Embed Size (px)
Citation preview
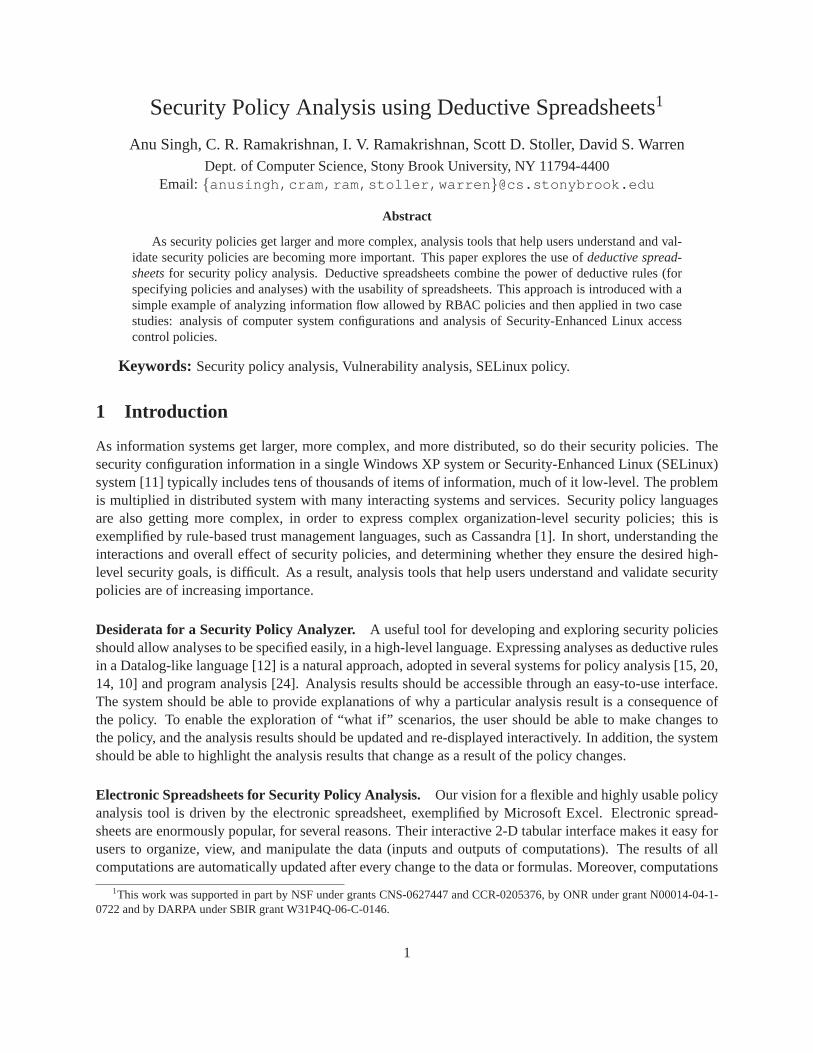
Security Policy Analysis using Deductive Spreadsheets1
Anu Singh, C. R. Ramakrishnan, I. V. Ramakrishnan, Scott D. Stoller, David S. WarrenDept. of Computer Science, Stony Brook University, NY 11794-4400
Email: {anusingh,cram,ram,stoller,warren }@cs.stonybrook.edu
Abstract
As security policies get larger and more complex, analysis tools that help users understand and val-idate security policies are becoming more important. This paper explores the use ofdeductive spread-sheetsfor security policy analysis. Deductive spreadsheets combine the power of deductive rules (forspecifying policies and analyses) with the usability of spreadsheets. This approach is introduced with asimple example of analyzing information flow allowed by RBACpolicies and then applied in two casestudies: analysis of computer system configurations and analysis of Security-Enhanced Linux accesscontrol policies.
Keywords: Security policy analysis, Vulnerability analysis, SELinux policy.
1 Introduction
As information systems get larger, more complex, and more distributed, so do their security policies. Thesecurity configuration information in a single Windows XP system or Security-Enhanced Linux (SELinux)system [11] typically includes tens of thousands of items of information, much of it low-level. The problemis multiplied in distributed system with many interacting systems and services. Security policy languagesare also getting more complex, in order to express complex organization-level security policies; this isexemplified by rule-based trust management languages, such as Cassandra [1]. In short, understanding theinteractions and overall effect of security policies, and determining whether they ensure the desired high-level security goals, is difficult. As a result, analysis tools that help users understand and validate securitypolicies are of increasing importance.
Desiderata for a Security Policy Analyzer. A useful tool for developing and exploring security policiesshould allow analyses to be specified easily, in a high-level language. Expressing analyses as deductive rulesin a Datalog-like language [12] is a natural approach, adopted in several systems for policy analysis [15, 20,14, 10] and program analysis [24]. Analysis results should be accessible through an easy-to-use interface.The system should be able to provide explanations of why a particular analysis result is a consequence ofthe policy. To enable the exploration of “what if” scenarios, the user should be able to make changes tothe policy, and the analysis results should be updated and re-displayed interactively. In addition, the systemshould be able to highlight the analysis results that change as a result of thepolicy changes.
Electronic Spreadsheets for Security Policy Analysis. Our vision for a flexible and highly usable policyanalysis tool is driven by the electronic spreadsheet, exemplified by Microsoft Excel. Electronic spread-sheets are enormously popular, for several reasons. Their interactive 2-D tabular interface makes it easy forusers to organize, view, and manipulate the data (inputs and outputs of computations). The results of allcomputations are automatically updated after every change to the data or formulas. Moreover, computations
1This work was supported in part by NSF under grants CNS-0627447 and CCR-0205376, by ONR under grant N00014-04-1-0722 and by DARPA under SBIR grant W31P4Q-06-C-0146.
1
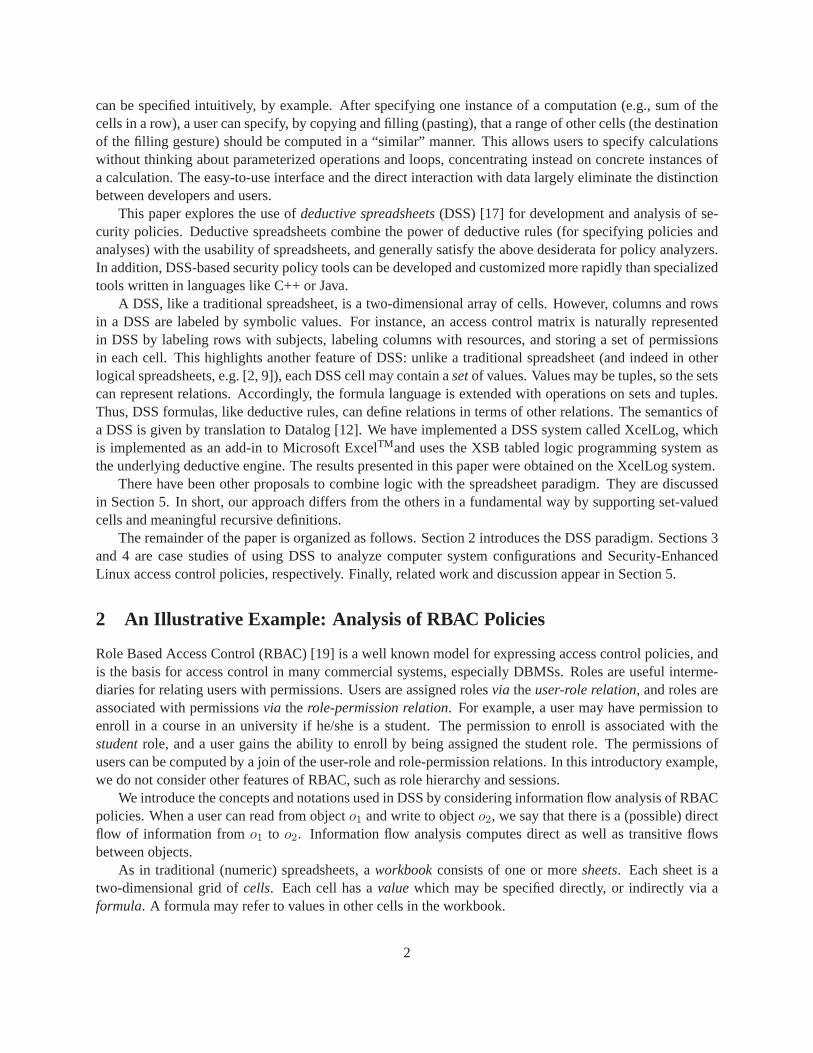
can be specified intuitively, by example. After specifying one instance of acomputation (e.g., sum of thecells in a row), a user can specify, by copying and filling (pasting), that arange of other cells (the destinationof the filling gesture) should be computed in a “similar” manner. This allows users to specify calculationswithout thinking about parameterized operations and loops, concentratinginstead on concrete instances ofa calculation. The easy-to-use interface and the direct interaction with datalargely eliminate the distinctionbetween developers and users.
This paper explores the use ofdeductive spreadsheets(DSS) [17] for development and analysis of se-curity policies. Deductive spreadsheets combine the power of deductiverules (for specifying policies andanalyses) with the usability of spreadsheets, and generally satisfy the above desiderata for policy analyzers.In addition, DSS-based security policy tools can be developed and customized more rapidly than specializedtools written in languages like C++ or Java.
A DSS, like a traditional spreadsheet, is a two-dimensional array of cells. However, columns and rowsin a DSS are labeled by symbolic values. For instance, an access control matrix is naturally representedin DSS by labeling rows with subjects, labeling columns with resources, and storing a set of permissionsin each cell. This highlights another feature of DSS: unlike a traditional spreadsheet (and indeed in otherlogical spreadsheets, e.g. [2, 9]), each DSS cell may contain asetof values. Values may be tuples, so the setscan represent relations. Accordingly, the formula language is extendedwith operations on sets and tuples.Thus, DSS formulas, like deductive rules, can define relations in terms of other relations. The semantics ofa DSS is given by translation to Datalog [12]. We have implemented a DSS systemcalled XcelLog, whichis implemented as an add-in to Microsoft ExcelTMand uses the XSB tabled logic programming system asthe underlying deductive engine. The results presented in this paper were obtained on the XcelLog system.
There have been other proposals to combine logic with the spreadsheet paradigm. They are discussedin Section 5. In short, our approach differs from the others in a fundamental way by supporting set-valuedcells and meaningful recursive definitions.
The remainder of the paper is organized as follows. Section 2 introduces the DSS paradigm. Sections 3and 4 are case studies of using DSS to analyze computer system configurations and Security-EnhancedLinux access control policies, respectively. Finally, related work and discussion appear in Section 5.
2 An Illustrative Example: Analysis of RBAC Policies
Role Based Access Control (RBAC) [19] is a well known model for expressing access control policies, andis the basis for access control in many commercial systems, especially DBMSs. Roles are useful interme-diaries for relating users with permissions. Users are assigned rolesvia theuser-role relation, and roles areassociated with permissionsvia the role-permission relation. For example, a user may have permission toenroll in a course in an university if he/she is a student. The permission to enroll is associated with thestudentrole, and a user gains the ability to enroll by being assigned the student role. The permissions ofusers can be computed by a join of the user-role and role-permission relations. In this introductory example,we do not consider other features of RBAC, such as role hierarchy and sessions.
We introduce the concepts and notations used in DSS by considering information flow analysis of RBACpolicies. When a user can read from objecto1 and write to objecto2, we say that there is a (possible) directflow of information fromo1 to o2. Information flow analysis computes direct as well as transitive flowsbetween objects.
As in traditional (numeric) spreadsheets, aworkbookconsists of one or moresheets. Each sheet is atwo-dimensional grid ofcells. Each cell has avaluewhich may be specified directly, or indirectly via aformula. A formula may refer to values in other cells in the workbook.
2
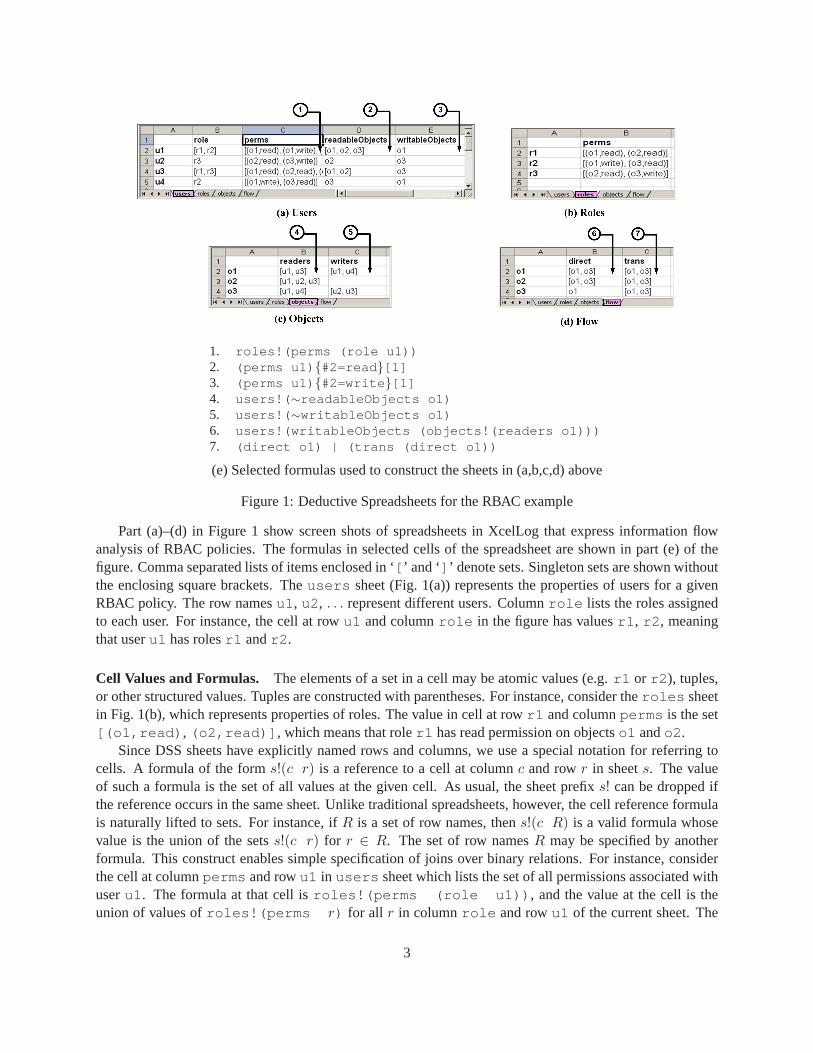
1. roles!(perms (role u1))2. (perms u1) {#2=read }[1]3. (perms u1) {#2=write }[1]4. users!( ∼readableObjects o1)5. users!( ∼writableObjects o1)6. users!(writableObjects (objects!(readers o1)))7. (direct o1) | (trans (direct o1))
(e) Selected formulas used to construct the sheets in (a,b,c,d) above
Figure 1: Deductive Spreadsheets for the RBAC example
Part (a)–(d) in Figure 1 show screen shots of spreadsheets in XcelLog that express information flowanalysis of RBAC policies. The formulas in selected cells of the spreadsheet are shown in part (e) of thefigure. Comma separated lists of items enclosed in ‘[ ’ and ‘] ’ denote sets. Singleton sets are shown withoutthe enclosing square brackets. Theusers sheet (Fig. 1(a)) represents the properties of users for a givenRBAC policy. The row namesu1 , u2 , . . . represent different users. Columnrole lists the roles assignedto each user. For instance, the cell at rowu1 and columnrole in the figure has valuesr1 , r2 , meaningthat useru1 has rolesr1 andr2 .
Cell Values and Formulas. The elements of a set in a cell may be atomic values (e.g.r1 or r2 ), tuples,or other structured values. Tuples are constructed with parentheses. For instance, consider theroles sheetin Fig. 1(b), which represents properties of roles. The value in cell at row r1 and columnperms is the set[(o1,read) , (o2,read)] , which means that roler1 has read permission on objectso1 ando2 .
Since DSS sheets have explicitly named rows and columns, we use a special notation for referring tocells. A formula of the forms!(c r) is a reference to a cell at columnc and rowr in sheets. The valueof such a formula is the set of all values at the given cell. As usual, the sheet prefixs! can be dropped ifthe reference occurs in the same sheet. Unlike traditional spreadsheets,however, the cell reference formulais naturally lifted to sets. For instance, ifR is a set of row names, thens!(c R) is a valid formula whosevalue is the union of the setss!(c r) for r ∈ R. The set of row namesR may be specified by anotherformula. This construct enables simple specification of joins over binary relations. For instance, considerthe cell at columnperms and rowu1 in users sheet which lists the set of all permissions associated withuseru1 . The formula at that cell isroles!(perms (role u1)) , and the value at the cell is theunion of values ofroles!(perms r) for all r in columnrole and rowu1 of the current sheet. The
3
formulas in other rows of columnperms are obtained by copying and filling, which appropriately renamesrow and column references in the formula. Note the use of traditional spreadsheet metaphors to specifyrules: first, the computation (a set-valued formula) is defined for a specificinstance, and then the values forother instances are defined by replacing row/column names.
Tuple operations. Two operations, namely projection and selection, support the manipulation oftuplevalues in DSS. For instance, consider the formula to compute the set of all objects that are readable by useru1 . Observe that(perms u1) is the set of all object/permission pairs to whichu1 has some access.Readable objects are selected using the formula(perms u1) {#2=read }, where the selection criterionis enclosed between ‘{’ and ‘}’. The ‘[1] ’ at the end of(perms u1) {#2=read }[1] (formula 2 inFig. 1) projects this set of pairs on the first component, thereby computing the set of objects readable byu1 . The values in columnwritableObjects , which lists the set of objects to which an user has writeaccess, is computed similarly.
Reverse Lookup. The formulausers!(readableObjects u1) returns the set of all objects towhich useru1 has read access. Conversely, the set of all users who have read access to a specific objecto1 , which is represented by the cell(readers o1) in objects sheet (Fig. 1(c)) is computed usingthe reverse-lookup operationusers!( ∼readableObjects o1) (formula 4 in the figure). In general,(v ∼r) is the set of all columnsc such that valuev is in (c r); similarly, (∼c v) is the set of all rowsr suchthatv is in (c r). Moreover, structured values may be used in a reverse-lookup operation. For instance, theformula users!( ∼perms (o1,read)) also computes the set of all readers of objecto1 . The set ofwriters of an object, which is the set of users who have write privileges, isalso computed similarly.
Recursive Definitions. When the formula in a cellx1 contains a reference to another cellx2 we say thatcell x1 directly depends on cellx2. A cell x1 is said to depend (directly or indirectly) on cellx2 if (a) x1
directly depends onx2 or (b) there is an intermediate cellx3 such thatx1 depends onx3 andx3 dependson x2. DSS permits recursive definitions, so a cell may depend on itself. We illustrate this by encodinginformation flow analysis (seeflow sheet in Figure 1(d)).
We say that information directly flows from objecto1 to objecto2 if there is some useru who can readfromo1 and write too2. Consider the computation of the set of objects to which there is a direct flow fromo1.The set of all readers ofo1 is given byobjects!(readers o 1) . The set of objects that an useru maywrite to is given byusers!(writableObjects u) . Thus the set of objects that some reader ofo1may write to is given byusers!(writableObjects (objects!(readers o1))) (formula 6in Fig. 1).
Columntrans in sheetflow represents the transitive closure of thedirect flow relation, and henceexpresses transitive information flow. It is computed as follows. In the base case, we say that there is atransitive flow fromo1 to o2 if there is a direct flow fromo1 to o2. Let O be the set of all objects to whichthere is a direct flow fromo1. The setO is the value of(direct o1) . Let O′ be the set of all objects towhich there are (direct or transitive) flows from some object inO. ThusO′ is the value of(trans O) ,that is, (trans (direct o1)) . Note thatO′ contains the destinations of all flows that have morethan one direct step; andO contains destinations of flows with exactly one direct step. ThusO ∪ O′ is theset of all objects that are destinations of flows fromo1 using one or more direct flow steps. In DSS, theinfix operator ‘|’ is used to denote the union of two sets. Thus the formula in the cell at rowo1 and columntrans (formula 7 in Figure 1(e)) is the union of the formulas corresponding toO andO′.
4
Relationship to Datalog. The meaning of recursive formulas is given as follows. Letx be a cell, and letfx be the formula atx. Then the value atx is thesmallestset that contains the value offx. This definitioncorresponds to the least model semantics of Datalog programs.
A set of spreadsheets defines a 4-ary relation:sheet(Name,Row,Column,Contents), wheresheet(S, R, C, E)is true if and only ifE is in the cell at rowR and columnC in sheetS. For example, the cell at rowu1 andcolumnperms in the DSS sheet namedusers in Figure 1(a) is defined by the Datalog rule:
sheet(users,u1,perms,X) :-sheet(users,u1,role,Y), sheet(roles,Y,perms,X).
XcelLog is implemented as a plug-in to Microsoft ExcelTM . It evaluates DSS formulas in the back-endby invoking the logic programming system XSB. DSS formulas are passed as parameters to a function calledDSSthat is implemented by the plug-in. When the value of a cell is needed during the evaluation of a DSSformula (e.g. when the formula contains a reference to the cell), the XSB sideof the interface fetches thevalue from Excel. This architecture enables some cells to contain pure Excel formulas (e.g., statistical andnumeric functions) while other cells contain DSS formulas.
Explaining Analysis Results. To help the user understand how the value (e.g., an analysis result) in acell was obtained, XcelLog can highlight all of the cells whose value is used, directly or indirectly (tran-sitively), in computing that cell’s value; those cells are called itsprecedents. For example, consider thedirect information flow fromo1 . To compute this cell, we need the values of the cell at rowo1 and columnreaders in the objects sheet, and also the values of every cell in the columnwriters of the samesheet. Transitively, we need all values in columnreadableObjects of users (and more). A cell’s con-tents are completely explained by its precedents; in particular, if the cell contains a set, the cell’s precedentscompletely determine which values are in the set, and which are not.
A more narrowly focused notion of precedent is sometimes useful as well. Theanswer precedentsof avaluev (in the set in a specific cell) are values (in specific cells) that explain the presence ofv in that set.For example, to understand how there is an information flow fromo1 to o3 , we can look at the answerprecedents for the valueo3 in the cell in rowo1 and columndirect in the flow sheet. The answerprecedents for that value are the valueu3 in columnreaders of row o1 in theobjects sheet and thevalueo3 in columnwritableObjects of row u3 in the users sheet. XcelLog does not currentlyhighlight answer precedents, but this feature is easy to add, since the underlying logic-programming system(XSB) can provide the necessary information. Similarly, XcelLog can highlight thedependentsof a cell andcould be extended to highlight theanswer dependentsof a value in a cell.
Incremental Re-computation. Spreadsheets provide an interactive environment in which data can easilybe changed, and computed values are promptly and automatically updated. Inthe context of policy analysis,a user can modify the policy by editing the values in some cells, and immediately see updated analysisresults.
When the value of a cell is changed, incremental recomputation proceeds as follows. First, the val-ues of cells that are directly dependent on the changed cell are re-evaluated. Then any cell whose valuechanges due to re-evaluation triggers re-evaluation of its dependent cells. The re-evaluation process, whichis based on the incremental evaluation algorithm of [18], continues until there is no further change invalues. For instance, when useru3 is removed from roler1 and added to roler2 , the cell in columnperms in row u3 of users sheet is first re-evaluated. Since the cell value changes to[(o1,write) ,(o2,read) , (o3,read) , (o3,write)] , the other cells in the same row are re-evaluated. Note that the
5
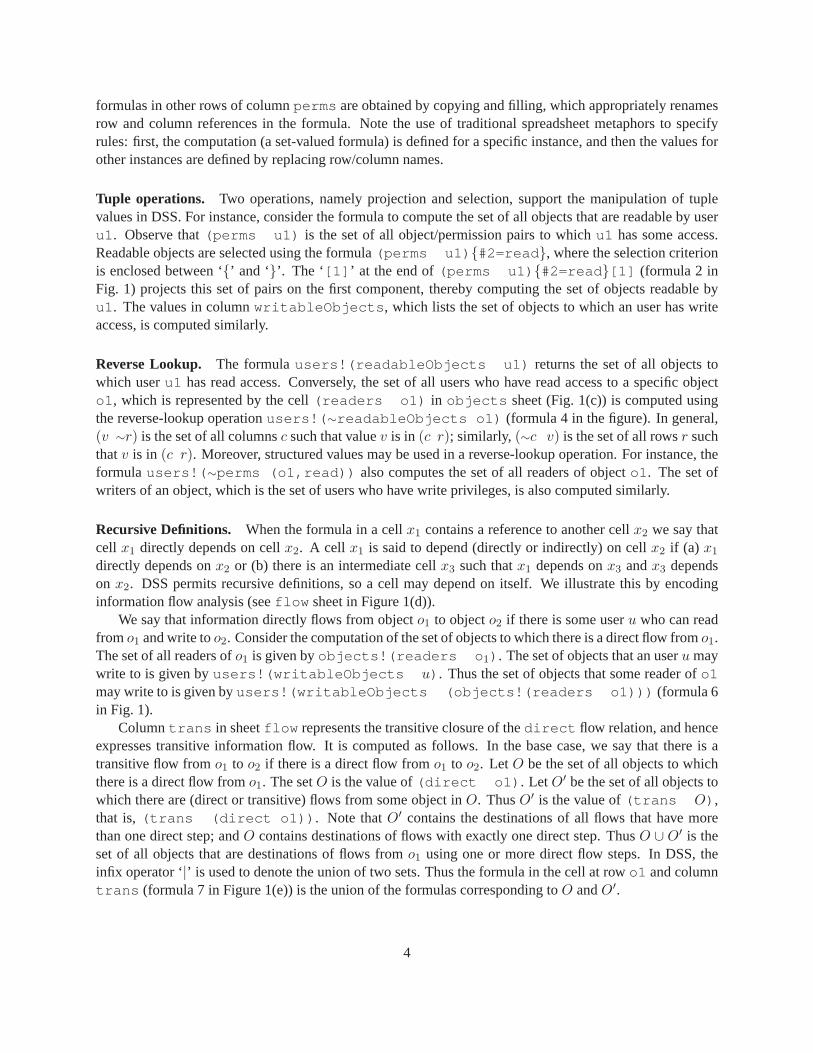
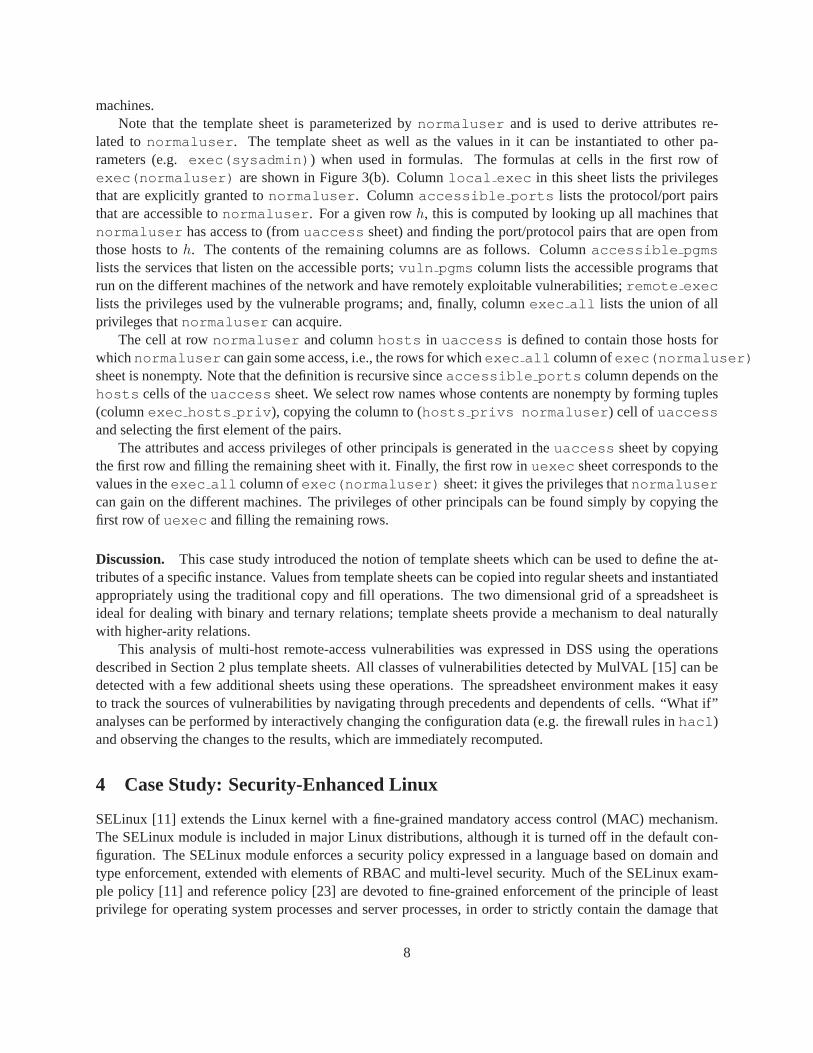
Figure 2: Vulnerability Analysis: machine and network configuration
cell at columnwritableObjects becomes[o1,o3] while the cell at columnreadableObjectsbecomes[o2,o3] . This triggers the recomputation of all cells inreaders andwriters columns ofthe objects sheet. However, since the value at columnreaders of row o2 in objects sheet doesnot change, the value at columndirect of row o2 in flow sheet is not recomputed. In large examples,incremental evaluation enables a user to efficiently explore “what if” scenarios by observing the effect ofchanging the values or formulas at specific cells.
Usability. We have described how DSS can be used to effectively encode a non-trivial analysis, usingstraightforward extensions to the popular spreadsheet metaphor. Policyanalysis problems encoded this wayinherit the usability benefits of the spreadsheet paradigm “for free”. Firstly, the tabular layout can organizea considerable amount of information on the screen at once. Secondly, users can understand the results ofcalculations by navigating the precedents and dependents of cells. Thirdly, users can explore the effects ofchanges, since values in the spreadsheets are recomputed immediately whenever necessary when some cellvalues are changed.
3 Case Study: Vulnerability Analysis of Computer Systems
Vulnerabilities in an individual computer system may lead to exploitable vulnerabilities on an entire networkof systems. MulVAL is a rule-based network vulnerability analyzer that assesses the impact of softwarevulnerabilities throughout a network [15]. This section illustrates how a DSScan be used to specify a partof MulVAL’s analysis that deals with remote-access vulnerabilities.
Configuration Data. Figure 2 shows deductive spreadsheets that contain data about the configurationsof different machines in a network. In the example, we consider a networkconsisting of a web server, afile server, and a workstation; machines outside of our network are abstracted into a single machine called“ internet ”. The network configuration (firewall rules) is specified byhacl sheet (top sheet in thefigure) which specifies the services (protocol/port pairs) on a machine that can be accessed from anothermachine in the network. For instance, in the sample configuration, the contentsof cell at rowwebserverand columnfileserver indicates thatwebserver can contact services onfileserver usingrpc
6
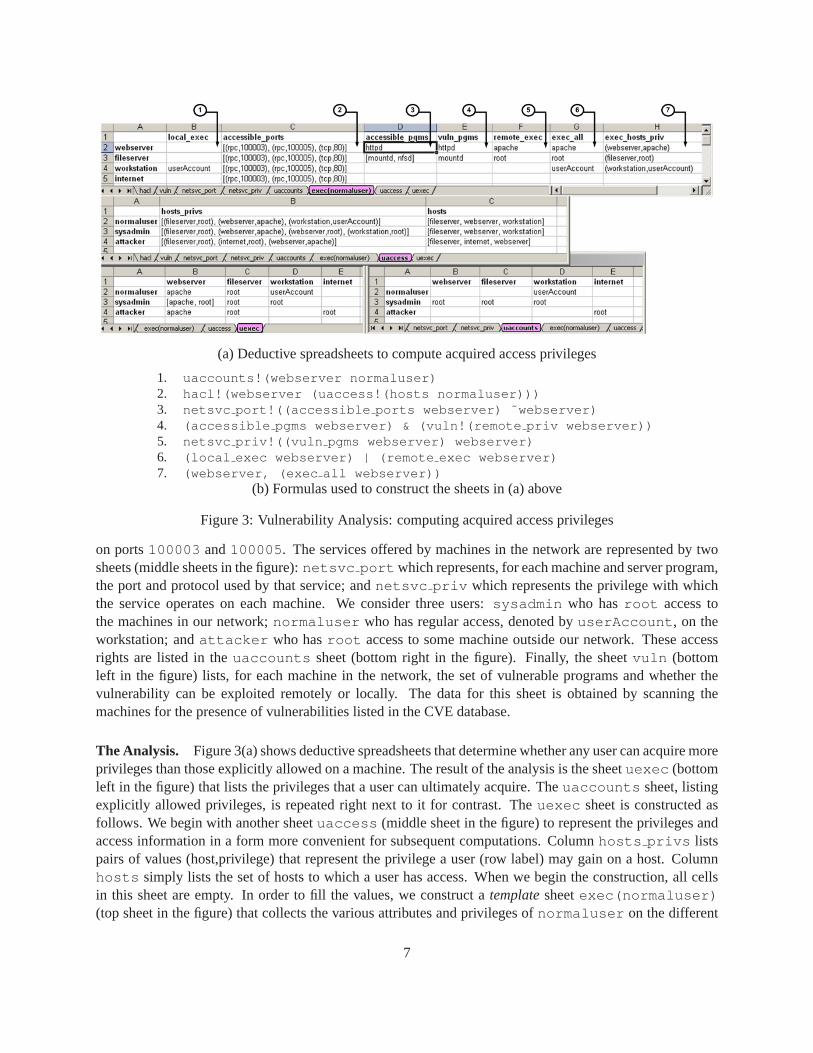
(a) Deductive spreadsheets to compute acquired access privileges
1. uaccounts!(webserver normaluser)2. hacl!(webserver (uaccess!(hosts normaluser)))3. netsvc port!((accessible ports webserver) ˜webserver)4. (accessible pgms webserver) & (vuln!(remote priv webserver))5. netsvc priv!((vuln pgms webserver) webserver)6. (local exec webserver) | (remote exec webserver)7. (webserver, (exec all webserver))
(b) Formulas used to construct the sheets in (a) above
Figure 3: Vulnerability Analysis: computing acquired access privileges
on ports100003 and100005 . The services offered by machines in the network are represented by twosheets (middle sheets in the figure):netsvc port which represents, for each machine and server program,the port and protocol used by that service; andnetsvc priv which represents the privilege with whichthe service operates on each machine. We consider three users:sysadmin who hasroot access tothe machines in our network;normaluser who has regular access, denoted byuserAccount , on theworkstation; andattacker who hasroot access to some machine outside our network. These accessrights are listed in theuaccounts sheet (bottom right in the figure). Finally, the sheetvuln (bottomleft in the figure) lists, for each machine in the network, the set of vulnerable programs and whether thevulnerability can be exploited remotely or locally. The data for this sheet is obtained by scanning themachines for the presence of vulnerabilities listed in the CVE database.
The Analysis. Figure 3(a) shows deductive spreadsheets that determine whether anyuser can acquire moreprivileges than those explicitly allowed on a machine. The result of the analysis is the sheetuexec (bottomleft in the figure) that lists the privileges that a user can ultimately acquire. The uaccounts sheet, listingexplicitly allowed privileges, is repeated right next to it for contrast. Theuexec sheet is constructed asfollows. We begin with another sheetuaccess (middle sheet in the figure) to represent the privileges andaccess information in a form more convenient for subsequent computations. Columnhosts privs listspairs of values (host,privilege) that represent the privilege a user (row label) may gain on a host. Columnhosts simply lists the set of hosts to which a user has access. When we begin the construction, all cellsin this sheet are empty. In order to fill the values, we construct atemplatesheetexec(normaluser)(top sheet in the figure) that collects the various attributes and privileges of normaluser on the different
7
machines.Note that the template sheet is parameterized bynormaluser and is used to derive attributes re-
lated tonormaluser . The template sheet as well as the values in it can be instantiated to other pa-rameters (e.g.exec(sysadmin) ) when used in formulas. The formulas at cells in the first row ofexec(normaluser) are shown in Figure 3(b). Columnlocal exec in this sheet lists the privilegesthat are explicitly granted tonormaluser . Columnaccessible ports lists the protocol/port pairsthat are accessible tonormaluser . For a given rowh, this is computed by looking up all machines thatnormaluser has access to (fromuaccess sheet) and finding the port/protocol pairs that are open fromthose hosts toh. The contents of the remaining columns are as follows. Columnaccessible pgmslists the services that listen on the accessible ports;vuln pgms column lists the accessible programs thatrun on the different machines of the network and have remotely exploitable vulnerabilities;remote execlists the privileges used by the vulnerable programs; and, finally, columnexec all lists the union of allprivileges thatnormaluser can acquire.
The cell at rownormaluser and columnhosts in uaccess is defined to contain those hosts forwhichnormaluser can gain some access, i.e., the rows for whichexec all column ofexec(normaluser)sheet is nonempty. Note that the definition is recursive sinceaccessible ports column depends on thehosts cells of theuaccess sheet. We select row names whose contents are nonempty by forming tuples(columnexec hosts priv ), copying the column to (hosts privs normaluser ) cell of uaccessand selecting the first element of the pairs.
The attributes and access privileges of other principals is generated in theuaccess sheet by copyingthe first row and filling the remaining sheet with it. Finally, the first row inuexec sheet corresponds to thevalues in theexec all column ofexec(normaluser) sheet: it gives the privileges thatnormalusercan gain on the different machines. The privileges of other principals can be found simply by copying thefirst row ofuexec and filling the remaining rows.
Discussion. This case study introduced the notion of template sheets which can be used to define the at-tributes of a specific instance. Values from template sheets can be copied intoregular sheets and instantiatedappropriately using the traditional copy and fill operations. The two dimensional grid of a spreadsheet isideal for dealing with binary and ternary relations; template sheets provide amechanism to deal naturallywith higher-arity relations.
This analysis of multi-host remote-access vulnerabilities was expressed in DSS using the operationsdescribed in Section 2 plus template sheets. All classes of vulnerabilities detected by MulVAL [15] can bedetected with a few additional sheets using these operations. The spreadsheet environment makes it easyto track the sources of vulnerabilities by navigating through precedents and dependents of cells. “What if”analyses can be performed by interactively changing the configuration data (e.g. the firewall rules inhacl )and observing the changes to the results, which are immediately recomputed.
4 Case Study: Security-Enhanced Linux
SELinux [11] extends the Linux kernel with a fine-grained mandatory access control (MAC) mechanism.The SELinux module is included in major Linux distributions, although it is turned off in the default con-figuration. The SELinux module enforces a security policy expressed in alanguage based on domain andtype enforcement, extended with elements of RBAC and multi-level security. Much of the SELinux exam-ple policy [11] and reference policy [23] are devoted to fine-grained enforcement of the principle of leastprivilege for operating system processes and server processes, inorder to strictly contain the damage that
8
can be caused by a compromised process. These policies are large (tensof thousands of lines), low-level,and difficult to write, understand, and validate. This motivated the development of several tools for develop-ment and analysis of SELinux policies [6, 5, 20, 4, 22, 14]. This section describes our prototype deductivespreadsheet for SELinux policies and compares it with other tools.
Overview of SELinux Policies. SELinux associates asecurity contextwith each resource (file, process,socket,etc.). A security context is a tuple(user , role, type). A type is an abstraction analogous to a role:resources are organized into types, and subjects are granted permissions to perform operations on types (i.e.,on the resources in the type).
An access vector ruleindicates that resources (usually processes) in a specified type, calledthesourcetype, have specified permissions for the resources in a specified type, calledthetarget type. A permission isidentified by aclass(i.e., a kind of resource, such asfile or process ) and anoperation(such asreador signal ). Types may havealiasesandattributes(e.g., thedomain attribute is given to types that canbe assigned to processes). An attribute, when used in an access vectorrule, represents all types having thatattribute. The policy may also define anever-allowrelation that describes accesses that should never beallowed; checking disjointness of the allow and never-allow relations can catch errors in the policy.
A policy also specifies the allowed roles for each user, and the allowed types for each role (more pre-cisely, the allowed types for processes running in security contexts with that role). A security context(user , role, type) is consistentif the role is allowed for the user, and the type is allowed for the role. TheSELinux module blocks actions that would lead to the creation of an inconsistent security context.
SELinux Policies in DSS. SELinux policies inpolicy.conf format are loaded into our system by us-ing a Perl script to transform the policy into comma-separated-value (.csv)format and then opening the .csvfiles in Excel (currently, some manual steps are also needed, but they could be automated). In our experi-ments, we analyzed parts of the SELinux example policy (version 1.1, for consistency with the experimentsin [20]) and the SELinux reference policy (version 20061212) [23].
Sheets containing intermediate results and analysis results are computed frombase data loaded in thisway. The workbook provides many of the analyses in Gokyo [5], SLAT [3, 4], PAL [20], and NETRA [14],including the following.
Privilege Escalation Vulnerability. A privilege escalation vulnerability, also called awrite-execute (W-E) vulnerability, exists when a non-administrative (i.e., less trusted) type has write permissionfor a resource,and an administrative type has execute permission for that resource [14]. As in the NETRA analysis [14],we introduce aroot type with execute permission for selected types containing security-critical binaries,e.g., the typesu exec t , which contains thesu binary. We classifyroot as administrative, and all othertypes as non-administrative.
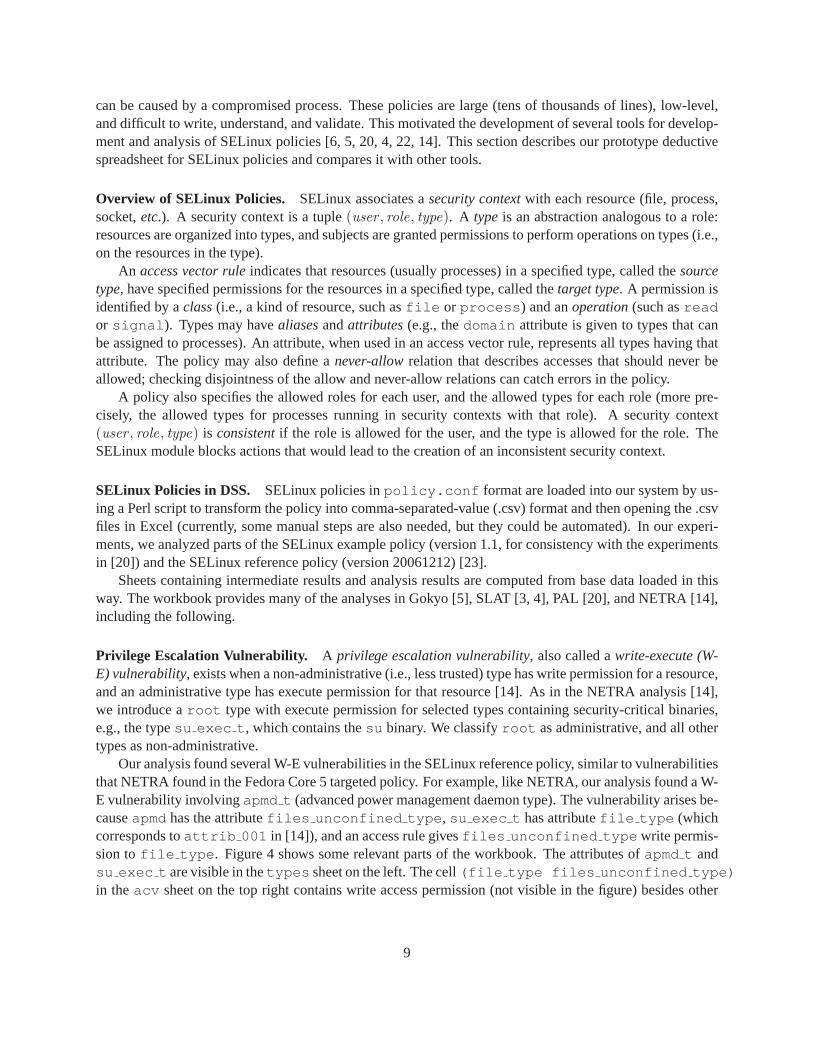
Our analysis found several W-E vulnerabilities in the SELinux referencepolicy, similar to vulnerabilitiesthat NETRA found in the Fedora Core 5 targeted policy. For example, like NETRA, our analysis found a W-E vulnerability involvingapmd t (advanced power management daemon type). The vulnerability arises be-causeapmd has the attributefiles unconfined type , su exec t has attributefile type (whichcorresponds toattrib 001 in [14]), and an access rule givesfiles unconfined type write permis-sion tofile type . Figure 4 shows some relevant parts of the workbook. The attributes ofapmd t andsu exec t are visible in thetypes sheet on the left. The cell(file type files unconfined type)in theacv sheet on the top right contains write access permission (not visible in the figure) besides other
9
Figure 4: Write-Execute Vulnerability in SELinux Reference Policy
permissions on file objects representing the aforementioned access rule. The (root, su exec t) en-try in cell (writeExecuteAttack apmd t) in the analysis sheet on the bottom right indicatesthe vulnerability; specifically, it means that the non-administrative typeapmd t has write permission forsu exec t , and the administrative typeroot has execute permission forsu exec t .
Integrity Vulnerability. An integrity vulnerabilityexists when a non-administrative types has write per-mission for a resource, and an administrative typet has read permission for that resource [14]. For thisanalysis, we gave the administrative typeroot read permission for selected types containing security-critical files, e.g., the typeshadow t , which contains the password file/etc/shadow . For example, wefound an integrity vulnerability due toapmd t having write permission toshadow t , for similar reasonsas above.
Integrity of Trusted Computing Base. This analysis checks for privilege escalation and integrity vul-nerabilities, as above, with the administrative types taken to be the types in the trusted computing base(TCB) for SELinux proposed in [6]. As described in [6], the system designer may examine these potentialvulnerabilities and eliminate the unacceptable ones.
Information-Flow Analysis. Information-flow analysis determines possible information flows betweensecurity contexts or types. Direct information flow is possible from a security context c1 to a securitycontextc2 if a process with contextc1 has a write permission for resources with contextc2, or a processwith contextc2 has a read permission for resources with contextc1 [3, 4]. The information-flow relation isthe transitive closure of the direct flow relation. In the row for source contextc, the cell in theinfoFlowcolumn contains the set of contexts to which information can flow fromc. The sheet could be extended toprovide specific paths along which information can flow.
We also developed similar but simpler sheets that, like NETRA [14] and Apol [22], calculate informationflow between types, rather than security contexts, by ignoring constraintsthat involve the user and rolecomponents of the security context.
Information-flow analysis can be used in several ways. The user might want to simply examine thetypes from which or to which information flows for selected types of interest.The user might want torestrict attention to flows that do not pass through a specified typef that acts as an “information firewall”;
10
this is easily supported by parameterizing the information-flow sheet byf and modifying the formulasappropriately. Information-flow analysis can be used to enhance other analyses. For example, atransitiveprivilege escalation vulnerabilityexists when there is information flow from a non-administrative sourcetype s to another types′ and there is a privilege escalation vulnerability betweens′ and t. A transitiveintegrity vulnerabilityis defined similarly.
Policy Completeness. Jaegeret al. point out thatunspecified permissions—i.e., permissions that are notin the allow or never-allow relations—reflect a kind of incompleteness in the policy specification [5].Policycompleteness analysislists all the unspecified permissions, so policy developers can check whether theincompleteness is intentional and acceptable.
Usability. As mentioned earlier, precedents and descendants of cells, which can behighlighted in Xcel-Log, can be navigated to understand analysis results. However, findinghighlighted cells in a large workbookcould be tedious. XcelLog currently helps the user with this by marking sheetscontaining highlighted cells,but could be extended to automatically elide rows and columns that do not contain highlighted cells.
While spreadsheets are incrementally updated, it is sometimes useful to highlight all cells whose valueschanged as a result of the most recent edit operation. This is similar to showing answer dependents, but ismore sensitive to the specific values involved: changing a value does not necessarily change the value of allits answer dependents.
After exploring changes to a policy in a spreadsheet, the user might want tomake those changes perma-nent. It is easy to generate apolicy.conf file that incorporates them, by saving the sheet as a .csv fileand using a Perl script to convert the data topolicy.conf format. A similar idea is mentioned in [10].
Performance. Our current prototype is usable but leaves room for performance improvement. For a work-book that implements all the analyses in PAL [20], including information-flow analysis (which involves arelatively expensive transitive closure) but excluding policy completeness, calculation of all analysis resultsfor a subset of the SELinux example policy with all 271 types and 8700 access vector rules (43% of the total)takes about 5 minutes on a 1.7 GHz Pentium. Incremental re-calculation of all analysis results takes, forexample, 1 second after deleting the attributedomain from the typecrond t ; re-calculation takes about1 minute after deleting all the attributes ofcrond t .
Comparison With Other SELinux Policy Analysis Tools. Expressing policy analyses and requirementsas DSS formulas is similar to expressing them as set formulas, like in Gokyo [5,6], as regular-expression-like formulas, like in SLAT [3, 4], or as deductive rules, like in PAL [20], NETRA [14], and Lopol [10].However, none of these other tools provide the usability benefits of DSS. In particular, none of them providesan interactive environment in which analysis results are incrementally updated as the policy is modified.
SLAT, PAL, and Lopol are command-line tools whose input and output aresimply text streams. Apol[22] has a GUI for specifying the analyses to perform and displaying theanalysis results, but it does not sup-port editing the policy. NETRA does not support modifying the policy duringanalysis but provides a usefulgraphical output format: it generates derivations, in the form of directed acyclic graphs (DAGs), to justifyand explain analysis results. A derivation provides the same basic information as a set of answer precedents,namely, indicating which policy rules contributed to the result, but presents it ina more structured manner.
None of these analysis tools, including our current spreadsheets but with the exception of PAL [20],work with policies in source-level format. A disadvantage of working with lower-level formats is thatmacros (with parameters), the primary abstraction mechanism in the SELinux policy language, have been
11
expanded; this can make the analysis results harder to understand. A useful direction for future work is toimport source-level policies into spreadsheets, by translating macros into formulas in parameterized sheets.
5 Related Work and Discussion
There are several proposals for combining the spreadsheet metaphorwith logic; some are surveyed in [13].Knowledgesheet [2] and PrediCalc [9] are two recent ones that are related to DSS in their vision. Both ofthese approaches maintain the functional aspect of traditional spreadsheets, in that each cell still contains asingle value. They extend traditional spreadsheets by allowing the user to specify constraints that partiallyor completely determine the value in a cell. Our approach differs from these ina fundamental way, in thatwe allow cells to contain sets of values and allow formulas with cell referencesto specify subset constraints.As as result, recursively defined cells do not make sense in their functional framework but are perfectlymeaningful in our relational one. This is what really allows our spreadsheets to support full deduction.
Another interesting combination of rules and spreadsheets is ARulesXL (http://www.arulesxl.com/ ). ARulesXL allows users to define WHEN rules that specify cell contents using defined variables.The use of logic is interesting, but it retains the functional aspects of traditional spreadsheets and does notsupport recursive definitions.
There has also been recent work on extensions to the Excel spreadsheet that integrateuser-defined (non-recursive) functionsinto the spreadsheet grid, rather than treating them as a “bolt-on” [8]. This work de-velops a way to specify user defined functions visually with a spreadsheet. But each cell still possesses aunique value.
Quantrix [16] has developed spreadsheet technology for compact representation of single-element celldata and manipulation of various dimensions to ease viewing of data under different representations. It willbe useful to explore and generalize Quantrix’s technology from single-element cell to sets for reducing thesparseness of data and facilitate multiple views of data in DSS.
Deductive spreadsheets might be viewed as a visual interface to a set-based language. While there havebeen several proposals for more expressive programming languagesthat support set specifications [7, 21],our focus is less on the power of the underlying language and more on its presentation and usability in thetabular spreadsheet form.
Deductive spreadsheets can be regarded as a different way of presenting the relational tables of a DBMS.A table view treats all components of a relation symmetrically, while the spreadsheet view introduces asym-metry, by choosing components to use as row names and column names, and tupling the remaining compo-nents. The DSS view is sometimes more compact, because a cell in a DSS may contain a set, while eachentry in a DBMS table is an atomic value.
We conclude with some possible extensions to XcelLog, the current DSS prototype, that will furtherimprove its usability. Currently, cell-level dependencies are considered when constructing explanations. Byrefining this cell-level granularity to the granularity of individual values in the set in a cell, more detailedexplanations can be constructed. Another useful extension would be to allow the user to explicitly define setsof row or column names and then automatically extend a sheet (including generation of formulas for the newcells) when its row or column set is changed. For some policy analysis problems a Datalog encoding mayalready be known. In such cases, the initial development of DSS encoding can be simplified by generatingit automatically from the Datalog program with annotations about the desired layout of the relations.
12
References
[1] M. Y. Becker and P. Sewell. Cassandra: Flexible trust management, applied to electronic healthrecords. InProc. 17th IEEE Computer Security Foundations Workshop (CSFW), pages 139–154. IEEEComputer Society Press, 2004.
[2] G. Gupta and S. F. Akhter. Knowledgesheet: A graphical spreadsheet interface for interactively devel-oping a class of constraint programs. InPractical Aspects of Declarative Languages (PADL), volume1753 ofLecture Notes in Computer Science, pages 308–323. Springer, 2000.
[3] J. D. Guttman, A. L. Herzog, and J. D. Ramsdell. Information flow in operating systems: Eager formalmethods. InWorkshop on Issues in the Theory of Security (WITS), 2003.
[4] J. D. Guttman, A. L. Herzog, and J. D. Ramsdell. SLAT: Information flow in Security Enhanced Linux,2003. Available fromhttp://www.mitre.org/tech/selinux/ .
[5] T. Jaeger, A. Edwards, and X. Zhang. Policy management using access control spaces.ACM Transac-tions on Information Systems Security, Aug. 2003.
[6] T. Jaeger, R. Sailer, and X. Zhang. Analyzing integrity protection in the SELinux example policy. InUSENIX Security Symposium, 2003.
[7] B. Jayaraman and K. Moon. Subset logic programs and their implementation. J. Log. Program.,42(2):71–110, 2000.
[8] S. P. Jones, A. Blackwell, and M. Burnett. A user-centered approach to function in excel. InIntl. Conf.on Functional Programming, 2003.
[9] M. Kassoff, L.-M. Zen, A. Garg, and M. Genesereth. PrediCalc:A logical spreadsheet managementsystem. In31st International Conference on Very Large Databases (VLDB), 2005.
[10] A. Kissinger and J. Hale. Lopol: A deductive database approachto policy analysis and rewriting. In2006 Security Enhanced Linux Symposium, 2006.
[11] P. Loscocco and S. Smalley. Meeting critical security objectives with security-enhanced Linux. InProc. of 2001 Ottawa Linux Symposium, 2001. Available fromhttp://www.nsa.gov/selinx/ .
[12] D. Maier and D. S. Warren. Computing with Logic: Logic Programming and Prolog. Ben-jamin/Cummings Publishers, Menlo Park, CA, 1988. ISBN 0-8053-6681-4,535 pp.
[13] D. Merrit, J. Paine, and M. Kassof. Special Spreadsheet Issue of AI Expert Newsletter, May 2005.http://www.ainewsletter.com/newsletters/aix 0505.htm .
[14] P. Naldurg, S. Schwoon, S. Rajamani, and J. Lambert. NETRA: Seeing through access control. InProc. 4th ACM Workshop on Formal Methods in Security Engineering (FMSE), pages 55–66, 2006.
[15] X. Ou, S. Govindavajhala, and A. W. Appel. MulVAL: A logic-basednetwork security analyzer. In14th Usenix Security Symposium, 2005.
[16] Quantrix.http://www.quantrix.com/ .
[17] C. R. Ramakrishnan, I. V. Ramakrishnan, and D. S. Warren. Deductive spreadsheets using tabledlogic programming. In22nd International Conference on Logic Programming (ICLP), volume 4079of Lecture Notes in Computer Science, pages 391–405. Springer-Verlag, 2006.
13
[18] D. Saha and C. R. Ramakrishnan. Incremental evaluation of tabled prolog: Beyond pure logic pro-grams. InPADL, volume 3819 ofLecture Notes in Computer Science, pages 215–229. Springer, 2006.
[19] R. Sandhu, E. Coyne, H. Feinstein, and C. Youman. Role-based access control models.IEEE Com-puter, 29(2):38–47, Feb. 1996.
[20] B. Sarna-Starosta and S. D. Stoller. Policy analysis for security-enhanced linux. InProceedings ofthe 2004 Workshop on Issues in the Theory of Security (WITS), pages 1–12, April 2004. Available athttp://www.cs.sunysb.edu/ ∼stoller/WITS2004.html .
[21] J. T. Schwartz, R. B. Dewar, E. Schonberg, and E. Dubinsky.Programming with sets; an introductionto SETL. Springer-Verlag, New York, NY, USA, 1986.
[22] Tresys Technology. Policy tools for Security-Enhanced Linux. Available from http://www.tresys.com/selinux/ .
[23] Tresys Technology. Security-Enhanced Linux reference policy. Available from http://oss.tresys.com/projects/refpolicy .
[24] J. Whaley, D. Avots, M. Carbin, and M. S. Lam. Using Datalog with binary decision diagrams forprogram analysis. InThird Asian Symposium on Programming Languages and Systems (APLAS),volume 3780 ofLecture Notes in Computer Science, pages 97–118. Springer-Verlag, 2005.
14


![PHYSICAL SECURITY & ENVIRONMENTAL SECURITY · Physical Security & Environmental Security Policy and Procedures Title [company name] Physical Security & Environmental Security Policy](https://img.pdfslide.net/doc/110x75/5b5559c77f8b9ac5358b71e4/physical-security-environmental-security-physical-security-environmental.jpg)