Embed Size (px)
Citation preview

Copyright © 2015 Splunk Inc.
David Veuve Senior SE, Security SME, Splunk
Security Jiujitsu Building CorrelaEon Searches in Splunk

Disclaimer
2
During the course of this presentaEon, we may make forward looking statements regarding future events or the expected performance of the company. We cauEon you that such statements reflect our current expectaEons and esEmates based on factors currently known to us and that actual events or results could differ materially. For important factors that may cause actual results to differ from those contained in our forward-‐looking statements, please review our filings with the SEC. The forward-‐looking statements made in the this presentaEon are being made as of the Eme and date of its live presentaEon. If reviewed aRer its live presentaEon, this presentaEon may not contain current or
accurate informaEon. We do not assume any obligaEon to update any forward looking statements we may make.
In addiEon, any informaEon about our roadmap outlines our general product direcEon and is subject to change at any Eme without noEce. It is for informaEonal purposes only and shall not, be incorporated into any contract or other commitment. Splunk undertakes no obligaEon either to develop the features
or funcEonality described or to include any such feature or funcEonality in a future release.

Personal IntroducEon
3
David Veuve – Senior Sales Engineer for Major Accounts in Northern California
Pre-‐Sales Security SME [email protected]
Former Splunk customer (for 3 years, 3.x through 4.3) Security guy Primary author of Search Ac)vity app Search Ninja

Agenda
Four types of security correlaEon rules you probably want 1. CorrelaEon across many sourcetypes and events
– Generate high fidelity alerts
2. Privileged user monitoring – Detect lateral movement and prioriEze risky users
3. Conquering alert faEgue – Don’t be beaten by tens of thousands of alerts per day
4. Threat Intel hits – Immediately detect bad actors in your environment
4

For Each Scenario
• Focus on Visibility, Analysis, and AcEon • Driven by customer use cases and/or real deployments! • Backed by A Splunk App!
5

AlternaEve Agenda
Sweet Searches
6

Who Are You? 1. Security Engineer / SOC Analyst / Threat Analyst / Someone Technical Who Cares about Security
2. Splunk skill level is basic-‐advanced 3. No Enterprise Security required (though it can make things easier at scale)
7

What Experience Are You About to Have?
8
| eval state=If(SplunkExperience<Ninja, “InformaEon Overload”, “Neato”)
Don’t fear – the app is (almost) here. Published at Session End.
Guide to Search for CorrelaEon Use Cases

Security CorrelaEon In Splunk

Mainframe Data
VMware
Plaoorm for Machine Data
Splunk SoluEons > Easy to Adopt
Exchange PCI Security
RelaEonal Databases
Mobile Forwarders Syslog / TCP / Other
Sensors & Control Systems
Across data sources, use cases & consumpEon models
Wire Data
10
Mobile Intel
MINT

Splunk CorrelaEon Rules
Easy in enterprise security But even in core Splunk Enterprise, any search can: – Send an email – Trigger ServiceNow/Remedy/any other EckeEng system – Run a script – Interact with other systems to block / increase logging for hosts
CorrelaEon in Splunk is just searching

Visibility – Analysis – AcEon Framework for evaluaEng data and responding Splunk Applies to all exisEng frameworks, as it’s the Splunk side of the loop. For example, Let’s look at the lateral movement secEon of the kill chain. (Not familiar with the kill chain? It’s a great way to understand the phases of an auack. Check the URL below.)
Visibility: What data will let you detect Lateral Movement? Analysis: What will you do to that data to come to a decision? AcEon: What will you do in response to that decision? – Can we automate all of this?
Kill Chain: hup://www.lockheedmarEn.com/content/dam/lockheed/data/corporate/documents/LM-‐White-‐Paper-‐Intel-‐Driven-‐Defense.pdf

Visibility, Analysis, AND AcEon
13

CorrelaEon Across MulEple Sourcetypes

CorrelaEon Across MulEple Sourcetypes • Some don’t know how to correlate across mulEple sourcetypes in Splunk
• Easy: Across many auth log types • Easy: Across auth logs and event logs • Easy: New process launch within 15 minutes of anE-‐virus event also with uncategorized proxy acEvity
• In the following slides, we’ll see several techniques useful when creaEng correlaEon searches, followed by one complete example.
15

Techniques – Common InformaEon Model
16
tag=authenEcaEon | chart count over src by acEon | where success>0 AND failure>10 If you leverage Splunk’s Common InformaEon Model you can write one search across many products.
The above search could cover twenty different products, all with matching field extracEons
Most searches in this session will be based on the common informaEon model
Try with the ES Sandbox!

Search Example
17
Raw Search 71 Seconds
With Data Model AcceleraEon 9.8 Seconds

Techniques – Flexible Stats
18
Example: | stats count(eval(acEon=“success”)) as successes count(eval(acEon=“failure”)) as failures by user • Anything you can do inside of an eval you can do in stats • Great Techniques: • If statements (use null for non-‐valid results) • values(eval(if(acEon=“success”,user,null))) as “Successful Users”
• Searchmatch and match for flexible matching • count(eval(if(searchmatch(“example of log message”), 1, null))) as “example hits” count(eval(if(match(email, “\@buuercupgames\.com”),1,null))) as buuercup_emails
• AND OR NOT • If(match(…) AND (host=“emailserver” OR host=“webserver”)…)

Techniques – Expand Base Search
19
Joins are really computaEonally expensive, and limited Only if you have one *very* rare term search and one dense search, are subsearches a great approach. (Best
if they’re not IP based, because IP searches are challenging) Incorrect (10k results!): tag=malware acEon=allow | stats count as infecEons by host | join host [search
index=proxy category=uncategorized | stats count as hits by host] Maybe Incorrect (400 seconds, 10k malware hits): [search tag=malware acEon=allowed | dedup dest |
rename dest as src | table src] (tag=proxy category=uncategorized) | stats count(eval(tag="malware")) as NumMalwareHits count(eval(tag="proxy")) as NumProxyHits by src
Beuer (72 seconds): (tag=malware acEon=allowed) OR (tag=proxy category=uncategorized) | eval mydest=if(tag="malware", dest, src) | stats count(eval(tag="malware")) as malware count(eval(tag="proxy")) as proxy by mydest | where malware>0 AND proxy>0
Best (14 seconds): | tstats prestats=t summariesonly=t count(Malware_Auacks.src) as malwarehits from datamodel=Malware where Malware_Auacks.acEon=allowed groupby Malware_Auacks.src | tstats prestats=t append=t summariesonly=t count(web.src) as webhits from datamodel=Web where web.hup_user_agent="shockwave flash" groupby web.src | rename web.src as src Malware_Auacks.src as src | stats count(Malware_Auacks.src) as malwarehits count(web.src) as webhits by src| where malwarehits > 0 AND webhits > 0

Search Example
20

Techniques – The Other Stats
21
SomeEmes you need more flexibility TransacEon is the world’s biggest Swiss army knife, but usually you just want a screwdriver Consider: – streamstats – ordered processing – eventstats – addiEve (non-‐destrucEve) stats processing – geostats – be world aware If necessary: transacEon

Techniques – Breaking Subsearch Limits
22
Common Usage: [search index=malware | table host] index=proxy Interpreted as: (host=vicEm1 OR host=vicEm2) index=proxy Easy specificity creates huge performance improvements (Did you know you can do | eval myhost=[search tag=malware | return dest]) Subsearches limited to 10,000 results and 60 seconds by default
You can also return a literally interpreted search string: [search tag=malware | stats values(dest) as search | eval search=“(dest=“ . mvjoin(search, “ OR dest=“) . “)”] • Can’t break 60 second limit without limits.conf change

Techniques – Higher Confidence
23
Trigger your components and register to a summary index – Hey, ES does that already!
Example: Find sources or desEnaEons of brute force, vicEms of IDS hits, or malware events (clean or not) and determine if those hosts have new uncategorized web proxy acEvity
We’ll look at that later

Core Use Case
24
New Process Launch within 15 minutes of anE-‐virus alert (successful or failed) and uncategorized proxy acEvity
[search tag=malware earliest=-‐20m@m latest=-‐15m@m | table dest | rename dest as src ]
earliest=-‐20m@m (sourcetype=sysmon OR sourcetype=carbon_black evenuype=process_launch) OR (sourcetype=proxy category=uncategorized)
| stats count(eval(sourcetype=“proxy”)) as proxy_events count(eval(sourcetype=“carbon_black” OR sourcetype=“sysmon”)) as endpoint_events by src
| where proxy_events > 0 AND endpoint_events > 0
First, find our infected hosts. (Didn’t we just say use stats instead of subsearch? Well, it’s a guideline, but with a 5 minute window, this should
be reasonable.)
Pull endpoint + proxy data for those hosts
See how many proxy and endpoint events per host
Filter to just hosts that have the known bad events

How Does it Scale?
25
Tstats version of Core Use Case | tstats prestats=t summariesonly=t count(Malware_Auacks.src) as malwarehits from datamodel=Malware where Malware_Auacks.acEon=allowed groupby Malware_Auacks.src
| tstats prestats=t append=t summariesonly=t count(web.src) as webhits from datamodel=Web where web.hup_user_agent="shockwave flash" groupby web.src
| tstats prestats=t append=t summariesonly=t count(All_Changes.dest) from datamodel=Change_Analysis where sourcetype=carbon_black OR sourcetype=sysmon groupby All_Changes.dest
| rename web.src as src Malware_Auacks.src as src All_Changes.dest as src
| stats count(Malware_Auacks.src) as malwarehits count(web.src) as webhits count(All_Changes.dest) as process_launches by src
Pull Malware Data
Pull Web (Proxy) Data
Pull Endpoint Data
Normalize Field Names
Do Count

Scalability Improvements
26
Raw Search: 21 seconds Tstats without “summariesonly”: 2.76 seconds Tstats with “summariesonly”: 2 seconds
Would likely have to remove summariesonly, due to implicit data model lag

About Endpoint Logs
27
Curious about Endpoint Monitoring? Check out the epic talk from Splunk Rockstar James Brodsky:
Splunking The Endpoint Wednesday, September 23, 2015 | 3:15 PM-‐4:00 PM

Demo
28

Privileged User Monitoring
Privileged User Monitoring 1. Start by detecEng something bad 2. Focus on highly visible or highly privileged users. Visibility: AuthenEcaEon Data Model (OR auth events) Analysis: stats + lookup + eval AcEon: CreaEng notable with appropriate severity and risk
30

Visibility
31
AuthenEcaEon Data Model – could be any auth data you wish, but the auth data model is available to everyone (even if you don’t have ES) and gives us a common language to speak

Analysis
32
Alert when users who usually log into very few systems all of a sudden logs into a lot
tag=authenEcaEon earliest=-‐30d@d| bucket _Eme span=1d | stats count by user, host, _Eme
| eval isRecent=if(_Eme>relaEve_Eme(now(),"-‐1d"), "yes", "no") | stats avg(eval(if(isRecent="no",count,null))) as avg first(count) as recent by user, host
| eventstats count(eval(if(avg>0,"yes",null))) as NumServersHistorically dc(eval(if(recent>0,"yes",null))) as NumServersRecently by user
| eval Cause=if(isnull(avg) AND NumServersHistorically>0, "This is the first logon to this server", "")
| eval Cause=if(NumServersHistorically*3 < NumServersRecently, mvappend(Cause,"SubstanEal increase in the number of servers logged on to"), Cause)
| where Cause!="”
Pull daily count per host, per user per day
IdenEfy recent logins
Pull average and recent per user, per host
Analyze cross-‐host context
First Eme / exisEng users
Track users who log in more servers than normal
Filter atypical users

Analysis
33
Alert when users who usually log into very few systems all of a sudden log into a lot
| tstats summariesonly=true count from datamodel=AuthenEcaEon where earliest=-‐30d@d groupby AuthenEcaEon.dest AuthenEcaEon.user _Eme span=1d | rename AuthenEcaEon.dest as dest AuthenEcaEon.user as user
| eval isRecent=if(_Eme>relaEve_Eme(now(),"-‐1d"), "yes", "no") | stats avg(eval(if(isRecent="no",count,null))) as avg first(count) as recent by
user, dest | eventstats count(eval(if(avg>0,"yes",null))) as NumServersHistorically
count(eval(if(recent>0,"yes",null))) as NumServersRecently by user | eval Cause=if(isnull(avg) AND NumServersHistorically!=0, "This is the first
logon to this server", "") | eval Cause=if(NumServersRecently>3 AND
NumServersHistorically*3<NumServersRecently,mvappend(Cause,"SubstanEal increase in the number of servers logged on to"), Cause)
| where Cause!=""
Pull daily count per host, per user per day
IdenEfy recent logins
Pull average and recent per user, per host
Analyze cross-‐host context
First Eme / exisEng users
Track users who log in more servers than normal
Filter atypical users

Analysis – Part Two
34
You know the high risk, high exposure users in your organizaEon – Sys Admins – ExecuEves – Contractors – First 3 months of employment, last 3 months of employment
Sources: – AD Group Membership – AD Title – HRIS Employment Status
ImplementaEon. Run a periodic search that: – Refreshes AD (or consolidates mulEple ADs, etc.) – IniEalizes risk=1 for all users – Does a ton of evals to apply your logic, adding to risk – Outputs to a new lookup

Analysis – Part Two -‐ Example
35
| inputlookup LDAPSearch | eval risk = 1 | eval risk = case(NumWhoReportIn>100, risk+10, risk) | eval risk = case(like(Groups, “%OU=Groups,OU=IT Security,%”), risk + 10, risk) | eval risk = case(like(Etle, “VP %”), risk+10, like(Etle, “Chief %”), risk+100, 1=1, risk) | fields risk sAMAccountName | outputlookup RiskPerUser

Analysis – Pu�ng it Together
36
[… insert your Privileged User AcEvity Search …] | stats count by user | lookup RiskPerUser sAMAccountName as user | eval AggRisk = risk * count | eval DescripEveRisk = case(AggRisk > 100, “very high”, AggRisk>30, “medium”, AggRisk>5, “low”, 1=1, “very low”)

Analysis – Part Three (ES Specific)
37
If you are using Enterprise Security, you can pass a severity, risk_score, risk_object, and risk_object_type fields in your search
This lets you override the severity, or risk associated with the system. | rename AggRisk as risk_score
Beuer yet, use the built-‐in ES IdenEty Framework to automaEcally set the urgency for your events!

Demo
38

Conquering Alert FaEgue

Conquering Alert FaEgue • There are more events than you can possibly handle. Fact of life. • There are many great techniques for managing this:
– Risk analysis to idenEfy machines/users/etc of the greatest concern – StaEsEcal analysis to idenEfy unusual hits – Track alerts on mulEple vectors to bubble up significant threats – Trigger increased logging aRer mundane alerts (AcEon!) – Machine Learning to idenEfy outliers
• We will look at each of these techniques
40

Visibility
41
A typical Eer one analyst can handle one event every 10 (maybe 15) minutes on average. That’s about 50 events per shiR.
If you have 10 Eer one analysts, you shouldn’t have more than 500 events per day.
For any rule triggering more than a hundred events per day, consider these techniques. Certainly rules with tens of thousands.
Analysis Technique – Risk-‐Based
42
• This approach is great for general purpose events, and should always be enabled
• Increase the risk associated with an enEty (user, system, signature, etc.) for each Eme that it hits, and then focus acEvity on high risk enEEes
• Available out of the box with Enterprise Security (index=risk_acEvity)
• Easy to implement on your own by adding | summaryindex index=risk enEEes of your own

Analysis Technique – StaEsEcal – Part One
43
This technique requires some experimentaEon, and threat modeling. You need to know your environment, to know what you want to learn about.
Establish your base dataset: tag=ids tag=auack | bucket _Eme span=1d | stats count by severity signature dest _Eme | stats sum(count) as count avg(count) as avg stdev(count) as stdev sum(eval(if(_Eme > relaEve_Eme(now(), “-‐1d”), count, 0))) as recent_count min(_Eme) as earliest by severity signature dest | eventstats avg(avg) as avg_num_per_dest avg(earliest) as avg_earliest sum(count) as sig_wide_count sum(recent_count) as sig_wide_recent_count by signature
Pull IDS Data
Check Daily DesEnaEons per Signature
Pull relevant metrics per signature, per host
Pull relevant metrics per signature overall
Analysis Technique – StaEsEcal – Part Two
44
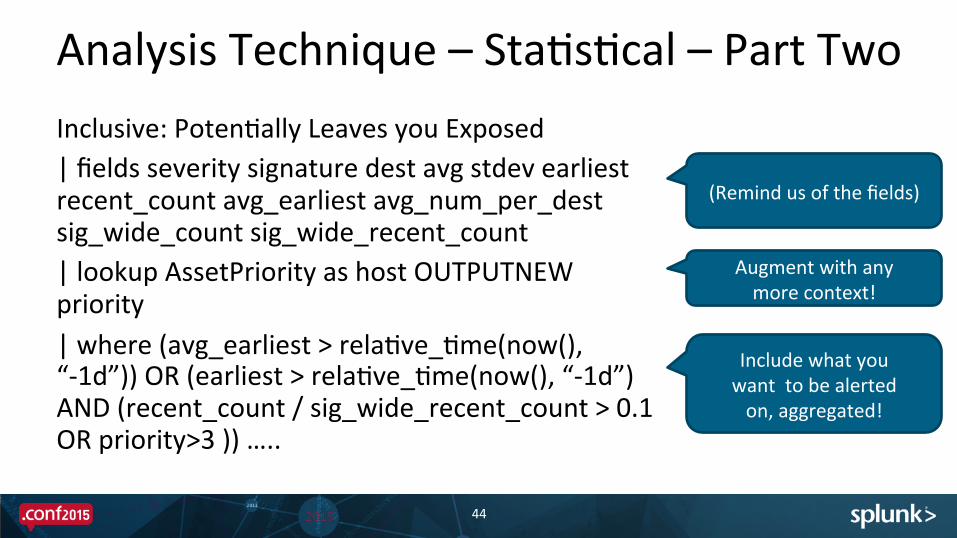
Inclusive: PotenEally Leaves you Exposed | fields severity signature dest avg stdev earliest recent_count avg_earliest avg_num_per_dest sig_wide_count sig_wide_recent_count | lookup AssetPriority as host OUTPUTNEW priority | where (avg_earliest > relaEve_Eme(now(), “-‐1d”)) OR (earliest > relaEve_Eme(now(), “-‐1d”) AND (recent_count / sig_wide_recent_count > 0.1 OR priority>3 )) …..
Include what you want to be alerted on, aggregated!
(Remind us of the fields)
Augment with any more context!

Analysis Technique – StaEsEcal – Part Two
45
Exclusive: PotenEally more work | fields severity signature dest avg stdev earliest recent_count avg_earliest avg_num_per_dest sig_wide_count sig_wide_recent_count | lookup AssetPriority as host OUTPUTNEW priority | where NOT (avg_earliest < relaEve_Eme(now(), “-‐1y” AND sig_wide_recent_count / sig_wide_recent_count < 0.05 AND priority <=3) …..
Exclude what you don’t want to be alerted on!
Repeat of last slide

Analysis Technique – Combine MulEple Vectors
46
If you have a number of correlaEon searches firing, you can track the output of those searches and do a meta analysis.
If you use Enterprise Security, use index=notable. If you use a EckeEng system, query that. If you use the alert manager, use | rest “/services/alerts/fired_alerts”
CraR a search that looks for mulEple event endpoint alerts, and then create a high confidence high severity event based on that.

Analysis Technique – Combine MulEple Vectors
47
Example: index=notable | stats dc(search_name) as NumRules values(search_name) by dest| where NumRules>2 More Powerful Example: (index=notable AnEvirus OR ids) OR (index=proxy category=uncategorized) | eval dest=case(index=“proxy”, src, index=“notable”, dest) | stats count(search_name) as NumRuleHits count(eval(index=“proxy”)) as NumUncategorizedHits by dest
In ES >= 3.2, search index=risk_acEvity for correlaEons w/o notables

Analysis Technique – Increase Logging
48
If you have a mundane alert (e.g., low severity IDS alert, AV successful clean, etc.), why not increase logging on that host for a while?
With ES, you can use Stream to do network capture. With or without ES, you can use your ETDR soluEon. Many customers leverage panblock or expect scripts to add suspect hosts to groups that have addiEonal logging. Etc.
Write addiEonal correlaEon rules based on that increased logging to look for higher confidence, higher severity alerts.

Analysis Techniques – Machine Learning
49
With Machine Learning, you can build extremely powerful models and techniques for finding outliers programmaEcally.
Look at Splunk UBA – this is what they do. – See Booth in the SoluEons Showcase – See Sessions Wed 10 AM – Ask your SE!
Look at the new ML App! – See booth in the SoluEons Showcase – See Sessions Wed 2:15 PM, Wed 4:15 PM (Also, AWS Wed 12:15 PM) – Ask your SE! (Watch him look bewildered!)

Demo
50

Threat Feeds

Threat Feeds • With everything covered above, you could easily build your own threat feed engine in Splunk.
• Don’t
52

Great Threat Feed Tools
53
Enterprise Security is officially supported and will integrate nine different types of threat intel
If you don’t have Enterprise Security, look at Splice on Splunkbase – it’s not supported, but works for many customers.
Please, please don’t build it yourself!
IPs Domains User Names
Process Names Hashs CerEficate Hashes
CerEficate Common Names Email Addresses File Names

Demo
54

But That’s Not all for Threat Intel
55
Lots of things you can do with Threat Intel – Turning IndicaEons of Compromise into Tangible ProtecEon – Wed 3:15 PM
Kaiser’s KaEe Winslow and Michael Slavick – OperaEonalizing Data Science Output Using Splunk -‐ Wed 4:15 PM
Kaiser’s Dave Dyer and Tim Neyman – Managed Threat Intelligence in Splunk ES – Thurs 11:15 AM
Splunk’s Brian Luger (ES Developer)
Generate it yourself (go ask your SE and tell him David Veuve sent you)

Wrap Up

We Looked at a Lot of Things
57
Many search techniques Many correlaEon search examples

How to Be Successful
58
Go download the app – install it on a non-‐producEon instance! Includes: – Link to session PDF – Link to hand-‐out – An example search for every use case and technique discussed!
Go check out other sessions Post quesEons on answers.splunk.com with tag “correlaEonsearch”! Talk to the person next to you! Go auend Birds of a Feather Session

Give Me Feedback!
59
Rate it in the app Also give feedback here: hup://www.davidveuve.com/conf2015 $50 Amazon giR card will be randomly given!
Download the app, play around with it, and give me feedback hup://www.davidveuve.com/conf2015app
Another $50 Amazon giR card will be randomly given!

THANK YOU

Appendix Network HunEng

Techniques -‐ Shape
62
Shape can be the length of a URL, the punct of a URL etc. hup://myurl.com/codepath
hup://myurl.com/codepath?query=Robert%2527)%3b%2520DROP%2520TABLE%2520Students%3b
Use eval with len (length), punct, and replace

Techniques -‐ Frequency
63
Understand your common raEos is easy – HTTP GET/POST/Connect/Delete
You’ve been around for 2,5,10,20 years. Track how oRen you talk to different websites, and alert on newness
Detect with top/rare/stats/Emechart
Techniques – Temporality
64
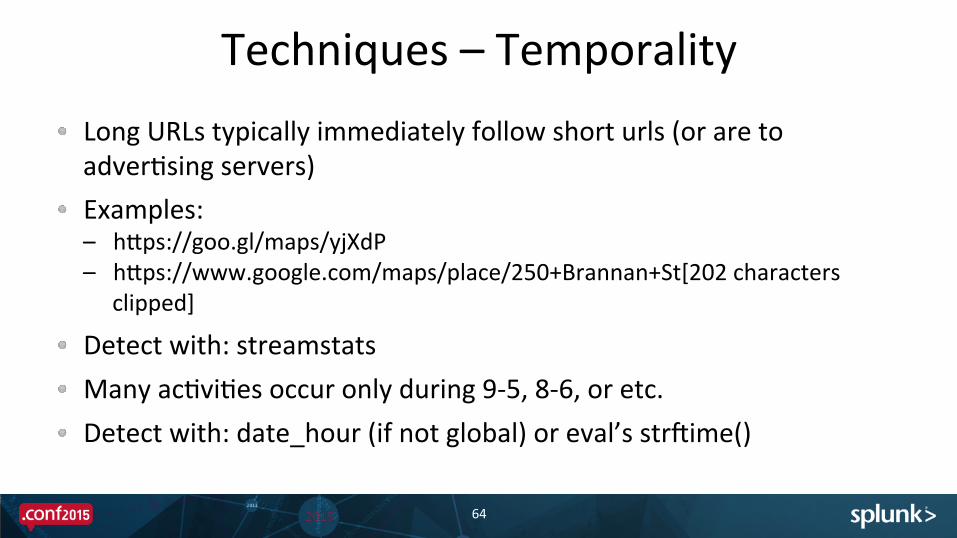
Long URLs typically immediately follow short urls (or are to adverEsing servers)
Examples: – hups://goo.gl/maps/yjXdP – hups://www.google.com/maps/place/250+Brannan+St[202 characters
clipped]
Detect with: streamstats Many acEviEes occur only during 9-‐5, 8-‐6, or etc. Detect with: date_hour (if not global) or eval’s strRime()

Techniques -‐ Coherence
65
Coherence (in this case) – Systems that are servers tend to stay servers, systems that are clients tend to stay clients Also useful for looking at network traffic

Analysis
66
| tstats summariesonly=t count from datamodel=Network_Sessions where src!=dest earliest=-‐30d@d groupby All_Sessions.src_ip All_Sessions.dest_ip _Eme span=1d | eval pairs = mvappend("src|" + 'All_Sessions.src_ip', "dest|" + 'All_Sessions.dest_ip') | fields pairs _Eme | mvexpand pairs | rex field=pairs "(?<direcEon>.*?)\|(?<host>.*)" | bucket _Eme span=1d | stats count(eval(direcEon="src")) as iniEaEng count(eval(direcEon="dest")) as terminaEng by host _Eme | eval isRecent = if(_Eme>relaEve_Eme(now(), "-‐1d"), "yes", "no") | eval raEo = iniEaEng / (iniEaEng+terminaEng) | stats avg(eval(if(isRecent="no", raEo, null))) as avg_raEo avg(eval(if(isRecent="yes", raEo, null))) as recent_raEo by host | where (avg_raEo > 0.9 AND recent_raEo < 0.3) OR (avg_raEo < 0.1 AND recent_raEo > 0.7)

Analysis
67
| tstats prestats=t summariesonly=t count(All_Sessions.src_ip) from datamodel=Network_Sessions where All_Sessions.src_ip!=All_Sessions.dest_ip All_Sessions.src_ip=* earliest=-‐30d@d groupby All_Sessions.src_ip _Eme span=1d | tstats prestats=t append=t summariesonly=t count(All_Sessions.dest_ip) from datamodel=Network_Sessions where All_Sessions.src_ip!=All_Sessions.dest_ip All_Sessions.dest_ip=* earliest=-‐30d@d groupby All_Sessions.dest_ip _Eme span=1d | rename All_Sessions.src_ip as ip All_Sessions.dest_ip as ip | bucket _Eme span=1d | stats count(All_Sessions.src_ip) as iniEaEng count(All_Sessions.dest_ip) as terminaEng by ip _Eme | eval isRecent = if(_Eme>relaEve_Eme(now(), "-‐1d"), "yes", "no") | eval raEo = coalesce(iniEaEng,0) / (coalesce(iniEaEng,0)+coalesce(terminaEng,0)) | where isnotnull(raEo) | stats sum(iniEaEng) sum(terminaEng) avg(eval(if(isRecent="no", raEo, null))) as avg_raEo avg(eval(if(isRecent="yes", raEo, null))) as recent_raEo by ip | where isnotnull(recent_raEo) AND isnotnull(avg_raEo) | where (avg_raEo > 0.9 AND recent_raEo < 0.8) OR (avg_raEo < 0.1 AND recent_raEo > 0.2)