Embed Size (px)
Citation preview

Sedentary Behaviour and Obesity: Review of the Current Scientific
Evidence
Authorship of this paper is The Sedentary Behaviour and Obesity Expert Working Group: Professor Stuart Biddle, Loughborough University (Chair) Nick Cavill, Cavill Associates & University of Oxford Dr Ulf Ekelund, MRC Epidemiology Unit, Cambridge Dr Trish Gorely, Loughborough University Professor Mark Griffiths, Nottingham Trent University Dr Russ Jago, University of Bristol Professor Jean-Michel Oppert, Pitie-Salpetriere Hospital, Paris, France Dr Monique Raats, University of Surrey Dr Jo Salmon, Deakin University, Australia Professor Gareth Stratton, Liverpool John Moores University Dr Germán Vicente-Rodríguez, University of Zaragoza, Spain Dr Bryony Butland, Cross Government Obesity Unit (Knowledge & Evidence) Liz Prosser, Cross Government Obesity Unit (Delivery Manager - Physical Activity) Debra Richardson, Cross Government Obesity Unit (Programme Manager) (until Dec, 2009)
Report submitted: March 26, 2010
1

Table of Contents
Executive Summary 3
1 Introduction: Policy Context and Process of DevelopingRecommendations 5
1.6 Summary Recommendations� 9
2 What is Sedentary Behaviour? 11
3 How do we Measure Sedentary Behaviour? 13
4 Health Outcomes of Sedentary Behaviour 15
4.1� Young people 154.2� Adults 18
5 Prevalence of Sedentary Behaviour 22
5.1� Young people 225.2� Adults and older adults 255.3� Tracking of Sedentary Behaviour 28
6 Factors Associated with Sedentary Behaviour 30
6.1� Young people 306.2� Adults 346.3� Diet and sedentary behaviour in young people 376.4� Diet and sedentary behaviour in adulthood 39
7 Interventions to Reduce Sedentary Behaviour 41
7.1� Young People 417.2� Adults 43
8 Current Trends in Media Technology 44
9 International Guidelines on Sedentary Behaviour 47
10 Gaps in evidence 50
References 51Appendices 66
2

____________ Executive Summary
1. Sedentary behaviour is not simply a lack of physical activity but is a cluster of individual behaviours where sitting or lying is the dominant mode of posture and energy expenditure is very low.
2. Sedentary behaviours are multi-faceted and might include behaviours at work or school, at home, during transport, and in leisure-time. Typically, key sedentary behaviours include screen-time (TV viewing, computer use), motorised transport, and sitting to read, talk, do homework, or listen to music.
3. Total time spent in sedentary behaviours can be captured by objective monitoring devices, such as accelerometers and inclinometers. The former can quantify the amount of time spent below a predetermined threshold of movement, and its temporal patterning across the day. Inclinometers can quantify time spent in different postures by distinguishing between lying, sitting and standing.
4. Self-reported sedentary behaviour instruments can ask respondents to report frequency and duration of time spent in different behaviours, such as TV viewing and computer game playing, over a specific time frame.
5. UK self-report data suggests that the majority of young people have ‘acceptable’ levels of TV viewing, but about one-quarter to one-third watch 4 hours per day or more, levels generally considered excessive.
6. Data on computer game playing by young people show more variability, but with up to 60% playing for more than 1 hour/day. These trends are changing rapidly and it is increasingly the case that technologies are converging.
7. According to accelerometer data, UK youth appear to spend about 420460 minutes per day in sedentary behaviour, which is about 60-65% of measured time.
8. Self-report estimates of sedentary behaviour show that approximately two-thirds of adults spend more than 2 hours per day watching TV and using the computer.
9. Significant proportions of adults report sitting for more than 5 hours per day (including work and leisure-time), and adults report spending between 3-4 hours per day sitting during their leisure-time.
10. Sedentary behaviours appear to track from childhood to adolescence or adulthood at low to moderate levels, with the strongest tracking shown for TV viewing.
11. The technological landscape is rapidly changing and evolving (for instance TV viewing on computers or internet access on TVs). This has implications for the interpretation of results from studies that may become rapidly dated.
12. Some countries have guidelines for sedentary behaviour. However, there is little or no justification given in the vast majority of recommendation documents for any time limit concerning sedentary behaviour.
13. There is a greater risk of obesity in young people with high amounts of sedentary behaviour and TV viewing at a young age being predictive of overweight as a young adult.
3

14. There is a positive association between sedentary time and markers of metabolic risk in young people.
15. Sedentary behaviour for adults is associated with all-cause and cardiovascular mortality, diabetes, some types of cancer and metabolic dysfunction.
16. The prospective association between sedentary behaviour and gain in body weight or the development of obesity is less clear.
17. Variables that are associated with screen-viewing in young children, and may be possible to change, include family TV viewing, snacking, body weight, parent viewing, and having a TV in the bedroom.
18. Higher BMI and depression are associated with screen-viewing in adolescents.
19. Screen-viewing tends to differ in young children by age, gender and SES; for adolescents by age, gender, ethnicity, SES, parent education; for young people by age, SES, single parent household, and ethnicity.
20. Sedentary behaviours in adults are associated with age, gender, socioeconomic conditions, occupation, weight status, and some characteristics of the physical environment. These relationships are independent of level of overall physical activity.
21. TV viewing in young people and adults is associated with a higher energy intake and poorer diet.
22. Interventions to reduce sedentary behaviour in young people, with or without the goal of changing weight status, show promise. However, given the paucity of evidence on modifiable correlates of sedentary behaviour, clear strategies to bring about successful behaviour change are still not known.
23. There is almost no evidence concerning sedentary behaviour interventions with adults.
24. Four recommendations suggest that the UK summary statements on physical activity: 1). should contain a specific recommendation that children and young people, adults, and older adults should aim to minimise the time they spend being sedentary each day; 2). should not set a quantified target for sedentary time (for people of school age and above) but should emphasize minimising time spent being sedentary each day; 3). should include specific recommendations for limiting sedentary time among children of pre-school age. These should be developed and agreed by the early years expert group; 4). should suggest the strategies to reduce sedentary behaviour.
4

1 Introduction: Policy Context and Process of
Developing Recommendations
1.1 Purpose of the report
This report was commissioned by the Department of Health’s Cross Government Obesity Unit to provide expert input into the process of developing recommendations on limiting time spent being sedentary. This report explores the evidence linking sedentary behaviour with health outcomes, and in particular overweight and obesity, describes what has been done in other countries, and investigates whether there is sufficient evidence to make recommendations on reducing or limiting sedentary behaviour.
1.2 Obesity and physical activity: the historical context
We are in what has been termed an ‘obesogenic’ environment, or society [1], with many factors acting to make it challenging to maintain healthy body weight or reduce overweight and obesity [2]. In respect of human evolution, people now adopt lifestyles in industrialised countries that were quite unknown until very recently. The industrial-technological ‘slothogenic’ society of today [3] was preceded by the early beginnings of the hunter-gatherer, through to active manual employment or substantial energy expenditure in home-based chores and active forms of transport [4]. Such changes reflect low levels of habitual physical activity and are associated with significant health problems. ‘Hypokinetic diseases', or health problems related to a lack of physical activity, were identified in ancient societies and formally documented in a systematic way over the past half century [5, 6]. Such hypokinetic problems can include poor mental health, coronary heart disease (CHD), obesity, low back pain, osteoporosis, hypertension, diabetes, and some cancers. The UK Government’s Chief Medical Officer (CMO) states that “there are few public health initiatives that have a greater potential for improving health and well-being than increasing the activity levels of the population” [7]. The evidence linking physical activity patterns with such health measures is increasing rapidly and reflects the growing importance of physical activity as a key public health issue.
In addition to studying the health benefits of moderate-to-vigorous physical activity, researchers have increasingly shown an interest in very low levels of movement and sitting, i.e., sedentary behaviour. While the obvious examples of such behaviours are TV viewing and playing computer games, there are many daily sitting behaviours, including car travel, socialising, reading, and listening to music, as well as long periods spent sitting at school or work. It is all of these sedentary behaviours that are of interest to health researchers and policy makers. However, the rise in the interest in sedentary behaviours is closely associated with the rapid increase in the availability and attractiveness of a wide range of screen-based behaviours, including school/work use of computers, leisure time computer use (games, online shopping, internet surfing etc), and TV viewing. While some of these behaviours will have replaced other sedentary pastimes (e.g., radio, reading) over the years, there
5

is widespread belief that the ubiquitous nature of screens is a threat to health from the point of view of very low energy expenditure and hence a risk to the development of overweight and obesity.
1.3 The policy context
The Government’s Foresight report was published in 2007, taking a cross-government ‘systems’ approach to the issue of obesity. This report set out a number of key challenges, most notably the need to view obesity as a complex system that required complex multi-level solutions. In response to this report, the Government published, in January 2009, ‘Healthy Weight, Healthy Lives: One Year On’ and committed to setting up an expert working group to review existing evidence on the impact of sedentary behaviour, including screen time, and in relation to overweight and obesity. This provides the context for this report and recommendations to the Cross Government Obesity Unit.
Underpinning this was the commitment that the Department of Health would ‘commission research to review the evidence on the impact of this ‘screen time’ on children’s outcomes, including their physical health and activity levels, and to consider the case for offering guidance to parents’. Such guidance has not existed before in the UK, and would be complementary to the established guidelines for physical activity. The guidelines could be a general recommendation to reduce time spent in sedentary activities, could offer a specific time limit, or could focus on limiting specific activities such as TV viewing or all ‘screen time’. This report considers all these issues, including evidence on sedentary behaviour of adults, and combines published evidence with expert opinion.
1.4 Process
The report is written by the Department of Health’s Sedentary Behaviour and Obesity Expert Working Group. Members are listed on the cover page. Each member of the group was invited to lead on the investigation of a key topic. While we were interested in all health outcomes (and indeed other outcomes such as cognitive development), the group had a particular focus on links to energy expenditure and obesity. For each topic the lead expert conducted their own review of the literature and presented the findings for discussion and agreement by the whole group. These topics were combined into a full report that was used to develop draft recommendations. These recommendations, and the evidence on which they are based, were issued for wide consultation via online consultation and a one-day stakeholder meeting. The report and recommendations should be seen to sit alongside work on the development of physical activity guidelines (see Figure 1).
The report is structured around the behavioural epidemiology framework [8], applied to sedentary behaviour, as follows, and with a particular focus on screen time:
6

1. to define and assess sedentary behaviour and to identify prevalence and trends
2. to establish the links between sedentary behaviour and health outcomes, with a specific focus on overweight and obesity
3. to identify the factors associated with sedentary behaviour 4. to evaluate the success of interventions designed to reduce sedentary
behaviour.
In addition, we considered international guidelines that exist on sedentary behaviour, as well as current trends in media technology that might influence sedentary behaviour. Moreover, links between sedentary behaviour and diet are also identified. Finally, we identify possible recommendations for sedentary behaviour as well as gaps in the current evidence base.
1.5 Consultation
This report was subjected to two forms of consultation (see Figure 1). First, an online consultation was held from December 2009-Jan 2010 to seek input to the project from professionals interested in sedentary behaviour. This had two main functions:
• To seek comments on the draft Working Paper Sedentary Behaviour
and Obesity: Review of the Current Scientific Evidence
• To gather initial views about the proposed recommendations made by the Expert Group.
Fifty two responses were received from a variety of professionals from public, private and voluntary sectors, with the vast majority being health professionals. Responses covered a wide variety of issues. The most frequently mentioned issue was whether there was sufficient evidence to make a quantified recommendation. Some respondents felt that the lack of a quantified recommendation meant that the report might look weak. Others appreciated that there was insufficient evidence available to quantify the amount of sedentary or screen time. Other comments tended to focus on specific ideas for ways to implement the recommendations. Overall, there were very high levels of agreement with between 70% - 90% of respondents agreeing with the draft recommendations.
Second, to investigate the issue further and enable people to discuss in more detail, a consultation meeting was held. This was attended by 48 people from a range of professional backgrounds. Again this revealed a great deal of interest in the topic. There was less discussion on the setting of a quantified limit for total time spent being sedentary, but considerable interest in the maximum recommended bout of sedentary time. This might lead to recommendations to sit for a maximum time before standing and taking a break. A great deal of the discussion focused on practical ways that the recommendations might be implemented, and turned into public messages. These will be conveyed to the group being tasked with communicating the final recommendations.
7

Figure 1. The process of developing recommendations for sedentary behaviour alongside recommendations and guidelines for physical activity.
8
1.6 Summary Recommendations
Table 1. Summary of recommendations and evidence for each recommendation, following consultation
Recommendation Evidence statements supporting this recommendationi
1. The UK summary statements on physical activity should contain a specific recommendation that children and young people,
Children, young people, adults and older adults in the UK currently spend, on average, more than half their waking hours being sedentary at school, at work, during leisure time and when travelling.
adults, and older adults should aim to minimise the time they spend being sedentaryii each day.
The amount of time spent being sedentary is an important risk factor for several aspects of ill health, including overweight and obesity and associated metabolic diseases.
Spending large amounts of time being sedentary may increase the risk of some health outcomes, even among people who are active at the recommended levels.
Sedentary behaviour during childhood and adolescence may form the foundation for such behaviours in adulthood. There appears to be a stronger relationship between child and adult TV viewing than there is between child and adult physical activity behaviour.
2. The UK summary statements on physical activity should not set a quantified target for sedentary time (for people of school age and above) but should emphasize minimising time spent being sedentary each day.
Although some countries have suggested limiting TV and/or screen time for children to two hours a day, the expert group concluded that the scientific evidence does not currently support such a specific recommendation for a limit to sedentary time, nor an exclusive focus on screen time for children.
The expert group also found insufficient evidence to agree a quantified recommendation for reducing sedentary behaviour among adults
3. The UK summary statements on physical activity should include specific recommendations for limiting sedentary time among children of pre-school age. These should be developed and agreed by the early years expert group.
The early years expert group found evidence for adverse associations between sedentary behaviour in 0-5 year olds and body fatness, and for cognitive development. There is also some evidence of adverse associations between sedentary behaviour and poor diet; cardiovascular health; self-regulation; and motor development. In addition there is evidence that sedentary behaviour in the early years: goes against the child’s natural tendencies to be active; reduces the amount of physical activity that can be participated in; reduces the time that can be spent developing rudimentary and fundamental movement skills, as well as restricting opportunities to learn about the environment, which is mainly done through play. In addition, extended periods of sitting may be detrimental to health.
9

4. The UK summary statements on physical activity should suggest the following strategies to reduce sedentary behaviour:
• for children and young people: offering opportunities to reduce sedentary behaviour at school, but particularly during the after-school period, at weekends, and during school holidays. Replace some sedentary time with active play.
• for adults: reducing sedentary behaviour through the day including at work and when travelling; at home, include some active tasks and hobbies, where possible.
• for all ages: replacing sedentary (motorised) travel with active travel (cycling and walking).
• for all ages: breaking up extended periods of sedentary behaviour; take an active break from sitting every 30 minutes.
• for families: reduce total TV viewing time; consider strategies for children to ‘earn’ screen time; agree a family limit to screen time per day.
Outside school and work, the most prevalent sedentary behaviours include use of screens (TV; computer games; media devices), motorised travel and sedentary social activities.
Among school-age children, the level of activity in the after school period is correlated with overall activity levels.
Travel takes up a significant proportion of people’s time, and offers a key opportunity to reduce time spent sitting.
10

2 What is Sedentary Behaviour?
The first studies on physical activity epidemiology included the study of sedentary and physically active occupations, such as the seminal work of the late Jeremy Morris. In one of his famous studies, Morris studied sedentary London bus drivers and active bus conductors and found that the incidence of coronary heart disease was higher in the sedentary occupations [9]. To this extent, therefore, sedentary behaviour research is not new. However, there has been an explosion of research specifically addressing sedentary behaviour in the past few years, prompted by the ubiquitous nature of attractive home-based, often screen-centred, entertainment and extensive use of labour-saving devices and door-to-door motorised travel.
Defining sedentary behaviour
The Latin verb sedere means to sit and gives rise to the modern use of the word ‘sedentary’. Intuitively, many think that ‘sedentary behaviour’ is simply a lack of physical activity, but this would be misleading. For example, many research studies refer to the recruitment of ‘sedentary’ participants when defining sedentary as not meeting a criterion level of physical activity. Marshall and Welk [10] state young people being ‘insufficiently active’ is different from being ‘sedentary’, although they say that this distinction often gets overlooked. They propose that the term ‘sedentary behaviour’ be used rather than ‘physical inactivity’.
Contemporary sedentary behaviour researchers do not accept the position that sedentary behaviour is simply a lack of physical activity and, instead, prefer to define the term in respect of individual behaviours where sitting or lying is the dominant mode of posture and energy expenditure is very low. Pate et al. [11] say that “sedentary behavior includes activities that involve energy expenditure at the level of 1.0-1.5 metabolic equivalent units (METs). (One MET is the energy cost of resting quietly, often defined in terms of oxygen uptake as 3.5 mL/kg-1.min-1) (p. 174).” However, recent research suggests this value is overestimated by about 35% [12]. This will have implications when estimating energy expenditure using MET values.
Sedentary behaviours are multi-faceted and might include behaviours at work or school, at home, during transport, and in leisure-time. Typically, key sedentary behaviours include screen-time (TV viewing, computer use), motorised transport, and sitting to read, talk, do homework, or listen to music. It is not simply the case of insufficient physical activity. While some reduction of sitting time at school or work may be desirable and possible, it is likely that major reductions in sedentary behaviour will come from addressing leisure-time behaviours, such as TV viewing and recreational screen time, as well as shifting from motorised to active forms of travel. Some reductions in sedentary behaviour may result in a direct transfer to moderate-to-vigorous physical
11

activity, however, some will result in a transfer in ‘light’ activity, such as standing and light ambulation. This, too, may be beneficial[13].
Figure 2 depicts different behaviours that vary in energy expenditure (EE) and highlight the distinctions being made in this report (see also Figure 1.1 in Marshall & Welk [10]). Typically, sedentary behaviours are those that involve sitting.
Figure 2. Sedentary behaviour (sitting) differentiated from other behaviours. Behaviours to the right of the dotted line are those featured in physical activity guidelines documents (figure adapted courtesy of Mark Tremblay, University of Ottawa, Canada). Key: EE: energy expenditure; MPA: moderate intensity physical activity; VPA: vigorous intensity physical activity.
12

3 How do we Measure Sedentary Behaviour?
If sedentary behaviour is defined in respect of time spent in a). low energy (sitting) tasks, and b). specific sedentary behaviours, measurement must reflect this. Therefore, there are two broad categories of measurements that have been adopted in sedentary behaviour research. Total time spent in sedentary behaviours can be captured by objective monitoring devices, such as accelerometers and inclinometers, and sensors assessing variations in physiological parameters, or combinations of these methods. The former can quantify the amount and temporal patterning across the day of time spent below a predetermined threshold of movement [14]. Inclinometers can quantify time spent in different postures by distinguishing between lying, sitting and standing. While these approaches can be valuable and avoid the vagaries of self-reported methods, there are times when we need to know what people are doing in respect of different sedentary behaviours. This will require using various self-report assessment methods.
Self-reported sedentary behaviour instruments can ask respondents to report frequency and duration of time spent in different behaviours, such as TV viewing and computer game playing, over a specific time frame [15, 16]. Alternatively, researchers have used time-use diaries, whereby participants record their behaviour at set time periods over several days [17]. Direct observation of behaviours is an alternative method that could yield reliable estimates but at the cost of high levels of intrusion and possible reactance. For young children, parents have sometimes been requested to estimate behaviours for their children. These are called ‘parent proxy’ measures. One paper has reported on the validity of parent proxy reporting of children’s TV viewing [18] and found that “parents overestimate their child's television time compared to an objective measure when no television is present in the bedroom by 4 hours/week … in comparison to underestimating television time by over 3 hours/week … when the child has a television in their bedroom” (p. 1).
Bryant et al. [19] conducted a systematic review of TV viewing measures in children and adolescents. Although TV is only one of many possible sedentary behaviours, it is the most highly prevalent. The authors concluded that most studies used self-report rather direct observation and few reported validity or reliability data for the instruments.
Clark et al. [20] conducted a systematic review of measures of television viewing time and other non-occupational sedentary behaviour in adults. They located 60 papers reporting on the assessment of at least one type of leisure-time sedentary behaviour and, unsurprisingly, TV viewing time was the most commonly measured sedentary behaviour. The main method used was self-reported survey. Only a few studies examined validity and reliability. However, the authors did report that test–retest reliabilities were moderate-to-high, but that validity was variable.
13

In conclusion, the assessment of sedentary behaviour requires further work, particularly if self-report methods are chosen. This requires more research on the validity and reliability of such instruments, and the need to assess more than TV viewing. The use of objective movement sensors, such as accelerometers, or the combination of movement and physiological (e.g. heart rate) sensors, are to be encouraged if aiming to provide an overall estimate of time in sedentary behaviour. However, the cut-offs used for defining sedentary behaviour currently differ between studies and this may need standardising.
14

4 Health Outcomes of Sedentary Behaviour, withSpecific Reference to Overweight and Obesity
4.1 Young people
Introduction
Data suggest a growing concern for the risk sedentary behaviour may have on the current and future health of children and adolescents, as well as adults. The main body of literature available has pursued the relationship between overweight and obesity and sedentary behaviour. A combination of electronic media use and screen time are thought to be related to obesity and other long term health outcomes. Most large studies reveal that young people who spend extensive amounts of time sitting are more likely to be overweight [2124] and also have worse metabolic health [25-28]. The aim of this section, therefore, is to describe the relationship between sedentary behaviour, overweight and metabolic risk in young people.
Methods
The literature was searched using PubMed and Web of Science. In addition, discussion with expert group members and perusal of reference lists of key publications took place. We did not perform a full systematic review, rather a rapid review. We restricted our search to include articles that included measures of sedentary behaviour and indices of body composition (such as BMI, body fat percentage, skin fold measures, waist circumference). Only studies examining the association between a measure of sedentary behaviour (e.g., time watching TV, computer use, screen time) with body composition or metabolic risk that included a measure of body composition were considered.
Results
We identified two prospective longitudinal cohort studies [21, 24] and one shorter longitudinal study [29], one meta-analysis [22], and two reviews that included interventions [30, 31]. The rest of the articles were either observational or cross sectional in design. Three studies used metabolic risk [25-27], one used insulin resistance [28], one blood pressure [32], and another serum cholesterol and blood pressure [21] as their outcome measure. Studies used BMI, BMI categories of overweight or obesity, BMI z-score, waist circumference, percent body fat (DXA), bioimpedance or skin folds as their main variable of interest. Sedentary behaviour was mainly assessed using various forms of self report, either direct or by parent proxy. The main behaviour recorded via self report was TV viewing, followed by screen time that also included computer use and computer games. One study assessed “actual TV viewing time” as well as sedentary behaviour [29] by direct observation. Other studies also reported the patterning of screen viewing time by weekday and weekend, or after school. Some studies used accelerometers
15

to measure sedentary behaviour although cut points varied with 100 [33], 200 [34], and 500 [26] counts per minute being used. Many studies controlled for confounding variables with baseline BMI, socioeconomic status, sports participation, and age being the most common. The sample sizes from the studies range from just over 100 to nearly 15,000 and some of the studies have follow up of between 3 and 25 years. All studies included girls and boys and a few also included ethnicity. Sample size was related to the research design and type of measurement, with metabolic studies and those that used objective measures of sedentary behaviour being smaller than large prospective cohort studies. An overview of studies is provided in Table 2.
Sedentary behaviour and obesity
The two prospective studies [21, 24] report associations between TV viewing and obesity whilst controlling for significant confounders. Both report a dose-response relationship with an increasing likelihood of overweight with greater TV viewing time. Viner and Cole [24], using a logistic regression analysis (using obesity [BMI ≥30] at 30 yrs as the outcome), also revealed that each additional hour of TV watched on weekends at age 5 years equated to a 7% increase in risk of obesity at 30 yrs. Conversely, Hancox and colleagues [21] found a similar relationship but with weekday television viewing where parent-and self-reported time spent viewing TV between 5 and 15 years predicted BMI and cholesterol at age 26 years. Jago and co-authors [29] used observation to quantify “actual TV viewing time” and found that TV viewing and physical activity predicted BMI across three study years in 3-7 year olds and the relationship increased with age and was similar across three ethnic groups.
Both available reviews [22, 30] found small but statistically significant relationships between body fat and TV viewing although Marshall et al. [22] reported that this was not likely to be clinically significant. Further cross sectional studies that used an objective measure of sedentary behaviour and more sensitive measures of body fat found positive associations and greater risks of being obese with sedentary behaviour [33, 34]. Interestingly, both studies also reported that moderate and vigorous physical activity were more significant contributors to obesity than sedentary behaviour. Laurson et al. [35] furthered this debate and found that boys and girls who met activity guidelines but not screen time recommendations [36] were over 30 per cent more likely to be overweight than children who met both guidelines. Whilst there is not enough evidence to make a recommendation on the amount of screen time required to reduce the risks of overweight and obesity, Spinks and colleagues [37] have reported an odds ratio (OR) of 1.63 for overweight for children who use electronic media for >2 hours per day compared to those who use it for <2 hours per day. Similarly, Fairclough and colleagues [23] reported that overweight girls were 33% more likely to use the internet for 1 hr/d at weekends than their normal weight counterparts.
Sedentary behaviour and metabolic risk
16

Ekelund et al [26] found a positive association between TV viewing and fasting insulin and body fat measured by skinfolds, as well as between TV viewing and clustered metabolic risk. However, TV viewing time was not associated with clustered metabolic risk score independent of adiposity, therefore the association between TV viewing and clustered metabolic risk appears to be mediated by adiposity. The association between TV time and adiposity was independent of physical activity whereas the associations with insulin and clustered metabolic risk were attenuated after adjustment for activity. Further, the association between TV time and adiposity was mediated by frequency of snacking.
Sardinha et al. [28] reported that fasting insulin (HOMA-IR) was significantly and positively associated with objectively measured sedentary time independent of sex, birth weight, sexual maturity, and total or central fat mass. Martinez-Gomez et al. [32] also found that TV viewing and screen time were associated with blood pressure in children independent of body composition. Mark and Janssen [27] reported a positive dose-response relationship between screen time and metabolic syndrome with those children watching screens for more than 3 hours per day, demonstrating double the risk of metabolic syndrome compared to children who spend less than 1 hour per day at a screen. Moreover, adjusting for physical activity had little impact on the findings.
Limitations
Prospective studies provide the most compelling evidence of the relationship between sedentary screen time in childhood and adult overweight and obesity. However, these studies are limited by self report of data and changing methods to assess sedentary behaviour over the duration of the study. Objective methods to quantify sedentary time have used various cut points, making comparisons difficult. The available literature is also limited by inconsistent approaches taken to accounting for confounding variables. Only one study measured dietary behaviour [38] and this is perhaps the main limitation of any work linking overweight and obesity to sedentary behaviour. Similar problems are observed in work on metabolic risk although these studies tend to use objective measures to quantify sedentary time which would also enable the interaction between sedentary behaviour and physical activity to be investigated. There is also a paucity of intervention studies [31] that would enable a causal link to be established between obesity and sedentary behaviour and to track this over time.
Summary
Overweight, obesity and sedentary behaviour • The association between sedentary screen time with overweight and
obesity does not vary by gender and age. • TV viewing at a young age is predictive of overweight as a young adult. • Odds ratios are consistent in demonstrating greater risk of obesity in
groups with high amounts of sedentary behaviour.
17

Metabolic factors There is a positive association between sedentary time and markers of metabolic risk.
Implications for national sedentary behaviour recommendations
1. There is a small-to-moderate significant relationship between TV viewing in childhood and adult overweight.
2. There is a limited scientific base to establish a relationship between sedentary behaviour and metabolic risk.
3. Based on the studies reviewed, it is possible to promote a recommendation that supports controlling screen time to manage overweight and obesity and metabolic markers of health in young people, but it is not possible to quantify this precisely in terms of a time limit for sedentary behaviour.
4.2 Adults
Introduction
American adults spend 55% of their waking time sedentary [39]. Furthermore, TV viewing is the most prevalent leisure time activity in American, Australian and UK adults [40-42]. Evidence is emerging that various indicators of sedentary behaviour, for example time spent watching TV, total sitting time, and objectively measured accumulated sedentary time, predicts insulin resistance [43], type 2 diabetes [44], cancer [45, 46], cardio-vascular, and all-cause mortality [47-49].
Adults who report longer durations of sitting time and time spent watching TV are more likely to be overweight or obese [50]. Similarly, cross-sectional and matched case-control studies suggest that normal-weight individuals are more physically active than obese individuals although the amount of energy expended from physical activity did not differ between groups [51]. However, cross-sectional, observational studies cannot address the direction of association between sedentary behaviour and weight gain and the development of obesity.
Therefore, the aim of this section is to describe the prospective associations between various indicators of sedentary behaviour with gain in body weight and development of obesity in adults.
Methods
Relevant published articles were searched using PubMed, supplemented by discussion with expert group members and reviewing reference lists of key publications. We did not attempt to perform a systematic review and restricted our search to include articles reporting results from prospective, observational cohort studies and randomised controlled trials. Only studies examining the
18

association between a baseline measure of sedentary behaviour (e.g., time watching TV, sitting time) with the outcome measured at follow-up and adjusting for the outcome measure at baseline were considered as other statistical approaches do not take the temporal sequence into account and preclude the possibility to interpret the direction of association.
Results
We identified six prospective observational cohort studies examining associations between a measure of baseline sedentary behaviour with weight gain [52-54], gain in BMI [21, 54], the development of obesity [44], and waist circumference and fat mass (16). One study reported on the associations between baseline sitting time and weight maintenance [55]. One study measured total sedentary time by means of minute-by-minute heart rate monitoring [54] whereas all other studies relied on self-reported sedentary behaviour. The sample sizes in the studies varied between 336 and 50,277 participants with a duration of follow-up between 4 and 21 years. The three largest studies only included women whereas only two studies included both men and women. Studies are summarised in Table 3.
Self-Reported TV time
Two of the identified studies used TV time as an indicator of sedentary behaviour. In a birth cohort study (n= 1,019) from New Zealand [21], parent-and self-reported time spent viewing TV between 5 and 15 years predicted BMI at age 26 years. For each additional hour per day viewing TV between 5 and 15 years of age, BMI was increased by 0.5 units at age 26 years. These associations were independent of childhood SES, BMI, and parental BMI.
Additional evidence for an association between TV viewing and obesity comes from The Nurses Health Study (n=50,277) [44]. In women who were categorised as normal weight or overweight (BMI < 30) at baseline, each 2hour per day increment in time spent watching TV was associated with a 23% increased risk of developing obesity during 6 years of follow-up. This association was independent of exercise habits and other confounding factors. However, further adjustment for baseline BMI substantially attenuated the relative risks of developing obesity (RR=1.29; 95% CI= 1.01; 1.61, between extreme groups). This may be interpreted as those who watched more TV were already on a trajectory to become obese at baseline. However, it does not preclude the possibility that already heavier individuals preferred more sedentary habits due to their higher body weight - a reverse causality argument.
Sitting time
Hu et al [44] reported a significantly elevated risk (RR=1.25, 95% CI = 1.02;1.54) of developing obesity using a comparison between extreme groups - those who reported > 40 hours per week spent sitting at work, during transport and away from home compared with those who reported 0 to 1 hours of sitting.
19

Blanck et al [53] analysed data in 18,583 women participating in the Cancer Prevention Study II Nutrition Cohort. No significant prospective association was observed between average self-reported leisure sitting time and weight gain of 5 to 9 lbs (2.3 – 4.1 kg) over 6 years of follow-up. In stratified analyses, an elevated risk of weight gain (5 to 9 lbs) was observed in those women who were normal-weight at baseline and reporting > 6 hours of leisure time sitting compare with those who reported < 3 hours/day of leisure time sitting (OR=1.47, 95% CI= 1.21; 1.79).
In a prospective cohort study including 336 premenopausal African American and Caucasian women followed for 4 years, no significant association was observed between self-reported sitting time and weight gain [52]. However, psychological measures, such as depressed mood, were significant correlates of weight gain (OR=1.9, 95% CI= 1.09; 3.31).
The Australian Longitudinal Study on Women’s Health [55] enrolled 8,726 women aged 18-23 years. They were followed for 4 years comparing weight gainers with weight maintainers. Compared with those with a low (≤33 h per week) sitting time, those with moderate (33-51 hr), and high (≥52 hrs) sitting time had a lower chance of weight maintenance (moderate group RR=0.83, 95% CI= 0.73; 0.95; high group RR=0.80, 95% CI= 0.70; 0.91).
Overall sedentary behaviour
One of the studies measured total sedentary time by means of minute-byminute heart rate recording and calculated the time spent below an individually predetermined heart rate threshold [54]. Total time spent was measured in 393 healthy middle-aged men and women at two time points 5.6 years apart. Time spent sedentary did not predict body weight, BMI, waist circumference and fat mass (measured by bio-impedance) at follow-up. In contrast, baseline body weight, BMI, fat mass and waist circumference all significantly predicted time sedentary at follow-up, independent of baseline sedentary time, baseline objectively measured physical activity energy expenditure, and other confounders. Individuals who gained body weight between baseline and follow-up spent significantly more time sedentary at follow-up compared with those who lost weight.
Limitations
All but one of the identified studies assessed different aspects of sedentary behaviour by self-report. Three studies reported associations in the expected direction, that is higher baseline sedentary behaviour predicted a higher BMI [21], the development of obesity [44], and less chance of weight maintenance [26]. Two studies [52, 54] did not observe any prospective associations between baseline sedentary behaviour and weight gain, and one study [55] observed an association between lower baseline sitting time with weight maintenance. Interpretation of the results is complicated not only by different exposure measurements but also by the different outcomes used which
20

prohibit a proper meta-analysis. Half of the reviewed studies only included women and more studies in men are warranted.
Furthermore, it is likely that the association between sedentary time and gain in body weight is mediated by time spent physically active and dietary intake. For example, studies in children have suggested that TV viewing is associated with adiposity but this association is attenuated following adjustment for eating while viewing TV [26].
Results from studies assessing sedentary time objectively are likely to be less influenced by recall bias and misclassification. However, so far, only one prospective study, which was rather limited in sample size (n=393), applied an objective measure of total sedentary time. The results from this study suggested a reverse association between measures of adiposity and sedentary time [54]. Clearly, more prospective observational studies, using objective methods for assessing sitting time, screen based time and other sedentary behaviours, are highly warranted.
Summary
• Sedentary behaviour is associated with all-cause and cardiovascular mortality, diabetes, some types of cancer and metabolic dysfunction.
• The prospective association between sedentary behaviour and gain in body weight or the development of obesity is less clear.
• Three of the six studies identified that examined the prospective association between sedentary behaviour and weight gain or obesity observed that higher levels of TV viewing were associated with weight gain or the development of obesity at follow up. The effect size was small.
• One study used objective monitoring of sedentary behaviour and found no prospective association between time spent sedentary and weight gain. In contrast, baseline adiposity predicted higher levels of sedentary behaviour at follow-up.
Implications for national sedentary behaviour recommendations
While there is accumulating evidence suggesting that sedentary time predicts a number of adverse health outcomes in adults, the available data are not sufficient to suggest a quantitative recommendation on daily sedentary time for maintaining a healthy body weight and the prevention of obesity.
21

5 Prevalence of Sedentary Behaviour
5.1 Young people
Data on the type and amount of sedentary behaviour undertaken by young people and adults provides important information underpinning much of this report. Based on the arguments presented earlier concerning the definition and measurement of sedentary behaviour, data can be collected using self-report (often reporting estimates of time in different behaviours), and objective assessments of total sedentary time. Data can be expressed in terms of prevalence (i.e., proportion of the population estimated within sedentary behaviour time-based categories) or point estimates (i.e., mean estimates of time spent in specific sedentary behaviours or total sedentary behaviour, or ‘dose’) [56].
We present data for young people separately for the UK and other countries (see Tables 4 and 5), and for different sedentary behaviours, where available, as well as overall sedentary behaviour assessed by accelerometers. We also draw on the systematic review by Marshall et al. [56] which summarised the prevalence and ‘dose’ of screen-based media use in young people (TV viewing, video game playing and computer use), as well as secular trends in TV viewing among youth. We will place greater emphasis on UK data.
In reporting prevalence of sedentary behaviour in youth we encounter several difficulties. First, there are no definitive population data suggesting where prevalence categories should be drawn. While organisations such as the American Academy of Pediatrics [36] state that they wish to see a restriction of “total media time (with entertainment media) to no more than 1 to 2 hours of quality programming per day” (p. 424), it is unclear whether this is only TV viewing or other screen time, and how such a figure was arrived at. TV viewing of more than 4 h per day is often considered ‘excessive’ [56]. However, there are no guidelines as to what might be considered ‘acceptable’ or ‘excessive’ sedentary behaviour when assessed by accelerometers across the day. In short, we are currently in a position where estimates of the prevalence of total or discrete sedentary behaviours is difficult to evaluate. Better sense will be made of such data when we have more evidence linking the nature and amount of sedentary behaviours to clearly assessed health outcomes in young people. Definitive data on this are currently lacking, although progress is being made.
UK Cross-Sectional Self-Report Data
Three large cross-sectional studies have been undertaken with UK youth (Table 4 and 5) using self-report assessments of sedentary behaviours. These are Project STIL (‘Sedentary Teenagers and Inactive Lifestyles’), in which papers report prevalence data for UK boys [57], UK girls [58], and
22

Scottish youth [17], the ‘Sports Linx’ project in Liverpool [23]1, and data from the Health Behaviour in School-Aged Children (HBSC) project, with data from Scotland and Wales reported by Samdal et al. [59]. This reports data over five time periods from 1986, with the latest on TV viewing for 1998; this provides some indication of recent prevalence trends.
Data from Project STIL were collected using a time-use diary. Adolescents aged 13-16y wrote down what behaviour they were doing every 15 mins, and behaviours were assumed to last for the full 15min period. Only leisure-time behaviours were recorded for three weekdays and one weekend day [17, 57, 58]. TV viewing was not excessive during the school week, with only 3-6% of girls and 6-9% of boys watching more than 4 hours/day. However, this rose on weekends to 21-24% in girls and 25-34% in boys. Time-use diaries may better reflect behavioural estimates that survey recall instruments.
Samdal et al’s [59] data for Scotland and Wales is for TV viewing for 1998. This shows that 29% of boys in Scotland and 36% in Wales watched more than 4 hours/day. Data for girls showed 27% in Scotland and 38% in Wales. These data compare with those calculated from a systematic review of studies in Canada (25%), Europe (28%), and USA (38%) [56], but are higher than for UK youth in Project STIL.
Fairclough et al. [23] only reported TV viewing for more than 1 hour per day, showing weekday prevalence rates of 36% for girls and 53% for boys, rising to 42% for girls at weekends and 54% for boys. However, 1 hr/d is a low cutoff and does not reflect likely ‘problematic’ levels of TV viewing.
The prevalence of boys and girls watching <2h of TV per week day in the UK is slightly lower, though broadly comparable, to data from elsewhere in Europe [60] . On average 52.1% of boys in the UK watch <2h of TV per week day compared to 59.4% in mainland Europe. On average, 59.4% of girls in the UK watch <2h of TV per week day compared to 64.7% of girls in mainland Europe.
Boys tend to play computer games much more than girls and Project STIL reported 28% of boys across the UK playing for more than 1 hour/day, but this figure was much higher at 58% for Scottish boys. The latter figure is consistent with that reported in Liverpool at 60% by Fairclough et al [23].
In summary, UK self-report data suggests that the majority of young people have ‘acceptable’ levels of TV viewing, but about one-quarter to one-third watch 4 hours per day or more – levels considered excessive. Data on computer game playing show more variability, but with up to 60% playing for more than 1 hour/day. These trends are likely to be changing rapidly and it is increasingly the case that technologies are converging. For example, TV programmes can be viewed on phones, games can also be played on phones
1 See also Lamb, L. (no date). ‘Putting children first – Sports Linx: Lifestyles report’. The City of Liverpool.
23

(some may be done while moving), and phone calls can be made from laptops etc (see Section 8).
UK Self-Report Data Trends Over Time
Samdal et al [59], in repeated cross-sectional data sets, found that in Scotland and Wales, the proportion of adolescents watching 4 h of TV daily changed little between 1985/86 and 1997/98. Boys and girls in Wales reported higher levels of TV watching across all four surveys than their counterparts in Scotland. Boys reported spending more time watching TV than girls. Such temporal trends and gender differences are common for TV viewing [56]. Similar to time use in the USA [61], there appears to be no support for the proposition that TV viewing is increasing in youth.
Brodersen et al. [62], in a longitudinal study, found that hours of screen based media (SBM) use increased in all gender, SES and ethnic groups over a 5 year period, with an average increase of 2.5 h per week in boys and 2.8 h per week in girls. Black students of both sexes reported higher levels of SBM than their white peers. The difference averaged 2.8 h in boys and 5.4 h in girls. This difference did not vary over the 5 years of the study. Trends in SBM also differed in white and Asian girls; there was no difference in school year 7 (aged 10-11y), but the increase in SBM use was faster in Asian girls, with an average difference in rates of 0.4 h each day.
Screen based media levels were greater in students from lower SES neighbourhoods. The difference between the higher and lower SES groups averaged 2.3 h per week in boys and 4.1 h per week in girls. This difference did not change over the 5 years of the study.
UK Objective Data
Riddoch et al. [63] used accelerometers to assess physical activity levels of a large cohort of 11 year old children (n=5595). They classified sedentary behaviour as <200 counts per minute and found that the median time spent in sedentary activities was 430 (inter-quartile range = 384-474) mins/day (boys = 420 (373-464) mins/day; girls = 440 (394-482) mins/day). This is similar to that found by Steele et al. [64] with 1,862 children aged 9-10y who reported 450 to 460 mins of sedentary behaviour (63% and 65% of measured time in boys and 65% and girls, respectively).
In isolation, it is difficult to interpret accelerometer data for sedentary behaviour. There is some evidence that objectively measured sedentary time is detrimental to health, but it may be difficult to quantify a specific threshold. Moreover, these data do not report whether such sedentary time was taken in sporadic bursts, with breaks for light, moderate or vigorous physical activity, or whether large portions of time were spent sedentary. Preliminary data from adults suggests that breaking up sedentary time might be better than prolonged periods of sitting [65]. Changes in sedentary behaviour over time, assessed using accelerometers, either through interventions or cohort studies, will prove instructive when compared with these cross-sectional data.
24

5.2 Adults and older adults
Introduction
The prevalence and mean time (where available) of self-reported sedentary behaviours, such as TV viewing, computer use, and sitting time are summarised for adults (over 18 years) and older adults (65+ years). Prevalence rates are based on self-report measures and used large population-representative samples where possible. In addition, objective estimates of time spent sedentary (from accelerometers and heart rate measures) are presented. To ensure that the most recent population estimates are reported in this section, the prevalence data are based on studies from the year 2000 onwards.
Results
Eleven population-based studies published since the year 2000, reported the prevalence of TV viewing, computer use and time spent sitting (see Table 6). Three studies were from the US, two were from France, three were from Australia, one was from Scotland, one was from Great Britain, and one was from Canada. Only five studies with adults were located in the published literature that used objective measures of time spent sedentary (two from the UK, one from France, one from the US, and one from Australia; see Table 7).
Prevalence of self-reported TV viewing, computer use, and sitting time
Two recent population-based studies reported the mean daily time spent watching TV or watching TV and videos/DVDs, listening to the radio, and listening to music. A US population-based study found that the average person watched 4 hours and 32 minutes of TV each day and that the amount of time spent watching TV, videos and the internet is increasing across all ages in the US [41]. In contrast, a population-representative sample of adults from Great Britain who completed a time-use diary reported spending 157 minutes per day watching TV and videos/DVDs, listening to the radio, and listening to music [40]. While population means are interesting to report, they do not provide a sense of the extent of participation in these behaviours, therefore, prevalence or proportions of people participating in sedentary behaviours are more useful.
A cross-sectional study of more than 3,000 men and 4,000 women in France aged 45 years and older collected self-report data on usual daily time spent watching TV (categorised as <1hr, 1-2h/d, 2-3h/d, >3h/d) [66]. It was reported that approximately 34% of adults spent between 2-3 hours per day watching TV, and 33% spent more than 3 hours per day watching TV. A further study by Bertrais and colleagues [67] of almost 4,000 50-69 year olds reported similar prevalence rates to the previous study, with 30% of adults spending 23 hours per day watching TV and using the computer and 33% spending more than 3 hours per day in these sedentary pursuits. In contrast, a large sample
25

of adults from Scotland (n=7,940; mean age 46.6y) self-reported a higher prevalence of screen time (television and “any other type of screen such as computer or video game”) than those in the French studies, with 28% spending between 2-3 hours per day in front of the screen and 55% spending more than 3 hours per day in these sedentary behaviours [68]. A US study of more than 1,500 female veterans found that 63% of respondents watched more than 2 hours of TV and videos per day on average, and approximately 45% watched more than 3 hours of TV and videos per day [69]. In contrast, 46% of men (n=4,950) and 40% of women (n=6,001), with a mean age of 48 years who participated in the 1999/2000 Australian Diabetes, Obesity and Lifestyle (AusDiab) study, self-reported spending more than two hours per day watching television. However, the self-report instrument in that study assessed TV viewing separately from computer use, unlike the other studies reviewed here. All of these studies employed different self-report measures of TV and/or computer use making it difficult to compare prevalence rates. Nevertheless, it seems from these large population-based samples that, apart from the AusDiab study, approximately two-thirds of the adult and older adult populations spend more than 2 hours per day watching TV and/or using the computer.
More than 17,000 Canadian adults reported the time spent sitting on most days of the week (including work and leisure-time). This large scale survey showed that 39% reported sitting for approximately one quarter of the day, 26% reported sitting approximately half of the day, and 13% and 5% reported sitting for three-quarters or almost all the time, respectively [47]. A study of just under 60,000 US women (mean age 63 years) found that 46% reported sitting during leisure-time less than 3 hours per day, 42% reported sitting 3-5 hours per day, and 10% reported spending more than six hours per day sitting during their leisure-time [70]. A longitudinal study of almost 9,000 young women assessed the self-reported time spent sitting (“while doing things like visiting friends, driving, reading, watching television, or working at a desk or computer”) on a usual weekday and weekend day [55]. Thirty-two percent of women spent less than 4.7 hours per day sitting, 34% spent between 4.7 and 7.4 hours per day sitting, and the remaining third of the sample spent more than 7.4 hour per day sitting. These estimates are greater than the study of US women, however the Australian study included work hours as well as leisure-time.
Another Australian study of adults aged 20-65 years reported on the mean time spent sitting using the International Physical Activity Questionnaire (IPAQ-long) measure (including work and leisure-time) and also the mean time spent sitting during leisure-time only [71]. Participants in that study reported approximately 6 hours per day sitting on weekdays and just over 4 hours sitting on weekend days. Just under 4 hours sitting per day was attributed to leisure-time activities.
These studies suggest that substantial proportions of the US, Australian and Canadian adult populations perceive that the majority of their day is comprised of time spent sitting. However, given the variability in the measures used, these data are not comparable and being self-reported they are likely to
26

possess substantial measurement error. It is therefore important to consider estimations of time spent sedentary using a more consistent and objective measure of time spent sedentary, such as accelerometers or combined movement and physiological sensors.
Objectively-assessed time spent sedentary
Based on heart rate monitoring, Ekelund and colleagues [54] estimated that men and women spent approximately one-third of their day sedentary. In contrast, using accelerometers (sedentary time defined as <100 counts per minute [cpm]) Ekelund and colleagues [72] found that men spent approximately 7.5 hours per day, and women approximately 7 hours per day, being sedentary. These estimates are consistent with a small study of French men and women who wore accelerometers (sedentary time defined as <100 cpm) which found that men spent approximately 7.8 hours per day and women spent just over 7 hours per day sedentary [73].
An Australian study of just under 180 adults found that participants spent 57% of their waking hours sedentary [74]. This estimate is substantially greater than that based on heart rate monitoring [54]. A population-based study of more than 6,000 US adults [39] who wore an accelerometer reported that between 7.5 and 9.3 hours per day were spent sedentary (defined as <100 cpm). Although the authors did not report the proportion of time spent sedentary, for an average 16 hour day, this would equate to between 47-58% of time spent sedentary, which is similar to the Australian study by Healy and colleagues [74].
Conclusions
In summary, according to self-report estimates of sedentary behaviour, approximately two-thirds of adults spend more than 2 hours per day watching TV and using the computer. Significant proportions of adults report sitting for more than 5 hours per day (including work and leisure-time), and adults report spending between 3-4 hours per day sitting during their leisure-time. These prevalence estimates highlight the pervasiveness of these behaviours. Interestingly, the studies that have used objective measures to assess the time adults spend in sedentary behaviours confirm the self-report estimates, suggesting that the majority of adults and older adults spend substantial proportions of the day in sedentary pursuits.
Summary
• Population-based studies of self-reported sedentary behaviours among adults published in the last 10 years suggest approximately two-thirds of adults spend more than 2 hours per day watching TV and using the computer.
• Most adults report sitting for more than 5 hours a day at work and during leisure-time.
• Smaller studies using objective measures (e.g., accelerometers, heart rate monitoring) of total time in sedentary behaviour on an average day
27

suggest approximately 50-60% of adults’ waking hours are spent sedentary.
Implications for national sedentary behaviour recommendations
1. Based on this review, it is apparent that a significant portion of the adult population spends large amounts of time in sedentary behaviours during their leisure-time and across the entire day.
2. Because of a lack of sedentary behaviour recommendations for adults in most developed countries, the prevalence data available are currently ad hoc and not generalisable to the population at large.
3. A reduction in the prevalence of sedentary behaviour in the population should be a key target for national recommendations, such as reducing the proportion of adults spending more than two hours per day watching television and using the computer during their leisure-time from 60% to 50%.
4. With such high prevalence rates of sedentary behaviour in the adult population, it is hoped that specific recommendations to limit these behaviours will provide the necessary national impetus to monitor prevalence of these behaviours at the population level.
5.3 Tracking of sedentary behaviour
An important aspect of the study of any health behaviour is to ascertain the extent to which the behaviour persists over time. For example, although it is assumed that physically active children become active adults, data show that the stability of this behaviour – ‘tracking’ – is small-to-moderate. Of course, this will partly depend on how far apart the behaviours are assessed, with lower tracking coefficients evident for longer time periods [75]. In addition, tracking is expected to be stronger within similar life course periods (e.g., from childhood to adolescence) than between periods that may differ in respect of life events (e.g., adolescence to adulthood). Although tracking of physical activity has been studied [76], there has been no review of tracking of sedentary behaviour.
A review of tracking of sedentary behaviours was conducted. Tracking coefficients, where available, were analysed for self-reported and objectively assessed sedentary behaviours, such as TV viewing, computer use, and total sedentary time. Where possible, data were summarised for young children (35 years), school-aged children (6-11 years), and adolescents (12-18 years). Tracking coefficients were based on self-reported and objective measures (using accelerometers) taken over at least two time points, some which are in adulthood.
Results
Fourteen prospective, longitudinal studies, comprising 22 independent samples published between 1999 and 2009, reported tracking of TV viewing, video game use, screen time, ‘inactivity’, and total sedentary time (see Table 8). Nine studies were from the USA, three from New Zealand, two from the
28

UK, and one was from Australia. Only two studies were located in the published literature that used objective measures of tracking of time spent sedentary (one with young children and one with adolescents).
Table 9 provides full tracking data and follow-up length for all studies. Data from the 22 independent samples showed tracking coefficients (r) that ranged from 0.21 to 0.73 for TV viewing, 0.18 to 0.37 for video game use, 0.16 to 0.65 for total screen time, 0.46 to 0.51 for ‘inactivity’, and 0.15 to 0.48 for total sedentary time. Study follow-up periods ranged from 1 to 29 years, and tracking coefficients tended to be higher with shorter follow-ups, as expected.
In summary, sedentary behaviours appear to track at low to moderate levels, with the strongest tracking shown for TV viewing. The tracking of sedentary behaviour suggests that such behaviours during childhood and adolescence may form the foundation for such behaviours in the future and may track better than physical activity. However, again, we should note the rapidity of technological change and the implications this may have for interpreting tracking of such behaviours.
Implications for national sedentary behaviour recommendations
Sedentary behaviours appear to track at low to moderate levels, with the strongest tracking shown for TV viewing, suggesting that recommendations must tackle sedentary behaviour in young people.
29

6 Factors Associated with Sedentary Behaviour
6.1 Young people
Introduction
Previous sections of this report suggest that for a variety of social and medical reasons there is a need to reduce all types of screen-viewing and overall sedentary behaviour. The ‘mediating variable model’ [77, 78] suggests that in order to change a behaviour we need to identify the key factors associated with the behaviour, especially those that are amenable to change, sometimes referred to as ‘mediators’ (e.g., home rules). In addition, there will be ‘moderators’ of the behaviour (variables that predict behaviour but cannot be changed, such as age or gender). Therefore, in order to reduce sedentary behaviour among youth we need to identify the key variables associated with these different behaviours. These are the ‘correlates’ of sedentary behaviour.
Objective
The objective of this section is to identify the key correlates of sedentary behaviour among young people. Because screen-viewing behaviours have been shown to change as children age [29, 77], where possible we will report our results by age group: young children (<7 years of age), primary school aged children (5-11 years of age), and secondary school aged children (11-18 years of age).
Methods
We identified relevant published systematic review papers using PubMed, supplemented by personal files, discussion with expert group members and reviewing of reference lists in identified publications. Where systematic reviews did not exist we used the same processes as those used to identify systematic reviews to identify appropriate studies examining the correlates of sedentary behaviour among youth. We did not attempt to perform a systematic review. Included papers were synthesised to identify the key correlates of sedentary behaviour among youth. Key research gaps and implications for recommendations are also elucidated.
Results
There is a paucity of research examining the correlates of sedentary behaviours other than screen viewing behaviours. This finding is reflected in the following sections which focus predominantly on the correlates of screen-viewing behaviours among young people.
Correlates of screen-viewing among young children
A recent systematic review of correlates of screen-viewing among young children (≤7 years of age) identified 44 studies that have been published in
30

English between 1980 and February 2009 in which correlates of TV viewing, computer use and screen-time were studied [79]. Of these studies, 36 (82%) were published after 2000 and 7 (16%) were published between 1990 and 2000, thereby indicating the recent growth of research in this area. The majority of the studies employed cross-sectional designs with vast differences in study design. For example, 6 studies (136.6%) had fewer than 100 participants while 46% (n=18) had more than 1000 participants. Average associations (positive or negative) were only reported for variables that had been studied in at least three different studies. Key findings are summarised below.
Socio-demographic factors were consistently associated with TV viewing with children from lower socio-demographic groups watching more television, older children watching more television, but no clear gender differences in TV viewing patterns. Family TV viewing, and particularly parental TV viewing, showed that higher levels of parental TV viewing were associated with higher levels of child TV viewing. There were inconsistent associations between TV viewing and a). the presence of a TV in the child’s bedroom, b). number of TV’s in the house and c). general TV access.
Gender and age were associated with computer use with higher levels among boys and older children. For overall screen-time, gender showed no consistent association. When all of the three behaviours were combined to create a new ‘Media Use’ variable, higher levels of media use were found among lower socio-demographic groups and older children. Collectively, these findings suggest that although a number of moderators of young children’s screen-viewing have been identified there is an absence of established modifiable correlates of screen-viewing in this age group.
Correlates of screen-viewing among young people 2-18 years
The first published review of correlates of sedentary behaviour in young people found that only TV viewing had been studied often enough to warrant review [80]. The review included papers for 2-18 year olds but did not differentiate results by age. Body weight, snacking, parent viewing habits, day of the week, and having a TV in the bedroom were all positively associated with TV viewing time. The authors noted that TV viewing may be more strongly associated with socio-demographic factors, with higher TV viewing levels being associated with low SES, single parent households, ethnic minorities, and 9-13 yr olds. However, this may simply reflect a bias in the literature as very few studies were identified that specifically investigated correlates of TV viewing; rather they were focused on other research questions, but because demographic data are routinely collected in research the relationship between such variables and TV viewing could be tested. Few longitudinal studies were identified so the direction of relationships could not be established. It was concluded that much more work is needed, particularly to identify modifiable correlates of TV viewing and other prominent sedentary behaviours in youth, with stronger measures and longitudinal designs.
Correlates of screen-viewing among children
31

Van der Horst et al. [81] updated the Sallis et al [82] review on correlates of physical activity and the Gorely et al [80] review of correlates of TV viewing. The authors identified three studies examining correlates of sedentary behaviours (television/video watching and computer games) in children 4-12 years old, and concluded that there is insufficient evidence to draw conclusions.
Correlates of screen-viewing and sedentary time among adolescents
Van der Horst et al. [81] also examined the correlates of sedentary behaviour in adolescents aged 13-18 years. Nine studies examining the correlates of TV/video watching or computer games were identified. A positive relationship was reported between watching TV/video and gender (male), BMI and depression. An inverse relationship was found between ethnicity (Caucasian), SES and parental education. For other variables there was insufficient evidence to draw conclusions. The authors concluded that physical activity and sedentary behaviour have their own unique correlates, and consistent correlates of physical activity do not always have an opposite association with sedentary behaviour. In addition, because sedentary behaviour comprises several types of behaviour (such as watching television, playing video games, socialising behaviours), more information on the correlates of the individual sedentary behaviours is needed to facilitate the development of effective interventions to limit sedentary behaviours. The authors also concluded that more prospective studies are needed.
Longitudinal predictors of screen-viewing
There is a lack of longitudinal studies on youth screen-viewing. A notable exception is the US National Longitudinal Study of Adolescent Health in which over 15,000 US adolescents were assessed in 1994-1995, and again in 20012002. It was reported that black males were 50% more likely to have low levels of TV viewing (<14 hours per week) during childhood and adolescence than their white counterparts. Similarly, black females were twice as likely to have high levels (≥ 14 hours per week) of TV viewing than white females during both childhood and adolescence [83]. These findings reinforce the likely importance of gender and ethnicity as key moderators of youth screen-viewing but reinforce the need for more information about key modifiable correlates that could form the basis of future behaviour change programmes.
On a smaller scale, Hardy et al. [84] described longitudinal changes (over 2.5 years) in leisure-time sedentary behaviour among 200 girls, during early to mid-adolescence (12-15 years). The participants self-reported their usual time spent in a comprehensive range of sedentary behaviours across a week. Girls aged 13 years spent approximately 45% of their discretionary time in sedentary behaviour, which increased to 63% at age 15 years. Sedentary behaviour increased by 1.4 and 3.3 hours on week and weekend days, respectively. On weekdays, increased time was spent on hobbies (27 min/day) and, on weekend days, increased time was spent sitting around talking with friends (60 min/day), computer use (37 min/day), and television
32

viewing (34 min/day). The authors concluded that among girls, the transition between early and mid-adolescence is accompanied by a significant increase in leisure-time sedentary behaviour.
General sedentary behaviour
Although it has been argued that it is important to understand the correlates of individual sedentary behaviours, a case can also be made for understanding the influences on overall, or general, levels of sedentary behaviour, such as time spent sitting or time spent in activities below a minimum activity intensity level. There are, however, very few studies, and no nationally representative studies in young people which examine the correlates of sedentary behaviour at this level. A recent cross-sectional study examined the associations between mode of transport to school, outdoor play after school, participation in exercise at clubs, and TV viewing with objectively measured physical activity and sedentary behaviour in 1327 children aged 9 and15 y from the European Youth Heart Study [85]. Older children spent more time than younger children, and boys spent less time than girls, in objectively measured sedentary behaviour. No associations with percent time in sedentary behaviour were observed for any of the other variables assessed. The authors concluded that the correlates related to time spent sedentary need further examination.
Summary
The potential modifiable correlates of youth screen-viewing are likely to differ by participant age and are summarised below.
• For young children, family TV viewing behaviours are likely to be associated with child TV viewing.
• For children, there is currently insufficient evidence on the likely modifiable correlates of screen-viewing.
• For adolescents, BMI is likely to be associated with higher levels of screen-viewing.
• For young people in general, snacking, body weight, parental TV viewing and having a TV in the bedroom are potential modifiable correlates of screen-viewing.
The potential moderators of youth screen-viewing are also likely to differ by participant age and are summarised below.
• For young children, the age of the child, gender and SES are likely to be moderators of screen-viewing behaviours.
• For children, there is currently insufficient evidence about the likely moderators of screen-viewing behaviours.
• For adolescents, age, gender, ethnicity, SES and parental education are likely to moderate screen-viewing behaviours.
• For young people in general, SES, living in a single parent household, ethnicity and age are likely to moderate screen-viewing behaviours.
Implications for national sedentary behaviour recommendations
33

1. As the correlates of screen-viewing differ by age of the participant, strategies to reduce screen-viewing will need to be tailored to the age of the child with a need for specific strategies for a) young children b) primary school aged children, and c) secondary school aged children.
2. The correlates of screen-viewing among children are not uniform and are likely to be different for each of the different types of screen-viewing.
3. There is no one factor that has been consistently correlated with screen-viewing behaviours and therefore, at this time, it is not possible to identify a key correlate of screen-viewing that should be the target of behaviour change strategies.
4. The correlates of sedentary behaviours, other than screen-viewing behaviours, have received little attention, so it is not currently possible to identify targets for behaviour change strategies.
6.2 Adults
The main question asked in this section is: “What are the factors associated with sedentary behaviours in adults?” The scope is on adults in general. All types of sedentary behaviours were investigated, with main categories being screen/television viewing and sitting. We distinguished between studies that used self-report assessment and those that used objective measurements of sedentary behaviour. Factors associated with sedentary behaviours included socio-demographic, behavioural, psychological/cognitive, biological and environmental correlates. A literature scan was performed through existing reviews and Medline.
Socio-demographic correlates
In a representative sample of Australian adults, greater television viewing was associated with female gender, age over 60 years, less education and the absence of paid employment [86]. Time spent sitting during leisure, in a pan-European survey of representative samples of subjects over 15 years in each of the then 15 EU member states, was associated inversely with age, social and educational achievements and positively with smoking [87].
Sedentary time assessed objectively by accelerometers, in participants in the US National Health and Nutrition Examination Survey (NHANES 2003-2004), was highest in older adolescents and in adults over 60 years [39]. Adults aged 70–85 years were the most sedentary group in that population (men: 67.8 percent, 9.5 hours/day; women: 66.3 percent, 9.1 hours/day). An interaction was found between age and gender. Women were more sedentary than men throughout youth and early adulthood, but this pattern was reversed after 60 years of age, when men were found to be more sedentary than women.
Early studies on physical activity and health in bus drivers and conductors by Morris [9] provided insights into the differences between professional categories according to time spent sitting and their health consequences. Time spent sitting in transport, work and leisure, was studied in two
34
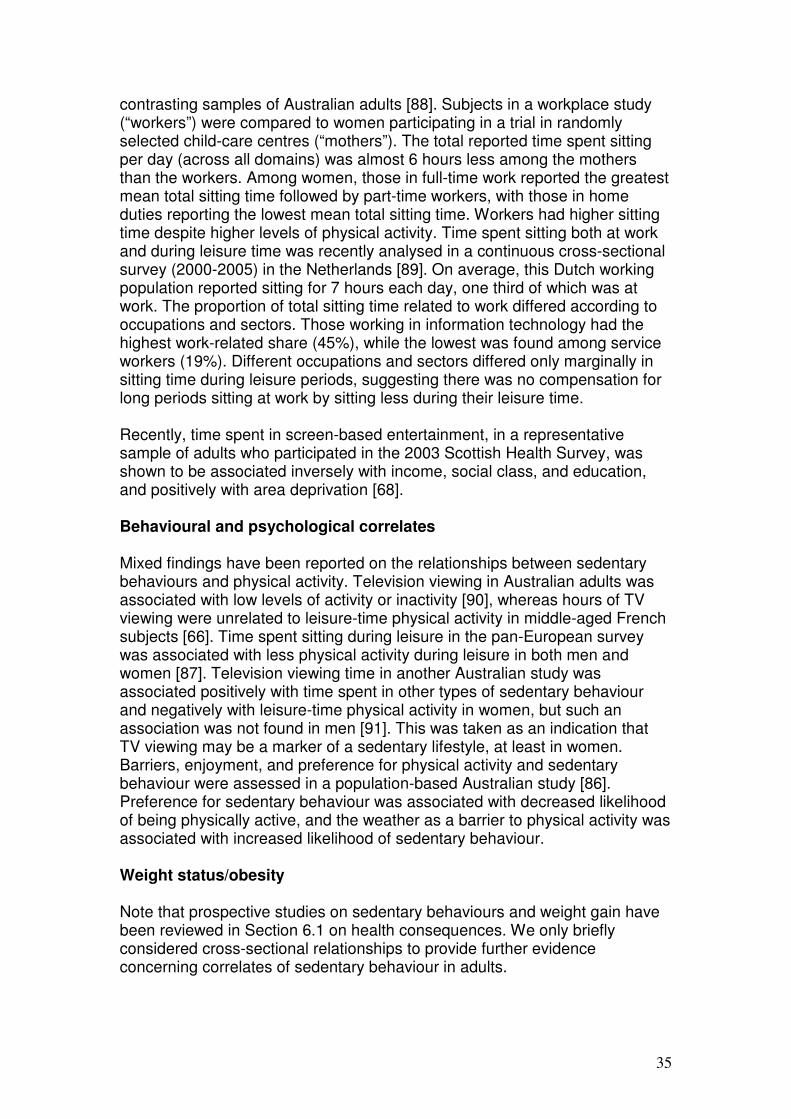
contrasting samples of Australian adults [88]. Subjects in a workplace study (“workers”) were compared to women participating in a trial in randomly selected child-care centres (“mothers”). The total reported time spent sitting per day (across all domains) was almost 6 hours less among the mothers than the workers. Among women, those in full-time work reported the greatest mean total sitting time followed by part-time workers, with those in home duties reporting the lowest mean total sitting time. Workers had higher sitting time despite higher levels of physical activity. Time spent sitting both at work and during leisure time was recently analysed in a continuous cross-sectional survey (2000-2005) in the Netherlands [89]. On average, this Dutch working population reported sitting for 7 hours each day, one third of which was at work. The proportion of total sitting time related to work differed according to occupations and sectors. Those working in information technology had the highest work-related share (45%), while the lowest was found among service workers (19%). Different occupations and sectors differed only marginally in sitting time during leisure periods, suggesting there was no compensation for long periods sitting at work by sitting less during their leisure time.
Recently, time spent in screen-based entertainment, in a representative sample of adults who participated in the 2003 Scottish Health Survey, was shown to be associated inversely with income, social class, and education, and positively with area deprivation [68].
Behavioural and psychological correlates
Mixed findings have been reported on the relationships between sedentary behaviours and physical activity. Television viewing in Australian adults was associated with low levels of activity or inactivity [90], whereas hours of TV viewing were unrelated to leisure-time physical activity in middle-aged French subjects [66]. Time spent sitting during leisure in the pan-European survey was associated with less physical activity during leisure in both men and women [87]. Television viewing time in another Australian study was associated positively with time spent in other types of sedentary behaviour and negatively with leisure-time physical activity in women, but such an association was not found in men [91]. This was taken as an indication that TV viewing may be a marker of a sedentary lifestyle, at least in women. Barriers, enjoyment, and preference for physical activity and sedentary behaviour were assessed in a population-based Australian study [86]. Preference for sedentary behaviour was associated with decreased likelihood of being physically active, and the weather as a barrier to physical activity was associated with increased likelihood of sedentary behaviour.
Weight status/obesity
Note that prospective studies on sedentary behaviours and weight gain have been reviewed in Section 6.1 on health consequences. We only briefly considered cross-sectional relationships to provide further evidence concerning correlates of sedentary behaviour in adults.
35

Television viewing was inversely associated with obesity indices in US studies in adult men [92-94] and women [95], in Australian studies [90], and in French studies (with waist circumference, [67]). Time spent sitting was inversely associated with indices of obesity in the Pan-European survey [87] and in an Australian study [88]. In most studies, these relationships were independent of physical activity levels and other potential confounders. In one study, weight status, BMI and waist circumference predicted higher levels of sedentary behaviour at follow up when sedentary time was assessed objectively by individually calibrated heart rate and expressed as % of daytime hours in middle-aged healthy subjects [54].
In a small laboratory study using inclinometers to assess postural allocation, Levine et al. [96] reported that obese subjects sit more than lean individuals. Interestingly, sitting time was not reduced by a 10% weight loss. In contrast, in the National Weight Control Registry, a descriptive US database of “successful weight losers”, long-term weight maintenance after weight loss was associated with minimal television viewing, independent of physical activity level and dietary intakes [97].
Environmental correlates
Television viewing time was negatively associated with neighbourhood ‘walkability’ in women, but not in men, in a large sample of Australian adults [98]. Assessment of neighbourhood walkability was based on dwelling density, street connectivity, land-use mix and net retail area. After controlling for neighbourhood socioeconomic status, BMI, physical activity, and sociodemographic variables, women living in medium- and high-walkable neighbourhoods reported significantly less TV viewing time per day (14 minutes and 17 minutes, respectively) compared to those residing in lowwalkable neighbourhoods. As noted above, time spent in screen-based entertainment was positively associated with area deprivation in the Scottish Health Survey [68].
Conclusion
There is evidence that sedentary behaviours in adults are associated with age, gender, socioeconomic conditions in general and occupation in particular, weight status, and some characteristics of the physical environment, independent of physical activity. Many of these correlates appear similar to those reported in younger subjects. One obvious difference is for occupation, with a large fraction of working time spent sedentary in many professions. These correlates have been studied mainly for indicators of sedentary behaviour such as time spent viewing television and time spent sitting. One exception is a study based on accelerometer measurements that suggests that older adults spend more time in sedentary behaviours than middle-aged adults.
There is some evidence that TV viewing in adults is associated with other types of sedentary behaviour and with less physical activity. However, the relationships between various sedentary behaviours, and of these with
36

physical activity, remain largely unexplored in adults. Different sedentary behaviours may have different correlates.
Based on accelerometer measures, a strong inverse association has been reported in one study in adults between sedentary time and light intensity physical activity [99]. Moreover, a strong inverse association was reported between sedentary time and light intensity activity using accelerometry (r=0.52)[72]. Similarly, self-reported TV time in this study was also only associated with objectively measured light intensity PA by accelerometry.
The lack of objective measurements of sedentary behaviour in adults from various populations is a major gap in the evidence base. The evidence provided by cross-sectional studies on the relationships of sedentary behaviours with weight status has to be put in balance with data from prospective investigations. Summary
• Sedentary behaviours in adults are associated largely with non-modifiable moderators, such as age, gender, socioeconomic conditions, occupation, weight status, and some characteristics of the physical environment.
• Older adults spend more time in sedentary behaviours than middle-aged adults.
• Different sedentary behaviours may have different correlates.
Implications for national sedentary behaviour recommendations There is no one factor that has been consistently correlated with sedentary behaviour in adults and therefore at this time it is not possible to identify a key correlate that should be the target of behaviour change strategies.
6.3 Diet and sedentary behaviour in young people
Experimental work has shown increased energy intake when eating while watching television, compared with undistracted eating [100, 101]. Bellissimo et al. [100] found television viewing increased boys’ lunchtime food intake by an average of 228 kcal and concluded that television viewing had made the boys less sensitive to internal signals of satiation and satiety.
Francis and Birch [102] examined the effects of television viewing on 3-5 year-old children’s lunch and snack intake in one condition when the children watched a cartoon video on television, and in another with no television. They found that children ate significantly less snack and lunch in the television condition compared to the no television condition. However, these authors found that within the television viewing condition, a subgroup of children who routinely watch more television, including the eating of meals whilst in front of the television at home, had higher lunch intakes in the study when exposed to television compared with those children who habitually viewed less television at home.
37

Temple et al. [101] looked at the effect of television viewing on children's motivation to eat and their energy intake. In their first study, children completed a computer-based task in order to earn portions of food. The television viewing group was found to spend longer doing the tasks and ate more food than the control group who had not viewed television. In their second experiment, Temple et al. [101] compared a group viewing a continuous television programme with control groups that either viewed nothing or viewed a repeated segment of a television programme (thus controlling for the television stimulus but requiring reduced allocation of attention). The continuous television group spent more time eating and consumed more energy than the controls. This work suggests that television watching can ‘dishabituate’ eating or disrupt the development of habituation, which may provide a mechanism for increased energy intake associated with watching television.
A small number of longitudinal studies [103-108] have examined the relationship between TV viewing and diet (Table 9). Philips et al. [105] found no relationship between energy dense snack food consumption and physical activity or sedentary behaviour, but did observe a significant relationship with hours of television viewed per day.
In a five year longitudinal study, Barr-Anderson et al. [106] examined the relationship between TV viewing and dietary intake of adolescents in middle school (mean age 13 y at baseline and 17 y at follow-up) and high school (mean age 16 y at baseline and 21 y at follow-up). In the older cohort, those participants who watched more than five hours of television per day whilst in high school reported less healthful eating habits (lower intakes of fruits, vegetables, whole grains and calcium-rich foods, and higher intakes of snack foods, fried foods, fast food, sugar-sweetened beverages, and trans fat). Moreover, TV viewing in middle school predicted lower fruit and greater sugar-sweetened beverage consumption five years later.
TV viewing during adolescence, therefore, longitudinally predicted poorer dietary intake patterns five years later, with stronger and more consistent patterns seen during the transition from high school to young adulthood than during the transition from middle school to high school. Both time periods are critical developmental periods for adolescents, in which they are likely to be forming lifelong behaviours. However, behaviours exhibited in high school may more strongly influence behaviours reported in subsequent years than behaviours exhibited during middle school. Differences between the two cohorts could possibly be explained by environmental influences, such as differential exposure to food and beverage television advertising, although this is speculative. TV viewing would appear to predict future eating habits during adolescence, particularly in the latter years.
In a smaller 4-year longitudinal study, Francis et al. [103] examined whether TV viewing provides a context for patterns of snacking, encouraging overweight in young girls from overweight and non-overweight families. They found that girls who watched more television consumed more snacks in front of the television. In families where neither parent was overweight, TV viewing
38

was the only significant predictor of girls’ increase in BMI. In families where one or both parents were overweight, girls who watched more television snacked more frequently, and girls who snacked more frequently had higher intakes of fat from energy-dense snacks, which predicted their increase in BMI from age 5 to 9.
Three studies [104, 107, 108] report data from a 19-month obesity reduction intervention for middle school students. Boynton-Jarrett et al. [104] found that each additional hour of television beyond the baseline number of hours watched resulted in a reduction of almost one portion of fruit and vegetables per week. Wiecha et al. [107] found an association between TV viewing and energy intake and an increased consumption of foods commonly advertised on television, namely sweet baked goods, sweets, fast food, fried potatoes, salty snacks, and sugar-sweetened drinks. Sonneville and Gortmaker [108] reported that a one hour increase in watching TV is associated with a 106 kcal per hour increase in total energy intake and 92 kcal per hour with playing video and computer games, whereas no significant change was associated with reading/doing homework, sometimes also called ‘productive’ sedentary behaviours. The authors point out that books are generally seen as free of the food advertisements that can be found on television, with the latter thought to play a role in advertising and encouraging the consumption of the foods in children which are often less healthy (e.g. [109, 110]). Healthier foods, such as fruits, vegetables, whole grains, milk, and low-fat items do not tend to be advertised on television so much as other food products [111].
Much of the research exploring the relationship between children and adolescents’ TV viewing habits and dietary behaviours has been cross-sectional in nature (Table 10), including a number of large datasets [112-120]. These find that TV viewing is associated with less favourable eating behaviours, namely:
• Higher consumption of high-fat and high-sugar foods [112, 113, 115-126] • Lower fruit and vegetable intake [112-114, 117, 121, 125, 127] • Higher energy intake [122, 128, 129].
6.4 Diet and sedentary behaviour in adulthood
Evidence on the associations between sedentary behaviour and dietary intake among adults is presented in this section. Eight cross-sectional studies based on self-reported sedentary and dietary behaviours among adults were identified (see Table 11). Television viewing was assessed in all eight studies. Studies assessed a variety of dietary behaviours including snacking, meal frequency, energy intake, percentage energy from fat, sweetened beverage consumption, and fast food consumption. Four studies were from the USA, three studies were from Australia, and one was from Canada.
In a study of 1,059 men and high and low income women, Jeffery and French [130] found that TV viewing was not related to energy or fat intake in men. TV
39

viewing was, however, positively related to energy intake in both high and low-income women and to percentage of energy from fat in low-income women. Bowman [131] found no such gender differences in a sample of over 9,000 adults. Adults who watched more than 2 hours of TV per day had higher intakes of energy and macronutrients, and they also obtained more energy from snacks and supper [131]. Furthermore, Rehm et al. [132] found that frequent consumption of sugar-sweetened beverages was positively associated with TV viewing in almost 10,000 American adults.
Evidence from Australia corroborates that from the USA. Cleland et al. [133] found, in both men and women, a positive association between TV viewing and frequency of consuming meals (p<0.01), snacks (p<0.01), and soft drinks (p<0.01) during TV viewing time. Crawford et al. [134] examined the association between eating dinner and snacks while watching TV and fruit and vegetable consumption in women. Women who ate dinner and snacks while watching television were less likely to eat two or more servings of vegetables daily. Women who ate dinner while watching TV were less likely to meet fruit intake recommendations. Scully et al. [135] examined associations between viewing of commercial TV (i.e., channels with advert breaks) and fast food consumption at different meal times. High commercial TV viewers were more likely to eat fast food for dinner at least once a week compared with low viewers (OR = 1.45; 95 % CI: 1.04, 2.03). Both moderate viewers (OR = 1.53; 95 % CI: 1.01, 2.31) and high viewers (OR = 1.81; 95 % CI: 1.20, 2.72) were more likely to eat fast food for snacks at least once a week compared with low viewers. Commercial TV viewing was not significantly related (P > 0.05) to fast-food consumption at breakfast or lunch [135].
Thomson et al. [136] examined the association between TV viewing and snacking in a sample of Canadian undergraduate students. Students reporting medium or high TV viewing snacked more frequently while watching TV and recognized more advertising than students who were considered low viewers. High viewers also reported more consumption of energy-dense snacks than low viewers.
Summary
• TV viewing in childhood and adolescence is associated with greater energy intake and poorer diet cross-sectionally and prospectively but limited to shorter duration of follow-up.
• TV viewing in adults appears to be positively associated with an increase frequency of consumption of energy-dense snacks, soft-drinks, and fast foods, and an increase in energy intake.
Implications for national sedentary behaviour recommendations Recommendations to reduce sedentary behaviour, and in particularly TV viewing, are warranted on the basis of associations with unhealthy dietary practices.
40

7 Interventions to Reduce Sedentary Behaviour
7.1 Young people
The number of intervention studies designed specifically to reduce sedentary behaviours is still quite small. In this section, we present findings from a review of interventions for young people [137], plus a commentary on a review of sedentary behaviour interventions designed to reduce weight status [31].
Review: Methods
A computerised search for intervention studies was conducted using ERIC, MedLine, PyschInfo, SportDiscus and the Cochrane Library from 1990 to 2008. The search was limited to English language papers only. The online search was supplemented by manual searching of the reference lists.
Titles and abstracts identified through the search process were reviewed to identify relevant articles which were then included for further assessment if they met the following criteria: (1) the study was an intervention; (2) subjects used were aged 18 or under; (3) an outcome measure of sedentary behaviour was reported; (4) sedentary behaviour was defined as screen-based entertainment and did not include educational activities; (5) published in English; (6) published in a peer-review journal, and (7) published in 1990 or later.
Results
Out of 197 identified titles, 16 papers met the inclusion criteria and were subject to detailed evaluation (see Table 12). These comprised 4 clinic-based (community care clinic, obesity research clinic and children’s hospitals), 9 population/community-based (including the child’s home environment, community-based after school programmes, and school settings), and 3 laboratory-based studies, all with varying intervention designs. Results were mixed, although overall a trend for reduced sedentary behaviours across heterogeneous studies was detected, with all but 5 studies suggestive of a medium to large effect on reducing one or more measures of sedentary behaviours.
Even though the clinic-based studies differed in terms of study methodology, participants and length of study, overall, they appeared to be successful at reducing sedentary behaviour of children aged 4 to 12 years. Three out of the four studies significantly reduced sedentary behaviour and though Ford et al’s [138] intervention did not result in statistically significant reductions, there were noted decreases in overall family television use and children’s TV, video-tape and video game use in favour to the behavioural intervention.
The population-based interventions varied considerably in terms of setting, intervention content and delivery as well as the duration of the intervention. However, while many of the interventions resulted in significantly reduced
41

sedentary behaviour, one of the interventions resulted in no significant changes [139] and one appeared to increase sedentary behaviour, though not significantly [140]. School-based studies showed positive behaviour changes, however, it was the home-based interventions incorporating the whole family which appeared to elicit the greatest effect on sedentary behaviour.
Laboratory-based studies showed that positive reinforcement for reducing sedentary behaviour and sedentary behaviour being made contingent upon being physically active were clearly successful in reducing sedentary behaviour. All three studies reviewed resulted in clear reductions in sedentary behaviour among obese children [141-143].
In summary, evidence suggests that interventions aimed at decreasing sedentary behaviour in young people may result in successful behaviour change. However, mechanisms for achieving successful sedentary behaviour change require further study. Example intervention strategies included time management of TV viewing, rewarding less sedentary time, and educational materials.
Other review-level evidence
DeMattia et al. [31] reviewed interventions that focussed on decreasing sedentary behaviours in children and adolescents and weight control. Twelve studies provided data, with six targeting clinic-based populations that were overweight or at risk of overweight, and six being population-based prevention studies. All interventions reduced sedentary behaviour and improved markers of weight status.
Of seven studies that showed reductions in BMI, only two were significant. DeMattia et al. [31] concluded that interventions aimed at decreasing sedentary behaviour “consistently result in positive health behaviour change as measured by self-reported TV/video use and are associated with improvement of weight parameters. The magnitude of weight parameters is modest and is difficult to interpret, because normal BMI ranges vary with age and development in children” (p. 79; emphasis added).
Summary
Interventions to reduce sedentary behaviour in young people, with or without the goal of changing weight status, show promise. However, given the paucity of evidence on modifiable correlates of sedentary behaviour, clear strategies to bring about successful behaviour change are still not known.
Implications for national sedentary behaviour recommendations
Evidence exists showing intervention effectiveness mainly for the reduction of TV viewing in youth. Recommendations concerning TV reduction are possible, but specifying how much to reduce and how requires further work.
42
7.2 Adults
Interventions to reduce sedentary behaviour in adults
There are several interventions in the published peer-reviewed literature concerning the reduction of sedentary behaviours in young people, as discussed above. However, little is thought to be available concerning adults. We conducted a search to find such interventions. Most papers that appeared to be relevant did not design the intervention to target sedentary behaviours but either recruited ‘sedentary’ adults or assessed physical activity. These were excluded from further consideration.
Three studies were located and considered worthy of comment. Two studies reported sedentary outcome data from physical activity interventions. These are not, of course, sedentary behaviour interventions because they designed the intervention to change physical activity, but looked at sedentary behaviour change as well. The study by Gilson et al. [144] encouraged university employees in Australia, Spain and the UK to increase their walking at work and found that a non-significant decrease in sitting time was detected in the intervention group and they showed a decrease relative to controls. De Cocker et al. [145] conducted a community intervention to increase walking in Belgian adults and found that a decrease of 12 mins of sitting was detected in the intervention community.
Gorin et al. [146] conducted a pilot family intervention targeting TV viewing reduction in children (mean age 6.9 y) and parents (aged 34-50 y). Two approaches were used:
• environmental approach: TV sets in the home were powered to turn off after family members had watched 75% of their baseline hours.
• behavioural approach: information was sent to the home weekly with suggestions of alternative ways to spend time as a family, as well as material on self-monitoring.
Five of the six families decreased their TV viewing during an 8 week period. Half of the families achieved the intervention goal and reduced their viewing time by 50%. Clearly, more interventions designed to reduce sedentary behaviour are needed with adults.
Summary
There is almost no evidence concerning sedentary behaviour interventions with adults.
Implications for national sedentary behaviour recommendations
It is not possible, given the dearth of studies, to make evidence-based recommendations concerning ways to reduce sedentary behaviour in adults.
43
8 Current Trends in Media Technology
The key objective of this section is to briefly examine some of the emerging technological trends and to summarise the empirical literature. However, it must be noted that when it comes to examining technology trends and the implications for sedentary behaviour, screen time and obesity, much of the research base is either sparse or somewhat speculative.
Technology and sedentary behaviour
Research generally shows that sedentary lifestyles are greatly influenced by increasing technological interaction and involvement. Research on television and video game use by children and adolescents tends to show associations with obesity and that increased sedentary lifestyle often has positive correlations with obesity [22, 147-149]. However, some research on frequency of video game play has reported no significant relationship with BMI [150].
Technological trends
Work and leisure have become increasingly ‘technologised’ and remote for both adults and children [151-153]. Activities that were once done in an external environment (e.g., an amusement arcade, cinema) can now be done in the home and/or workplace. This has led to ‘cocooning’ where a majority of activities can be done without ever having to leave the home and/or the work desk [154, 155]. Furthermore, technology is becoming increasingly convergent (e.g., cell phones with internet access, Blackberry’s, etc.) and there is increasing multi-media integration [156-158]. As a consequence, people of all ages are spending more time interacting with technology in the form of Internet, videogames, interactive television, mobile phones, MP3 players, etc. For adults, this increasing time is mostly work-related (and is also related to the fact people are generally working longer hours), whereas for teenagers is more likely to be leisure-related [151, 152, 155, 158, 159].
Young people’s use of technology (so called ‘screenagers’) has increased greatly over the last two decades and a significant proportion of daily time is spent in front of various screen interfaces, most notably videogames, mobile phones (e.g., SMS) and the Internet (e.g., social networking sites like Bebo, Facebook, etc) [160, 161]. It has been claimed that children’s increasing time spent engaging with these newer technologies may contribute to childhood obesity [162].
Technology has changed the way that society views social and asocial activities [155, 159]. Although many people’s interactions with technology are asocial (e.g., a single person engaging in some kind of screen-based activity), many of the activities carried out are social activities (playing and chatting to others in an online videogame or during online gambling on bingo or poker, chatting via Twitter or other social networking sites) [163, 164]. The new types of technological (social) interaction appear to be more sedentary in nature and may have implications for obesity.
44

Technology users of all ages may be at risk of becoming more sedentary in lifestyle although, somewhat paradoxically, technology is becoming increasingly mobile because of wireless-based technologies [156, 165]. New interactive technologies (e.g., Nintendo’s Wii console with Wii Sports, Wii Fit; games such as Rock Band, Guitar Hero) are more activity-based and have the potential to reverse the sedentary nature of interactive technology [166].
The development of computer games that involve sports, dance and other physical activities have been heavily marketed and may be thought to be an important advance in increasing levels of physical activity, decreasing sedentary screen time, and reducing risk for overweight and obesity. However, limited research has been conducted to date. A recent review of active video games for young people [167] concluded that there are some encouraging results regarding the energy costs involved in playing such games but that the energy costs of playing the real sports and activities are substantially larger. Moreover, evidence from a small number of trials suggests that the health benefits of active video games is mixed but many of the studies are small. No such trial has assessed the long-term impact on children’s health. Daley [167] is cautious concerning the ability of active video games to positively affect children’s health.
It should also be noted that technological advance appears to have different effects at different stages of human development, at least in terms of activities like video game playing [168]. The younger the person, the more likely that technology may affect some aspect of their moral, cognitive and/or social development [169]. There is some evidence that both adults and children appear to be ‘dependent’ on various forms of interactive technology (e.g., videogames, internet), although there are debates around technological excess, abuse and addiction [153, 170], and the context of excessive play is critical [152]. However, when it comes to obesity, the operational definition of behavioural excess makes little difference as the person is likely to be engaged in a sedentary lifestyle.
Future directions
Regardless of whether excessive technology use may be termed an ‘addiction’ it is generally agreed that some individuals’ technology usage may be considered problematic. Griffiths [171] has argued that researchers still face the task of identifying the mechanisms – biological, psychological and/or social – that underlie problematic involvement in technology and the implications that arise from this (e.g., increased sedentary lifestyles). There needs to be development of technological taxonomies that categorises and groups technologies in terms of structural characteristics as it is these dimensions that may help determine and pinpoint features that promote excessive use and, in turn, increased sedentary behaviour. Such taxonomies are starting to be developed in specific areas such as video games [152] but need to be developed more generally.
For instance, King et al [158] have argued that excessive video game playing
45

may be explained by examining five different types of features: (a) social features (i.e., social aspects of video game playing), (b) manipulation and control features (i.e., the role of user input in influencing in-game outcomes), (c) narrative and identity features (e.g., the role of character creation and interactive storytelling), (d) reward and punishment features (i.e., the ways in which players win and lose in video games), and (e) presentation features (e.g., the visual and auditory presentation of video games). The intention is to demonstrate the ways in which the psychological effects of these features may contribute to the development of problematic styles of video game playing, a consequence of which may be increased sedentary behaviour.
The extent to which these features contribute to excessive playing requires further investigation. It is hoped that taxonomies such as this act as a catalyst for future research into excessive video game play, particularly in those areas that the psychological literature has not explored in detail. The question of whether these features are as clearly demarcated as suggested deserves further attention, as does the prospect that this framework is indicative of different player typologies. King et al [158] argue that much of this research should perhaps be directed at child and teenage groups because these individuals (a) represent the potentially most vulnerable demographic group in the population, (b) are highly likely to be exposed to new technologies as a natural consequence of their involvement with the Internet and new media, (c) are increasingly more likely to be ‘early adopters’ of these new technologies (the so called ‘screenagers’) and be more ‘techno-savvy’, and (d) are perhaps less ‘techno-phobic’ than the adult population.
Given the infancy of the area, there are many gaps. It is important to realise that research highlighted elsewhere in this report does not happen in a vacuum and that the technological landscape is ever changing and ever evolving, sometimes rapidly. This has implications for the interpretation of results from studies that may become rapidly dated.
46

9 International Guidelines on Sedentary Behaviour
Introduction
Some countries have made recommendations for the maximum amount of time people should spend being sedentary each day. Virtually all of these have focused on recommendations for children and young people. The recommended limits range between one and two hours per day (depending on the age of the child). While there is strong evidence to support the reduction of sedentary behaviour among children and young people, there appears to be little or no evidence to support the precise time limits per day or week.
The aim of the section is to describe and analyse national recommendations from other countries on sedentary behaviour and screen time, in order to assess the level of consensus on the topic, and to inform the consideration of recommendations and guidelines for England.
Methods
A PubMed search was conducted, supplemented by discussion with expert group members; searching for specific countries’ recommendations on Google; and reviewing reference lists of key publications.
Recommendations were included if they met the following inclusion criteria:
• a recommendation made by a national agency or expert group representing a national agency.
• the recommendation quantified a minimum amount of time that people should spend being sedentary and/or use TV and other screens per day or week.
Results
A summary of recommendations is shown in Table 13. It can be seen that relatively few countries have quantified recommendations. Many countries have recommendations to limit sedentary time but do not quantify these. An example is the recommendation from Ireland: ‘Increase physical activity by replacing sedentary time – watching TV, playing computer games, talking on the phone – with active time.’ [172].
Other reviews make concrete recommendations for action, but do not focus on quantified guidelines [173]. It is of note that the EU guidelines and guidance from the World Health Organization both have quantified recommendations for youth and adult physical activity (60 minutes and 30 minutes per day respectively) but they do not quantify a maximum amount of sedentary or screen time [174, 175].
47

Those countries that have made quantified recommendations tend to follow the lead of the American Academy of Pediatrics, who made the first recommendation in 2001. This is for a maximum ‘total media time’ (with entertainment media) to no more than 1 to 2 hours of quality programming per day [36]. Interestingly, this is included in a paper focussed just on TV viewing yet is often interpreted, incorrectly, as a recommendation for screen time more broadly. Moreover, the interpretation of what constitutes ‘quality programming’ is clearly open to diverse interpretation.
Evidence base for quantified recommendations
It is interesting that there is little or no justification given in the vast majority of recommendation documents for any time limit. The main argument appears to be that it is desirable for children to reduce sedentary time, so that any recommended level should be lower than current estimates of time spent in sedentary pursuits and screen time. Some evidence is presented of the dose-response relationship between sedentary time and obesity, but this does not in itself justify a threshold level for a recommendation. It appears that most recommendations are made based more on a mix of expert opinion and common sense than extensive evidence. Okely et al justify this approach thus:
“From a scientific perspective, the correct course of action would be to wait until there is sufficient evidence to identify a specific amount of physical activity or sedentary behaviour. However, there are two reasons to provide a quantitative recommendation. First, ongoing surveillance of an important health indicator such as physical activity in children requires that a reasonable and logically derived threshold be applied so that individuals and population groups can be classified as sufficiently or insufficiently active. Second, a guideline communicating a minimum dose of physical activity and maximal time allotment for sedentary behaviour will encourage child care and health professionals to promote physical activity and reduced sedentary behaviour in children from birth to five years.” [176].
Conclusions
The evidence and practice from other countries should be borne in mind when considering whether a quantified recommendation is appropriate for the UK, and if so, the nature of that recommendation. It is important to consider whether we are confident in making a recommendation that will be based more on common sense or clinical experience rather than empirical research.
Summary
• Seven countries have issued guidelines for sedentary time and/or screen time, of which three set quantified limits.
• Guidelines are primarily focused on children and young people. • There is no consensus on the quantification of the guidelines. Some
countries recommend limiting sedentary time to 1-2 hours per day,
48

while others focus on limiting a single bout of sedentary time to 60 minutes.
• There is little or no evidence presented for these quantified time limits and these appear to be based on expert opinion.
49

10 Gaps in Evidence
Assessment of Sedentary Behaviour 1. The assessment of sedentary behaviour requires further work,
particularly if self-report methods are chosen. This requires more research on the validity and reliability of such instruments, and the need to assess more than TV viewing.
2. Valid and reliable measures of multiple sedentary behaviours are needed.
Health Outcomes of Sedentary Behaviour 3. More evidence is required to suggest a quantitative recommendation
on daily sedentary time for maintaining a healthy body weight.
Prevalence of Sedentary Behaviour 4. More data are required across different groups differing in age,
ethnicity and socio-economic status. 5. Better identification of changes in sedentary behaviour across time is
needed.
Correlates of Sedentary Behaviour 6. Correlates of young children’s and children’s screen-viewing need
further study. 7. Correlates of sedentary behaviours other than screen-viewing are
currently lacking. 8. Longitudinal studies are sparse.
Tracking of Sedentary Behaviour 9. Studies are required that test the stability of more than TV viewing and,
if possible, take into account changing technologies.
Interventions to Change Sedentary Behaviour 10. Although evidence suggests that interventions aimed at decreasing
sedentary behaviour in young people may result in successful behaviour change, little is known about the mechanisms for achieving successful sedentary behaviour change.
11. There are no sedentary behaviour change interventions with adults and this is a priority area for future investigation.
Media Technology 12. Research in the area of changing technology and sedentary behaviour
is somewhat sparse. 13. A major limitation in this area that needs addressing is that technology
is viewed homogenously. Asking whether increased playing of video games leads to increased sedentary behaviour depends upon which games across which platforms.
50

References
[1] Butland B, Jebb S, Kopelman P, McPherson K, Thomas S, Mardell J, et al. Foresight - Tackling obesities: Future choices – Project report. London: Government Office for Science, Department of Innovation, Universities and Skills: http://www.foresight.gov.uk/Obesity/17.pdf 2007. [2] Swinburn B, Egger G. The runaway weight gain train: Too many accelerators, not enough brakes. British Medical Journal. 2004;329(7468):736-9. [3] Biddle SJH, Mutrie N. Psychology of physical activity: Determinants, well-being and interventions (2nd Edition). London: Routledge 2008. [4] Katzmarzyk PT, Mason C. The physical activity transition. Journal of Physical Activity & Health. 2009;6:269-80. [5] Kraus H, Raab W. Hypokinetic disease. Springfield, IL: C.C. Thomas 1961. [6] Hardman AE, Stensel DJ. Physical activity and health: The evidence explained (2nd Edition). London: Routledge 2009. [7] Department of Health. At least five a week: Evidence on the impact of physical activity and its relationship to health. A report from the Chief Medical Officer. London: Department of Health 2004. [8] Sallis JF, Owen N, Fotheringham MJ. Behavioral epidemiology: A systematic framework to classify phases of research on health promotion and disease prevention. Annals of Behavioral Medicine. 2000;22:294-8. [9] Morris JN, Heady JA, Raffle PAB, Roberts CG, Parks JW. Coronary heart disease and physical activity of work. The Lancet. 1953;ii:1053-7; 111120 [10] Marshall SJ, Welk GJ. Definitions and measurement. In: Smith AL, Biddle SJH, eds. Youth physical activity and sedentary behavior: Challenges and solutions. Champaign, IL: Human Kinetics 2008:3-29. [11] Pate RR, O'Neill JR, Lobelo F. The evolving definition of 'sedentary'. Exercise and Sport Sciences Reviews. 2008;36(4):173-8. [12] Byrne NM, Hills AP, Hunter GR, Weinsier RL, Schutz Y. Metabolic equivalent: One size does not fit all. Journal of Applied Physiology. 2005;99:1112–9. [13] Tremblay MS. Assessing the level of sedentarism. In: Bouchard C, Katzmarzk PT, eds. Physical activity and obesity. 2nd ed. Champaign, IL: Human Kinetics 2010:13-7.
[14] van Sluijs EMF, Page A, Ommundsen Y, Griffin SJ. Behavioural and social correlates of sedentary time in young people. British Journal of Sports Medicine. 2008;published online 23 Sep 2008:doi:10.1136/bjsm.2008.049783. [15] Hardy LL, Booth ML, Okely AD. The reliability of the Adolescent Sedentary Activity Questionnaire (ASAQ). Preventive Medicine. 2007;45(1):71-4. [16] Sallis JF, Condon SA, Goggin KJ, Roby JJ, Kolody B, Alcaraz JE. The development of self-administered physical activity surveys for 4th grade students Research Quarterly for Exercise and Sport. 1993;64:25-31. [17] Biddle SJH, Gorely T, Marshall SJ, Cameron N. The prevalence of sedentary behavior and physical activity in leisure time: A study of Scottish adolescents using ecological momentary assessment. Preventive Medicine. 2009;48(2):151-5.
51

[18] Robinson JL, Winiewicz DD, Fuerch JH, Roemmich JN, Epstein LH. Relationship between parental estimate and an objective measure of child television watching. International Journal of Behavioral Nutrition and Physical Activity. 2006;3:43. [19] Bryant MJ, Lucove JC, Evenson KR, Marshall S. Measurement of television viewing in children and adolescents: A systematic review. Obesity Reviews. 2007;8(3):197-209. [20] Clark BK, Sugiyama T, Healy GN, Salmon J, Dunstan DW, Owen N. Validity and reliability of measures of television viewing time and other nonoccupational sedentary behaviour of adults: a review. Obesity Reviews. 2009;10(1):7-16. [21] Hancox RJ, Milne BJ, Poulton R. Association between child and adolescent television viewing and adult health: a longitudinal birth cohort study. The Lancet. 2004;364(9430):257-62. [22] Marshall SJ, Biddle SJH, Gorely T, Cameron N, Murdey I. Relationships between media use, body fatness and physical activity in children and youth: a meta-analysis. International Journal of Obesity. 2004;28:1238-46. [23] Fairclough SJ, Boddy LM, Hackett AF, Stratton G. Associations between children's socioeconomic status, weight status, and sex, with screen-based sedentary behaviours and sport participation. International Journal of Pediatric Obesity. 2009;19:1-7. [24] Viner RM, Cole TJ. Television viewing in early childhood predicts adult body mass index. Journal of Pediatrics. 2005;147(4):429-35. [25] Ekelund U, Anderssen SA, Froberg K, Sardinha LB, Andersen LB, Brage S, et al. Independent associations of physical activity and cardiorespiratory fitness with metabolic risk factors in children: The European youth heart study. Diabetologia. 2007;50(9):1832-40. [26] Ekelund U, Brage S, Froberg K, Harro M, Anderssen SA, Sardinha LB, et al. TV viewing and physical activity are independently associated with metabolic risk in children: The European Youth Heart Study. PLoS Medicine. 2006;3(12):e488 doi:10.1371/journal.pmed.0030488. [27] Mark AE, Janssen I. Relationship between screen time and metabolic syndrome in adolescents. Journal of Public Health. 2008;30(2):153-60. [28] Sardinha LB, Andersen LB, Anderssen SA, Quiterio AL, Ornelas R, Froberg K, et al. Objectively measured time spent sedentary is associated with insulin resistance independent of overall and central body fat in 9- to 10year-old Portuguese children. Diabetes Care. 2008;31(3):569-75. [29] Jago R, Baranowski T, Thompson D, Baranowski J, Geaves K. Sedentary behavior, not TV viewing, predicts physical activity among sedentary 3- to 7-year-old children. Pediatric Exercise Science. 2005;17:36476. [30] Rey-Lopez JP, Vicente-Rodriguez G, Biosca M, Moreno LA. Sedentary behaviour and obesity development in children and adolescents. Nutrition, Metabolism, and Cardiovascular Diseases. 2008;18(3):242-51. [31] DeMattia L, Lemont L, Meurer L. Do interventions to limit sedentary behaviours change behaviour and reduce childhood obesity? A critical review of the literature Obesity Reviews. 2007;8(1):69-81. [32] Martinez-Gomez D, Tucker JA, Heelan KA, Welk GJ, Eisenmann JC. Associations between sedentary behavior and blood pressure in young
52

children. Archives of Pediatrics and Adolescent Medicine. 2009;163(8):72430. [33] Steele RM, van Sluijs EMF, Cassidy A, Griffin SJ, Ekelund U. Targeting sedentary time or moderate- and vigorous-intensity activity: independent relations with adiposity in a population-based sample of 10-y-old British children. American Journal of Clinical Nutrition. 2009;90(5):1185-92. [34] Mitchell JA, Mattocks C, Ness AR, Leary SD, Pate RR, Dowda M, et al. Sedentary behavior and obesity in a large cohort of children. Obesity. 2009;17(8):1596-602. [35] Laurson KR, Eisenmann JC, Welk GJ, Wickel EE, Gentile DA, Walsh DA. Combined influence of physical activity and screen time recommendations on childhood overweight. Journal of Pediatrics. 2008;153(2):209-14. [36] American Academy of Pediatrics. Children, adolescents, and television. Pediatrics. 2001;107:423-6. [37] Spinks AB, Macpherson AK, Bain C, McClure RJ. Compliance with the Australian national physical activity guidelines for children: Relationship to overweight status. Journal of Science and Medicine in Sport. 2007;10(3):15663. [38] Jago R, Baranowski T, Baranowski JC, Thompson D, Greaves KA. BMI from 3–6 y of age is predicted by TV viewing and physical activity, not diet. International Journal of Obesity. 2005;29:557-64. [39] Matthews CE, Chen KY, Freedson PS, Buchowski MS, Beech BM, Pate RR, et al. Amount of time spent in sedentary behaviors in the United States, 2003-2004. American Journal of Epidemiology. 2008;167:875-81. [40] Office for National Statistics. The Time Use Survey, 2005. How we spend our time. London: Office for National Statistics; 2006. [41] Nielson Media Research. Television, internet and mobile usage in the US. A2/M2 Three Screen Report: Nielson 2009:4. [42] Australian Bureau of Statistics. How Australians use their time, 2006. Canberra, Australia, Commonwealth of Australia; 2008. [43] Helmerhorst H, Wijndaele K, Brage S, Wareham NJ, Ekelund U. Objectively measured sedentary time may predict insulin resistance independent of moderate and vigorous physical activity. Diabetes 2009;58:1776-79. [44] Hu F, Li TY, Colditz GA, Willett WC, Manson JE. Television watching and other sedentary behaviours in relation to risk of obesity and type 2 diabetes mellitus in women. JAMA. 2003;289:1785-91. [45] Friberg E, Mantzoros CS, Wolk A. Physical activity and risk of endometrial cancer: A population-based prospective cohort study. Cancer Epidemiology, Biomarkers and Prevention. 2006;15:2136–40. [46] Howrard RA, Freedman DM, Park Y, Hollenbeck A, Schatzkin A, Leitzmann M. Physical activity, sedentary behaviour and the risk of rectal cancer in the NIH-AARP diet and health study. Cancer Causes and Control. 2008;19:939-53. [47] Katzmarzyk PT, Church T, Craig CL, Bouchard C. Sitting time and mortality from all causes, cardiovascular disease and cancer. Medicine and Science in Sports and Exercise. 2009;41:998-1005. [48] Inoue M, Iso H, Yamamoto S, Kurahashi N, Iwasaki M, Sasazuki S, et al. Daily total physical activity level and premature death in men and women:
53
results from a large-scale population-based cohort study in Japan (JPHC study). Annals of Epidemiology. 2008;18:522-30. [49] Dunstan DW, Barr EL, Healy GN, Salmon J, Shaw JE, Balkau B, et al. Television viewing time and mortality: the Australian Diabetes, Obesity and Lifestyle Study (AusDiab). Circulation. 2010;121(3):384-91. [50] Shields M, Tremblay MS. Sedentary behaviour and obesity. Health Reports 2008;19:19-30. [51] Ekelund U, Åman J, Yngve A, Renman C, Westerterp K, Sjöstsröm M. Physical activity but not energy expenditure is reduced in obese adolescents: A case-control study. American Journal of Clinical Nutrition. 2002;76:935-41. [52] Sammel MD, Grisso JA, Freeman EW, Hollander L, Liu L, Liu S, et al. Weight gain among women in the late reproductive years. Family Practice 2003;20:401-09. [53] Blanck HM, McCullough ML, Patel AV, Gillespie C, Calle EE, Cokkinides VE, et al. Sedentary behavior, recreational physical activity, and 7year weight gain among postmenopausal U.S. women. Obesity. 2007;15:1578-88. [54] Ekelund U, Brage S, Besson H, Sharp S, Wareham NJ. Time spent being sedentary and weight gain in healthy adults: reverse or bidirectional causality? American Journal of Clinical Nutrition. 2008;88(3):612-7. [55] Ball K, Brown W, Crawford D. Who does not gain weight? Prevalence and predictors of weight maintenance in young women. International Journal of Obesity. 2002;26:1570-8. [56] Marshall SJ, Gorely T, Biddle SJH. A descriptive epidemiology of screen-based media use in youth: A review and critique. Journal of Adolescence. 2006;29(3):333-49. [57] Gorely T, Biddle SJH, Marshall SJ, Cameron N. The prevalence of leisure time sedentary behaviour and physical activity in adolescent boys: An ecological momentary assessment approach. International Journal of Pediatric Obesity. 2009;4(4):289-98. [58] Gorely T, Marshall SJ, Biddle SJH, Cameron N. The prevalence of leisure time sedentary behaviour and physical activity in adolescent girls: An ecological momentary assessment approach. International Journal of Pediatric Obesity. 2007;2:227-34. [59] Samdal O, Tynjala J, Roberts C, Sallis JF, Villberg J, Wold B. Trends in vigorous physical activity and TV watching of adolescents from 1986 to 2002 in seven European Countries. European Journal of Public Health. 2007;17(3):242-8. [60] te Velde SJ, De Bourdeaudhuij I, Thorsdottir I, Rasmussen M, Hagströmer M, Klepp KI, et al. Patterns in sedentary and exercise behaviors and associations with overweight in 9–14-year-old boys and girls - a cross-sectional study. BMC Public Health. 2007;7:16. [61] Sturm R. Childhood obesity: What we can learn from existing data on societal trends, Part 1. Preventing Chronic Disease [serial online]. 2005;2(1):A12. [62] Brodersen NH, Steptoe A, Boniface DR, Wardle J. Trends in physical activity and sedentary behaviour in adolescence: ethnic and socioeconomic differences. British Journal of Sports Medicine. 2006;41:140-4.
54

[63] Riddoch CJ, Mattocks C, Deere K, Saunders J, Kirkby J, Tilling K, et al. Objective measurement of levels and patterns of physical activity. Archives of Disease in Childhood. 2007;92(11):963-9. [64] Steele RM, van Sluijs EMF, Cassidy A, Griffin SJ, Ekelund U. Targeting sedentary time or moderate- and vigorous-intensity activity: independent relations with adiposity in a population-based sample of 10-y-old British children. American Journal of Clinical Nutrition. 2009;doi: 10.3945/ajcn.2009.28153. [65] Healy GN, Dunstan DW, Salmon J, Cerin E, Shaw JE, Zimmet PZ, et al. Breaks in sedentary time: Beneficial associations with metabolic risk. Diabetes Care. 2008;31:661-6. [66] Bertrais S, Preziosi P, Mennen L, Galan P, Hercberg S, Oppert J-M. Sociodemographic and geographic correlates of meeting current recommendations for physical activity in middle-aged French adults: the Supplementation en Vitamines et Mineraux Antioxydants (SUVIMAX) Study. American Journal of Public Health. 2004;94(9):1560-6. [67] Bertrais S, Beyeme-Ondoua J-P, Czernichow S, Galan P, Hercberg S, Oppert J-M. Sedentary behaviors, physical activity, and metabolic syndrome in middle-aged French subjects. Obesity. 2005;13(5):936-44. [68] Stamatakis E, Hillsdon M, Mishra G, Hamer M, Marmot M. Television viewing and other screen-based entertainment in relation to multiple socioeconomic status indicators and area deprivation: the Scottish Health Survey 2003. Journal of Epidemiology and Community Health. 2009;63(9):734-40. [69] Johnson KM, Nelson KM, Bradley KA. Television viewing practices and obesity among women veterans. Journal of General Internal Medicine. 2006;21(S3):S76-S81. [70] Patel AV, Rodriguez C, Pavluck AL, Thun MJ, Calle EE. Recreational physical activity and sedentary behavior in relation to ovarian cancer risk in a large cohort of US women. American Journal of Epidemiology. 2006;163(8):709-16. [71] Proper KI, Cerin E, Brown WJ, Owen N. Sitting time and socioeconomic differences in overweight and obesity. International Journal of Obesity. 2006;31(1):169-76. [72] Ekelund U, Brage S, Griffin SJ, Wareham NJ. Objectively measured moderate- and vigorous-intensity physical activity but not sedentary time predicts insulin resistance in high-risk individuals. Diabetes Care. 2009;32(6):1081-6. [73] Jacobi D, Charles M-A, Tafflet M, Lommez A, Borys J-M, Oppert J-M. Relationships of self-reported physical activity domains with accelerometry recordings in French adults. European Journal of Epidemiology. 2009;24(4):171-9. [74] Healy GN, Wijndaele K, Dunstan DW, Shaw JE, Salmon J, Zimmet PZ, et al. Objectively measured sedentary time, physical activity, and metabolic risk. Diabetes Care. 2008;31(2):369-71. [75] Telama R, Yang X, Viikari J, Valimaki I, Wanne O, Raitakari O. Physical activity from childhood to adulthood: A 21-year tracking study. American Journal of Preventive Medicine. 2005;28(3):267-73.
55
[76] Malina RM. Tracking of physical activity and physical fitness across the lifespan. Research Quarterly for Exercise and Sport. 1996;67(3, Suppl.):S48S57. [77] Baranowski T, Jago R. Understanding mechanisms of change in children's physical activity programs. Exercise and Sport Sciences Reviews. 2005;33(4):163-8. [78] Baranowski T, Anderson C, Carmack C. Mediating variable framework in physical activity interventions. How are we doing? How might we do better? American Journal of Preventive Medicine. 1998;15:266-97. [79] Cillero IH, Jago R. Systematic review of correlates of screen-viewing among young children: What factors could be used to design interventions to reduce screen-viewing. International Journal of Pediatric Obesity. in review. [80] Gorely T, Marshall S, Biddle SJH. Couch kids: Correlates of television viewing among youth. International Journal of Behavioural Medicine. 2004;11(3):152-63. [81] van der Horst K, Chin A Paw M, Twisk J, Van Mechelen W. A brief review on correlates of physical activity and sedentariness in youth. Medicine and Science in Sports and Exercise. 2007;39(8):1241-50. [82] Sallis J, Prochaska J, Taylor W. A review of correlates of physical activity of children and adolescents. Medicine and Science in Sports and Exercise. 2000;32:963-75. [83] Gordon-Larsen P, Nelson MC, Popkin BM. Longitudinal physical activity and sedentary behavior trends: adolescence to adulthood. American Journal of Preventive Medicine. 2004;27(4):277-83. [84] Hardy LL, Bass SL, Booth ML. Changes in sedentary behavior among adolescent girls: A 2.5-year prospective cohort study. Journal of Adolescent Health. 2007;40:158-65. [85] Nilsson A, Bo Andersen L, Ommundsen Y, Froberg K, Sardinha L, Piehl-Aulin K, et al. Correlates of objectively assessed physical activity and sedentary time in children: a cross-sectional study (The European Youth Heart Study). BMC Public Health. 2009;9(1):322. [86] Salmon J, Owen N, Crawford D, Bauman A, Sallis JF. Physical activity and sedentary behavior: a population-based study of barriers, enjoyment, and preference. Health Psychology. 2003;22:178-88. [87] Martínez-González MA, Martínez JA, Hu FB, Gibney MJ, Kearney J. Physical inactivity, sedentary lifestyle and obesity in the European Union. International Journal of Obesity. 1999;23:192-201. [88] Brown WJ, Miller YD, Miller R. Sitting time and work patterns as indicators of overweight and obesity in Australian adults. International Journal of Obesity. 2003;27:1340-6. [89] Jans MP, Proper KI, Hildebrandt VH. Sedentary behavior in Dutch workers: differences between occupations and business sectors. American Journal of Preventive Medicine. 2007;33:450-4. [90] Salmon J, Bauman A, Crawford D, Timperio A, Owen N. The association between television viewing and overweight among Australian adults participating in varying levels of leisure-time physical activity. International Journal of Obesity. 2000;24:600-06. [91] Sugiyama T, Healy GN, Dunstan DW, Salmon J, Owen N. Is television viewing time a marker of a broader pattern of sedentary behavior? Annals of Behavioral Medicine. 2008;35:245-50.
56
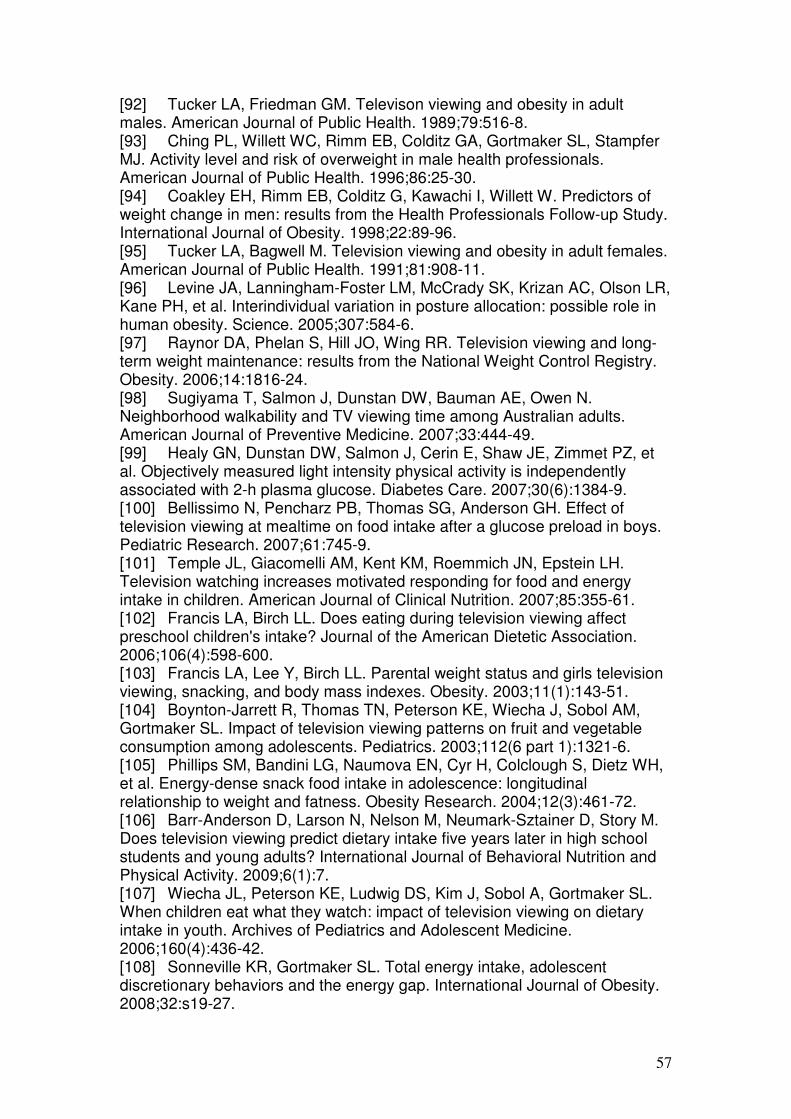
[92] Tucker LA, Friedman GM. Televison viewing and obesity in adult males. American Journal of Public Health. 1989;79:516-8. [93] Ching PL, Willett WC, Rimm EB, Colditz GA, Gortmaker SL, Stampfer MJ. Activity level and risk of overweight in male health professionals. American Journal of Public Health. 1996;86:25-30. [94] Coakley EH, Rimm EB, Colditz G, Kawachi I, Willett W. Predictors of weight change in men: results from the Health Professionals Follow-up Study. International Journal of Obesity. 1998;22:89-96. [95] Tucker LA, Bagwell M. Television viewing and obesity in adult females. American Journal of Public Health. 1991;81:908-11. [96] Levine JA, Lanningham-Foster LM, McCrady SK, Krizan AC, Olson LR, Kane PH, et al. Interindividual variation in posture allocation: possible role in human obesity. Science. 2005;307:584-6. [97] Raynor DA, Phelan S, Hill JO, Wing RR. Television viewing and long-term weight maintenance: results from the National Weight Control Registry. Obesity. 2006;14:1816-24. [98] Sugiyama T, Salmon J, Dunstan DW, Bauman AE, Owen N. Neighborhood walkability and TV viewing time among Australian adults. American Journal of Preventive Medicine. 2007;33:444-49. [99] Healy GN, Dunstan DW, Salmon J, Cerin E, Shaw JE, Zimmet PZ, et al. Objectively measured light intensity physical activity is independently associated with 2-h plasma glucose. Diabetes Care. 2007;30(6):1384-9. [100] Bellissimo N, Pencharz PB, Thomas SG, Anderson GH. Effect of television viewing at mealtime on food intake after a glucose preload in boys. Pediatric Research. 2007;61:745-9. [101] Temple JL, Giacomelli AM, Kent KM, Roemmich JN, Epstein LH. Television watching increases motivated responding for food and energy intake in children. American Journal of Clinical Nutrition. 2007;85:355-61. [102] Francis LA, Birch LL. Does eating during television viewing affect preschool children's intake? Journal of the American Dietetic Association. 2006;106(4):598-600. [103] Francis LA, Lee Y, Birch LL. Parental weight status and girls television viewing, snacking, and body mass indexes. Obesity. 2003;11(1):143-51. [104] Boynton-Jarrett R, Thomas TN, Peterson KE, Wiecha J, Sobol AM, Gortmaker SL. Impact of television viewing patterns on fruit and vegetable consumption among adolescents. Pediatrics. 2003;112(6 part 1):1321-6. [105] Phillips SM, Bandini LG, Naumova EN, Cyr H, Colclough S, Dietz WH, et al. Energy-dense snack food intake in adolescence: longitudinal relationship to weight and fatness. Obesity Research. 2004;12(3):461-72. [106] Barr-Anderson D, Larson N, Nelson M, Neumark-Sztainer D, Story M. Does television viewing predict dietary intake five years later in high school students and young adults? International Journal of Behavioral Nutrition and Physical Activity. 2009;6(1):7. [107] Wiecha JL, Peterson KE, Ludwig DS, Kim J, Sobol A, Gortmaker SL. When children eat what they watch: impact of television viewing on dietary intake in youth. Archives of Pediatrics and Adolescent Medicine. 2006;160(4):436-42. [108] Sonneville KR, Gortmaker SL. Total energy intake, adolescent discretionary behaviors and the energy gap. International Journal of Obesity. 2008;32:s19-27.
57

[109] Harrison K, Marske AL. Nutritional content of foods advertised during the television programs children watch most. American Journal of Public Health. 2005;95:1568-74. [110] Powell LM, Szczypka G, Chaloupka FJ, Braunschweig CL. Nutritional content of television food advertisements seen by children and adolescents in the United States. Pediatrics. 2007;120:576-83. [111] Gantz W, Schwartz N, Angelini JR, Rideout V. Food for thought: Television food advertising to children in the United States. Menlo Park: Kaiser Family Foundation. 2007:1-55. [112] Vereecken CA, Todd J, Roberts C, Mulvihill C, Maes L. Television viewing behaviour and associations with food habits in different countries. Public Health Nutrition. 2006;9(02):244-50. [113] Vereecken CA, Maes L. Television viewing and food consumption in Flemish adolescents in Belgium. International Journal of Public Health. 2006;51(5):311-7. [114] Lowry R, Wechsler H, Galuska DA, Fulton JE, Kann L. Television viewing and its associations with overweight, sedentary lifestyle, and insufficient consumption of fruits and vegetables among US high school students: differences by race, ethnicity, and gender. Journal of School Health. 2002;72(10):413-21. [115] Snoek HM, van Strien T, Janssens JM, Engels RC. The effect of television viewing on adolescents' snacking : Individual differences explained by external, restrained and emotional eating. Journal of Adolescent Health. 2006;39(3):448-51. [116] Hoelscher DM, Amanda M, Vader AM, Scott T, Walters ST, Harris TR. Television viewing and snacking behaviors of fourth- and eighth-grade schoolchildren in Texas. Preventing Chronic Disease. 2009;6(3):A89. [117] Utter J, Scragg R, Schaaf D. Associations between television viewing and consumption of commonly advertised foods among New Zealand children and young adolescents. Public Health Nutrition. 2006;9(05):606-12. [118] Van den Bulck J, Van Mierlo J. Energy intake associated with television viewing in adolescents, a cross sectional study. Appetite. 2004;43(2):181-4. [119] Manios Y, Kondaki K, Kourlaba G, Grammatikaki E, Birbilis M, Ioannou E. Television viewing and food habits in toddlers and preschoolers in Greece: the GENESIS study. European Journal of Paediatrics. 2009;168(7):801-8. [120] Salmon J, Campbell KJ, Crawford DA. Television viewing habits associated with obesity risk factors: a survey of Melbourne schoolchildren. Medical Journal of Australia. 2006;184(2):64-7. [121] Coon KA, Goldberg J, Rogers BL, Tucker KL. Relationships between use of television during meals and children's food consumption patterns. Pediatrics. 2001;107(1):E7. [122] Matheson DM, Wang Y, Klesges LM, Beech BM, Kraemer HC, Robinson TN. African-American girls dietary intake while watching television. Obesity. 2004;12(S9):32S-7S. [123] Taveras EM, Sandora TJ, Shih M-C, Ross-Degnan D, Goldmann DA, Gillman MW. The association of television and video viewing with fast food intake by preschool-age children. Obesity. 2006;14(11):2034-41. [124] Kremers SP, Horst K, Brug J. Adolescent screen-viewing behaviour is associated with consumption of sugar-sweetened beverages: The role of habit strength and perceived parental norms. Appetite. 2007;48(3):345-50.
58

[125] Campbell KJ, Crawford DA, Ball K. Family food environment and dietary behaviors likely to promote fatness in 5-6 year-old children. International Journal of Obesity. 2006;30(8):1272-80. [126] Miller SA, Taveras EM, Rifas-Shiman SL, Gillman MW. Association between television viewing and poor diet quality in young children. International Journal of Pediatric Obesity. 2008;3(3):168-76. [127] Haerens L, Craeynest M, Deforche B, Maes L, Cardon G, De Bourdeaudhuij I. The contribution of psychosocial and home environmental factors in explaining eating behaviours in adolescents. European Journal of Clinical Nutrition. 2007;62(1):51-9. [128] Matheson DM, Killen JD, Wang Y, Varady A, Robinson TN. Children's food consumption during television viewing. American Journal of Clinical Nutrition. 2004;79(6):1088-94. [129] Lake AA, Townshend T, Alvanides S, Stamp E, Adamson AJ. Diet, physical activity, sedentary behaviour and perceptions of the environment in young adults. Journal of Human Nutrition and Dietetics. 2009;22(5):444-54. [130] Jeffery RW, French SA. Epidemic obesity in the United States: are fast foods and television viewing contributing? American Journal of Public Health. 1998;88(2):277-80. [131] Bowman SA. Television-Viewing Characteristics of Adults: Correlations to Eating Practices and Overweight and Health Status. Preventing Chronic Disease. 2006;3(2):1-11. [132] Rehm C, Matte T, Van Wye G, Young C, Frieden T. Demographic and behavioral factors associated with daily sugar-sweetened soda consumption in New York City adults. Journal of Urban Health. 2008;85(3):375-85. [133] Cleland VJ, Schmidt MD, Dwyer T, Venn AJ. Television viewing and abdominal obesity in young adults: is the association mediated by food and beverage consumption during viewing time or reduced leisure-time physical activity? American Journal of Clinical Nutrition. 2008;87(5):1148-55. [134] Crawford D, Ball K, Mishra G, Salmon J, Timperio A. Which food-related behaviours are associated with healthier intakes of fruits and vegetables among women? Public Health Nutrition. 2007;10(03):256-65. [135] Scully M, Dixon H, Wakefield M. Association between commercial television exposure and fast-food consumption among adults. Public Health Nutrition. 2009;12(01):105-10. [136] Thomson M, Spence JC, Raine K, Laing L. The association of television viewing with snacking behavior and body weight of young adults. American Journal of Health Promotion. 2008;22(5):329. [137] O'Connell S, Biddle SJH, Braithwaite R. Are interventions aimed at reducing sedentary behaviours in young people successful? A systematic review. Manuscript in preparation. 2009. [138] Ford BS, McDonald TE, Owens AS, Robinson TN. Primary care interventions to reduce television viewing in African-American children. American Journal of Preventive Medicine. 2002;22(2):106-9. [139] Sahota P, Rudolf MCJ, Dixey R, Hill AJ, Barth JH, Cade J. Randomised controlled trial of primary school based intervention to reduce risk factors for obesity. British Medical Journal. 2001;323(1-5). [140] Salmon J, Ball K, Hume C, Booth M, Crawford D. Outcomes of a group-randomized trial to prevent excess weight gain, reduce screen
59

behaviours and promote physical activity in 10-year-old children: Switch-Play. International Journal of Obesity. 2008;32(4):601-12. [141] Saelens BE, Epstein LH. Behavioural engineering of activity choice in obese children. International Journal of Obesity. 1998;22(3):275-7. [142] Epstein LH, Saelens BE, O'Brien JG. Effects of Reinforcing Increases in Active Behavior Versus Decreases in Sedentary Behavior for Obese Children. International Journal of Behavioral Medicine. 1995;2(1):41-50. [143] Epstein LH, Saelens BE, Myers MD, Vito D. Effects of decreasing sedentary behaviors on activity choice in obese children. Health Psychology. 1997;16(2):107-13. [144] Gilson N, Puig-Ribera A, McKenna J, Brown W, Burton N, Cooke C. Do walking strategies to increase physical activity reduce reported sitting in workplaces? A randomized control trial. International Journal of Behavioral Nutrition and Physical Activity. 2009;6(1):43. [145] De Cocker KA, De Bourdeaudhuij IM, Brown WJ, Cardon GM. The effect of a pedometer-based physical activity intervention on sitting time. Preventive Medicine. 2008;47(2):179-81. [146] Gorin A, Raynor H, Chula-Maguire K, Wing R. Decreasing household television time: A pilot study of a combined behavioral and environmental intervention. Behavioral Interventions. 2006;21:273-80. [147] Shimai S, Yamada F, Masuda K, Tada M. TV game play and obesity in Japanese school children. Perceptual and Motor Skills. 1993;76:1121-2. [148] Johnson B, Hackett AF. Eating habits of 11-14-year-old schoolchildren living in less affluent areas of Liverpool, UK. Journal of Human Nutrition and Dietetics. 1997;10:135-44. [149] Vandewater EA, Shim M, Caplovitz AG. Linking obesity and activity level with children’s television and game use. Journal of Adolescence. 2004;27:71-85. [150] Wack E, Tantleff-Dunn S. Relationships between electronic game play, obesity and psychosocial functioning in young men. CyberPsychology and Behavior. 2009;doi: 10.1089/cpb.2008.0151. [151] Griffiths MD. Occupational health issues concerning Internet use in the workplace. Work and Stress. 2002;16:282-7. [152] Cameron N, Jones LL, Griffiths PL, Norris SA, Pettifor JM. How well do waist circumference and body mass index reflect body composition in prepubertal children? European Journal of Clinical Nutrition. 2009;advance online publication, 13 May 2009; doi:10.1038/ejcn.2009.26. [153] Widyanto L, Griffiths MD. Internet addiction: A critical review. International Journal of Mental Health and Addiction. 2006;4:31-51. [154] Griffiths MD, Wood RTA. Risk factors in adolescence: The case of gambling, video-game playing and the internet. Journal of Gambling Studies. 2000;16:199-225. [155] Griffiths MD. Internet abuse in the workplace – Issues and concerns for employers and employment counselors. Journal of Employment Counseling. 2003a;40:87-96. [156] De Freitas S, Griffiths MD. The convergence of gaming practices with other media forms: what potential for learning? A review of the literature. Learning, Media and Technology. 2008;33:11-20. [157] Griffiths MD. Digital impact, crossover technologies and gambling practices. . Casino and Gaming International. 2008a;4(3):37-42.
60

[158] King AC, Sallis JF. Why and how to improve physical activity promotion: Lessons from behavioral science and related fields. Preventive Medicine. 2009;49(4):286-8. [159] Griffiths MD. Internet gambling: Issues, concerns and recommendations. CyberPsychology and Behavior. 2003b;6:557-68. [160] Griffiths MD. Parents are right to worry about screenagers. Sunday Post. 2000. [161] Griffiths MD. Excessive internet use: Implications for education. Education and Health. 2001;19:23-9. [162] Griffiths MD. Childhood obesity: A side effect of being a "screenager"? . BMJ online. 2004. [163] Cole H, Griffiths MD. Social interactions in massively multiplayer online role-playing gamers. CyberPsychology and Behavior. 2007;10:575-83. [164] Meredith A, Hussain Z, Griffiths MD. Online gaming: A scoping study of massively multi-player online role playing games. Electronic Commerce Research. 2009;9:3-26. [165] Campbell NC, Murray E, Darbyshire J, Emery J, Farmer A, Griffiths F, et al. Designing and evaluating complex interventions to improve health care. BMJ. 2007;334(7591):455-9. [166] Brown D. Playing to win: Video games and the fight against obesity. Journal of the American Dietetic Association. 2006;2:188-9. [167] Daley AJ. Can exergaming contribute to improving physical activity levels and health outcomes in children? Pediatrics. 2009;124(2):763-71. [168] Griffiths MD, Davies MNO, Chappell D. Online computer gaming: A comparison of adolescent and adult gamers. Journal of Adolescence. 2004;27:87-96. [169] Griffiths MD. Video games and aggression: A review of the literature. Aggression and Violent Behavior. 1998;4:203-12. [170] Griffiths MD. Diagnosis and management of video game addiction. New Directions in Addiction Treatment and Prevention. 2008b;12:27-41. [171] Griffiths MD. Internet and video-game addiction. In: Essau C, ed. Adolescent Addiction: Epidemiology, Assessment and Treatment. San Diego: Elselvier 2008c:231-67. [172] The Department of Health and Children. The National Guidelines on Physical Activity for Ireland. Dublin: The Department of Health and Children 2009. [173] Biddle SJ, Gorely T, Stensel DJ. Health-enhancing physical activity and sedentary behaviour in children and adolescents. Journal of Sports Sciences. 2004;22(8):679 - 701. [174] European Union. EU Physical Activity Guidelines. Recommended Policy Actions in Support of Health-Enhancing Physical Activity. Fourth Consolidated Draft, Approved by the EU Working Group 'Sport & Health'. Brussels: European Union 2008. [175] World Health Organization. Physical activity and young people. 2009 [cited; Available from: http://www.who.int/dietphysicalactivity/factsheet_young_people/en/index.html [176] Okely AD, Salmon J, Trost SG, Hinkley T. Discussion paper for the development of physical activity recommendations for children under five years. Canberra: Australian Government 2008.
61

[177] Vicente-Rodriguez G, Rey-Lopez JP, Martin-Matillas M, Moreno LA, Warnberg J, Redondo C, et al. Television watching, videogames, and excess of body fat in Spanish adolescents: The AVENA study. Nutrition. 2008;24(7):654-62. [178] Hume C, Singh A, Brug J, Van Mechelen W, Chin A Paw MJ. Dose-response associations between screen time and overweight among youth. International Journal of Pediatric Obesity. 2009;4:61-4. [179] Sportslinx. Childhood lifestyles in Liverpool; Lifestyles report; 2009. [180] Marshall SJ, Gorely T, Biddle SJH. A descriptive epidemiology of screen-based media use in youth: A review and critique. Journal of Adolescence. 2006;29:333-49. [181] Hamar P, Biddle SJH, Soos I, Takacs B, Huszar A. The prevalence of sedentary behaviours and physical activity in Hungarian youth. European Journal of Public Health. 2010;20(1):85-90. [182] Iannotti RJ, Janssen I, Haug E, Kololo H, Annaheim B, Borraccino A, et al. Interrelationships of adolescent physical activity, screen-based sedentary behaviour, and social and psychological health. International Journal of Public Health. 2009;54:S191-S8. [183] Iannotti RJ, Kogan MD, Janssen I, Boyce WF. Patterns of adolescent physical activity, screen-based media use, and positive and negative health indicators in the U.S. and Canada. Journal of Adolescent Health. 2009;44(5):493-9. [184] Wake M, Hesketh K, Waters E. Television, computer use and body mass index in Australian primary school children. Journal of Paediatrics and Child Health. 2003;39(2):130-4. [185] Li M, Dibley MJ, Sibbritt DW, Zhou X, Yan H. Physical activity and sedentary behavior in adolescents in Xi’an City, China. Journal of Adolescent Health. 2007;41:99-101. [186] Springer AE, Hoelscher DM, Castrucci B, Perez A, Kelder SH. Prevalence of physical activity and sedentary behaviors by metropolitan status in 4th-, 8th-, and 11th-grade students in Texas, 2004-2005. Preventing Chronic Disease. 2009;6(1):A21. [187] Olds T, Ridley K, Dollman J. Screenieboppers and extreme screenies: the place of screen time in the time budgets of 10-13 year-old Australian children. Australia and New Zealand Journal of Public Health. 2006;30:13742. [188] Hardy LL, Dobbins T, Michael L. Booth ED-W, Okely AD. Sedentary behaviours among Australian adolescents. Australia and New Zealand Journal of Public Health. 2006;30(6):534-40. [189] Nelson MC, Neumark-Stzainer D, Hannan PJ, Sirard JR, Story M. Longitudinal and secular trends in physical activity and sedentary behavior during adolescence. Pediatrics. 2007;118(6):e1627-e34. [190] Eaton DK, Kann L, Kinchen S, Shanklin S, James Ross J, Hawkins J, et al. Youth risk behavior surveillance — United States, 2007. Surveillance Summaries. 2008;57(SS-4). [191] Taveras EM, Field AE, Berkey CS, Rifas-Shiman SL, Frazier AL, Colditz GA, et al. Longitudinal relationship between television viewing and leisure-time physical activity during adolescence. Pediatrics. 2007;119(2):e314-9.
62

[192] Hancox RJ, Milne BJ, Poulton R. Association between child and adolescent television viewing and adult health: A longitudinal birth cohort study. The Lancet. 2004;364:257-62. [193] Janz KF, Burns TL, Levy SM. Tracking of activity and sedentary behaviors in childhood: The Iowa Bone Development Study. American Journal of Preventive Medicine. 2005;29(3):171-8. [194] Kelly LA, Reilly JJ, Jackson DM, Montgomery C, Grant S, Paton JY. Tracking physical activity and sedentary behavior in young children. Pediatric Exercise Science. 2007;19(1):51-60. [195] Landhuis CE, Poulton R, Welch D, Hancox RJ. Programming obesity and poor fitness: The long-term impact of childhood television. Obesity. 2008;16:1457-9. [196] Salbe AD, Weyer C, Harper I, Lindsay RS, Ravussin E, Tataranni PA. Assessing risk factors for obesity between childhood and adolescence: II. Energy metabolism and physical activity. Pediatrics. 2002;110(2):307-14. [197] Taylor RW, Murdoch L, Carter P, Gerrard DF, Willimas SM, Taylor BJ. Longitudinal study of physical activity and inactivity in preschoolers: The FLAME study. Medicine and Science in Sports and Exercise. 2009;41(1):96102. [198] Davison KK, Francis LA, Birch LL. Links between parents' and girls' television viewing behaviors: A longitudinal examination. Journal of Pediatrics. 2005;147(4):436-42. [199] Hesketh K, Wake M, Graham M, Waters E. Stability of television viewing and electronic game/computer use in a prospective cohort study of Australian children: relationship with body mass index. International Journal of Behavioral Nutrition and Physical Activity. 2007;4:60. [200] Janz KF, Dawson JD, Mahoney LT. Tracking physical fitness and physical activity from childhood to adolescence: The Muscatine study. Medicine and Science in Sports and Exercise. 2000;32:1250-7. [201] Laurson K, Eisenamnn JC, Moore S. Lack of association between television viewing, soft drinks, physical activity and body mass index in children. Acta Paediatrica. 2008;97:795-800. [202] Pate RR, Trost SG, Dowda M, Ott AE, Ward DS, Saunders R, et al. Tracking of physical activity, physical inactivity, and health-related physical fitness in rural youth. Pediatric Exercise Science. 1999;11:364-76. [203] Baggett CD, Stevens J, McMurray RG, Evenson KR, Murray DM, Catellier DJ, et al. Tracking of physical activity and inactivity in middle school girls. Medicine and Science in Sports and Exercise. 2008;40(11):1916-22. [204] Berkey CS, Rockett HRH, Gillman MW, Colditz GA. One-year changes in activity and in inactivity among 10- to 15-year-old boys and girls: relationship to change in body mass index. Pediatrics. 2003;111(4):836-43. [205] Motl RW, McAuley E, Birnbaum AS, Lytle LA. Naturally occurring changes in time spent watching television are inversely related to frequency of physical activity during early adolescence. Journal of Adolescence. 2006;29(1):19-32. [206] Gore SA, Foster JA, DiLillo VG, Kirk K, Smith West D. Television viewing and snacking. Eating Behaviors. 2003;4(4):399-405. [207] Cleland V, Crawford D, Baur LA, Hume C, Timperio A, Salmon J. A prospective examination of children's time spent outdoors, objectively
63

measured physical activity and overweight. International Journal of Obesity. 2008;32:1685 - 93. [208] Epstein LH, Roemmich JN, Robinson JL, Paluch RA, Winiewicz DD, Fuerch JH, et al. A randomised trial of the effects of reducing television viewing and computer use on body mass index in young children. Archives of Pediatric and Adolescent Medicine. 2008;162(3):239-45. [209] Epstein LH, Paluch RA, Gordy CC, Dorn J. Decreasing sedentary behaviors in treating pediatric obesity. Archives of Pediatric and Adolescent Medicine. 2000;154:220-6. [210] Goldfield GS, Mallory R, Parker T, Cunningham T, Legg C, Lumb A, et al. Effects of open-loop feedback on physical activity and television viewing in overweight and obese children: A randomized, controlled trial. Pediatrics. 2006;118(1):e157-66. [211] Epstein LH, Paluch RA, Consalvi A, Riordan K, Scholl T. Effects of manipulating sedentary behavior on physical activity and food intake. Journal of Pediatrics. 2002;140:334-9. [212] Robinson TN, Killen JD, Kraemer HC, Wilson DM, Matheson DM, Haskell WL, et al. Dance and reducing television viewing to prevent weight gain in African-American girls: the Stanford GEMS pilot study. Ethnicity and Disease. 2003;13(1 (suppl 1)):S65- S77. [213] Faith MS, Berman N, Moonseong H, Pietrobelli A, Gallagher D, Epstein LH, et al. Effects of contingent television on physical activity and television viewing in obese children. Pediatrics. 2001;107(5):1043-8. [214] Lubans D, Morgan P. Evaluation of an extra-curricular school sport programme promoting lifestyle and lifetime activity for adolescents. Journal of Sports Sciences. 2008;26(5):519- 29. [215] Robinson TN. Reducing children's television viewing to prevent obesity: a randomized controlled trial. JAMA. 1999;282(16):1561- 7. [216] Gortmaker SL, Peterson K, Wiecha J, Sobol AM, Dixit S, Fox MK, et al. Reducing obesity via a school-based interdisciplinary intervention among youth: Planet Health. Archives of Pediatrics and Adolescent Medicine. 1999;153(4):409- 18. [217] Simon C, Wagner A, DiVita C, Rauscher E, Klein-Platat C, Arveiler D, et al. Intervention centred on adolescents' physical activity and sedentary behaviour (ICAPS): concept and 6-month results. International Journal of Obesity. 2004;28(suppl 3):S96-S103. [218] Australian Government. National Physical Activity Guidelines for Australians; 2005. [219] Australian Government. Active Kids are Healthy Kids: Australia's physical activity recommendations for 5-12 year olds. Canberra: Dept of Health and Ageing 2004. [220] Australian Government. Get up and grow. Director/Coordinator book. Healthy eating and physical activity for early childhood. Canberra: Dept of Health and Ageing 2009. [221] Jordan AB, Robinson TN. Children, television viewing, and weight status: summary and recommendations from an expert panel meeting. The ANNALS of the American Academy of Political and Social Science. 2008;615(1):119-32. [222] Institute of Medicine. Institute of Medicine Committee on Food Marketing and the Diets of Children and Youth and Food and Nutrition Board.
64

Food marketing to children and youth: Threat or opportunity? Washington, DC: National Academies Press; 2006. [223] National Association of Sport and Physical Education. Active Start: A statement of physical activity guidelines for children birth to 5 years. Reston, VA; 2002. [224] National Heart Foundation of New Zealand. An introduction to active movement: Koringa Hihiko. Wellington, NZ.: National Heart Foundation of New Zealand 2004. [225] Tammelin T, Ekelund U, Remes J, Nayha S. Physical activity and sedentary behaviors among Finnish youth. Medicine and Science in Sports and Exercise. 2007;39(7):1067-74.
65

APPENDIX A. Glossary
Term Operational definition for report
Adolescents Young people aged 12-18 years
Adults People aged 19-64 years
Children Young people aged 7-11 years
Cocooning The leisure pattern of ‘cocooning’ refers to where the family or individual concentrates their leisure time around in-house entertainment systems. The need to seek entertainment leisure outside the home is greatly reduced as digital television and home cinema systems offer a multitude of interactive entertainment services and information. Rather than going out, the entertainment comes to them direct via digital television and internet services.
Convergence/multi-media integration Refers to all modes of communication and information converging in to a digital nexus (i.e., multi-media integration). In a general sense, media convergence is viewed as a process of ‘blurring the lines between media’ due to the growing use and influence of digital electronics and can relate to both hardware and software. Multi-media integration (i.e., convergent) behaviours include such activities as online computer gaming and interactive television whereas convergent technologies include handheld devices that can integrate telephone, internet, and television technologies.
Correlates Factors associated with a behaviour of interest (i.e., sedentary behaviour).
Early Years (young children) Children aged up to 5 years. ‘Young children’ refers to those up to aged 7 years.
Mediators Factors that predict behaviour and can be changed, such as home media-use rules. Because they can be changed they become the focus of intervention strategies.
Moderators Factors that predict behaviour but cannot be changed, such as age or gender. Because they cannot be changed they are used to identify target groups for interventions.
Obesity Defined by the World Health Organisation as BMI of 30+

Older Adults Adults aged 65 years and over
Overweight Defined by the World Health Organisation as BMI of 25-29.9
Physical Activity Any movement of the body produced by the skeletal muscles that results in energy expenditure well above resting levels. Can include habitual ‘lifestyle physical activity (e.g. active travel), exercise, and sport.
Prevalence The proportion of individuals in a population engaged in different levels of a behaviour of interest (i.e., sedentary behaviour).
Sedentary Behaviour Operationally defined as ‘sitting’ time. Sedentary behaviours are multi-faceted. Typically, key sedentary behaviours include screen-time (TV viewing, computer use), motorised transport, and sitting to read, talk, and do homework, or listen to music.
Screenager This refers to a child or teenager who has grown up in the age of screen-based computer technology (e.g., internet, mobile phones, MP3 players, television). Although the term is intended to refer to any child or adolescent that spends time in front of the television or computer screen, it is more commonly used to describe more excessive players, viewers and/or users of screen-based technologies.
Screen Time Any sedentary behaviour whereby the individual is sat in front of screen (e.g., TV, computer). This could be at school, work, or in leisure time.
Video game Any game that has been computerised and can be played electronically. Video games can be played on a wide range of platforms including handheld consoles (e.g., Nintendo DS,
Sony PSP), personal computer, home video console (e.g., PlayStation, Xbox), arcade machine in a leisure centre, and other handheld devices (e.g., playing games on mobile phones, i-Pods, etc.). Video games can also be played online or offline either alone (playing against the computer program) or against other people.
Young People Children and adolescents
67

APPENDIX B. Summary evidence tables
Table 2. Sedentary behaviour in youth: weight and metabolic health outcomes
Reference Population Study Design
Sedentary Assessment
Outcome Size of effect Confounders
Hancox et al Age 5,15 Longitudinal Parent report VO2max, Adjusted β .= .48 (SE=.19; P<.01) for BMI Socioeconomic status, BMI at (2004) [21] and 26 weekday TV BMI, at 26 yrs with TV viewing at 5-15 yrs. age 5, BMI of both parents,
N=1000 ages 5-11 yrs. Serum Childhood (age 5-13 yrs) TV viewing at age 21 Self report TV cholester Adjusted β .= .49 (SE=.18; P<.005) viewing at 13, 15 and 21 yrs
ol Systolic
Adolescence (13-15 yrs) Adjusted β .= .33 (SE=.10; P<.001)
blood Early adulthood (21 yrs) pressure Adjusted β .= .23 (SE=.09; P<.007)
Marshall et Age range Meta analysis Body fat Body fat mixed methods (60% Sampling error al. (2004) 3-18 years TV viewing and skinfolds, 37% BMI): Measurement error in [22]
n=44707, computer games Mean-sample weighted effect size
r=0.066 (95% CI=0.056 to 0.078), independent and dependent variable
Independen p < 0.05 Dichotomization of a t samples Fully corrected r=0.084 continuous dependent k=52 Mean effect size invariant with variable (body fatness)
gender Effects are greater in young children (0-6 yr) than during.
Jago et al. 3-7 years Longitudinal Sed time, Mins sed beh/hr correlated Physical activity, BMI (2005) N= 133 observation of (-) with calories from fat and +vely with baseline, gender and [38] Tri-ethnic actual
TV viewing, not TV on) Dietary assessment.
calories from carbohydrates.
Mins TV –vely correlated with HR and +vely with mins sedentary behaviour.
ethnicity
Viner and Age 5 British Birth Mothers report BMI z- Mean hrs of watching TV on the weekend Sex social class, maternal Cole (2005) n=13135 Cohort 1970 of TV viewing at score related to BMI z-score at 10 yrs (b=.02, CI educational achievement, birth [24] Age 10 Longitudinal 5 and 10 yrs, no .002-.05;P<.04). weight, maternal attitude
n=14875 TV viewing data towards TV, sports Age 30 at 30 yrs. Additional hr of TV watched on: participation, BMI z-score of n=11261 weekdays at age 5 yrs =12% (OR=1.12, CI both parents, height and BMI z
1.04-1.21; p<.002) increase in risk of score at 10 yrs for the

Reference Population Study Design
Sedentary Assessment
Outcome Size of effect Confounders
obesity at 10 yrs. multivariable model at 30 yrs. Weekends OR=1.10, CI 1.01-1.13. P<.02).
Mean hrs of watching TV on the weekend at 5 yrs related to BMI z-score at age 30 yrs (b=.03, CI .01-.05;P<.01) Additional hr of TV watched on: weekends at age 5 yrs =7% (OR=1.07, CI 1.01-1.13; p<.02) increase in risk of obesity at 30 yrs.
Spinks et al 5-12 yrs Cross Electronic media BMI Odds ratios for overweight if Adjusted for effects of (2007) [37] n=518 sectional use (using a
computer for entertainment (i.e. not homework), electronic games and watching TV)
spending > 2 h/day using electronic media was 1.63 (95% CI: 1.05 to 2.54) times more than < 2 h/day.
school clustering, gender, age group, compliance with minimum activity recommendation and school SES
-parental reporting 7-day diary.
DeMattia et Young Review of BMI Interventions (all RCT) demonstrating al (2007) people Interventions modest improvements in [31] limiting BMI compared with control subjects: data
sedentary presented is mean difference behaviour to reduce
(95% CI) relative to controls: Speciality clinic studies:
obesity. Epstein et al. (2001): boys, -1.11 (-2.31 to 0.09) int n=14, con
Controlled n=15 intervention Epstein et al. (2001): girls, -1.27 (0.09 to studies, in a natural
2.45) int n=13, con n=14
setting (e.g. Faith et al. (2001): -1.30 (-3.09 to 0.49) int at home) n=6, con n=4 1966 - Feb Primary care setting:
69

Reference Population Study Design
Sedentary Assessment
Outcome Size of effect Confounders
2005. Saelens et al. (2002): -1.20 (-2.19 to -0.21) int n=20, con n=19 School-based: Dennison et al. (2004): -0.36 (-1.13 to 0.41) int n=43, con n=34 Robinson (1999): -0.42 (-0.89 to 0.05) int n=92, con n=100 Robinson et al. (2003): -0.21 (-1.44 to 1.02) int n=28, con n=33.
Ekelund et 9-10 yrs Cross TV BMI BMI overweight: (A) al n=1092 sectional self-report hours Significant positive association: (2007) [26] 15-16 yrs spent before and β -Coefficients [95% CI]) = 0.06
n=829 after school (no weekend data weekend media use > week, Olds
(0.008 to 0.11), p=0.021 Fasting insulin: (A) Significant positive association: β -Coefficients [95% CI]) = 0.067 (0.014 to 0.12), p=0.013
et al 2006 = low TV mean)
Clustered metabolic risk: (B): Standardized β -Coefficients (95% CI) = 0.026, (0.0003 to 0.052), p = 0.053 Clustered metabolic risk: (C): Standardized β -Coefficients (95% CI) = 0.01, (0.017 to 0.038), p = 0.46 Results appear invariant by gender and age group.
Ekelund et 9-10 yr Cross Sedentary time – Metabolic Individual metabolic risk factors: A) Age group, gender, al n=1092 sectional objective risk (A) n=1709 study location (2007) [25] 15-16 yr (Actigraph) factors Standardized β -Coefficients (95% (B) Age group, gender,
n=829 Minimum 3 days CI) study location, waist (with 1 weekend Diastolic Bp: 0.14 (0.08, 0.19) circumference, day) Minimum 10 h/day,
Systolic Bp: 0.14 (0.09, 0.19) Fasting glucose: 0.08 (0.03, 0.13)
cardiorespiratory fitness
Sedentary < 500 Triacylglycerol: 0.06 (0.01, 0.12) cpm Insulin: 0.10 (0.05, 0.15)
All significant (p<0.001) though
70

Reference Population Study Design
Sedentary Assessment
Outcome Size of effect Confounders
Triacylglycerol (p<0.05) Clustered metabolic risk factors: (B) n=1709 0.05 (0.03 to 0.08), p<0.001.
Mark and 12-19 yrs Cross Screen time (TV, Metabolic Metabolic syndrome (defined as (A) Age, smoking Janssen n=1803 sectional computer and syndrome ≥ 3 of high triglycerides, high Adjusting for physical (2008) [27] video fasting glucose, high waist activity (self-reported
game use) – circumference, high blood MVPA time) had a self-report of the number of hours
pressure, low HDL cholesterol): (A)
minimal impact on associations
per typical day in Positive dose-response relationship the past 30 days they watched TV -ORs (95% CI) for metabolic (including videos) syndrome by screen time category and/or used a computer
were: ≤1 h/day: 1.00 (referent)
(including 2 h/day: 1.21 (0.54 to 2.73) video games 3 h/day: 2.16 (0.99 to 4.74) console) during 4 h/day: 1.73 (0.72 to 4.17) their free time. ≥5 h/day: 3.07 (1.48 to 6.34).
Rey-Lopez et al. (2008) [30]
Review of cross sectional, longitudinal and intervention studies
1990- 2007
Ages 2-18
Review 46 cross-sectional studies about the effect of sedentary behaviour on the development of overweight and/or obesity.
Indices of body fat
Twenty-eight studies included children under 10. Most +ve associations 3 studies finding +ve effect only in girls 1 study +ve effect TV viewing in children with an obese parent. Similar results in children >10yrs. Small number studies video-gaming and PC use. X-sectional studies relationships equivocal, longitudinal studies no relationships.
Lack of control for SE status and family structure
yrs Sardinha et 9-10 yrs Cross Sedentary time – Insulin Homeostasis model assessment (A) Gender, sexual al (2008) n=308 sectional objective resistanc of insulin resistance (HOMA-IR): maturity, birth weight, [28] (Actigraph) e (A) overall fat mass (DXA)
71

Reference Population Study Design
Sedentary Assessment
Outcome Size of effect Confounders
Minimum 3 days Time spent sedentary was (B) further adjustment for (with 1 weekend day) Minimum 10
significantly and positively associated with HOMA-IR:
total or central fat mass (CXA)
h/day Standardized b-Coefficients (95% Sedentary < 500 CI) 0.001 (0.0002 to 0.002) p=0.003 Cpm Homeostasis model assessment
of insulin resistance: (B) Time spent sedentary was positively associated with HOMA-IR after further adjustments for total fat mass = 0.001 (0.000001–0.002) p=0.012, or central fat mass = 0.0008 (0.00009–0.002) p=0.009.
Vicente 1960 Cross Separates TV Indices of When data were analysed by the entire check Rodríguez et subjects, sectional and body fat group or every hr of sed al. (2008) 1012 VG usage behaviour overweight risk increased by [177] males, age recording as well 15.8%.Obesity risks
13–18.5 y) as decreased with age in males (17.8%) and PA and active females (27.1%) commuting. BMI Overfat risks increased by 26.8 and 9.4%. and skin folds, per increasing hour of SE TV status of father and weekend videogame usage, and respectively (both Ps _ 0.05). parental self In males, the overfat risk increased by report of height and
21.5% per increasing hour in weekend videogame usage (P _
weight. 0.05). Each hour of TV use increased the overfat risks by 22% in males and 28.3% in females (both Ps _ 0.05). Time PA ortime spent doing.
Fairclough Children 9 Cross questionnaire BMI 23.2% of OW youth in SES4 NA et 10 yrs n=6 sectional sedentary >1 hr/ d weekend internet use al, (2009) 337 behaviours and compared with 17.5% of NW [23] sport participation SES4. OW girls were
during week days more likely than NW girls to use the
72
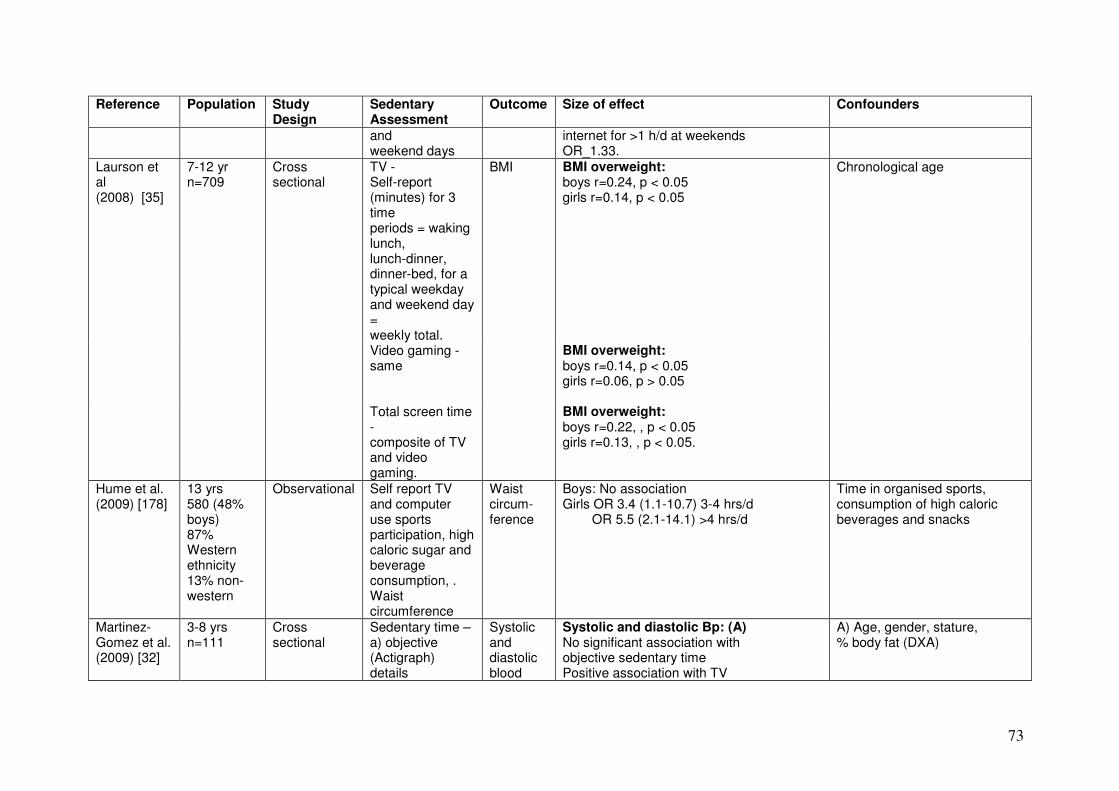
Reference Population Study Design
Sedentary Assessment
Outcome Size of effect Confounders
and internet for >1 h/d at weekends weekend days OR_1.33.
Laurson et al (2008) [35]
7-12 yr n=709
Cross sectional
TV Self-report (minutes) for 3 time periods = waking lunch, lunch-dinner, dinner-bed, for a typical weekday and weekend day
BMI BMI overweight: boys r=0.24, p < 0.05 girls r=0.14, p < 0.05
Chronological age
= weekly total. Video gaming same
BMI overweight: boys r=0.14, p < 0.05 girls r=0.06, p > 0.05
Total screen time -composite of TV and video gaming.
BMI overweight: boys r=0.22, , p < 0.05 girls r=0.13, , p < 0.05.
Hume et al. 13 yrs Observational Self report TV Waist Boys: No association Time in organised sports, (2009) [178] 580 (48% and computer circum- Girls OR 3.4 (1.1-10.7) 3-4 hrs/d consumption of high caloric
boys) use sports ference OR 5.5 (2.1-14.1) >4 hrs/d beverages and snacks 87% Western
participation, high caloric sugar and
ethnicity beverage 13% non- consumption, . western Waist
circumference Martinez 3-8 yrs Cross Sedentary time – Systolic Systolic and diastolic Bp: (A) A) Age, gender, stature, Gomez et al. n=111 sectional a) objective and No significant association with % body fat (DXA) (2009) [32] (Actigraph) diastolic objective sedentary time
details blood Positive association with TV
73

Reference Population Study Design
Sedentary Assessment
Outcome Size of effect Confounders
unknown pressure viewing and screen time, but not b) TV viewing, computer use computer, screen Participants in lowest tertile of time – parent TV/screen time had significantly report lower levels of systolic and diastolic
Bp than peers in the upper tertile (data not in abstract).
Mitchell et al 11-12 yrs Cross Sedentary time – DXA DXA body fat: At enrolment - maternal (2009) [34] n=5434 sectional objective
(ActiGraph) percent body fat
Odds of being obese were 1.32 (95% CI: 1.14 to 1.53) times more
obesity, At birth - birth weight,
Any 3 days, likely for every hour spent gestation, Minimum 10h, sedentary per day, after controlling 18+32 wk - maternal Sed <200cpm for all confounders. smoking,
32 wk - social class, maternal education, 30 month - child sleep pattern, 38 months - child TV per week, 11-yr clinic.
74

Table 3. Sedentary behaviour and health outcomes in adults: Study summary
Self-reported
sedentary
behaviour
Reference Population Study Design Sedentary
Assessment
Outcome Size of effect Confounding
Ball et al (2002) [55]
8,726 women between 18 and 23 yrs, participants in
Exposure data collection 1996, 4 years follow-up. 44% categorised as weight
Open ended question on duration of sitting during a
Weight maintenance vs. weight gain
Compared with those with a low (≤33 h per week) sitting time, moderate (33-51 hr) and high (≥52 hrs) sitting time was
occupation, student status, marital status, parity and new mothers
Australian Longitudinal study on women’s health, randomly
maintainers, 41% gained weight and 15% lost weight
usual Weekday and weekend day
associated with lower chance of weight maintenance (RR=0.83, 95%CI (0.73, 0.95) and (RR=0.80, 95%CI (0.7, 0.91)).
selected
Hu et al (2003) Registered Exposure data Average Obesity Compared with those Age, smoking, PA, [44] nurses from 11 collection 1992; mean weekly time (BMI>30) watching 0-1 hr TV the RRs hormone use,
US states follow-up 6 yrs spent sitting were 1.22 (1.06;1.42), 1.42 alcohol, smoking, recruited in 1976
Women 30-55 yrs (n=50,277) from Nurses’ Health Study free from diabetes, cancer,
3,757 (7.5%) participants become obese
while watching TV and video categorised (01, 2-5, 6-20, 21-40 and >40 hrs/week.
(1.24;1.63), 1.65 (1.41;1.93), 1.94 (1.51;2.49) for increasing categories,
glycemic load, total fat intake, cereal fibre and total EI
and CVD and Average BMI <30 at weekly time
sitting at work, Compared with those
75

baseline away from home and during transport categorised as above
reporting 0-1 hrs sitting at work or away from home the RRs were 1.02 (0.89;1.18), 1.13 (0.98;1.29), 1.13 (0.96;1.31), 1.25 (1.02;1.54) for increasing categories
NS following further adjustment for baseline BMI
Sammel et al African-American 4 yes follow-up, Self-reported Net weight gain No significant associations (2003) [52] and Caucasian
women aged 3547 yrs (n=336), randomly selected
duration of sitting, sleeping and reclining during a typical week and
of > 10lb at FU compared with baseline
between sedentary and prospective weight gain
weekend day
Hancox et al Birth cohort of Exposure data (TV Parental and BMI at age 26 TV viewing between 5 and 15 Childhood SES, (2004) [21] 1037 participants
(48% boys) followed between ages 5 to 15 years and again
viewing) collected between 1977-78 and 1987-88 at ages 5, 7, 9, 11, 13, 15 years. Outcome data collected
self-report TV viewing time summarised as mean hours per weekday
years years of age significantly and independently predicted BMI at age 26 (adjusted β (SE) = 0.48 (0.19); P=0.012)
BMI at age 5 years, parental BMI
at age 21 and 26 years
at age 26 years in 96% of the original sample.
between 5 and 15 years.
Blanck et al (2007) 18,583 healthy Baseline data collection Self-reported Weight gain (lb) No significant associations age, recreational [53] women (40 to 74 in 1992, 7 years follow- leisure time over 7 years (5 between sedentary and PA, education,
yrs), participants up spent sitting to 9 lb or ≥10lb prospective weight gain of 5 smoking status, from the Cancer (watching TV, to 9lb hormone therapy Prevention
Study II Nutrition
reading etc), average day during last year
In normal weight women at baseline, the OR was 1.47; 95% CI 1.21 to 1.79) for
use, and total
energy intake
76

Cohort categorised into three categories (<3
those who women who reported ≥6 h/d of nonoccupational sedentary
hours, ≥3 to 5 hours, ≥6 h/d)
behaviour compared with <3 h/d.
Objectively
measured
sedentary
behaviour
Ekelund et al Population-based Baseline data collection Objectively Body weight, Time spent sedentary did not Sex, baseline age, (2008) [54] (MRC Ely study), between 1994 to 1996, measured BMI, WC, FM predict any of the adiposity fat mass, smoking,
Men and women average follow-up time (minute-by (bio- indicators at FU SES, PAEE and (n=393), healthy, = 5.6 yrs minute HR impedance) duration of follow-recruited through monitoring with Baseline BW (β=0.33; 95% up general individual CI: 0.15, 0.50), BMI (β=1.10;
practitioners calibration) 0.58, 1.63), FM
accumulated time spent sedentary (min<HR Flex,
( β=0.59; 0.11, 0.40), and WC (β=0.44; 0.23, 0.66) predicted sedentary time at FU
expressed % of daytime hours)
77

Table 4. Prevalence of sedentary behaviour in young people
Author and date Study design Sample characteristics
Assessment of sedentary behaviour
Main findings
UK studies
Gorely et al. Cross- Stratified, random Ecological momentary 62.1% of girls watched < 2h TV/weekday (43% on weekends) 2007[58] sectional sample from
secondary schools in 15 regions within the United
Kingdom. A total of 923 girls with a mean age of 14.7 years. The majority were
assessment.
Participants completed a 4-day (3 weekdays, 1 weekend day) self-report diary of ‘‘free-time’’ activities outside of school. Time intervals of 15 minutes.
3.3% of girls watched > 4h TV/weekday (20.7 on weekends)
<20% girls spent > 30minutes/day using a computer.
50% of girls spent < 1h in motorised transport on weekdays.
32% of girls spent > 1h in motorised transport on weekdays (41% on weekends)
white-European (88.7%).
30% of girls reported no motorised transport on weekends.
67.9% of girls spent 30mins-2h doing homework on weekdays.
54% of girls did no homework on weekends
19% of girls spent > 2h doing homework on weekends.
Gorely et al. 2009 Cross- Stratified, random Ecological momentary 50% of boys watched < 2h TV/weekday (25.5% on weekends) [57] sectional sample from
secondary schools in 15 regions within the United
Kingdom. A total of 561 boys with a mean age of 14.6 years. The majority were white-European
assessment.
Participants completed a 4-day (3 weekdays, 1 weekend day) self-report diary of ‘‘free-time’’ activities outside of school. Time intervals of 15 minutes.
8.9% of boys watched > 4h TV/weekday (33.8% on weekends)
< 25% of boys spent > 30minutes/day using a computer.
59.3% of boys reported no computer use on weekdays (76.6% on weekends)
51.3% reported no computer/video game use on weekdays (63.9% on weekends)
(86.5%). 14.2% reported >1h/day computer/video game use on weekdays
78

(27.9 on weekends)
74% reported < 1h motorised transport on weekdays
34.8% reported > 1h motorised transport during weekends (41.7% reported none)
62.3% reported doing 30mins-2h homework per weekday
58% reported doing no homework on weekends
13.5% reported doing > 2h homework on weekends
Biddle et al. 2009 Cross- Stratified, random Ecological momentary Boys [17] sectional sample of
adolescents from schools in 14 districts in Scotland. A total of 385 boys and 606 girls; mean age 14.1 years; range 12.6– 16.7 years).
assessment.
Participants completed a 4-day (3 weekdays, 1 weekend day) self-report diary of ‘‘free-time’’ activities outside of school. Time intervals of 15 minutes.
54.2% of boys watched < 2h TV/weekday (32.1% on weekends)
5.8% of boys watched > 4h TV/weekday (25.9% on weekends)
38.2% reported 30min-2h computer/video game use on weekdays 44.7% reported no computer/video game use on weekdays.
42.5% reported <1h/day computer/video game use on weekends (51.1% reported none on weekends).
17.9% reported no motorised transport on weekdays (45.2 on weekends)
71.3% reported < 1h motorised transport during week days
26.2% reported 30-60 mins motorised transport during the week.
49.3% travelled using motorised transport for at least 30minutes during the weekend.
Girls
56.7% of girls watched < 2h TV/weekday (45.6% on weekends)
79

6.1% of girls watched > 4h TV/weekday (23.5% on weekends)
47.1% reported 30min-2h of homework per weekday (24.6% at weekends).
39.9% reported sitting and talking for 30-120min during week days (38.1% on weekends).
17.1% reported sitting and talking for at least 2h on weekend days.
84.1% reported no computer/video game use on weekdays (93% on weekends)
15.6% reported no motorised transport on weekdays (21.2% on weekends).
70.3% reported < 1h motorised transport during week days
40% reported 30-60 mins motorised transport during the week.
69.6% travelled using motorised transport for at least 30minutes during the weekend.
Liverpool lifestyles Cross Approximately 4000 Self-report survey. 43% of boys and 53% of girls use motorised transport during Report[179] sectional children aged 9-10
from Liverpool. school days.
44.5% watched <1h of TV/video/DVD on a weekday
14% reported watching >3h of TV/video/DVD on a weekday (15% on weekends)
6% reported no time watching TV/video/DVD on a weekday (>10% on weekends).
>75% reported spending <1h doing homework on a weekday (59% on weekends).
>6% claim to spend no time on homework.
80
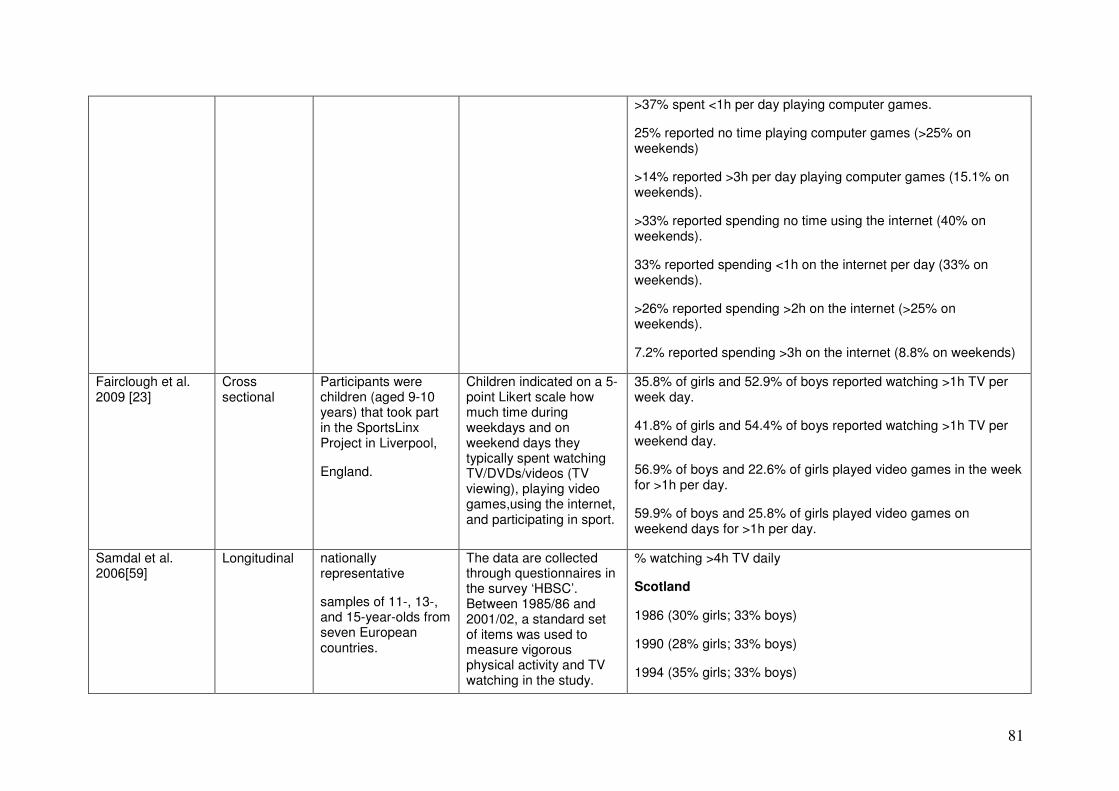
>37% spent <1h per day playing computer games.
25% reported no time playing computer games (>25% on weekends)
>14% reported >3h per day playing computer games (15.1% on weekends).
>33% reported spending no time using the internet (40% on weekends).
33% reported spending <1h on the internet per day (33% on weekends).
>26% reported spending >2h on the internet (>25% on weekends).
7.2% reported spending >3h on the internet (8.8% on weekends)
Fairclough et al. Cross Participants were Children indicated on a 5 35.8% of girls and 52.9% of boys reported watching >1h TV per 2009 [23] sectional children (aged 9-10 point Likert scale how week day.
years) that took part much time during in the SportsLinx weekdays and on 41.8% of girls and 54.4% of boys reported watching >1h TV per Project in Liverpool, weekend days they weekend day.
typically spent watching England. TV/DVDs/videos (TV 56.9% of boys and 22.6% of girls played video games in the week
viewing), playing video for >1h per day. games,using the internet, and participating in sport. 59.9% of boys and 25.8% of girls played video games on
weekend days for >1h per day.
Samdal et al. Longitudinal nationally The data are collected % watching >4h TV daily 2006[59] representative through questionnaires in
the survey ‘HBSC’. Scotland samples of 11-, 13-, Between 1985/86 and and 15-year-olds from 2001/02, a standard set 1986 (30% girls; 33% boys) seven European countries.
of items was used to measure vigorous 1990 (28% girls; 33% boys)
physical activity and TV watching in the study.
1994 (35% girls; 33% boys)
81

Austria, Finland, Hungary, Norway, Scotland, Sweden, and Wales used these measures in all surveys.
1998 (27% girls; 29% boys)
Wales
1986 (43% girls; 44% boys)
1990 (37% girls; 37% boys)
1994 (43% girls; 46% boys)
1998 (38% girls; 36% boys)
Brodersen et al. 2006[62]
5-year longitudinal
diverse cohort of students aged 11–12 years at baseline in 1999.
Setting: 36 London schools sampled using a stratified random sampling procedure.
Participants: A total of 5863 students categorised as white, black or Asian, and stratified for SES using the Townsend Index.
Sedentary behaviour was assessed by asking students how many hours they
watched television, or played computer or video games on school days and weekends. Responses were added to generate
an estimate of total hours of sedentary behaviour.
Hours/week spend using screen based media
White Black Asian
B G B G B G
Year 7 13+ 12 15+ 16+ 14 12
Year 8 14 12+ 16 17 15 12+
Year 9 15 13 17 18 13 13
Year 10 15 13 18 18 16 15
Year 11 15 13+ 17+ 17+ 16 15
Riddoch et al. Cross ALSPAC is a birth Physical activity was Mean time spent in sedentary activities = 430 (384-474) mins/day 2007 [63] sectional cohort study located measured over a
in the former county of Avon, in the
maximum of 7 consecutive days using
Boys = 420 (373-464) mins/day
southwest of England. This
the MTI Actigraph Girls = 440 (394-482) mins/day
82

study used data collected when the children were 11 years old.
N= 5595 children (2662 boys, 2933 girls).
accelerometer.
Other Countries
Marshall et al. Systematic 90 studies published 83% of papers used self 28% watched > 4h TV per day 2006[180] review to in English language report methods, 87%
estimate the prevalence
journals between 1949 and 2004 were
used hours as a unit of recall for use of SBM, and
66% watched < 2h TV per day
and dose of TV viewing, video game playing and computer use.
included, presenting data from 539 independent samples
64% of studies collected data for at least one day.
94% of studies were cross-sectional, 63% were conducted in European countries and 28% were from the US.
18% spent > 4h per week using video games
Hamar et al. 2009 Cross 301 Hungarian Ecological momentary 64 watched < 2h TV/weekday (39% on weekends) [181] sectional adolescents aged 13 assessment.
18 years. Participants completed a 4-day (3 weekdays, 1 weekend day) self-report diary of ‘‘free-time’’ activities outside of school. Time intervals of 15 minutes.
3% of boys watched > 4h TV/weekday (24% on weekends)
10% spent > 30minutes/day using a computer (15% on weekends).
75% of boys reported no computer use on weekdays (84% on weekends)
47% reported no computer/video game use on weekdays (52% on weekends).
45% reported < 1h motorised transport on weekdays
32% reported > 1h motorised transport during weekdays (20% on
83

weekends)
64% reported no motorised transport on weekends.
80% reported doing 30mins-2h homework per weekday
36% reported doing no homework on weekends
29% reported doing > 2h homework on weekends
Iannotti et al. Cross- HBSC HBSC survey: Mean (SD) hours/day spent using SBM: 2009[182] sectional
North America (n=9444, mean age 13.8 years). Western Europe (n=8558, mean age 13.5 years). Eastern Europe (n=10126, mean age 13.8 years). Northern Europe (n=8770, mean age 13.6 years). Southern Europe (n=12226, mean age 13.6 years).
Screen-based Media Use (SBM) was estimated using 2 two-part questions asking how many hours (none, ½, 1 to 7 or more) per weekday and weekend day was spent: 1) using a computer during free time (excluding time spent doing homework), and 2) watching television (including videos). Using the values indicated, mean hours per day of both screen-based activities were calculated and summed to create a SBM score.
North America (SBM use = 4.1 (2.9) hours/day).
Western Europe (SBM use = 3.7 (2.7) hours/day)
Eastern Europe (SBM use = 4.3 (2.8) hours/day)
Northern Europe (SBM use = 3.6 (2.3) hours/day)
Southern Europe (SBM use = 3.5 (2.3) hours/day)
Iannotti et al. 2009 Cross Nationally HBSC survey: United states (SBM use = 4.5 (2.64) hours/day) [183] sectional representative
samples of American
(N = 14,818) and Canadian (N= 7266) students in grades 6 to 10 (age 11-16
Screen-based Media Use (SBM) was estimated using 2 two-part questions asking how many hours (none, ½, 1 to 7 or more) per
Canada (SBM use = 4.5 (2.52) hours/day)
84

years) weekday and weekend day was spent: 1) using a computer during free time (excluding time spent doing homework), and 2) watching television (including videos). Using the values indicated, mean hours per day of both screen-based activities were calculated and summed to create a SBM score.
Wake et al. Cross A sample of 2862 Parents reported the Hours/week TV viewing: 20% > 10 hours/week; 52% 11-20 2003[184] sectional children aged 5–13
years from Victoria, Australia.
amount of time their child watched TV and used video games/computer for an average school day and average non-school day.
hours/week; 24% 21-30 hours/week; 3% >30 hours/week.
Hours/week video games/computer use: 28% <1.5 hours/week; 32% 1.6-4.5 hours/week; 32% 4.6-10.5 hours/week; 8% >10.5 hours/week.
Nilsson et al. 2009[85]
Cross sectional
A total of 1327 nine-and 15-year-old children from three European countries (Norway,
Estonia, Portugal) participated as part of the European Youth Heart Study.
PA was measured during
two weekdays and two weekend days using the MTI accelerometer, and average percent of time
in moderate-to-vigorous PA (MVPA) and time spent sedentary were derived.
All participants also completed a structured computerized questionnaire
Objective methods: 9 year olds spent 42% of their time in sedentary pursuits and 15 year olds spent 58% of their time in sedentary pursuits.
Self-report methods 9-year olds: 52% watched <2h TV/day; 32% 2-3 h/day; 16% >3h/day. 26% were taken to school in motorised transport.
Self-report methods 15-year olds: 44% watched <2h TV/day; 35% 2-3 h/day; 21% >3h/day. 44% were taken to school in motorised transport.
85

on numerous items related to health behaviour. Mode of travel to school was a closed question with three possible answers (motorized transport, bicycling and walking).
Data on time watching TV was based on two questions ('how many hours of TV do you usually watch before school?' and 'how many hours of TV do you usually watch after school?').
Li et al. 2007 [185] Cross sectional
1760 adolescents aged 11-17 years from Xi’an City, China.
Time spent in sedentary activities was recorded on a form in which weekday and weekend daily time for watching TV, playing games, working on the computer, doing homework, and sedentary hobbies were listed.
Adolescents spent 6.5h/day in sedentary activities (3.7 h/d on week days and 2.8 h/d on weekend days).
3.4 h/d homework (79% >2h home work and 35% >4h homework per day).
1.4 h/d TV viewing (24% > 2h TV per day)
te Velde et al. Cross 11-year-old children Usual TV viewing and PC 35.3% of boys and 33.4% of girls watched TV during dinner every 2007 [60] sectional in nine European
countries (n = 12538) use were measured by the questions 'About how many hours a day do you usually watch television and videos in your leisure time?' and 'About how many hours a day do you usually use a computer in leisure time?'. TV viewing
day.
40.6% of boys and 35.3% of girls watched TV > 2hours/day.
36.2% of boys and 16.4% of girls used a PC for > 1hour/day.
86

during dinner was measured by a question with 5 response alternatives ranging from 'never' to 'every day'.
Springer et al. Cross Probability sample of Self report. Two TV/video movie watching >3 hours/day: 4th grade: 26.9% of girls 2009 [186] sectional children in the 4th
(mean age, 9.7 years; n = 7,907), 8th (mean age, 13.7 years; n = 8,827), and 11th (mean age 16.9 years; n = 6,456) grades by urban, suburban, and rural location in Texas.
indicators assessed sedentary behaviour: watching TV/video movies and playing computer/video games for 3 or more hours per day.
and 34.3% of boys. 8th grade: 54.4% girls and 51.2% boys. 11th
grade: 39.9% girls and 48.2% boys.
Computer/video game use >3hours/day: 4th grade: 8.6% of girls and 30.7% of boys. 8th grade: 11.7% of girls and 32.7% of boys. 11th grade: 0.9% of girls and 13.8% of boys.
Olds et al. Cross 1,039 South Children completed a The median screen time was 229 mins/day. This was higher in 2006[187] sectional Australian children multimedia 24-hour boys (264 vs. 196 minutes; p<0.001) and on nonschool days (260
aged 10-13 years activity recall diary on 2-4 vs. 190 minutes; p<0.001), increased with age p=0.003), and occasions in 2002, decreased with socio-economic status (SES; p=0.003). TV including at least one consumed 73% of all screen time, video games 19%, nongame school day and one non-school day.
computer use 6%, and cinema 2%.
Hardy et al. 2.5-year Girls aged 12–15 Girls were asked to report Over 2.5 years, the amount of leisure time spent in sedentary 2007[84] prospective
cohort.
5 data collections, 6 months apart,
between 2000 and 2002
years (n=200) from 8 high schools located in Sydney, Australia
the time usually spent watching television, videos, or playing video games; using a computer for fun or study; doing homework/ study (not on a computer) or reading for fun; talking on the telephone, sitting with friends or hanging out; doing hobbies or crafts or music lessons/ practice;
behaviour increased by 28%; this represents an increase from 45% to 63%.
Time spent in sedentary behaviour increased on schooldays, Saturdays, and Sundays (23%, 32%, and 39% of total leisure time, respectively).
87

and travelling in a car, bus, ferry, or train, before and after school on a usual weekday and for each weekend day. Girls also reported time spent going to the cinema each week.
Hardy et al. Cross Representative The Adolescent Boys in grades 6, 8 and 10 spent 45%, 57%, and 61%, and girls 2006[188] sectional population survey of Sedentary Activities 44%, 52%, and 59%, respectively, of their discretionary time
school students Questionnaire (ASAQ) engaged in sedentary activities. was administered and
(n=2,750) in grade 6 students were asked to 10 in New South think about a normal Wales, Australia. week and to report how
long they usually spent engaged in a range of sedentary behaviours before and after school on each day of the week and for each weekend day.
Nelson et al. 5-year Early to mid Project Eat survey items Hours/week TV/video use (TV) and leisure time computer use 2007[189] longitudinal adolescence (junior that were adapted from (LTCU)
high to high school; n= 806; mean Planet Health were Younger cohort Older cohort baseline age: 12.8 years) and mid- to late adolescence
included to assess usual time spent Early
ad Mid ad (2004)
Mid ad (1999)
Late ad (2004)
(high school to post– high school; n=1710;
(1) “watching TV & videos” and (2) “using a computer Girls
(1999)
20 17.8 (0.7) 17.4 18.4 (0.6) mean baseline age: 15.8 years). USA (not for homework).”
Participants reported TV
(0.7) (0.6) (p<0.001)
average hours per LTCU 10.1 11.1 (0.6) 8.8 12.5 (0.5) weekday spent engaging
88

in these behaviors, as well as average hours per weekend day (Saturday
(0.6) (0.6)
Boys 22.5 21.6 (0.9) 21.7 21.7 (0.8) or Sunday). Possible categorical responses ranged from 0 to
5 hours per day
TV (0.8) (0.8)
LTCU 11.4 (0.8)
15.2 (0.9)
(p<0.001)
10.4 (0.8)
14.2 (0.8)
(p<0.001)
Eaton et al. 2007 Cross This report Self-report 35.4% watched > 3h TV per school day. [190] sectional summarizes results
from the national 24.9% spent > 3h playing computer/video games per school day. survey, 39 state surveys, and 22 local surveys conducted among students in grades 9–12 during 2007. USA
Taveras et al. 4-year A cohort of 6369 girls We designed a series of Baseline 2007 [191] longitudinal and 4487 boys who
were 10 to 15 years of age in 1997, taking part in the Growing Up Today study.
questions to measure weekly
hours of sedentary behavior, including “watching television,” “watching videos or VCR,” and “Nintendo/ Sega/computer games
Girls TV viewing (mean (SD) hours/week):
10-12y=10.2 (7.6)
13-15y=9.4 (7.4)
Girls total sedentary behaviour (TV, video, computer games) (mean (SD) hours/week):
(not homework).” For each of these, children selected their usual number of hours from options ranging from 0 to >31 hours.
10-12y=18.1 (11.2)
13-15y=16.7 (10.4)
Boys TV viewing (mean (SD) hours/week):
10-12y=11.6 (7.9)
89
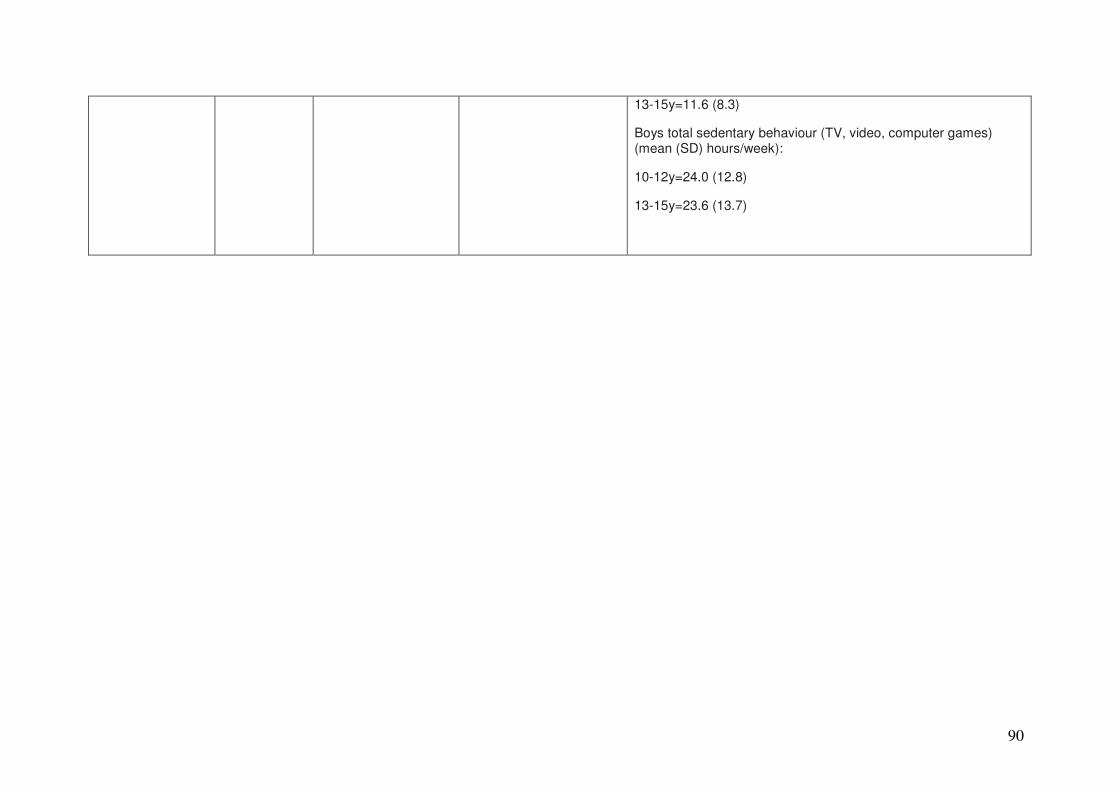
13-15y=11.6 (8.3)
Boys total sedentary behaviour (TV, video, computer games) (mean (SD) hours/week):
10-12y=24.0 (12.8)
13-15y=23.6 (13.7)
90

Table 5. UK sedentary behaviour prevalence data: summary
Gorely et al.
2007 [58]
Gorely et al.
2009 [57]
Biddle et al.
2009 [17]
Liverpool report
[179]
Fairclough et al.
2009 [23]
Boys Girls Boys Girls Boys Girls Total Boys Girls
>1h TV week
days
- - - - - - 55.5 52.9 35.8
< 2h TV week
days
- 62.1 50 - 54.2 56.7 - - -
> 4h TV week
days
- 3.3 8.9 - 5.8 6.1 - - -
>1h TV weekend
days
- 54.4 41.8
< 2h TV weekend
days
- 43 25.5 - 32.1 45.6 - - -
> 4h TV weekend
days
- 20.7 33.8 - 24.9 23.5 - - -
> 1h/day
computer/video
game use week
days
- 0 14.2 - - - 63 56.9 22.6
> 1h/day
computer/video
- 0 27.9 - 57.5 - - 59.9 25.8

game use
weekend days
< 1h motorised
transport week
days
- 68.2 74 - 71.3 70.3 - - -
> 1h motorised
transport week
days
- 31.8 26 - 28.7 29.7 - - -
< 1h motorised
transport
weekend days
- 59 65.2 - - - - - -
> 1h motorised
transport
weekend days
- 41 34.8 - - - - - -
92

Table 6. Studies reporting prevalence of self-reported TV viewing, computer use, and sitting time
Author, date Sample Measure Prevalence estimate
Ball et al, 2002 [55] women=8,726 (22-27y); Australia ‘How many hours in total do you Low sitting (<33 hrs/week; <4.7 h/d) typically spend sitting down while doing 2624 (32%) things like visiting friends, driving, Moderate sitting (33-52 hrs/week; 4.7reading, watching television, or working 7.4 h/d) 2741 (34%) at a desk or computer? On a usual High sitting ( >52 hrs/week; >7.4 h/d) week day; on a usual weekend day’ 2775 (34%)
Bertrais et al, 2004 [66] men=3,403 (55y); women=4,000 (53y); S-R: "In general how many hours per <1h: 10.7% men, 10.8% women France day do you spend watching television? 1-<2h: 26.7% men, 24.1% women
(hours/day)". TV viewing categorised as 2-<3h: 34.5% men, 33.4% women <1hr, 1-2h/d, 2-3h/d, >3h/d >3h: 22.8% men, 23.7% women
Bertrais et al, 2005 [67] men=1,902; women =1,932 (50 to 69y); France
Average daily time spent at home watching TV/video or playing video games, using a computer, and reading (for leisure). Time spent watching TV/video or playing video games, and time spent using a computer were summed and that indicator was termed “screen viewing”.
TV/computer use h/d <2h/d: men=32.9%; women=35.9% 2-3h/d: men=28.9%; women=29.8% >3h/d: men=32.8%; women=34.3%
Reading m/d <40m/d: men=38.2%; women=32.3% 40-80m/d: men=37.8%; women=38.3% >80m/d: men=24.0%; women=28.4%
Clarke et al, In press men =4,950; women=6,001 (mean age 48y); Australia
TV time (including video viewing) during past 7 days (week days and weekend days reported separately).
≥ 2 hours TV/day men =46%; women =40% ≥ 4 hours TV/day men =9%; women = 6%
Johnson et al, 2006 women=1,555 (veterans); US ‘‘On a typical or average week day (24 >=2h/day = 63% [69] hr), about how much time do you spend Weekdays: <1 hr=19%; 1-2 hrs=33%;
watching television or videos?’’ <1 hr; 3-4 hrs= 28%; 5-7 hrs= 10% ; 8+ hrs= 1-2 hrs; 3-4 hrs; 5-7 hrs; 8-10 hrs; 6% Weekend days: <1 hr=15%; 1-2 11+hrs. Television >=2 hr on weekdays hrs=26%; 3-4 hrs= 31%; 5-7 hrs= 15% ; and/or weekends 8+ hrs= 9%
93

Katzmarzyk et al, 2009 n=17,013 (18 to 90 y); Canada Self-reported time spent sitting during 1) 17.8%; [47] the course of most days of the week as 2) 39%;
either 1) almost none of the time, 2) 3) 25.7%; approximately one fourth of the time, 4) 12.6%; 3)approximately half of the time, 4) approximately three fourths of the time, or 5) almost all of the time.
5) 4.8%
Patel et al, 2006 [70] n=59,695 women (mean age 62.7y); US ‘‘During the past year, on an average day, (not counting time spent at your job) how many hours per day did you spend sitting (watching TV [television], reading, etc.)?’’ Responses included none, less than 3, 3–5, 6–8, and more than 8 hours per day. The duration of sedentary behavior at baseline was categorized as 0–<3, 3–5, 6, or missing hours/day.
<3 h/d= 46%; 3-5h/d= 42%; 6+h/d= 10%; missing= 2.4%
Proper et al, 2007 [71] n=1,008 (20 to 65y); South Australia IPAQ-L: last 7 days. "time spent while at work, at home, while doing course work and during leisure time, and may include time spent sitting at a desk, visiting friends, reading, or sitting or lying down to watch television." "Additional questions asked about time spent (in days and minutes per day) in the following seven sedentary leisure activities: computer/internet for leisure, video games, reading, sitting and talking with friends or listening to music, talking on the phone, television or video watching, and driving or riding in a car"
On average, sitting time was higher on weekdays (350 min or almost 6 h) than on weekend days (261 min or 4.35 h) (P<0.001). In response to the more detailed leisure-time sitting questions, participants reported sitting in leisure time for an average of 1577 min per week (225 min or 3.75 h per day).
Nielsen Media Research, 2009 [41]
Population data; US Electronically measured using ‘Convergence Panel’ and time use diary.
The average person watched television 4 hours and 32 minutes each day
94
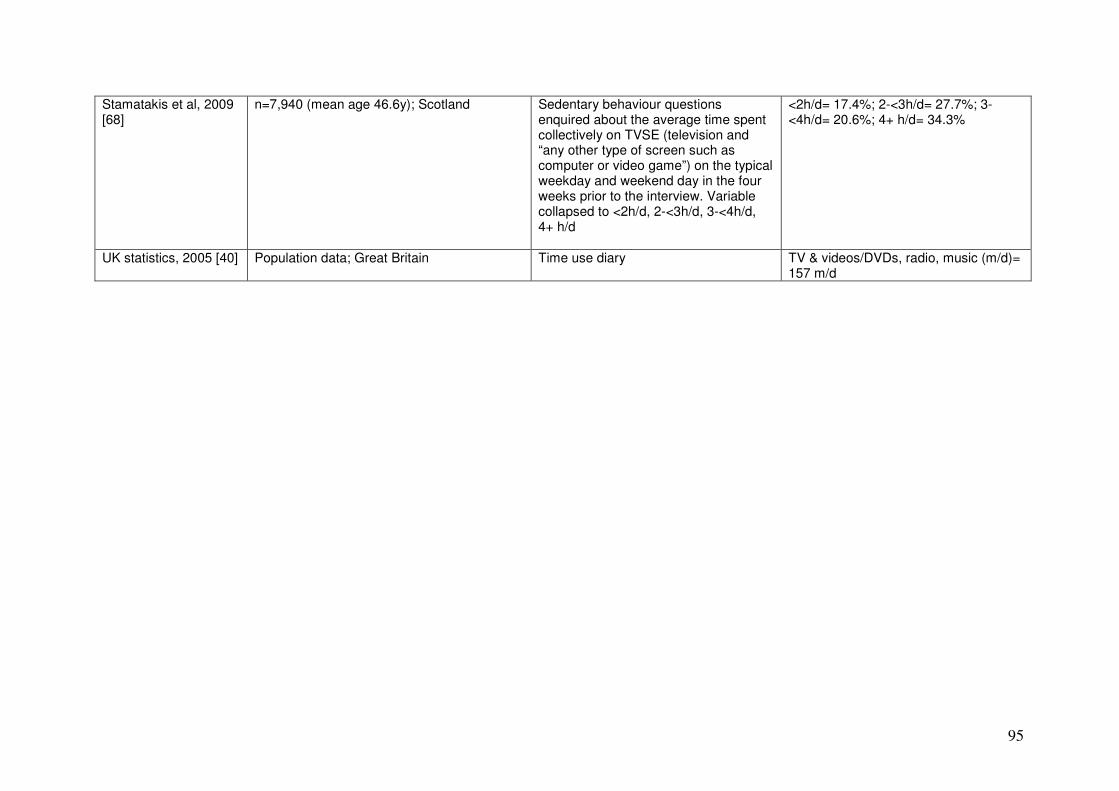
Stamatakis et al, 2009 [68]
n=7,940 (mean age 46.6y); Scotland Sedentary behaviour questions enquired about the average time spent collectively on TVSE (television and “any other type of screen such as computer or video game”) on the typical weekday and weekend day in the four weeks prior to the interview. Variable collapsed to <2h/d, 2-<3h/d, 3-<4h/d, 4+ h/d
<2h/d= 17.4%; 2-<3h/d= 27.7%; 3<4h/d= 20.6%; 4+ h/d= 34.3%
UK statistics, 2005 [40] Population data; Great Britain Time use diary TV & videos/DVDs, radio, music (m/d)= 157 m/d
95
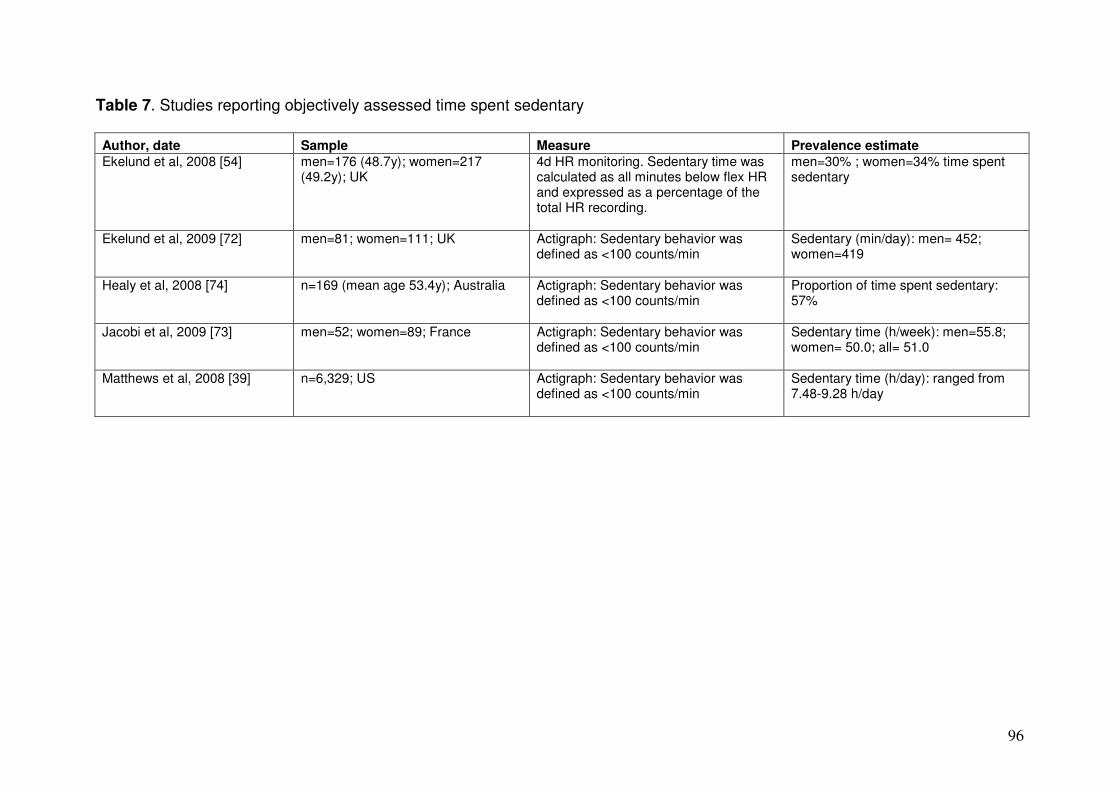
Table 7. Studies reporting objectively assessed time spent sedentary
Author, date Sample Measure Prevalence estimate
Ekelund et al, 2008 [54] men=176 (48.7y); women=217 (49.2y); UK
4d HR monitoring. Sedentary time was calculated as all minutes below flex HR and expressed as a percentage of the total HR recording.
men=30% ; women=34% time spent sedentary
Ekelund et al, 2009 [72] men=81; women=111; UK Actigraph: Sedentary behavior was defined as <100 counts/min
Sedentary (min/day): men= 452; women=419
Healy et al, 2008 [74] n=169 (mean age 53.4y); Australia Actigraph: Sedentary behavior was defined as <100 counts/min
Proportion of time spent sedentary: 57%
Jacobi et al, 2009 [73] men=52; women=89; France Actigraph: Sedentary behavior was defined as <100 counts/min
Sedentary time (h/week): men=55.8; women= 50.0; all= 51.0
Matthews et al, 2008 [39] n=6,329; US Actigraph: Sedentary behavior was defined as <100 counts/min
Sedentary time (h/day): ranged from 7.48-9.28 h/day
96

Table 8. Characteristics of studies reporting tracking of sedentary behaviours
Author and date Length of Sample Sample Sample size Sedentary Measure follow-up baseline age gender behaviour
assessed
Sample age < 3 - 5 years
Hancox et al. 2004[192] New Zealand
21 years 5 years BG 1000 TV Questionnaire (parent and self)
Janz et al. 2005[193] USA
3 years 5.6 years B/G 379 IA, TV, VG Questionnaire (parent)
Kelly et al. 2007 [194] UK 2 years 3.8 years B/G 42 SB Accelerometer
Landhuis, et al. 2008[195] New Zealand
27 years 5 years BG 1037 TV Questionnaire (parent and self)
Salbe et al. 2002 [196]USA
5 years 5 years BG 138 TV Questionnaire (parent)
Taylor et al. 2009[197] New Zealand
2 years 3 years BG 244 TV, ST, TST Questionnaire (parent)
Sample age 6 – 11 years
Davison et al. 2005[198] USA
2 years 9 years G 173 TV Questionnaire (parent)
Hesketh et al. 2007 [199] Australia
3 years 7.6 years BG 1278 TV, VG, ST Questionnaire (parent)
Janz et al. 2000[200] USA
5 years 10.5 years B/G 126 ST Questionnaire (self)
Laurson et al. 2008[201] USA
18 months 10 years B/G 268 ST Questionnaire (self)
97
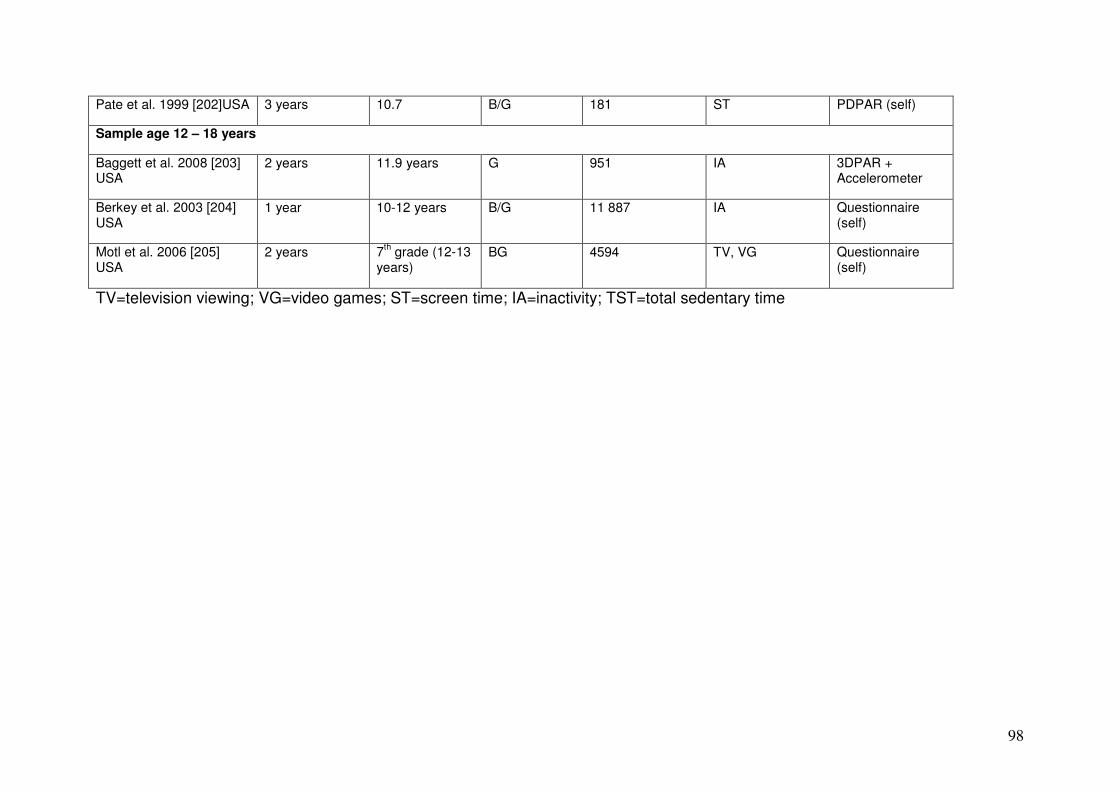
Pate et al. 1999 [202]USA 3 years 10.7 B/G 181 ST PDPAR (self)
Sample age 12 – 18 years
Baggett et al. 2008 [203] USA
2 years 11.9 years G 951 IA 3DPAR + Accelerometer
Berkey et al. 2003 [204] USA
1 year 10-12 years B/G 11 887 IA Questionnaire (self)
Motl et al. 2006 [205] USA
2 years 7th grade (12-13 years)
BG 4594 TV, VG Questionnaire (self)
TV=television viewing; VG=video games; ST=screen time; IA=inactivity; TST=total sedentary time
98
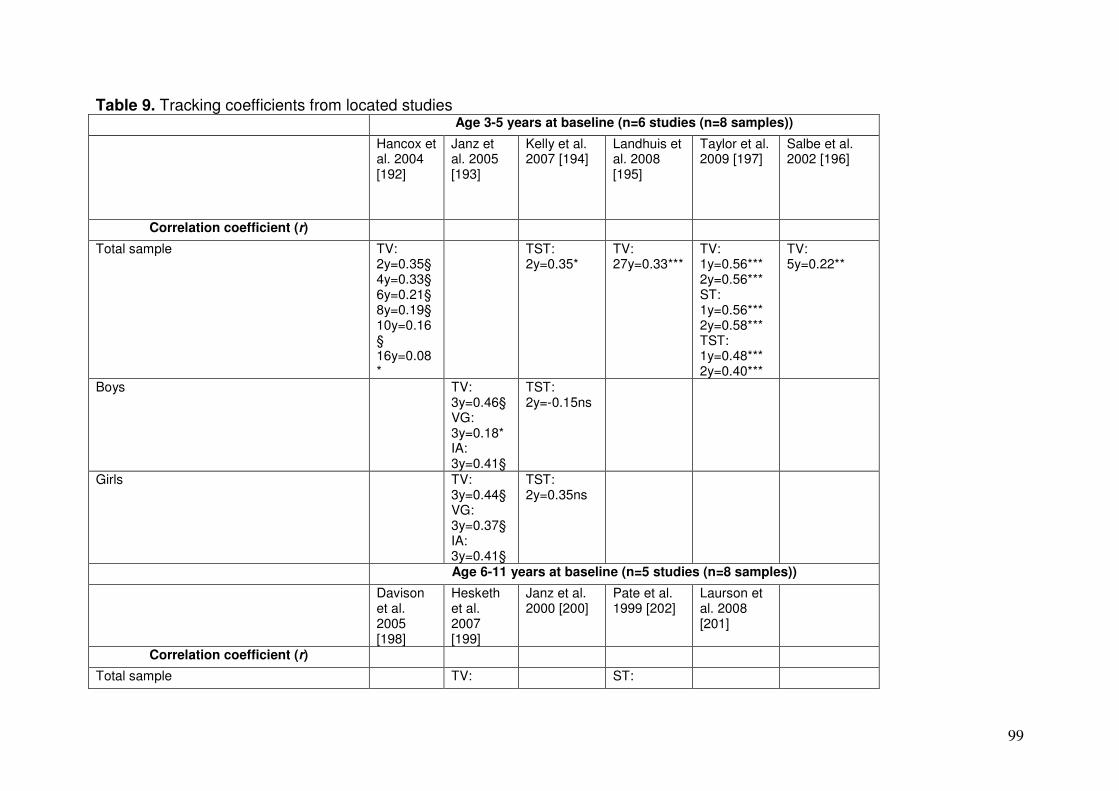
Table 9. Tracking coefficients from located studies Age 3-5 years at baseline (n=6 studies (n=8 samples))
Hancox et al. 2004 [192]
Janz et al. 2005 [193]
Kelly et al. 2007 [194]
Landhuis et al. 2008 [195]
Taylor et al. 2009 [197]
Salbe et al. 2002 [196]
Correlation coefficient (r)
Total sample TV: 2y=0.35§ 4y=0.33§ 6y=0.21§ 8y=0.19§ 10y=0.16 § 16y=0.08 *
TST: 2y=0.35*
TV: 27y=0.33***
TV: 1y=0.56*** 2y=0.56*** ST: 1y=0.56*** 2y=0.58*** TST: 1y=0.48*** 2y=0.40***
TV: 5y=0.22**
Boys TV: 3y=0.46§ VG: 3y=0.18* IA: 3y=0.41§
TST: 2y=-0.15ns
Girls TV: 3y=0.44§ VG: 3y=0.37§ IA: 3y=0.41§
TST: 2y=0.35ns
Age 6-11 years at baseline (n=5 studies (n=8 samples))
Davison et al. 2005 [198]
Hesketh et al. 2007 [199]
Janz et al. 2000 [200]
Pate et al. 1999 [202]
Laurson et al. 2008 [201]
Correlation coefficient (r)
Total sample TV: ST:
99

3y=0.48nr VG: 3y=0.34 ST: 3y=0.46
3y=0.41***
Boys ST: y1Vy5=0.48 * y2Vy5=0.40 * y3Vy5=0.65 * y4Vy5=0.56 *
ST: 3y=0.42***
ST=0.37**
Girls TV: 2y=0.73nr
ST: y1Vy5=0.16 y2Vy5=0.26 y3Vy5=0.16 y4Vy5=0.59 *
ST: 3y=0.39***
ST=0.38**
Age 12-18 years at baseline (n=3 studies (n=6 samples))
Baggett et al. 2008 [203]
Berkey et al. 2003 [204]
Motl et al. 2006 [205]
Correlation coefficient (r)
Total sample TV: 1y=0.51 IA: 1y=0.49
TV: 2y=0.53 VG: 2y=0.52
Boys IA: (<13years )1y=0.46
IA: (>13years )1y=0.50
100

Girls IA: (objective ) 6-day ICC 2y=0.16
IA (self report) 3day ICC 2y=0.17
IA: (<13years )1y=0.47
IA: (>13years )1y=0.51
§p<0.0001, ***p<0.001, **p<0.01, *p<0.05, ns=non significant TV=television viewing; VG=video games; ST=screen time; IA=inactivity; TST=total sedentary time
101

Table 10. Sedentary behaviour and dietary intake in young people
Authors Study type Sample size, Sedentary Dietary behaviour Association between sedentary behaviour (year), age, and gender behaviour assessed assessed and diet country
Barr-Anderson et al. (2009), US [106]
5 year longitudinal 564 middle school students (12.8 years) and 1366 high school students (17.2 years). BG
Time spent watching TV and videos per day at time 1.
Dietary intake and fast food intake at time 2: fruit and vegetables, whole grains, snack foods, fried foods, sugar-sweetened beverages, and calcium rich foods
Younger cohort: Time 1 heavy TV viewers (>5 hours/day) reported lower fruit intake (p=0.009) and higher sugar-sweetened beverage consumption (p=0.02) at time 2.
Older cohort: Time 1 heavy TV viewers reported lower intakes of fruit (p<0.001), vegetables (p<0.001), a higher consumption of snack foods (p=0.012), higher total energy intake (p=0.05), fewer servings of calcium rich foods (p<0.001), greater percentage of total calories from trans fat (p=0.02), and a greater number of sugar sweetened beverages (p=0.004) at time 2.
Phillips et al., 2004 [105]
Longitudinal 196 nonobese premenarcheal girls 8 to 12 years old were enrolled
Television viewing Dietary intake in terms of categories of energy dense foods considered were
A significant, positive relationship was observed between energy-dense snack food consumption and television viewing
between 1990 and 1993 and followed until 4 years after menarche
baked goods, ice cream, chips, sugar-sweetened soda, and candy.
102
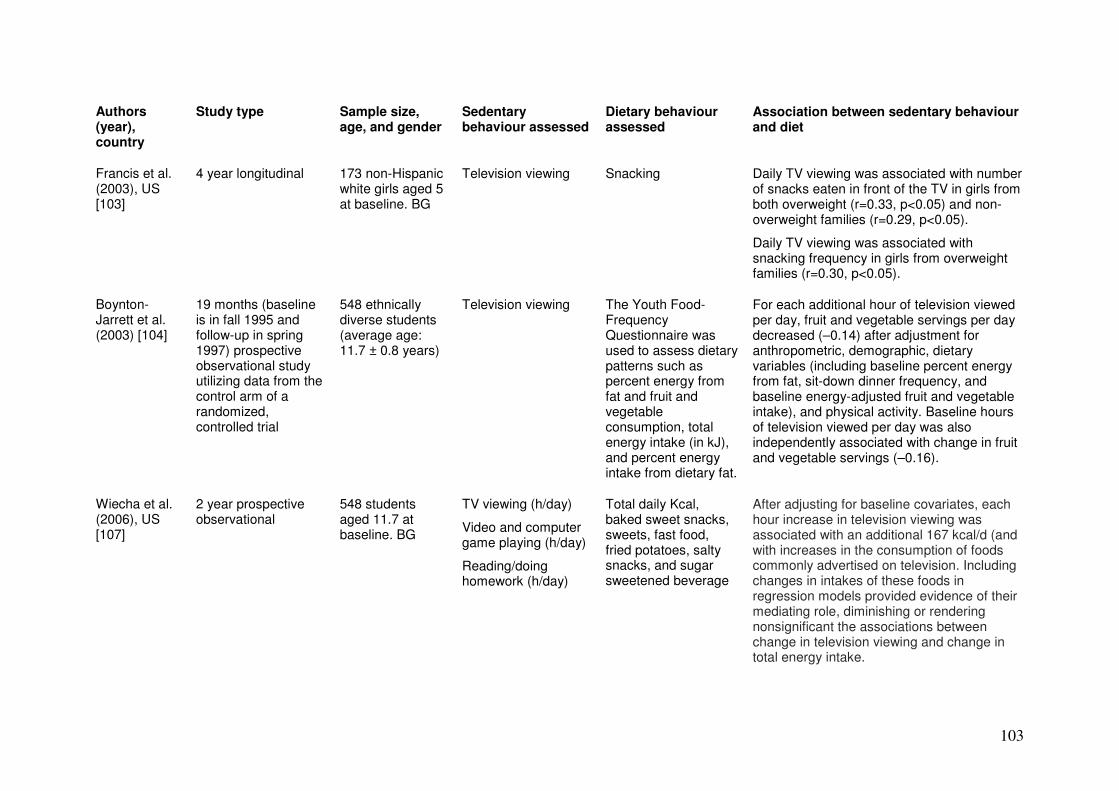
Authors Study type Sample size, Sedentary Dietary behaviour Association between sedentary behaviour (year), age, and gender behaviour assessed assessed and diet country
Francis et al. 4 year longitudinal 173 non-Hispanic Television viewing Snacking Daily TV viewing was associated with number (2003), US white girls aged 5 of snacks eaten in front of the TV in girls from [103] at baseline. BG both overweight (r=0.33, p<0.05) and non-
overweight families (r=0.29, p<0.05).
Daily TV viewing was associated with snacking frequency in girls from overweight families (r=0.30, p<0.05).
Boynton- 19 months (baseline is in fall 1995 and follow-up in spring 1997) prospective observational study utilizing data from the control arm of a randomized, controlled trial
548 ethnically diverse students (average age: 11.7 ± 0.8 years)
Television viewing The Youth Food-Frequency Questionnaire was used to assess dietary patterns such as percent energy from fat and fruit and vegetable consumption, total energy intake (in kJ), and percent energy intake from dietary fat.
For each additional hour of television viewed per day, fruit and vegetable servings per day decreased (–0.14) after adjustment for anthropometric, demographic, dietary variables (including baseline percent energy from fat, sit-down dinner frequency, and baseline energy-adjusted fruit and vegetable intake), and physical activity. Baseline hours of television viewed per day was also independently associated with change in fruit and vegetable servings (–0.16).
Jarrett et al. (2003) [104]
Wiecha et al. (2006), US [107]
2 year prospective observational
548 students aged 11.7 at baseline. BG
TV viewing (h/day)
Video and computer game playing (h/day)
Reading/doing homework (h/day)
Total daily Kcal, baked sweet snacks, sweets, fast food, fried potatoes, salty snacks, and sugar sweetened beverage
After adjusting for baseline covariates, each hour increase in television viewing was associated with an additional 167 kcal/d (and with increases in the consumption of foods commonly advertised on television. Including changes in intakes of these foods in regression models provided evidence of their mediating role, diminishing or rendering nonsignificant the associations between change in television viewing and change in total energy intake.
103

Authors (year), country
Sonneville et al. (2008), US [108]
Vereecken et al. (2006), HBSC [112]
Lowry et al. (2002), US [114]
Snoek et al., 2006,the Netherlands [115]
Study type Sample size, age, and gender
Sedentary behaviour assessed
Dietary behaviour assessed
2 year prospective observational
538 students age 11.7 years at baseline. BG
TV viewing (h/day)
Video and computer game playing (h/day)
Reading/doing homework (h/day)
Energy intake (Kcal/day)
Cross-sectional 162,305 11, 13 and 15 year olds. BG
TV viewing Fruit, vegetables, sweets, non-diet soft drinks
Cross-sectional. Youth Risk Behavior Survey
15,349 high school students in grades 9-12. BG
TV viewing hours per average school day
Fruit and vegetable consumption
Cross-sectional 10,087 adolescents aged 11-16 years (M = 13.0, SD = .8)
Television viewing Snacking behaviour
Association between sedentary behaviour and diet
Each hour increase in TV viewing was associated with an additional energy intake of 106 kcal day. Each hour increase in video and computer game playing was associated with an additional energy intake of 92 kcal day. Each hour increase in physical activity was associated with an additional energy intake of 292 kcal day. No significant change in energy intake was observed for each hour increase in reading/doing homework.
Those who watched more TV were more likely to consume sweets and soft drinks on a daily basis and less likely to consume fruit and vegetables daily, although the latter associations were not so apparent among Central and Eastern European countries.
TV viewing was associated with eating insufficient fruits and vegetables among the total sample, and among White male and female students. Among Hispanic males, TV viewing was inversely related to insufficient consumption of fruits and vegetables
Snacking was negatively associated with physical activity and positively associated with television viewing. For both boys and girls, the positive association between television viewing and snacking was stronger in adolescents who scored high on external and (only for boys) emotional eating, whereas restrained eating attenuated this association.
104

Authors Study type Sample size, Sedentary Dietary behaviour (year), age, and gender behaviour assessed assessed country
Hoelscher et al., 2009, US [116]
Cross-sectional 6,235 fourth-grade students and 5,359 eighth-grade students.
Daily television watching,
Snack consumption, and daily consumption of the foods most frequently advertised on television shows targeted to children (television foods), i.e. punch, sports drinks, and other fruit-flavoured drinks; sodas and soft drinks; frozen desserts; sweet rolls, doughnuts, cookies, brownies, pies, and cakes; and chocolate candy
Association between sedentary behaviour and diet
Snack frequency and television foods were positively associated with television viewing.
Fourth-grade students who ate 2 or more snacks per day were 77% more likely to watch 3 or more hours of television per day than were those who ate 1 or fewer snacks per day.
Eighth-grade students who reported eating 2 or more snacks per day were 44% more likely to watch 3 or more hours of television per day than those who ate no snacks or 1 snack.
Students who ate 4 or more television foods per day were more likely to watch 3 or more hours of television per day than those who ate 3 or fewer television foods per day.
Both fourth- and eighth-grade students who ate 2 or more snacks per day were more likely than those who ate 1 or fewer snacks per day to also eat 4 or more television foods per day.
105
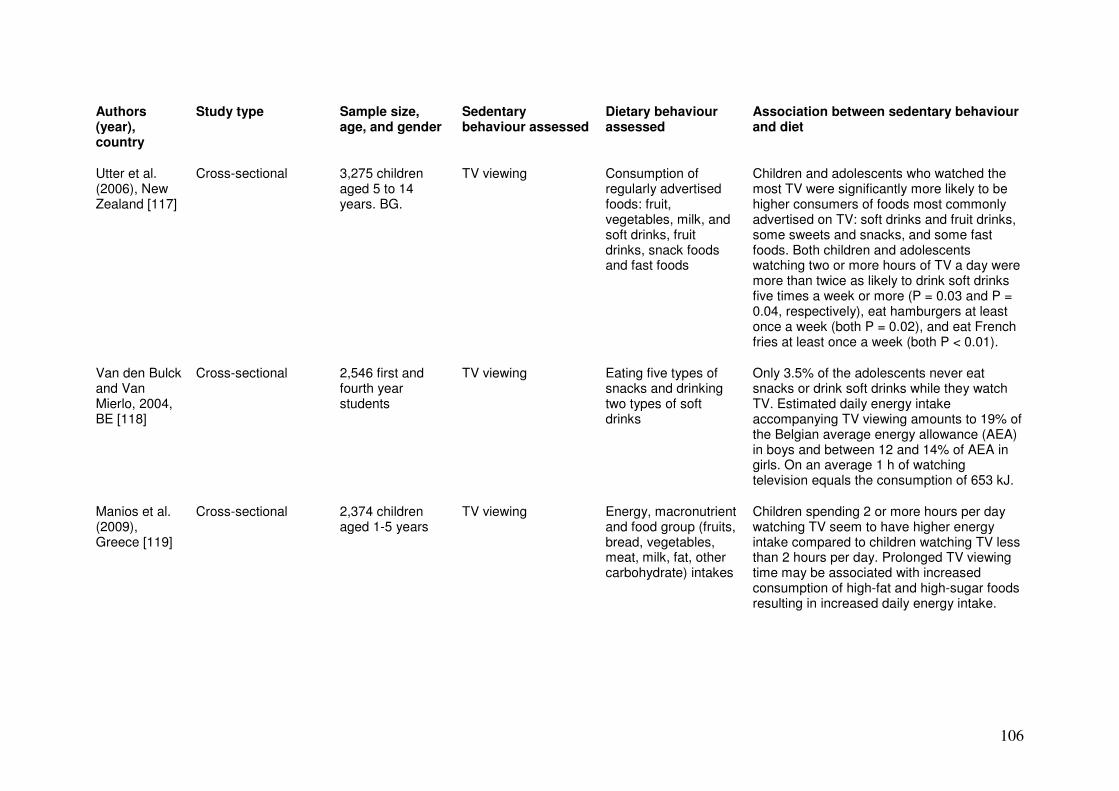
Authors Study type Sample size, Sedentary Dietary behaviour Association between sedentary behaviour (year), age, and gender behaviour assessed assessed and diet country
Utter et al. (2006), New Zealand [117]
Cross-sectional 3,275 children aged 5 to 14 years. BG.
TV viewing Consumption of regularly advertised foods: fruit, vegetables, milk, and soft drinks, fruit drinks, snack foods and fast foods
Children and adolescents who watched the most TV were significantly more likely to be higher consumers of foods most commonly advertised on TV: soft drinks and fruit drinks, some sweets and snacks, and some fast foods. Both children and adolescents watching two or more hours of TV a day were more than twice as likely to drink soft drinks five times a week or more (P = 0.03 and P = 0.04, respectively), eat hamburgers at least once a week (both P = 0.02), and eat French fries at least once a week (both P < 0.01).
Van den Bulck and Van Mierlo, 2004, BE [118]
Cross-sectional 2,546 first and fourth year students
TV viewing Eating five types of snacks and drinking two types of soft drinks
Only 3.5% of the adolescents never eat snacks or drink soft drinks while they watch TV. Estimated daily energy intake accompanying TV viewing amounts to 19% of the Belgian average energy allowance (AEA) in boys and between 12 and 14% of AEA in girls. On an average 1 h of watching television equals the consumption of 653 kJ.
Manios et al. (2009), Greece [119]
Cross-sectional 2,374 children aged 1-5 years
TV viewing Energy, macronutrient and food group (fruits, bread, vegetables, meat, milk, fat, other carbohydrate) intakes
Children spending 2 or more hours per day watching TV seem to have higher energy intake compared to children watching TV less than 2 hours per day. Prolonged TV viewing time may be associated with increased consumption of high-fat and high-sugar foods resulting in increased daily energy intake.
106

Authors Study type Sample size, Sedentary Dietary behaviour Association between sedentary behaviour (year), age, and gender behaviour assessed assessed and diet country
Salmon et al. (2006), Australia [120]
Cross-sectional 1,560 children (613 aged 5–6 years [50% boys], and 947 aged 10– 12 years [46% boys])
Parents’ reports of the time their child spends watching television
Food Frequency Questionnaire to calculate“takeawaystyle foods” (eg, pasties, meat pies, sausage rolls, pizza); “high-energy fluids” (eg, fruit juice drinks, cordial, soft drinks), “sweet snacks” (eg, sweet biscuits, cake, confectionary), “savoury snacks” (eg, flavoured savoury biscuits, peanuts, potato crisps, extruded snacks); and “fruits” and
After adjusting for the age and sex of child, the parents’ level of education, clustering by school, and all other health behaviour variables, children who watched television for more than 2 hours per day were significantly more likely than children who watched television for less than 2 hours per day to: to have one or more serves/day of high energy drinks (adjusted odds ratio [AOR], 2.31; 95% CI, 1.61–3.32), and to have one or more serves/day of savoury snacks (AOR, 1.50; 95% CI, 1.04–2.17). They were also less likely to have two or more serves/day of fruit (AOR, 0.58; 95% CI, 0.46–0.74), or to participate in any organized PA (AOR, 0.52; 95% CI, 0.34–0.80).
“vegetables”.
Vereecken and Maes, 2006, Belgium [113]
Cross-sectional 1,031 adolescents (±12–14 years of age).
Television viewing 24-hour dietary recall and
Those who generally watched more television were more likely to consume frequently advertised items such as soft drinks and snacks. Not all frequently advertised food items (e.g. cereals) were associated with television viewing. An inverse association was found with fruit, water and milk. A negative association was found with brown bread; a positive association was found with white bread.
107

Authors Study type Sample size, Sedentary Dietary behaviour Association between sedentary behaviour (year), age, and gender behaviour assessed assessed and diet country
Miller et al. (2008), US [126]
Cross-sectional 613 boys and 590 girls, age 3 years
TV viewing Food frequency questionnaire
For each 1-hour increment of TV viewing per day, we found higher intakes of sugar-sweetened beverages, fast food, red and processed meat, total energy intake, and percent energy intake from trans fat. We found lower intakes of fruit and vegetables, calcium, and dietary fibre.
Campbell et al.(2006), Australia [125]
Cross-sectional 560 children (53% girls), mean age 6.1 years, and their primary care providers (92% mothers; 8% fathers).
Television viewing Energy intake, vegetable, sweet snack, savory snack and high-energy (nondairy) fluid consumption.
TV viewing time was associated with increased index of energy intake, increased sweet snack and high-energy drink consumption, and deceased vegetable intake. In addition, parent's increased confidence in the adequacy of their child's diet was associated with increased consumption of sweet and savory snacks and decreased vegetable consumption.
Haerens et al., 2008, Belgium [127]
Cross-sectional 534 seventh and eighth graders
Television viewing Food frequency questionnaire to measure intake of healthy and unhealthy foods
Boys with more unhealthy products available at home consumed more fat and more soft drinks. Boys who reported better television viewing habits ate more fruit (P< or =0.001, 95% CI: -1.7 to -0.5). Girls who reported better television viewing habits consumed less fat (P< or =0.01, 95% CI: 1.4-9.0) and more fruit (P< or =0.05, 95% CI: -1.0 to -0.1).
108

Authors (year), country
Kremers, Horst and Brug, 2007, the Netherlands [124]
Taveras et al. (2006), US [123]
Matheson et al. (2004), US [128]
Study type Sample size, Sedentary Dietary behaviour Association between sedentary behaviour age, and gender behaviour assessed assessed and diet
Cross-sectional 383 adolescents from 16 first- and second-grade classes, mean age of 13.5 years (SD .6; range 12– 16), 55.1% female, 14.4% of recent immigrant origin, defined as one or both
The behavioural measure of screen-viewing which comprised of (1) watching television (TV) or video and (2) using a computer (surfing the Internet, playing games, chatting)
Consumption of sugar-sweetened, beverages
Screen-viewing behaviour was associated with consumption of sugar-sweetened beverages (r=.32).
parents frorn abroad
Cross-sectional 240 parents of children aged 25.9 years. BG
Average TV/video viewing (hours/day)
Fast food intake Number of hours watching TV/videos per week (p<0.0001), on weekdays (p=0.002) and on weekend days (p<0.0001) was associated with a fast food consumption.
Cross-sectional 90 children aged 8.6 years (3rd
grade), 124 children aged 9.6 years (fifth grade). BG.
For each meal or snack, children were asked if they participated in any of the following activities while eating: watching TV, video or movie, doing homework, reading, playing inside, playing outside, or motorised transport.
Three non consecutive 24h dietary recalls.
In the third grade sample, 73.6% ate while watching TV on weekdays and 62.9% on weekend days. 16.6% of total daily energy was consumed during TV viewing on weekdays, and 26.2% on weekend days.
In the fifth grade sample, 76% ate while watching TV on weekdays, and 58.2% on weekend days. 18.3% of total daily energy was consumed during TV viewing on weekdays, and 26.4% on weekend days.
109
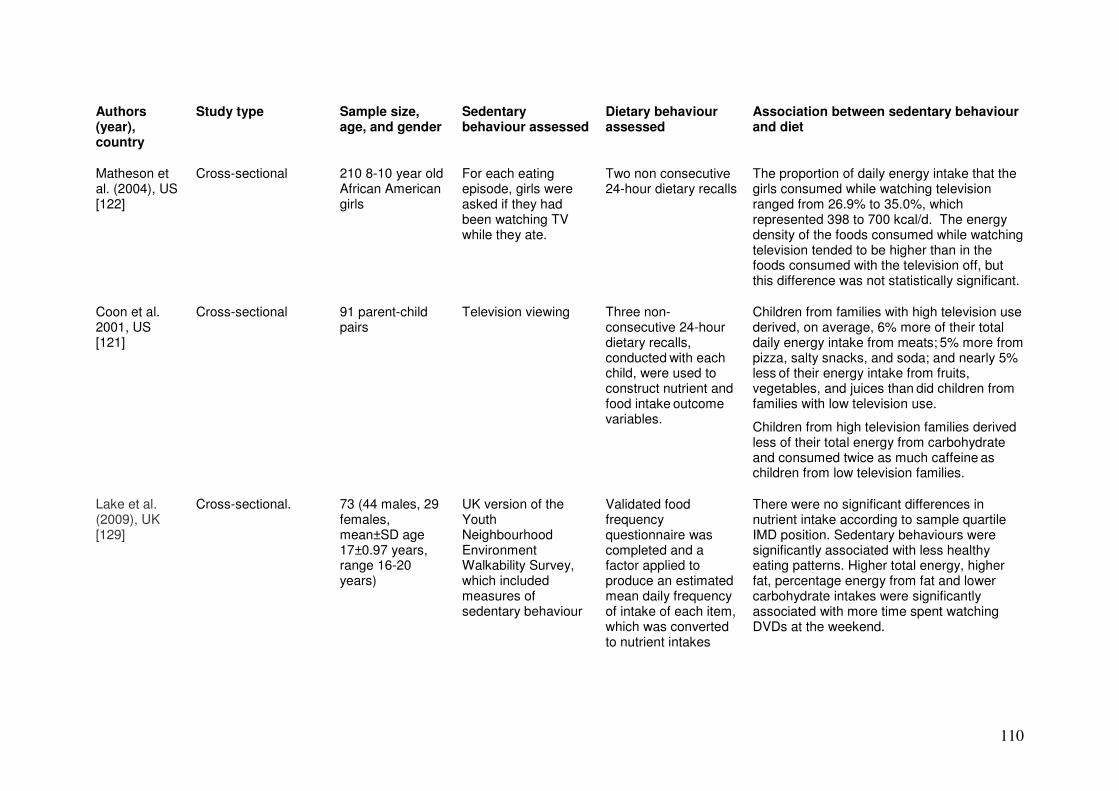
Authors Study type Sample size, Sedentary Dietary behaviour Association between sedentary behaviour (year), age, and gender behaviour assessed assessed and diet country
Matheson et al. (2004), US [122]
Cross-sectional 210 8-10 year old African American girls
For each eating episode, girls were asked if they had been watching TV while they ate.
Two non consecutive 24-hour dietary recalls
The proportion of daily energy intake that the girls consumed while watching television ranged from 26.9% to 35.0%, which represented 398 to 700 kcal/d. The energy density of the foods consumed while watching television tended to be higher than in the foods consumed with the television off, but this difference was not statistically significant.
Coon et al. 2001, US [121]
Cross-sectional 91 parent-child pairs
Television viewing Three nonconsecutive 24-hour dietary recalls, conducted with each child, were used to construct nutrient and food intake outcome
Children from families with high television use derived, on average, 6% more of their total daily energy intake from meats; 5% more from pizza, salty snacks, and soda; and nearly 5% less of their energy intake from fruits, vegetables, and juices than did children from families with low television use.
variables. Children from high television families derived less of their total energy from carbohydrate and consumed twice as much caffeine as children from low television families.
Lake et al. (2009), UK [129]
Cross-sectional. 73 (44 males, 29 females, mean±SD age 17±0.97 years, range 16-20 years)
UK version of the Youth Neighbourhood Environment Walkability Survey, which included measures of sedentary behaviour
Validated food frequency questionnaire was completed and a factor applied to produce an estimated mean daily frequency of intake of each item, which was converted
There were no significant differences in nutrient intake according to sample quartile IMD position. Sedentary behaviours were significantly associated with less healthy eating patterns. Higher total energy, higher fat, percentage energy from fat and lower carbohydrate intakes were significantly associated with more time spent watching DVDs at the weekend.
to nutrient intakes
110

Table 11. Sedentary behaviour and diet in adulthood
Author, date and Study type Sample size, age Sedentary Dietary behaviour Association between sedentary country and gender behaviour behaviour and diet
Jeffery and French (1998) [130]. USA
Cross 1059 men and TV viewing Energy intake TV viewing was not related to energy or fat intake in men. It was, however, positively related to energy intake in both high and low-income women and to percentage of energy from fat in low-income women.
sectional women aged 20-45 years
Percentage energy from fat
Gore et al. (2003) Cross 74 overweight TV viewing Meals Snacking, but not necessarily eating meals, while watching TV is associated with increased overall caloric intake and calories from fat.
[206]. USA sectional women Total calorie intake Calories from fat
Bowman (2006) [131]. USA
Cross-sectional
9146 men and women aged 20+
TV viewing Energy intake Snacks
Adults who watched more than 2 hours of television per day had high intakes of energy and macronutrients. They also obtained more energy from snacks and supper.
years Meals
Rehm et al. (2008) Cross 9865 men and TV viewing Sugar-sweetened Adjusting for demographics, frequent consumption is associated with more television viewing and with less physical activity.
[132]. USA sectional women aged 18 soda consumption years+
Cleland et al. (2008) [207]. Australia
Cross-sectional
947 men and 1054 women aged 26-36 years
TV viewing Meals Snacks Soft drinks
In both men and women, the median reported time spent watching TV increased with increasing frequency of consuming meals (p<0.01), snacks (p<0.01) and soft drinks (p<0.01) during TV viewing time.
Scully et al. (2009) [135]. Australia
Cross-sectional
1495 men and women aged 18+
Commercial TV viewing
Frequency of fast-food consumption at
High viewers were more likely to eat fast food for dinner at least once weekly
different meal times compared with low viewers (OR = 1.45; 95 % CI 1.04, 2.03). Both moderate viewers (OR = 1.53; 95 % CI 1.01, 2.31) and high viewers (OR = 1.81; 95 % CI 1.20, 2.72)
111

were more likely to eat fast food for snacks at least once weekly compared with low viewers. Commercial television viewing was not significantly related (P > 0.05) to fast-food consumption at breakfast or lunch.
Crawford et al. Cross 1136 women aged Eating dinner and Fruit and vegetable Women who ate dinner and snacks while (2007) [134]. sectional 18–65 years snacks while consumption watching television were less likely to eat Australia watching TV two or more servings of vegetables daily.
Women who ate dinner while watching TV were less likely to meet fruit intake recommendations.
Thomson et al. Cross 613 undergraduate TV viewing Snacking behaviour Students reporting medium or high TV (2008) [136]. sectional students age 18-25 viewership snacked more frequently while Canada years watching TV and recognized more
advertising than students who were considered low viewers. High viewers also reported more consumption of energy-dense snacks than low viewers.
112

Table 12. Characteristics of intervention studies for young people
Study/ Quality Design Participants Intervention Control Sedentary Behaviour Other Confounding Rating Outcomes Outcomes Variables/
Possible Sources of bias
Clinic-based Epstein et al RCT N (Intervention) = 36 TV viewing/ Control TV viewing and zBMI: No evidence of (2008)[208] 2 year N (Control) = 34 computer use families had computer use: Significant decrease major
measure- Mean Age (yrs ±±±± SD): budgeted and free access to Control: at 24 months, TV of 0.24 and 0.13 at confounding ment period Intervention: 5.8 ± 1.2 reduced. Children the television and computer use 24 months for variables. with measurement every 6 months.
Intention to treat: Yes
Control: 6.1 ± 1.3 Sex: Intervention: 52.7% male Control: 52.9% male Race: Intervention: 78% white Control: 73% white Recruitment: flyers, posters and ads.
praised for reducing TV viewing, computer use and for participating in non-sedentary alternatives.
and computer. Received newsletters providing parenting tips, sample praise statements and child appropriate activities.
reduced significantly by 5.2 hrs/wk (P<0.001).
Intervention: TV and computer use reduced at 6 months by 17.5 hrs/wk and remained significantly reduced through 24 months.
intervention and control groups, respectively (P<0.05)
Energy Intake: A greater reduction in intervention (P<0.05).
PA: No statistically significant between-group changes over time.
113

Epstein et al RCT N = 90 4 treatment groups The 2 differing Time spent in targeted % time being No mention of (2000)[209] 6-month
treatment, 16 weekly, 2 biweekly, 2 monthly meetings. Follow-up: 12 and 24 months.
Intention to treat: Yes
N (Intervention) = 45 N (Control) = 45 Mean Age (yrs ±±±± SD):
10.5 ± 1.2 Sex: 46.2% male Race: Not reported Recruitment: physician referrals, posters, newspaper, TV advertisements.
that varied the targeted behaviours (SB vs PA) and treatment dose (low vs high).
A comprehensive family-based behavioural weight control programme that included dietary and behaviour change information.
behaviour groups acted as controls for each other.
and non-targeted SB: Significant decreases across both groups from baseline at 6 (-13.4 ±
22.6, P<0.001) and 24 (8.7 ± 23.6, P<0.05) months in percentage of time spent in targeted behaviours. Percentage of time spent in non-targeted behaviours were increased from baseline to 6 months (+ 9.3 ± 18.7, P<0.05).
active: Significant increases in time spent being active was observed from baseline to 2 years (+7.5 ± 20.0, P<0.05).
% overweight: Significant decreases in percentage overweight from baseline to 6 months (25.5 ± 10.6, P<0.001) through 2 years (12.9 ± 17.0, P<0.001).
‘blinding.’ If this aspect was ignored in the study, there is the possibility of experimenter bias.
Ford et al RCT N (Intervention) = 13 Brief counselling Brief Media use: Decreases in PA: Compared to Control group did (2002)[138] 20 minute
session Follow-up: 4 weeks Intention to treat: Yes
N (Control) = 15
Mean Age (yrs ±±±± SD):
Intervention: 9.5 ± 1.4 Control: 9.6 ± 1.7 Sex: 53.6% female Race: Not reported Recruitment: Not reported.
intervention with written educational material and 20 minute behavioural intervention on reducing TV viewing. Families also received electronic TV time manager to help stick to a weekly media budget.
counselling session and written educational materials on risks on SB.
overall family television use and children’s TV, video-tape and video game use appeared to favour the behavioural intervention, however, not statistically significant.
the counselling group, the behavioural intervention group reported a statistically significant increase in organised PA (P=0.004).
not receive the brief counselling intervention, therefore reduced SB could be due to the brief intervention or the result of a reporting bias or other factor.
114

Goldfield et al RCT N (Intervention) = 14 Open-loop Control group SB: Intervention group PA: Intervention No evidence of (2006)[210] 8-week N (Control) = 16 feedback plus wore PA showed significantly group demonstrated major
intervention Mean Age (yrs ±±±± SD): reinforcement monitors, greater reductions in significantly greater confounding Follow-up: Intervention: 10.0 ± 0.9 group were however, had targeted SB over time changes in total PA variables. Upon completion of intervention Intention to treat: Yes
Control: 10.7 ± 1.4 Sex: Intervention: 57.1% female Control: 56.3% female Race: Not reported Recruitment: Not reported
provided with objective feedback on their PA. The PA they completed was rewarded by access to TV. Families attended biweekly meetings to discuss
free access to the television, independent of the PA they had done.
(P<0.05). Intervention group showed larger reductions than controls in mins/day of TV/VCR/DVD/Videogame playing from baseline through intervention (P<0.001).
counts (P<0.05) and time spent in MVPA (P<0.05) compared to the controls.
progress. Population-based Epstein et al Experi- N = 13 Aimed to decrease All subjects Targeted SB: Children Energy balance: Participants who (2002)[211] mental Age: 8-12 years and increase levels acted as their significantly (P<0.001) When SB were took part
within-Ss Sex: NR of sedentary own controls decreased their time increased, there was responded to ads crossover Race: NR activity. Families as they spent in targeted SB by a significant (P = and therefore 9 weeks Follow-up: Upon completion of
Recruitment: Newspaper ads, flyers and direct mailings
attended meetings to discuss behavioural modification techniques,
participated in all conditions.
53.9 ± 15.3% from baseline measures when in the decrease SB phase.
0.05) increase in energy balance per day due to increased energy intake (+250.9 kcal) and a
were willing participants, if people from differing socioeconomic
intervention including praise, reduced energy status, race Intention to positive expenditure (-99.8 and/or ethnicity treat: reinforcement and kcal). were to take part, Unsure stimulus control. results may differ.
115

Robinson et al RCT N (Intervention) = 28 ‘GEMS Jewels’ Active control Television Viewing: PA: PA levels after Active control (2003) [212] 60 dance
classes over 12 weeks. Follow-up: Conclusion of intervention Intention to treat: Unsure
N (Control) = 33 Mean Age (yrs ±±±± SD):
Intervention: 9.5 ± 0.8 Control: 9.5 ± 0.9 Sex: 100% female Race: 100% African American Recruitment: Through community centres and after-school programmes
dance classes offered 5 days a week over the 3 month study period. Classes included healthy snack, homework session and about 45-60 minutes of moderate-tovigorous dance. Also 5 home visits to reduce SB.
health education intervention. Participants received health lectures and newsletters focussing on reducing risks for lifestyle diseases.
Treatment reported 23% less media use than the control group. Total household TV viewing: Treatment group showed a statistically significant decrease in total household television use (P = 0.007).
the intervention were higher in the intervention group relative to the control group. Meals eaten in front of TV: Treatment group showed 40% decrease in dinners eaten in front of the TV relative to the control.
received a health lectures which the intervention group did not receive, therefore, the results could partly be as a result of the lectures rather than the intervention itself.
Faith et al RCT N (Intervention) = 6 To reduce TV Cycle TV viewing time: TV PA (pedalling No evidence of (2001) [213] 12 weeks,
with 2-week baseline phase and 10-week treatment phase. Follow-up: Upon completion of intervention. Intention to treat: Yes
N (Control) = 4 Mean Age (yrs ±±±± SD):
Intervention: 10.2 ± 1.5 Control: 10.0 ± 1.6 Sex: Intervention: 66.7% male Control: 75% male Race: NR Recruitment: advertisements placed in local newspapers.
watching by linking it to a cycle ergometer. One minute of moderate intensity cycling resulted in 2 minutes of TV viewing.
ergometer was placed in the home, but TV viewing was not contingent on cycling.
viewing time significantly decreased from baseline to weeks 3-5 (P < 0.0001), weeks 6-8 (P < 0.0001) and weeks 9-12 (P<0.0001) in treatment group. During treatment phase, the treatment group and the control group watched an average of 1.6 and 21.0 hrs of TV/day, respectively.
time): The treatment group significantly increased PA from baseline to weeks 35 (P = 0.05), the following weeks were not significant. During treatment phase (weeks 3-12) the treatment group and the control group pedalled for an average of 64.4 and 8.3 minutes a day, respectively.
major confounding variables.
116

Lubans et al Quasi- N (Intervention) = 50 Health-related Received the Time spent watching PA (Steps/day): No evidence of (2008) [214] experi- N (Comparison) = 66 fitness and lifetime health- related TV/playing video Low active major
mental Mean Age (yrs ±±±± SD): physical activities fitness and games: The only adolescents in confounding 8-week programme Follow-up: Upon completion of intervention. Intention to treat: Yes
14.2 ± 0.7 Sex: Intervention: 52% female Comparison: 66% female Race: 95% Australian born Recruitment: Secondary schools were invited to take part.
delivered as school sport option. Weekly information sessions focussing on behaviour modification strategies. Provision of pedometers for PA monitoring and program booklets with intervention activity ideas.
lifetime physical activities delivered as school sport option and the program booklets with intervention activity ideas.
statistically significant change was a within group change for low-active adolescents in the comparison group, they decreased time watching TV from baseline to post-test by 0.4 ± 0.8 hours/day (P < 0.01).
intervention group significantly increased PA by 2341 steps/day from baseline (P<0.05). Significantly different to that of the comparison group (P<0.05). High active adolescents in the control group significantly reduced their steps/day by
variables.
2184 ± 2618 (P<0.01).
Robinson (1999) RCT at N (Intervention) = 92 18 lessons The control Media use and TV Adiposity: All No evidence of [215] school level N (Control) = 100 incorporated into group received viewing: According to children’s BMI, tricep major
18 sessions Mean Age (yrs ±±±± SD): school’s the regular both participant and skinfold thickness, confounding over 7 Intervention: 8.5 ± 0.64 curriculum. school parent reports, the waist circumference, variables. months Follow-up: Conclusion of intervention. Intention to treat: Yes
Control: 8.92 ± 0.70 Sex: Intervention: 44.6% female Control: 48.5% female Race: NR Recruitment: Third and fourth graders in 2 public elementary schools in California were recruited to participate.
Lessons included self monitoring of TV use, followed by a turn-off TV challenge. Participants encouraged to limit TV and media use to 7 hours week. Newsletters sent out to parents to help them
curriculum. intervention significantly reduced children’s TV viewing from (P<0.001).
hip circumference increased. But those in intervention group had significant relative decreases BMI (P=0.002), tricep skinfold thickness (P=0.002), waist circumference (P<0.001) hip-towaist ratio (P<0.001) compared to the
encourage their controls. children to stay within their budgets.
117
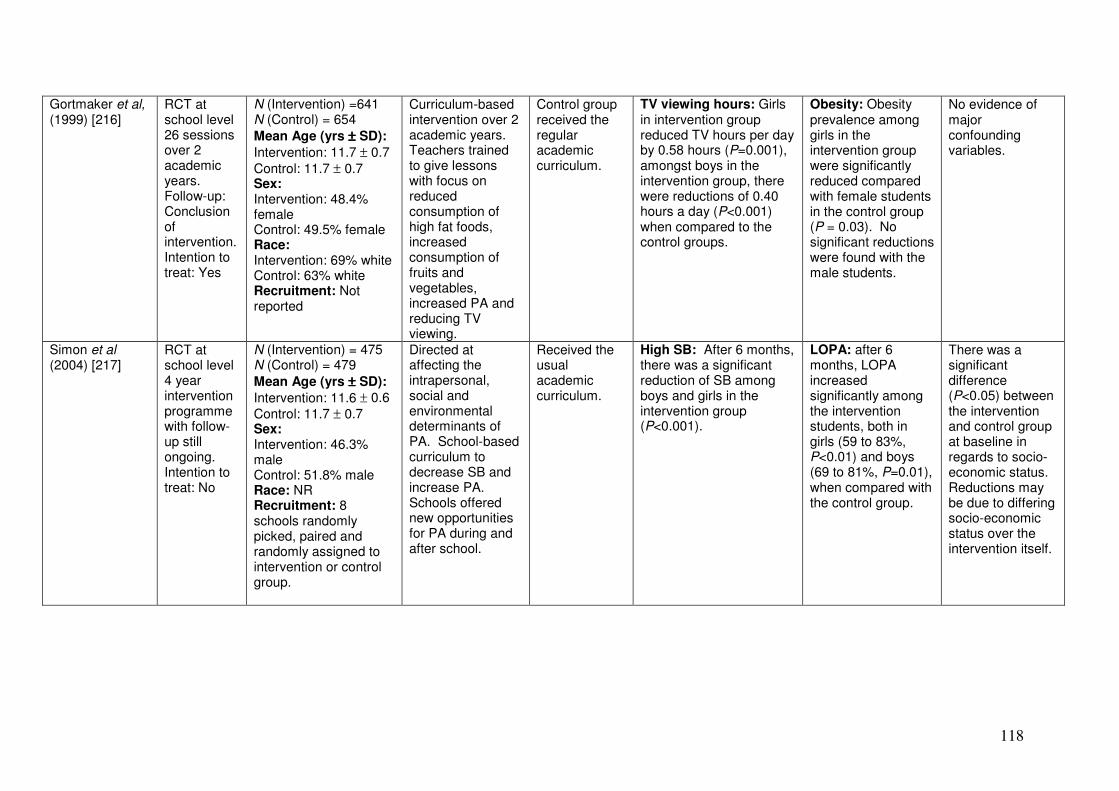
Gortmaker et al, RCT at N (Intervention) =641 Curriculum-based Control group TV viewing hours: Girls Obesity: Obesity No evidence of (1999) [216] school level
26 sessions over 2 academic years. Follow-up: Conclusion of intervention. Intention to treat: Yes
N (Control) = 654 Mean Age (yrs ±±±± SD):
Intervention: 11.7 ± 0.7 Control: 11.7 ± 0.7 Sex: Intervention: 48.4% female Control: 49.5% female Race: Intervention: 69% white Control: 63% white Recruitment: Not reported
intervention over 2 academic years. Teachers trained to give lessons with focus on reduced consumption of high fat foods, increased consumption of fruits and vegetables, increased PA and reducing TV viewing.
received the regular academic curriculum.
in intervention group reduced TV hours per day by 0.58 hours (P=0.001), amongst boys in the intervention group, there were reductions of 0.40 hours a day (P<0.001) when compared to the control groups.
prevalence among girls in the intervention group were significantly reduced compared with female students in the control group (P = 0.03). No significant reductions were found with the male students.
major confounding variables.
Simon et al RCT at N (Intervention) = 475 Directed at Received the High SB: After 6 months, LOPA: after 6 There was a (2004) [217] school level
4 year intervention programme with follow-up still ongoing. Intention to treat: No
N (Control) = 479 Mean Age (yrs ±±±± SD):
Intervention: 11.6 ± 0.6 Control: 11.7 ± 0.7 Sex: Intervention: 46.3% male Control: 51.8% male Race: NR Recruitment: 8 schools randomly picked, paired and randomly assigned to intervention or control group.
affecting the intrapersonal, social and environmental determinants of PA. School-based curriculum to decrease SB and increase PA. Schools offered new opportunities for PA during and after school.
usual academic curriculum.
there was a significant reduction of SB among boys and girls in the intervention group (P<0.001).
months, LOPA increased significantly among the intervention students, both in girls (59 to 83%, P<0.01) and boys (69 to 81%, P=0.01), when compared with the control group.
significant difference (P<0.05) between the intervention and control group at baseline in regards to socioeconomic status. Reductions may be due to differing socio-economic status over the intervention itself.
118

Salmon et al RCT N (3 Intervention Additional classes Received the Screen behaviours: PA: BM and FMS No evidence of (2008) [140] 19 lessons
over 1 Australian academic year Follow-up: At 6 and 12 months Intention to treat: Yes
classes) =233 N (1 control class) = 62 Mean Age (yrs ±±±± SD): 10 years 8 months Sex: 51% female Race: Not reported Recruitment: Convenience sample of 3 schools recruited for the study.
using techniques such as self-monitoring, behavioural contracting to ‘switch off’ the TV for increasing durations, reinforcement and skill building. The intervention groups were behavioural modification, fundamental movement skills and a combined group.
usual school curriculum.
Significant intervention effects for children’s TV viewing, undesired direction. BM reported 229 min/week more than control group (P<0.05).
groups significantly increased vigorous PA and movement counts of PA per day compared to control group (P<0.0001). FMS recorded 10.4 mins/day more in moderate PA compared to control (P<0.0001). BMI: BM/FMS group significantly (P<0.05) reduced their BMI compared to the control group.
major confounding variables.
Sahota et al RCT N (5 Intervention Active Programme Received the SB: No significant PA: No significant No evidence of (2001) [139] 1 academic
year Follow-up: 12 months after baseline Intention to treat: Unsure
schools) =314 N (5 Control schools) = 322 Mean Age (yrs ±±±± SD):
Intervention: 8.36 ±
0.63 Control: 8.42 ± 0.63 Sex: Intervention: 49% female Control: 41% female Race: Not reported Primary schools in Leeds area recruited, methods not reported.
Promoting Lifestyle Education in Schools (APPLES). Programme consisted of teacher training, modification of school meals and the development and implementation of school action plans designed to promote healthy eating and PA.
usual health curriculum.
differences for SB were recorded.
changes for PA were recorded.
major confounding variables.
Lab-based
119

Epstein et al RCT N (3 x Intervention) = Participants were Those in the Time spent in sedentary PA: The Poor description (1997) [143] 6 day
measureme nt period with 1 post-intervention day Intention to treat: Unsure
25 N (Control) = 9 Mean Age (yrs ±±±± SD):
10.0 ± 1.2 Sex: 41.1% male Race: 89.2% white Participants had applied but had not yet been enrolled to the Childhood Weight Control Program at the State University of New York at Buffalo.
assigned to 1 of 3 intervention groups in which they were reinforced for not engaging in high preference sedentary activities, punished for engaging in high preference sedentary activities and where access to their high preference sedentary activities were limited.
control group were given access to all available activities and were not punished or reinforced for participating in any of the activities.
activities: Those in the intervention groups spent significantly less time engaging in the high preference sedentary activities than those in the control group (P<0.001). There were no significant differences between each of the intervention groups.
reinforcement group and punishment group were significantly more active than the control group and restriction group (P=0.016 and P=0.009, respectively).
of randomisation method; no mention of ‘blinding.’ Possible experimenter bias if experimenters know which participants are in which group. Subjects may also act differently if they know which group they are in.
Epstein et al RCT N = 27 Participants Same as Time spent in sedentary No other data No evidence of (1995) [142] 6 sessions
with a post-baseline day follow-up. Intention to treat: Yes
N (2 x Intervention) = 18 N (Control) = 9 Mean Age (yrs ±±±± SD):
10.0 ± 1.4 Sex: 1/3 male Race: Not reported Recruitment methods were not reported.
attended the laboratory and during the 3 experimental days, were reinforced for increasing their PA (group 1) or reinforced for decreasing time spent in high preference SB (group 2).
intervention however, rewards were not contingent of their activity choices.
activities: Participants in the intervention groups spent significantly less time in high-preference SB than the control group (both groups:- P<0.001). Group 2 spent significantly more time in lower preferred sedentary activities than group 1 (P = 0.004).
present major confounding variables.
120

Saelens et al RCT N = 14 During intervention Same as Time spent in sedentary No other data Poor description (1998) [141] 2 x 90 Age: 8-12 years days, the targeted intervention activities: The reported. of randomisation
minute intervention
Sex: 64.3% male Race: Not reported
SB of playing video games and
however there were no
contingency of riding the stationary bike was
method; no mention of
sessions Recruitment methods watching VCR contingencies associated with a ‘blinding.’ over 2 days. were not discussed in were made on any of the significant reduction in Possible Intention to the paper. contingent upon activities time spent in targeted experimenter bias treat: riding a stationary available for sedentary activities if experimenters Unsure bike. the (P<0.001). However, the know which
participants to control group showed no participants are in participate in. significant changes in which group.
time spent in sedentary Subjects may also activities. act differently if
they know which group they are in.
121

Table 13. Details of specific sedentary time recommendations from selected countries
Country Recommendation Reference Justification for time limit? Comments
Australia Children shouldn't spend more than two hours a day using electronic media for entertainment (eg computer games, TV, internet), particularly during daylight hours.
Australian Government National Physical Activity Guide for Australians [218, 219]
“Television viewing of more than two hours a day in childhood and adolescence is associated with poor fitness, smoking, raised cholesterol and being overweight in adulthood” [219]
Sedentary behaviour Guideline 3: Children younger than two years should not spend any time watching television or using other electronic media (DVDs, computer and other electronic games).
Australian Government Healthy Eating And Physical Activity For Early Childhood. [220]
Screen-time is not recommended for babies and children less than two years of age, particularly in the childcare setting, because it may: • reduce the amount of time they have for active play, social contact with others and chances for language development • affect the development of a full range of eye movement • reduce the length of time they can stay focused
These guidelines primarily refer to childcare settings.
Of interest that it splits sedentary time into:
Non-productive sedentary behaviour: • Watching television and DVDs for leisure. • Playing screen games such as handheld, video or computer games. • Being restrained for long periods of time, such as in a car seat, high chair, porta-cot or stroller. Productive sedentary behaviour: • Reading. • Quiet play, such as art and craft activities, drawing and puzzles. • Sleeping.
Guideline 4: For children two to five years of age, sitting and watching television and the use of other electronic
Australian Government Healthy Eating And Physical Activity For Early
In toddlers and pre-schoolers, long periods of screen-time have been associated with:
122

media should be limited to less than one hour per day.
Childhood. [220] • less active, outdoor and creative play time • an increased risk of being overweight • sub-optimal muscle and bone growth • unhealthy eating habits • poorer social skills • fewer opportunities to develop decision-making, self-awareness and self-regulation skills • slower development of language skills and short-term memory • television-viewing habits that may continue through childhood.
Guideline 5: Infants, toddlers, and preschoolers should not be sedentary, or kept inactive, for more than one hour at a time, with the exception of sleeping.
Australian Government Healthy Eating And Physical Activity For Early Childhood. [220]
“Sometimes children are left inactive for longer than they ought to be, in places such as high chairs, strollers or car seats. Young children are naturally curious and eager to explore, therefore active play opportunities need to be available whenever possible”
This is in addition to the screen time recommendation
Canada Inactive children and youth should increase the amount of time they currently spend being physically active by at least 30 minutes more per day and decrease the time they spend on TV, playing computer games and surfing the Internet -- by at least 30 minutes less per day.
… Over several months, children and youth should try to accumulate at least 90 minutes more physical activity per day and decrease by at least 90 minutes per day the amount of time spent on sedentary
Canada’s physical activity guide for children and youth
http://www.phacaspc.gc.ca/pauuap/paguide/child_youth/p artners/promo_tips.html
Not clear
123

activities such as watching videos and sitting at a computer.
USA Limit children's total media time (with entertainment media) to no more than 1 to 2 hours of quality programming per day
Discourage television viewing for children younger than 2 years, and encourage more interactive activities that will promote proper brain development, such as talking, playing, singing, and reading together
[36] None, other than reference to the existing prevalence: “the average child or adolescent watches an average of nearly 3 hours of television per day. This figure does not include time spent watching videotapes or playing video games.”
Also more recent recommendation [221] [222] Jordan and Robinson point out the published by US expert committee in 2008 dose response relationship [221] and recommendations from Institute between TV viewing time and of Medicine for two hours or less [222] obesity, and current high levels of
US children watching five hours TV per day [221].
Guideline 2. Toddlers [and preschoolers] should engage in at least 60 minutes and up to several hours per day of unstructured physical activity and should not be sedentary for more than 60 minutes at a time except when sleeping
National Association of Sport and Physical Education. [223]
No specific justification for 60 minutes
New Avoid inactivity: Many hours of [224] Zealand television/video viewing, playing on
computers and game consoles limits the development of the brain/body system as well as provide opportunities for extra food snacking. Set time limits and be selective.
France Limit the time spent in sedentary occupations, especially in children (time spent in front of the television and video games)
National Nutrition & Health Programme (PNNS) 20012005.
http://www.inpes.sante.fr/C FESBases/catalogue/pdf/5
No specific time limit on sedentary activity for children and adolescents.
124

“Try to reduce the time spent watching television, playing video games or using the computer. Suggest replacing 2 hours of TV time on one day of the week with physical activity”.
67.pdf
Le Guide nutrition des enfants et ados pour tous les parents.
http://www.mangerbouger.f r/IMG/pdf/0-18.pdf
Denmark “…parents may set limits to children’s inactivity, e.g. in connection with television and computer games as well as transport to and from school and spare time activities”
National Action Plan against Obesity
http://www.sst.dk/publ/publ 2003/National_action_plan .pdf
Finland TV viewing less than 2 hours/day [225]
125

Acknowledgement. The assistance and contributions of Dr Natalie Pearson are gratefully acknowledged.
i Full evidence is presented later in the report
ii The recommendations refer to sedentary behaviour (i.e., time spent sitting/lying in sedentary tasks and behaviours) and not to time spent sleeping.
126


![Impact of replacing sedentary behaviour with other …...high sedentary behaviour [17, 18]. There is some evidence that high sedentary behaviour is an independent risk factor for depression](https://img.pdfslide.net/doc/110x75/61355e13dfd10f4dd73c53f1/impact-of-replacing-sedentary-behaviour-with-other-high-sedentary-behaviour.jpg)