Embed Size (px)
Citation preview

Sediment dynamic processes and products on the shoreface of the East Frisian barrier-island
system, southern North Sea
Dissertation
zur
Erlangung des Doktorgrades der Naturwissenschaften
im Fachbereich 5
der Universität Bremen
vorgelegt von
Chang Soo SON
Bremen 2009

Tag des Kolloquiums: 29. October 2009
Gutachter:
Prof. Dr. Burghard W. Flemming
Prof. Dr. Dierk Hebbeln
Prüfer:
Prof. Dr T. Mörz
Prof. Dr. K. Huhn
Mitglieder:
Dr. C. Winter
der Universität:
A. Schwab

Table of Contents
Acknowledgements …..…………………………………………………………
Summary ……..………………………………….………………………………
List of figures …………………………………………………………………..
Section A: Concepts and outline ……………………………………….. 1
1 General introduction …………………………………………………………………….. 2
1.1 Rationale and objectives ……………………………………………………………… 2
1.2 Study area ……………………………………………………………………………… 5
1.3 Materials and methods ……………………………………………………………….. 7
1.3.1 Surface sediment samples …………………………………………………………… 7
1.3.2 Box-cores ………………………………………………………………………………… 8
1.3.3 Vibro-cores …………………………………………………………………………….. 9
1.3.4 High-resolution Multi-beam bathymetry and elevation measurements ………… 10
1.4 Outline of the manuscripts ………………………………………………………… 11
Section B: Submitted papers ………………………………………….. 14
2. Sedimentary facies of shoreface-connected sand ridges off the East Frisian barrier-island coast, southern North Sea: climatic controls and preservation potential
Abstract …………………………………………………………………………………… 15
2.1 Introduction ………………………………………………………………………….. 16
2.2 Physical settings ……………………………………………………………………. 17
2.3 Methods ……………………..………………………………………………………… 19
2.4 Results ………………………..……………………………………………………….. 20
2.4.1 Bedforms ……………………………………………………………………………… 20
2.4.2 Surfacial sediments …………………..……………………………………………… 22
2.4.3 Internal sedimentary structures …………………..………………………………… 24
2.5 Discussion ……………………………………………………………………...... 31
2.5.1 Sediment sources and dynamics ……………………………………………………. 31
2.5.2 Preservation potential and effective wave base …………………….……………… 33
2.6 Conclusions ………….……………………………………………………………….. 37
Acknowledgements ………………………………………………………………………. 37
3. Long-term changes in morphology and textural sediment characteristics in response to energy variations on shoreface-connected ridges off the East Frisian barrier-island coast, southern North Sea
Abstract ……………………………………………………………………………………. 38
3.1 Introduction …………………………………………………………………………… 39
3.2 Methods ……………………………………………………………………………… 41
3.3 Results ………………………………………………………………………………... 44
3.3.1 Textural sediment characteristics ……………………………………………………. 44
3.3.2 Comparison of texctural parameters from 1989 and 2005 ……………………….. 48
3.3.3 Changes in ridge topography between 2003 and 2007 …………………………. 53
3.4 Discussion …………………………………………………………………………… 54
3.4.1 Grain-size patterns ……………………………………………………………………. 54
3.4.2 The role of wave action ………………………………………………………………. 55
3.5 Conclusions ……………………………………………………………….………….. 59
Acknowledgements ……………………………………………………………………… 59
4. Sediment transport patterns on an ebb-tidal delta of the East Frisian barrier-island system, southern North Sea
Abstract ……………………………………………………………………………….. 60
4.1 Introduction …………………………………………………………………………… 63
4.2 Study area …………………………………………………………………………… 63
4.3 Materials and methods ………………………………………………………….…… 66
4.4 Results ………………………………………………………………..………………. 67
4.4.1 Morphological changes ……………………………………………………………….. 67
4.4.2 Spatial grain-size patterns ………………………………………………………….. .. 71
4.4.3 Internal sedimentary structures ………………………………………………..……. 74
4.5 Discussion …………………………………………………………………………….. 79
4.6 Conclusions …………………………………………………………………………… 82
Acknowledgements ………………………………………………………………………. 83
5. Summary discussion and outlook ………………………………………………. 84
References …………………………………………………………………………. 87

I
Acknowledgements
First of all, I wish to thank my family, especially my mother, for the sustaining support,
persisting confidence and unwaving trust.
I am very grateful to Prof. Dr. B.W. Flemming, who was a great mentor to me, for giving me
the opportunity to carry out this research at the Senckenberg Institute and, in particular, for
guiding me in the right direction, not only in terms of my scientific endeavors but also my
outlook on life in general.
Special acknowledgement for their critical and constructive comments and advice are due to
Dr. Alexander Bartholomä, Prof. Dr. Kerstin Schrottke, Dr. Adam Kubicki, Prof. Dr. Seung Soo
Chun, Dr. Tae Soo Chang and Qian Yu.
I also wish to thank the staff of the institute for their cooperation and assistance over the
years. Furthermore, the captain and crew of the research vessel ‘Senckenberg’ deserve my
special gratitude for their support during fieldwork even under antagonistic weather
conditions. Arnulf Möller, Astrid Raschke, Nicol Mahnken-Rötzer and Corinna Schollenberger
are thanked for their support in the laboratory. Last but not least, I wish to thank the technical
fellows at the institute, Maik Willsenack, Max Irmer and Norbert Schmitz who have assisted
me since I arrived.
This study was supported by a Korea Science and Engineering Foundation grant funded by
the Korean Government (M60-2004-000-10524).
Finally, I wish to dedicate this dissertation to my father who passed away much too early nine
years ago.
II
Summary
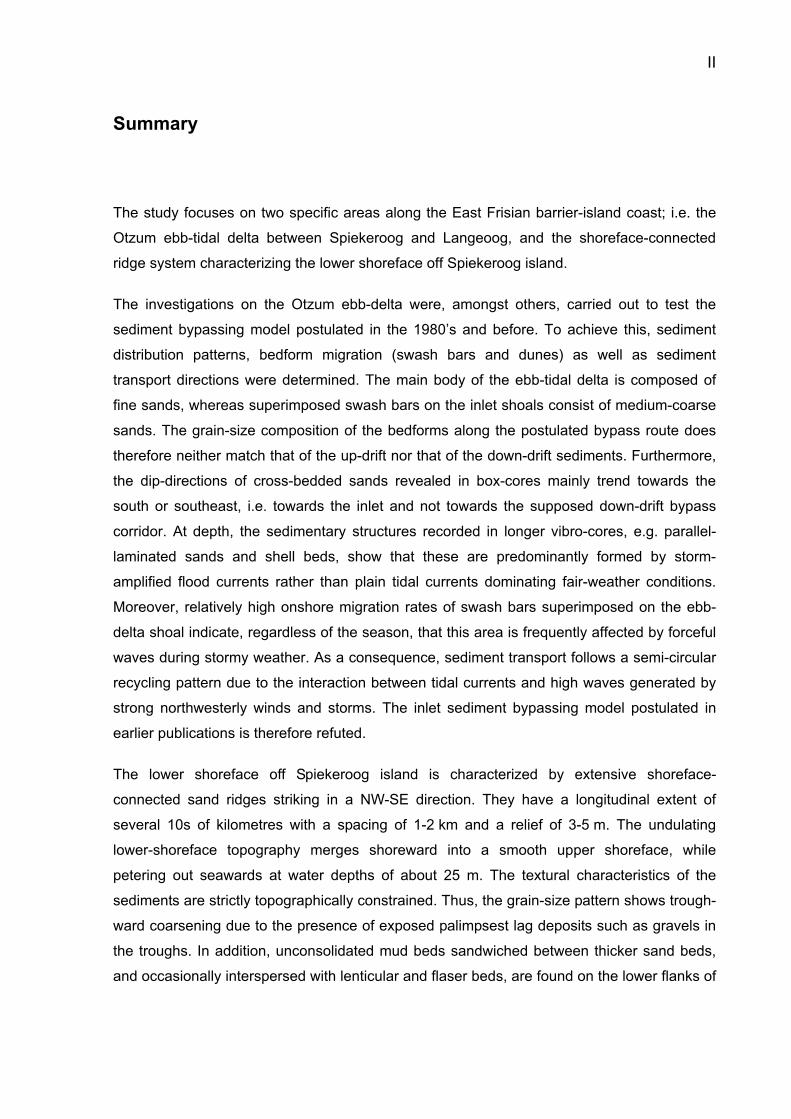
The study focuses on two specific areas along the East Frisian barrier-island coast; i.e. the
Otzum ebb-tidal delta between Spiekeroog and Langeoog, and the shoreface-connected
ridge system characterizing the lower shoreface off Spiekeroog island.
The investigations on the Otzum ebb-delta were, amongst others, carried out to test the
sediment bypassing model postulated in the 1980’s and before. To achieve this, sediment
distribution patterns, bedform migration (swash bars and dunes) as well as sediment
transport directions were determined. The main body of the ebb-tidal delta is composed of
fine sands, whereas superimposed swash bars on the inlet shoals consist of medium-coarse
sands. The grain-size composition of the bedforms along the postulated bypass route does
therefore neither match that of the up-drift nor that of the down-drift sediments. Furthermore,
the dip-directions of cross-bedded sands revealed in box-cores mainly trend towards the
south or southeast, i.e. towards the inlet and not towards the supposed down-drift bypass
corridor. At depth, the sedimentary structures recorded in longer vibro-cores, e.g. parallel-
laminated sands and shell beds, show that these are predominantly formed by storm-
amplified flood currents rather than plain tidal currents dominating fair-weather conditions.
Moreover, relatively high onshore migration rates of swash bars superimposed on the ebb-
delta shoal indicate, regardless of the season, that this area is frequently affected by forceful
waves during stormy weather. As a consequence, sediment transport follows a semi-circular
recycling pattern due to the interaction between tidal currents and high waves generated by
strong northwesterly winds and storms. The inlet sediment bypassing model postulated in
earlier publications is therefore refuted.
The lower shoreface off Spiekeroog island is characterized by extensive shoreface-
connected sand ridges striking in a NW-SE direction. They have a longitudinal extent of
several 10s of kilometres with a spacing of 1-2 km and a relief of 3-5 m. The undulating
lower-shoreface topography merges shoreward into a smooth upper shoreface, while
petering out seawards at water depths of about 25 m. The textural characteristics of the
sediments are strictly topographically constrained. Thus, the grain-size pattern shows trough-
ward coarsening due to the presence of exposed palimpsest lag deposits such as gravels in
the troughs. In addition, unconsolidated mud beds sandwiched between thicker sand beds,
and occasionally interspersed with lenticular and flaser beds, are found on the lower flanks of
III
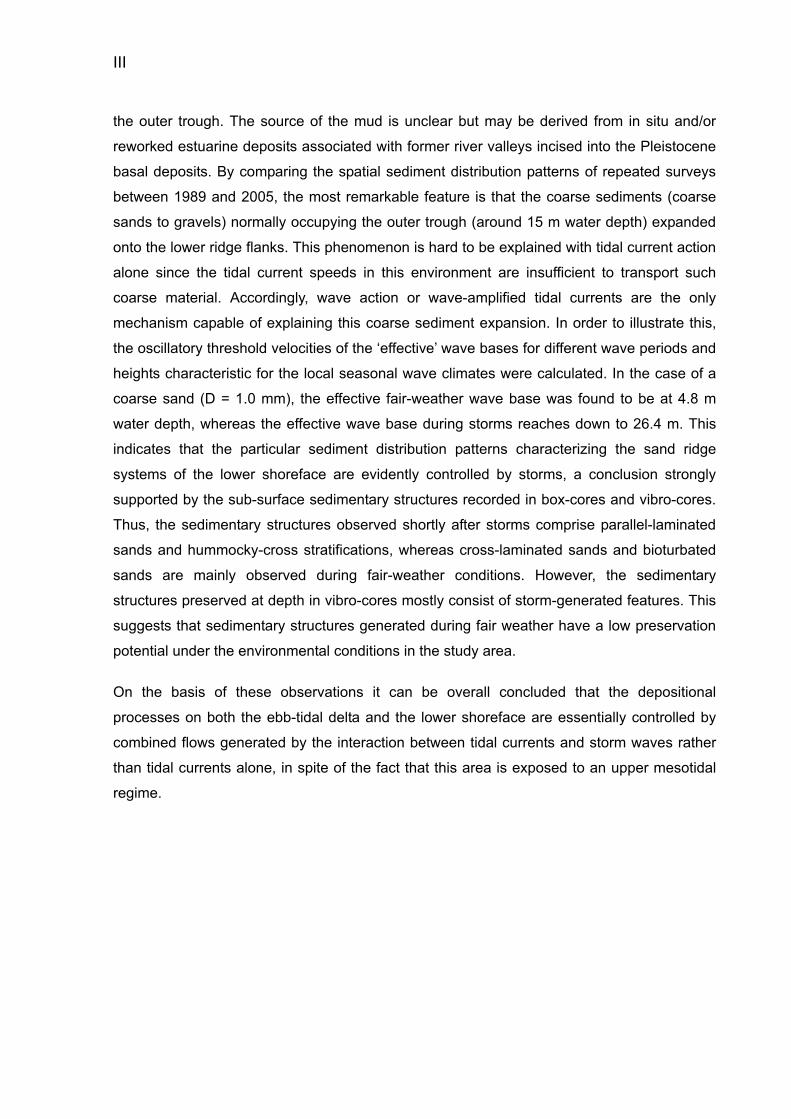
the outer trough. The source of the mud is unclear but may be derived from in situ and/or
reworked estuarine deposits associated with former river valleys incised into the Pleistocene
basal deposits. By comparing the spatial sediment distribution patterns of repeated surveys
between 1989 and 2005, the most remarkable feature is that the coarse sediments (coarse
sands to gravels) normally occupying the outer trough (around 15 m water depth) expanded
onto the lower ridge flanks. This phenomenon is hard to be explained with tidal current action
alone since the tidal current speeds in this environment are insufficient to transport such
coarse material. Accordingly, wave action or wave-amplified tidal currents are the only
mechanism capable of explaining this coarse sediment expansion. In order to illustrate this,
the oscillatory threshold velocities of the ‘effective’ wave bases for different wave periods and
heights characteristic for the local seasonal wave climates were calculated. In the case of a
coarse sand (D = 1.0 mm), the effective fair-weather wave base was found to be at 4.8 m
water depth, whereas the effective wave base during storms reaches down to 26.4 m. This
indicates that the particular sediment distribution patterns characterizing the sand ridge
systems of the lower shoreface are evidently controlled by storms, a conclusion strongly
supported by the sub-surface sedimentary structures recorded in box-cores and vibro-cores.
Thus, the sedimentary structures observed shortly after storms comprise parallel-laminated
sands and hummocky-cross stratifications, whereas cross-laminated sands and bioturbated
sands are mainly observed during fair-weather conditions. However, the sedimentary
structures preserved at depth in vibro-cores mostly consist of storm-generated features. This
suggests that sedimentary structures generated during fair weather have a low preservation
potential under the environmental conditions in the study area.
On the basis of these observations it can be overall concluded that the depositional
processes on both the ebb-tidal delta and the lower shoreface are essentially controlled by
combined flows generated by the interaction between tidal currents and storm waves rather
than tidal currents alone, in spite of the fact that this area is exposed to an upper mesotidal
regime.

IV
List of figures
Figure 1.1 Transgressive (supply<<deficit) barrier island evolution in response to sea-level
rise. (modified after Flemming, 2002) .……………………………………………………………. 2
Figure 1.2 Location map of the study areas along the East Frisian barrier-island coast
………………………………………………………………………………………………….……… 5
Figure 1.3 Surface sediment acquisition and analysis ………………………………………… 7
Figure 1.4 The processes of dealing with Reineck box-core samples ………………..……… 9
Figure 1.5 Recovery and processing procedures for vibro-cores ……………………..……… 9
Figure 1.6 Bathymetric seabed surveying by multi-beam echo-sounding (A), and levelling by
means of a theodolite (B) ……………………………………………….………………………. 10
Figure 2.1 Locality map showing the study area .................................................... 18
Figure 2.2 Multi-beam image of the study area with location of transects and sampling
stations …………………………………………………………………………………………. 19
Figure 2.3 Bed forms at different positions on the ridges …………………………………….. 21
Figure 2.4 Mean grain size and sorting trends across the ridges …………………………… 23
Figure 2.5 Description of sedimentary structures observed in box-core peels …………….. 25
Figure 2.6 Epoxy peels of box-cores from different parts of the ridge and trough systems
………………………………………………………………………………………………….. 27
Figure 2.7 Epoxy peels of box-cores from different parts of the ridge and trough systems
(continued) ………………………………………………………………………………………….. 28
Figure 2.8 Storm-generated sedimentary structures ………………………………………… 30
Figure 2.9 Sedimentary structures recorded in vibro-cores (modified after Antia, 1995)
…………………………………………………………………………………………………… 35
V
Figure 2.10 Depths of effective wave-bases in fine sand for typical storm and fair-weather
situations in the study area (after Flemming, 2005) ………………………………………… 36
Figure 3.1 Locality map of the wider study area off Spiekeroog Island ……………………… 40
Figure 3.2 Diagram of significant wave height (Hsig) versus significant wave period (Tpeak) at
the FINO wave buoy …………………………………………………………………………… 42
Figure 3.3 Contour map of mean grain sizes ………………………………………………… 45
Figure 3.4 Spatial distribution patterns of textural parameters ………………………………. 46
Figure 3.5 Bivariate scatter diagrams of textural parameters ………………………………… 47
Figure 3.6 Variations in mean grain-size distribution between 1989 and 2005 …………… 48
Figure 3.7 Comparison of spatial patterns in textural parameters …………………………… 49
Figure 3.8 Comparison of textural parameters ………………………………………………… 50
Figure 3.9 Variations in the distribution patterns of 1.0-phi size fractions (wt %) in the course
of 15 years …………………………………………………………………………………….. 51
Figure 3.10 Comparison of bathymetric maps (upper panel) and depth profiles (lower panels)
of 2003 and 2007 ………………………………………………………………………………….. 52
Figure 3.11 Conceptual process model illustrating the relationship between selected wave
parameters (cf.Fig. 3.2) and the water depths associated with the critical oscillatory velocities
(effective wave bases) for grain sizes of 1.0, 0.35, and 0.18 mm (after Flemming, 2005)
………………………………………………………………………………………………......... 56
Figure 4.1 Location map of the study area …………………………….……………………….. 64
Figure 4.2 Storm surge information for the southern North Sea. Upper panel: storm surge
heights measured at the Norderney water-level gauge since 1900 (NLWKN, 2006); lower
panel: predicted maximum water levels associated with a northwesterly storm surge (after
Bork et al., 2005) ………………………………………………………………………………….. 65

VI
Figure 4.3 Ebb-tidal delta growth and deepening of the Otzum inlet between 1841 (A) and
1860 (B) due to a substantial increase in the tidal catchment area (after Flemming, 1991)
……………………………………………………………………………………………………. 68
Figure 4.4 Topographic and associated volume changes of the ebb-tidal delta in the course of
the last 50 years …………………………………………………………………………………… 69
Figure 4.5 Elevation changes along an east-west transect on the ebb-tidal shoal in the
course of 10 months ………………………………………………………………………………. 70
Figure 4.6 Photographic documentation of major features on the ebb-tidal shoal …………. 71
Figure 4.7 Distribution of mean grain sizes on the inlet/ebb-tidal delta system ………..…… 72
Figure 4.8 Distribution patterns of individual grain-size fractions (wt %) …………………….. 73
Figure 4.9 Comparison of textural parameters ………………………………………………… 74
Figure 4.10 Comparison of the spatial patterns produced by sorting and skewness ………. 74
Figure 4.11 Seasonal sedimentary structures in selected short box-cores from the ebb-tidal
shoal (Robben plate) ……………………………………………………………………………. 76
Figure 4.12 Dip directions of large-scale cross-beds in intertidal sediments and orientation of
flow-transverse bedforms …………………………………………………………………………. 77
Figure 4.13 Sedimentary structures in vibro-cores ……………………………………………. 78
Figure 4.14 Schematic sediment transport routes …………………………………………….. 80

1
Section A
Concepts and outline
2
1 General introduction
1.1 Rationale and objectives
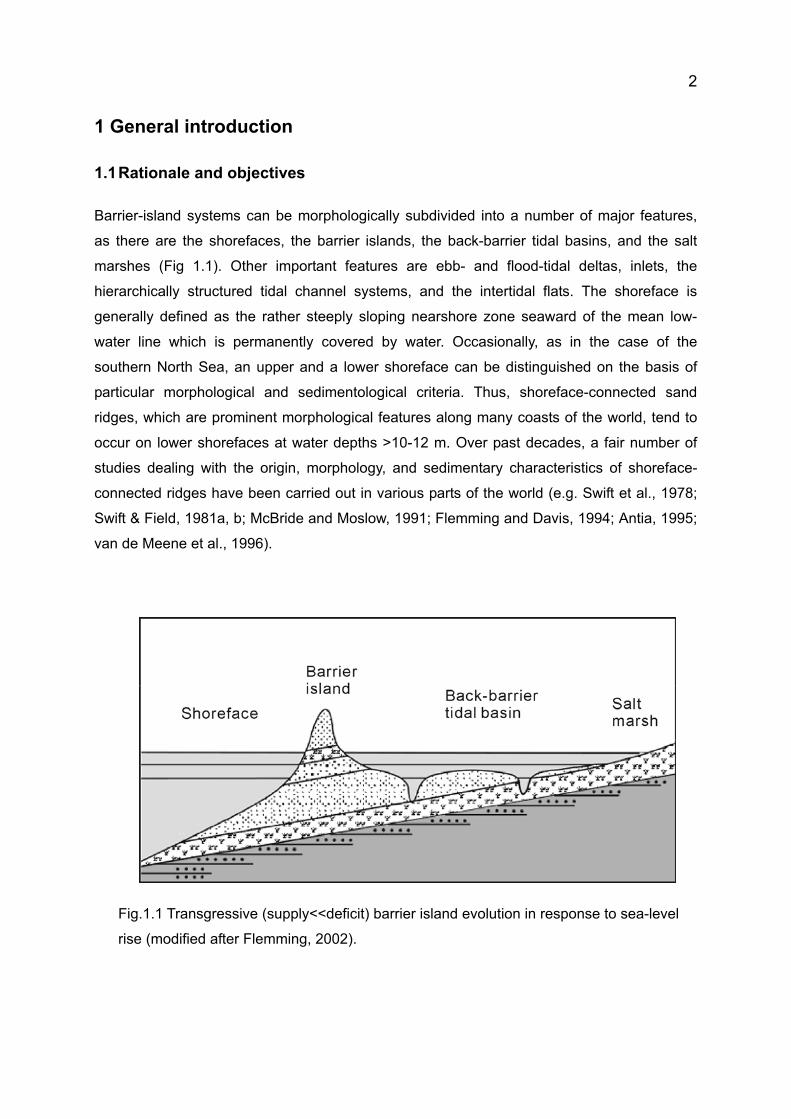
Barrier-island systems can be morphologically subdivided into a number of major features,
as there are the shorefaces, the barrier islands, the back-barrier tidal basins, and the salt
marshes (Fig 1.1). Other important features are ebb- and flood-tidal deltas, inlets, the
hierarchically structured tidal channel systems, and the intertidal flats. The shoreface is
generally defined as the rather steeply sloping nearshore zone seaward of the mean low-
water line which is permanently covered by water. Occasionally, as in the case of the
southern North Sea, an upper and a lower shoreface can be distinguished on the basis of
particular morphological and sedimentological criteria. Thus, shoreface-connected sand
ridges, which are prominent morphological features along many coasts of the world, tend to
occur on lower shorefaces at water depths >10-12 m. Over past decades, a fair number of
studies dealing with the origin, morphology, and sedimentary characteristics of shoreface-
connected ridges have been carried out in various parts of the world (e.g. Swift et al., 1978;
Swift & Field, 1981a, b; McBride and Moslow, 1991; Flemming and Davis, 1994; Antia, 1995;
van de Meene et al., 1996).
Fig.1.1 Transgressive (supply<<deficit) barrier island evolution in response to sea-level
rise (modified after Flemming, 2002).

3
Concurrently, morphodynamic and sediment transport studies have been carried out (e.g.
Niedoroda et al., 1984; Wright et al., 1991; Walgreen et al.; 2002; Swart et al., 2008). Among
the controlling factors, the impact of storm waves on sediment reworking processes is
thought to be one of the most important mechanisms (Kumar and Sanders, 1976; Bose and
Das, 1986; Calvete et al., 2001). However, the characteristics of storm-generated
sedimentary facies are still not fully understood because of the inherent difficulty of collecting
appropriate data during high-energy conditions. In spite of this, many valiant attempts have
been undertaken to identify storm effects in short box-cores taken during fair-weather
conditions, the interpretations, however, having remained conjectural to this day (e.g. Duke,
1991). In addition, the genesis of the ridge and trough morphology is still largely obscure,
although some modelling success has recently been reported (e.g. de swart, 2008). For
these reasons, shorefaces continue to be of interest world-wide, the logistical accessibility of
the East Frisian coast having been an important motivator for the present study.
Another morphologically pronounced feature of barrier-island coasts are the large ebb-deltas
fronting the tidal inlets. Although it is generally accepted that both ebb- and flood deltas are
formed by the scouring effects of tidal currents which excavate the inlets and dump the
sediment on their seaward and landward sides, their morphodynamic behaviour and, in
particular, the sediment movement on and around the tidal deltas have remained an issue of
continued debate (e.g. Hayes, 1975; FitzGerald et al., 1984; Nummedal and Penland, 1981;
Hicks and Hume, 1997; Burningham and French, 2006; Cheung et al., 2007). Most of these
studies have adopted the sediment bypassing theory, by which sediment supplied by
alongshore transport is supposed to cross the ebb-deltas towards the down-drift shores, to
continue down the coast. This theory is mostly based on deductive reasoning where oblique
wave incidence is assumed to generate longshore currents and hence alongshore sediment
transport. This has been supported by the apparent migration of subaerially exposed swash
bars inferred from air photo time series (not internal structures). However, especially in the
case of the East Frisian coast, this bypassing theory has been questioned (e.g. Ehlers, 1984;
Hanisch, 1981; Flemming & Davis, 1994; Antia, 1993) because in none of the cited cases the
inferred transport routes had actually been validated by groundtruthing, e.g. grain-size
patterns and internal sedimentary structures. Again, the logistical accessibility of the ebb
deltas along the East Frisian coast was instrumental in having a closer look at them.
Accordingly, the main objectives of this study were, to describe sediment distribution patterns,
document internal sedimentary structures formed during different weather situations, and
ascertain the main factors controlling these phenomena along the East Frisian barrier-island

4
coast, both in a ridge and trough system of the lower shoreface and on the Otzum ebb-tidal
delta located between the islands of Langeoog and Spiekeroog. In the latter case, the data
were also to be used to reconstruct the main sediment transport pathways on the ebb delta in
order to either confirm or reject the sediment bypassing model.

5
1.2 Study area
The study focuses on the shoreface off Spiekeroog island and the Otzum ebb-tidal delta
situated between the islands of Langeoog and Spiekeroog, i.e. between the third- and
second-last islands (counted from the west) of the East Frisian barrier island chain located
along the German coast of the southern North Sea (Fig 1.2). The study areas are
characterised by semi-diurnal tides with a mean tidal range exceeding 2 m and a maximum
range of about 2.6 m.
Study area A is located on the lower shoreface off Spiekeroog island. This region is
sculptured into a series of NW-SE striking ridges and troughs (shoreface-connected ridge
systems) which have a spacing of 1-2 km and a relief of 3-5 m. Peak current velocities on the
shoreface during calm weather range from 30 cm/s at a water depth of 3 m, increasing to 60
cm/s at 22 m (Antia, 1993). However, the currents differ in strength and orientation as a
function of tidal phase and location relative to the topography. Thus, at a height of 1 m above
the ridge crests and seaward flanks, peak flood currents reach 40 cm/s and 45 cm/s
respectively, whereas peak ebb current velocities reach 36 cm/s and 40 cm/s respectively. In
the troughs, on the other hand, the ebb current dominates with peak velocities of 36 cm/s, as
opposed to 30 cm/s for the flood current (Flemming & Davis, 1994). Corresponding
measurements during storms are lacking. The significant near-shore wave height and period
(at 10 m water depth) averaged over the year as a whole are 1.5 m and 6 s respectively. In
the winter months, 10-30 cumulative days of storm episodes occur annually (Dette, 1977),
typical mean wave heights and periods increasing to 2.5 m and 8 s respectively.
Fig. 1.2 Location map of the study areas along the East Frisian barrier-island coast.

6
Study area B comprises the ca. 20 km2 large ebb-delta complex located north of the Otzum
inlet which drains a tidal prism of around 114 x 106 m3 (Postma 1982). The tidal wave
approaches from the west and rotates counter-clockwise around an amphidrome located in
the central North Sea. Maximum current velocities in the inlet during calm weather reach
velocities of 0.7-1.3 m s-1 (Davis and Flemming, 1995). In general, the ebb tidal cycle is of
shorter duration and the current hence slightly stronger than during the flooding tide. An
analysis of local wind data reveals that a two-fold increase in the frequency and a fourfold
increase in the duration of winds exceeding 6 Bft has occurred in the German Bight since
1989, a situation that has persisted to the present day. As shown by Tilch (2003), strong
winds of 6-7 Bft are not only restricted to the stormy winter months, but can occur throughout
the year.
7
1.3 Materials and methods
1.3.1 Surface sediment samples
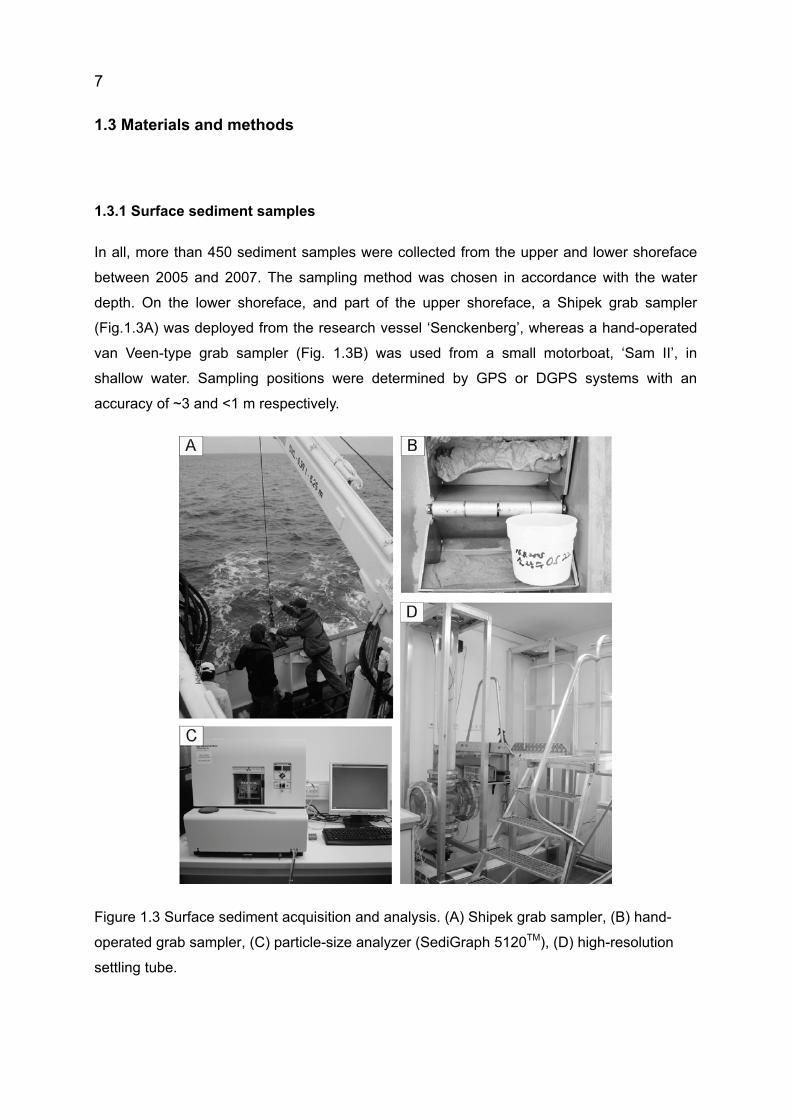
In all, more than 450 sediment samples were collected from the upper and lower shoreface
between 2005 and 2007. The sampling method was chosen in accordance with the water
depth. On the lower shoreface, and part of the upper shoreface, a Shipek grab sampler
(Fig.1.3A) was deployed from the research vessel ‘Senckenberg’, whereas a hand-operated
van Veen-type grab sampler (Fig. 1.3B) was used from a small motorboat, ‘Sam II’, in
shallow water. Sampling positions were determined by GPS or DGPS systems with an
accuracy of ~3 and <1 m respectively.
Figure 1.3 Surface sediment acquisition and analysis. (A) Shipek grab sampler, (B) hand-
operated grab sampler, (C) particle-size analyzer (SediGraph 5120TM), (D) high-resolution
settling tube.

8
The sediment samples were subsequently processed in the laboratory according to standard
procedures (Müller, 1967; Carver, 1971; Folk, 1984), e.g. desalination by means of dialysis,
separation of coarse (>63 �m) and fine fractions (<63 �m) by wet sieving, removal of
bioclastic carbonates by acid digestion, removal of organic matter by treatment with
hydrogen peroxide. The dispersed mud fractions were analysed with a ‘SediGraph 5120’
particle-size analyzer (Fig. 1.3C), contents below 10 % being ignored. The sand fractions
were analysed by a high-resolution settling tube (Fig. 1.3D), equivalent grain-size parameters
such as mean, sorting and skewness being calculated by both moment and percentile
statistics.
1.3.2 Box-cores
Over 170 box-cores were collected in the two study areas, individual sampling stations being
repeated in winter and summer seasons, as well as in fair weather and immediately after
storms. For this purpose a Reineck box-corer was used in areas over 5 m water depth,
whereas geo-referenced hand-operated box-cores were taken in areas exposed during low
tide (e.g. ebb-tidal shoals). The cores were kept for several weeks in cold storage in order to
drain excess porewater from the core sediments. Subsequently, the box-cores were opened
and treated with a resin-hardener mixture to produce resin peels for a detailed assessment of
internal sedimentary structures. The method of producing resin peels differed for Reineck
box-cores and hand-opertated box-cores, the former being cast and dried at room
temperature (15 to 25°C) using the pouring method of Reineck (1970) (Fig. 1.4), whereas the
latter were first dried at 80°C in an oven before being treated with resin and then returned to
the oven for curing at 100°C overnight.
9
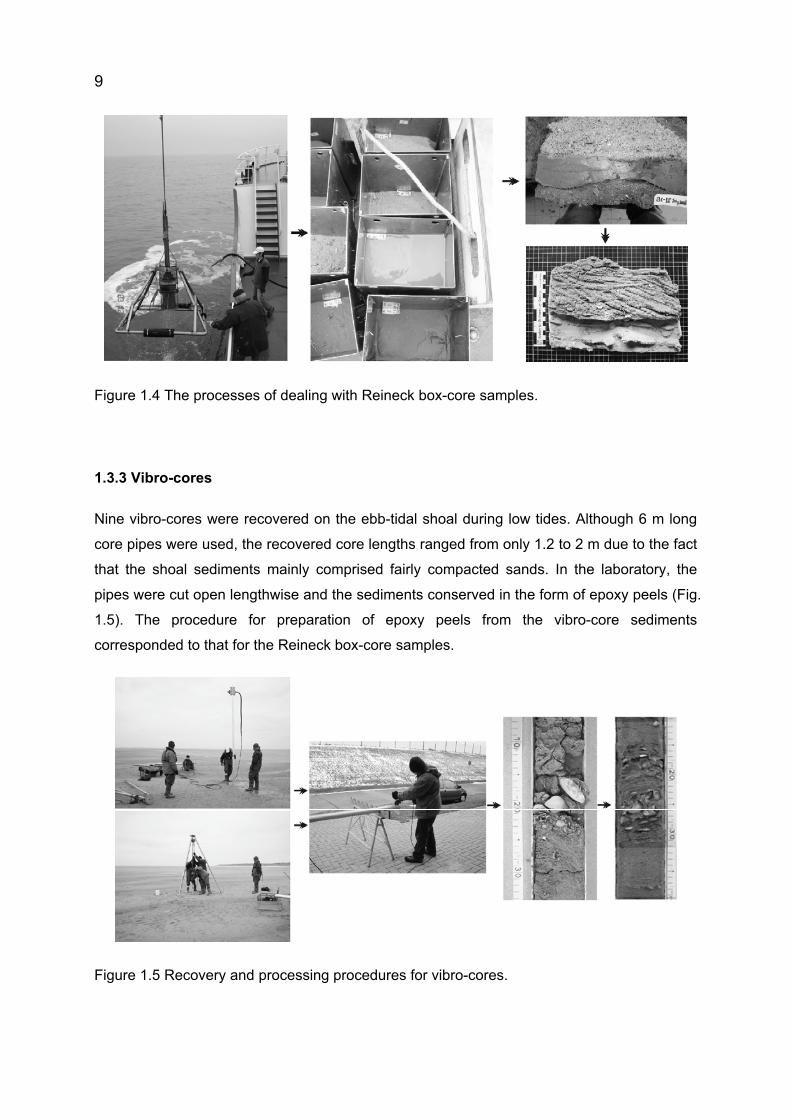
Figure 1.4 The processes of dealing with Reineck box-core samples.
1.3.3 Vibro-cores
Nine vibro-cores were recovered on the ebb-tidal shoal during low tides. Although 6 m long
core pipes were used, the recovered core lengths ranged from only 1.2 to 2 m due to the fact
that the shoal sediments mainly comprised fairly compacted sands. In the laboratory, the
pipes were cut open lengthwise and the sediments conserved in the form of epoxy peels (Fig.
1.5). The procedure for preparation of epoxy peels from the vibro-core sediments
corresponded to that for the Reineck box-core samples.
Figure 1.5 Recovery and processing procedures for vibro-cores.
10
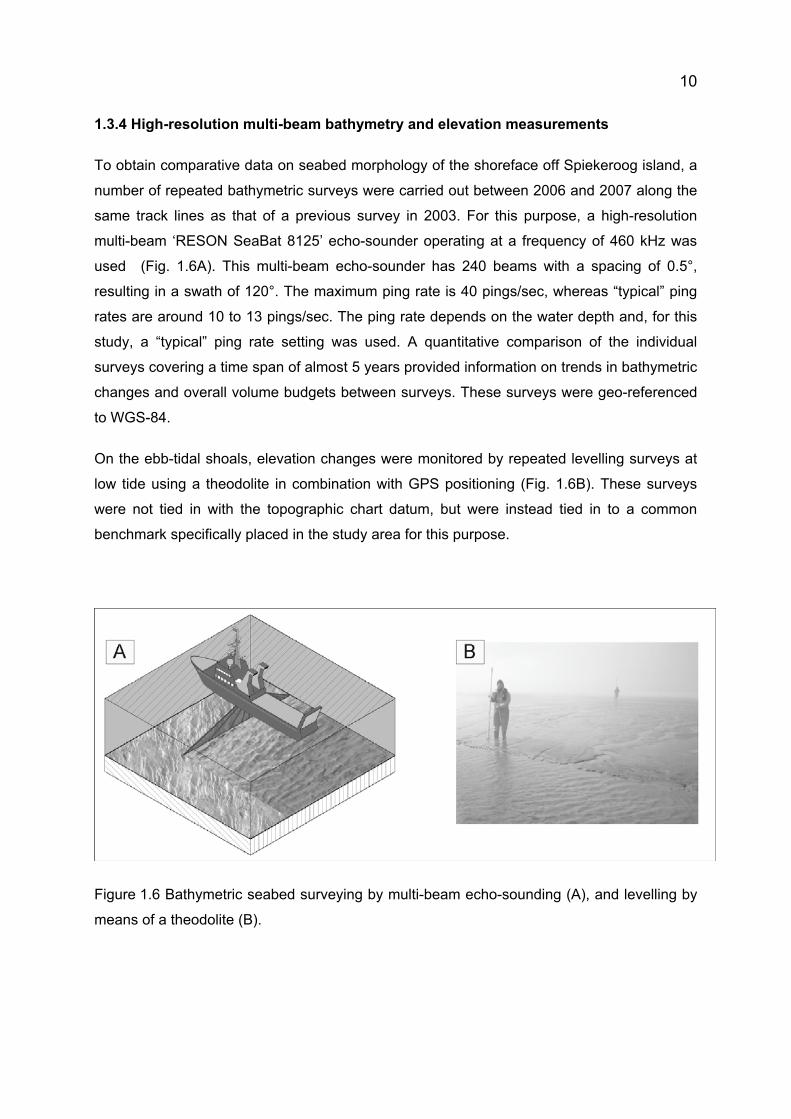
1.3.4 High-resolution multi-beam bathymetry and elevation measurements
To obtain comparative data on seabed morphology of the shoreface off Spiekeroog island, a
number of repeated bathymetric surveys were carried out between 2006 and 2007 along the
same track lines as that of a previous survey in 2003. For this purpose, a high-resolution
multi-beam ‘RESON SeaBat 8125’ echo-sounder operating at a frequency of 460 kHz was
used (Fig. 1.6A). This multi-beam echo-sounder has 240 beams with a spacing of 0.5°,
resulting in a swath of 120°. The maximum ping rate is 40 pings/sec, whereas “typical” ping
rates are around 10 to 13 pings/sec. The ping rate depends on the water depth and, for this
study, a “typical” ping rate setting was used. A quantitative comparison of the individual
surveys covering a time span of almost 5 years provided information on trends in bathymetric
changes and overall volume budgets between surveys. These surveys were geo-referenced
to WGS-84.
On the ebb-tidal shoals, elevation changes were monitored by repeated levelling surveys at
low tide using a theodolite in combination with GPS positioning (Fig. 1.6B). These surveys
were not tied in with the topographic chart datum, but were instead tied in to a common
benchmark specifically placed in the study area for this purpose.
Figure 1.6 Bathymetric seabed surveying by multi-beam echo-sounding (A), and levelling by
means of a theodolite (B).

11
1.4 Outline of the manuscripts
This thesis comprises three manuscripts, all submitted to SCI journals. In the meantime one
paper has been accepted for publication, whereas the other two are being reviewed.
Chapter 2
Sedimentary facies of shoreface-connected sand ridges off the East Frisian barrier-island coast, southern North Sea: climatic controls and preservation potential
Chang Soo SON, Burghard W. FLEMMING & Tae Soo CHANG
Accepted for publication in the International Association of Sedimentologists Special Publication Series (Proceedings of Session X, IAS Congress, Fukuoka, Japan, 2007)
Sedimentary structures from box-cores on the shoreface-connected ridges were analysed in
relation to different weather conditions and seasons (e.g. during fair-weather conditions and
shortly after storms). In fair-weather conditions, large-scale cross-bedding and strong
bioturbation are predominant, whereas most of these structures are replaced by low-angle
laminations, upper-flow-regime plane beds and hummocky cross-stratifications during storms.
According to vibro-core data, the dominantly preserved physical sedimentary structures are
related to storm events, although occasional fair-weather structures may also occur.
12
Chapter 3
Long-term changes in morphology and textural sediment characteristics in response to energy variations on shoreface-connected ridges off the EastFrisian barrier-island coast, southern North Sea
Chang Soo SON, Burghard W. FLEMMING and Alexander BARTHOLOMÄ
Submitted to Marine Geology (Special Publication of TIDALITES 2008, Qingdao, China)
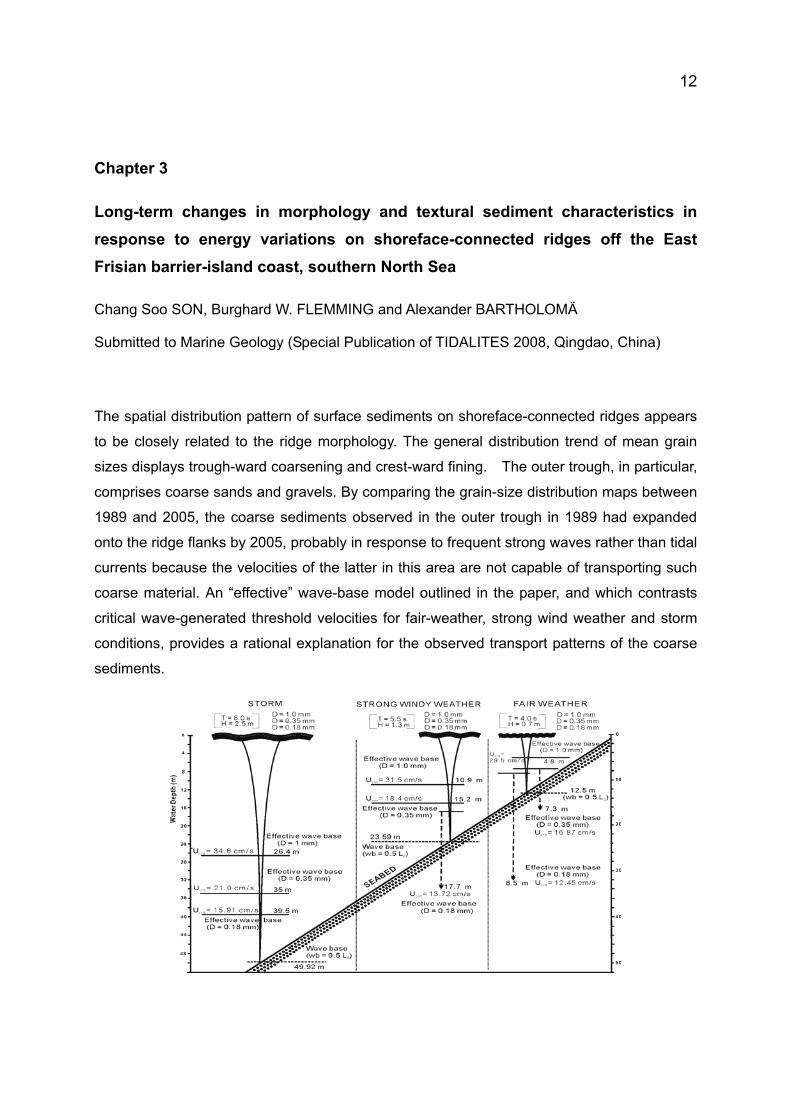
The spatial distribution pattern of surface sediments on shoreface-connected ridges appears
to be closely related to the ridge morphology. The general distribution trend of mean grain
sizes displays trough-ward coarsening and crest-ward fining. The outer trough, in particular,
comprises coarse sands and gravels. By comparing the grain-size distribution maps between
1989 and 2005, the coarse sediments observed in the outer trough in 1989 had expanded
onto the ridge flanks by 2005, probably in response to frequent strong waves rather than tidal
currents because the velocities of the latter in this area are not capable of transporting such
coarse material. An “effective” wave-base model outlined in the paper, and which contrasts
critical wave-generated threshold velocities for fair-weather, strong wind weather and storm
conditions, provides a rational explanation for the observed transport patterns of the coarse
sediments.

13
Chapter 4
Sediment transport patterns on an ebb-tidal delta of the East Frisian barrier-island system, southern North Sea.
Chang Soo SON, Burghard W. FLEMMING and Alexander BARTHOLOMÄ
Submitted to Geo-Marine Letters (in review)
A schematic sediment transport pattern in the Otzum inlet and on the eastern ebb-tidal delta
shoal, derived from sediment distribution patterns and the dip directions of cross-beds,
mitigates strongly against a previously suggested inlet by-passing model. Instead, the
deduced sediment transport pathways follow semi-circular recycling patterns resulting from
the interaction of tidal currents and northwesterly storm waves. Storm influence is also
documented by onshore migrating, coarse-grained swash bars, which are superimposed on
the ebb-delta shoal, and the high preservation potential of storm-generated internal
sedimentary structures. These observations clearly support a sediment recirculation model
and refute the inlet by-passing model.
14
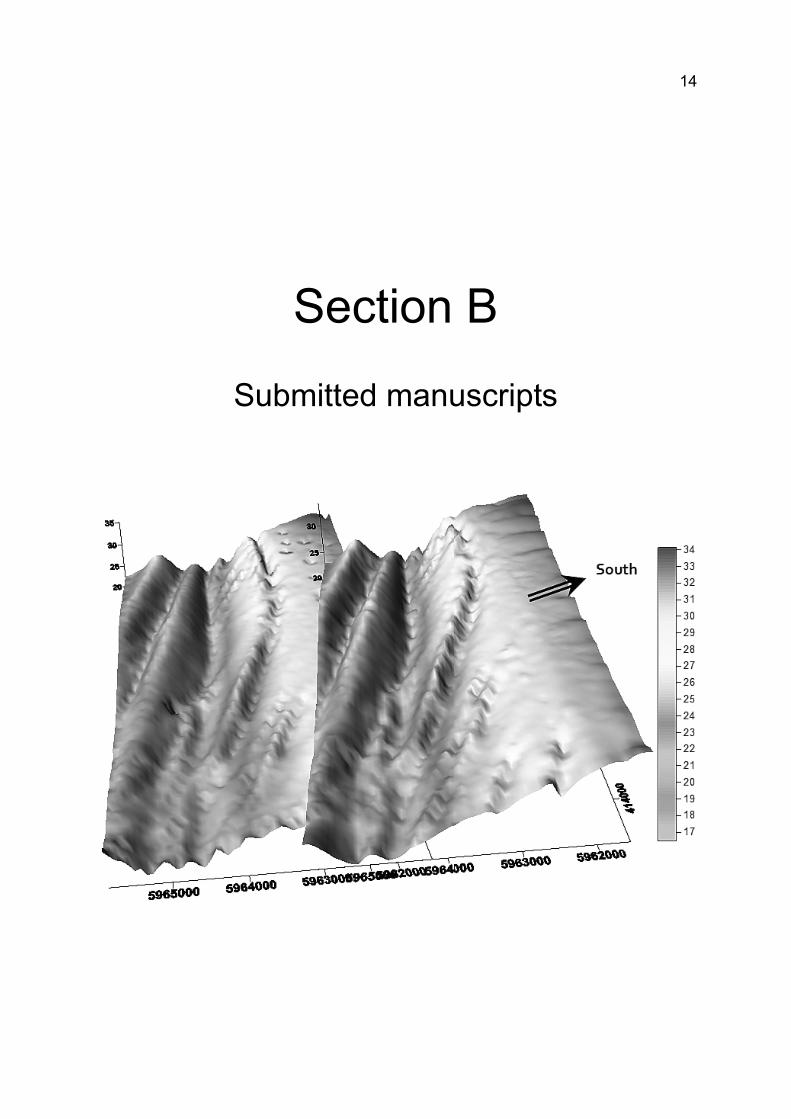
Section B
Submitted manuscripts

15
2. Sedimentary facies of shoreface-connected sand ridges off the East
Frisian barrier-island coast, southern North Sea: climatic controls and
preservation potential
Chang Soo SON*, Burghard W. FLEMMING* & Tae Soo CHANG†
Abstract
The sedimentary facies characterizing the shoreface-connected ridges off the East Frisian
barrier-island coast, southern North Sea, were analyzed by means of high-resolution multi-
beam bathymetry, sediment characteristics, and internal sedimentary structures derived from
vibro-cores and box-cores. Particular attention was given to the contrasting sedimentary
characteristics associated with seasonal storm and calm-weather situations, and how this
was reflected in the preservation potential of the respective deposits. The internal
sedimentary structures of the ridges are clearly related to the local wave climate and tidal
regime. Under calm-weather conditions (summer months), partly bioturbated ripple cross-
laminated sands dominate the deposits. In addition, tide-generated features such as small
dune cross-stratification, herring-bone crossbeds, and flaser structures can be recognised.
Particularly on the inner ridges, most of the physical structures in the upper sediment layer
are strongly bioturbated by burrowing sea urchins (Echinocardium cordatum) and polychaete
worms such as Lanice conchilega and Arenicola marina, whereas towards the outer ridges,
the rate of bioturbation decreases rapidly, bi-directional large-scale crossbeds and climbing-
ripple crossbeds being the dominant sedimentary structures. During the storm period
(autumn – spring), however, most of these structures are replaced by hummocky cross-
stratifications, low-angle laminations, and upper-flow-regime plane beds indicative of storm
events. According to vibro-core data, most of the preserved down-core sedimentary
structures reflect storm influence, although a few structures possibly relate to fair-weather
conditions, e.g. occasionally preserved bioturbated beds and ripple crossbedding. This may
be due to a change in the effective wave-base in response to changing weather conditions
16
during the waning storm phase rather than to a prolonged fair-weather period. Modern facies
models based solely on short box-cores must be applied with great caution to the
interpretation of the rock record.
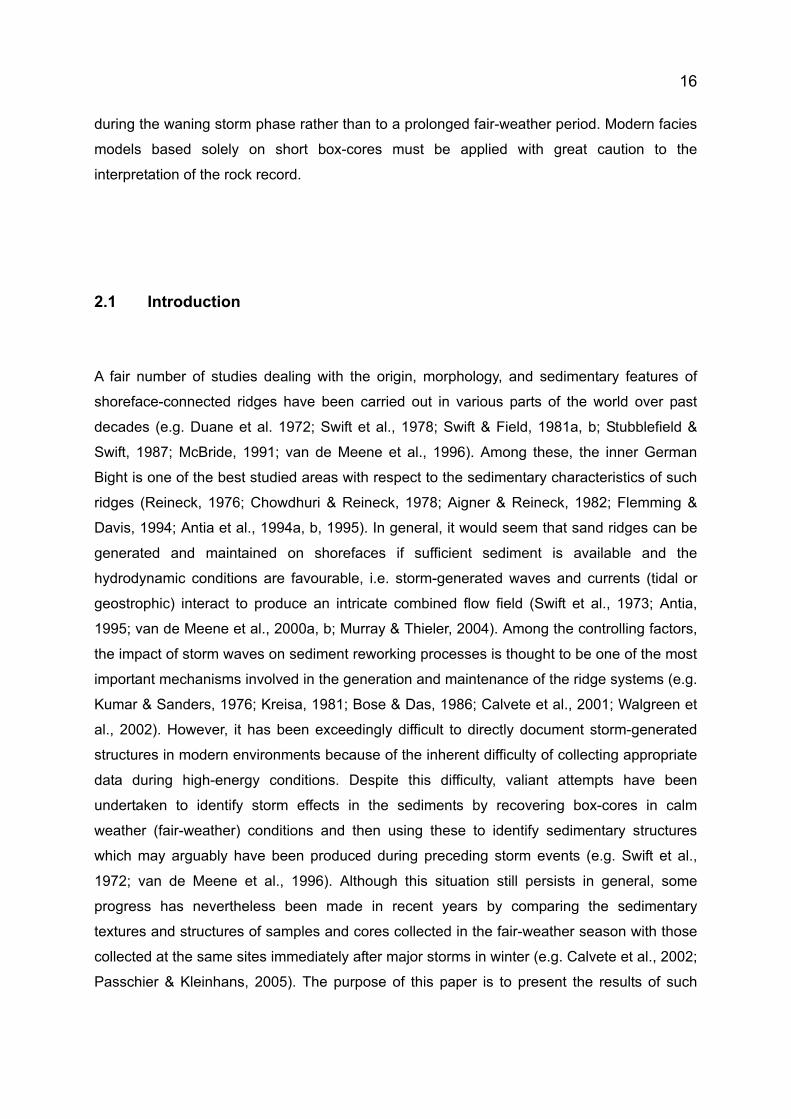
2.1 Introduction
A fair number of studies dealing with the origin, morphology, and sedimentary features of
shoreface-connected ridges have been carried out in various parts of the world over past
decades (e.g. Duane et al. 1972; Swift et al., 1978; Swift & Field, 1981a, b; Stubblefield &
Swift, 1987; McBride, 1991; van de Meene et al., 1996). Among these, the inner German
Bight is one of the best studied areas with respect to the sedimentary characteristics of such
ridges (Reineck, 1976; Chowdhuri & Reineck, 1978; Aigner & Reineck, 1982; Flemming &
Davis, 1994; Antia et al., 1994a, b, 1995). In general, it would seem that sand ridges can be
generated and maintained on shorefaces if sufficient sediment is available and the
hydrodynamic conditions are favourable, i.e. storm-generated waves and currents (tidal or
geostrophic) interact to produce an intricate combined flow field (Swift et al., 1973; Antia,
1995; van de Meene et al., 2000a, b; Murray & Thieler, 2004). Among the controlling factors,
the impact of storm waves on sediment reworking processes is thought to be one of the most
important mechanisms involved in the generation and maintenance of the ridge systems (e.g.
Kumar & Sanders, 1976; Kreisa, 1981; Bose & Das, 1986; Calvete et al., 2001; Walgreen et
al., 2002). However, it has been exceedingly difficult to directly document storm-generated
structures in modern environments because of the inherent difficulty of collecting appropriate
data during high-energy conditions. Despite this difficulty, valiant attempts have been
undertaken to identify storm effects in the sediments by recovering box-cores in calm
weather (fair-weather) conditions and then using these to identify sedimentary structures
which may arguably have been produced during preceding storm events (e.g. Swift et al.,
1972; van de Meene et al., 1996). Although this situation still persists in general, some
progress has nevertheless been made in recent years by comparing the sedimentary
textures and structures of samples and cores collected in the fair-weather season with those
collected at the same sites immediately after major storms in winter (e.g. Calvete et al., 2002;
Passchier & Kleinhans, 2005). The purpose of this paper is to present the results of such
17
seasonal investigations along the East Frisian barrier-island coast which is characterized by
an extensive shoreface-connected ridge system. The differences between fair-weather and
storm-generated sedimentary structures will be highlighted and their preservation potential
under the hydrodynamic regime in the study area discussed.
2.2 Physical settings
The study focuses on the shoreface of Spiekeroog Island (Fig. 2.1), one of the East Frisian
barrier islands located in the south-eastern part of the North Sea. The area is characterised
by semi-diurnal tides with a mean tidal range exceeding 2 m and a maximum range of about
2.6 m offshore Spiekeroog Island. In water depths >10 m, the lower shoreface is sculptured
into a series of NW-SE striking ridges and troughs which have a spacing of 1-2 km and a
relief of 3-5 m. Peak current velocities on the shoreface during calm weather range from 30
cm/s at a water depth of 3 m to 60 cm/s at 22 m (Antia, 1993). However, the currents differ in
strength and orientation as a function of tidal phase and location relative to the topography.
Thus, at a height of 1 m above the ridge crests and seaward flanks, peak flood currents
reach 40 cm/s and 45 cm/s respectively, whereas peak ebb current velocities reach 36 cm/s
and 40 cm/s respectively. In the troughs, on the other hand, the ebb current dominates with
peak velocities of 36 cm/s, as opposed to 30 cm/s for the flood current (Flemming & Davis,
1994). Corresponding measurements during storms are lacking. The significant near-shore
wave height and period (at 10 m water depth) are 1.5 m and 6 s respectively, with about 10-
30 cumulative days of storm episodes annually (Dette, 1977).
18
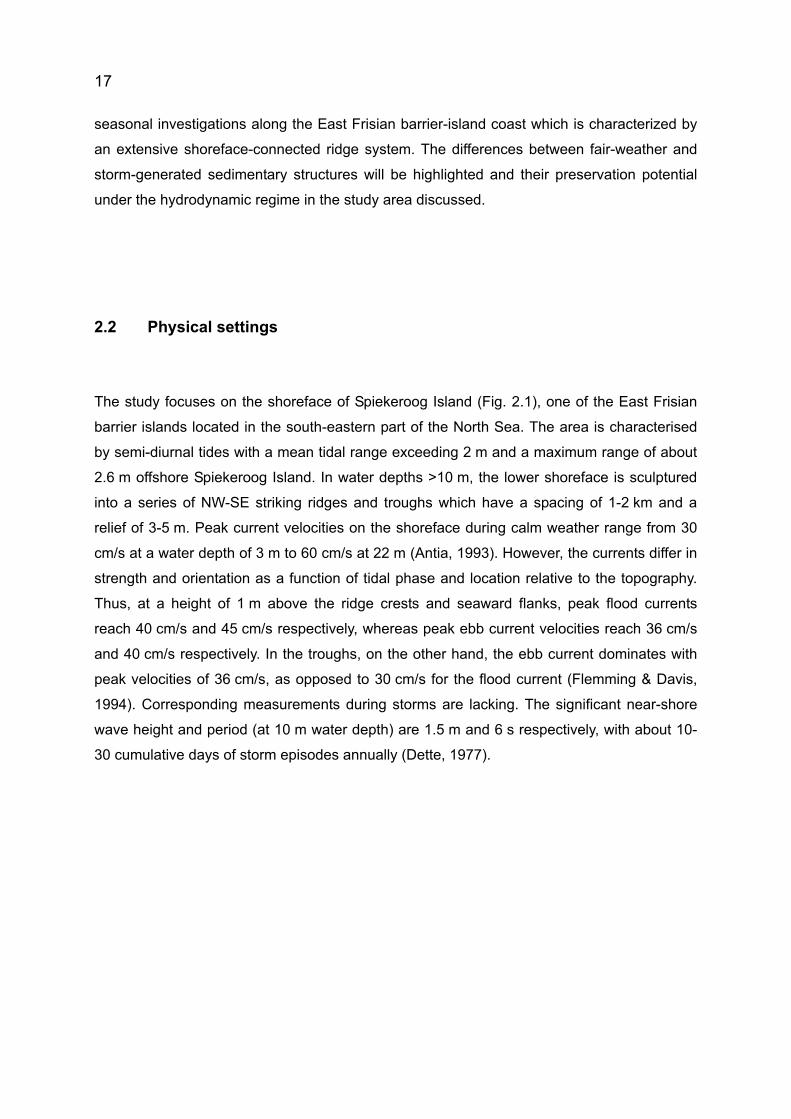
Figure 2.1 Locality map showing the study area off Spiekeroog Island, southern North Sea.
Water depths are in metres relative to NN (German topographic chart datum).
19
2.3 Methods
The bathymetry on the shoreface off Spiekeroog Island was recorded in late summer (i.e. in
the fair-weather season) of 2003 using a high-resolution (460 kHz) multi-beam echo-sounder
(Fig. 2.2). On the basis of these data, three transects were selected perpendicular to the
ridge axes, taking the overall morphology of the ridges into account. Along these transects,
box-cores were collected on two occasions after major storms in the winter season
(February/March 2005) and during extended calm-weather conditions in the subsequent
summer-autumn (August/October 2005). In all, 76 box-cores were recovered along the
transects using a Reineck box-corer. The boxes have a rectangular surface of 27×20 cm and
a height of 45 cm.
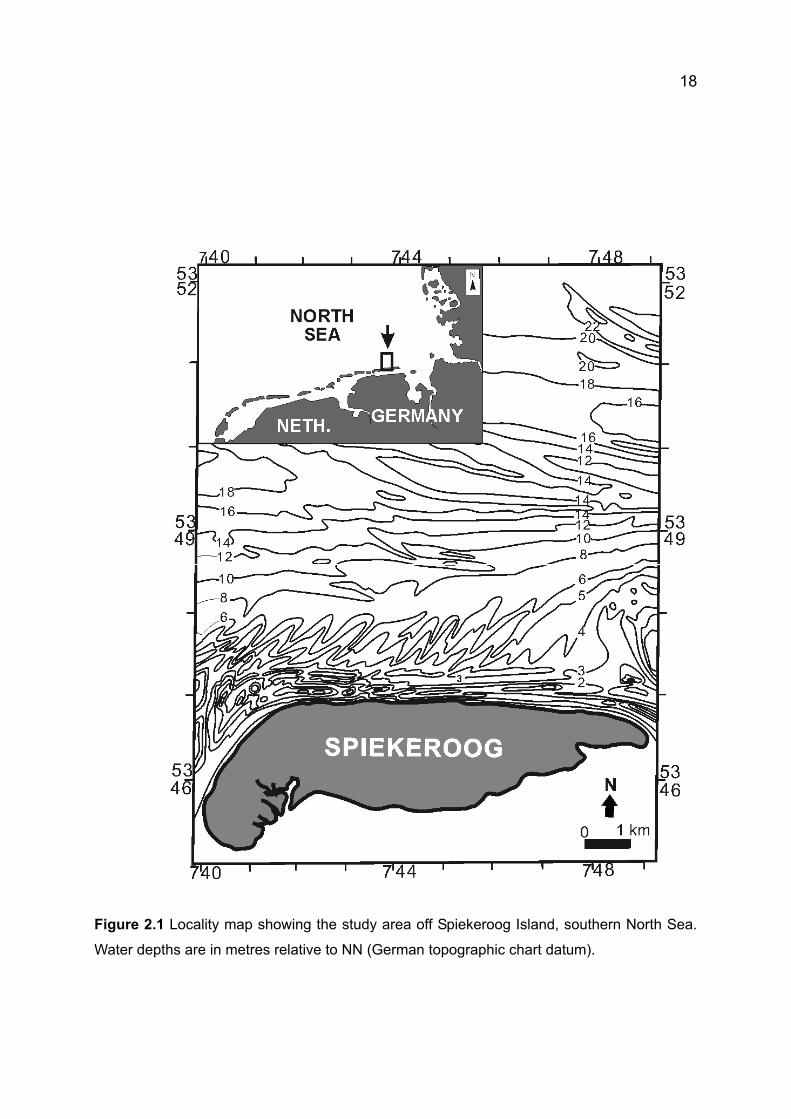
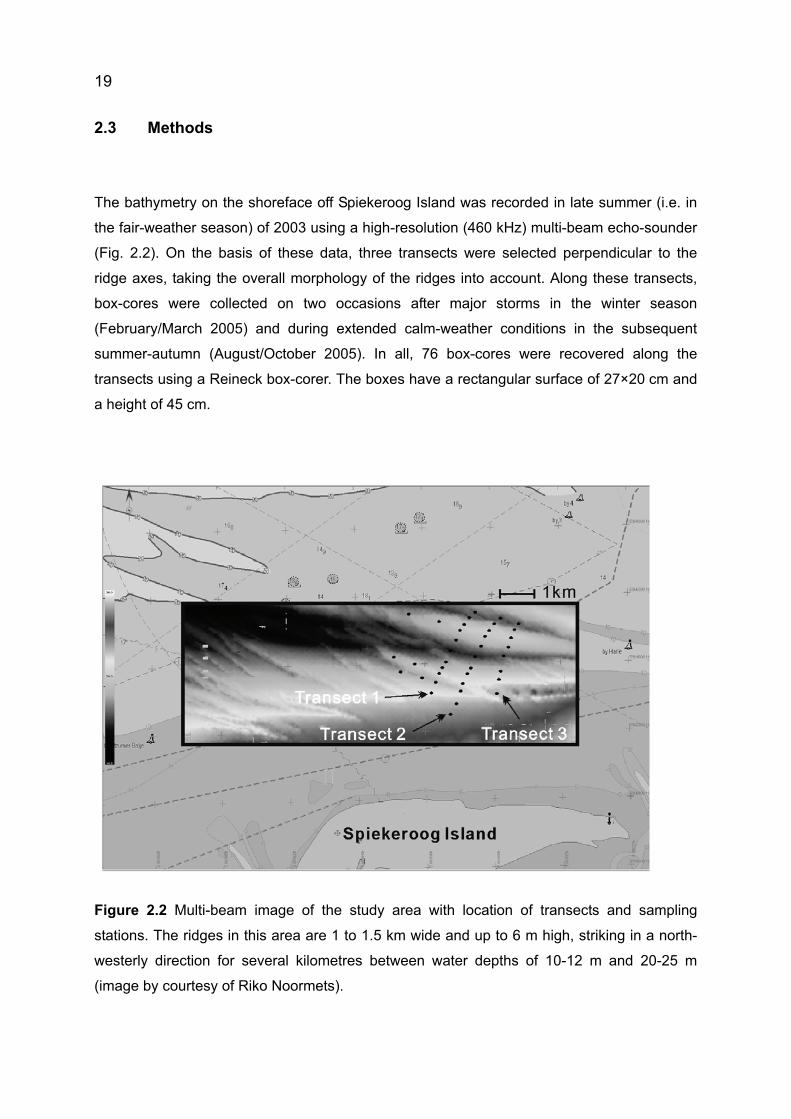
Figure 2.2 Multi-beam image of the study area with location of transects and sampling
stations. The ridges in this area are 1 to 1.5 km wide and up to 6 m high, striking in a north-
westerly direction for several kilometres between water depths of 10-12 m and 20-25 m
(image by courtesy of Riko Noormets).
20
Of the boxes recovered, 25 were taken shortly after storm events, the rest being retrieved
under fair-weather conditions. Due to the high friction in sandy-gravelly sediments, the length
of the box-cores rarely exceeded 20 cm. The cores were drained for a few weeks in cold
storage before being opened. Epoxy peels were made down-core along undisturbed central
sections applying the pouring method of Reineck (1970) in order to preserve the physical and
biogenic structures in the greatest possible detail. In addition, sediment samples were taken
from the surfaces of the box-cores and then analyzed by sieve and settling tube after being
subjected to standard laboratory treatment (Carver, 1971; Flemming & Ziegler, 1995).
2.4 Results
2.4.1Bedforms
The multi-beam bathymetry displays a variety of bedforms which occupy particular zones of
the ridges (Fig. 2.3). The largest bed forms occur on the seaward flank of the outer ridge
(where current velocities are highest). They are aligned almost perpendicular to the ridge
axis and have an average spacing of about 5 m and heights of 0.05 to 0.2 m (Fig. 2.3A). Due
to their weak flood-oriented asymmentry, it is not clear whether these bed forms are small,
current-generated dunes or large wave-generated ripples or, indeed, combined-flow features,
although tidal currents are probably the dominant mechanism in the fair-weather season.
They progressively decrease in size towards the ridge crest where they disappear completely
and the seabed becomes relatively smooth (Fig. 2.3B, right-hand side of panel).

21
Figure 2.3 Bed forms at different positions on the ridges: (A) Seaward flank of outer ridge.
(B) Outer ridge crest. (C) Landward flanks of outer and inner ridges. (D) Upper shoreface.
Note the direction of bed form orientation; the length of the black lines is 50 m in each case.
At the same time, the surficial sediment of the outer ridge gets coarser from the crest to the
landward flank. The flat seabed continues into the outer trough and inner-ridge area. The
swath bathymetry indicates some bed roughness in this region, but the appearance on the
image suggests that these are artefacts (dynamic motion residuals) of the multi-beam system
(Fig 2.3C). With decreasing water depth towards the upper shoreface, smaller and more
irregular bed forms reaching a few centimetres in height begin to appear (Fig 2.3D). Their
orientation is slightly more oblique (towards the northwest) than the larger bed forms on the
seaward flank of the outer ridge. As in the case of outer-ridge bed forms, the generating
process is not clear, although tidal currents are the most probable mechanism in this case
too, considering that the multi-beam records were obtained during the fair-weather season.

22
2.4.2 Surficial sediments
The seasonal variations in mean grain size and sorting of the surficial sediments along
transects 1 and 2 are shown in Fig. 4 (for location cf. Fig. 2.2). The samples of February
2005 were taken shortly after a storm. With the exception of the troughs along transect 1 in
March and October 2005, mean grain sizes across both ridge systems show a remarkable
stability over the whole year along both transects, in spite of the fact that they vary spatially in
a systematic manner from coarse to fine sand (Fig. 2.4, upper panel). Interestingly, the
departures from this trend in the troughs of transect 1 show an inverse pattern, the mean
grain size in the outer trough getting finer, whereas that of the inner trough gets coarser.
The same essentially applies to the sorting (standard deviation) trends which show a similar
seasonal stability in spite of its variability along the transects (Fig.2. 4, lower panel). Thus, the
sediment is well to moderately well sorted on the seaward flank, the crest, and the landward
flank of the outer ridge, and again on the seaward flank of the inner ridge and on the upper
shoreface. In the troughs of both ridges and on the crest of the inner ridge, by contrast, the
sediments are moderately to poorly sorted. Again the observed departures occur along
transect 1 where the sorting of the sediment in the inner trough decreases (i.e. the standard
deviation increases) in both March and October 2005, whereas in the outer trough the poorer
sorting (higher standard deviation) is restricted to the March 2005 sampling campaign. In
terms of textural facies, the upper shoreface and the seaward flank of the inner ridge are
composed of fine to very fine sand throughout the year, the sediments of the former being
slightly finer than those of the latter. Likewise stable throughout the year are the sediments of
the landward flank, the crest, and the seaward flank of the outer ridge, the textural facies
getting progressively finer from a mixture of coarse-medium sand on the inner flank, through
medium sand on the crest, to fine-very fine sand on the seaward flank, and very fine sand in
deeper water beyond the seaward limit of the study area. Only the sediments of the two
troughs thus show dramatic seasonal changes in their textural attributes, as reflected by their
mean diameters and sorting values, with distinct differences between the two transects which
are spaced only 300 m apart, transect 1 being located in slightly deeper water.

23
Figure 2.4 Mean grain size and sorting trends across the ridges: (A) Mean grain size. (B)
Sorting. The samples along transect 2 (Feb. 2005) were obtained shortly after a storm event.
Note the moderately to poorly sorted coarse sediments on the inner ridge crest and in both
troughs.
24
The seasonal facies changes in the troughs are evidently related to storm events. On such
occasions, fine sand transported into the outer trough during calm weather by tidal currents
is removed by storm-amplified combined flows, thereby exposing the coarse sand and fine
gravel lag deposits typically occupying the troughs, and which the tidal currents on their own
are unable to mobilize. A departure from this general pattern is observed in the shallower part
of the inner trough (transect 2). Here, the sediment consists of fine sand regardless of the
weather conditions, probably reflecting its proximity to the upper shoreface which consists of
the same sediment type. In a strict sense, he sources or transport paths of the fine sands are
unknown. Most probably, the sediment simply oscillates between particular local sources (e.g.
adjacent ridges, seaward flanks or upper shoreface) and their temporary storm repositories
(troughs, landward flanks). Occasionally, centimetre to decimetre thick mud layers are
deposited in large patches over the sands and/or gravels in the outer trough during calm
weather conditions. Such mud deposits are particularly prominent along transect 1 where
they can also be found sandwiched between coarser sediment layers (see below).
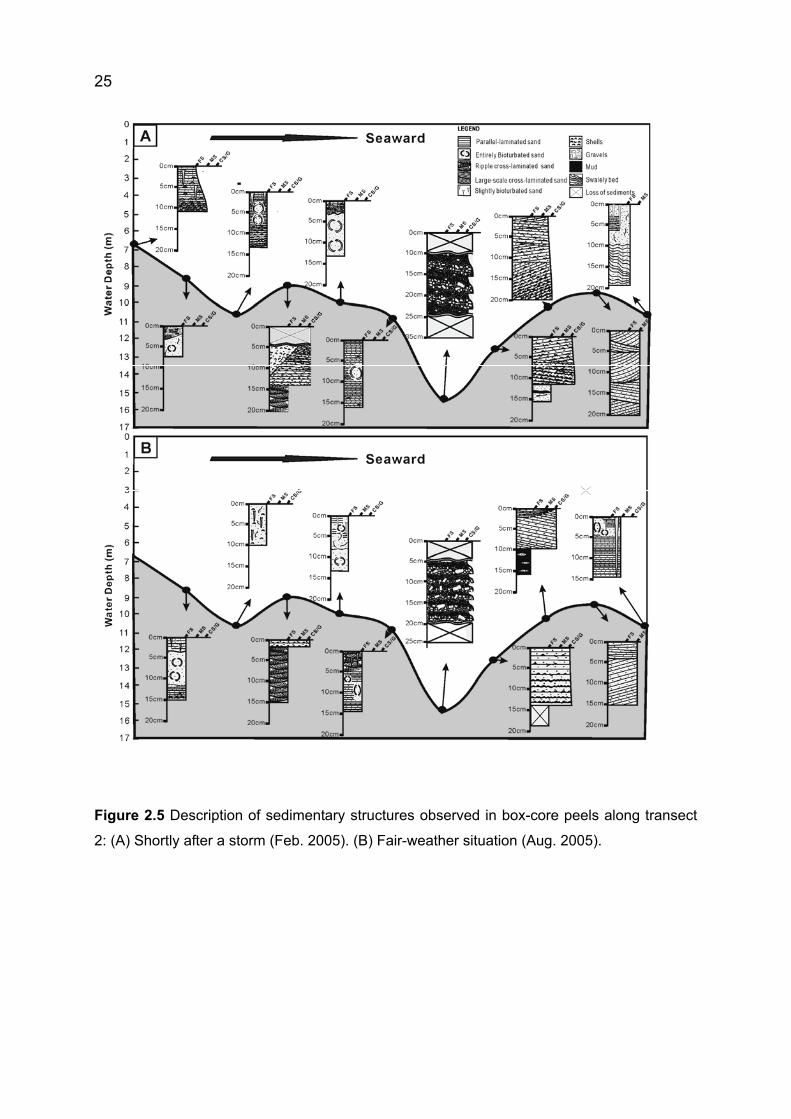
2.4.3 Internal sedimentary structures
The internal sedimentary structures documented in the peels of the 79 box-cores recovered
along the three transects at different times of the year in 2005 are summarized in Fig. 2.5.
Typical structures characterizing different parts of the ridge-trough-systems in the stormy
season (February 2005) are illustrated in Fig. 2.5A, whereas those of the fair-weather season
(August 2005) are presented in Fig. 2.5B. When comparing the winter and summer cores
recovered at the various sampling positions, it is immediately evident that the sedimentary
structures generated during the stormy season in most cases show variable degrees of
physical and biological reworking associated with subsequent fair-weather processes. The
only exception appears to be the outer trough where fair-weather processes are evidently
unable to rework the coarse lag deposits generated during the previous winter season. The
reworking depth by fair-weather processes in summer may vary from a few centimetres to a
few decimetres, depending on the position along the transect.
25
Figure 2.5 Description of sedimentary structures observed in box-core peels along transect
2: (A) Shortly after a storm (Feb. 2005). (B) Fair-weather situation (Aug. 2005).
26
In the following, typical sedimentary structures generated during storms and fair weather are
compared with each other, the storm season being represented by the peels on the left-hand
side, those recovered during the fair-weather season on the right-hand side of Figs 2.6 and
2.7. Thus, the sedimentary structures on the upper shoreface and the upper seaward flank of
the inner ridge (Fig. 2.6A, B) are generally characterized by wave-generated, parallel-
laminated sands with shell lags in winter (left panels).
In both cases, the cores recovered at the same sites, in summer show strong bioturbation
(right panels), although some parallel lamination is still visible. The observed bioturbation is
associated with the burrowing activity of sea urchins (Echinocardium cordata) and
polychaete worms such as Lanice conchilega and Arenicola marina. The degree of
bioturbation generally increases and reaches greater depths in the sediment the longer the
fair-weather periods last. The complete lack of bioturbation in the winter cores, on the other
hand, suggests complete physical reworking during storms to depths exceeding the
biological activity. In this respect, the upper-shoreface and the upper seaward flank of the
inner ridge are analogous to each other, a feature attributed to the fact that both facies
consist of the same sediment (fine sand), occur at similar water depths, and have the same
orientation regarding their exposure to the forces responsible for the physical reworking (tidal
currents and/or waves).
This situation changes when viewing seasonal cores from the inner trough and the inner-
ridge crest. Both locations are situated at similar depths as in the previous case, but the
degree of exposure and partly also the grain size differ. Thus, in the inner trough of transect 1
(Fig. 2.6C), the sediment consists of plane- to crossbedded coarse sands with intercalated
shell material. In this particular example, the winter core does not contain any shell material
and shows signs of bioturbation by sea urchins in the upper 5 cm (Fig. 2.6C, left panel).
Although not normally found in such coarse substrates, the urchins must have locally
occupied the sediment shortly after a storm event in this case. In summer, by contrast, the
sediment is cross-bedded without any signs of bioturbation (Fig. 2.6C, right panel). This
either suggests no physical reworking after the winter season or perhaps tidal-current
influence in the fair-weather season, the former being more plausible than the latter
considering the grain size of the sediment.
On the inner-ridge crest, in turn, the sediments are characterized by parallel-bedded, coarse
shelly sands overlying ripple cross-laminated fine sands in both seasons (Fig. 2.6D). The

27
Figure 2.6 Epoxy peels of box-cores from different parts of the ridge and trough systems (left panels:
shortly after a storm; right panels: fair-weather). (A) Upper shoreface: parallel-laminated storm deposit
(left); strongly bioturbated sands of the fair-weather season (right) still showing remnants of parallel-
laminated sands at the top and the bottom. (B) Seaward flank of inner ridge: the sedimentary
structures are similar to those on the upper shoreface in both seasons, but the degree of bioactivitiy is
more intense. (C) Inner trough: coarse sediments characterize the inner trough in both seasons. (D)
Inner ridge crest: storm deposits consisting of coarse sand and shell lags over fine sand characterize
the sediments in both seasons.

28
Figure 2.7 Epoxy peels of box-cores from different parts of the ridge and trough systems (continued).
(A) Outer ridge trough: coarse laminated sands with gravel characterize the storm deposits (left); mud
layers above and below a coarse, laminated sand bed characterize the fair-weather deposits (right).
(B) Landward flank of outer ridge: coarse, laminated storm deposit with gravel (left); mud layer below
coarse, crossbedded storm deposit recovered in a fair-weather period (right). (C) Outer ridge crest:
large-scale crossbedding and herring-bone crossbedding characterize the sediments in both seasons.
(D) Seaward flank of outer ridge: storm-generated swaley beds (left) are replaced by climbing-ripple
cross-stratification in the fair-weather season.
29
coarse sediments are very similar to those occupying the inner trough along transect 1 and
they may thus have been transported onto the crest where they came to rest over the fine
sands normally found at this location. At this stage of the investigation it is not clear whether
the coarse sediment layers are periodically removed from the inner-ridge crest, or whether
they become permanently embedded within the fine sand in the form of coarse-grained
lenses.
In the outer trough, coarse sand to gravelly storm beds are prominent, regardless of the
season (Fig. 2.7A). These coarse sediments are composed of graded, parallel to sub-parallel
beds deposited in the course of strong storm activity, bioturbation being rare because of the
coarse grain size. At the same time, centimetre to decimetre thick mud layers are locally
deposited on the seabed during slack water. These may overlie and/or underlie the coarse
sand beds, both in winter and in summer (Fig. 2.7A, right panel). The origin of the mud is not
immediately evident, except that the source cannot be far away because the mud would
presumably have been dispersed in the water column during the high-energy events.
Particularly in cases where the mud layers are sandwiched between coarse sand beds, one
must assume that the mud had sufficient time to dewater in order to become stiff enough not
to be eroded during a later high-energy event in the course of which the coarse sand was
deposited above it.
On the outer ridge, the sediments gradually fine seawards, as already mentioned above.
Thus, the sediment on the landward flank of the outer ridge is still relatively coarse-grained
and still contains substantial amounts of shell material, particularly in the lower parts of the
cores recovered during the stormy season (Fig. 2.7B). On the crest and seaward slope, by
contrast, the sediment is finer, common sedimentary structures including low-angle plane
beds and swaley cross-beds generated during storms (Fig. 2.7C, D, left panels), whereas bi-
directional moderate- to high-angle dune cross-stratification, climbing-ripple crossbedding,
and herring-bone crossbedding are generated during calm weather (Fig. 2.7C, D, right
panels) which suggest tidal-current control with weak wave influence. In addition, the fair-
weather deposits in this area may show signs of weak bioturbation.

30
Figure 2.8 Storm-generated sedimentary structures. (A), (B) Mud beds overlain by coarse-
grained, parallel-laminated and crossbedded sands. (C) Hummocky cross-stratification
(water depth: 17 m). (D) Parallel-laminated sand (water depth 20 m).
Additional examples of coarse sediments overlying mud layers are illustrated in Fig. 2.8A and
8B. As pointed out before, further offshore on the lower shoreface the sediment grades from
medium sand on the seaward flank of the outer ridge to fine sand in water depths >17 m.
Box-cores from this region invariably display hummocky and swaley cross-stratification
(Fig. 2.8C) or parallel laminations (Fig. 2.8D) typical of the transition from the lower to the
upper flow regime. At this water depth, these sedimentary structures can only have been
generated in the course of combined flows during severe storms.
31
2.5 Discussion
2.5.1 Sediment sources and dynamics
The bed forms recorded on the ridge system during the fair-weather season (Fig. 2.4) seem
to be primarily controlled by grain size and tidal current velocity. Thus, flow-transverse bed
forms only occur in the medium sands of the seaward flank of the outer ridge and in the fine
sands of the upper shoreface, the dimensions of the former being larger than those of the
latter. This is consistent with the fact that the velocity of the tidal current increases with water
depth (Antia et al., 1995). The lack of bed-form development in the coarser sediments
suggests that tidal currents alone are evidently unable to move sediments having mean grain
sizes larger than about 1.5 phi (ca. 0.35 mm) in deeper water, and 2.5 phi (0.18 mm) in
shallower water. This, in turn, is consistent with the interpretation that the physical
sedimentary structures recorded in the coarser sediments of the study area are associated
with combined flows generated in the stormy season (see below).
When considering the composition and dynamics of the sediments found on the shoreface-
connected ridge system in the study area, it is important to note that the upper shoreface
(<10 m water depth) along the entire East Frisian barrier-island coast is essentially
composed of fine quartz sand (e.g. Antia et al., 1994b), and that extensive modern mud
deposits only occur in mud flats along the mainland shore (e.g. Flemming & Nyandwi, 1995),
as fluid mud in the estuaries of the nearby rivers Ems and Weser (e.g. Schrottke et al., 2006),
and in a fairly remote deep-water repository of the inner German Bight at water depths
greater than 20 m (e.g. Hertweck, 1983). In this context, questions arise especially regarding
the origin of two particular sediment types, namely the mud, on the one hand, and the coarse
sands-gravels, on the other.
As outlined above, mud layers on or in the sediments of the outer trough and the landward
flank of the outer ridge are often encountered in box-cores recovered during the fair-weather
season. Rather than being indicative of storm influence, Swift and Field (1981) suggested
that the occurrence of such fine-grained sediments on the seabed within shoreface-
connected ridge systems can be inferred to indicate that tidal currents played the main role in
controlling sedimentation in this environment. However, when scrutinizing the muds in this
area more closely, one can distinguish two types of deposits which suggest deposition under
fair-weather and storm conditions, repectively. The fair-weather mud generally settles out
32
from suspension at slack tide. Such mud deposits are normally not very thick and mostly
occur in the form of flasers draping the troughs of ripple-crossbedded sands (Reineck &
Wunderlich, 1968; Flemming, 2003). Although occasionally preserved, they are more
commonly eroded by the following tide or the next storm event.
The other, and more persistent, type of mud deposit is considered to be associated with
storms. In the study area, such mud layers are 5-10 cm thick and may even be overlain by
very coarse sands. Dewatering processes evidently render these muds so stiff that they
resist erosion when the coarser sediment move across them. Such examples are also known
from the rock record (e.g. Potter et al., 2005, p.34, Fig. 3.13,). These observations thus
mitigate against the model of Swift et al. (1973) which favours tidal currents as the overall
controlling mechanism in the formation and maintenance of shoreface-connected ridge
systems. In addition, the mud frequently contains intercalations of symmetrical cross-
laminated or parallel-laminated lenticular and wave-ripple cross-laminated fine sand.
For this type of mud, two potential sources come to mind which could release sufficiently
large amounts of mud in response to erosional storm impacts on the seabed. One such
source may consist of estuarine mud deposits which formed in estuarine valleys incised into
Pleistocene deposits when the sea level was lower and which today outcrop locally in the
troughs between the ridges. The other comprises young muds resuspended in the back-
barrier tidal basins from where they are transported seawards by strong ebb-surge currents
in the wake of storms. Thus, Koch and Niemeyer (1978) reported ebb-flow accelerations of
up to 65% in the inlet of Norderney Island shortly after the very severe storm of 1976 peaked
in the inner German Bight. In addition, Flemming & Nyandwi (1994) convincingly
demonstrated that land reclamation and dike construction had all but removed the former
accommodation space for mud in the back-barrier basins of the region. Export of mud from
the tidal basins during high-energy events is thus a logical consequence. However, in this
latter case, the resuspended mud would be dispersed in the water column and would,
therefore, be less likely to accumulate in thick patches on the shoreface.
The other side of the coin is the enigma of the coarse sands and gravels (granules to
pebbles) found in the troughs and on the landward flanks of the ridges. Swift et al. (1978)
favour a deep-water source from where they are transported upslope into the ridge systems.
This explanation is rejected here, as was previously done by Flemming & Davis (1994) and
Antia et al. (1994). An important observation in this context is the fact that none of the coarse
sands or fine gravels are ever found in upper shoreface or beach sediments of the southern
33
North Sea. It would, indeed, be strange to have such coarse particles transported halfway up
the shoreface from a deep-water source without ever reaching the beaches. Having
discounted a deep-water source on energetic grounds, the gravels must evidently represent
palimpsest lag deposits eroded more or less in situ from Pleistocene tills and glacial outwash
material which, like the estuarine muds, also outcrop in the troughs of the shoreface-
connected ridges. The local existence of such outcrops was already documented some 85
years ago (Krüger, 1922). In such cases, the gravels would thus merely be distributed around
their sources by strong wave action and combined flows during storms. At the same time, our
interpretation elegantly explains the patchiness and close association of gravel and mud in
specific locations of the ridge and trough systems in the study area. Upon exposure in the
troughs, both the Pleistocene gravels and early Holocene estuarine muds are redistributed
around their outcrops by the action of storm waves and storm-amplified tidal currents.
Modelling sediment fluxes on the basis of tidal and storm-driven currents, Walgreen et al.
(2002), concluded that the shoreface-connected sand ridges off the coast of The Netherlands
were mainly controlled by storms. In this context, Meene et al. (2000a) observed that mean
sediment fluxes on the shoreface were predominantly associated with wave stirring during
storms, whereas sediment transport during fair-weather conditions tended to occur only
episodically. Moreover, Vincent et al. (1998) observed that the direction of sediment transport
reflected mean flow directions, but that waves significantly enhanced remobilization of
sediments at the seabed to result in high sediment fluxes. The tidal characteristics on the
ridges in the present study area have revealed that flood currents are dominant on the crests
and seaward slopes, whereas ebb currents prevail in the troughs (Antia, 1995). Accordingly,
both gravels and muds, besides spreading out in the troughs, are drawn up onto the
landward flanks of the ridges as a result of the combined flows generated during storms and
which propagate in the direction of the ebb current in the troughs, while being absent on the
seaward flanks
2.5.2 Preservation potential and effective wave base
The identification of storm-generated sedimentary structures in short box-cores recovered
from modern shorefaces during the fair-weather season is a troublesome affair because
small-scale storm-generated structures can be destroyed within a few days even by relatively
weak tidal currents (Butman et al., 1979). However, in the present case, it was possible to
compare box-cores taken in the fair-weather season with others recovered at the same

34
locations immediately after a strong storm in winter, and which, therefore, would be expected
to show structures generated during the previous high-energy event. That this is indeed the
case is, amongst others, reflected by the ubiquitous presence of shell-lag horizons in the
cores. Since the cores were recovered from water depths well below the effective fair-
weather wave base capable of concentrating such material on the seabed by exhumation of
previously buried shells (Sepkoski, 1978), their storm-related origin is without dispute. This
inference is also supported by the concomitant presence of parallel-laminated sands and
hummocky cross-stratification in cores from the lower shoreface at water depths around
20 m recovered after the same storm event (Fig. 2.8C, D).
Such storm-generated sedimentary structures are invariably observed below tide-generated
structures such as herring-bone cross-bedding or crossbeds produced during short periods
of calm weather in the storm season. This implies that, in the study area, north-westerly
storms play a key role in sediment transport on the ridge systems in winter, especially in the
case of the coarser sediments, while tidal currents are also important during fair-weather
conditions in the case of the finer sediments. However, on the basis of short box-cores alone
it is difficult to assess the preservation potential of the observed sedimentary structures.
This shortcoming can only be overcome by long vibro-cores which reach well below the
modern sediment turnover depth. In this respect, several up to 1.5 m long cores retrieved
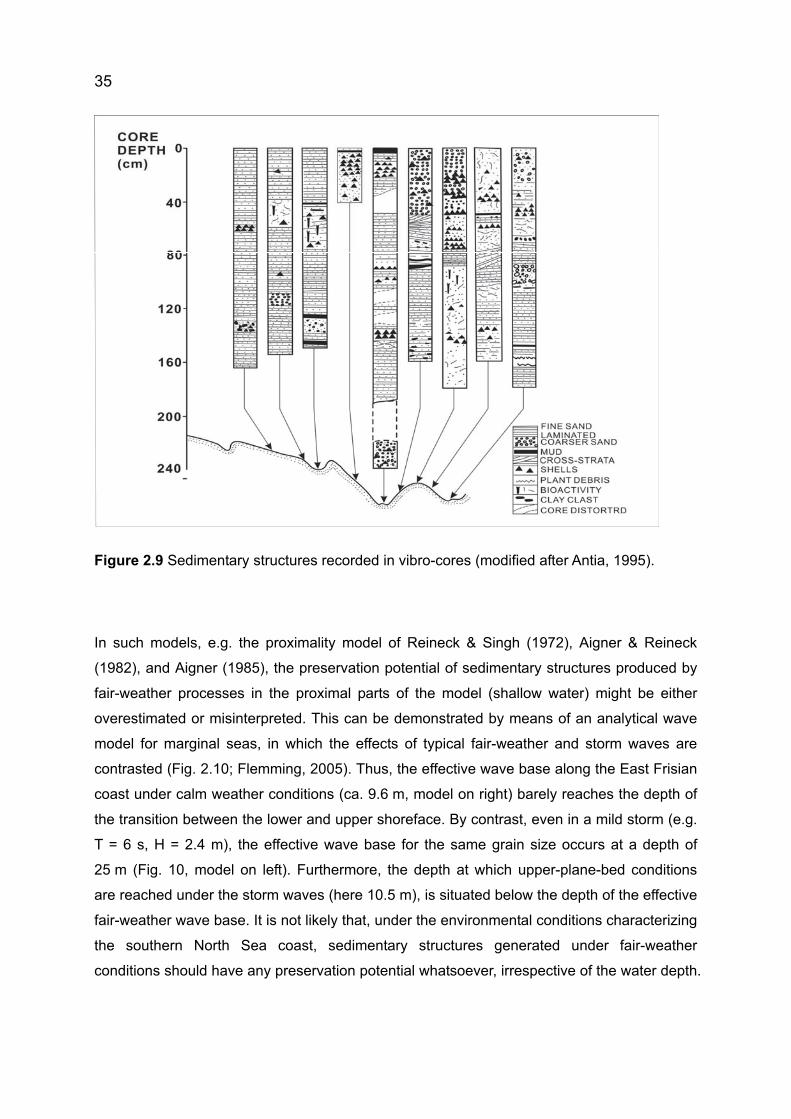
and described by Antia (1993) and Antia et al. (1994b) bridge the gap. Throughout their
length, the sedimentary structures of these cores mainly comprise parallel laminations with
interspersed massive shell beds and/or graded coarse sand to gravel beds, all relating to
high-energy conditions (Fig. 2.9). In rare instances, some faint biogenic activity and thin
cross-laminated sand beds, which may be related to fair-weather processes, are preserved.
Although short box-cores display abundant sedimentary structures generated by tidal
currents under calm weather conditions at water depths exceeding fair-weather wave
influence, the record of longer cores clearly supports the facies model of a storm-dominated
shoreface, as already asserted by Antia et al. (1994b). This observation could challenge
certain aspects in shoreface models based solely on short box-cores which, in addition, have
mostly been recovered during the fair-weather season.
35
Figure 2.9 Sedimentary structures recorded in vibro-cores (modified after Antia, 1995).
In such models, e.g. the proximality model of Reineck & Singh (1972), Aigner & Reineck
(1982), and Aigner (1985), the preservation potential of sedimentary structures produced by
fair-weather processes in the proximal parts of the model (shallow water) might be either
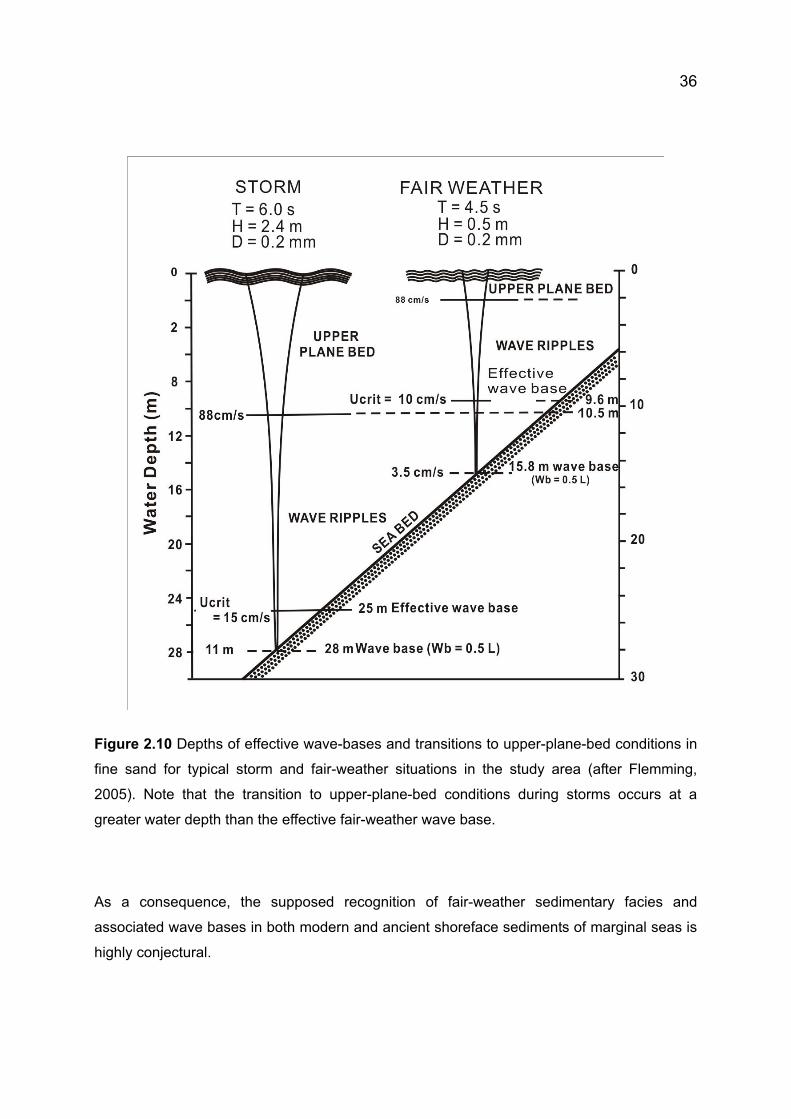
overestimated or misinterpreted. This can be demonstrated by means of an analytical wave
model for marginal seas, in which the effects of typical fair-weather and storm waves are
contrasted (Fig. 2.10; Flemming, 2005). Thus, the effective wave base along the East Frisian
coast under calm weather conditions (ca. 9.6 m, model on right) barely reaches the depth of
the transition between the lower and upper shoreface. By contrast, even in a mild storm (e.g.
T = 6 s, H = 2.4 m), the effective wave base for the same grain size occurs at a depth of
25 m (Fig. 10, model on left). Furthermore, the depth at which upper-plane-bed conditions
are reached under the storm waves (here 10.5 m), is situated below the depth of the effective
fair-weather wave base. It is not likely that, under the environmental conditions characterizing
the southern North Sea coast, sedimentary structures generated under fair-weather
conditions should have any preservation potential whatsoever, irrespective of the water depth.
36
Figure 2.10 Depths of effective wave-bases and transitions to upper-plane-bed conditions in
fine sand for typical storm and fair-weather situations in the study area (after Flemming,
2005). Note that the transition to upper-plane-bed conditions during storms occurs at a
greater water depth than the effective fair-weather wave base.
As a consequence, the supposed recognition of fair-weather sedimentary facies and
associated wave bases in both modern and ancient shoreface sediments of marginal seas is
highly conjectural.
37
2.6 Conclusions
The results of this study have shown that:
(a) The characteristics of surface sediments and sedimentary structures can be classified
according to the morphology of sand ridges. In addition, preserved storm-generated
structures observed in box-cores during fair-weather conditions and in long-cores
demonstrate that the study area is mainly controlled by combined flows produced in the
course of northwesterly storms.
(b) The gravels and muds observed in the vicinities of the troughs between ridges must be
associated with palimpsest lag deposits eroded in situ from Pleistocene tills and glacial
outwash material. An additional source of the muds could be estuarine valleys incised into
the Pleistocene deposits.
(c) The preservation potential of sedimentary structures recorded in this study can be
explained by means of an analytical wave model for marginal seas, in which the effects of
typical fair-weather and storm waves are contrasted. Therefore, selective preservation needs
to be taken into account when reconstructing palaeo-environmental conditions in such areas.
Acknowledgements
This study was mainly supported by the Korea Science and Engineering Foundation Grant
funded by the Korea government (M06-2004-000-10524) and partly supported by a KIGAM’s
basic program (T.S. Chang, Code: GP2009-026). We are grateful to Arnulf Moeller, Astrid
Raschke and Nicol Mahnken-Rötzer for technical support in the laboratory. In addition, we
wish to thank the captain and crew of the RV Senckenberg for logistical support in the field.
Special thanks is due to Dr. Alexander Bartholomä for conscientious advice and constructive
discussions.

38
3. Long-term changes in morphology and textural sediment
characteristics in response to energy variations on shoreface-connected
ridges off the East Frisian barrier-island coast, southern North Sea
Chang Soo SON, Burghard W. FLEMMING and Alexander BARTHOLOMÄ
Abstract
Surficial sediment distribution patterns across shoreface-connected sand ridges located
along the barrier-island coast of the southern North Sea generally show a strong affinity
between textural parameters and ridge morphology. Thus, the sediment of the upper
shoreface and the inner ridge crest consist of fine sand (water depths <12 m). The troughs
between the ridges, by contrast, comprise medium to coarse sands, whereas the ridge flanks
are characterized by fine to medium sands with a coarsening trend towards the troughs
(water depths >12 m). In order to assess the mobility of the sediments and the consistency of
the observed textural patterns, two high-resolution multi-beam bathymetric surveys were
carried out of a selected corridor across a ridge system off Spiekeroog island located along
the southern North Sea coast of Germany, one in 2003, the other in 2007. The bathymetric
data of the two surveys show only small-scale topographic changes. These were mainly
produced by local changes in the bedform patterns on the inner ridge, which documents a
remarkable morphological stability of the ridges over time periods of several years. Spatial
and temporal variations in the distribution of standard textural parameters were assessed on
the basis of 95 sediment samples recovered on the same grid in 1989 and 2005. This data
shows that, for example, the distribution of coarse sand (0-1 Phi) became enhanced along
the axis of the outer trough, while expanding onto the lower ridge flanks. Current
measurements in fair weather demonstrate that the coarse sediments can not be moved by

39
the local tidal currents. The observed changes in the distribution of coarse sand, and in
particular its expansion onto the adjacent flanks, must therefore be associated with wave
action. This is supported by an assessment of the entrainment potential of coarse sand (D =
1 mm) by typical waves during storms (T = 8 s; H = 2.5 m) and fair weather (T = 4 s; H = 0.7
m). The results demonstrate that the effective wave base for coarse sand during fair-weather
conditions is limited to a water depth of 4.8 m, whereas during storms it exceeds a depth of
26.4 m. The mobility of the coarse sands in the outer trough at water depths >16 m, and with
it the morphodynamics of the ridges as a whole, is thus clearly controlled by the
superimposition of storm waves on the tidal current regime.
3.1 Introduction
Shore-face connected sand ridges are prominent morphological features along many coasts
of the world and have been the subject of investigation for several decades now. In the
course of these investigations, a variety of (partly conflicting) conceptual models for the origin
and evolution of sand ridges have been proposed, among others by Swift et al. (1972, 1978,
1981a, 1981b), Amos and King (1984), Pattiaratchi and Collins (1987), McBride and Moslow
(1991), Flemming and Davis (1994), and Dyer and Huntley (1999). Detailed textural
characteristics and sedimentary facies patterns have, among others, been described by
Chowdhuri and Reineck (1978), Stubblefield and Swift (1981), Aigner and Reineck (1983),
Antia et al. (1994a, 1994b), Trentesaux et al. (1994), van de Meene et al. (1996), and Son et
al. (2005, 2009). Concurrently, studies focusing on morphodynamics and sediment transport
were, among others, carried out by Niedoroda et al. (1984), Liu and Zarillo (1990), Wright et
al. (1991), van de Meene et al. (2000a, 2000b), Walgreen et al. (2002), Goff et al. (2005),
and de Swart et al. (2008). On the basis of such data, it had generally been concluded that
shoreface-connected sand ridges were evidently formed by strong storm-induced combined
flows, whereas tidal currents on their own were at best able to maintain the ridges. However,
a comprehensive and conclusive model explaining the evolution and maintenance of
shoreface-connected ridges is still lacking, although sediment transport studies during both
fair weather and storms, augmented by recent numerical modelling exercises, have greatly
illuminated our understanding of sediment transport patterns on shorefaces in general and

40
sand ridges in particular (e.g., Wright et al., 1991; Green et al., 1995; Li et al., 1996, 1997;
Vincent et al., 1998; Xu et al., 1998; Goff et al., 2005; Héquette et al., 2008). As in other parts
of the world, the lower shoreface off the East Frisian barrier islands in the southern German
Bight, North Sea, is morphologically sculptured into a series of sand ridges separated by
deep troughs. These shoreface-connected ridge and trough systems merge with a smooth,
gently dipping upper shoreface at water depths of 10-12 m. Ridge and trough axes strike
NW-SE, have a spacing of 1-2 km and a relief of 3-6 m (Fig. 3.1).
Figure 3.1 Locality map of the wider study area off Spiekeroog Island, southern North Sea,
showing the multi-beam bathymetry with superimposed sampling grid in the central area.
Water depths are in metres relative to NN (German topographic chart datum).
41
The mean tidal range is 2.7 m, ranging from 2.2 m at neap tide to 3.2 m at spring tide. Water
depths within the study area ranged from ca. 8 m on the upper shoreface to ca. 20 m in the
troughs. Peak tidal current velocities measured 1 m above the seabed during calm weather
range from 30 cm s-1 at a water depth of 3 m to 60 cm s-1 at 22 m (Antia, 1994b). Peak
current velocities over ridge crests and flanks reach 40 and 45 cm s-1 respectively during the
flood phase as opposed to 36 and 40 cm s-1repectively during the ebb phase (Flemming &
Davis, 1994). In the troughs, by contrast, the ebb current dominates the flow with values
reaching 36 cm s-1 as opposed to 30 cm s-1 during the flood phase. Previous studies in this
region (e.g., Chowdhuri and Reineck, 1978; Aigner and Reineck, 1983; Antia et al., 1994a,
1994b; Flemming & Davis, 1994), while documenting sedimentary facies and internal
sedimentary structures characterizing the ridge and trough systems, and speculating on
possible hydrodynamic mechanisms maintaining them, have expended little effort on actually
explaining observed sediment distribution patterns.
The main objective of this study, therefore, is to not only document and describe the
characteristics of sediment distribution patterns across a ridge and trough system along the
East Frisian barrier-island coast, but to evaluate the spatial variability of the topography and
sediment textural parameters in the course of the last 15 years by comparing the results of
two surveys in each case. The mobility potential of coarse sediments, in particular, is then
assessed in terms of local tidal current and wave-climate data.
3.2 Methods
The bathymetry of the shoreface off Spiekeroog Island was recorded twice along the same
grid lines, once during a fair-weather period in 2003 and a second time during more windy
conditions in 2007, using a high-resolution (460 kHz) multi-beam echo-sounder (Reson
SeaBat 8125). Both, the geographic positions and the depth data have an accuracy of a few
centimetres. These surveys were carried out within the framework of another study and thus
merely served as an accurate bathymetric background to the present, spatially more
confined study. On the basis of the first multi-beam bathymetric survey, 195 surface sediment
samples were collected in 2005 during fair-weather conditions on a regular grid spaced 270 x
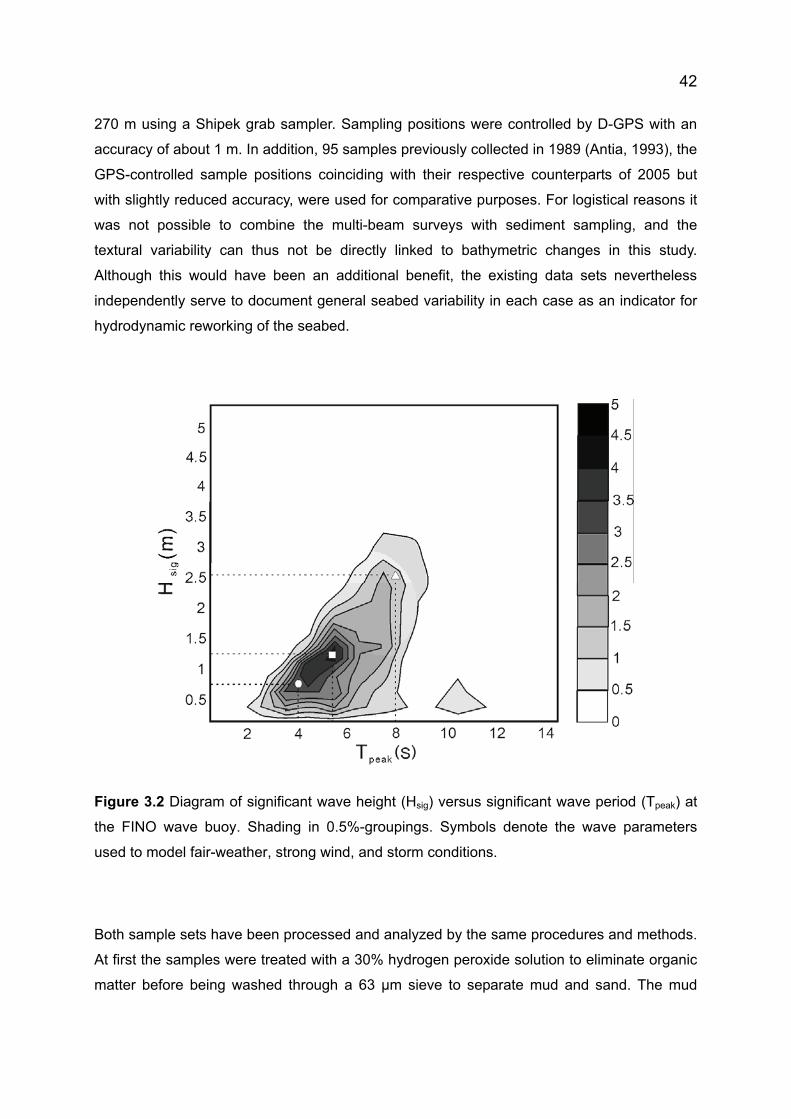
42
270 m using a Shipek grab sampler. Sampling positions were controlled by D-GPS with an
accuracy of about 1 m. In addition, 95 samples previously collected in 1989 (Antia, 1993), the
GPS-controlled sample positions coinciding with their respective counterparts of 2005 but
with slightly reduced accuracy, were used for comparative purposes. For logistical reasons it
was not possible to combine the multi-beam surveys with sediment sampling, and the
textural variability can thus not be directly linked to bathymetric changes in this study.
Although this would have been an additional benefit, the existing data sets nevertheless
independently serve to document general seabed variability in each case as an indicator for
hydrodynamic reworking of the seabed.
Figure 3.2 Diagram of significant wave height (Hsig) versus significant wave period (Tpeak) at
the FINO wave buoy. Shading in 0.5%-groupings. Symbols denote the wave parameters
used to model fair-weather, strong wind, and storm conditions.
Both sample sets have been processed and analyzed by the same procedures and methods.
At first the samples were treated with a 30% hydrogen peroxide solution to eliminate organic
matter before being washed through a 63 �m sieve to separate mud and sand. The mud
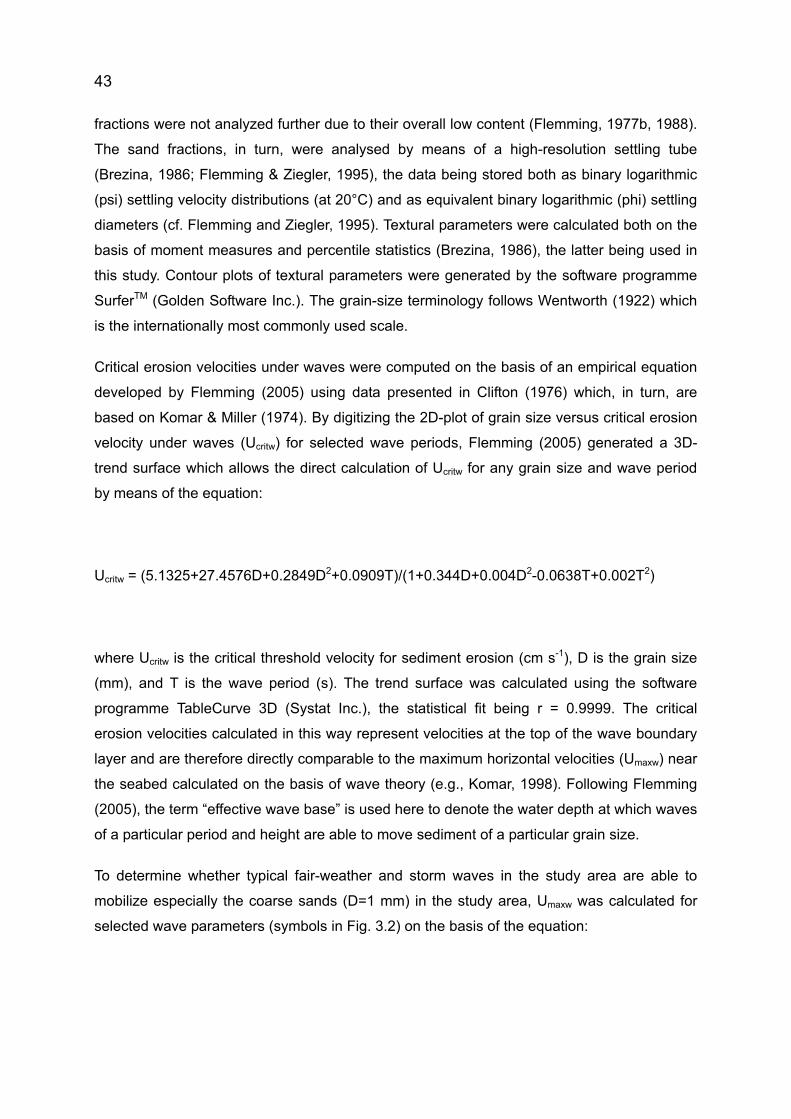
43
fractions were not analyzed further due to their overall low content (Flemming, 1977b, 1988).
The sand fractions, in turn, were analysed by means of a high-resolution settling tube
(Brezina, 1986; Flemming & Ziegler, 1995), the data being stored both as binary logarithmic
(psi) settling velocity distributions (at 20°C) and as equivalent binary logarithmic (phi) settling
diameters (cf. Flemming and Ziegler, 1995). Textural parameters were calculated both on the
basis of moment measures and percentile statistics (Brezina, 1986), the latter being used in
this study. Contour plots of textural parameters were generated by the software programme
SurferTM (Golden Software Inc.). The grain-size terminology follows Wentworth (1922) which
is the internationally most commonly used scale.
Critical erosion velocities under waves were computed on the basis of an empirical equation
developed by Flemming (2005) using data presented in Clifton (1976) which, in turn, are
based on Komar & Miller (1974). By digitizing the 2D-plot of grain size versus critical erosion
velocity under waves (Ucritw) for selected wave periods, Flemming (2005) generated a 3D-
trend surface which allows the direct calculation of Ucritw for any grain size and wave period
by means of the equation:
Ucritw = (5.1325+27.4576D+0.2849D2+0.0909T)/(1+0.344D+0.004D2-0.0638T+0.002T2)
where Ucritw is the critical threshold velocity for sediment erosion (cm s-1), D is the grain size
(mm), and T is the wave period (s). The trend surface was calculated using the software
programme TableCurve 3D (Systat Inc.), the statistical fit being r = 0.9999. The critical
erosion velocities calculated in this way represent velocities at the top of the wave boundary
layer and are therefore directly comparable to the maximum horizontal velocities (Umaxw) near
the seabed calculated on the basis of wave theory (e.g., Komar, 1998). Following Flemming
(2005), the term “effective wave base” is used here to denote the water depth at which waves
of a particular period and height are able to move sediment of a particular grain size.
To determine whether typical fair-weather and storm waves in the study area are able to
mobilize especially the coarse sands (D=1 mm) in the study area, Umaxw was calculated for
selected wave parameters (symbols in Fig. 3.2) on the basis of the equation:

44
Umaxw = (�H/T) • (1/sinh(2�d/L))
where H is the wave height (m), T the wave period (s), d the water depth (m), L the
wavelength (m), and sinh the hyperbolic sine. The wavelength L at a particular intermediate
water depth d is determined iteratively (by trial and error) on the basis of the wave dispersion
equation:
L = (g/2�)T² • tanh(2�d/L)
where, in adition to the wave parameters already defined above, g is the acceleration due to
gravity (9.81 m s-2) and tanh is the hyperbolic tangent. The wave data presented in Fig. 2 is
based on a one-year record from a wave-rider buoy located in deeper water some distance
NW of the study area near the FINO measuring pile (cf. Lettmann et al., 2009).
3.3 Results
3.3.1 Textural sediment characteristics
As highlighted in Fig. 3.3, the distribution pattern of mean grain sizes reveals a strong affinity
towards the topography of the ridges (Fig. 3.3, upper panel). Thus, when grouped into
individual grain-size classes, the surface sediments can be
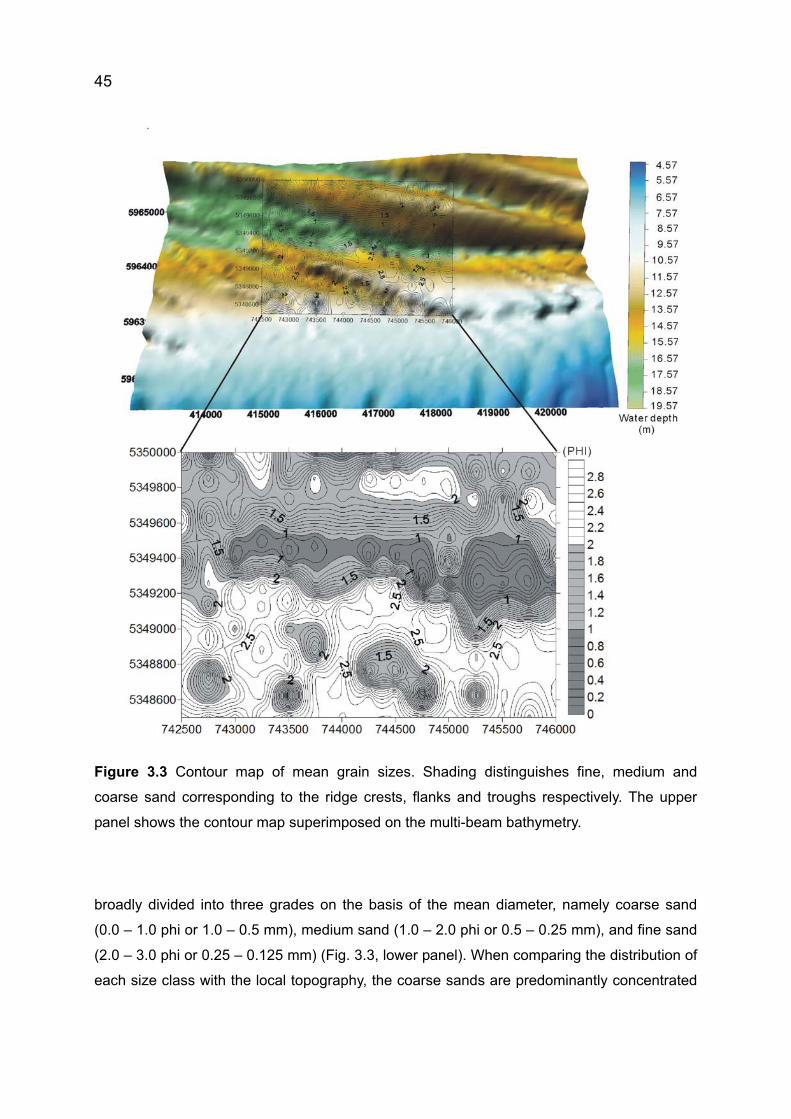
45
Figure 3.3 Contour map of mean grain sizes. Shading distinguishes fine, medium and
coarse sand corresponding to the ridge crests, flanks and troughs respectively. The upper
panel shows the contour map superimposed on the multi-beam bathymetry.
broadly divided into three grades on the basis of the mean diameter, namely coarse sand
(0.0 – 1.0 phi or 1.0 – 0.5 mm), medium sand (1.0 – 2.0 phi or 0.5 – 0.25 mm), and fine sand
(2.0 – 3.0 phi or 0.25 – 0.125 mm) (Fig. 3.3, lower panel). When comparing the distribution of
each size class with the local topography, the coarse sands are predominantly concentrated
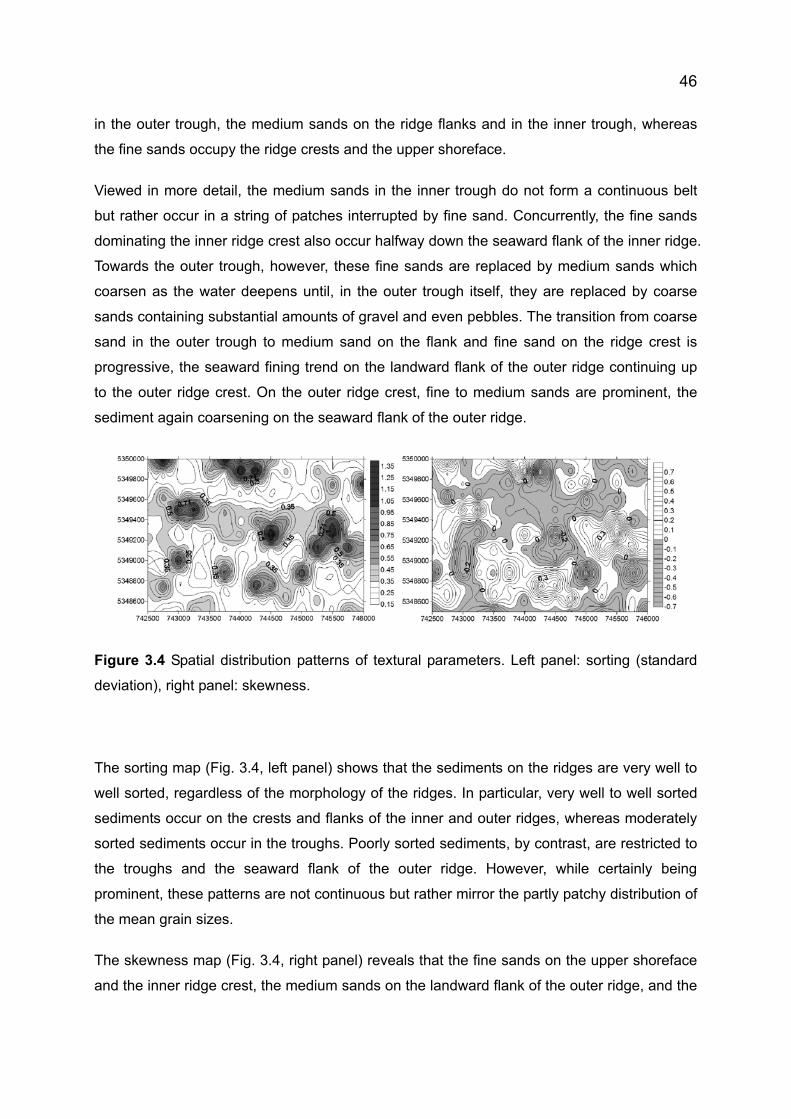
46
in the outer trough, the medium sands on the ridge flanks and in the inner trough, whereas
the fine sands occupy the ridge crests and the upper shoreface.
Viewed in more detail, the medium sands in the inner trough do not form a continuous belt
but rather occur in a string of patches interrupted by fine sand. Concurrently, the fine sands
dominating the inner ridge crest also occur halfway down the seaward flank of the inner ridge.
Towards the outer trough, however, these fine sands are replaced by medium sands which
coarsen as the water deepens until, in the outer trough itself, they are replaced by coarse
sands containing substantial amounts of gravel and even pebbles. The transition from coarse
sand in the outer trough to medium sand on the flank and fine sand on the ridge crest is
progressive, the seaward fining trend on the landward flank of the outer ridge continuing up
to the outer ridge crest. On the outer ridge crest, fine to medium sands are prominent, the
sediment again coarsening on the seaward flank of the outer ridge.
Figure 3.4 Spatial distribution patterns of textural parameters. Left panel: sorting (standard
deviation), right panel: skewness.
The sorting map (Fig. 3.4, left panel) shows that the sediments on the ridges are very well to
well sorted, regardless of the morphology of the ridges. In particular, very well to well sorted
sediments occur on the crests and flanks of the inner and outer ridges, whereas moderately
sorted sediments occur in the troughs. Poorly sorted sediments, by contrast, are restricted to
the troughs and the seaward flank of the outer ridge. However, while certainly being
prominent, these patterns are not continuous but rather mirror the partly patchy distribution of
the mean grain sizes.
The skewness map (Fig. 3.4, right panel) reveals that the fine sands on the upper shoreface
and the inner ridge crest, the medium sands on the landward flank of the outer ridge, and the

47
coarse sands in the middle section of the outer trough are negatively skewed. The remaining
areas are positively skewed. The negative and positive skewness trends in the sediments
probably reflect admixtures of coarser or finer material respectively. This interpretation is
supported by the fact that both very positive and negative skewness values are generally
associated with poorer sorting.
Figure 3.5 Bivariate scatter diagrams of textural parameters. Left panel: sorting versus mean
grain size (phi), right panel: skewness versus mean grain size (phi)
The characteristics of the relationships between grain-size parameters (mean, sorting and
skewness) are also illustrated in the scatter diagrams of Fig. 3.5. The mean grain size versus
sorting (standard deviation) plot (Fig. 3.5, left panel) shows that the bulk of the sediment is
very well to well sorted, with a tendency towards slightly lesser sorting as the sediment gets
coarser (slope in lower cut-off). At the same time, the scatter of the data points increases
gradually with coarsening of the sediment. A distinctly separate group is formed by the poorly
sorted outliers, which occur in small numbers throughout the grain-size range. These
represent mixed sediments.
The scatter diagram of mean grain size versus skewness (Fig. 3.5, right panel) reveals that
most of the sediments have symmetrical or near-symmetrical size distributions (grouping
around zero skewness). These coincide with the very well to well sorted samples in the mean
grain size versus sorting plot. The more negatively and more positively skewed samples, in
turn, coincide with the outliers in the former plot, higher positive values occurring in the
coarser sediments, higher negative values in the finer sediments. This pattern supports the
interpretation that, in some localities of the study area, there is spatially restricted mixing
between adjacent sediment types (possibly representing separate grain-size populations).
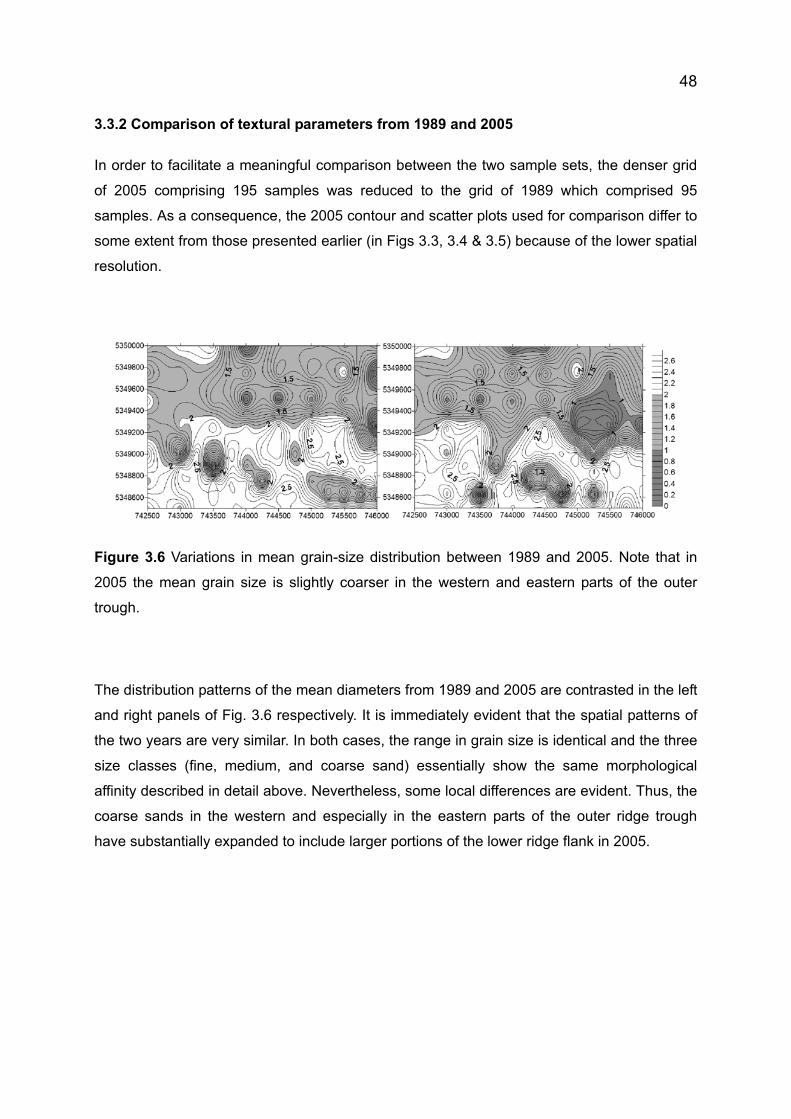
48
3.3.2 Comparison of textural parameters from 1989 and 2005
In order to facilitate a meaningful comparison between the two sample sets, the denser grid
of 2005 comprising 195 samples was reduced to the grid of 1989 which comprised 95
samples. As a consequence, the 2005 contour and scatter plots used for comparison differ to
some extent from those presented earlier (in Figs 3.3, 3.4 & 3.5) because of the lower spatial
resolution.
Figure 3.6 Variations in mean grain-size distribution between 1989 and 2005. Note that in
2005 the mean grain size is slightly coarser in the western and eastern parts of the outer
trough.
The distribution patterns of the mean diameters from 1989 and 2005 are contrasted in the left
and right panels of Fig. 3.6 respectively. It is immediately evident that the spatial patterns of
the two years are very similar. In both cases, the range in grain size is identical and the three
size classes (fine, medium, and coarse sand) essentially show the same morphological
affinity described in detail above. Nevertheless, some local differences are evident. Thus, the
coarse sands in the western and especially in the eastern parts of the outer ridge trough
have substantially expanded to include larger portions of the lower ridge flank in 2005.

49
Figure 3.7 Comparison of spatial patterns in textural parameters. Upper panels: sorting
(standard deviation). Lower panels: skewness. Left panels: 1989; right panels: 2005.
The comparison of sorting and skewness patterns (Fig. 3.7) yields a similar result. While
being broadly similar, the patterns deviate locally in that the areas of poorer sorting (upper
panels) and positive skewness (lower panels) have increased in 2005, especially in the
western and eastern parts of the outer trough. More important, however, is the fact that in
both data sets, sorting and skewness show the same relationship towards each other and
with grain size, poor sorting being associated either with more negative or more positive
skewness, the former being coarser-grained, the latter finer-grained. These trends are also
evident in the scatter diagrams of sorting and skewness versus mean grain size (Fig. 3.8). In
both years, most of the sediments are very well to moderately well sorted (upper panels) with
symmetrical to near-symmetrical size distributions (lower panels) regardless of grain size.
Poorly sorted outliers are either positively or negatively skewed in both years, but are more
prominently represented in 2005, indicating an expansion of mixed sediments.

50
Figure 3.8 Comparison of textural parameters. Upper panels: sorting versus mean grain size
(phi); lower panels: skewness versus mean grain size (phi). Leftpanels: 1989; right panels:
2005.
In the context of this study it was of particular interest to ascertain which sediment size
classes showed the greatest change between 1989 and 2005. Since the mobility of the
sediment should increase with decreasing grain size, one would intuitively expect the
smallest changes to have occurred in the coarse sediments. A comparison of the distribution
patterns of individual size classes (Fig. 3.9), however, shows exactly the opposite. Contrary
to expectations, the most notable feature is the change in the content of coarse sand which,
in particular, increased around the outer trough (Fig. 3.9A). As a consequence, the medium
and fine sand contents decreased somewhat, while maintaining their overall distribution
patterns remarkably well (Fig. 3.9B, C). The very fine sand content is negligible and therefore
less revealing in this context (Fig. 3.9D).
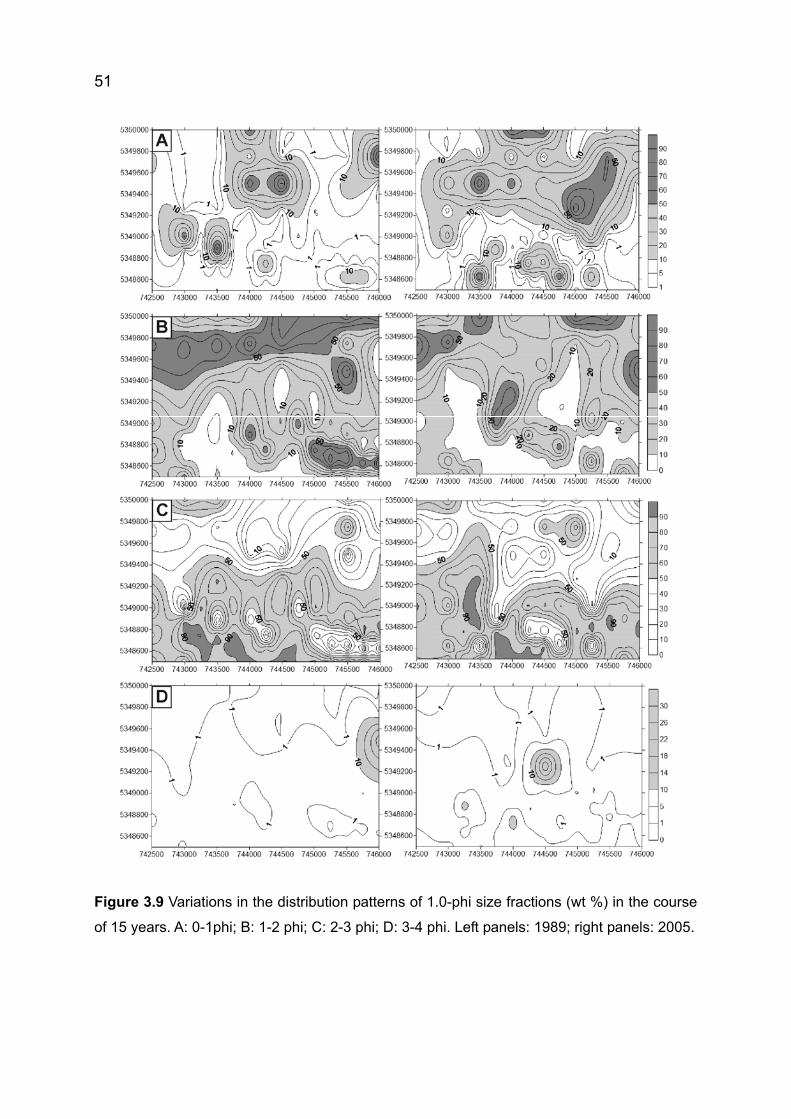
51
Figure 3.9 Variations in the distribution patterns of 1.0-phi size fractions (wt %) in the course
of 15 years. A: 0-1phi; B: 1-2 phi; C: 2-3 phi; D: 3-4 phi. Left panels: 1989; right panels: 2005.
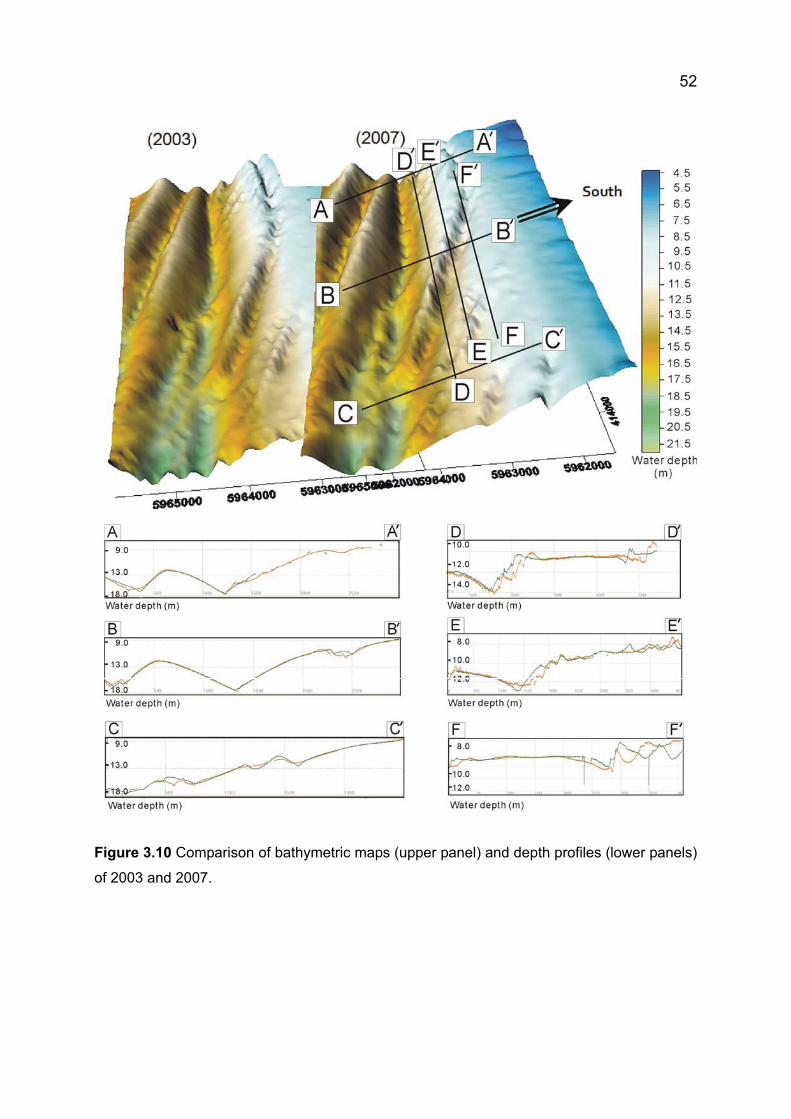
52
Figure 3.10 Comparison of bathymetric maps (upper panel) and depth profiles (lower panels)
of 2003 and 2007.
53
3.3.3 Changes in ridge topography between 2003 and 2007
Multi-beam surveys carried out in 2003 and 2007 were evaluated to document changes in
ridge morphology over this five-year period. In Fig. 3.10, the two three-dimensional
topographic maps (upper panel) generated from the multi-beam data are shown together with
three shore-normal and three shore-parallel bathymetric profiles (lower panels). For a better
view, the 3D-map projections have been vertically exaggerated (factor of ca. 55) and rotated
90° clockwise with illumination from the left. At the chosen scale, pronounced changes
between the maps are not evident and the overall configurations of the ridges and the
troughs, i.e. their location, shape and elevation, have remained remarkably stable over the
five-year period. Small topographic features (bumps and holes) visible on both projections
may represent bedforms, artifacts (dynamic motion residuals of the multi-beam echo-
sounder) emphasized by the strong vertical exaggeration, or a combination of both.
In order to highlight any small-scale changes, the bathymetric profiles of the three shore-
normal and shore-parallel transects have been superimposed (Fig. 3.10, lower panels). Along
the shore-normal transects (A-C), no significant variations in morphology are evident. In
particular, the locations of the ridge crest and trough axes have remained in place, although
some erosion and deposition in and near the troughs can be seen locally. Here, the changes
in elevation amount to less than 1 m. On the other hand, along the shore-parallel transects
(D-F) greater vertical fluctuations can be seen, especially in the inner trough and on the inner
ridge crest. These fluctuations are due to small current-generated bedforms which occur
exclusively in the fine and medium sands, i.e. on the inner ridge crest, on the landward flank,
and on the upper seaward flanks, both in 2003 and 2007. Since the bedforms are mobile
features, it is unlikely that they would have been recorded in precisely the same locations at
the different survey times. They hence intimate topographic changes which, in reality, merely
reflect the displacement of bedforms. Because of their orientation, they are picked up more
readily on the shore-parallel transects but less so on the shore-normal ones. It is interesting
to note that the occurrence of bedforms on ridge crests and flanks does not appear to affect
the long-term stability of the ridges.
54
3.4 Discussion
3 .4.1 Grain-size patterns
In this study, the sediment distribution patterns across a ridge and trough system off
Spiekeroog island are well defined according to the topography of the ridges. Such strict
relationships between grain size and ridge morphology have also been observed on ridge
systems located in other physical settings. Thus, the sand ridges on the Flemish Banks are
characterized by coarser sediments on the ridge crests than in adjacent troughs (Trentesaux
et al., 1994), i.e. a reverse pattern to that observed on the ridges discussed here. Of the
sand ridges on the New Jersey continental shelf, Stubblefield and Swift (1981) report the
coarsest sediments to occur on the landward flanks (up-current slope), whereas fine
sediments dominate seaward of the crest and down the seaward flank (down-current slope).
This pattern, which in some respects is similar to that reported in this study, has been
interpreted to reflect the effect of storm flow accelerating towards the up-current crests and
resulting in the deposition of coarse sediments, whereas the expanding flow beyond the crest
decelerates and hence causes deposition of finer sediment on the down-current slope (Swift
and Field, 1981a, b; McBride and Moslow, 1991). Sand ridges on the inner shelf off west-
central Florida, in turn, are characterized by fine to very fine siliciclastic sand on the
southeastern sides (landward flanks) and by shell hash on their northwestern sides (seaward
flanks). This has been interpreted to be the result of south-flowing currents generated during
winter storms that winnow the fine sediment from the troughs (Twichell et al., 2003; Harrison
et al., 2003). These examples emphasize that shoreface-connected ridges in different parts
of the world display both similar and dissimilar sedimentary features, suggesting that the
mechanisms controlling them are not the same everywhere in spite of the similarities in size,
shape and orientation.
In the present study, the sediment distribution over the ridges is characterized by fine sand
on the crests, medium sand on the ridge flanks and in the inner trough, and coarse sand
(including some fine gravel and occasional pebbles) in the outer trough. Considering this
grain-size spectrum, the question arises as to the source or sources of the sediment. In their
global comparison, Swift et al. (1978) suggested that the coarse material of the ridge system
off the East Frisian barrier island coast was probably carried up the shoreface from deeper
water. If this were true, then it is indeed strange that the coarse sediment never reached the
55
local beaches (cf. also Son et al., 2009). This would have to be anticipated because of the
progressive increase in hydrodynamic energy and wave asymmetry as the water depth
decreases. Instead, the coarse terrigenous material is limited to water depths below about 12
m.
In this context it has to be remembered that the East Frisian barrier island system is strongly
transgressive (erosional), i.e. the sediment deficit created by sea-level rise is not
compensated by the import of material from external sources (e.g. Flemming, 2002). As a
consequence, the barrier island system migrates shoreward while aggrading vertically,
sediment being eroded from the shoreface and transported into the back-barrier basins. A
much more likely source of the sediments composing the ridge and trough system is thus the
shoreface itself. Finer sediments are readily eroded and carried shoreward where they form
the bulk of the sediments composing the upper shoreface, the island beaches and the back-
barrier tidal flats. Medium sands, which are much less mobile, are merely dispersed around
the source areas on the lower shoreface, whereas the coarse material forms in situ
palimpsest lag deposits eroded from locally exhumed Pleistocene tills and glacial outwash
material as already suggested by Krügel (1922) and reemphasized by Son et al. (2006,
2009). Being trapped in the troughs, the well sorted in situ lag deposits frequently get mixed
along their margins with medium sands, especially during storms, to produce poorly sorted
and positively skewed coarse-grained deposits. The spatial expansion of the coarse lag
deposits in the period between 1989 and 2005 may indicate spatially limited transport around
their source, although local winnowing of medium sand covering parts of the coarser lag
deposits on the lower flanks cannot be discounted. At the other end of the size spectrum, the
fine sands on the crests are frequently mixed along their margins with medium sands to
produce poorly sorted and negatively skewed finer-grained deposits. Such mixing processes
and their textural expression have been described in detail by Flemming (1988, 2007).
3.4.2 The role of wave action
The most striking feature in the temporal variations of grain size distributions over the 15-
year period covered in this study is the apparent expansion of the area occupied by coarse
sands (including gravels) in the outer trough. As already argued by Son et al. (2009), even
the peak flow velocities attained by the tidal currents in the troughs of the study area (36 and
30 cm s-1 in the ebb and flood phases respectively) are insufficient to account for the
observed distribution and apparent mobility of the coarse material. This conclusion is
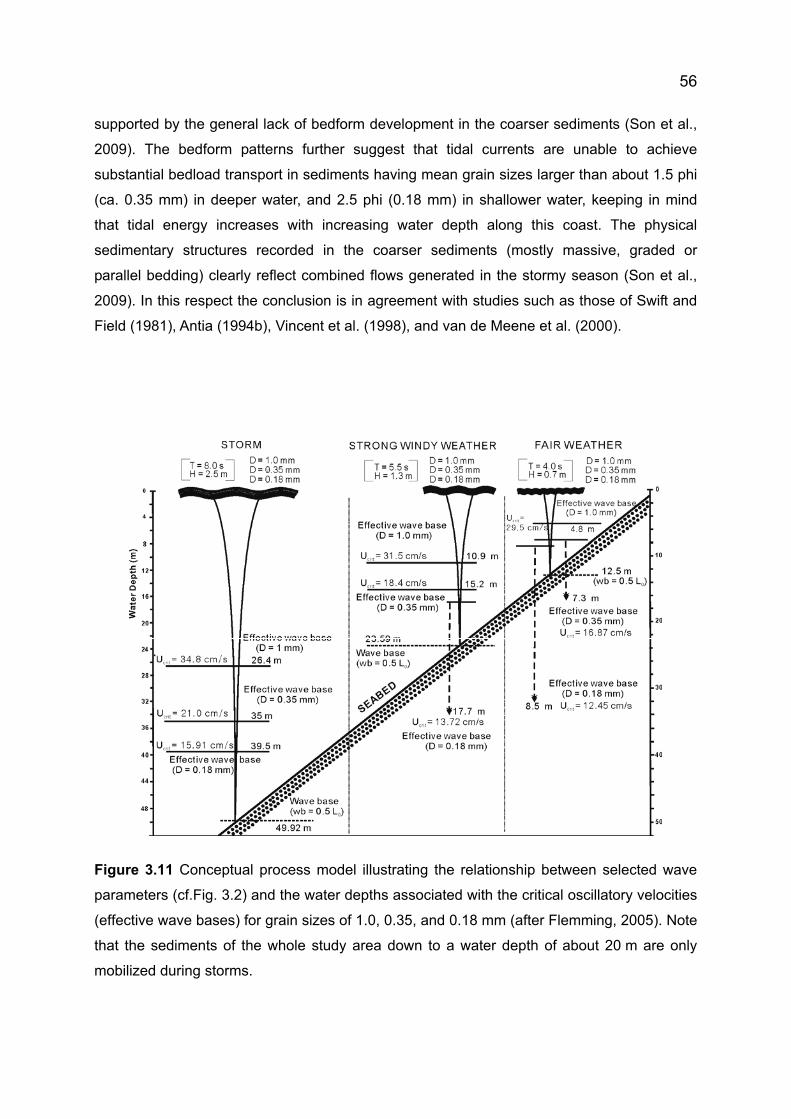
56
supported by the general lack of bedform development in the coarser sediments (Son et al.,
2009). The bedform patterns further suggest that tidal currents are unable to achieve
substantial bedload transport in sediments having mean grain sizes larger than about 1.5 phi
(ca. 0.35 mm) in deeper water, and 2.5 phi (0.18 mm) in shallower water, keeping in mind
that tidal energy increases with increasing water depth along this coast. The physical
sedimentary structures recorded in the coarser sediments (mostly massive, graded or
parallel bedding) clearly reflect combined flows generated in the stormy season (Son et al.,
2009). In this respect the conclusion is in agreement with studies such as those of Swift and
Field (1981), Antia (1994b), Vincent et al. (1998), and van de Meene et al. (2000).
Figure 3.11 Conceptual process model illustrating the relationship between selected wave
parameters (cf.Fig. 3.2) and the water depths associated with the critical oscillatory velocities
(effective wave bases) for grain sizes of 1.0, 0.35, and 0.18 mm (after Flemming, 2005). Note
that the sediments of the whole study area down to a water depth of about 20 m are only
mobilized during storms.
57
On tidal shorefaces, the nature of the interaction between tidal flows and wave-generated
oscillatory flows depends on how the respective current vectors are aligned to each other in
the course of a tidal cycle. The result can be to accelerate, decelerate, or neutralize a current
component (e.g., Héquette et al., 2008). In the present case, the orientation of the ridge
system is parallel to the paths of north-westerly storms but oblique to the tidal currents.
During the flood phase, the onshore current component is enhanced, whereas the offshore
one is slowed down or neutralized. The situation is reversed during the ebb phase. In
addition, the turbulence created by this interaction will promote sediment resuspension at the
seabed (Wright et al., 1991; Vincent et al., 1998). The flood-oriented asymmetry of flow-
transverse bedforms (small dunes) in the fine and medium sands (Son et al., 2009) suggests
that there is a net onshore residual flow on the crests and flanks of the lower shoreface.
Unclear to date are the environmental circumstances required to mobilize these sediments,
i.e. fair weather, strong winds or storms. Only in the case of the coarse sediment have storm
conditions been identified as the only viable option. In order to assess the role of waves, the
modelling approach proposed by Flemming (2005) was adopted. The results listed in Table 1
are also presented visually in a conceptual process model (Fig. 3.11). As pointed out in the
introduction, the flood current reaches 40 cm s-1 on the crests and 45 cm s-1 on the flanks of
the ridges, whereas the ebb current reaches 36 and 40 cm s-1 respectively. In both cases this
would generate current ripples but not dunes. In order to produce the dunes observed in the
fine and medium sands, considerable enhancement of the flood current is required. The
wave threshold velocities for grain sizes of D = 0.18 mm (fine sand) and D = 0.35 mm
(medium sand) are 12.5 and 16.9 cm s-1 respectively. For typical fair-weather waves of
period T = 4 s and a height of H = 0.7 m (cf. Fig. 3.2), such velocities are restricted to water
depths of 7.3 and 8.5 m respectively (Fig. 3.11).

58
Table 3.1 Critical oscillatory flows for selected wave parameters and grain sizes.
Grain size Wave period Wave height Critical velocity Water depth
D (mm) T (s) H (m) Ucritw (cm s-1) d (m)
0.18 4.0 0.7 12.45 8.5
0.35 4.0 0.7 16.87 7.3
1.00 4.0 0.7 29.50 4.8
0.18 5.5 1.3 13.72 17.7
0.35 5.5 1.3 18.40 15.2
1.00 5.5 1.3 31.50 10.9
0.18 8.0 2.5 15.91 39.5
0.35 8.0 2.5 21.00 35.0
1.00 8.0 2.5 34.80 26.4
The effective wave base during fair-weather conditions is thus restricted to the upper
shoreface. To explain the occurrence of small dunes on the lower shoreface, the flood
current must therefore be substantially enhanced by waves of longer periods and heights.
Similarly, the effective fair-weather wave base for coarse sand (D = 1 mm, Ucritw = 29.5 cm s-
1) is restricted to water depths shallower than 4.8 m (Fig. 3.11).
If we consider the situation of strong windy weather with waves of period T = 5.5 s and a
height of H = 1.3 m (cf. Fig.3. 2), the effective wave base for fine and medium sand (13.7 and
18.4 cm s-1) deepens to 15.2 and 17.7 m respectively. Under such conditions, the flood
current on the upper part of the lower shoreface is marginally enhanced, although it is not
conceivable that this will be sufficient to generate small dunes. In the case of the coarse
sand (D = 1 mm), the threshold conditions (Ucritw = 31.5 cm s-1) are limited to water depths
shallower than 10.9 m. At greater depths maximum orbital velocities decrease rapidly and will
therefore not be able to enhance the tidal current sufficiently to mobilize the lag deposits.
Finally, under storm conditions with waves of period T = 8 s and a wave height of H = 2.5 m
59
(cf. Fig. 3.2), the critical threshold velocities for the fine, medium and coarse sands are 15.9,
21.0 and 34.8 cm s-1 respectively. These velocities define effective wave bases at water
depths of 39.5, 35, and 26.4 m respectively. In the case of the fine and medium sands, the
flood current is significantly enhanced to achieve the velocities required for the generation of
dunes. In the case of the coarse sand, the tidal current is sufficiently enhanced to attain lower
plane bed transport, the condition required to generate the graded or parallel bedding
observed in box cores (Son et al., 2009).
3.4.5 Conclusions
Grain size patterns, internal sedimentary structures, and results of wave modelling
unanimously support the conclusion that the shoreface-connected ridges off the East Frisian
barrier islands (and possibly elsewhere) are controlled by combined flows produced during
storms. During such high-energy conditions, threshold velocities capable of moving coarse
sand are marginally exceeded, while small dunes are generated in fine and medium sands
which are later also maintained during strong wind events. Together they produce a
remarkably stable shoreface system. Fair-weather conditions, by contrast, have no influence
on lower shoreface processes along the coast of the southern North Sea (and probably
elsewhere).
Acknowledgements
This study was supported by a Korea Science and Engineering Foundation Grant funded by
the Korean Government (M60-2004-000-10524). We are grateful to Arnulf Moeller, Astrid
Raschke and Nicol Mahnken-Rötzer for technical support in the laboratory. In addition, we
wish to thank the captain and crew of the RV Senckenberg for logistical support in the field.
60
4. Sediment transport patterns on an ebb-tidal delta of the East Frisian
barrier-island system, southern North Sea.
Chang Soo SON, Burghard W. FLEMMING and Alexander BARTHOLOMÄ
Abstract
The sedimentology and morphodynamics of the Otzum ebb-tidal delta, located along the
East Frisian barrier-island coast, southern North Sea, were investigated on the basis of its
morphological evolution, sediment distribution patterns, and internal sedimentary structures.
Bathymetric charts reveal that, over the last 50 years, the size of the Otzum ebb-tidal delta
has slightly shrunk, while sediment has accreted on the ebb-delta lobe to the east of the
main inlet channel (to the west of Spiekeroog island). In this period, swash bars
superimposed on the eastern ebb-tidal shoal (Robben Plate), which is partly separated by a
flood tidal channel from the western head of Spiekeroog, migrated south- or southeastward,
i.e. towards the inlet, regardless of seasonal changes in wave climate. The spatial distribution
of mean grain size and the mineralogical composition of the sediment have revealed that the
main ebb-delta body is composed of fine quartz sand, while the superimposed swash bars
and the inlet channel bed consist predominantly of medium-grained quartz sand containing
high proportions of coarser bioclastic material. Internal sedimentary structures in short box-
cores (up to 30 cm) are dominated by flood oriented cross-beds which, in some places, are
strongly bioturbated. Longer vibro-cores (up to 1.5 m), on the other hand, show that, at depth,
the sediment is mainly composed of storm-generated parallel (upper plane bed) laminations
with intercalated shell layers and dune cross-bedding. The dip directions of the cross-bedded
sands in both box-cores and vibro-cores from the ebb-delta shoal are dominantly directed
towards the south or southeast, indicating transport towards the inlet by the flood current.
These patterns demonstrate that, contrary to previous contentions, the sediments of the
highly mobile swash bars are continually being recirculated by the combined action of tidal
61
currents and waves. In this model, the cycle begins with both fine and medium sands,
including shell hash, being transported seaward in the main ebb channel until they reach the
shallow ebb-delta front. From here the sediment is pushed onto the eastern ebb-delta shoal
by wind-generated waves and low-amplitude swells, the sediment getting rapidly size-sorted
in the process. The medium sands together with the shell hash are formed into swash bars
which, in response to the combined action of waves and flood current, migrate along arcuate
paths over a base of fine sand back to the main ebb channel located south of the ebb-delta.
At the same time, the fine sand is concentrated in the shallow channels between the swash
bars, where the flood current generates small dunes which migrate southeastward until they
cascade into the large flood channel located to the west of Spiekeroog island. From here the
fine sand is fed back into the main ebb channel to complete the cycle. There is little evidence
for sediment being transported eastward along the island shore. These observations clearly
refute previously postulated sediment bypassing models.
Key words: ebb-tidal delta, ebb-tidal shoal, swash bars, sediment recycling, tidal currents,
wave action
4.1 Introduction
Tidal inlets along barrier coastlines throughout the world show a high diversity in morphology,
hydraulic signature, and sediment transport patterns (e.g. Buynevich and FitzGerald, 2003).
Ebb-tidal deltas are usually part of such inlet systems with sediment accumulating on the
seaward side of the tidal inlets. In general, ebb-tidal deltas are best developed along upper
mesotidal coasts (2.0 < TR <3.5 m), whereas well-developed flood-tidal deltas preferentially
occur along micro- and lower mesotidal coasts (TR <2.0 m) (Hayes, 1978; FitzGerald et al,
1984). Moreover, there is a close relationship between inlets and ebb-tidal deltas in terms of
evolution, morphodynamics and sediment transport. The morphodynamic behavior of ebb-
tidal deltas have, amongst others, been studied by Hayes (1975), FitzGerald et al. (1984),
Eitner (1996), Hicks and Hume (1997), Burningham and French (2006), and Son et al. (2007),
whereas patterns of sediment transport along the periphery of inlets have, amongst others,
62
been assessed by Nummedal and Penland (1981), Hanisch (1981), Sha (1989a, b), and
Cheung et al. (2007). In the course of this ebb-delta research it has been demonstrated that
the volume of ebb-tidal deltas is dependent on the size of the tidal prism (e.g. Kana and
Mason 1988; Sha and Van den Berg, 1993; Hughes, 2002; Powell et al., 2006), while
sediment movement on ebb-tidal deltas and along their periphery is driven by tidal currents
and waves (Powell et al., 2006, Beck et al., 2008). In addition, a number of numerical models
calculating sediment transport rates on ebb-tidal deltas and in associated inlet systems have
been presented (e.g. Özssoy, 1986; Kana et al., 1999; van de Kreeke, 2006; Wang et al.,
2008). Many of these studies have suggested that sediment bypassing is the most common
feature characterizing inlet systems, i.e. sediment supplied by alongshore transport is
delivered to the up-drift side of an inlet, from where it is transported across the ebb-delta
towards the down-drift side, from where, in turn, it continues down the coast. Indeed, this
bypassing model appears to have been widely accepted as the main transport pattern in the
vicinity of inlet systems by many researchers, only a few studies challenging this concept, e.g.
Tanner (1987) in the case of the Gulf coast of Florida, Hanisch (1981) in the case of the
Harle ebb-delta located along the southern North Sea coast of Germany, Flemming and
Davis (1994) in the case of the Otzum ebb-delta, also located along the southern North Sea
coast of Germany, Smith and FitGerald (1994) in the case of the Essex River inlet located
along the coast of Massachusetts, USA, and Elias et al. (2006) in the case of Texel inlet
located along the coast of The Netherlands.
For the upper mesotidal East Frisian barrier-island coast, inlet sediment bypassing had
initially been postulated to proceed in the form of swash bars, fed by sediment from the
updrift shore, migrating along the periphery of the ebb-delta lobes towards the downdrift
shore, this having been inferred from a series of aerial photographs (Homeier and Kramer,
1957; Lüders et al., 1972). Based on the same data, this interpretation was later also
propagated by Nummedal and Penland (1981), and Fitzgerald et al. (1984). Alternative
interpretations, which challenged the bypassing model, were offered by Hanisch (1981),
Ehlers (1984), and Flemming and Davis (1994). These mutually exclusive interpretations
therefore warranted a closer in situ look at sediment transport directions on the ebb-deltas of
the East Frisian barrier-island system. The objectives of the present study thus were to
document the sedimentary and morphodynamic characteristics of the Otzum tidal delta, one
of the inlets of the East Frisian barrier island coast, and to reconstruct sediment transport
pathways on the basis of historical maps, modern nautical charts, sediment distribution
patterns, and internal sedimentary structures.

63
4.2 Study area
The East Frisian barrier islands are situated along the southern North Sea coast of Germany.
Of these, the islands of Langeoog and Spiekeroog are the third- and second-last islands from
the west, respectively. The Otzum inlet, which is located between Langeoog and Spiekeroog
(Fig. 4.1), has a semi-diurnal mesotidal regime with a mean tidal range of 2.8 m and a tidal
prism of around 114 x 106 m3 (Postma 1982). The tidal wave approaches from the west and
rotates counter-clockwise around an amphidrome located in the central North Sea. Seaward
of the inlet, a ca. 20 km2 large ebbdelta is located which is dissected by a large ebb channel
in the centre, two marginal flood channels, and numerous smaller tidal channels located
between the swash-bars superimposed on the ebb-delta (Figure 4.1A). Maximum current
velocities in the inlet during calm weather reach velocities of 0.7-1.3 m s-1 (Davis and
Flemming, 1995). In general, the ebb tidal cycle is of shorter duration and the current hence
slightly stronger than during the flooding tide. An analysis of local wind data reveals that a
two-fold increase in the frequency and a fourfold increase in the duration of winds exceeding
6 Bft has occurred in the German Bight since 1989, a situation that has persisted to the
present day. As shown by Tilch (2003), strong winds of 6-7 Bft are not restricted to the stormy
winter months, but can occur throughout the year. In addition, the frequency of winter storms
has increased significantly in the second half of the last century. The more severe storms
generally approach from the west or northwest, and in the year 2005 were associated with
elevated water levels reaching up to 3 m above mean high-tide at the gauge station on the
island of Norderney (Fig 4.2, upper panel, NLWKN, 2006). However, storm surge simulations
(Bork et al., 2005) have predicted potential water levels at the Norderney gauge of up to 4 m
above mean high-tide (Fig. 4.2, lower panel).

64
Figure 4.1 Location map of the study area. 0 m water depth = mean spring-tide low water
level; contours in meters. (A) Surface sediment sampling stations. (B) Box-coring stations.
(C) Vibro-coring stations.
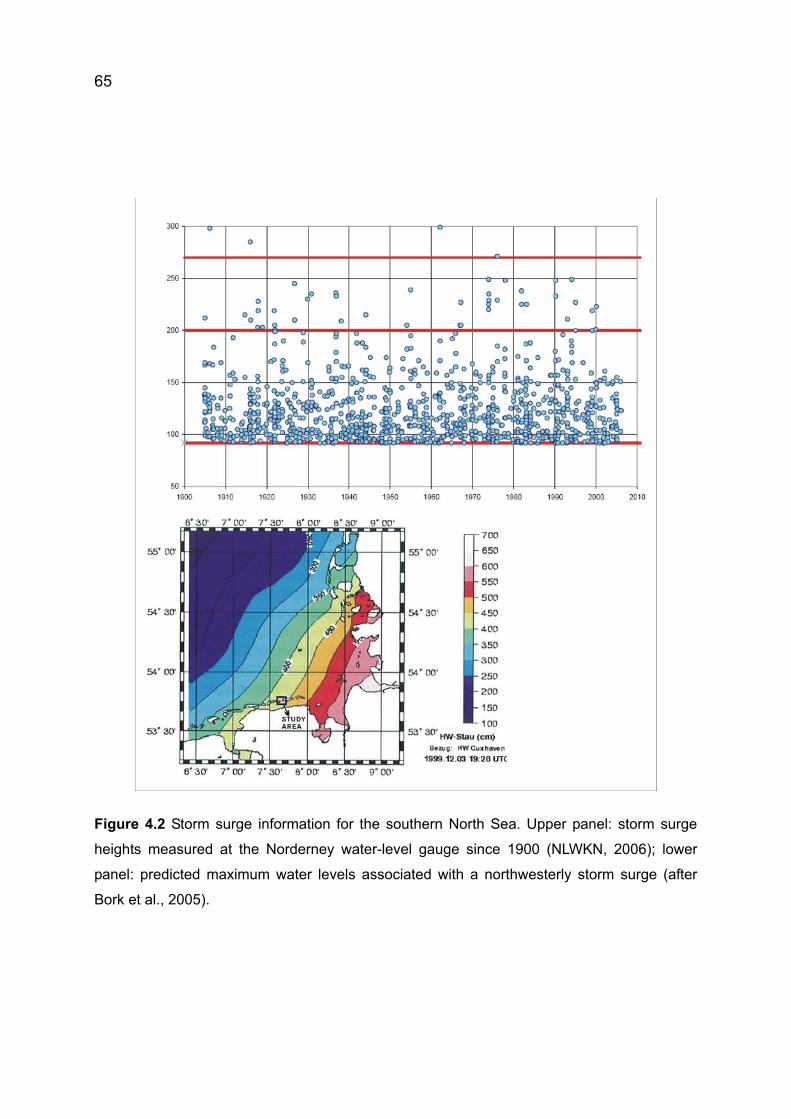
65
Figure 4.2 Storm surge information for the southern North Sea. Upper panel: storm surge
heights measured at the Norderney water-level gauge since 1900 (NLWKN, 2006); lower
panel: predicted maximum water levels associated with a northwesterly storm surge (after
Bork et al., 2005).
66
4.3 Materials and methods
Altogether, 333 sediment samples were collected on the ebb-tidal delta on a regular grid
defined by constant geographic intervals (0.15’ Latitude and 0.25’ Longitude) in the course of
three field campaigns between August and October 2005 (Fig 4.1A). In the deeper subtidal
areas, the samples were collected by means of a Shipek grab sampler deployed from the RV
Senckenberg, positions being fixed by a Thales Aquarius 5000 LRK (Long Range Kinematic)
DGPS (accuracy <1 m). The intertidal and shallow subtidal areas where sampled around
high tide from a shallow-draught motor boat using a small, hand-operated van Veen grab
sampler, the positions being fixed by means of a hand-held GPS in this case (accuracy ca. 3
m). Equivalent grain-size distributions of the sediment samples were determined by a high-
resolution settling tube (Brezina, 1985; Flemming & Ziegler, 1995) after having been
processed according to standard laboratory procedures (Carver, 1971). Textural parameters
were calculated on the basis of percentile statistics defined in Folk and Ward (1957).
In addition, 60 short box-cores (up to 28 cm in length) and 9 vibro-cores (up to 1.72 m long)
were recovered on the ebb-tidal shoal at low tide (Fig. 4.1B, B’). The boxes (5-liter metal
canisters) had a rectangular plan shape of 15 x 8 cm and a height of 30 cm. After draining
excess pore water, the boxes were laid flat and cut open lengthwise on two opposite sides
(30 x 15 cm). A ca. 5-cm thick sand layer was then removed to avoid potentially disturbed
sediments near the box walls. The exposed section was planed off and dried overnight in an
oven at 80°C. After drying, epoxy peels were made by pouring a resin-hardener mixture on
the planed sediment until the entire surface was soaked. The boxes were then placed in the
oven and left to cure at a temperature of 100°C. The sectioned vibro-cores were cut in half
lengthwise and left overnight to partially dry in air. Epoxy peels were then made by applying
the pouring method of Reineck (1970) using a resin-hardener mixture able to cure in partly
wet sediment and exposed to the air. Once cured, the epoxy peels of both the box-cores and
the vibro-cores were photographically documented and then described in detail, giving
particular attention to physical and biogenic sedimentary structures. The dip directions of the
larger-scale cross-beds, which were determined on the basis of core orientations in the field,
were determined from the compass readings marked on the boxes and core pipes before
extraction.
The evolution of the Otzum tidal basin was reconstructed on the basis of historical charts
dating back almost 400 years. The shorter-term morphodynamics of the Otzum ebb-tidal
delta was determined by comparing nautical charts of the last 50 years. Four of these were
67
digitized with MapViewer 7 (Golden SoftwareTM) before being analysed for erosion/accretion
tendencies using the software program Surfer (Golden SoftwareTM), and applying the
‘triangulation with linear interpolation gridding method’ (Lee and Scachter, 1980). In addition,
very short-term local topographic changes were monitored by three leveling surveys along an
east-west transect on the eastern ebb-delta lobe (Robben Plate) in June 2006, January 2007
and April 2007, respectively, using a theodolite in combination with a portable GPS.
4.4 Results
4.4.1 Morphological changes
Land reclamation along the East Frisian mainland coast has partly resulted in dramatic
reductions of the tidal prisms of individual tidal basins over past centuries. The only exception
is the tidal catchment draining through the Ozum tidal inlet, i.e. the inlet between the barrier
islands of Langeoog and Spiekeroog (Luck 1975; Flemming, 1991; Flemming and Davis,
1994). The reason for this opposing trend is the geometry of the mainland coast to the east
of the Otzum catchment produced in the wake of the severe storm surge of 1362, in the
course of which the so-called Harle embayment was excavated. This embayment, which
extended >10 km into the hinterland, was progressively reclaimed in the course of
subsequent centuries, the modern dike line having only been completed in 1960. After the
1362 storm surge, the eastern tidal divide of the Otzum tidal basin was attached to the
western margin of the Harle embayment which itself drained through the Harle inlet located
to the east of Spiekeroog. In the course of reclamation, the island of Spiekeroog doubled in
length towards the east, as a result of which the eastern tidal divide of the Otzum catchment
also migrated eastward, thereby progressively increasing its catchment area and hence the
tidal prism. The largest step was evidently accomplished between 1841 and 1860, as
reflected by the massive growth of the ebb-delta (Fig. 4.3) in response to the sudden
increase in the tidal prism. Since then, the area of the Otzum catchment has remained
essentially unchanged.
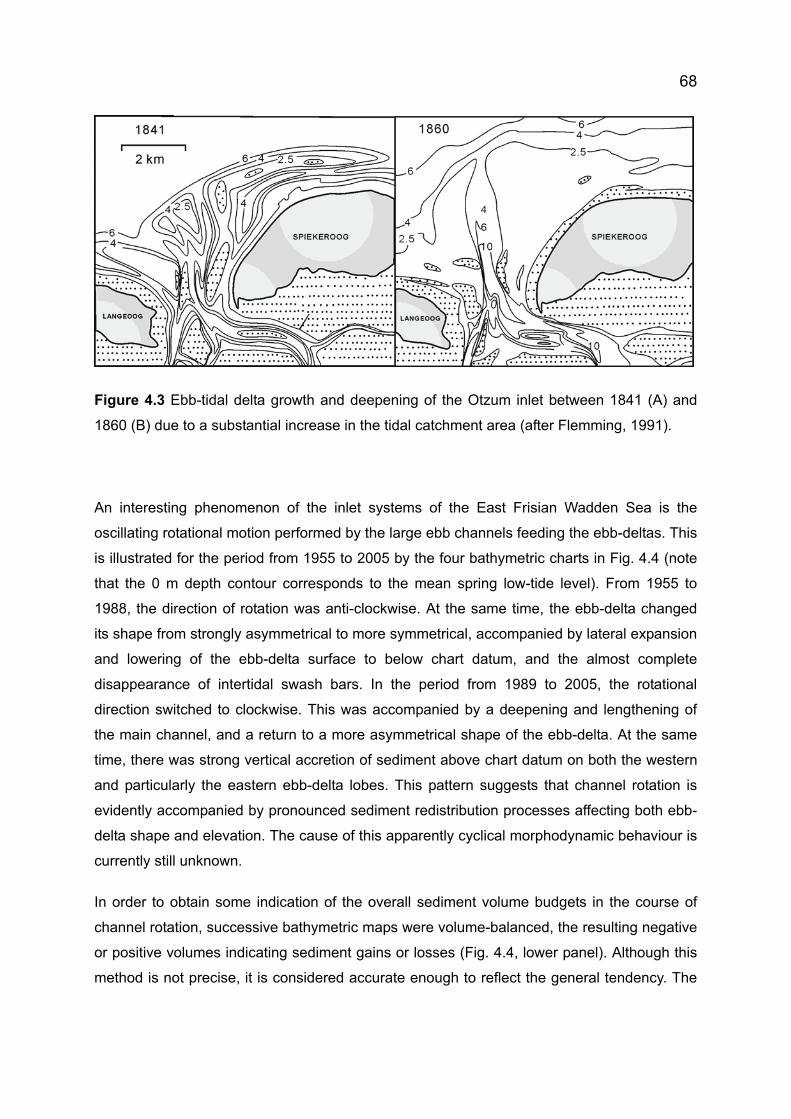
68
Figure 4.3 Ebb-tidal delta growth and deepening of the Otzum inlet between 1841 (A) and
1860 (B) due to a substantial increase in the tidal catchment area (after Flemming, 1991).
An interesting phenomenon of the inlet systems of the East Frisian Wadden Sea is the
oscillating rotational motion performed by the large ebb channels feeding the ebb-deltas. This
is illustrated for the period from 1955 to 2005 by the four bathymetric charts in Fig. 4.4 (note
that the 0 m depth contour corresponds to the mean spring low-tide level). From 1955 to
1988, the direction of rotation was anti-clockwise. At the same time, the ebb-delta changed
its shape from strongly asymmetrical to more symmetrical, accompanied by lateral expansion
and lowering of the ebb-delta surface to below chart datum, and the almost complete
disappearance of intertidal swash bars. In the period from 1989 to 2005, the rotational
direction switched to clockwise. This was accompanied by a deepening and lengthening of
the main channel, and a return to a more asymmetrical shape of the ebb-delta. At the same
time, there was strong vertical accretion of sediment above chart datum on both the western
and particularly the eastern ebb-delta lobes. This pattern suggests that channel rotation is
evidently accompanied by pronounced sediment redistribution processes affecting both ebb-
delta shape and elevation. The cause of this apparently cyclical morphodynamic behaviour is
currently still unknown.
In order to obtain some indication of the overall sediment volume budgets in the course of
channel rotation, successive bathymetric maps were volume-balanced, the resulting negative
or positive volumes indicating sediment gains or losses (Fig. 4.4, lower panel). Although this
method is not precise, it is considered accurate enough to reflect the general tendency. The

69
results suggest that there was an overall loss of sediment in the period from 1955 to 1988,
which is in line with the observed flattening of the ebb-delta. In the period from 1988 to 2005,
the situation reversed, the calculated net sediment gain being also reflected in the vertical
accretion visible on the chart of 2005.
Figure 4.4 Topographic and associated volume changes of the ebb-tidal delta in the course
of the last 50 years. Upper panels: bathymetric charts of the Otzum ebb-tidal delta and inlet
located between the islands of Langeoog and Spiekeroog: (A) 1955, (B) 1979, (C) 1988, (D)
2005; lower panels: volume changes calculated for the individual time intervals on the basis
of the digitized maps.
Considering the restricted area of observation, the time spans, and the sediment volumes
involved in net loss or gain, it is unclear whether any sediment was actually exported from or
imported to the ebb-delta in the 50-year period covered by the bathymetric surveys. It would
appear more plausible that we have merely been witnessing large-scale redistribution
processes in response to changing hydrodynamic conditions and involving a larger area than
covered by the volume balance. The high mobility of the ebb-delta sands is well documented
by the results of the three leveling surveys on the central part of the Robben Plate in the 10-
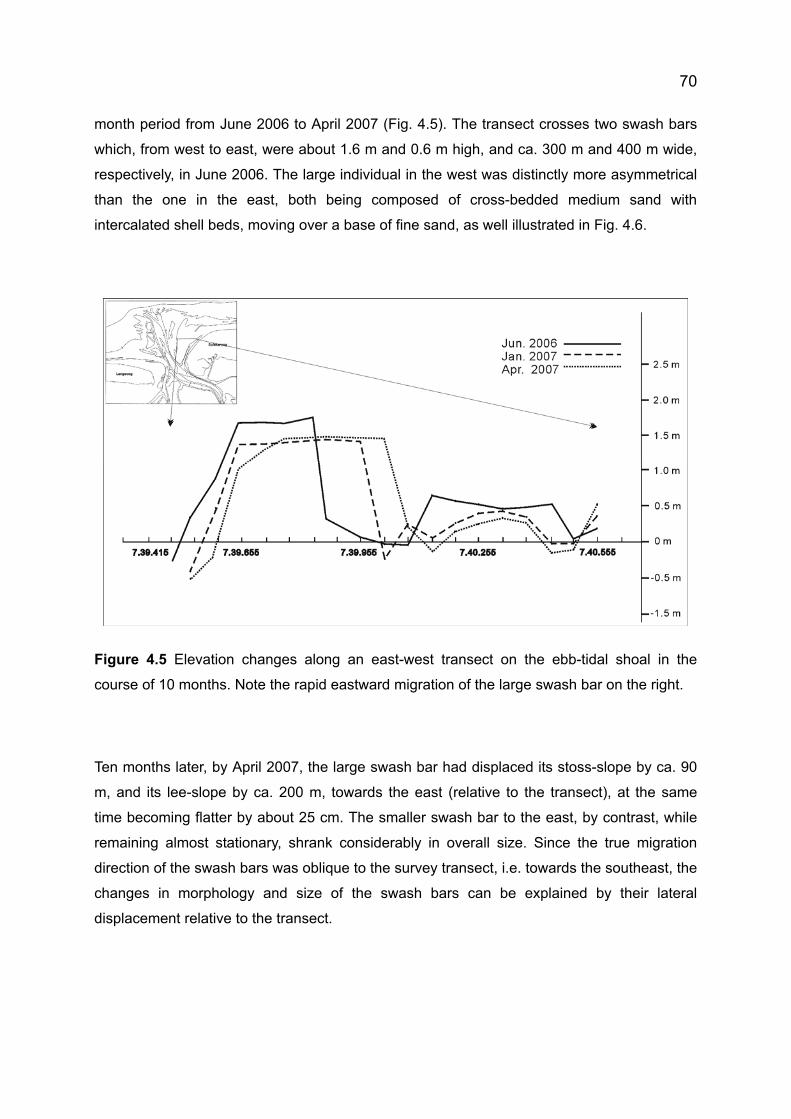
70
month period from June 2006 to April 2007 (Fig. 4.5). The transect crosses two swash bars
which, from west to east, were about 1.6 m and 0.6 m high, and ca. 300 m and 400 m wide,
respectively, in June 2006. The large individual in the west was distinctly more asymmetrical
than the one in the east, both being composed of cross-bedded medium sand with
intercalated shell beds, moving over a base of fine sand, as well illustrated in Fig. 4.6.
Figure 4.5 Elevation changes along an east-west transect on the ebb-tidal shoal in the
course of 10 months. Note the rapid eastward migration of the large swash bar on the right.
Ten months later, by April 2007, the large swash bar had displaced its stoss-slope by ca. 90
m, and its lee-slope by ca. 200 m, towards the east (relative to the transect), at the same
time becoming flatter by about 25 cm. The smaller swash bar to the east, by contrast, while
remaining almost stationary, shrank considerably in overall size. Since the true migration
direction of the swash bars was oblique to the survey transect, i.e. towards the southeast, the
changes in morphology and size of the swash bars can be explained by their lateral
displacement relative to the transect.
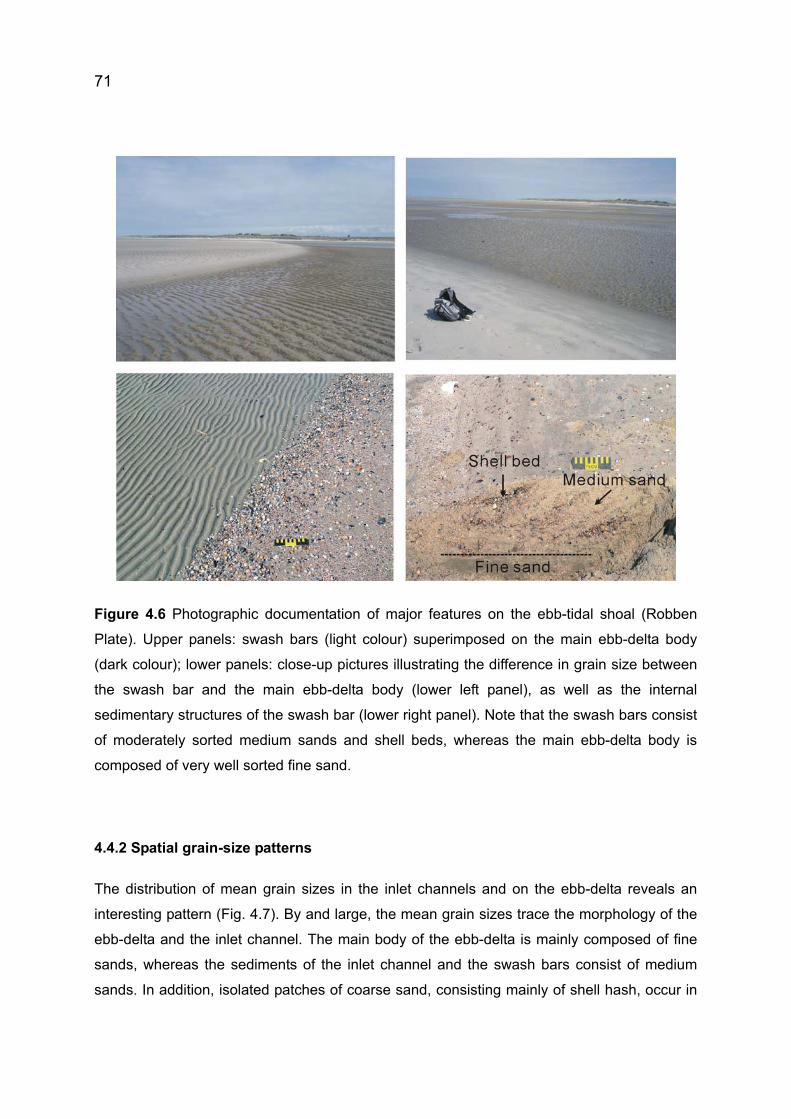
71
Figure 4.6 Photographic documentation of major features on the ebb-tidal shoal (Robben
Plate). Upper panels: swash bars (light colour) superimposed on the main ebb-delta body
(dark colour); lower panels: close-up pictures illustrating the difference in grain size between
the swash bar and the main ebb-delta body (lower left panel), as well as the internal
sedimentary structures of the swash bar (lower right panel). Note that the swash bars consist
of moderately sorted medium sands and shell beds, whereas the main ebb-delta body is
composed of very well sorted fine sand.
4.4.2 Spatial grain-size patterns
The distribution of mean grain sizes in the inlet channels and on the ebb-delta reveals an
interesting pattern (Fig. 4.7). By and large, the mean grain sizes trace the morphology of the
ebb-delta and the inlet channel. The main body of the ebb-delta is mainly composed of fine
sands, whereas the sediments of the inlet channel and the swash bars consist of medium
sands. In addition, isolated patches of coarse sand, consisting mainly of shell hash, occur in

72
the main channel. Of particular interest is the semi-circular arrangement of the areas
composed of medium sand, which include the main channel and the swash bars on the
eastern ebb-delta lobe. As will be seen later, this pattern traces the arcuate route of sediment
recycling reconstructed on the basis of the dip directions of cross-bedded sands on the ebb-
delta. Another important fact is that the swash bars on the western ebb-delta lobe also
consist of medium sand.
Figure 4.7 Distribution of mean grain sizes on the inlet/ebb-tidal delta system. Note that the
area as a whole is dominated by fine sand, whereas the channel bed and isolated patches
(swash bars) on the ebb-delta consist of medium sands.
The distribution patterns of individual size fractions (Fig. 4.8) enhance the picture drawn by
the mean grain sizes. Thus, the coarser size fractions (0-1 phi and 1-2 phi) show a patchy
distribution mirror-imaged by the patches of low concentration seen in the distribution of the
finer size fractions (2-3 phi and 3-4 phi). From the field observation we know that the coarser
size fractions were associated with the swash bars superimposed on the mostly finer-grained
ebb-delta body (Fig. 4.6). As a consequence, the fine and very fine sands appear as a sheet
covering the entire survey area, whereas the medium and coarse sands are concentrated in
well-defined patches, as outlined above.

73
Figure 4.8 Distribution patterns of individual grain-size fractions (wt.-%). (A) 0-1 phi. (B) 1-2
phi. (C) 2-3 phi. (D) 3-4 phi
The textural characteristics of the sediments of the inlet and ebb-delta system reveal that we
are dealing with mixtures of at least two grain-size populations. Thus, although the sediments
are mostly well to very well sorted, there is a distinct trend from better sorting in the finer
sands to poorer sorting in the coarser sands (Fig. 4.9, left panel). This probably reflects a
mixing sequence in which progressively more material of the coarser population is admixed
to that of the finer population, thereby gradually increasing the mean diameter and
decreasing the sorting. This is also reflected in the skewness coefficients (Fig. 4.9, right
panel), i.e. the best sorted fine sands are predominantly negatively skewed due to small
admixtures of medium and coarse sand. As the mean grain size increases and sorting
decreases, the skewness gradually changes from negative to positive values, i.e. the coarser
population gradually becomes dominant but has varying proportions of fine sand admixed to
produce

74
Figure 4.9 Comparison of textural parameters. Left panel: sorting in phi versus mean grain
size in phi; right panel: skewness versus mean grain size in phi
the positive skewness. The textural parameters thus reveal that the sediments of the main
ebb-body consist mainly of well to very well sorted, negatively skewed fine sand, whereas
the channel and swash-bar sediments consist predominantly of positively skewed and more
poorly sorted medium to coarse sands (Fig 4.10).
Figure 4.10 Comparison of the spatial patterns produced by sorting (left panel) and
skewness (right panel).
4.4.3 Internal sedimentary structures
Sedimentary structures were documented from 60 box-cores, collected at fixed positions at
different times, and from 9 vibro-cores recovered on the eastern ebb-delta shoal (Robben
Plate) (Fig. 4.1B, B’).
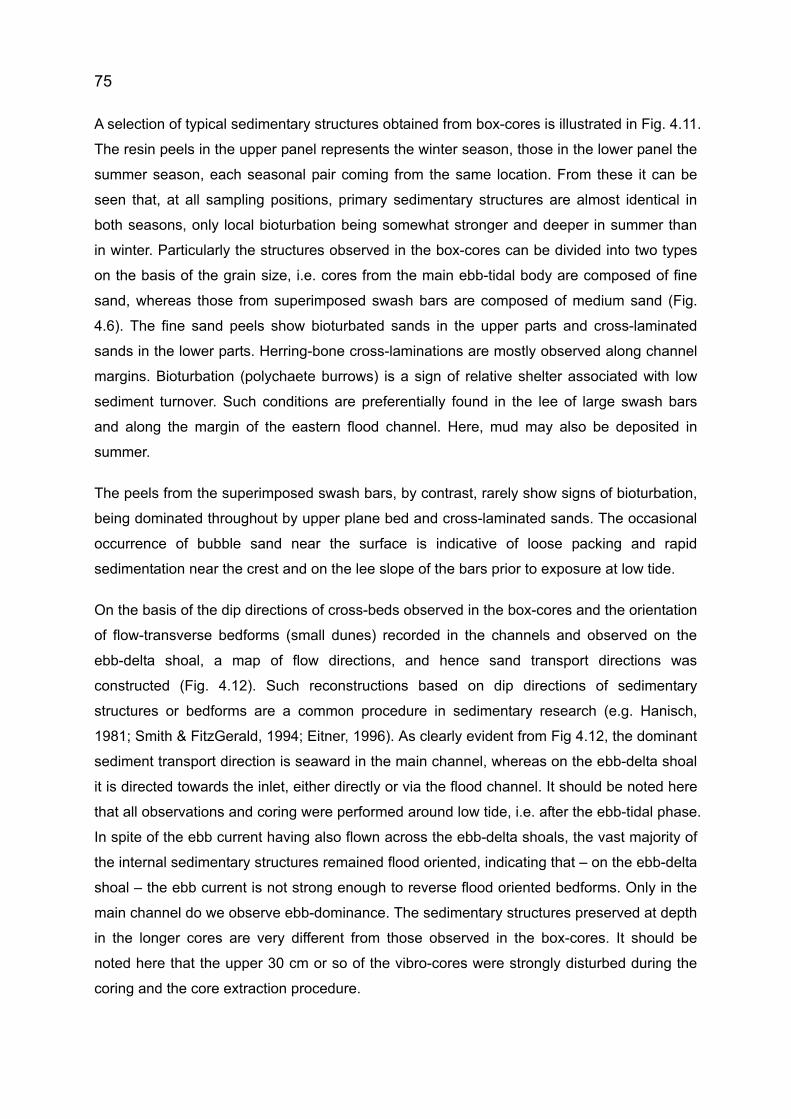
75
A selection of typical sedimentary structures obtained from box-cores is illustrated in Fig. 4.11.
The resin peels in the upper panel represents the winter season, those in the lower panel the
summer season, each seasonal pair coming from the same location. From these it can be
seen that, at all sampling positions, primary sedimentary structures are almost identical in
both seasons, only local bioturbation being somewhat stronger and deeper in summer than
in winter. Particularly the structures observed in the box-cores can be divided into two types
on the basis of the grain size, i.e. cores from the main ebb-tidal body are composed of fine
sand, whereas those from superimposed swash bars are composed of medium sand (Fig.
4.6). The fine sand peels show bioturbated sands in the upper parts and cross-laminated
sands in the lower parts. Herring-bone cross-laminations are mostly observed along channel
margins. Bioturbation (polychaete burrows) is a sign of relative shelter associated with low
sediment turnover. Such conditions are preferentially found in the lee of large swash bars
and along the margin of the eastern flood channel. Here, mud may also be deposited in
summer.
The peels from the superimposed swash bars, by contrast, rarely show signs of bioturbation,
being dominated throughout by upper plane bed and cross-laminated sands. The occasional
occurrence of bubble sand near the surface is indicative of loose packing and rapid
sedimentation near the crest and on the lee slope of the bars prior to exposure at low tide.
On the basis of the dip directions of cross-beds observed in the box-cores and the orientation
of flow-transverse bedforms (small dunes) recorded in the channels and observed on the
ebb-delta shoal, a map of flow directions, and hence sand transport directions was
constructed (Fig. 4.12). Such reconstructions based on dip directions of sedimentary
structures or bedforms are a common procedure in sedimentary research (e.g. Hanisch,
1981; Smith & FitzGerald, 1994; Eitner, 1996). As clearly evident from Fig 4.12, the dominant
sediment transport direction is seaward in the main channel, whereas on the ebb-delta shoal
it is directed towards the inlet, either directly or via the flood channel. It should be noted here
that all observations and coring were performed around low tide, i.e. after the ebb-tidal phase.
In spite of the ebb current having also flown across the ebb-delta shoals, the vast majority of
the internal sedimentary structures remained flood oriented, indicating that – on the ebb-delta
shoal – the ebb current is not strong enough to reverse flood oriented bedforms. Only in the
main channel do we observe ebb-dominance. The sedimentary structures preserved at depth
in the longer cores are very different from those observed in the box-cores. It should be
noted here that the upper 30 cm or so of the vibro-cores were strongly disturbed during the
coring and the core extraction procedure.
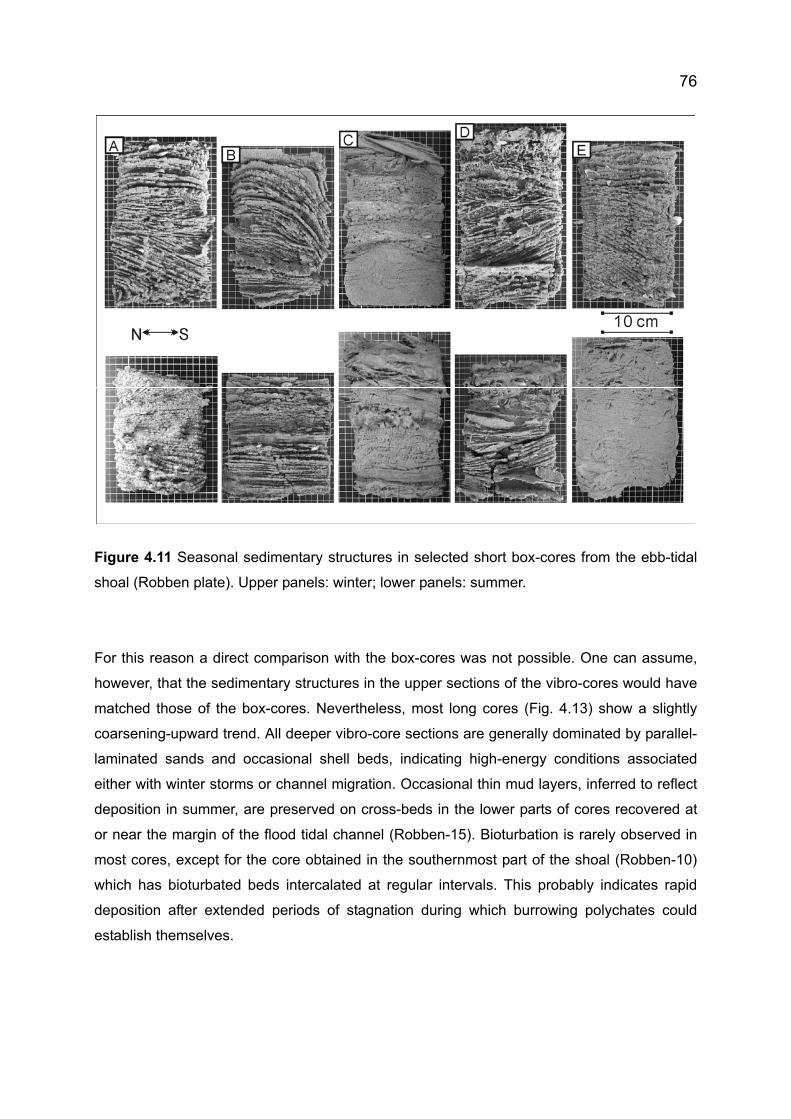
76
Figure 4.11 Seasonal sedimentary structures in selected short box-cores from the ebb-tidal
shoal (Robben plate). Upper panels: winter; lower panels: summer.
For this reason a direct comparison with the box-cores was not possible. One can assume,
however, that the sedimentary structures in the upper sections of the vibro-cores would have
matched those of the box-cores. Nevertheless, most long cores (Fig. 4.13) show a slightly
coarsening-upward trend. All deeper vibro-core sections are generally dominated by parallel-
laminated sands and occasional shell beds, indicating high-energy conditions associated
either with winter storms or channel migration. Occasional thin mud layers, inferred to reflect
deposition in summer, are preserved on cross-beds in the lower parts of cores recovered at
or near the margin of the flood tidal channel (Robben-15). Bioturbation is rarely observed in
most cores, except for the core obtained in the southernmost part of the shoal (Robben-10)
which has bioturbated beds intercalated at regular intervals. This probably indicates rapid
deposition after extended periods of stagnation during which burrowing polychates could
establish themselves.
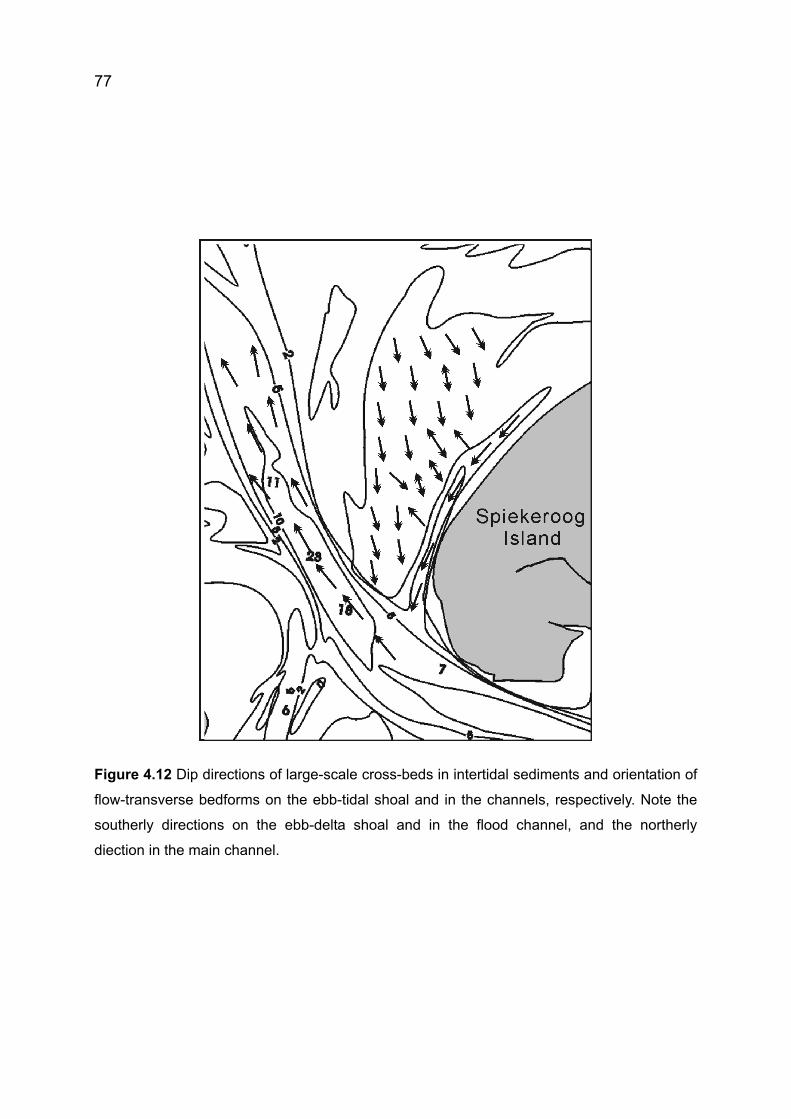
77
Figure 4.12 Dip directions of large-scale cross-beds in intertidal sediments and orientation of
flow-transverse bedforms on the ebb-tidal shoal and in the channels, respectively. Note the
southerly directions on the ebb-delta shoal and in the flood channel, and the northerly
diection in the main channel.

78
Figure 4.13 Sedimentary structures in vibro-cores from the ebb-tidal shoal (Robben
Plate).
79
4.5 Discussion
According to many authors, sediment transport in the vicinity of tidal inlets is thought to be
dominated by inlet bypassing resulting from littoral drift associated with wave-driven
longshore currents (e.g. Kraus, 2000; FitzGerald et al, 2001; van de Kreeke, 2006; Cheung
et al, 2007). While this may well be true for open ocean coastlines, it may not be applicable
to the southeastern North Sea. Although most storms, and hence wave fields, approach from
the west or northwest, and would thus potentially produce an easterly directed longshore
current along the southern North Sea coast, it is unclear to what extent such currents can
actually develop. Due to the pile-up of water in the funnel-shaped German Bight (cf. Fig. 4.2,
lower image) during initial storm phases, one would expect leakage in the form of return
flows along the coast and the deeper seabed, i.e. in the opposite direction to the storm-
driven water masses. As a consequence, any wave-induced longshore current may either be
counter-balanced, or at least be severely dampened, to the point that substantial littoral
sediment transport towards the inner German Bight is forestalled. This argumentation is
supported by evidence suggesting on-shore/offshore rather than alongshore transport of
sediment off the barrier islands (Veenstra, 1982), and offshore transport into the German
Bight along the seabed during storms (Reineck & Singh, 1972).
On the basis of the evidence provided in the present study, the sediment bypassing
mechanism in the form of swash-bar migration from west to east around the periphery of
ebb-deltas, as proposed for the East Frisian coast by Homeier and Kramer (1957), Lüders et
al. (1972), Nummedal and Penland (1981), and Fitzgerald et al. (1984), needs to be
reconsidered. The above authors derived this model purely on the basis of morphological
changes observed on a limited number of temporally widely spaced aerial photographs
without verification by ground-truthing. As shown in this study, neither the sediments nor the
sediment transport directions recorded on the ground support the bypassing model. As far as
the sediment itself is concerned, neither the updrift nor the downdrift shore or foreshore
sediments consist of medium or coarse sand (250-600 μm), i.e. the grain sizes of the swash
bars which are supposed to act as the main transfer mechanism bypassing the inlet. Instead,
both adjacent shores are uniformly composed of fine sand around 180-200 μm (Veenstra,
1982; Flemming & Davis, 1994). This alone precludes the swash bars as representing the
main vehicle by which sand is supposed to bypass the inlet. In addition, the semi-circular
pattern produced by the medium-coarse swash-bar sediment suggests recycling rather than
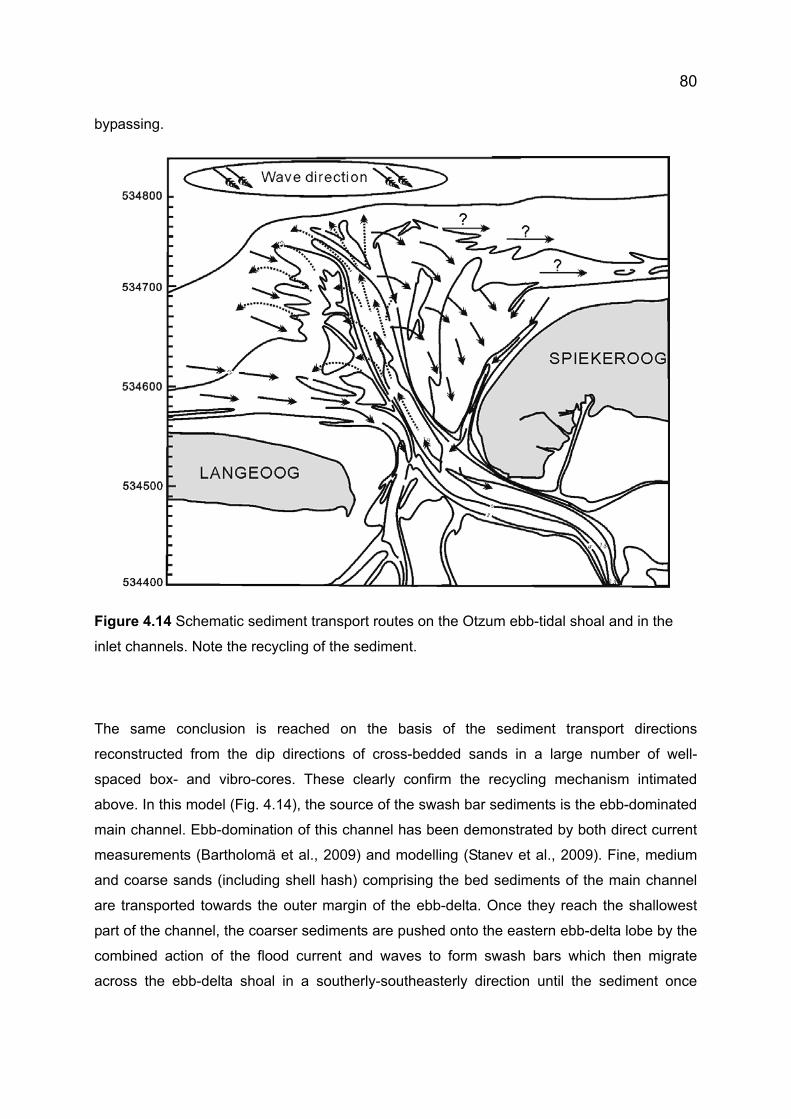
80
bypassing.
Figure 4.14 Schematic sediment transport routes on the Otzum ebb-tidal shoal and in the
inlet channels. Note the recycling of the sediment.
The same conclusion is reached on the basis of the sediment transport directions
reconstructed from the dip directions of cross-bedded sands in a large number of well-
spaced box- and vibro-cores. These clearly confirm the recycling mechanism intimated
above. In this model (Fig. 4.14), the source of the swash bar sediments is the ebb-dominated
main channel. Ebb-domination of this channel has been demonstrated by both direct current
measurements (Bartholomä et al., 2009) and modelling (Stanev et al., 2009). Fine, medium
and coarse sands (including shell hash) comprising the bed sediments of the main channel
are transported towards the outer margin of the ebb-delta. Once they reach the shallowest
part of the channel, the coarser sediments are pushed onto the eastern ebb-delta lobe by the
combined action of the flood current and waves to form swash bars which then migrate
across the ebb-delta shoal in a southerly-southeasterly direction until the sediment once
81
again reaches the main channel. From here the cycle repeats itself. The fine sand delivered
to the ebb-delta is recirculated in much the same way, the only difference being that it is
rapidly segregated from the coarser sediment to be transported by the flood current,
separately from the swash bars, in the form of small dunes across the ebb-delta shoal
towards the marginal flood channel. The flood channel then feeds the fine sand into the main
channel from where the cycle repeats itself. An analogous circular sediment transport pattern
has been postulated by Elias et al. (2006) for the Texel tidal inlet in the Netherlands.
The recirculation model emphasises the role of waves in swash bar dynamics on the ebb-
delta, in particular winter storm waves. Several other local studies have dealt with the effects
of storms on the coast of the southern North Sea, from the back-barrier tidal basins to the
shoreface (Flemming & Davis; 1994; Davis & Flemming 1995; Chang et al, 2005; Son et al,
2009). Similar observations have been made in an inlet along the coast of Normandy, France,
where the onshore migration rate of swash bars increased from 0.13 m/day during fair
weather to 1.1 m/day during storms (Robin et al, 2007). In the case of the Barra Nova inlet,
southern Portugal, an onshore migration rate of 50 m in two weeks was recorded after a
major storm (Balouin et al., 2004). In the case of this study, the migration rates show 0.78
m/day in the winter months of 2007 (January to April), whereas the mean for the whole
measuring period, around 10 months, amounts to 0.61 m/day (June 2006 to April 2007).
Comparing these rates, it can be inferred that the swash bars in this study are continuously
affected by waves due to frequent strong winds and storms regardless of seasons, the
migration rate in the more energetic winter months being slightly higher than the average for
the whole period.
The recirculation model presented in this study deals mainly with the processes acting on the
eastern ebb-delta shoal. The processes on the western ebb-delta shoal are less well
understood because this part of the ebb-delta was difficult to access for coring so that
internal sedimentary structures were not available for a reconstruction of sediment transport
directions. However, sediment being supplied to the main channel from the west or northwest
by the flood current and by wave action would either be returned to the western shoal by the
ebb current or be fed into the recirculating system of the eastern shoal described above. In
the former case, the existence of a smaller recirculating cell is postulated for the western
ebb-delta lobe. Although this interpretation is speculative at this stage, it is supported by the
investigations of Hanisch (1981) on the western lobe of the Harle ebb-delta located between
the islands of Spiekeroog and Wangerooge.
82
Entirely unclear is whether some fine sand actually does manage to bypass the ebb-delta
beyond the area investigated in this study. Any such mechanism would have to act along the
seaward subtidal fringe of the ebb-delta and be entirely independent of the processes acting
on the ebb-delta itself. There is no direct evidence for such a process and the existence of a
well-developed flood channel on the western side of the ebb-delta (i.e. along the eastern
shore of Langeoog) strongly mitigates against such a model because any sediment supplied
from the west would ultimately be fed into this channel from where it is transported towards
the inlet.
Finally, the preservation potential of sedimentary structures is remarkable. The predominant
sedimentary structures in the upper sediment column (box-core depth) are cross-laminated
sands and, locally, also strongly bioturbated sands. However, at greater depth (vibro-cores)
the sedimentary structures are dominated by parallel-laminated sands and shell beds
indicative of high-energy conditions. This means that the sedimentary structures generated
near the surface are short-lived, having a low preservation potential for the rock record. What
is preserved in the long run are the sedimentary structures produced by episodic storms.
4.6 Conclusions
The main conclusions of this study can be summarized as follows:
(1) According to nautical charts, the area of the Otzum ebb-tidal delta has slightly shrunk over
the past 20 years in the course of channel rotation back to a more asymmetrical shape
accompanied by sediment accretion on the eastern ebb-delta lobe and characterized by a
series of large superimposed swash bars which migrate towards the tidal inlet.
(2) The inlet and ebb-delta consist of medium and fine sand, the main ebb-delta body being
composed of fine sand, whereas the main channel and the swash bars are composed of
medium sands containing fair amounts of shell hash. The two sediment populations are
transported separately from each other, the former mainly by tidal currents, the latter by the
ebb current in the main channel and by wave action on the ebb-delta shoal.

83
(3) Although most sedimentary structures in short box-cores comprise cross-laminated and
bioturbated sand, these structures have little preservation potential. Instead, the structures
preferentially preserved in the long term are parallel-laminations and shell beds, both
indicative of high-energy storm conditions.
(4) Sediment transport on the Otzum ebb-tidal delta follows a semi-circular pattern by which
the sediment is constantly being recycled. This pattern results from the interaction of tidal
currents and northwesterly storm waves. There is no evidence for sediment bypassing and
previously postulated models to this effect are thus refuted.
Acknowledgements
This study was supported by a Korea Science and Engineering Foundation grant awarded by
the Korea government (M60-2004-000-10524). We are grateful to Arnulf Moeller, Astrid
Raschke and Nicol Mahnken-Rötzer for technical support in the laboratory. In addition, we
wish to thank the captain and crew of the RV Senckenberg for logistical support in the field.

84
5. Summary discussion and outlook
This dissertation is composed of three complete manuscripts which have in the meantime
been submitted to international journals. Two of these deal with the shoreface-connected
ridge system off Spiekeroog island, whereas the third one concerns itself with the ebb-tidal
delta located between the islands of Langeoog and Spiekeroog.
The sand ridges on the lower shoreface off Spikeroog show well defined sediment
distribution patterns which are closely aligned with the ridge topography. In general,
shoreface-connected ridges in different parts of the world display both similar and dissimilar
sedimentary features, suggesting that the mechanisms controlling them are not strictly the
same everywhere in spite of the similarities in size, shape and orientation. In the present
case, the distribution pattern is characterized by trough-ward coarsening of mean diameters,
the sediment in the troughs consisting of exceptionally coarse material (coarse sands, very
coarse sands and gravels). Wave modelling suggests that we are dealing with palimpsest lag
deposits here which cannot have been moved far from their source.
Sub-surface sedimentary structures were analysed relative to particular weather conditions
(shortly after storm periods and during fair-weather conditions). The structures in short box-
cores clearly reflect the energy conditions prevailing at the times of recovery. However, the
sedimentary structures at greater sub-surface depths,I as revealed in long vibro-cores, are
dominated by storm-generated features. This demonstrates that, along the East Frisian coast,
storm-generated sedimentary structures have a higher preservation potential than those
produced under fair-weather conditions. In addition, the comparison of repeated grain-size
distributions between 1989 and 2005 discloses that coarse sediments have expanded onto
the lower ridge flanks over the 15 years in question. This means that coarse sediments have
either spread out around their source areas, or that a finer-grained drape has been removed
to expose the coarser material beneath. Whichever the case, the observations can only be
explained by invoking strong wave action associated with frequent strong winds and storms
in southern North Sea, as tidal current velocities in this area are not high enough to account
for the mobility of the coarse material. In order to assess the role of waves, a modelling
approach proposed by Flemming (2005) was adopted in which wave threshold velocities are
calculated in relation to grain size and water depth. The results demonstrate that in the
case of fine (D = 0.18 mm) and medium sands (0.35 mm), the effective wave bases during
fair-weather are restricted to water depths of 8.5 and 7.3 m respectively, whereas the wave
bases during storms reach water depths of 39.5 and 35 m respectively. In the case of coarse
85
sand (D = 1.0 mm), the effective wave base during fair-weather is restricted to water depths
shallower than 4.8 m, whereas during storms the wave base reaches down to a water depth
of 26.4 m. From this it can be concluded that the shoreface-connected ridges off the East
Frisian barrier islands are controlled by combined flows (i.e. oscillatory wave-generated flows
superimposed on tidal currents) produced during storms.
In the case of the ebb-tidal delta, one of the main objectives was to test the theory of
sediment pypassing postulated by numerous authors in many parts of the world. Only a few
studies have questioned the bypassing theory (e.g. Tanner, 1987; Flemming and Davis,
1994; Elias et al., 2006). The results of the present study clearly negate the bypassing theory.
Thus, already the sediment distribution patterns on the Otzum ebb delta are incompatible
with the bypassing model, as the swash bars, which are supposed to be the vehicle for
transporting sediment from the up-drift shore, across the ebb-delta, to the down-drift shore,
are compsed of much coarser sediment than that on either side. On the other hand, the
sediments of the inlet channel consist of the same medium sands (and coarse shell hash)
characterizing the swash bars on the ebb-delta shoal (Robben Plate). These, in turn, migrate
back towards the inlet (southward) at a relatively high rate (0.61 m/day for 10 months). This
is corobborated by the analysis of the dip directions of cross-bedded sands recorded in
numerous box-cores. The vast majority of dip directions also indicate a southward transport.
Thus, neither the sediment composition nor the internal sedimentary structures of the swash
bars support the sediment bypassing model proposed by previous publications. One of the
main reasons why previous studies failed to recognise the true sediment transport pathways
on the ebb-tidal deltas of the East Frisian barrier islands is the fact that these studies did not
validate their air-photo analyses by observations on the ground. The results of the present
study, by contrast, reveal a semi-circular sediment recycling pattern by which sediment
supplied by the ebb current along the main inlet channel is moved onto the ebb-delta shoal
by the combined action of waves and the flood current. On the shoal, the coarser sediment is
concentrated in swash bars which migrate south-southeastwards until they reach the edge of
the main inlet channel. Once fed into the channel, the next cycle starts. Similarly, the fine
sand is transported separately in the form of small flood-oriented dunes which spill their load
into the marginal flood channel, from where it too is transported towards the main inlet
channel where a new cycle starts. Finally, the predominant sedimentary structures observed
in short box-cores are cross-laminated sands and, locally, also strongly bioturbated sands.
However, as in the case of the shoreface, the preservation potential of these near-surface
sedimentary structures produced by average weather conditions is low in comparison to
86
those preserved in longer vibro-cores which are dominated by parallel-laminated sands and
shell beds indicative of high-energy conditions as would be produced by the interaction of
tidal currents and northwesterly storm waves.
Although the results of the present study have provided important new insights into the
depositional processes in each of the two areas, i.e. the shoreface-connected ridge system
and the ebb-tidal delta, the relationship and interaction between the two zones is still unclear.
To solve this problem, an array of well positioned moorings with both upward and downward
looking ADCP current meters, coupled with seasonally repeated high-resolution multibeam
echosounder and sediment sampling surveys would be required. The results of such a study
would be invaluable for the development, calibration and validation of a 3D morphodynamic
model of the East Frisian barrier-island coast.
87
References
Aigner, T.A. (1985) Storm depositional systems. Springer, Berlin, 173 pp.
Aigner, T.A. and Reineck, H.E. (1982) Proximality trends in modern storm sands from the
Helgoland Bight (North Sea) and their implications for basin analysis. Senckenbergiana
marit., 14, 183-215.
Aigner, T.A. and Reineck, H.E. (1983) Seasonal variation of wave-base on the shoreface of
the barrier island Norderney, North Sea. Senckenbergiana marit., 15, 82-92.
Amos, C.L. and King, E.L., (1984) Bedforms of the Canadian Eastern seaboard: a
comparison with global occurrences. Mar. Geol., 57, 167-208.
Antia, E.E. (1993) Surficial grain-size statistical parameters of a North Sea shoreface-
connected ridge: patterns and process implication. Geo-Mar. Lett., 13, 172-181.
Antia, E.E. (1993) Sedimentology, morphodynamics and facies association of a mesotidal
barrier island shoreface (Spiekeroog, southern North Sea). 370 Seiten, Bremen 1993.
Antia, E.E. (1995) Sedimentary deposits related to inlet-shoreface storm flow interation in the
German Bight. Estuar. Coastal Mar. Sci., 40, 699-712.
Antia, E.E., Flemming, B.W. and Wefer, G. (1994a) Transgressive facies sequence of a high
energy, wave-tide storm-influenced shoreface: a case study of the East Frisian barrier
islands (southern North Sea). Facies, 30, 15-24.
Antia, E.E., Flemming, B.W. and Wefer, G. (1994b) Sedimentary facies associations of the
shoreface connected ridge systems in the German Bight, southern North Sea. Dtsch.
Hydrogr. Z., 46, 229-244.
Antia, E.E., Flemming, B.W. and Wefer, G. (1995) Calm-weather spring and neap tidal
current characteristics on a shoreface-connected ridge complex in the German Bight
(southern North Sea). Geo-Mar. Lett.,15, 30-36
Balouin, Y., Morris, B.D., Davison, M.A and Howa, H. (2004) Morphology evolution of an
ebb-tidal delta following a storm perturbation: Assessments from Remote sensed video
88
data and direct surveys. J. Coastal Res., 20, 414-423.
Bartholomä, A., Kubicki, A., Badewien, T.H. and Flemming, B.W. (2009). Suspended
sediment transport in the German Wadden Sea – seasonal variations and extreme events.
Ocean Dynamics 59, 213-225.
Beck, T.M., Wang, P. and Davis, R.A., Jr. (2008) Morphodynamics of New Pass and Big
Sarasota Pass, West-central Florida, USA. 7th International Conference on Tidal
Environments, 25-26th September in Qingdao, China. Abstracts, p. 94-95.
Bork, I., Müller-Navarra, S. and Christian, K. (2005) Modelluntersuchungen zu Extrem-
sturmfluten. Mitteilungen des Kuratoriums für Forschung im Küsteningenieurwessen.
Hamburg, Januar 2005, 9-11.
Bose, P.K. and Das, N.G. (1986) A transgressive storm- and fair-weather wave dominated
shelf sequence: Cretaceous Nimar Formation, Chakrud, Madhya Pradesh, India. Sed.
Geol., 46, 147-167.
Brezina, J. (1986). Macrogranometer MC86: Laboratory Manual. Macrogranometry,
Heidelberg, 33 pp.
Burningham, H. and French, J. (2006) Morphodynamic behaviour of a mixed sand-gravel
ebb-tidal delta: Deben estuary, Suffolk, UK. Mar. Geol., 225, 23-44.
Butman, B., Noble, M., and Folger, D.W. 1979, Longterm observations of bottom current
and bottom sediment movement on the Mid-Atlantic Continental Shelf: J. Geophys. Res.,
84, 1182-1205.
Buynevich, I.V. and FitzGerald, D.M. (2003) Textural and compositional characterization of
recent sediments along a paraglacial estuarine coastline, Maine, USA. Estuar. Coastal
Shelf Sci., 56, 139-153.
Calvete, D., Falques, A. De Swart, H.E. and Walgreen. M. (2001) Modelling the formation
of shoreface-connected sand ridges on storm dominated inner shelf. J. Fluid Mechanics,
441, 169-193
Calvete, D., De Swart H.E. and Falques, A. (2002) Effect of depth-dependent wave stirring
on the final amplitude of shoreface-connected sand ridges. Cont. Shelf Res., 22, 2763-
2776.
89
Carver, R.E. (1971) Procedures in Sedimentary Petrology. Wiley-Interscience, New York,
653 pp.
Chang, T.S., Bartolomae, A. and Flemming, B.W. (2006) Distinction between sortable silts
and aggregated particles in muddy intertidal sediments of the southern North Sea. In:
Flemming, B.W. & Hartmann, D. (eds), From particle size to sediment dynamics.
Proceeding of a Workshop, 15-18 April 2004, Hanse Institute for Advanced Study
Delmenhorst (Germany). Sediment. Geol. (Spec. Issue) 202, 453-463.
Cheung, K.F., Gerritsen, F. and Cleveringa, J. (2007) Morphodynamics and sand
bypassing at Ameland inlet, the Netherlands. J. Coastal Res., 23, 106-118.
Chowdhuri, K.R. and Reineck, H.E. (1978) Primary sedimentary structures and their
sequence in the shoreface of barrier island Wangerooge (North Sea). Senckenbergiana
marit., 10, 15-29.
Clifton, H.E. (1976). Wave-formed sedimentary structures – conceptual model. In: Davis,
R.A. and Ethington, R.L. (eds.), Beach and Nearshore Sedimentation. SEPM Spec. Publ.,
24, 126-148.
de Swart, H.E., Walgreen, M., Calvete, D. and Vis-Star, N.C. (2008) Nonlinear modelling of
shoreface-connected ridges; Impact of grain sorting and interventions. Coastal Eng., 55,
642-656.
Davis, R.A. and Flemming, B.W. (1995) Stratigraphy of a combined wave- and tide
dominated tidal flat system: Maartens Plate, German Wadden Sea. Internat. Assoc.
Sedimentologists Spec. Publ. 24: 121-132.
Dette, H.H. (1977) Ein Vorschlag zur Analyse eines Wellenklimas. Die Küste, 31, 166-180.
Duke, W.L., Arnott, R.W. and Cheel, R.J. (1991) Shelf sandstones and hummocky cross
stratification; new insights on a stormy debate: Geol., 19, 625-628.
Dyer, R.K. and Huntley, A.D. (1999) The origin, classification and modelling of sand banks
and ridges. Continent. Shelf Res., 19, 1285-1330
Ehlers, J. (1984) Platenwanderung an der ostfriesischen Küste? Ergebnis der
Luftbildauswertung von zwei Befliegungen der Wichter Ee (zwischen Norderney und
Baltrum) im Sommer 1982. Mitt. Geol.-Paläontol. Inst. Univ. Hamburg, 57, 123-129.
90
Eitner, V. (1996) Morphological and sedimentological development of a tidal inlet and its
catchment area (Otzumer Balje, southern North Sea). J. Coastal Res., 12, 271-293.
Elias, E.P.L., Cleveringa, J., Buijsman, M.C., Roelvink, J.A. and Stive, M.J.F. (2006) Field
and model data analysis of sand transport patterns in Texel tidal inlet (the Netherlands).
Coastal Engineering, 53, 505-529
FitzGerald, D.M., Penland, S. and Nummedal, D. (1984) Control of barrier islands shape by
inlet sediment bypassing: East Frisian Islands, west Germany. Mar. Geol., 60, 355-376.
FitzGerald, D.M., Kraus, N.C. and Hands, E.B. (2001) Natural mechanisms of sediment
bypassing at tidal inlets. Coastal Engineering Technical Note US Army Corps of Engineers
ERDC/CHL CETN- -30. U.S. Army Engineer Research and Development Center,
Vicksburg, Mississippi.
Flemming, B.W. (1977) Langebaan Lagoon - a mixed carbonate-siliciclastic tidal
environment in a semi-arid climate. Sedim. Geol., 18, 61-95
Flemming, B.W. (1988) Process and pattern of sediment mixing in a microtidal castal lagoon
along the west coast of South Africa. In: de Boer, P.L., van Gelder, A. and Nio, S.D. (Eds),
Tide-influenced Sedimentary Environments and Facies. D. Reidel Publ. Co., Dordrecht, p.
275-288.
Flemming, B.W. (1991) Holozäne Entwicklung, Morphologie und fazielle Gliederung der
Ostfriesischen Insel Spiekeroog (südliche Nordsee). Senckenberg-am-Meer, Ber., 91/3,
51.
Flemming, B.W. (2002) Effects of climate and human interventions on the evolution of the
Wadden Sea depositional system (southern North Sea). In: Wefer, G., Berger, W., Behre,
K.-E. & Jansen, E. (eds), Climate Development and History of the North Atlantic Realm.
Springer, Berlin, p. 399-413.
Flemming, B.W. (2003) Flaser. In: Middleton, G.V. (ed.) Encyclopedia of sediments and
sedimentary rocks. Kluwer, Dordrecht, pp. 282-283.
Flemming, B.W. (2005) The concept of wave base: fact and fiction. In: Haas, H., Ramseyer,
K. and Schlunegger, F. (Eds.), Abstracts, Sediment 2005, 18-19 July, Gwatt, Lake Thun,
Swizerland. Schriftenr. Deutsche Gesellsch. Geowiss., 38, p. 57.

91
Flemming, B.W. (2007) The influence of grain-size analysis methods and sediment mixing
on curve shapes and textural parameters: Implications for sediment trend analysis.
Sediment. Geol., 202, 425-435.
Flemming, B.W. and Davis, R.A., Jr. (1994) Holocene evolution, morphodynamics, and
sedimentology of the Spiekeroog barrier island system (southern North Sea).
Senckenbergiana marit., 24, 117-155.
Flemming, B.W. and Nyandwi, N. (1995) Land reclamation as a cause of fine-grained
sediment depletion in backbarrier tidal flats (southern North Sea). Neth. J. Aquat. Ecol., 28,
299-307.
Flemming, B.W. and Ziegler, K. (1995) High-resolution grain size distribution patterns and
textural trends in the backbarrier environment of Spiekeroog Island (southern North Sea).
Senckenbergiana marit., 26, 1-24.
Folk, R.L. and Ward, R.V. (1957). Brazos River bar: a study in the significance of grain size
parameters. J. Sediment. Petrol., 27, 3-26.
Gaudiano, D.J. and Kana, T.W. (2001) Shoal bypassing in mixed energy inlets: Geomorphic
variables and empirical predictions for nine South Carolina Inlets. J. Coastal Res., 17,
280-291.
Goff, J.A., Austin Jr, J.A., Gulick, S., Nordfjord, S., Christensen, B., Sommerfield., Olson, H. and Alexander, C. (2005) Recent and modern marine erosion on the New
Jersey outer shelf. Mar. Geol., 216, 275-296.
Green, M.O., Vincent C.E., McCave, I.N., Dickson, R.R., Rees, J.M. and Pearson, N.D. (1995) Storm sediment transport: observation from the British North Sea shelf. Continent.
Shelf Res., 15, 889-912.
Hanish, J. (1981) Sand transport in the tidal inlet between Wangerooge and Spiekeroog (W.
Germany). Spec. Publs int. Ass. Sediment., 5, 175-185.
Harrison, S.E., Locker, S.D., Hine, A.C., Edwards, J.H., Naar, D.F., Twichell, D.C. and
Mallinson D.J. (2003) Sediment-starved sand ridges on a mixed carbonate/siliciclastic
inner shelf off west-central Florida. Mar. Geol., 200, 171-194.
Hayes, M.O. (1975) Morphology of sand accumulations in estuaries. I Cronin, L.E. (ed.),
92
Estuarine Research, 2, Academic Press, 1-28.
Héquette, A., Hemdane, Y. and Antony, E.J. (2008) Sediment transport under wave and
current combined flows on a tide-dominated shoreface, northern coast of France. Mar.
Geol., 249, 226-242.
Hertweck, G. (1983) Das Schlickgebiet der inneren Deutschen Bucht. Aufnahme mit dem
Sedimentechographen. Senckenbergiana marit., 15, 219-249.
Hicks, D.M and Hume, T.M. (1997) Determining sand volumes and bathymetric change on
an ebb-tidal delta. J. Coastal Res., 13, 407-416.
Homeier, H. and Kramer, J. (1957). Verlagerung der Platen im Riffbogen vor Norderney und
ihre Anlandung an den Strand. Jahresber. 1956, Forschungsstelle Norderney, 8, 37-60.
Hughes, S.A. (2002) Eauilibrum cross sectional area at tidal inlets. J. Coastal Res., 18, 160-
174.
Kana, T.W. and Mason, J.E. (1988) Evolution of an ebb-tidal delta after an inlet relocation.
In: D.G. Aubrey and L. Weishar (eds.), Hydrodynamics and Sediment Dynamics of Tdal
Inlets, New York: Springer-Verlag, 382-411.
Kana, T.W., Hayter, E.J. and Work, P.A. (1999) Mesoscale sediment transport at
southeastern U.S. tidal inlets: Conceptual model applicable to mixed energy settings. J.
Coastal Res., 15, 303-313
Koch, M. and Niemeyer, H.D. (1978) Sturmtidenstrommessungen im Bereich des
Norderneyer Seegats. Forschungsstelle Norderney, Jahresbericht für 1977, Band 29, 91-
108.
Komar, P.D. (1998). Beach Processes and Sedimentation (2nd edition). Prentice Hall, New
Jersey, 544 pp.
Komar, P.D. and Miller, M.C. (1974). Sediment threshold under oscillatory waves. ASCE,
14th Conference on Coastal Engineering, Proceedings, p. 756-775.
Kraus, N.C (2000) Reservoir model for ebb-tidal delta shoal evolution and sand bypassing.
Jounal of waterway, Port, Coastal, and Ocean Engineering, 126(6), 305-313.
Kreisa, D.R. (1981) Storm-generated sedimentary structures in subtidal marine facies with
93
examples from the middle and upper Ordovician of southwestern Virginia. J. Sed. Petrol.,
51, 823-848.
Krüger, W. (1922) Die Jade, das Fahrwasser Wilhelmshavens, ihre Entstehung und ihr
Zustand. Jahrbuch der Hafenbautechnischen Gesellschaft, Band 4, 1921, Berlin (1922),
pp. 44-60.
Kumar, N. and Sanders, J.E. (1976) Characteristics of shoreface storm deposits: modern
and ancient examples. J. Sed. Petrol., 46, 145-162.
Lee, D.T and Schachter, B.J. (1980) Two algorithms for constructing a Delaunay
Triangulation. International journal of Computer and Information Science, 9, 3.
Lettmann, K.A., Wolff, J.-O., and Badewien, T.H. (2009) Modeling the impact of wind and
waves on suspended particulate matter fluxes in the East Frisian Wadden Sea (southern
North Sea). Ocean Dynamics (in press).
Li, M.Z., Wright, L.D. and Amos, C.L. (1996) Predicting ripple roughness and sand
resuspension under combined flows in a shoreface. Mar. Geol., 130, 139-161.
Li, M.Z., Amos, C.L. and Héquette, A. (1997) Boundary layer dynamics and sediment
transport under storm and non-storm conditions on the Scotian shelf. Mar. Geol., 141,
157-181.
Liu, J.T. and Zarillo, G.A. (1990) Shoreface dynamics: Evidence from bathymetry and
surficial sediments. Mar. Geol., 94, 37-53.
Lüders, K., Führböter, A. and Rodloff, W. (1972). Neuartige Dünen- und Strandsicherung
im Nordwesten der Insel Langeoog. Die Küste, 23, 63-121.
Luck, G. (1975) Der Einfluß der Schutzwerke der Ostfriesischen Inseln auf die
morphologischen Vorgänge im Bereich der Seegaten und ihrer Einzugsgebiete.
Mitteilungen des Leichtweiss Istitutes, 47, 1-81.
McBride, R.A. (1991) Origin, evolution, and distribution of shoreface sand ridges, Atlantic
inner shelf, USA. Mar. Geol., 97, 57-85.
McBride, R.A. and Moslow T. F. (1991) Origin, evolution, and distribution of shoreface sand
ridges, Atlantic inner shelf, USA. Mar. Geol., 97, 57-85.

94
Müller, G. (1967) Methods in sedimentary petrology. Schweizerbart, Stuttgart, 283 pp.
Murray, A.B. and Thieler, E.R. (2004). A new hyphothesis and exploratory model for the
formation of large-scale inner-shelf sediment sorting and “rippled scour depressions”.
Cont. Shelf Res. 24, 295-315.
Niedoroda, A.W., Swift, D.J.P., Hopkins, T.S. and Ma, C.M. (1984) Shoreface
morphodynamics on wave-dominated coasts. Mar. Geol., 60, 331-354.
NLWKN (2006). Sturmfluten und Klimawandel sowie gewässerkundliche Daten. Seminar des
Bundes der Ingenieure für Wasserwirtschaft, Abfallwirtschaft und Kulturbau (BWK), 10. 10.
2006, Aurich, 23pp.
Nummedal, D. and Penland, S. (1981) Sediment dispersal Norderneyer Seegat, West
Germany. Spec. Publs int. Ass. Sediment., 5, 187-210.
Özsoy, E. (1986) Ebb-tidal jets: A model of suspended sediment and mass transport at tidal
inlets. Estuar. Coastal Shelf Sci., 22, 45-62.
Passchier, S. and Kleinhans, M.G. (2005) Observations of sand waves, megaripples, and
hummocks in the Dutch coastal area and their relation to currents and combined flow
conditions. J. Geophy. Res., 110, F04S15.
Pattiaratchi, C.B. and Collins, M. (1987) Mechannisms for linear sandbank formation and
maintenance in relation to dynamical oceanographic observations. Proc. Oceanogr., 19,
117-176.
Postma, H. (1982) Hydrography of the WaddenSea. Final report on Hydrography of the
Wadden Sea Woking Group. Stricht, Leiden: Veth Steun Waddenonderz 77.
Potter, P.E., Maynard, J.B. and Depetris, P.J. (2005). Mud & Mudstones – Introduction and
Overview. Springer, Berlin, 297 pp.
Powell, M.A., Thieke, R.J. and Mehta. A.J. (2006) Morphodynamic relationships for ebb and
flood delta volumes at Florida’s tidal entrances. Ocean Dynamics, 56, 295-307.
Reineck, H.-E. (1970) Reliefguss und projizierbarer Dickschliff. Senckenbergiana marit. 2, 61-66.
Reineck, H.-E. (1976). Primäregefüge, Bioturbation und Makrofauna als Indikatoren des
95
Sandversatzes im Seegebiet vor Nordeney (Nordsee). 1. Zonierung von Primärgefügen
und Bioturbation. Senckenbergiana marit. 8, 155-169.
Reineck, H.-E. and Wunderlich, F. (1968) Classification and origin of flaser and lenticular
bedding. Sedimentology, 11, 99-104.
Reineck, H.-E. and Singh, I.B. (1972) Genesis of laminated sand and graded rhythmites in
storm-sand layers of shelf mud. Sedimentology, 18, 123-128.
Robin, N., Levoy, F. and Monfort, O. (2007) Bar morphodynamic behavior on the ebb delta
of a macrotidal inlet (Normandy, France). J. Coastal Res., 23 1370-1378.
Schrottke, K., Becker, M., Bartholomä, A., Flemming, B.W. and Hebbeln, D. (2006) Fluid
mud dynamics in the Weser estuary turbidity zone tracked by high-resolution side-scan
sonar and parametric sub-bottom profiler. Geo-Mar. Lett., 26, 185-198.
Sha, L.P. (1989a) Sand transport patterns in the ebb-tidal delta off Texel inlet, Wadden Sea,
the Netherlands. Mar. Geol. 86, 137-154.
Sha, L.P. (1989b) Variation in ebb-delta morphologies along the west and east Frisian
islands, the Netherlands and Germany. Mar. Geol. 89, 11-28.
Sha, L.P. and Van Den Berg, J.H. (1993) Variation in E-tidal delta geometry along the coast
of the Netherlands and the German Bight. J. Coastal Res., 9, 730-746.
Smith, J.B. and FitzGerald, D.M. (1994) Sediment transport patterns at the Essex River inlet
ebb-tidal delta, Massachusetts, U.S.A. J. Coastal Res., 10, 752-774.
Son, C.S., Flemming, B.W. and Chang, T.S. (2005) Storm-influenced sedimentary faies of
the shoreface-connected ridges off the east Frisian Islands, southern North Sea. In: Haas,
H., Ramseyer, K. and Schlunegger, F. (Eds.), Abstracts, Sediment 2005, 18-19 July, Gwatt,
Lake Thun, Swizerland. Schriftenr. Deutsche Gesellsch. Geowiss., 38, p. 136-137.
Son, C.S., Flemming, B.W. and Chang, T.S. (2006) Sedimentary structures of shoreface-
connected rides off the East Frisian coast, southern North Sea: storm climate and
preservation potential. 17th International Sedimentological Congress, 27 August-1
September, Fukuoka, Japan. Abstracts, p. 160.
Son, C.S., Flemming, B.W. and Chang, T.S. (2007) Morphodynamics and sedimentary

96
characteristics of an ebb-tidal shoal (Robben Plate) in the Otzum tidal inlet of Spiekeroog
Island, southern North Sea. International Conference 2007 and 97th Annual Meeting of the
Geologiche Vereinigung e.V. (GV), Bremen, Germany, October 1-5, 2007. Abstract, p.215.
Son, C.S., Flemming, B.W. and Chang, T.S. (2009) Sedimentary facies of shoreface-
connected sand ridges off the East Frisian barrier-island coast, southern North Sea:
climatic controls and preservation potential. In: Li, M.Z., xxxx (eds), xxxx. Int. Assoc.
Sedimentologists Spec. Publ. (in press).
Sepkoski, J.J. (1978) Kinetic model of phanerozoic taxonomic diversity. 1. Analysis of
marine orders. J. Paleobiol., 4, 223-251.
Stanev, E.V., Grayek, S. and Staneva, J. (2009) Temporal and spatial circulation patterns in
the East Frisian Wadden Sea. Ocean Dynamics, 59(2), 167-181.
Stubblefield W.L. and Swift, D.J.P. (1981) Grain size variation across sand ridges, New
Jersey continental shelf. Geo-Mar. Lett., 1, 45-48.
Swift, D.J.P. and Field, M.E. (1981a) Storm-built sand ridges on the Maryland inner shelf: a
preliminary report. Geo-Mar. Lett., 1, 33-37.
Swift, D.J.P. and Field, M.E. (1981b) Evolution of a classic sand ridge field: Maryland sector,
North America inner shelf. Sedimentology, 28, 461-482.
Swift, D.J.P., Duane, D.B. and McKinney, T.F. (1973) Ridge and swale topography of the
middle Atlantic Bight, North America: Secular response to the Holocene hydraulic regime.
Mar. Geol., 15, 227-247.
Swift, D.J.P., Holliday, B., Avignone, N. and Shideler, G. (1972) Anatomy of a shore-face
ridge system, False Cape, Virginia. Mar. Geol., 12, 59-84.
Swift, D.J.P., Parker, G., Lanfredi, N.W., Perillo, G. and Figge, K. (1978) Shore-face
connected ridges on American and European shelves: a comparison. Estuar. Coast. Mar.
Sci., 7, 257-273.
Tanner, W.F. (1987). The beach: where is the “river of sand”? J. Coastal Res., 3, 377-386.
Tilch, E. (2003) Oszillation von Wattflächen und deren fossils Erhaltungspotential (Spiekero-
oger Rückseitenwatt, südliche Nordsee). Berichte, Fachbereich Geowissenschaften Uni-
97
versität Bremen, No. 222, p.137.
Trentesaux, A., Stolk, A., Tessier, B. and Chamley, H. (1994) Surficial sedimentology of the
Middelkerke Bank (southern North Sea). Mar. Geol., 121, 43-55.
Twichell D., Brooks, G., Gelfenbaum, G. Paskevich, V. and Donahue, B. (2003) Sand
ridges off Sarasota, Florida: A complex facies boundary on a low-energy inner shelf
environment. Mar. Geol., 200, 243-262.
van de Kreeke, J. (2006) An aggregate model for the adaptation of the morphology and
sand bypassing after basin reduction of the Frisian inlet. Coastal Engineering, 53, 255-
263.
Van de Meene, J.W.H., Boersma, J.R. and Terwindt, J.H.J. (1996) Sedimentary structures
of combined flow deposits from the shoreface-connected ridge along the central Dutch
coast. Mar. Geol., 131, 151-175.
Van de Meene, J.W.H. and Van Rijn, L.C. (2000a) The shoreface-connected ridges along
the central Dutch coast – Part 1: field observations. Cont. Shelf Res., 20, 2295-2323.
Van de Meene, J.W.H. and Van Rijn, L.C. (2000b) The shoreface-connected ridges along
the central Dutch coast – Part 2: morphological modelling. Cont. Shelf Res., 20, 2325-
2345.
Veenstra, H.J. (1982). Size, shape and origin of sands of the East Frisian islands, southern
North Sea. Geol. Mijnbouw, 61, 141-146.
Vincent, C.E., Stolk, A. and Porter, C.F.C. (1998) Sand suspension and transport on the
Middlekerke Bank (southern North Sea) by storms and tidal currents. Mar. Geol., 96, 113-
129.
Wang, P., Beck, T.M. and Kraus, N. (2008) Measuring and modelling sedimentation pattern
in a stabilized Migratory Inlet, Blind Pass, Florida, USA. 7th international conference on
tidal Environments, 25-26th September in Qingdao, China. Abstracts, p. 85-86.
Walgreen, M., Calvete, D. and de Swart, H.E (2002) Growth of large-scale bed forms due to
storm-driven and tidal current: a model approach. Cont. Shelf Res., 22, 2777-2793.
Wentworth, C.K. (1922) A scale of grade and class terms for clastic sediments. J. Geol., 30,

98
377-392.
Wright, L.D., Boon, J.D., Kim, S.C. and List, J.H. (1991) Modes of cross-shore sediment
transport on the shoreface of the Middle Atlantic Bight. Mar. Geol., 96, 19-51.
Xu, J.P. and Wright, L.D. (1998) Observation of wind-generated shoreface currents off Duck,
North Carolina. J. Coast. Res., 14, 610-619.