Embed Size (px)
Citation preview

V Ü Z (vzw)V L A A M S I N S T I T U U T V O n n r r -
,aumol o f,h e Geo,asica, U figs. Printed in Northern Ireland
O o s t e n d e - B e , g i u m N S T ' T U T i 1
Sedim ent dynamics o f the Severn Estuary and inner Bristol Channel
p . M c L a r e n 1, m . b . c o l l i n s 2, s . g a o 2 & r . i . l . p o w y s 31 G eoS ea C o n su ltin g (C a n a d a ) L td , 2810 Fulford G anges R oad, Fulford H arbour, British Columbia,
Canada VOS ICO
2 D e p a r tm e n t o f O ceanography, The U niversity, Southam pton S O 9 5NH , UK 3 G e o S e a C on su ltin g (U K ) L td , P O B ox 310, C am bridge C B 3 9H U U K
Abstract: N et sed im ent transport pathways have been determined in many environments by studying grain size trends. This approach is extended here to an inner shelf environment, with improved sta tistica l techniques.
Patterns of net surficial sediment transport are proposed, indicating that the area is dominated by up-estuary transport. Exceptions exist in the form of radial mud transport at the river mouths and (clockwise) sand circulation around linear sandbanks.
Six d ifferen t sedim entary environments are defined on the basis of the shape of the ‘transfer fu n c tio n ’ and its relationship to the grain size distributions. Erosion takes place along the axis of the estu ary . D ynam ic equilibrium is reached around the linear sandbanks, whilst accretion occurs at the h ead o f th e estuary and where there are riverine inputs.
T h e results are com pared with numerical model outputs, representing w ater movement and sed im en t tran sp o rt. Over the seaward part of the study area, there is agreement between the two ap p roaches; contradictions increase, however, towards the upper reaches of the estuary. The d iscrepancies can be a ttributed to: (1) inherent differences between patterns of water and sediment m o v em en t; (2) difficulties in modelling intertidal boundary conditions; (3) inadequate representation o f riv er influences in the models; and (4) time-scale differences, associated with sediment transport processes.
Marine sedim ent transport investigations are concerned mainly with: (1) determ ination o f the direction of net sediment transport; (2) estim ation o f sediment transport rates; and (3) identify ing th e location o f accretional or erosional conditions.
M echanics-orientated approaches are based upon empirical equations for transport rates, related to tidally- and wave-induced near-bed shear stresses. T he validity o f such solutions is variable (H eathershaw 1981; Pattiaratchi & Collins 1985).
Transport pathw ays can be determ ined qualitatively from the deposits th em selves. For exam ple, progressive improvements in sorting or decreases in mean grain size have been considered as indicating net sediment transport. Recently, net transport paths have been related to grain size trends; this is b ased upon th e concept that grain size distributions are the result o f erosion, transport and accumulation p rocesses , rather than the sedimentary environment (e .g . b each es and rivers) alone (McLaren & Bowles 1985).
The present contribution applies this new technique to the macrotidal Severn E stuary and Bristol Channel (Fig. 1) to: (1) determ ine n et sed im ent transport patterns;(2) define sed im ent transport environm ents on the basis o f grain size and dynam ic stability ( i .e . erosion, accretion or equilibrium); and (3) undertake preliminary comparisons between the derived results and observations based upon other m ethods.
Study area
G eology and geom orphology
The Bristol Channel is 50 -60 m deep at its seaward end, with extensive shallow water areas (10-20 m) up-channel (Fig. 1). The coastline is characterized by cliffs, with low coastal plains near the outlets o f the tributary rivers (Harris & Collins 1988). The Severn Estuary is bordered by extensive mud flats and wetlands, currently being eroded (Allen & Rae 1987; Allen 1990).
The surficial sediment cover is thin (generally less than 10 m) over m ost o f the Channel, with large areas o f bedrock (Mesozoic and older strata) exposed (Lloyd et al. 1973; Brooks & James 1975). Large amounts o f sediments are deposited within the linear sandbanks, such as the Nash, Holm and Culver Sands (Fig. 1); these are formed by residual circulations in the estuarine waters. The areas sampled for the grain size trend analysis lie mainly in the inner part o f the Channel and Severn Estuary, where the cover of loosely-consolidated sediments is almost continuous, together with the Nash Sands.
W aves and tidesThe Channel receives high wave energy being exposed to the Atlantic O cean, with a fetch of up to 6000 km (Collins 1987). Storm waves over 10 m in height have been recorded
589
subito e.V . licensed customer copy supplied and printed for Flanders Marine Institute Library (SLI05XQ 0225E)
590 P. M C L A R E N E T A L .
S e v e r n R ood B r id g e ^
S h a rp n e s s N ew p o rt
> 6'
A vonm oulh
H ulchw ynsPoint
C o rd itf
B rid g w a te rB ay
M ineheod
W alch e t
3 ° 3 0 ' W 3°00 'W
S w a n s e aBoy
BD = B r is to l D e e p CG = C a rd i f f G ro u n d s C S = C u lv e r S a n d s E G = E ng lish G ro u n d s F H = F lo i Holm G S = G o re S a n d
H S = H olm S a n d L P = L a v e r n o c k P o in t ND = N e w p o r t D e e p N P = N a sh P a s s a g e N S = N a sh S a n d s S H = S le e p Holm W B = W o o d sp r ln g B ay WG = W e lsh G ro u n d s
5lo30'N
5I°I5'N
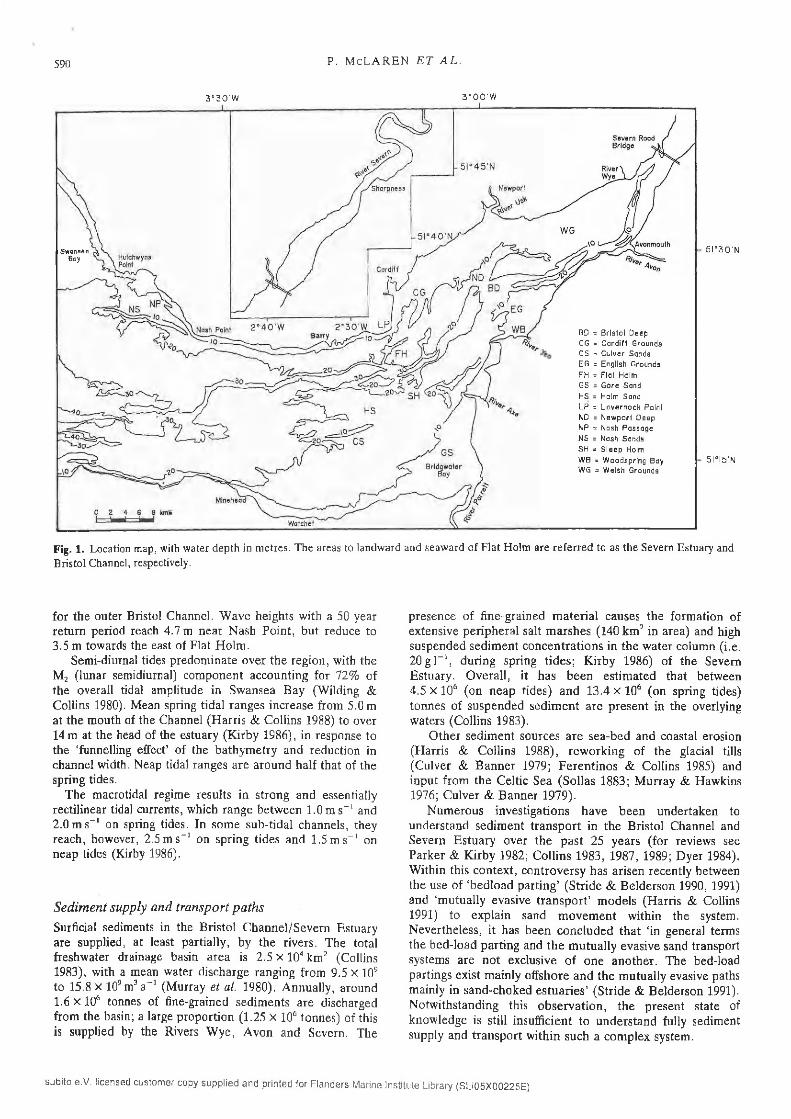
Fig. 1. Location map, with water d ep th in m etres. T he areas to landw ard and seaw ard o f F la t Holm a re re fe rred to as th e Severn Estuary and B ristol Channel, respectively.
for the outer Bristol Channel. W ave heights with a 50 year return period reach 4.7 m near N ash P oint, but reduce to3.5 m towards the east o f Flat H olm .
Semi-diurnal tides predom inate over the region, with the M 2 (lunar semidiurnal) com ponent accounting for 72% o f the overall tidal amplitude in Sw ansea Bay (W ilding & Collins 1980). Mean spring tidal ranges increase from 5.0 m at the mouth of the Channel (Harris & Collins 1988) to over 14 m at the head o f the estuary (K irby 1986), in response to the ‘funnelling effect’ o f the bathym etry and reduction in channel width. Neap tidal ranges are around half that o f the spring tides.
T he macrotidal regim e results in strong and essentially rectilinear tidal currents, which range betw een 1.0 m s"1 and 2 .0 m s _l on spring tides. In som e sub-tidal channels, they reach, however, 2.5 m s -1 on spring tides and 1.5 m s -1 on neap tides (Kirby 1986).
S ed im en t su pp ly and tran sport p a th s
Surficial sediments in the Bristol C hannel/Severn Estuary are supplied, at least partially, by the rivers. The total freshwater drainage basin area is 2 .5 x IO4 km2 (Collins1983), with a mean water discharge ranging from 9.5 X IO9 to 15.8 X 10⁹m3 a-1 (Murray et al. 1980). A nnually, around 1.6 X IO6 tonnes o f fine-grained sedim ents are discharged from the basin; a large proportion (1 .25 x IO6 tonnes) o f this is supplied by the Rivers W ye, A von and Severn. The
presence o f fine-grained m aterial causes the form ation o f extensive peripheral salt m arshes (140 km 2 in area) and high suspended sedim ent concentrations in the water colum n (i.e . 20 g I-1 , during spring tides; Kirby 1986) o f the Severn Estuary. O verall, it has been estim ated that betw een4 .5 x IO6 (on neap tides) and 13.4 x IO6 (on spring tides) tonnes o f suspended sed im ent are present in the overlying waters (C ollins 1983).
O ther sedim ent sources are sea-bed and coastal erosion (Harris & C ollins 1988), rew orking o f the glacial tills (Culver & B anner 1979; F erentinos & Collins 1985) and input from the C eltic Sea (S olías 1883; Murray & Hawkins 1976; C ulver & Banner 1979).
N um erous investigations h ave been undertaken to understand sedim ent transport in the Bristol Channel and Severn Estuary over the past 25 years (for reviews see Parker & Kirby 1982; C ollins 1983, 1987, 1989; D yer 1984). W ithin this con text, controversy has arisen recently betw een the use o f ‘bedload parting’ (Stride & B elderson 1990, 1991) and ‘m utually evasive transport’ m odels (Harris & Collins 1991) to explain sand m ovem en t within the system. N evertheless, it has been concluded that ‘in general terms the bed-load parting and th e m utually evasive sand transport system s are n ot exclusive o f o n e another. T he bed-load partings exist m ainly offshore and the m utually evasive paths mainly in sand-choked estu aries’ (Stride & B elderson 1991). N otw ithstanding this ob servation , the present state of know ledge is still insufficient to understand fully sedim ent supply and transport w ithin such a com plex system .
sub ito e.V . licensed c u sto m er copy su p p lied a n d prin ted for F la n d e rs M arine Institute Library (SL I05X 00226E )
S E V E R N E S T U A R Y / B R I S T O L C H A N N E L S E D I M E N T S591
Methods
Data a c q u is it io n a n d a n a ly s i s
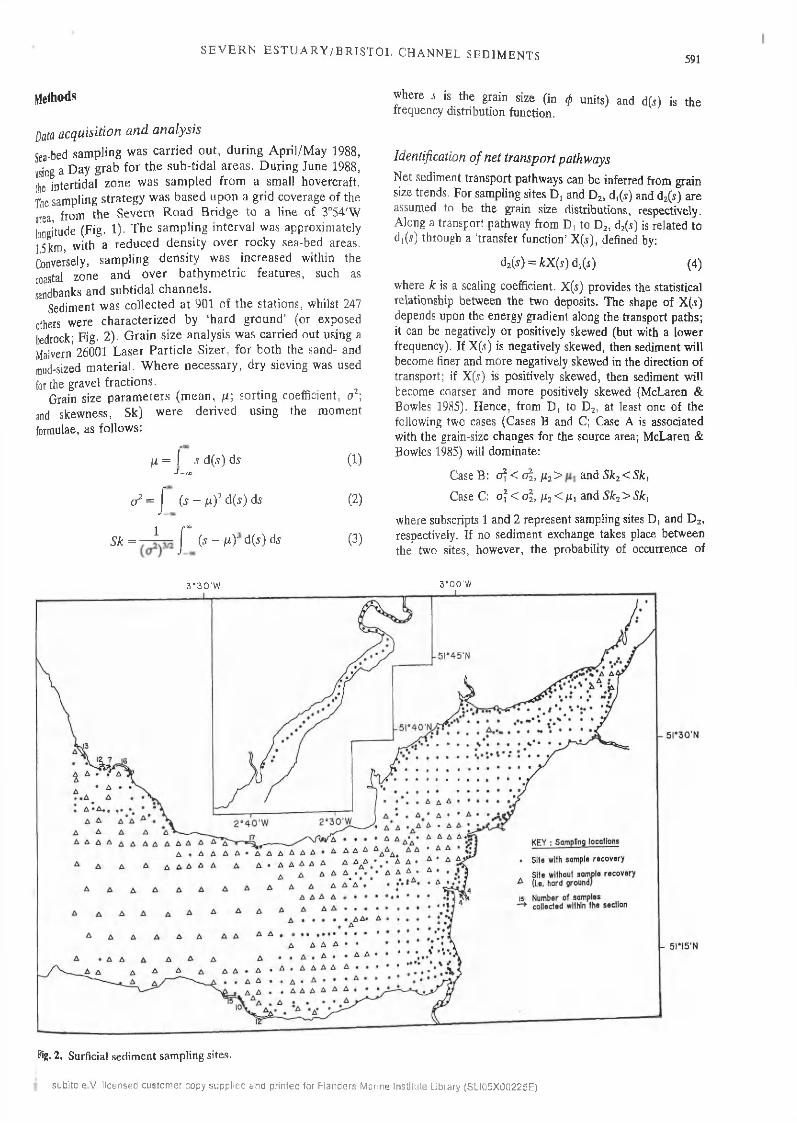
Sea-bed sam pling w as carried o u t, during A p ril/M ay 1988, using a D ay grab fo r th e sub-tidal areas. D uring June 1988* the intertidal zone w as sam p led from a sm all hovercraft.’ The sampling strategy w as based upon a grid coverage o f the area, from the Severn R oad B ridge to a line o f 3°54'W longitude (F ig. 1). T h e sam pling interval w as approxim ately1.5 km, with a reduced den sity o v er rocky sea-bed areas. Conversely, sam pling d en sity was increased within the coastal zone and over bathym etric features, such as sandbanks and subtidal channels.
Sediment w as co llec ted at 901 o f th e stations, whilst 247 others were characterized by ‘hard ground’ (or exposed bedrock; F ig. 2 ) . G rain s iz e analysis w as carried out using a Malvern 26001 Laser Particle Sizer, for both the sand- and mud-sized m aterial. W h ere n ecessary , dry sieving was used for the gravel fractions.
Grain size param eters (m ean , fx\ sorting coefficient, a 2; and skew ness, Sk) w ere derived using the m om ent formulae, as fo llow s:
ju = I j d (j ) d s ( 1)J - to
ct2 = J ( s - p ) 2 d ( s ) d s (2)
i rS k = J (s - H)’ d (s ) ás (3)
where 5 is the grain size (in (f) units) and d(s) is the frequency distribution function.
Identification o f net transport pathw ays
N et sediment transport pathways can be inferred from grain size trends. For sampling sites D , and D 2, d ,(i) and d2(s) are assumed to be the grain size distributions, respectively. Along a transport pathway from D , to D 2, d2(j) is related to dt(s) through a ‘transfer function’ X (s), defined by:
d2(s) = k X( s ) d ,( i) (4)
where A: is a scaling coefficient. X (s) provides the statistical relationship between the two deposits. The shape o f X (s) depends upon the energy gradient along the transport paths; it can be negatively or positively skewed (but with a lower frequency). If X (s) is negatively skewed, then sediment will become finer and more negatively skewed in the direction o f transport; if X (s) is positively skewed, then sediment will become coarser and more positively skewed (McLaren & Bowles 1985). H ence, from D , to D 2, at least one o f the following two cases (Cases B and C; Case A is associatedwith the grain-size changes for the source area; McLaren &Bowles 1985) will dominate:
Case B : cfi< d i, p 2> and S k2< Sk¡
Case C: o? < oL #x2 < M, and S k*> S k '
where subscripts 1 and 2 represent sampling sites D, and D 2, respectively. If no sediment exchange takes place between the two sites, however, the probability of occurrence of
3°30 'W 3"00'W
L 5 I ° 4 0 'N .
2 ’ 4 0 'W
KEY : Som pling locutionsA A
. S lle with sam p le re c o v e ry
S ite w ithout sam p le re c o v e ry (i.e. hard ground)
is N um ber o f s a m p le sco llec ted within th e sec tionA A
A A
A A
A A
Fig. 2. Surficial sed im en t sam pling sites.
subito e .V . licensed customer copy supplied and printed for Flanders M arine Institute Library (SLI05X 00225E )
592 P. M C L A R E N E T A L .
either Case B or C is very low. If the probability is high, then the most probable transport direction can be identified.
A procedure for calculating the probabilities o f Case B and C occurrences, together with a significance test to determ ine if the probability is high enough for such transport, has been proposed (M cLaren & B ow les 1985). For n samples along a survey line, /V = (n2 - n ) / 2 possible pairs are form ed. For each direction, Nx (the observed numbers o f pairs representing Case B or C) is then established. Finally, a Z-score for each case and each direction is calculated, using the formula:
Nx - p N
[ N p ( l - p ) V(5)
where p is the background probability. A Z -score which exceeds a certain level indicates that transport in a preferred direction is highly probable. The 95% and 99% levels o f significance are Z = 1.645 and Z = 2 .330, respectively.
Equation (5) can be rewritten as:
[ p ( l - p ) ] iaZ / N ia ~ N J N + p = 0 (6)
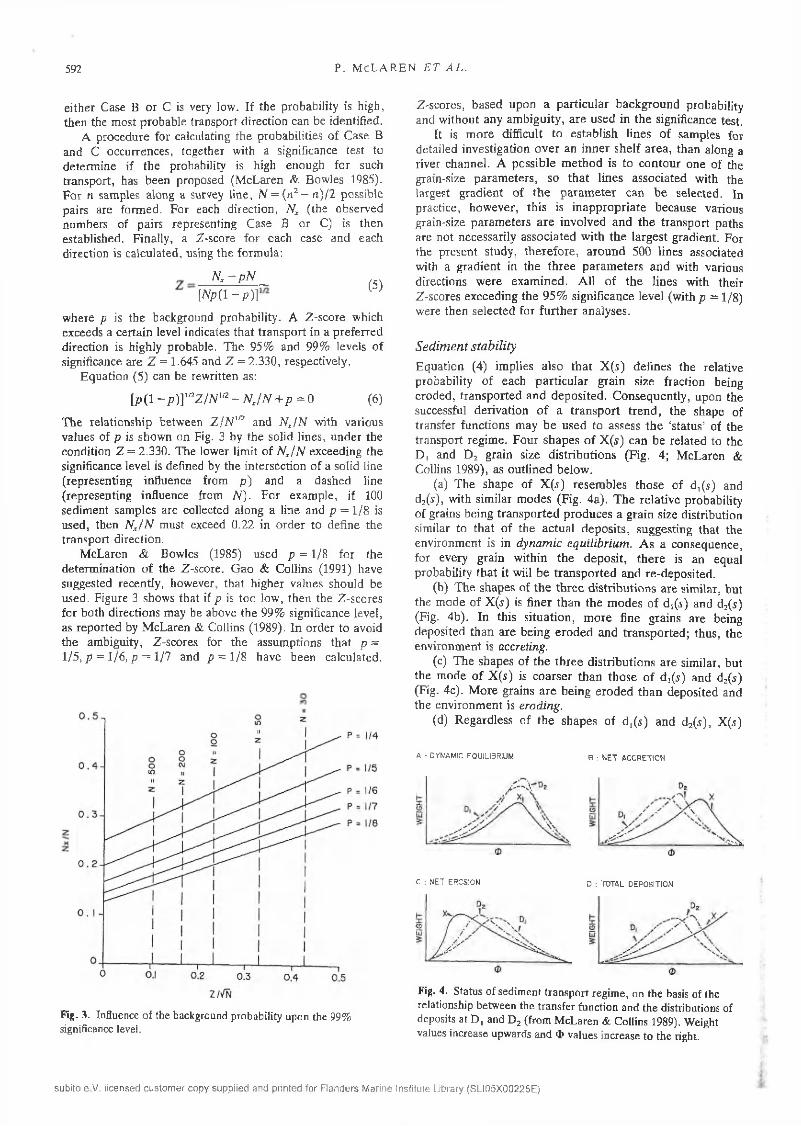
T he relationship between Z / N ]f2 and N x/ N with various values of p is show n on Fig. 3 by the solid lines, under the condition Z = 2 .330. The lower limit o f Nx/ N exceeding the significance level is defined by the intersection o f a solid line (representing influence from p ) and a dashed line (representing influence from N ) . For exam ple, if 100 sedim ent sam ples are collected along a line and p = 1 /8 is used, then Nx/ N must exceed 0.22 in order to define the transport direction.
McLaren & Bowles (1985) used p = 1/8 for the determination o f the Z-score. G ao & Collins (1991) have suggested recently, however, that higher values should be used. Figure 3 shows that if p is too low , then the Z-scores for both directions may be above the 99% significance level, as reported by McLaren & Collins (1989). In order to avoid the ambiguity, Z-scores for the assumptions that p = 1/5 , p = 1 /6 , p = 1/7 and p = 1 /8 have been calculated.
0 . 5
p = 1/4
0 . 4 P = 1/5
P = 1/7
P = 1/80 . 3
0 . 2
0 . I
00.2 0.3 0.4 0.5
Z-scores, based upon a particular background probability and without any am biguity, are used in the significance test.
It is m ore difficult to establish lines o f sam ples for detailed investigation o v er an inner sh e lf area, than along a river channel. A possib le m ethod is to contour one o f the grain-size param eters, so that lines associated with the largest gradient o f th e param eter can b e selected. In practice, how ever, this is inappropriate because various grain-size param eters are involved and th e transport paths are not necessarily associated w ith the largest gradient. For the present study, therefore, around 500 lines associated with a gradient in the three param eters and with various directions w ere exam ined. A ll o f th e lines w ith their Z-scores exceeding the 95% significance level (with p = 1/8) were then selected for further analyses.
S edim ent s tab ility
Equation (4) im plies a lso that X (s ) defines the relative probability o f each particular grain size fraction being eroded, transported and deposited . C onsequently, upon the successful derivation o f a transport trend, the shape of transfer functions may b e used to assess th e ‘status’ of the transport regim e. Four shapes o f X (s) can be related to the D , and D 2 grain size distributions (F ig. 4; McLaren & Collins 1989), as outlined below .
(a) T he shape o f X (s ) resem bles th ose o f d ,(s) and d2(y), with similar m odes (Fig. 4a). T he relative probability o f grains being transported produces a grain size distribution similar to that o f the actual deposits, suggesting that the environm ent is in dyn a m ic equ ilib rium . A s a consequence, for every grain within the deposit, there is an equal probability that it will be transported and re-deposited.
(b) T he shapes o f the three distributions are similar, but the m ode o f X (s) is finer than the m odes o f dj(.s) and d2(s) (Fig. 4b). In this situation, m ore fine grains are being deposited than are being eroded and transported; thus, the environm ent is accreting.
(c) T he shapes o f the three distributions are similar, but the m ode o f X (s) is coarser than th ose o f d ,( i ) and d2(.s) (Fig. 4c). M ore grains are being eroded than deposited and the environm ent is eroding.
(d) R egardless o f the shapes o f dx(j ) and d2(s ) , X (s)
A : DYNAMIC EQUILIBRIUM B : N ET ACCRETION
CD
HXtoUJ5
CD
C : NET EROSION D : TOTAL DEPOSITION
H-Xtoui5
<D
HXOUJ
O
Fig. 3. Influence of the background probability upon the 99% significance level.
Fig. 4. Status of sedim ent tran sp o rt regim e, on th e basis of the relationship betw een th e transfer function and th e distributions of deposits at D , and D 2 (from M cL aren & Collins 1989). W eight values increase upwards and «1» values increase to th e right.
sub ito e.V . licensed c u s to m e r copy su p p lied a n d prin ted for F la n d e rs M arine institu te Library (SLI05X 00225E )
S E V E R N E S T U A R Y / B R I S T O L C H A N N E L S E D I M E N T S 593
increase m onotonically over the com p lete size range (Fig. 4d) This pattern occurs w hen sed im ent, once deposited, undergoes no further transport ( i .e . total deposition ).
The shapes o f th e transfer functions are exam ined below, for areas where th e trend o f sed im en t transport is shown to be statistically significant. T ypical transfer functions are used then to illustrate the status o f th e transport regim e. Based upon the status, as w ell as the sed im ent facies and the case of sediment transport (C ase B or C ), various transport environments are identified.
Results
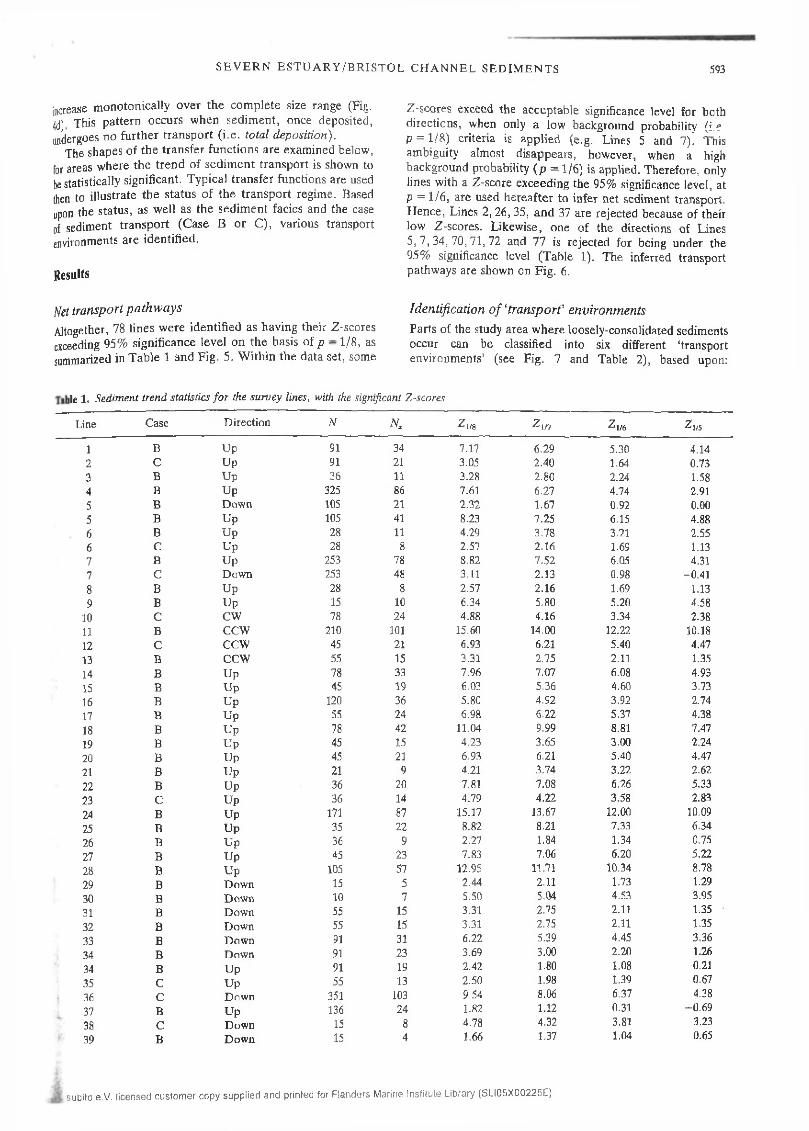
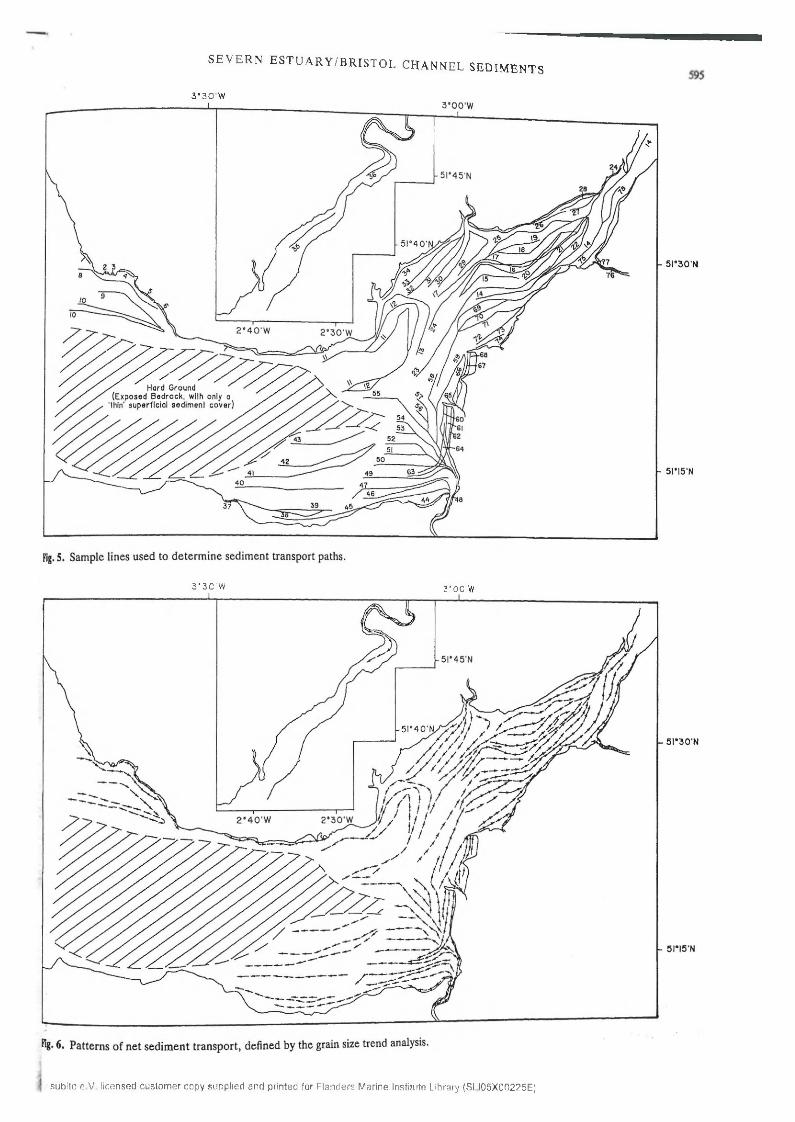
Z -scores exceed the acceptable significance level for both directions, when only a low background probability (i.e. P = 1 /8 ) criteria is applied (e .g . Lines 5 and 7). This ambiguity almost disappears, however, when a high background probability (p = 1/6) is applied. Therefore, only lines with a Z-score exceeding the 95% significance level, at p = 1 /6 , are used hereafter to infer net sediment transport. H ence, Lines 2 ,2 6 ,3 5 , and 37 are rejected because o f their low Z-scores. L ikew ise, one o f the directions o f Lines 5 ,7 ,3 4 ,7 0 ,7 1 ,7 2 and 77 is rejected for being under the 95% significance level (Table 1). The inferred transport pathways are shown on Fig. 6.
Net transport p a th w a y sAltogether, 78 lines w ere identified as having their Z-scores exceeding 95% significance level on th e basis o f p - 1 / 8 , as summarized in T able 1 and F ig. 5 . W ithin the data set, som e
Identification o f 1tra n sp o rt ’ environm ents
Parts o f the study area w here loosely-consolidated sediments occur can be classified into six different ‘transport environm ents’ (see Fig. 7 and Table 2), based upon:
le 1. Sedim ent trend statistics fo r the survey lines, with the significant Z-scores
Line Case D irection N Nx Zi/8 z \n Z M Z V5
1 B Up 91 34 7.17 6.29 5.30 4.142 C Up 91 21 3.05 2.40 1.64 0.733 B Up 36 11 3.28 2.80 2.24 1.584 B Up 325 86 7.61 6.27 4.74 2.915 B D ow n 105 21 2.32 1.67 0.92 0.005 B Up 105 41 8.23 7.25 6.15 4.886 B Up 28 11 4.29 3.78 3.21 2.556 C Up 28 8 2.57 2.16 1.69 1.137 B Up 253 78 8.82 7.52 6.05 4.317 C D ow n 253 48 3.11 2.13 0.98 -0 .4 18 B Up 28 8 2.57 2.16 1.69 1.139 B Up 15 10 6.34 5.80 5.20 4.58
10 C c w 78 24 4.88 4.16 3.34 2.3811 B c c w 210 101 15.60 14.00 12.22 10.1812 C c c w 45 21 6.93 6.21 5.40 4.4713 B c c w 55 15 3.31 2.75 2.11 1.3514 B Up 78 33 7.96 7.07 6.08 4.9315 B Up 45 19 6.03 5.36 4.60 3.7316 B Up 120 36 5.80 4.92 3.92 2.7417 B Up 55 24 6.98 6.22 5.37 4.3818 B Up 78 42 11.04 9.99 8.81 7.4719 B Up 45 15 4.23 3.65 3.00 2.2420 B Up 45 21 6.93 6.21 5.40 4.4721 B Up 21 9 4.21 3.74 3.22 2.62
22 B Up 36 20 7.81 7.08 6.26 5.3323 C Up 36 14 4.79 4.22 3.58 2.83
24 B Up 171 87 15.17 13.67 12.00 10.0925 B U p 35 22 8.82 8.21 7.33 6.34
26 B Up 36 9 2.27 1.84 1.34 0.75
27 B Up 45 23 7.83 7.06 6.20 5.22
28 B Up 105 57 12.95 11.71 10.34 8.78
29 B D ow n 15 5 2.44 2.11 1.73 1.29
30 B D ow n 10 7 5.50 5.04 4.53 3.95
31 B D ow n 55 15 3.31 2.75 2.11 1.35
32 B D ow n 55 15 3.31 2.75 2.11 1.35
33 B D ow n 91 31 6.22 5.39 4.45 3.36
34 B D ow n 91 23 3.69 3.00 2.20 1.26
34 B Up 91 19 2.42 1.80 1.08 0.21
35 C Up 55 13 2.50 1.98 1.39 0.67
36 C D ow n 351 103 9.54 8.06 6.37 4.38
37 B Up 136 24 1.82 1.12 0.31 -0 .6 9
38 C D ow n 15 8 4.78 4.32 3.81 3.23
39 B D ow n 15 4 1.66 1.37 1.04 0.65
sub ito e.V . licensed c u s to m e r copy su p p lied a n d prin ted for F la n d e rs M arine institu te Library (SL.I05X00225E)
594 P. M C L A R E N E T A L .
Table 1— (Continued)
Line Case D irection N Z 1/8 Z i/? Z\/6 Z y s
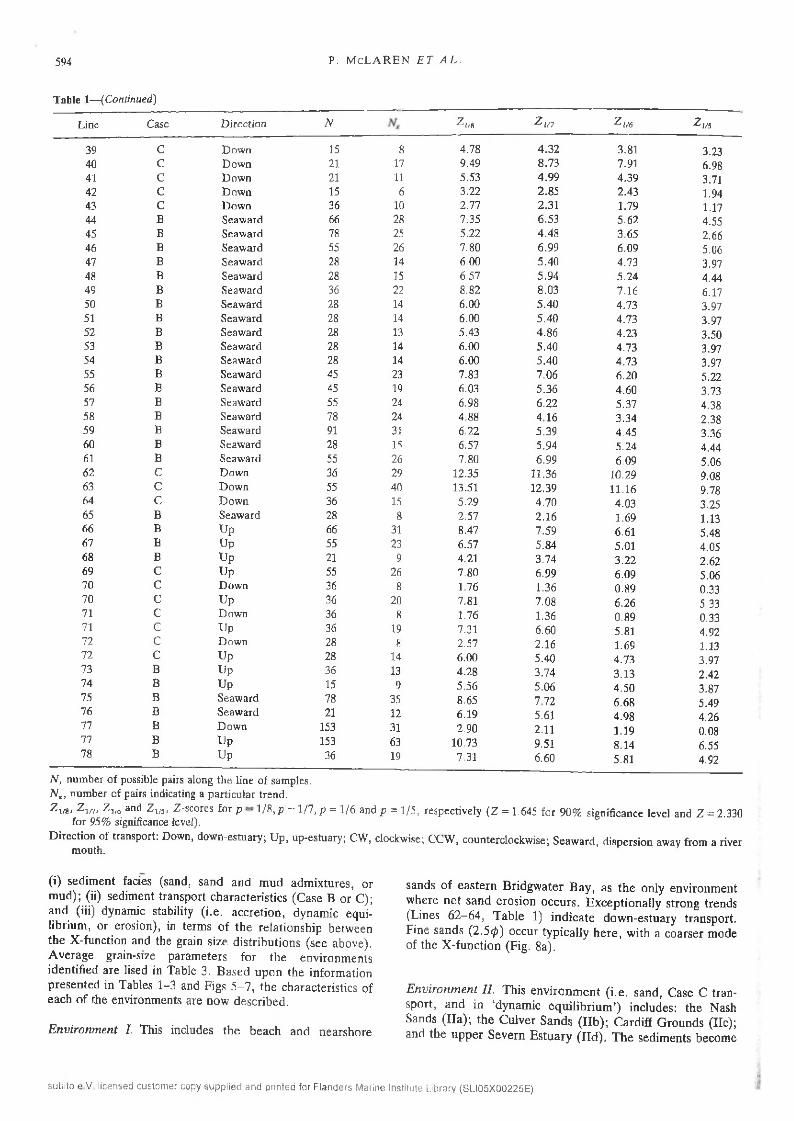
39 C D ow n 15 8 4.78 4 .32 3.81 3.2340 C D ow n 21 17 9.49 8.73 7.91 6.9841 C D ow n 21 11 5.53 4.99 4.39 3.7142 c D ow n 15 6 3.22 2.85 2.43 1.9443 c Dow n 36 10 2.77 2.31 1.79 1.1744 B Seaward 66 28 7.35 6.53 5.62 4.5545 B Seaward 78 25 5.22 4.48 3.65 2.6646 B Seaw ard 55 26 7.80 6.99 6.09 5.0647 B Seaw ard 28 14 6.00 5.40 4.73 3.9748 B Seaw ard 28 15 6.57 5.94 5.24 4.4449 B Seaw ard 36 22 8.82 8.03 7.16 6.1750 B Seaw ard 28 14 6.00 5.40 4.73 3.9751 B Seaw ard 28 14 6.00 5.40 4.73 3.9752 B Seaw ard 28 13 5.43 4.86 4.23 3.5053 B Seaw ard 28 14 6.00 5.40 4.73 3.9754 B Seaward 28 14 6.00 5.40 4.73 3.9755 B Seaward 45 23 7.83 7.06 6.20 5.2256 B Seaw ard 45 19 6.03 5.36 4.60 3.7357 B Seaw ard 55 24 6.98 6.22 5.37 4.3858 B Seaw ard 78 24 4.88 4.16 3.34 2.3859 B Seaw ard 91 31 6.22 5.39 4.45 3.3660 B Seaw ard 28 15 6.57 5.94 5.24 4.4461 B Seaw ard 55 26 7.80 6.99 6.09 5.0662 C Dow n 36 29 12.35 11.36 10.29 9.0863 C D ow n 55 40 13.51 12.39 11.16 9.7864 C D ow n 36 15 5.29 4.70 4.03 3.2565 B Seaw ard 28 8 2.57 2.16 1.69 1.1366 B U p 66 31 8.47 7.59 6.61 5.4867 B Up 55 23 6.57 5.84 5.01 4.0568 B U p 21 9 4.21 3.74 3.22 2.6269 C Up 55 26 7.80 6.99 6.09 5.0670 C D ow n 36 8 1.76 1.36 0.89 0.3370 C U p 36 20 7.81 7.08 6.26 5.3371 C D ow n 36 8 1.76 1.36 0.89 0.3371 C U p 36 19 7.31 6.60 5.81 4.9272 C D ow n 28 8 2.57 2.16 1.69 1.1372 C U p 28 14 6.00 5.40 4.73 3.9773 B U p 36 13 4.28 3.74 3.13 2.4274 B U p 15 9 5.56 5.06 4.50 3.8775 B Seaw ard 78 35 8.65 7.72 6.68 5.4976 B Seaw ard 21 12 6.19 5.61 4.98 4.2677 B D ow n 153 31 2.90 2.11 1.19 0.0877 B U p 153 63 10.73 9.51 8.14 6.5578 B U p 36 19 7.31 6.60 5.81 4.92
N , num ber o f possible pairs along th e line of samples.Nx , num ber of pairs indicating a particu lar trend.Z m , Z in , Z 1/6 and Z vs, Z -scores fo r p - 1 /8 , p = 1 /7 , p = 1/6 and p = 1 /5, respectively (Z = 1.645 fo r 90% significance level and Z = 2.330
fo r 95% significance level).
D irection of transport: Down, dow n-estuary; U p , up-estuary; CW , clockwise; C C W , counterclockw ise; Seaw ard , d ispersion away from a river m outh.
( i) s e d im e n t facies (san d , s a n d a n d m u d a d m ix tu re s , o r m u d ) ; (ii) s e d im e n t t ra n s p o r t c h a ra c te r is tic s (C a se B o r C ); a n d (iii) d y n am ic s tab ility ( i .e . a c c re t io n , d y n a m ic e q u il ib r iu m , o r e ro s io n ) , in te rm s o f th e re la tio n s h ip b e tw e e n th e X -fu n c tio n a n d th e g ra in s iz e d is tr ib u tio n s (se e a b o v e ) .A v e ra g e g ra in -s ize p a ra m e te rs f o r th e e n v iro n m e n ts id e n tif ie d a re lised in T a b le 3 . B a s e d u p o n th e in fo rm a tio n p re s e n te d in T ab les 1 -3 an d F ig s 5 - 7 , th e c h a ra c te r is tic s o f e a c h o f th e e n v iro n m e n ts a re n o w d e sc r ib e d .
E n v ir o n m e n t I. T h is in c lu d e s th e b e a c h a n d n e a rs h o re
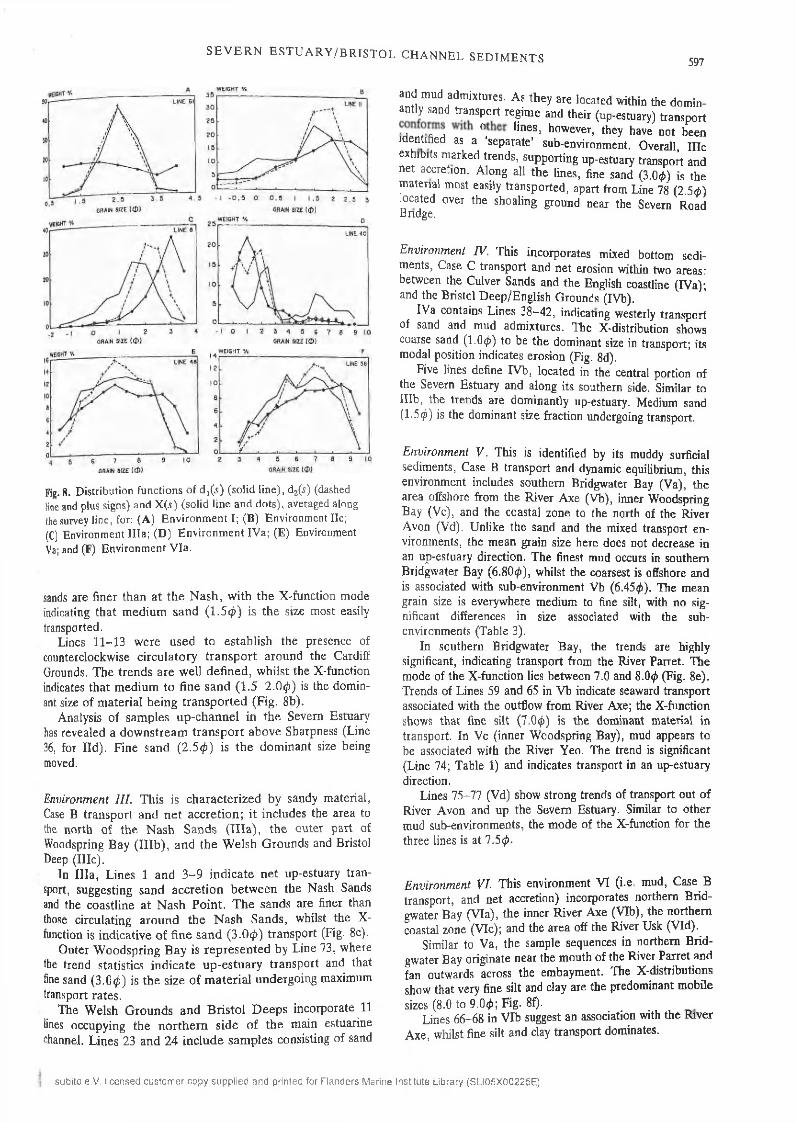
sa n d s o f e a s te r n B r id g w a te r B a y , a s th e o n ly e n v iro n m e n t w h e re n e t s a n d e ro s io n o c c u rs . E x c e p tio n a lly s tro n g tre n d s (L in e s 6 2 - 6 4 , T a b le 1) in d ic a te d o w n -e s tu a ry t ra n s p o r t . F in e s a n d s (2 .5 <p) o c c u r ty p ic a lly h e r e , w ith a c o a rs e r m o d e o f th e X -fu n c tio n (F ig . 8a ).
E n v ir o n m e n t I I . T h is e n v ir o n m e n t ( i .e . s a n d , C a se C t r a n sp o r t , a n d in ‘d y n a m ic e q u i l ib r iu m ’) in c lu d e s : th e N ash S a n d s ( I l a ) ; th e C u lv e r S a n d s ( l i b ) ; C a rd if f G r o u n d s ( I le ) ; a n d th e u p p e r S e v e rn E s tu a r y ( l i d ) . T h e s e d im e n ts b e c o m e
su b ito e.V . licensed c u sto m er copy su p p lie d arid p rin ted for F la n d e rs M arine Institute Library (S L I05X 00225E )
S E V E R N E S T U A R Y /B R I S T O L C H A N N E L S E D IM E N T S
3 '3 0 'W
- 5 I * 3 0 'N
2 “ 4 0 'W 2 ’30'W
/ Hard Ground(Exposed Bedrock, wllh only a
'Ihln' superficial sedlmenl cover)
52
50
49
39
?ig. 5. Sample lines used to d e te rm in e sedim ent transport paths.
3 '3 0 'W 3'00'W
2 ‘40'W
h- 6. Patterns of net sediment transport, defined by the grain size trend analysis.
su b ito e.V . lic en se d c u s to m e r copy supp lied a n d p rin ted for F la n d e rs M arine Institute Library (S I.I05X 00225E)

596 p . M c L a r e n e t a l .
3°30'W 3°00'W
•Vic
■ V dn i e5I°4 O'N,5I°30'N
Illa!V b
YeIle2°30'W
I l lb
•VIb
Vialib
5 I ° I 5 'N
E r o s io n a lVoIVa
Fig. 7. Sediment transport environm ents, on the basis of dynam ic sta tus, sed im en t provinces and th e C ase B and C conditions.
steadily finer, from the Nash Sands to the upper Severn Estuary, ranging from medium (1 .3 4 0 ) to fine sands 2 .9 0 (0 ) (Table 3).
Transport around the Nash Sands is represented by Line 10, as (clockwise) sand circulation around a linear sandback
Table 2. Sediment transport environm ents in the Severn Estuary and Bristol Channel
Sample Sedim ent Environm ent* lines type Case Status
I 62-64 sand C ne t erosionIla 10 sand C equilibriumlib 43 sand C equilibriumIle 11-13 sand c equilibriumlid 36 sand c equilibriumIlla 1, 3 -9 sand B ne t accretionIllb 73 sand B net accretionUle 14-22, 25, 78 sand B ne t accretionIVa 38-42 mixed C ne t erosionrvb 23, 69-72 mixed C ne t erosionVa 44-49 m ud B equilibriumVb 59, 65 mud B equilibriumVc 74 mud B equilibriumVd 75-77 mud B equilibriumV ia 50-58, 60-61 mud B ne t accretionVIb 66-68 mud B ne t accretionVic 27-28 mud B ne t accretionVId 30-33 m ud B net accretion
(cf. Pattiaratchi & C ollins 1988). T he X -function m ode lies at 1 .0 0 , show ing that coarse sand is the dom inant size fraction in transit.
T o the south o f the C ulver Sands, th e trend analysis of Line 43 indicated w esterly (dow n-estuary) transport. The
Table 3. A verage grain-size characteristics in each o f the transport environm ents (defined in Table 2 and o n Fig. 9)
G rain-size p a ram ete rs (0 ) N um ber of
Environment* M a 2samples
I 2.69 1.00 3.17 22Ila 1.34 0.71 1.79 13lib 1.87 0.88 1.97 9Ile 2.13 1.93 1.64 34l id 2.90 1.06 2.63 27I l la 1.85 1.02 0.55 14I l lb 2.43 0.77 3.59 10U le 2.59 1.69 1.90 106IV a 2.44 2.37 1.11 29IVb 3.87 2.53 0.51 29V a 6.80 1.51 -0 .6 1 60V b 6.45 1.85 -1 .3 7 11Vc 6.73 1.38 -0 .1 4 8Vd 6.75 1.49 -0 .5 3 28V ia 6.59 1.69 -0 .7 6 57V Ib 6.66 1.48 -0 .5 4 26V Ic 6.94 1.44 -0 .8 5 56V Id 6.38 1.78 -0 .9 8 23
* Locations given in Fig. 8. * Locations given in Fig. 8
sub ito e.V . licenced cu s to m e r copy su p p lied a n d prin ted for F la n d e rs M arine Institu te Library (SLIÜ5X00225E)
S E V E R N E S T U A R Y / B R I S T O L C H A N N E L S E D I M E N T S 597
3 0
2 5
G R A IN S IZ E (< D )
C_L I N E B
W E IG H T % O2 5
2 0
V43
G R A IN S IZ E (CT>)
ILINE 48 I
?5 6 8 9 IOZ 3IOG R A IN S I Z E ( © )
Fig. 8. D istribution functions o f d , ( i ) (solid line), d 2(s) (dashed line and plus signs) an d X (i) (solid line and do ts), averaged along the survey line, for: (A ) E n v iro n m en t I; (B ) E nvironm ent Ile;(C) Environm ent I l la ; (D ) E n v iro n m e n t IV a; (E ) Environm ent Va; and (F) E nv ironm en t V ia .
sands are finer than at th e N a sh , w ith the X -function mode indicating that m edium sand ( 1 .5 0 ) is the size most easily transported.
Lines 1 1 -13 w ere used to establish the presence of counterclockwise circulatory transport around the Cardiff Grounds. T h e trends are w ell defined , w hilst the X-function indicates that m edium to fine sand ( 1 .5 - 2 .0 0 ) is the dominant size o f m aterial being transported (F ig. 8b).
Analysis o f sam ples up -ch an n el in th e Severn Estuary has revealed a dow nstream transport ab ove Sharpness (Line 36, for l id ) . F ine sand ( 2 .5 0 ) is th e dom inant size being moved.
Environm ent III. T his is characterized by sandy material, Case B transport and n et accretion; it includes the area to the north o f the N ash Sands ( I l la ) , th e outer part of Woodspring B ay ( I l lb ) , and the W elsh G rounds and Bristol Deep ( l i le ) .
In I l la , L ines 1 and 3 - 9 in d ica te net up-estuary transport, suggesting sand accretion betw een the Nash Sands and the coastline at N ash P oin t. T h e sands are finer than those circulating around th e N ash Sands, whilst the X- function is indicative o f fine san d ( 3 .0 0 ) transport (Fig. 8c).
Outer W oodspring B a y is rep resen ted by L ine 73, where the trend statistics in d icate up-estuary transport and that fine sand (3 .0 0 ) is th e size o f m ateria l undergoing maximum transport rates.
The W elsh G rounds and B risto l D eep s incorporate 11 fines occupying the northern sid e o f th e main estuarine channel. L ines 23 and 24 in clu d e sam p les consisting o f sand
and mud admixtures. A s they are located within the dominantly sand transport regim e and their (up-estuary) transport
h ° hneS’ however> they have not beenidentified as a ‘separate’ sub-environment. Overall, l i le exhibits marked trends, supporting up-estuary transport and net accretion. A long all the lines, fine sand (3 .00) is the material most easily transported, apart from Line 78 (2 .5 0 ) located over the shoaling ground near the Severn Road Bridge.
E nvironm ent IV . This incorporates mixed bottom sediments, Case C transport and net erosion within two areas: between the Culver Sands and the English coastline (IVa); and the Bristol D eep/E nglish Grounds (IVb).
IVa contains Lines 38 -4 2 , indicating westerly transport of sand and mud admixtures. The X-distribution shows coarse sand (1 .0 0 ) to be the dominant size in transport; its modal position indicates erosion (Fig. 8d).
Five lines define IVb, located in the central portion o f the Severn Estuary and along its southern side. Similar to Illb , the trends are dominantly up-estuary. Medium sand (1 .50 ) is the dominant size fraction undergoing transport.
E nvironm ent V . This is identified by its muddy surficial sediments, Case B transport and dynamic equilibrium, this environment includes southern Bridgwater Bay (Va), the area offshore from the River A xe (Vb), inner Woodspring Bay (V c), and the coastal zone to the north of the River Avon (Vd). U nlike the sand and the mixed transport environments, the mean grain size here does not decrease in an up-estuary direction. The finest mud occurs in southern Bridgwater Bay (6 .800 ), whilst the coarsest is offshore and is associated with sub-environment Vb (6 .450). The mean grain size is everywhere medium to fine silt, with no significant differences in size associated with the sub- environments (Table 3).
In southern Bridgwater Bay, the trends are highly significant, indicating transport from the River Parret. The mode of the X-function lies between 7.0 and 8 .00 (Fig. 8e). Trends of Lines 59 and 65 in Vb indicate seaward transport associated with the outflow from River Axe; the X-function shows that fine silt (7 .0 0 ) is the dominant material in transport. In V c (inner Woodspring B ay), mud appears to be associated with the River Y eo. The trend is significant (Line 74; Table 1) and indicates transport in an up-estuary direction.
Lines 75-77 (Vd) show strong trends of transport out o f River Avon and up the Severn Estuary. Similar to other mud sub-environments, the m ode o f the X-function for the three lines is at 7 .5 0 .
E nvironm ent VI. This environment VI (i.e. mud, Case B transport, and net accretion) incorporates northern Bridgwater Bay (V ia), the inner River A xe (VIb), the northern coastal zone (Vic); and the area off the River Usk (VId).
Similar to Va, the sample sequences in northern Bridgwater Bay originate near the mouth o f the River Parret and fan outwards across the embayment. The X-distributions show that very fine silt and clay are the predominant mobilesizes (8.0 to 9 .00; Fig. 8f). _
Lines 66-68 in VIb suggest an association with the River A xe, whilst fine silt and clay transport dominates.
sub ito e.V . licensed c u sto m er copy su p p lied a n d p rin ted for F la n d e rs M arine Institute Library (SLI05X 00225E )
598 P. M C L A R E N E T A L .
In V ic , Lines 27 and 28 indicate mud deposition near the narrows (Severn Road Bridge), along th e northern side o f the Severn Estuary. Transport is up-estuary, consistent with the directions in the nearby sub-environments.
Lines 30-33 indicate a transport regim e em anating from the R iver U sk, trending down-estuary. T he X -function is indicative o f net accretion.
Sum m ary. T he distribution o f sedim entary environm ents (described above) compared to areas o f outcropping pre- Quaternary rocks (indicative o f erosion) represents, in general, dynamic stability. H ence, along the main channel of the Severn estuary and most o f the longitudinal axis o f the B ristol Channel, erosion is taking place. A ccretion is associated generally with the head o f the estuary and areas adjacent to the tributary rivers, such as the Parret and U sk. Linear sandbanks, such as the N ash, Culver and Holm Sands, are considered to be in a state o f dynamic equilibrium.
Discussion: comparison with previous investigations
P atterns o f w ater m o vem en t
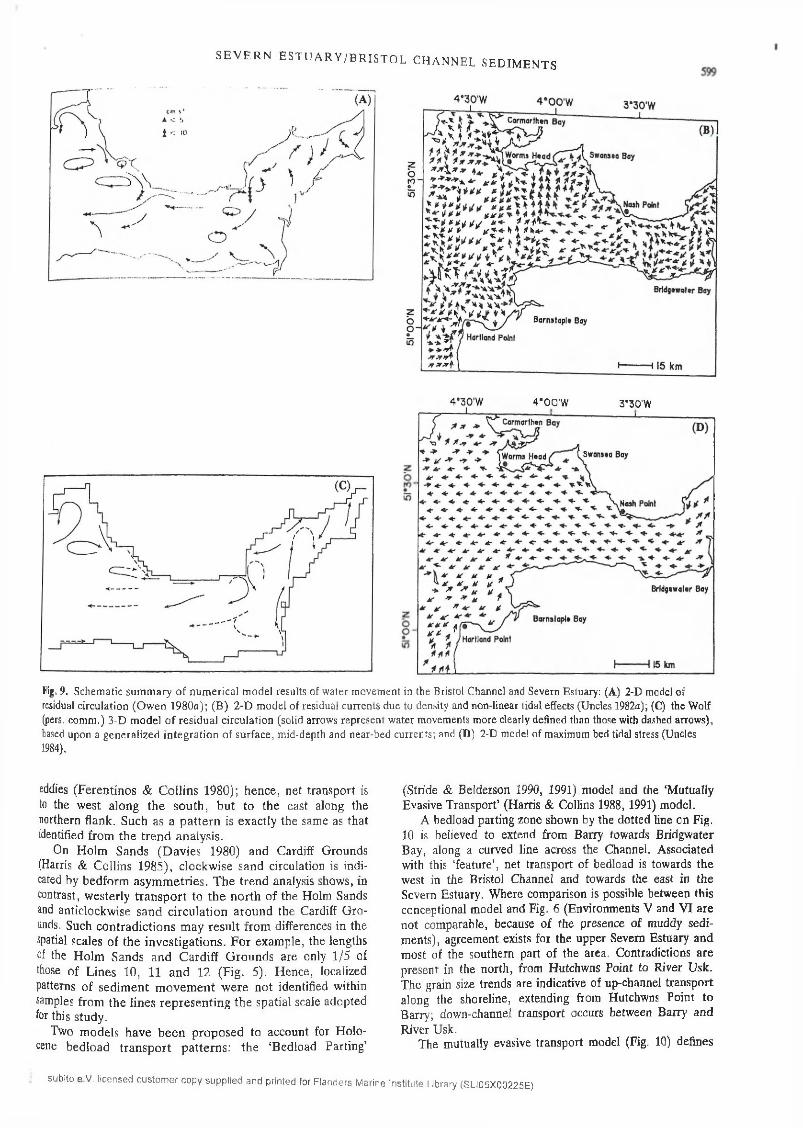
Investigations into residual water circulation and maximum near-bed shear stresses (or speeds) for the Bristol Channel have been undertaken on the basis o f current meter observations and seabed drifter recovery patterns (Collins & Ferentinos 1984; Harris & Collins 1985) and numerical m odelling (Hamilton 1973; Robinson 1978; Pingree & Griffiths 1979; Owen 1980a, b ; U ncles 1982a, b, 1984; U ncles et al. 1985; Stephens 1986; W olf 1987). R epresentative results obtained from the higher resolution (2-D and 3-D ) numerical modelling approaches are com pared now with transport patterns defined using sedim ent trends, as follow s: (1) residual currents (O w en 1980a); (2) residual currents (U ncles 1982a); (3) near-bed and mid-depth Eulerian residual water circulation (W olf 1987 and pers. com m .); and (4) tidally-induced m aximum stresses on the sea-bed, resulting from M2- M 4 and residual current interaction (U ncles 1984).
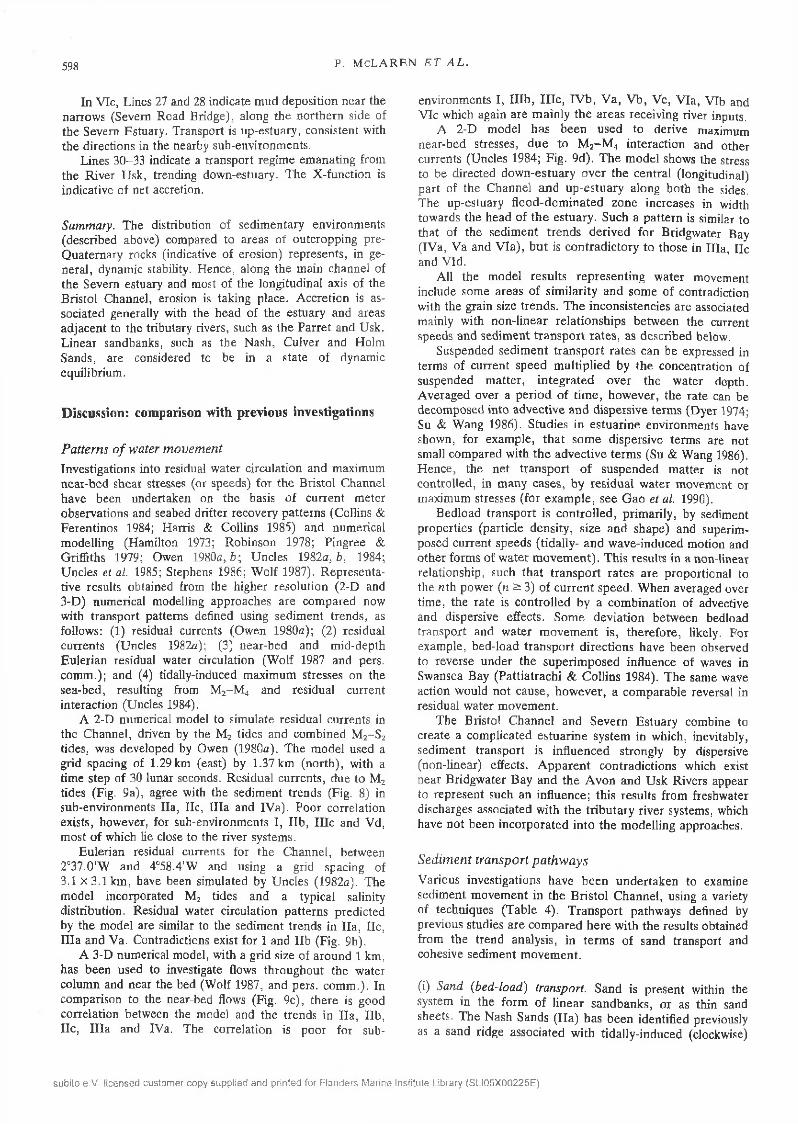
A 2-D numerical m odel to sim ulate residual currents in the Channel, driven by the M2 tides and com bined M 2- S 2 tides, was developed by Owen (1980a). T he m odel used a grid spacing o f 1 .29km (east) by 1.37 km (north), with a tim e step o f 30 lunar seconds. R esidual currents, due to M 2 tides (Fig. 9a), agree with the sedim ent trends (Fig. 8) in sub-environm ents Ila , Ile , I l la and IV a). Poor correlation exists, how ever, for sub-environm ents I, l ib , U le and Vd, m ost o f which lie close to the river system s.
Eulerian residual currents for the Channel, between 2°37.0'W and 4°58.4'W and using a grid spacing of 3.1 X 3.1 km , have been simulated by U ncles (1982a). T he m odel incorporated M2 tides and a typical salinity distribution. Residual water circulation patterns predicted by the m odel are similar to the sedim ent trends in Ila , Ile, I lla and V a. Contradictions exist for I and l ib (F ig. 9b).
A 3-D numerical m odel, with a grid size o f around 1 km, has been used to investigate flows throughout the water colum n and near the bed (W olf 1987, and pers. com m .). In comparison to the near-bed flows (Fig. 9c), there is good correlation betw een the m odel and the trends in I la , lib , Ile , I l la and IVa. The correlation is poor for sub
environm ents I, I l lb , l i l e , IV b , V a , V b , V c, V ia , VIb and V ic which again are m ain ly th e areas receiving river inputs.
A 2 -D m odel has been u sed to derive maximum near-bed stresses, d u e to M 2- M 4 interaction and other currents (U ncles 1984; F ig. 9d). T h e m odel show s the stress to be directed dow n-estuary over the central (longitudinal) part o f the C hannel and up-estuary along both the sides. T he up-estuary flood-dom inated zon e increases in width towards the head o f th e estuary. Such a pattern is similar to that o f the sedim ent trends derived for Bridgwater Bay (IV a, V a and V ia ) , but is contradictory to those in I l la , Ile and VId.
A ll the m odel results representing water m ovem ent include som e areas o f sim ilarity and som e o f contradiction with the grain size trends. T h e inconsistencies are associated mainly with non-linear relationships betw een the current speeds and sedim ent transport rates, as described below.
Suspended sed im ent transport rates can be expressed in terms o f current speed m ultip lied by the concentration o f suspended m atter, in tegrated over the w ater depth. A veraged over a period o f tim e, how ever, the rate can be decom posed into ad vective and dispersive term s (D yer 1974; Su & W ang 1986). S tud ies in estuarine environm ents have show n, for exam ple, th at so m e d ispersive term s are not small com pared with th e ad vective term s (Su & W ang 1986). H en ce, the net transport o f suspended m atter is not controlled, in m any cases, by residual w ater m ovem ent or maxim um stresses (for exam ple, see G ao et al. 1990).
B edload transport is con tro lled , prim arily, by sedim ent properties (particle density , s ize and shape) and superimposed current speeds (tidally- and w ave-induced m otion and other form s o f w ater m ovem en t). T his results in a non-linear relationship, such that transport rates are proportional to the nth pow er (n s 3) o f current speed . W hen averaged over tim e, the rate is controlled by a com bination o f advective and dispersive effects. Som e deviation betw een bedload transport and w ater m ovem en t is , therefore, likely. For exam ple, bed-load transport directions have been observed to reverse under the superim posed influence o f waves in Swansea Bay (Pattiatrachi & C ollins 1984). T he sam e wave action would n ot cause, h ow ever, a com parable reversal in residual water m ovem ent.
T he Bristol C hannel and Severn Estuary com bine to create a com plicated estuarine system in w hich, inevitably, sedim ent transport is in fluenced strongly by dispersive (non-linear) effects. A pparent contradictions which exist near Bridgwater B ay and the A v o n and U sk R ivers appear to represent such an influence; this results from freshwater discharges associated with the tributary river system s, which have not been incorporated in to the m odelling approaches.
S ed im e n t tra n sp o rt p a th w a y s
Various investigations have b een undertaken to examine sedim ent m ovem ent in the B ristol C hannel, using a variety of techniques (T able 4). Transport pathways defined by previous studies are com pared here w ith the results obtained from the trend analysis, in term s o f sand transport and cohesive sedim ent m ovem ent.
(i) S a n d (b ed -lo a d ) transport. Sand is present within the system in the form o f linear sandbanks, or as thin sand sheets. T h e N ash Sands (I la ) has been identified previously as a sand ridge associated w ith tidally-induced (clockwise)
sub ito e.V . lic en sed cu s to m er copy su p p lied a n d p rin ted fo r F la n d e rs M arine Institute Library (SLI05X 00225E )
C arm a rth » n Boy
B a rn s ta p I* Boy
^ H artland Point
S E V E R N E S T U A R Y / B R I S T O L C H A N N E L S E D I M E N T S
3 ‘30'W
Fig. 9. Schem atic sum m ary o f num erical m odel results of w ater m ovem ent in the Bristol Channel and Severn Estuary: (A) 2-D model of residual circulation (O w en 1980a); (B ) 2-D m odel of residual currents due to density and non-linear tidal effects (Uncles 1982a); (C) the Wolf (pers. com m .) 3-D m odel o f residual circulation (solid arrows represent water movements m ore clearly defined than those with dashed arrows), based upon a generalized in teg ra tio n o f surface , m id-depth and near-bed currents; and (D) 2-D model o f maximum bed tidal stress (Uncles1984).
eddies (F erentinos & C ollin s 1980); hence, net transport is to the w est a long th e sou th , but to the east along the northern flank. Such as a pattern is exactly the same as that identified from the trend analysis.
On H olm Sands (D a v ie s 1980) and Cardiff Grounds (Harris & C ollins 1985), c lock w ise sand circulation is indicated by bedform asym m etries. T h e trend analysis show s, in contrast, w esterly transport to th e north o f the Holm Sands and anticlockw ise sand circulation around the Cardiff G rounds. Such contrad ictions m ay resu lt from differences in the spatial scales o f the in vestiga tion s. F or exam ple, the lengths of the H olm Sands and C ardiff G rounds are only 1 /5 of those o f L ines 10, 11 and 12 (F ig . 5). H ence, localized patterns o f sed im en t m o v em en t w ere n ot identified within samples from th e lin es represen ting the spatial scale adopted for this study.
Two m odels have b een prop osed to account for H olo- cene bedload transport patterns: th e ‘B edload Parting’
(Stride & Belderson 1990, 1991) model and the ‘Mutually Evasive Transport’ (Harris & Collins 1988,1991) model.
A bedload parting zone shown by the dotted line on Fig. 10 is believed to extend from Barry towards Bridgwater Bay, along a curved line across the Channel. Associated with this ‘feature’, net transport o f bedload is towards the west in the Bristol Channel and towards the east in the Severn Estuary. W here comparison is possible between this conceptional m odel and Fig. 6 (Environments V and V I are not comparable, because o f the presence o f muddy sedim ents), agreement exists for the upper Severn Estuary and most o f the southern part o f the area. Contradictions are present in the north, from Hutchwns Point to River U sk. The grain size trends are indicative of up-channel transport along the shoreline, extending from Hutchwns Point to Barry; down-channel transport occurs between Barry and River Usk.
The mutually evasive transport model (Fig. 10) defines
B rldgew olar Boy
B ornai api» Bay
Hortland Point
C arm a rth en B ay
S w an sea Bay• W orm s H «od
4 ‘OO'W 3*30'W
subito e.V . licensed custom er copy supplied and printed for Flanders Marine Institute Library (S L I05X 00225E )

P. M C L A R E N E T A L .
Table 4. Sediment transport investigations relating to the Bristol Channel and Severn Estuary
Type of evidence A u th o r(s)
C urrent measurements Kirby & P arker (1975); Collins et al. (1980); P a rk er & K irby (1982); Pattiaratchi & Collins (1984); Parker (1987); H arris & Collins (1988)
General water movement H am ilton (1973); Pingree & Griffiths (1979)
Numerical model Odd (1982)Seabed drifter recoveries Collins & Ferentinos (1984)Bedform orientations Stride (1963); B elderson & Stride (1966); K enyon & S tride (1970); Davies (1980);
Ferentinos & Collins (1980); H arris & C ollins (1985); P a ttia ra tch i & Collins (1987); H arris (1988)
Sediment distributions Solías (1883); B elderson & S tride (1966); C ollins et al. (1980); Davies (1980); Evans (1982)
Heavy mineral distributions B arrie (1990)M ovem ent of foraminiferal tests M urray & Hawkins (1976); C ulver & B an n er (1979); C ulver (1980)Trace element fluxes C hester & Stoner (1975)Geomorphological changes M antz & W akeling (1982)R em ote sensing data Collins (1983); Kenyon (1983)Magnetic fabric analysis Imienwanrin (1988)L iterature reviews Parker & Kirby (1982); Collins (1983, 1987, 1989); D y er (1984); M cLaren & Collins
(1989);Bed load transport pathways Stride & Belderson (1990; 1991); H arris & C ollins (1991)
ebb- and flood-dominant zon es, in terms o f net sediment transport. It is essentially similar to the trend analysis results (Fig. 6) for the Nash Sands, along the southern coastline of the Severn Estuary and near H olm Sands. M odel and trend analyses contradict, however, in the central part o f the Severn Estuary (i.e . over som e o f l i l e and IVb) and som e areas around Culver Sand ( l ib ) and near W atchet (part of IVa).
(ii) Suspended sedim ent transport. Schem atized circulation patterns for fine-grained sedim ents have been studied and proposed by Parker & Kirby (1982) and by Collins (1983). In the schematic m odel o f Parker & Kirby (Fig. I la ) , suspended material is transported up-channel along the northern side o f the Severn Estuary, whilst Bridgwater Bay appears to be a sink for fine-grained m aterial. T he sediment trend analyses demonstrate (Fig. 6 ), how ever, seaward transport within V Ic (River U sk) and radial m ovem ent from the River Parret (Va and V ia).
Fig. 10. Conceptual models for sand transport in the Severn Estuary and Bristol Channel showing ‘bedload parting’ and ‘mutually evasive transport’ patterns (after H arris & Collins 1991).
T he m odel o f C ollins (F ig. l i b ) represents suspended sed im ent transport in th e surface w aters. This interpretation agrees w ith the trend analysis for V a , V ia and V Ic, but am biguities exist in eastern B ridgw ater Bay.
Interestingly, in both m od els, the influence o f tributary river inputs is not as m arked as indicated by the grain size trends. T he latter analysis dem onstrates that these rivers (Parret and U sk , in particular) control the net transport paths o f fine-grained sed im ents (F ig . 6 ). It is worth noticing that such radial transport was n o t observed at the mouths of Rivers A v o n and W ye. T his lim itation is probably because these rivers are located in the bay-head area, where the relative im portance o f tidal currents is enhanced and the influence o f the freshw ater p lum es w eakened .
In another approach to the problem , m agnetic anisotropy data from eight short cores from outer Bridgwater B ay and off N ew p ort and A von m outh have been used to represent principal and subsidiary grain orientations (Imien- wanrin 1988). L ong grain axis orientations appear to be influenced n ot only by the dom inant flood-ebb tidal currents in the m ain channel, but also by the outflow s from the Rivers Parret, U sk and A von .
(iii) T ransport im plica tions. T h e contradictions identified above do not necessarily invalidate any particular approach, because o f the w ide range o f tim e-scales applied. For ex am ple, tidal current and w ave m easurem ents provide data on a tim e-scale o f l ( T 2- 1 0 o a, w hilst geom orphological investigations relate to tim e-scales o f the order o f IO3 a. Likew ise, the tw o m odels (‘bed load parting’ and ‘mutually evasive transport’) are hypotheses to account for long-term m aterial balance within th e system . B oth approaches incorporate a w ide variety o f ev id en ce, representing different tim e-scales.
Interpretation o f grain s ize trends can , in itself, represent various tim e-scales; this dep en ds upon sam pling depth and technique and accum ulation rates. H en ce , the tim e-scale is shorter for an area with h igh accum ulation rates, than for one experiencing minimal accretion or undergoing erosion.
S evern
E s fu o ry
C oa s ta l Dunes
B e d l o a d P a r \ i n g Z
sub ito e.V . licensed c u sto m er copy su p p lie d a n d p rin ted for F lan d e rs M arine Institute Library (S L I05X 00225E )

S E V E R N E S T U A R Y / B R I S T O L C H A N N E L S E D I M E N T S
k m
5 m
10 m
15 m
N e w p o r t
P o r t h c a w l3 0 '
C a r d i f f
B a r r y
i W e s t o n - s u p e r - M a r e
S u s p e n d e ds e d i m e n tf ron t
- 1 5 '
M in e h e a d
W a t c h e t
3* W
Fig. 11. C onceptual m odels fo r finegrained sed im ent tran sp o rt in th e Severn Estuary and B risto l C hannel:(A) suspended sed im en t c ircu lation (from P ark er & K irby 1982); and(B) suspended sed im en t m o v em en t in the surface w a ter (thick solid arrow s represent tran sp o rt d irec tions , arrow s with dashed line possible d irec tions , and thin solid arrow s schem atized residual surface w ater circulation (a fte r Collins 1983).
0 = o b s e r v e d s u r f a c e r e s id u a l c u r r e n ts
C = c o m p u te d s u r f a c e re s id u a l c u r r e n ts
QIC
\ T ID A L RESUSPENSION
BRIDGWATERB AY
4*W
E rosion a l / a cc re tio n a l p a tte rn s
Major regional d ep osition a l areas have been recognized as: (i) inner B ridgw ater B a y (K irby & Parker 1983); (ii) a sub-tidal area w ithin Sw ansea B ay (C o llin s e t al. 1980); and(iii) off the R iver U sk and inner Severn Estuary (Harris & Collins 1985). T h ese areas are id en tified also in the grain size trend analysis.
Present d ep osition rates (over a period o f IO3 a) in Swansea B ay (near I l la ) , B ridgw ater B ay (V ia ) and in the Newport D e e p (V Ic) h a v e been m easu red , using the 210Pb dating techn iqu e (C lifton & H am ilton , 1979). In Swansea Bay, the m easured rate w as 0 .1 4 -0 .1 9 cm a “ 1. There was poor correlation in B ridgw ater B a y and N ew port D eep between th e 210Pb sp ecific activity and depth within the
deposits. Deposits in these areas appear either to be accumulating rapidly or constitute part of an ‘unstable’ sedimentary system. Other surveys have suggested that areas o f Bridgwater Bay are eroding under the present hydrodynamic conditions (Mantz & Wakeling 1982; Kirby 1986), Such localized variations have not been identified in the trend analysis. In summary, there is a consistent pattern between the radionuclide and trend analysis data in two o f the sub-environments.
Conclusions(1) Net sediment transport pathways for the Severn
Estuary and inner Bristol Channel have been defined on the
su b ito e.V . licensed c u sto m er copy su p p lied a n d p rin ted for F la n d e rs M arine Institute Library (SLI05XQ0225E)
602 p . M c L a r e n e t a l .
basis o f grain size trend analyses. A m biguities in the significance test used in the analyses disappear when p — 1 /6 is used, as a background probability for Case B or C conditions. H ence, the follow ing patterns have been identified: clockwise m ovem ent around the Nash Sands; radial transport from the R iver Parret, to seawards, in Bridgwater Bay; down-estuary transport characterizing the coastal zon e, from Barry to N ew port, with up-estuary transport dominant over other parts o f the Severn Estuary.
(2) Based upon the relationship betw een the grain size distributions and the transfer function, the dynamic status (i.e . erosional, equilibrium or accretional environm ents) o f areas have been analysed. Com bined with facies and transport observations (i.e . Case B or C), this has led to 6 environm ents being identified: (i) the Nash Passage, Bridgwater Bay and inner Severn Estuary as the main accretional areas (in agreem ent with previous investigations); (ii) erosion around the Bristol D eep , betw een the Culver Sands and the English coastline; and (iii) sandbanks m ostly in a state o f (dynamic) equilibrium.
(3) A reas o f poor correlation betw een the results of previous investigations and the trend analysis are associated mainly with the tributary rivers. Such discrepancies can be caused by non-linear effects betw een water and sedim ent m ovem ents. Som e of the differences can be ascribed to variations in time-scales, but further investigations should address this particular issue.
T h e authors are grateful to the Severn Tidal Pow er G roup (STPG) fo r initiating the investigations described within this project. T he pro ject benefited greatly from discussions with R. Kirby (Ravensrodd Consultants), I. S. R obinson (University of Southam pton) and J. R. W est (University of B irm ingham ). Particular appreciation is expressed to T. L. Shaw (STPG ), who did much to coordinate and facilitate all phases of the program m e, Finally, one of the authors (S. Gao) was supported by a grant from the TC (U K -C h in a Technical C ooperation) scheme sponsored by the British Council. T he authors wish to thank K. Saull for her careful preparation o f most of the figures.
ReferencesA l l e n , J. R. L. 1990. The Severn Estuary in southwest Britain: its retreat
under marine transgression, and fine-sediment regime. Sedimentary Geology, 66, 13-28.
& R a e , J. E. 1987. Late Flandrian shoreline oscillations in the Severnestuary: a geomorphological and stratigraphical reconnaissance. Transactions o f the Royal Society o f London, B315, 185-230.
B a r r i e , J. V. 1980. Heavy mineral distributions in bottom sediments of the Bristol Channel, U.K. Estuarine and Coastal Marine Science, 11, 369-381.
B e l d e r s o n , R. H. & S t r i d e , A, H. 1966. Tidal current fashioning of a basal bed. Marine Geology, 4, 237-257.
B r o o k s , M. & J a m e s , D. G. 1975. The geological results of seismic refraction surveys in the Bristol Channel, 1970-1973. Journal o f the Geological Society, London, 131, 163-182.
C h e s t e r , R. & S t o n e r , J. H. 1975. Trace elements in sediments from the lower Severn Estuary and Bristol Channel. Marine Pollution Bulletin, 4, 92-95.
C l i f t o n , R. J. & H a m i l t o n , E. I. 1979. Lead-210 chronology in relation to levels of elements in dated sediment core profiles. Estuarine and Coastal Marine Science, 8, 259-269.
C o l l i n s , M. B. 1983. Supply, distribution and transport of suspended sediment in a macrotidal environment: Bristol Channel, U.K. Canadian Journal o f Fisheries and Aquatic Science, 40 (Suppl. 1) 44-59.
1987, Sediment transport in the Bristol Channel: a review. Proceedingso f the Geologists' Association, 98, 367-383.
1989. Sediment fluxes in the Bristol Channel. Proceedings o f the UssherSociety, 7, 107-111.
& F e r e n t i n o s , G. 1 9 8 4 . Residual circulation in the Bristol Channel as
suggested by Woodhead se a-b ed drifter recovery patterns. Oceanologica Acta, 7, 33-42.
, P a t t i a r a t c h i , C. B., B a n n e r , F, T . & F e r e n t i n o s , G. K. io«n Thesupply o f sand to Swansea Bay. In: C o l l i n s , M. B ., B a n n e r , F. T ., T y l e r , P. A ., W a k e f i e l d , S. J. & J a m e s , A . E. (eds) Industrialised Embayments and Their Environm ental Problems. Pergamon, Oxford, 193-213.
C u l v e r , S. J. 1980. D ifferential Two-way sedim ent transport in the Bristol Channel and Severn E stuary , U.K . Marine Geology, 34, M39-M43.
& B a n n e r , F. T. 1979. Foraminiferal assemblages as Flandrianpalaeo-environmental indicators. Palaeogeography, Palaeoclimatology, Palaeoecology, 24, 53-72.
D a v i e s , C. M. 1980. Evidence fo r the form ation and age of a commercial sand deposit in the B ristol Channel. Estuarine and Coastal Marine Science, 11, 83-99.
D y e r , K. R. 1974. The salt balance in stratified estuaries. Estuarine and Coastal Marine Science, 2, 273-181.
1984. Sedimentary processes in the Bristol Channel/Severn Estuary.Marine Pollution Bulletin, 15, 53-57.
E v a n s , C. D. R. 1982. The geology and surficial sediments of the inner Bristol Channel and Severn Estuary. In: T h e I n s t i t u t i o n o f C iv il
E n g i n e e r s (ed.) Severn Barrage. Thomas Telford, London. 35-42.F e r e n t i n o s , G. & C o l l i n s , M. 1980. Effects o f shoreline irregularities on a
rectilinear tidal current and their significance in sedimentation processes. Journal o f Sedimentary Petrology, 50, 1081-1094.
& ------ 1985. Sediment response to hydraulic regime of the coastal zone:a case study from the northern Bristol Channel, U .K. Proceedings o f European Workshop on Coastal Zones, as Related to Physical Processes and Coastal Structures. Council of E urope, Loutraki (Greece), 2.1-2.14.
G a o , S. & C o l l i n s , M. 1991. A critique of the ‘McLaren Method’ for defining sediment transport paths. Journal o f Sedimentary Petrology, 61, 143-146.
, X i e , Q.-C. & F e n g , Y.-J. 1990. Fine-grained sediment transport andsorting by tidal exchange in Xiangshan Bay, Zhejiang, China. Estuarine, Coastal and Shelf Science, 31, 397-409.
H a m i l t o n , P. 1973. The circulation o f the Bristol Channel. Geophysical Journal o f the Royal Astronom ical Society, 32, 409-422.
H a r r i s , P. T. 1988. Large-scale bedforms as indicators of mutually evasive sand transport and the sequential infilling o f wide-mouthed estuaries. Sedimentary Geology, 57, 273-298.
& C o l l i n s , M. B. 1985. Bedload distributions and sediment transportpaths in the Bristol Channel and Severn Estuary, UK. Marine Geology, 62, 153-166.
& ------ 1988. Estimation o f annual bedload flux in a macrotidal estuary:Bristol Channel, U .K. M arine Geology, 83, 237-252.
& ------ 1991. Sand transport in the Bristol Channel: ‘Bedload PartingZ one’ or ‘Mutually Evasive T ransport Pathways’? Marine Geology, 101, 209-216.
H e a t h e r s h a w , A . D . 1981. Com parisons o f measured and predicted sediment transport rates in tidal currents. Marine Geology, 42, 75-104.
I m i e n w a n r i n , A. 1988. Palaeomagnetism and Magnetic Fabric o f Recent Sediments from the Severn Estuary System. PhD Thesis, Department of Oceanography, University o f Southampton.
K e n y o n , N. H. 1983. Tidal current bedforms investigated by SEASAT. In: A l l a n , T. D. (ed.) Satellite Microwave Remote Sensing. Ellis Horwood, Chichester, 261-270.
• & S t r i d e , A. M. 1970. T he tide swept continental shelf sedimentsbetween the Shetland and France. Sedimentólo,gy, 14, 159-173.
K i r b y , R. 1986. Suspended Fine Cohesive Sediment in the Severn Estuary and Inner Bristol Channel, U.K. R eport to United Kingdom Atomic Energy Authority, No. ETSU-STP-4042.
& P a r k e r , W. R. 1975. Sedim ent dynamics in the Severn Estuary: ab a c k g r o u n d f o r s t u d i e s o f t h e e f f e c t s o f a b a r r a g e . In: S h a w , T. L. ( e d . )
An Environmental Appraisal o f the Severn barrage. 35-46.& 1983. Distribution and behaviour o f fine sediment in the Severn
Estuary and inner Bristol Channel, U .K . Canadian Journal o f Fisheries and Aquatic Sciences, 40 (suppl. 1), 83-95.
L l o y d , A . J ., S a v a g e , R. J. G ., S t r i d e , A. H . & D o n o v a n , D. T. 1973. The geology of the Bristol Channel floor. Philosophical Transaction o f the Royal Society o f L ondon , 274A, 595-626.
M a n t z , P. A. & W a k e l i n g , H. L. 1982, A spects o f sediment movement near to Bridgwater Bay, Bristol Channel. Proceedings o f the Institution of Civil Engineers, 73, Part 2, 1-23.
M c L a r e n , P. & B o w l e s , D. 1985. T he effects o f sediment transport on grain-size distributions. Journal o f Sedimentary Petrology, 55, 457-470.
& C o l l i n s , M. B. 1989. Sediment Transport Pathways in the Severn Estuary and Bristol Channel. Severn Barrage Development Project, Ref. STPG /G EO SEA /3. l(iii)f.
M u r r a y , J. W. & H a w k i n s , A. B. 1976. Sedim ent transport in the Severn
su b ito e.V . lic en sed c u s to m e r c o p y su p p lied an d p rin ted for F la n d e rs M arine Institu te Library (SLI05X 00225E )
S E V E R N E S T U A R Y / B R I S T O L C H A N N E L S E D I M E N T S
Estuary during the past 8000-9000 years. Journal o f the Geologien! Society o f London, 132, 385-398. ' 'g e o lo g ic a l
M u r r a y , L. A ., N o r t o n , M. G ., N o w r y , R. S. & R o l f e , M S 1980 The field assessment o f effects o f dum ping wastes at sea: 7. Sewage sludge and industrial waste disposal in the Bristol Channel. Fishcrv Resrnmh Technical Report No. 59, M A FF, Lowestoft.
Odd, N. V. M. 1982. The feasibility o f using mathematical models to predict sediment transport m the Severn Estuary. In: I n s t i t u t i o n o f C i v i l
E n g i n e e r s (ed) Severn Barrage. Thom as Telford, London, 195-202O w e n , A. 1980a. The tidal regime of the Bristol Channel’: a numerical
modelling approach. Geophysical Journal o f the Royal Astronomical Society, 62, 59-75.
19806. A three-dim ensional model for the Bristol Channel. Journal o fPhysical Oceanography, 10, 1290-1302.
P a r k e r , W. R. 1987. Observations on the fine sediment transport phenomena in turbid coastal environments. Continental Shelf Research 7, 1285-1293.
& K i r b y , R. 1982. Sources and transport patterns of sediment in theinner Bristol Channel and Severn Estuary. In: I n s t i t u t i o n o f C i v i l
E n g i n e e r s , (ed.) Severn Barrage. Thom as Telford, London, 181-189P a i t i a r a t c i u , C. B. & C o l l i n s , M. B. 1984. Sediment transport under the
combined influence o f waves and currents: a case study from the northern Bristol C hannel, U .K . Marine Geology, 56, 27-40.
& ------- 1985. Sand transport under the combined influence of waves andcurrents: an assessment o f available formulae. Marine Geologv 67 83-100. ’
& ------ 1987. Mechanisms for linear sandbank formation andmaintenance in relation to dynamical oceanographic observations. Progress in Oceanography, 19, 117-176.
P i n o r e e , R. D. & G r i f f i t h s , D . K. 1979. Sand transport paths around the British Isles resulting from M 2 and M4 tidal interactions. Journal o f the Marine Biological Association, U .K ., 59, 497-523.
R o b i n s o n , I. S. 1978. Tidal response of a wedge-shaped estuary to the installation of a tidal pow er barrage: a simplified analytical approach.
603
Proceedings o f the Institute o f Civil Engineers, 65, 773-790.So llas, W. J. 1883. The estuaries of Severn and its tributaries: an inquiry
into the nature and origin o f their tidal sediment and alluvial flats. Quarterly Journal o f the Geological Society o f London, 39, 611-626.
Stephens, C. V. 1986. A three-dimensional model for tides and salinity in the Bristol Channel. Continental Shelf Research, 6, 531-560.
S t r i d e , A. H. 1963. Current swept area floors near the southern half of GreatBritain. Quarterly Journal o f the Geological Society o f London, 119,175-199.
& B e l d e r s o n , R. H. 1990. A reassessment of sand transport paths inthe Bristol Channel and their regional significance. Marine Geology, 92,227-236.
& ------1991. Sand transport in the Bristol Channel east of Bull Pointand Worms Head: a bed-load parting model with some indications of mutually evasive sand transport paths. Marine Geology, 101, 203-207.
Su, JiLAN & W ang, Kangshan 1986. The suspended sediment balance in Changjiang Estuary. Estuarine, Coastal and Shelf Sciences, 23, 81-98.
U n c l e s , R. J . 1982a. Computed and observed residual currents in the Bristol Channel. Oceanologica Acta, 5,11-20.
19826. Residual currents in the Severn Estuary and their effects ofdispersion. Oceanologica Acta, 5, 403-410.
1984. Hydrodynamics of the Bristol Channel. Marine Pollution Bulletin,15(2), 47-53.
, E l l o it , R. C. A. & W e s t o n , S. A. 1985. Observed fluxes of water, saltand suspended sediment in a partially mixed estuary. Estuarine, Coastal and Shelf Science, 20, 147-167.
W i l d i n g , A. J. & C o l l in s , M. B. 1980. Tidal and non-tidal variations in sea level. In: C o l l in s , M. B ., B a n n e r , F. T ., T y l e r , P. A., W a k e f i e l d , S. J. & J a m e s , A. E . (ed.) Industriallised Embayments and Their Environmental Problems: A Case Study from Swansea Bay. Pergamon Press, Oxford, 85-100.
W o l f , J. 1987. A 3-D model of the Severa Estuary. In: N i h o u l & J a m a r t
(eds) Three-Dimensional Models o f Marine and Estuarine Dynamics. Elsevier Science, Amsterdam, 609-624.
Received 14 January 1992; revised typescript accepted 27 August 1992.
subito e.V. licensed customer copy supplied and printed for Flanders Matine Institute Library (S L I05X 00225E )