Embed Size (px)
Citation preview
Sediment Sampling and Analysis Plan
Appendix
Guidance on the Development of Sediment Sampling and
Analysis Plans Meeting the Requirements of the Sediment Management Standards (Chapter 173-204 WAC)
Ecology Publication No. 03-09-043
February 2008
If you need this publication in another format, please call the Toxic Cleanup Program at (360) 407-7170. Persons with hearing loss can call 711 for Washington Relay Service. Persons with a
speech disability can call 877-833-6341.
Download this report from the Department of Ecology’s Web Site at http://www.ecy.wa.gov/biblio/0309043.html
For additional copies of this publication, please contact: Department of Ecology
Toxics Cleanup Program P.O. Box 47600
Olympia, WA 98504-7600 (360) 407-7170
Refer to Publication No. 03-09-043 Revised February 2008
CONTENTS
Page APPENDICES iv LIST OF FIGURES v LIST OF TABLES vi ACRONYMS AND ABBREVIATIONS vii 1. INTRODUCTION 1 1.1 PURPOSE OF THIS DOCUMENT 1 1.2 OBJECTIVES OF SEDIMENT INVESTIGATIONS CONDUCTED UNDER THE SEDIMENT SOURCE CONTROL PROGRAM 2 1.3 OBJECTIVES OF SEDIMENT INVESTIGATIONS CONDUCTED UNDER THE SEDIMENT CLEANUP PROGRAM 9 1.4 COMPARISON OF DATA REQUIREMENTS OF THE SEDIMENT
MANAGEMENT STANDARDS (SMS) AND THE DREDGED MATERIAL MANAGEMENT PROGRAM (DMMP) 11
1.5 DEVELOPMENT OF SEDIMENT SAMPLING AND ANALYSIS PLANS UNDER THE SMS 13 2. SELECTION OF STUDY-SPECIFIC PARAMETERS AND LABORATORY ANALYTICAL
METHODS 18 2.1 CHEMICAL ANALYSES OF SEDIMENTS 18 2.1.1 Selection of Chemical Analytes 18 2.1.2 Chemical Laboratory Analytical Methods 18 2.2 BIOLOGICAL ANALYSES OF SEDIMENTS 26 2.2.1 Selection of Biological Tests 26 2.2.1.1 Marine and Estuarine Sediment Biological Tests 26 2.2.1.2 Freshwater Sediment Biological Tests 33 2.2.2 Biological Laboratory Methods 33 3. FREQUENCY AND TIME OF SAMPLING 35 3.1 FREQUENCY OF SAMPLING 35
Sediment Sampling and Analysis Plan Appendix February 2008
i
Sediment Sampling and Analysis Plan Appendix February 2008
ii
Page 3.2 TIME OF SAMPLING 36 3.3 PHASING OF SAMPLING AND/OR ANALYSES, IF APPROPRIATE 37 3.4 SCHEDULE 38 4. SAMPLING STATION LOCATIONS 39 4.1 LOCATIONS OF SAMPLING STATIONS RELATIVE TO POINT SOURCES 39 4.1.1 Locations of Sampling Stations for Baseline Monitoring 39 4.1.2 Locations of Sampling Stations for SIZ Maintenance Monitoring 40 4.2 LOCATIONS OF SAMPLING STATIONS RELATIVE TO KNOWN OR SUSPECTED
AREAS OF SEDIMENT CONTAMINATION 45 4.2.1 Locations of Sampling Stations for an Initial Investigation of Sediment Contami-
nation 45 4.2.2 Locations of Sampling Stations for a Sediment Cleanup Investigation 46 4.3 WATER DEPTH 47 4.4 DEPTH INTERVAL IN THE SEDIMENTS TO BE SAMPLED 47 4.5 OTHER FACTORS TO BE CONSIDERED IN THE SELECTION OF SAMPLING
STATION LOCATIONS 49 5. FIELD SAMPLING METHODS 50 5.1 STATION POSITIONING 50 5.2 SAMPLING EQUIPMENT 50 5.2.1 Surface Sediment Samplers 51 5.2.2 Subsurface Sediment Corers 51 5.2.3 Recommended Sampling Equipment 54 5.3 DECONTAMINATION PROCEDURES 55 5.4 SAMPLE COMPOSITING 55 5.5 SAMPLE CONTAINERS AND LABELS 56 5.6 FIELD DOCUMENTATION 57
Sediment Sampling and Analysis Plan Appendix February 2008
iii
Page 5.7 DISPOSAL OF CONTAMINATED SEDIMENTS 57 6. SAMPLE HANDLING PROCEDURES 61 6.1 SAMPLE STORAGE REQUIREMENTS 61 6.1.1 Sample Storage Requirements for Chemical/Physical Analyses 61 6.1.2 Sample Storage Requirements for Toxicity Testing 61 6.1.3 Sample Storage Requirements for Analysis of Benthic Macroinvertebrate
Communities 62 6.2 CHAIN-OF-CUSTODY PROCEDURES 62 6.3 DELIVERY OF SAMPLES TO ANALYTICAL LABORATORIES 63 7. QUALITY ASSURANCE AND QUALITY CONTROL REQUIREMENTS 64 7.1 QUALITY ASSURANCE AND QUALITY CONTROL FOR SEDIMENT CHEMICAL
ANALYSES 64 7.2 QUALITY ASSURANCE AND QUALITY CONTROL FOR BIOLOGICAL
ANALYSES 64 7.3 DATA QUALITY ASSURANCE REVIEW 66 8. DATA ANALYSIS, RECORD KEEPING, AND REPORTING REQUIREMENTS 75 8.1 DATA ANALYSIS 75 8.1.1 Sediment Chemistry Data 75 8.1.2 Biological Test Data 77 8.1.3 Data Interpretation 77 8.2 RECORD KEEPING 78 8.3 REPORTING 78 9. HEALTH AND SAFETY PLAN 82 10. PROJECT PERSONNEL AND RESPONSIBILITIES 84 11. REFERENCES 85
APPENDICES Page A. SEDIMENT MANAGEMENT CONTACT LIST A-1
B. MARINE MICROTOX® 100 PERCENT SEDIMENT POREWATER B-1
TOXICITY ASSESSMENT
C. FRESHWATER MICROTOX® 100 PERCENT SEDIMENT POREWATER C-1 TOXICITY ASSESSMENT
D. RECOMMENDATIONS FOR CONDUCTING BIOASSAYS ON SEDIMENTS D-1
CONTAINING POLYCYCLIC AROMATIC HYDROCARBONS EXPOSED TO ULTRA-VIOLET RADIATION
E. SEDIMENT RELATED EIM DATA ENTRY BUSINESS RULE E-1
Sediment Sampling and Analysis Plan Appendix February 2008
iv
LIST OF FIGURES
Page Figure 1. Sediment Sampling and Analysis Plan outline and checklist 15 Figure 2. Decision tree for selecting the appropriate amphipod species for
marine/estuarine toxicity tests 32 Figure 3. Examples of baseline monitoring station locations using 6 and 15 stations 42 Figure 4. Additional examples of baseline monitoring station locations using 10 stations 43 Figure 5. Examples of maintenance monitoring station locations 44
Sediment Sampling and Analysis Plan Appendix February 2008
v
LIST OF TABLES Page Table 1. Chemical criteria for Puget Sound marine sediments 4 Table 2. Biological effects criteria for Puget Sound marine sediments 7 Table 3. Conventional sediment variables and their use in sediment investigations 21 Table 4. Examples of chemical contaminants that should be measured on a site-specific
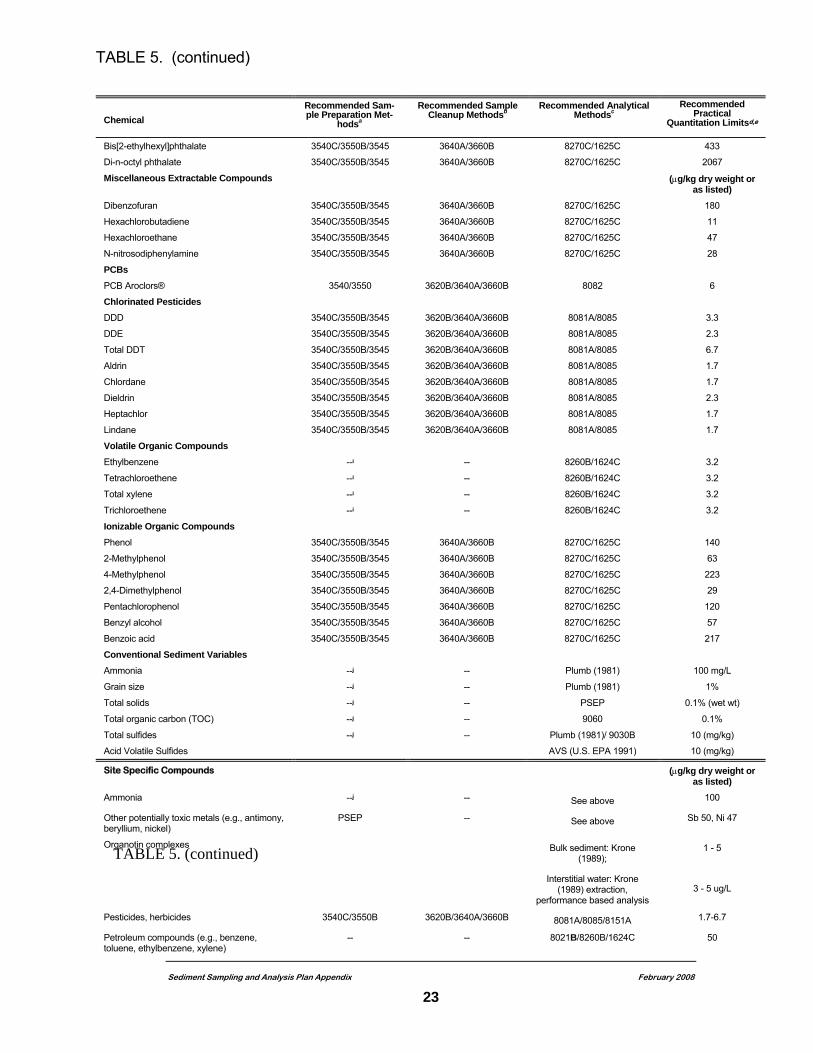
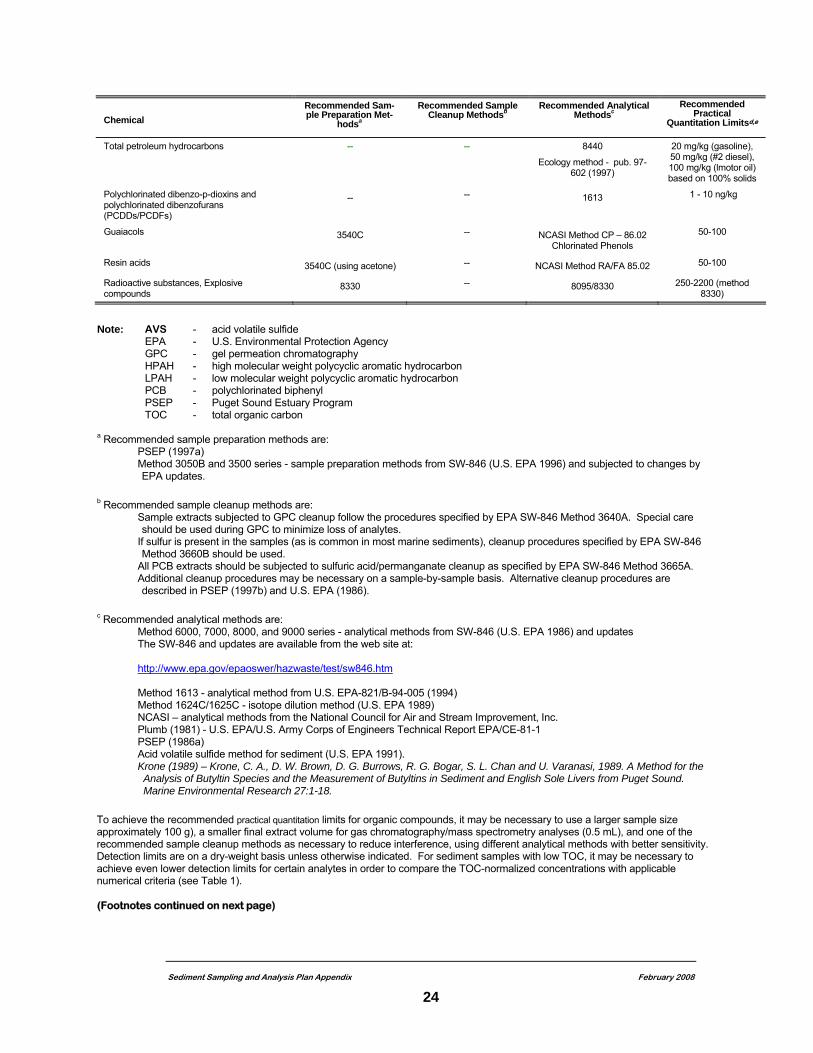
basis 21 Table 5. Recommended sample preparation methods, cleanup methods, analytical methods,
and practical quantitation limits for sediments 22 Table 6. Marine and estuarine sediment toxicity test characteristics 30 Table 7. Freshwater sediment toxicity test characteristics 34 Table 8. Advantages and disadvantages of various sediment samplers 53 Table 9. Minimum sediment sample sizes and acceptable containers for physical/chemical
analyses and sediment toxicity tests 59 Table 10. Storage temperatures and maximum holding times for physical/chemical analyses
and sediment toxicity tests 60 Table 11. Quality control procedures for organic analyses 67 Table 12. Quality control procedures for metal analyses 69 Table 13. Quality control procedures for conventional analyses 71 Table 14. Marine and estuarine sediment toxicity test conditions 72 Table 15. Freshwater sediment toxicity test conditions 74
Sediment Sampling and Analysis Plan Appendix February 2008
vi
ACRONYMS AND ABBREVIATIONS
AET apparent effects threshold CERCLA Comprehensive Environmental Response, Compensation, and Liability Act CSL cleanup screening level DGPS differential global positioning system DMMP Dredged Material Management Program Ecology Washington Department of Ecology EIM Environmental Information Management GPS global positioning systems HPAH high molecular weight polycyclic aromatic hydrocarbon LPAH low molecular weight polycyclic aromatic hydrocarbon MCUL minimum cleanup level ML maximum level MTCA Washington Model Toxics Control Act NPDES National Pollutant Discharge Elimination System PCB polychlorinated biphenyl ppb parts per billion ppm parts per million ppt parts per thousand PLP potentially liable party PSDDA Puget Sound Dredged Disposal Analysis PSEP Puget Sound Estuary Program PQL Practical Quantitation Limit QA/QC quality assurance and quality control SCUM1 Sediment Source Control Standards User Manual SCUM2 Sediment Cleanup Standards User Manual SIZ sediment impact zone SIZmax sediment impact zone maximum criterion SL screening level SMS Washington Sediment Management Standards SQS sediment quality standard TOC total organic carbon WAC Washington Administrative Code
Sediment Sampling and Analysis Plan Appendix February 2008
vii

Sediment Sampling and Analysis Plan Appendix February 2008
viii
1. INTRODUCTION
1.1 PURPOSE OF THIS DOCUMENT This document provides technical guidance for developing sampling and analysis plans for sediment investigations to be conducted under the Washington Sediment Management Standards (SMS) (Washington Administrative Code [WAC] Chapter 173-204). The SMS provide the framework for the following two important regulatory programs administered by the Washington Department of Ecology (Ecology): Sediment Source Control Program—Under provisions of the Sediment
Source Control Standards (WAC 173-204-400 through 420), methods are described for controlling the effects of point and nonpoint source discharges through the National Pollutant Discharge Elimination System (NPDES) permit program, state water quality permit programs, issuance of administrative orders, or other means determined appropriate by Ecology.
Sediment Cleanup Program—Under provisions of the Sediment Cleanup
Standards (WAC 173-204-500 through 590), administrative procedures and criteria are established to identify, screen, rank, prioritize, and clean up contaminated surface sediment sites.
Technical guidance on implementing the Sediment Source Control Standards and the Sediment Cleanup Standards is provided in the Sediment Source Control Standards User Manual (SCUM1, Ecology 1993) and the Sediment Cleanup Standards User Manual (SCUM2, Ecology 1991), respectively. This document serves as an appendix to both SCUM1 and SCUM2. It is assumed that the reader of this document is familiar with those two documents. Both SCUM1 (Ecology 1993) and SCUM2 (Ecology 1991) provide general discussions of the objectives and rationale for sediment investigations to be conducted under the above two programs. Technical guidance on various aspects of sediment sampling and analysis procedures that will need to be taken into account in the design and implementation of sediment investigations is available in the Puget Sound Estuary Program (PSEP) protocols. The PSEP protocols are available from the web site at: http://www.wa.gov/puget_sound/Publications/protocols/protocol.html However, additional technical guidance is needed to assist those responsible (e.g., permitted dischargers, property owners, potentially liable parties (PLPs), and consultants) for the design and implementation of sediment investigations under the SMS. This document draws on other available sources of technical guidance and makes specific recommendations about applying that guidance under the SMS.
Sediment Sampling and Analysis Plan Appendix February 2008
1
1.2 OBJECTIVES OF SEDIMENT INVESTIGATIONS CONDUCTED UNDER THE SEDIMENT SOURCE CONTROL PROGRAM The Sediment Source Control Standards of the SMS set forth a process for controlling the release of substances from point and non-point sources (e.g., NPDES permitted discharges) that may contribute to sediment contamination. This process is designed to support the long-term management goal for sediment quality throughout the state, established by WAC 173-204-100. WAC 173-204-100(2) states that the purpose of the SMS is: “to reduce and ultimately eliminate adverse effects on biological resources and
significant health threats to humans from surface sediment contamination by: (a) Establishing standards for the quality of surface sediments; (b) Applying these standards as the basis for management and reduction of
pollutant discharges; and (c) Providing a management and decision process for the cleanup of
contaminated sediments.” WAC 173-204-100(3) defines a “narrative standard” or goal for the sediment quality regulation and management as “no adverse effects, including no acute or chronic adverse effects on biological resources and no significant health risk to humans”. The long-term management goal is specifically addressed in WAC 173-204-320 through WAC 173-204-340 by the establishment of numerical chemical concentration criteria; biological effects criteria; human health criteria; other toxic, radioactive, biological, or deleterious substances criteria; and nonanthropogenically affected sediment quality criteria. The marine sediment quality standards (SQS) of WAC 173-204-320 include numerical chemical concentration criteria (Table 1) and biological effects criteria (Table2) for SQS that define the degree of sediment quality that is expected to cause no adverse effects to biological resources in Puget Sound marine sediments. However, there are no adopted SQS numerical chemical concentration criteria or biological effects criteria for Puget Sound marine sediments for protection of human health or for other toxic, radioactive, biological, or deleterious substances. Ecology will therefore address these issues on a case-by-case basis using best professional judgment under authority of the federal Clean Water Act and RCW 90.48, the Water Pollution Control Act. Although the narrative standard also applies to freshwater, low-salinity, and non-Puget Sound marine sediments, the establishment of numerical chemical concentration criteria and biological effects criteria for these sediments is currently reserved in the rule. Ecology will therefore also address these issues on a case-by-case basis using best professional judgment. Adverse effects of contaminated sediments on biological resources and threats to human health generally will only occur when there is a pathway to ecological or human receptors. In most cases, such a pathway will only exist when surface sediments (defined by the SMS as those within the biologically active zone) are contaminated. Contaminated sediments existing at depths below the biologically active zone are unlikely to result in such effects unless the overlying sediments are removed by natural (e.g., erosion, scouring) or anthropogenic (e.g., dredging, propeller scour) means, or there are other mechanisms for the release of sediment contaminants such that exposure may occur. Hence, the focus of sediment sampling in the sediment source control process is generally on the sediments within the biologically active zone. Additionally, the surface sediment will be most likely to exhibit impacts from recent discharges of contaminants. Sediment Sampling and Analysis Plan Appendix February 2008
2
The Sediment Source Control Standards of the SMS include provisions for allowing the sediment quality within the immediate vicinity of a permitted discharge to exceed the SQS. The authorized area within which the SQS may be exceeded is referred to as a sediment impact zone (SIZ) and is analogous to a mixing zone within the water column, which represents a volume of water where water quality standards may be exceeded. WAC 173-204-100(7) defines a goal of “minor adverse effects” as the maximum level of sediment contamination that will be allowed within an authorized SIZ. WAC 173-204-420 establishes “minor adverse effects” as the maximum chemical concentration; human health risk based concentration; biological effects level; other toxic, radioactive, biological, or deleterious substance level; and nonanthropogenically affected sediment quality level allowed within an authorized SIZ. The ceiling on allowable sediment contamination is referred to as the SIZ maximum (SIZmax) allowable contamination level. WAC 173-204-420 includes numerical chemical concentration criteria (Table 1) and biological effects criteria (Table 2) for SIZmax that define minor adverse effects for Puget Sound marine sediments. However, there are no adopted SIZmax numerical chemical concentration criteria or biological effects criteria for Puget Sound marine sediments for protection of human health or for other toxic, radioactive, biological, or deleterious substances. Ecology will therefore address these issues on a case-by-case basis using best professional judgment. The establishment of specific SIZmax criteria for freshwater, low-salinity, and non-Puget Sound marine sediments is currently reserved in the rule and will also be addressed by Ecology on a case-by-case basis using best professional judgment.
Sediment Sampling and Analysis Plan Appendix February 2008
3
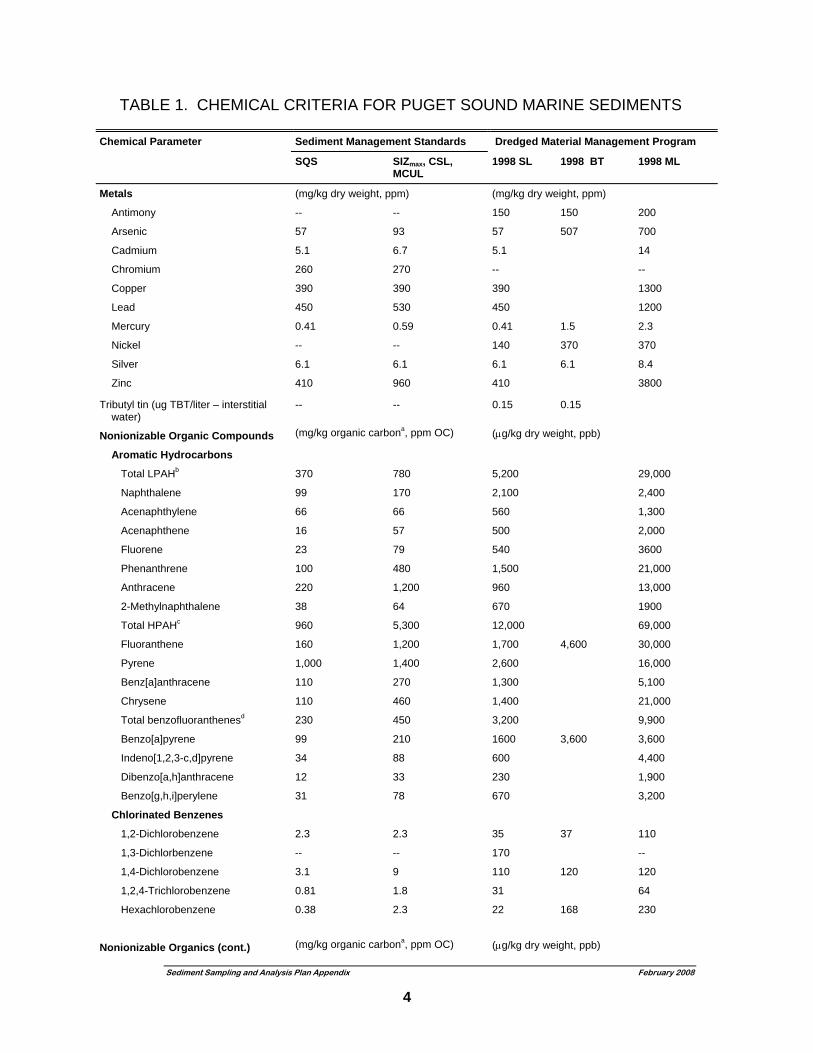
TABLE 1. CHEMICAL CRITERIA FOR PUGET SOUND MARINE SEDIMENTS
Chemical Parameter Sediment Management Standards Dredged Material Management Program
SQS SIZmax, CSL, MCUL
1998 SL 1998 BT 1998 ML
Metals (mg/kg dry weight, ppm) (mg/kg dry weight, ppm)
Antimony -- -- 150 150 200
Arsenic 57 93 57 507 700
Cadmium 5.1 6.7 5.1 14
Chromium 260 270 -- --
Copper 390 390 390 1300
Lead 450 530 450 1200
Mercury 0.41 0.59 0.41 1.5 2.3
Nickel -- -- 140 370 370
Silver 6.1 6.1 6.1 6.1 8.4
Zinc 410 960 410 3800
Tributyl tin (ug TBT/liter – interstitial water)
-- -- 0.15 0.15
Nonionizable Organic Compounds (mg/kg organic carbona, ppm OC) (μg/kg dry weight, ppb)
Aromatic Hydrocarbons
Total LPAHb 370 780 5,200 29,000
Naphthalene 99 170 2,100 2,400
Acenaphthylene 66 66 560 1,300
Acenaphthene 16 57 500 2,000
Fluorene 23 79 540 3600
Phenanthrene 100 480 1,500 21,000
Anthracene 220 1,200 960 13,000
2-Methylnaphthalene 38 64 670 1900
Total HPAHc 960 5,300 12,000 69,000
Fluoranthene 160 1,200 1,700 4,600 30,000
Pyrene 1,000 1,400 2,600 16,000
Benz[a]anthracene 110 270 1,300 5,100
Chrysene 110 460 1,400 21,000
Total benzofluoranthenesd 230 450 3,200 9,900
Benzo[a]pyrene 99 210 1600 3,600 3,600
Indeno[1,2,3-c,d]pyrene 34 88 600 4,400
Dibenzo[a,h]anthracene 12 33 230 1,900
Benzo[g,h,i]perylene 31 78 670 3,200
Chlorinated Benzenes
1,2-Dichlorobenzene 2.3 2.3 35 37 110
1,3-Dichlorbenzene -- -- 170 --
1,4-Dichlorobenzene 3.1 9 110 120 120
1,2,4-Trichlorobenzene 0.81 1.8 31 64
Hexachlorobenzene 0.38 2.3 22 168 230
Nonionizable Organics (cont.) (mg/kg organic carbona, ppm OC) (μg/kg dry weight, ppb)
Sediment Sampling and Analysis Plan Appendix February 2008
4
Sediment Sampling and Analysis Plan Appendix February 2008
5
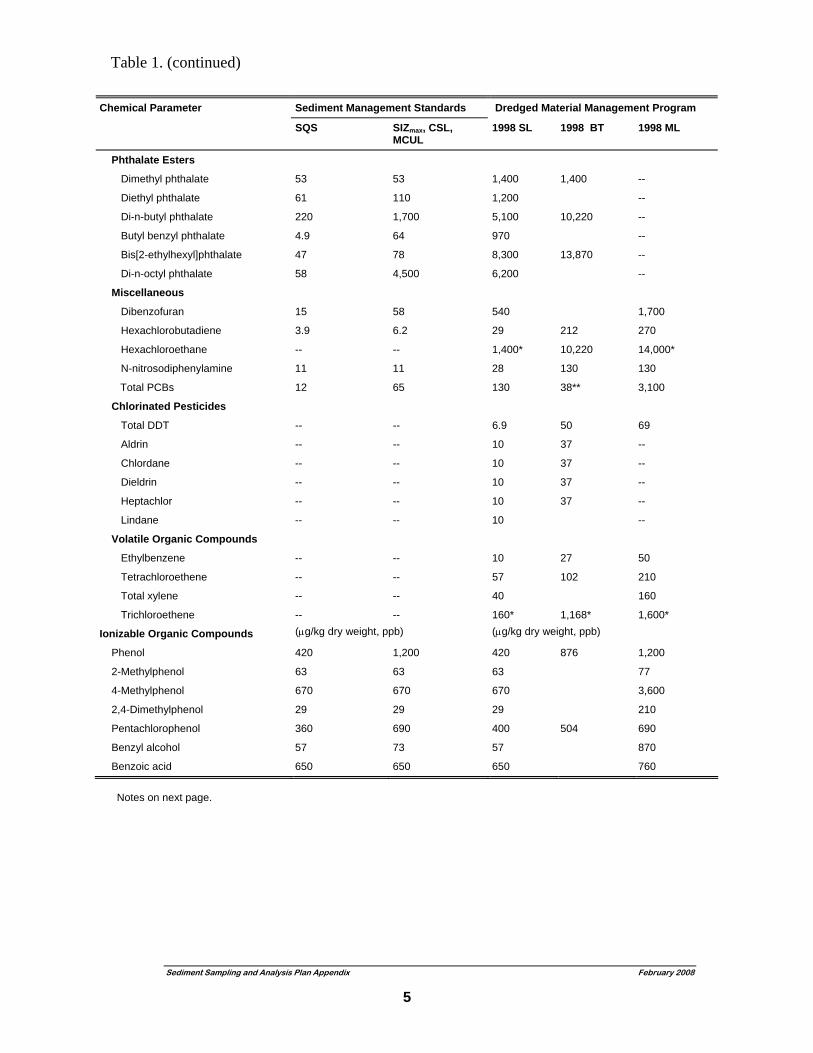
Chemical Parameter Sediment Management Standards Dredged Material Management Program
SQS SIZmax, CSL, MCUL
1998 SL 1998 BT 1998 ML
Phthalate Esters
Dimethyl phthalate 53 53 1,400 1,400 --
Diethyl phthalate 61 110 1,200 --
Di-n-butyl phthalate 220 1,700 5,100 10,220 --
Butyl benzyl phthalate 4.9 64 970 --
Bis[2-ethylhexyl]phthalate 47 78 8,300 13,870 --
Di-n-octyl phthalate 58 4,500 6,200 --
Miscellaneous
Dibenzofuran 15 58 540 1,700
Hexachlorobutadiene 3.9 6.2 29 212 270
Hexachloroethane -- -- 1,400* 10,220 14,000*
N-nitrosodiphenylamine 11 11 28 130 130
Total PCBs 12 65 130 38** 3,100
Chlorinated Pesticides
Total DDT -- -- 6.9 50 69
Aldrin -- -- 10 37 --
Chlordane -- -- 10 37 --
Dieldrin -- -- 10 37 --
Heptachlor -- -- 10 37 --
Lindane -- -- 10 --
Volatile Organic Compounds
Ethylbenzene -- -- 10 27 50
Tetrachloroethene -- -- 57 102 210
Total xylene -- -- 40 160
Trichloroethene -- -- 160* 1,168* 1,600*
Ionizable Organic Compounds (μg/kg dry weight, ppb) (μg/kg dry weight, ppb)
Phenol 420 1,200 420 876 1,200
2-Methylphenol 63 63 63 77
4-Methylphenol 670 670 670 3,600
2,4-Dimethylphenol 29 29 29 210
Pentachlorophenol 360 690 400 504 690
Benzyl alcohol 57 73 57 870
Benzoic acid 650 650 650 760
Notes on next page.
Table 1. (continued)
Table 1. (continued)
Note: -- - no numerical criterion of this type for this chemical AET - apparent effects threshold BT - bioaccumulation trigger CSL - cleanup screening level DMMP - Dredged Material Management Program HPAH - high molecular weight polycyclic aromatic hydrocarbon LPAH - low molecular weight polycyclic aromatic hydrocarbon MCUL - minimum cleanup level ML - maximum level PCB - polychlorinated biphenyl SIZmax - Sediment Impact Zone maximum allowable contamination level (WAC 173-204-420) SL - screening level SMS - Sediment Management Standards (WAC 173-204) SQS - Sediment Quality Standards (WAC 173-204-320) Where laboratory analysis indicates a chemical is not detected in a sediment sample, the detection limit shall be reported with U (Undetected) qualifier code and shall be at or below the Marine Sediment Quality Standards (SQS) chemical criteria (Table 1) . Where chemical criteria in Table 1 represent the sums of individual compounds (e.g., total LPAHs and total HPAHs), isomers (e.g., total benzofluoranthenes), or groups of congeners (e.g., total PCBs), the following methods shall be applied: (i) Where chemical analyses identify an undetected value for every individual compound/isomer/congener, then the single highest detection limit shall represent the sum of the respective compounds/isomers/congeners; and (ii) Where chemical analyses detect one or more individual compound/isomers/ congeners, only the detected concentrations will be added to represent the group sum. Both the SMS and DMMP numerical criteria are based on Puget Sound apparent effects threshold (AET) values (Barrick et al. 1988). Conceptually, the SMS and DMMP numerical criteria provide two regulatory levels for the evaluation of sediment contaminant concentrations. The SQS under the SMS and the SL under the DMMP represent concentrations below which adverse biological effects are considered to be unlikely. The SIZmax, CSL, and MCUL under the SMS and the ML under the DMMP represent concentrations above which adverse biological effects are considered to be significant. The derivation of these numerical criteria from the AET values is somewhat different because of the different regulatory uses of these criteria in the two applications. In addition, the fact that the concentrations of nonionizable organic compounds are expressed on a TOC-normalized basis under the SMS but on a dry-weight basis under the DMMP means that direct comparison of these two sets of numerical criteria is not possible. a The listed values represent concentrations in parts per million “normalized” on a total organic carbon basis. To normalize to total organic carbon, the dry-weight concentration for each parameter is divided by the decimal fraction representing the percent total organic carbon content of the sediment. b The total LPAH criterion under the SMS represents the sum of the concentrations of the following LPAH compounds: naphthalene, acenaphthylene, acenaphthene, fluorene, phenanthrene, and anthracene. 2-Methylnaphthalene is not included in the LPAH definition under the SMS, but is included in the LPAH definition under the DMMP. The total LPAH criterion is not the sum of the corresponding criteria listed for the individual LPAH compounds. c The total HPAH criterion under the SMS represents the sum of the concentrations of the following HPAH compounds: fluoranthene, pyrene, benz[a]anthracene, chrysene, total benzofluoranthenes, benzo[a]pyrene, indeno[1,2,3-c,d]pyrene, dibenzo[a,h]anthracene, and benzo[g,h,i]perylene. The total HPAH criterion is not the sum of the corresponding criteria listed for the individual HPAH compounds. d The total benzofluoranthenes criterion represents the sum of the concentrations of the b, j, and k isomers of benzofluoranthene. *Values derived through equilibrium portioning. ** Value normalized to total organic carbon, mg/kg (TOC normalized).
Sediment Sampling and Analysis Plan Appendix February 2008
6
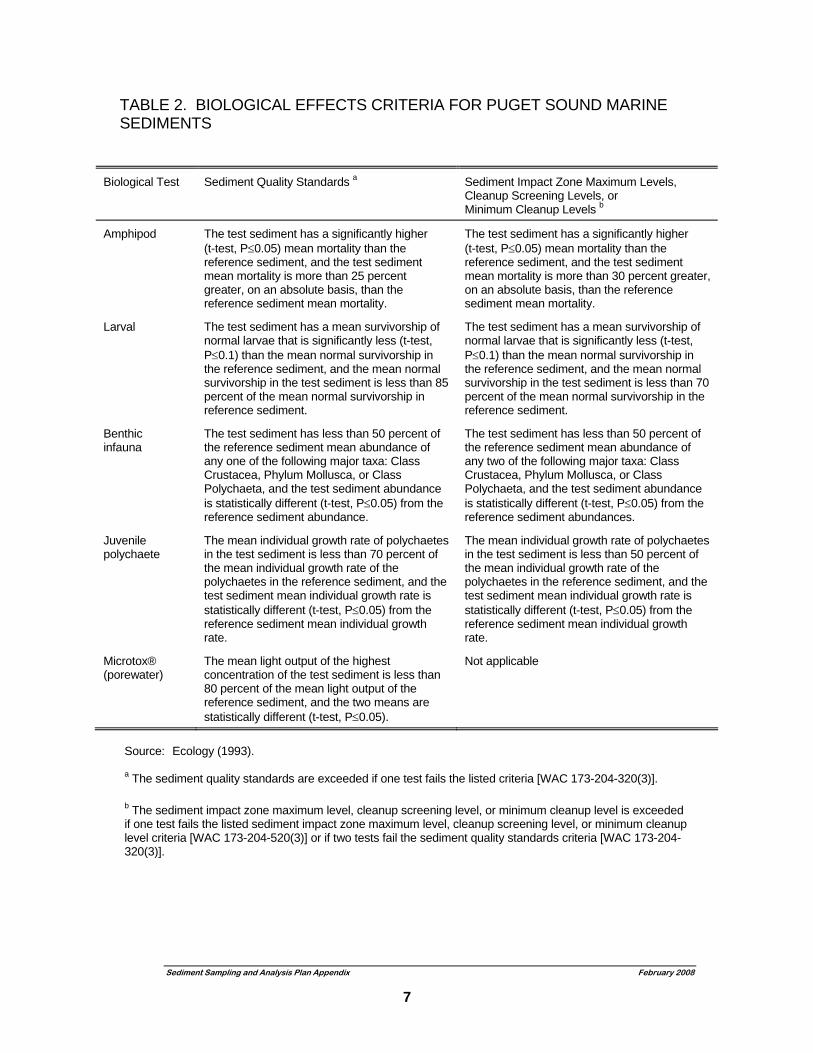
TABLE 2. BIOLOGICAL EFFECTS CRITERIA FOR PUGET SOUND MARINE SEDIMENTS
Biological Test Sediment Quality Standards a Sediment Impact Zone Maximum Levels, Cleanup Screening Levels, or Minimum Cleanup Levels b
Amphipod The test sediment has a significantly higher (t-test, P≤0.05) mean mortality than the reference sediment, and the test sediment mean mortality is more than 25 percent greater, on an absolute basis, than the reference sediment mean mortality.
The test sediment has a significantly higher (t-test, P≤0.05) mean mortality than the reference sediment, and the test sediment mean mortality is more than 30 percent greater, on an absolute basis, than the reference sediment mean mortality.
Larval The test sediment has a mean survivorship of normal larvae that is significantly less (t-test, P≤0.1) than the mean normal survivorship in the reference sediment, and the mean normal survivorship in the test sediment is less than 85 percent of the mean normal survivorship in reference sediment.
The test sediment has a mean survivorship of normal larvae that is significantly less (t-test, P≤0.1) than the mean normal survivorship in the reference sediment, and the mean normal survivorship in the test sediment is less than 70 percent of the mean normal survivorship in the reference sediment.
Benthic infauna
The test sediment has less than 50 percent of the reference sediment mean abundance of any one of the following major taxa: Class Crustacea, Phylum Mollusca, or Class Polychaeta, and the test sediment abundance is statistically different (t-test, P≤0.05) from the reference sediment abundance.
The test sediment has less than 50 percent of the reference sediment mean abundance of any two of the following major taxa: Class Crustacea, Phylum Mollusca, or Class Polychaeta, and the test sediment abundance is statistically different (t-test, P≤0.05) from the reference sediment abundances.
Juvenile polychaete
The mean individual growth rate of polychaetes in the test sediment is less than 70 percent of the mean individual growth rate of the polychaetes in the reference sediment, and the test sediment mean individual growth rate is statistically different (t-test, P≤0.05) from the reference sediment mean individual growth rate.
The mean individual growth rate of polychaetes in the test sediment is less than 50 percent of the mean individual growth rate of the polychaetes in the reference sediment, and the test sediment mean individual growth rate is statistically different (t-test, P≤0.05) from the reference sediment mean individual growth rate.
Microtox® (porewater)
The mean light output of the highest concentration of the test sediment is less than 80 percent of the mean light output of the reference sediment, and the two means are statistically different (t-test, P≤0.05).
Not applicable
Source: Ecology (1993). a The sediment quality standards are exceeded if one test fails the listed criteria [WAC 173-204-320(3)]. b The sediment impact zone maximum level, cleanup screening level, or minimum cleanup level is exceeded if one test fails the listed sediment impact zone maximum level, cleanup screening level, or minimum cleanup level criteria [WAC 173-204-520(3)] or if two tests fail the sediment quality standards criteria [WAC 173-204-320(3)].
Sediment Sampling and Analysis Plan Appendix February 2008
7
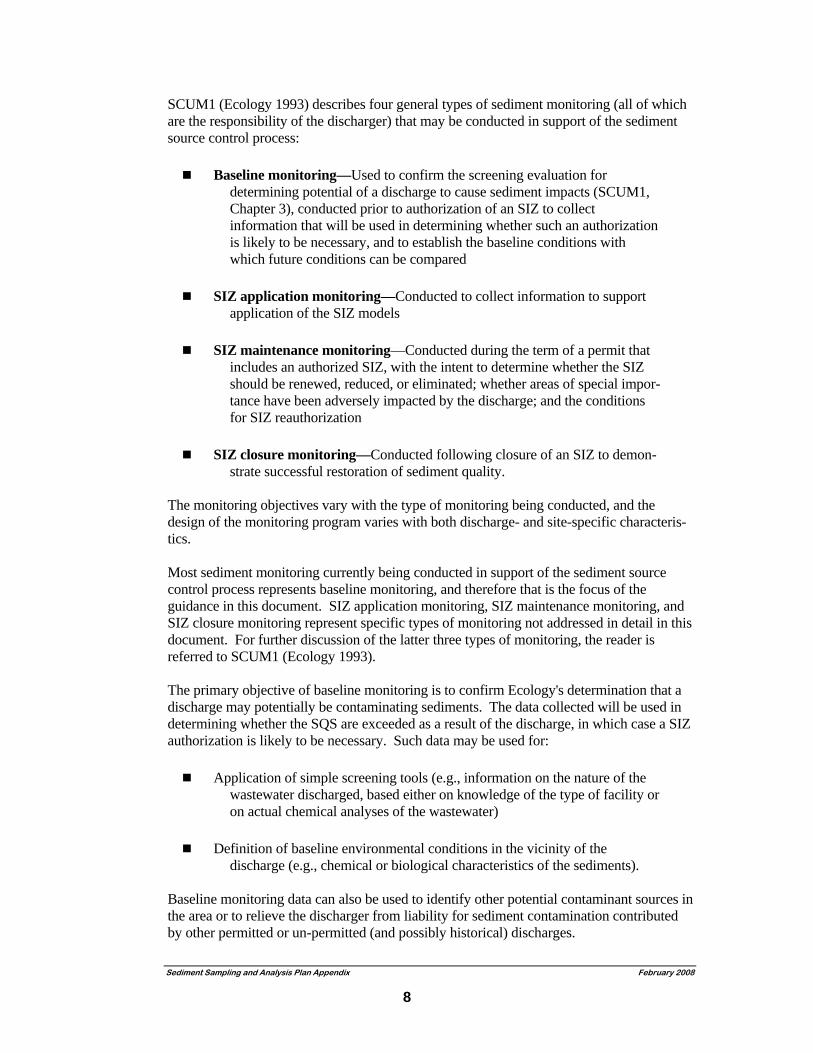
SCUM1 (Ecology 1993) describes four general types of sediment monitoring (all of which are the responsibility of the discharger) that may be conducted in support of the sediment source control process: Baseline monitoring—Used to confirm the screening evaluation for
determining potential of a discharge to cause sediment impacts (SCUM1, Chapter 3), conducted prior to authorization of an SIZ to collect information that will be used in determining whether such an authorization is likely to be necessary, and to establish the baseline conditions with which future conditions can be compared
SIZ application monitoring—Conducted to collect information to support
application of the SIZ models SIZ maintenance monitoring—Conducted during the term of a permit that
includes an authorized SIZ, with the intent to determine whether the SIZ should be renewed, reduced, or eliminated; whether areas of special impor-tance have been adversely impacted by the discharge; and the conditions for SIZ reauthorization
SIZ closure monitoring—Conducted following closure of an SIZ to demon-
strate successful restoration of sediment quality. The monitoring objectives vary with the type of monitoring being conducted, and the design of the monitoring program varies with both discharge- and site-specific characteris-tics. Most sediment monitoring currently being conducted in support of the sediment source control process represents baseline monitoring, and therefore that is the focus of the guidance in this document. SIZ application monitoring, SIZ maintenance monitoring, and SIZ closure monitoring represent specific types of monitoring not addressed in detail in this document. For further discussion of the latter three types of monitoring, the reader is referred to SCUM1 (Ecology 1993). The primary objective of baseline monitoring is to confirm Ecology's determination that a discharge may potentially be contaminating sediments. The data collected will be used in determining whether the SQS are exceeded as a result of the discharge, in which case a SIZ authorization is likely to be necessary. Such data may be used for: Application of simple screening tools (e.g., information on the nature of the
wastewater discharged, based either on knowledge of the type of facility or on actual chemical analyses of the wastewater)
Definition of baseline environmental conditions in the vicinity of the
discharge (e.g., chemical or biological characteristics of the sediments). Baseline monitoring data can also be used to identify other potential contaminant sources in the area or to relieve the discharger from liability for sediment contamination contributed by other permitted or un-permitted (and possibly historical) discharges.
Sediment Sampling and Analysis Plan Appendix February 2008
8
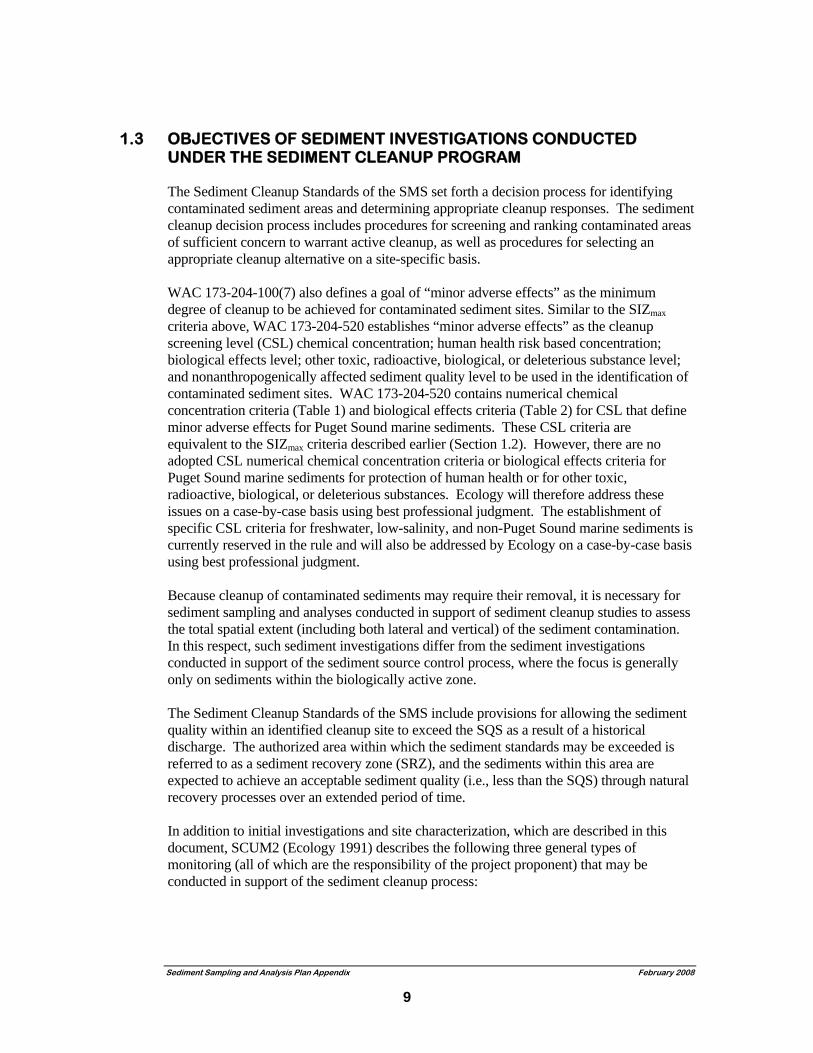
1.3 OBJECTIVES OF SEDIMENT INVESTIGATIONS CONDUCTED UNDER THE SEDIMENT CLEANUP PROGRAM The Sediment Cleanup Standards of the SMS set forth a decision process for identifying contaminated sediment areas and determining appropriate cleanup responses. The sediment cleanup decision process includes procedures for screening and ranking contaminated areas of sufficient concern to warrant active cleanup, as well as procedures for selecting an appropriate cleanup alternative on a site-specific basis. WAC 173-204-100(7) also defines a goal of “minor adverse effects” as the minimum degree of cleanup to be achieved for contaminated sediment sites. Similar to the SIZmax criteria above, WAC 173-204-520 establishes “minor adverse effects” as the cleanup screening level (CSL) chemical concentration; human health risk based concentration; biological effects level; other toxic, radioactive, biological, or deleterious substance level; and nonanthropogenically affected sediment quality level to be used in the identification of contaminated sediment sites. WAC 173-204-520 contains numerical chemical concentration criteria (Table 1) and biological effects criteria (Table 2) for CSL that define minor adverse effects for Puget Sound marine sediments. These CSL criteria are equivalent to the SIZmax criteria described earlier (Section 1.2). However, there are no adopted CSL numerical chemical concentration criteria or biological effects criteria for Puget Sound marine sediments for protection of human health or for other toxic, radioactive, biological, or deleterious substances. Ecology will therefore address these issues on a case-by-case basis using best professional judgment. The establishment of specific CSL criteria for freshwater, low-salinity, and non-Puget Sound marine sediments is currently reserved in the rule and will also be addressed by Ecology on a case-by-case basis using best professional judgment. Because cleanup of contaminated sediments may require their removal, it is necessary for sediment sampling and analyses conducted in support of sediment cleanup studies to assess the total spatial extent (including both lateral and vertical) of the sediment contamination. In this respect, such sediment investigations differ from the sediment investigations conducted in support of the sediment source control process, where the focus is generally only on sediments within the biologically active zone. The Sediment Cleanup Standards of the SMS include provisions for allowing the sediment quality within an identified cleanup site to exceed the SQS as a result of a historical discharge. The authorized area within which the sediment standards may be exceeded is referred to as a sediment recovery zone (SRZ), and the sediments within this area are expected to achieve an acceptable sediment quality (i.e., less than the SQS) through natural recovery processes over an extended period of time. In addition to initial investigations and site characterization, which are described in this document, SCUM2 (Ecology 1991) describes the following three general types of monitoring (all of which are the responsibility of the project proponent) that may be conducted in support of the sediment cleanup process:
Sediment Sampling and Analysis Plan Appendix February 2008
9
Source control monitoring—Conducted prior to and following sediment cleanup to determine how ongoing sources at or near a site may affect the success of active cleanup and/or natural recovery
Compliance monitoring—Conducted during the term of an authorized SRZ,
with the intent to demonstrate that the site complies with the maximum allowable contaminant concentrations and /or biologic effects have not been exceeded within the SRZ and that natural recovery is proceeding at the expected pace.
Closure monitoring—Conducted following completion of active cleanup or
closure of a SRZ to demonstrate successful cleanup of sediment contamination. Closure monitoring must be performed before a site can be considered for delisting.
The monitoring objectives vary with the type of monitoring being conducted, and the design of the monitoring program varies with site-specific characteristics. Source control monitoring, compliance monitoring, and closure monitoring represent specific types of monitoring not addressed in detail in this document. For further discussion of the three types of monitoring, the reader is referred to SCUM2 (Ecology 1991). The primary objectives of sediment sampling and analyses conducted as part of a preliminary investigation of a contaminated sediment site are to support the following SMS activities: Identifying sediment station clusters of potential concern Ranking identified cleanup sites Additionally, other non-SMS objectives include: Aquatic lands lease transfers and renewals Property transfers (due diligence). Such sampling and analyses must be sufficient to enable a determination of whether there are exceedances of the CSL numerical chemical criteria (Table 1) or biological effects criteria (Table 2) at three or more stations within a specific area of concern, but the spatial extent of such exceedances need not be defined as part of a preliminary investigation. Unless there are plans to dredge or otherwise disturb the sediments, sampling and analyses conducted as part of a preliminary investigation need only focus on surface sediments. After the need for cleanup has been identified, a more focused sediment sampling and analysis program would then be required to define the spatial extent of contamination (including its vertical extent) and to evaluate cleanup alternatives. At smaller sites of known or suspected sediment contamination, the use of a relatively small number of stations or samples in a preliminary investigation may allow assessment of the spatial extent of contamination, gradients toward or away from other sources, or other
Sediment Sampling and Analysis Plan Appendix February 2008
10
important details. Hence, a single study could suffice, thereby precluding the need for a second focused investigation.
1.4 COMPARISON OF DATA REQUIREMENTS OF THE SEDIMENT MANAGEMENT STANDARDS (SMS) AND THE DREDGED MATERIAL MANAGEMENT PROGRAM (DMMP) In addition to the SMS, the other major framework for sediment management activities in Puget Sound is the Dredged Material Management Program (DMMP). The SMS and DMMP are very similar in the suites of biological and chemical evaluations that are required, and in the evaluation criteria that are applied. While the two programs have the same goal, protection of sediment quality, the two programs have different applications and, as a result, there are some differences in data requirements. A brief comparison of the data requirements of the two programs is added here to assist those individuals who may be involved with projects subject to the requirements of both programs. This document is intended to address SMS requirements for sampling and analysis plans, but the technical information contained here may have broader applicability to other programs. However, for specific requirements of the DMMP for sampling and analysis, the reader should contact the Dredged Material Management Office (DMMO) of the Seattle District Army Corps of Engineers at (206) 764-3768. A copy of the DMMP prototype sampling and analysis plan is available from the DMMO and their web site at: http://www.nws.usace.army.mil/PublicMenu/Menu.cfm?sitename=dmmo&pagename=Useful_Stuff. Sediment sampling and analysis conducted under the SMS is to determine whether and to what extent surface sediments are contaminated, whether point or nonpoint source discharges have contributed or may still be contributing to such contamination, and whether contaminated sediments should be remediated. Sediment sampling and analysis conducted under the DMMP is to determine whether the sediment matrix (volume) proposed for dredging, when dredged and discharged at unconfined, open-water disposal sites within Puget Sound, could cause or contribute to unacceptable adverse effects on the aquatic environment. Because of these different purposes, sampling gear and compositing techniques and allowances will differ. However, both the DMMP and SMS data requirements attempt to evaluate “exposure potential” using a “sediment unit” concept. In dredging situations (DMMP), the exposure potential of concern is with the entire mass of sediments to be released at the DMMP disposal site(s) and the sediment unit of concern is the minimum dredge unit that can be effectively managed. In SMS situations, the exposure potential and sediment unit of concern is generally the surface, specifically the “biologically active zone” (often the top 10 cm). Because of these differences in purpose, sampling and analysis procedures under these two programs have a different focus. DMMP sampling is designed to characterize the bulk properties of the sediments to be dredged, transported, and discharged. Sediment core samples are typically collected to characterize the sediment matrix to the depth of proposed dredging. Because dredging removes the material in bulk, the cores are typically segmented on a 4-foot basis and composited across that segment (rather than further subdivided). The number of samples collected and composited is often defined using a three dimensional “dredged material
Sediment Sampling and Analysis Plan Appendix February 2008
11
management unit.” Sediment sampling under the sediment source control process of the SMS is generally designed to characterize conditions near the sediment surface. In cases where the goal is to characterize the exposure potential, such sampling may target the biologically active zone of the sediments, which typically represents only the uppermost 0–10 cm. In other cases, where the goal is to sample only the most recently deposited sediment, such sampling may target only the uppermost 0–2 cm of sediments. Sediment sampling designed to identify contaminated sediment sites under the sediment cleanup process of the SMS is initially focused on the near-surface, biologically active zone of the sediments. After a contaminated site is identified, however, collection of sediment cores will also generally be required to assess the vertical extent of contamination and to determine the sediment quality of any new surface to be exposed after cleanup. The process of compositing samples from a range of depth intervals below the sediment surface may dilute higher concentrations of contaminants or vice-versa. Compositing over depth provides an assessment of the condition of the overall sediment matrix, but does not provide an assessment of the sediments within the biologically active zone. Compositing of samples from a range of depth intervals is therefore appropriate for DMMP purposes, but should ordinarily not be performed for SMS investigations. In addition, many more samples may be needed for SMS purposes to establish patterns or gradients of contamination, to identify contaminant sources, or to delimit the area of contamination. There are also some differences in analytical requirements between the DMMP and the SMS. For example, under DMMP, chemical analyses are always required, but they may in some cases be followed by biological testing if chemical screening levels (SLs) are exceeded. Alternatively, a dredging applicant may, at their discretion, decide to conduct chemical and biological testing concurrently if there is reason to believe that SLs will be exceeded or if there are time limitations on the testing and analyses. Under the SMS, biological testing may in some cases be conducted first, and chemical characterization may only be required if significant biological effects are found. Finally, there are differences in data interpretation procedures between the DMMP and the SMS. The DMMP has established SLs and maximum levels (MLs) for 61 chemicals or classes of chemicals in Puget Sound, ocean and Columbia River sediments (Table 1), whereas the SMS has established numerical criteria (SQS, SIZmax, CSL, and minimum cleanup levels [MCUL]) for 47 chemicals or classes of chemicals in Puget Sound marine sediments (Table 1). Both the SMS and DMMP chemical numerical criteria are based primarily on Puget Sound apparent effects threshold (AET) values (Barrick et al. 1988). Conceptually, the SMS and DMMP chemical numerical criteria provide two regulatory levels for the evaluation of sediment contaminant concentrations. The SQS under the SMS and the SL under the DMMP represent concentrations below which adverse biological effects are considered to be unlikely. The SIZmax, CSL, and MCUL under the SMS and the ML under the DMMP represent concentrations above which adverse biological effects are likely to be significant. The derivation of these chemical numerical criteria from the AET values is somewhat different because of the different regulatory uses of these criteria in the two programs. Because the concentrations of nonionizable organic compounds are expressed on a total organic carbon (TOC)-normalized basis under the SMS, but on a dry-weight basis under the DMMP, direct comparison of these two sets of chemical numerical criteria (Table 1) is not possible without conversion of data to the desired units. There are also some relatively minor differences between the DMMP and the SMS in the use and interpretation of biological test results. Because of these differences, it should not be assumed that sediments considered acceptable for DMMP disposal would pass the SMS
Sediment Sampling and Analysis Plan Appendix February 2008
12
standards, or vice versa. If sediments are initially sampled and analyzed under the SMS and it is later decided that it will be necessary to dredge those sediments, it will generally be necessary to resample the sediments for evaluation under the DMMP. There is, however, the potential for assessing sediments at a given site for both SMS and DMMP purposes. If dredging and disposal at a DMMP disposal site were considered as a possible remedial option, it may be possible to coordinate the sediment sampling and analyses. In such cases, the project proponent is encouraged to contact both the DMMP lead (the Corps of Engineers Dredged Material Management Office) and one of Ecology's sediment cleanup or source control specialists to coordinate between the two programs (see Appendix A for the contact list).
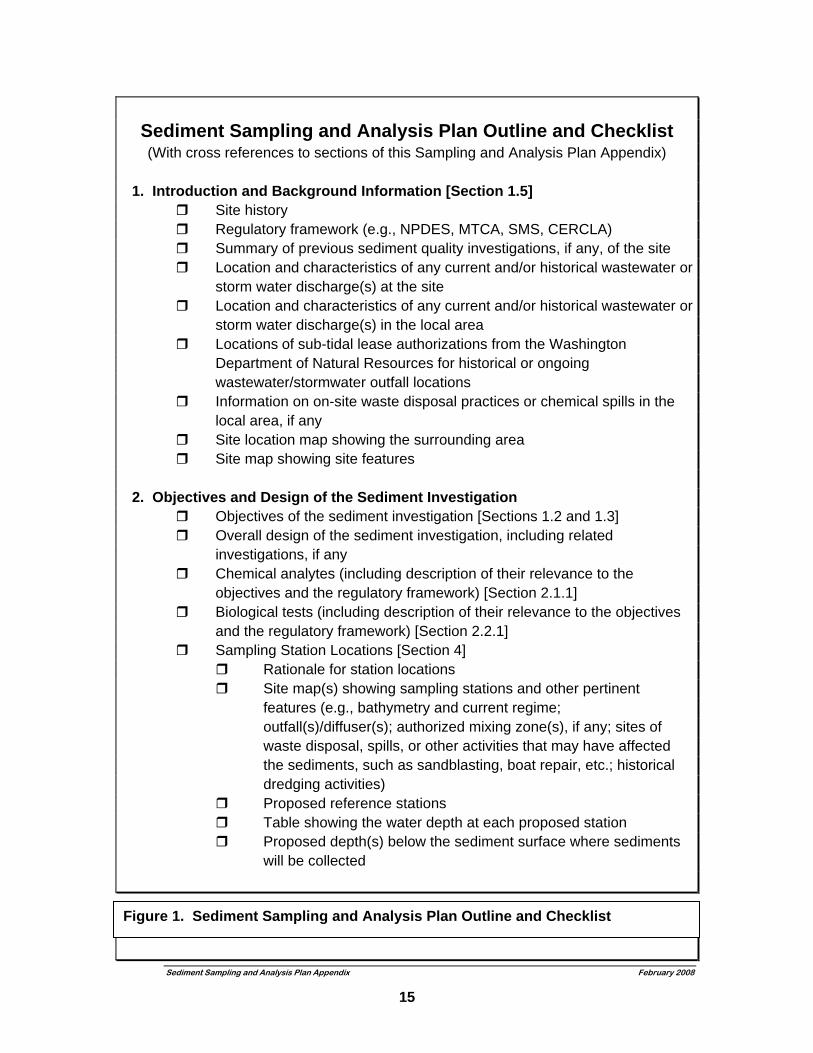
1.5 DEVELOPMENT OF SEDIMENT SAMPLING AND ANALYSIS PLANS UNDER THE SMS Although the specific details of individual sampling and analysis plans may be very different, all such plans submitted for review by Ecology should contain certain basic elements. Figure 1 provides a recommended outline for sediment sampling and analysis plans that can also serve as a checklist for those preparing or reviewing such plans. The outline contains cross-references to pertinent sections of this document for guidance. To support the development of study-specific objectives for a given sediment investigation, it is necessary for a project proponent to review available background information on the site. Therefore, each sediment sampling and analysis plan, regardless of whether it is being prepared under the sediment source control process or the sediment cleanup process, should include as part of the introduction a summary of site background information. Alternatively, if the sampling and analysis plan is attached to a work plan (e.g., as part of a remedial investigation or cleanup study), the necessary background information may be provided in the work plan and does not need to be repeated in the sampling and analysis plan. The following background information should be provided in one of the two documents: Site ownership, management and use history Regulatory framework (e.g., NPDES; Model Toxics Control Act; SMS;
Comprehensive Environmental Response, Compensation, and Liability Act, etc,.)
Summary of results of previous sediment quality investigations, if any, of the
site Location and characteristics of any current and/or historical wastewater or
stormwater discharge(s) at the site. These should be provided in latitude/longitude coordinates in North American Datum 1983 South zone, as an ArcView GIS v3.x or 8.x shape file and in hardcopy figures.
Location and characteristics of any current and/or historical wastewater or
stormwater discharge(s) in the local area. These should be provided in
Sediment Sampling and Analysis Plan Appendix February 2008
13
latitude/longitude coordinates in North American Datum 1983 South zone, as an ArcView GIS v3.x or 8.x shape file and in hardcopy figures.
Locations of sub-tidal lease authorizations from the Washington Department of
Natural Resources for historical or ongoing wastewater/stormwater outfall locations. These should be provided in latitude/longitude coordinates in North American Datum 1983 South zone, as an ArcView GIS v3.x or 8.x shape file and in hardcopy figures.
Information on onsite waste disposal practices or chemical spills in the local
area, if any Site location, including a location map showing the surrounding area and a
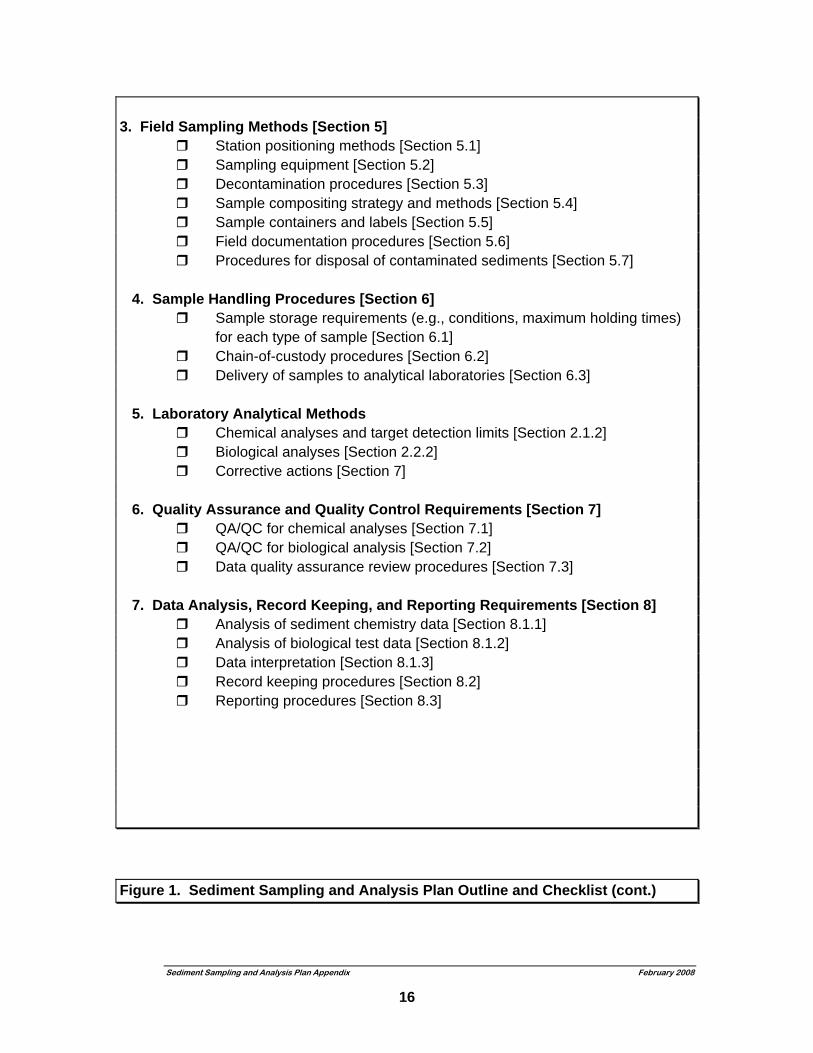
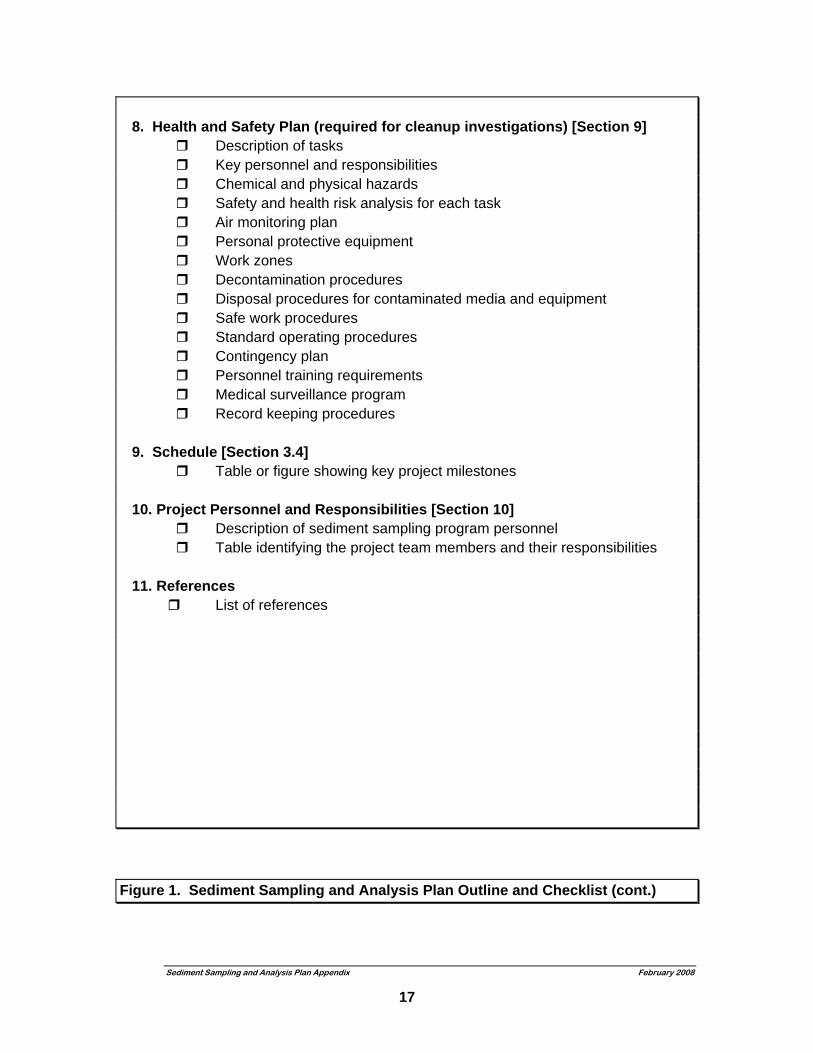
site map. The second section of a sampling and analysis plan should describe the objectives of the sediment investigation in the context of the appropriate regulatory framework (e.g., sediment source control process [see Section 1.2], sediment cleanup process [see Section 1.3]). Guidance on the selection of appropriate chemical analytes and biological tests is provided in Section 2 of this document. Guidance on the selection of sampling station locations is provided in Section 4 of this document. Subsequent sections of this document provide guidance on appropriate field sampling methods (Section 5); sample handling procedures (Section 6); laboratory analytical methods (Sections 2.1.2 and 2.2.2); quality assurance and quality control requirements (Section 7); data analysis, record keeping, and reporting requirements (Section 8); health and safety plan (Section 9); schedule (Section 3.4); and project personnel and responsibilities (Section 10). Strict adherence to the outline shown in Figure 1 is not required, but use of the outline is recommended by Ecology to ensure an efficient and timely review of sediment sampling and analysis plans.
Sediment Sampling and Analysis Plan Appendix February 2008
14
Sediment Sampling and Analysis Plan Outline and Checklist (With cross references to sections of this Sampling and Analysis Plan Appendix)
1. Introduction and Background Information [Section 1.5] Site history Regulatory framework (e.g., NPDES, MTCA, SMS, CERCLA) Summary of previous sediment quality investigations, if any, of the site Location and characteristics of any current and/or historical wastewater or
storm water discharge(s) at the site Location and characteristics of any current and/or historical wastewater or
storm water discharge(s) in the local area Locations of sub-tidal lease authorizations from the Washington
Department of Natural Resources for historical or ongoing wastewater/stormwater outfall locations
Information on on-site waste disposal practices or chemical spills in the local area, if any
Site location map showing the surrounding area Site map showing site features 2. Objectives and Design of the Sediment Investigation Objectives of the sediment investigation [Sections 1.2 and 1.3] Overall design of the sediment investigation, including related
investigations, if any Chemical analytes (including description of their relevance to the
objectives and the regulatory framework) [Section 2.1.1] Biological tests (including description of their relevance to the objectives
and the regulatory framework) [Section 2.2.1] Sampling Station Locations [Section 4] Rationale for station locations Site map(s) showing sampling stations and other pertinent
features (e.g., bathymetry and current regime; outfall(s)/diffuser(s); authorized mixing zone(s), if any; sites of waste disposal, spills, or other activities that may have affected the sediments, such as sandblasting, boat repair, etc.; historical dredging activities)
Proposed reference stations Table showing the water depth at each proposed station Proposed depth(s) below the sediment surface where sediments
will be collected
Figure 1. Sediment Sampling and Analysis Plan Outline and Checklist
Sediment Sampling and Analysis Plan Appendix February 2008
15
3. Field Sampling Methods [Section 5] Station positioning methods [Section 5.1] Sampling equipment [Section 5.2] Decontamination procedures [Section 5.3] Sample compositing strategy and methods [Section 5.4] Sample containers and labels [Section 5.5] Field documentation procedures [Section 5.6] Procedures for disposal of contaminated sediments [Section 5.7] 4. Sample Handling Procedures [Section 6] Sample storage requirements (e.g., conditions, maximum holding times)
for each type of sample [Section 6.1] Chain-of-custody procedures [Section 6.2] Delivery of samples to analytical laboratories [Section 6.3] 5. Laboratory Analytical Methods Chemical analyses and target detection limits [Section 2.1.2] Biological analyses [Section 2.2.2] Corrective actions [Section 7] 6. Quality Assurance and Quality Control Requirements [Section 7] QA/QC for chemical analyses [Section 7.1] QA/QC for biological analysis [Section 7.2] Data quality assurance review procedures [Section 7.3] 7. Data Analysis, Record Keeping, and Reporting Requirements [Section 8] Analysis of sediment chemistry data [Section 8.1.1] Analysis of biological test data [Section 8.1.2] Data interpretation [Section 8.1.3] Record keeping procedures [Section 8.2] Reporting procedures [Section 8.3]
Figure 1. Sediment Sampling and Analysis Plan Outline and Checklist (cont.)
Sediment Sampling and Analysis Plan Appendix February 2008
16
8. Health and Safety Plan (required for cleanup investigations) [Section 9] Description of tasks Key personnel and responsibilities Chemical and physical hazards Safety and health risk analysis for each task Air monitoring plan Personal protective equipment Work zones Decontamination procedures Disposal procedures for contaminated media and equipment Safe work procedures Standard operating procedures Contingency plan Personnel training requirements Medical surveillance program Record keeping procedures 9. Schedule [Section 3.4] Table or figure showing key project milestones 10. Project Personnel and Responsibilities [Section 10] Description of sediment sampling program personnel Table identifying the project team members and their responsibilities 11. References List of references
Figure 1. Sediment Sampling and Analysis Plan Outline and Checklist (cont.)
Sediment Sampling and Analysis Plan Appendix February 2008
17
2. SELECTION OF STUDY-SPECIFIC PARAMETERS AND LABORATORY ANALYTICAL METHODS
This section provides guidance on the selection of appropriate study-specific parameters and laboratory analytical methods. Input from Ecology should be sought early in the process of designing the sediment investigation to ensure that appropriate parameters are selected and other similar issues are addressed. See the Ecology contact list in Appendix A for the appropriate contact person.
2.1. CHEMICAL ANALYSES OF SEDIMENTS
2.1.1. Selection of Chemical Analytes Sediment investigations in virtually all cases will involve measurement of chemical con-centrations in the sediment. The list of analytes should include those chemicals for which there are numerical criteria under the SMS (SQS and SIZmax/CSL/MCUL in Table 1). All sediment investigations should also include measurement of conventional sediment variables (Table 3) that are useful in interpreting other sediment chemical or biological data. There also may be potentially toxic contaminants known or suspected to be associated with a given site for which there are presently no numerical criteria (i.e., “other toxic, radioactive, biological, or deleterious substances,” see WAC 173-204-320(5)). The association of these contaminants with a site may be either because of their presence in wastewater discharged from the site or from other nearby locations or because of other historical activities at the site (e.g., spills, mining activities, waste disposal). Examples of such contaminants are listed in Table 4. When there is reason to believe that any such potentially toxic contaminants may be present in the sediments at a site, they should also be measured.
2.1.2. Chemical Laboratory Analytical Methods Guidelines for the analyses of conventional sediment variables are provided in PSEP (1986). However, the analytical method for TOC in PSEP (1986a) is now out of date. Method 9060 (U.S. EPA 1986) should be used instead. Metals should be analyzed according to the guidelines provided in PSEP (1997a), and organic compounds should be analyzed according to the guidelines provided in PSEP (1997b). Recommended sample preparation methods, cleanup methods, analytical methods, and practical quantitation limits for sediments are summarized in Table 5. Selected ion monitoring may improve the sensitivity of Method 8270C (U.S. EPA 1996) and is recommended in cases when practical quantitation limits must be lowered to human health criteria levels or when TOC levels elevate practical quantitation limits above ecological criteria levels as described below. Alternative methods of analysis that satisfy quality assurance standards described in
Sediment Sampling and Analysis Plan Appendix February 2008
18
Section 7 of this document, may be approved by Ecology on a case by case basis. Accredited, alternative methods will be given highest consideration for approval. For the analysis of organic compounds, special attention must be paid to achieving sufficiently low practical quantitation limits, especially when the sediment analyzed has low TOC. Achievement of the recommended practical quantitation limits in Table 5 will generally allow comparison with the numerical criteria in Table 1 for sediments with a normal range of TOC values. However, at low TOC values, the TOC-normalized detection limits for certain chemicals may be above the numerical criteria expressed on a TOC-normalized basis (i.e., SQS and SIZmax/CSL/MCUL in Table 1). If the analytical laboratory achieves detection limits that are above the numerical criteria after TOC normalization, the sample should be reanalyzed, correcting for matrix interferences through appropriate clean-up procedures (Table 5) and other measures. The analytical laboratory should contact the quality assurance and quality control (QA/QC) coordinator and/or the project manager and identify the steps being taken to lower the practical quantitation limits. It is unacceptable for the laboratory to report high practical quantitation limits after holding time has been exceeded and reanalysis is precluded. In some case where low TOC values unavoidably cause SMS criteria exceedance, Ecology may allow case-by-case comparison of dry-weight test sediment chemistry values to alternative dry weight-based sediment guidance values. For further information on TOC analysis/normalization, see Bragdon-Cook (1995). To determine metal concentrations in sediment samples, the metals must be extracted prior to quantitative analysis. For the analysis of metals other than mercury, there are two options for digesting the sediment sample: total acid digestion and strong acid digestion. Total acid digestion may be performed using either a combination of nitric, perchloric, and hydrofluoric acids (Method 200.4, U.S. EPA [1983]) or a combination of hydrofluoric acid and aqua regia (Rantala and Loring [1975]). Although both total acid digestion methods result in the release of all mineral-bound metals into solution, including naturally occurring metals, the method of Rantala and Loring is preferred by some laboratories because the use of perchloric acid in the Method 200.4 procedure requires the use of a fume hood. Method 3050 (U.S. EPA 1986) is a strong acid digestion method using nitric acid and hydrogen peroxide. Strong acid digestion is recommended by PSEP (1997a), acceptable for most applications, and more commonly used. Ecology has a laboratory accreditation program designed to ensure that analytical laboratories meet certain performance standards. Attention should be given in the planning stage to select laboratories accredited within the “Solids and Chemical Materials” matrix category for the sediment analysis methods that will be performed for the project. Laboratory accreditation requirements are specified in WAC 173-50, Accreditation of Environmental Laboratories and the accompanying Procedural Manual for the Environmental Laboratory Accreditation Program. The requirement to use accredited laboratories for sediment analyses currently exists under the Toxics Cleanup Program rule (Chapter 173-340 WAC) and the water quality rules (Chapter 173-216 WAC, Chapter 173-220 WAC, Chapter 173-226 WAC). These rules require that laboratories be accredited for the methods used to analyze environmental samples for regulatory purposes. The Questions on the accredited laboratories and methods may be directed to Ecology's Quality Assurance Section at (360) 895-6145. A current list of accredited laboratories can be obtained and queried on line at the following websites: http://www.ecy.wa.gov/programs/eap/labs/labs_main.html Sediment Sampling and Analysis Plan Appendix February 2008
19
http://www.ecy.wa.gov/apps/eap/acclabs/labquery.asp
Method accreditation requirements for the analysis of chemical parameters described in the SMS rule, Chapter 173-204-320(5) as “other toxic, radioactive, biological, or deleterious substances” (e.g., organic debris, tributyltin, DDT, dioxin, resin acids, guaiacols, etc.) for which there are presently no numerical criteria, will be determined on a case by case basis by the department. As authorized under the SMS Chapters 173-204-110(6) WAC and 173-204-310(3) WAC, the department may identify appropriate and practicable sampling and analysis methodologies as standard analytical methods are developed for these parameters. At that time, Ecology may require the use of the laboratories accredited for such methods of sediment analyses.
Sediment Sampling and Analysis Plan Appendix February 2008
20
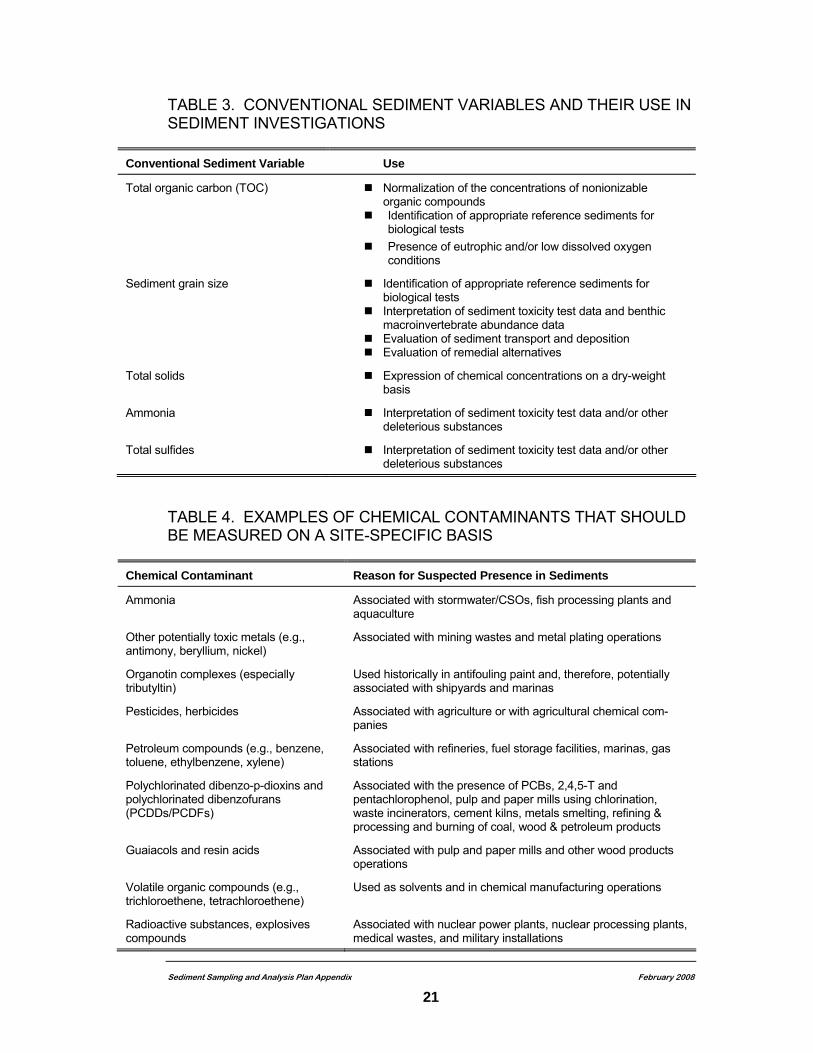
TABLE 3. CONVENTIONAL SEDIMENT VARIABLES AND THEIR USE IN SEDIMENT INVESTIGATIONS
Conventional Sediment Variable Use
Total organic carbon (TOC) Normalization of the concentrations of nonionizable organic compounds
Identification of appropriate reference sediments for biological tests
Presence of eutrophic and/or low dissolved oxygen conditions
Sediment grain size Identification of appropriate reference sediments for biological tests
Interpretation of sediment toxicity test data and benthic macroinvertebrate abundance data
Evaluation of sediment transport and deposition Evaluation of remedial alternatives
Total solids Expression of chemical concentrations on a dry-weight basis
Ammonia Interpretation of sediment toxicity test data and/or other deleterious substances
Total sulfides Interpretation of sediment toxicity test data and/or other deleterious substances
TABLE 4. EXAMPLES OF CHEMICAL CONTAMINANTS THAT SHOULD BE MEASURED ON A SITE-SPECIFIC BASIS
Chemical Contaminant Reason for Suspected Presence in Sediments
Ammonia Associated with stormwater/CSOs, fish processing plants and aquaculture
Other potentially toxic metals (e.g., antimony, beryllium, nickel)
Associated with mining wastes and metal plating operations
Organotin complexes (especially tributyltin)
Used historically in antifouling paint and, therefore, potentially associated with shipyards and marinas
Pesticides, herbicides Associated with agriculture or with agricultural chemical com-panies
Petroleum compounds (e.g., benzene, toluene, ethylbenzene, xylene)
Associated with refineries, fuel storage facilities, marinas, gas stations
Polychlorinated dibenzo-p-dioxins and polychlorinated dibenzofurans (PCDDs/PCDFs)
Associated with the presence of PCBs, 2,4,5-T and pentachlorophenol, pulp and paper mills using chlorination, waste incinerators, cement kilns, metals smelting, refining & processing and burning of coal, wood & petroleum products
Guaiacols and resin acids Associated with pulp and paper mills and other wood products operations
Volatile organic compounds (e.g., trichloroethene, tetrachloroethene)
Used as solvents and in chemical manufacturing operations
Radioactive substances, explosives compounds
Associated with nuclear power plants, nuclear processing plants, medical wastes, and military installations
Sediment Sampling and Analysis Plan Appendix February 2008
21
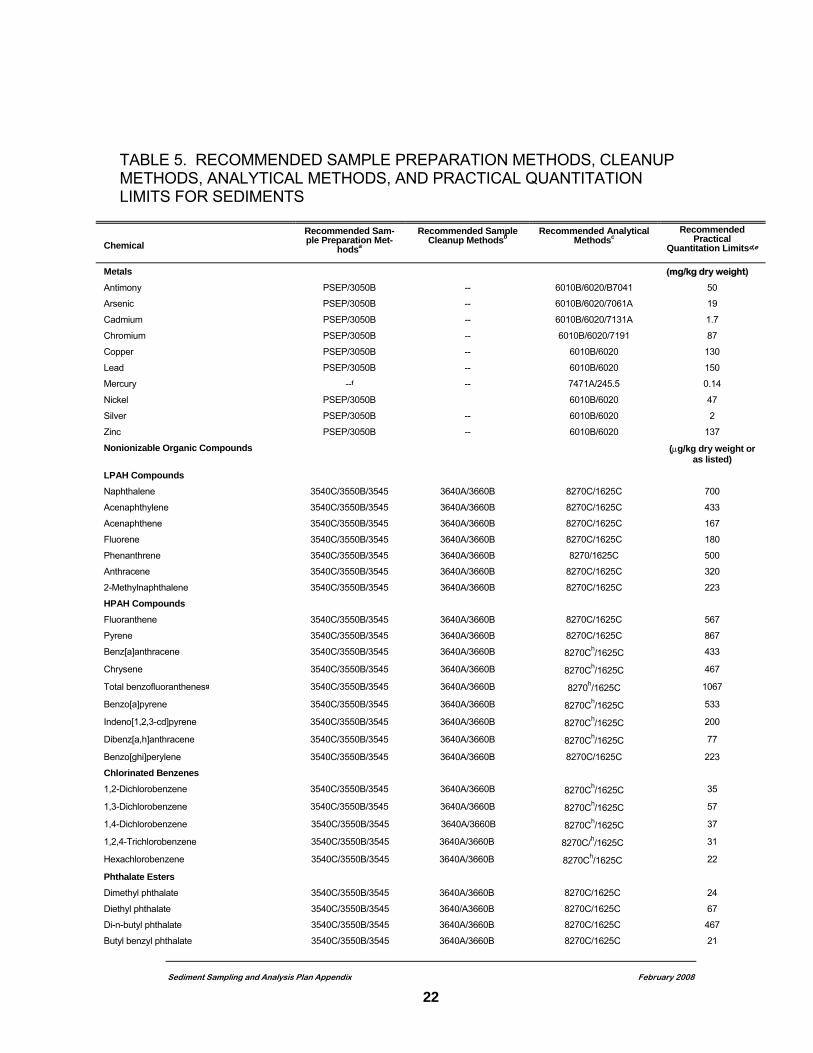
TABLE 5. RECOMMENDED SAMPLE PREPARATION METHODS, CLEANUP METHODS, ANALYTICAL METHODS, AND PRACTICAL QUANTITATION LIMITS FOR SEDIMENTS
Chemical
Recommended Sam-ple Preparation Met-
hodsa
Recommended Sample Cleanup Methodsb
Recommended Analytical Methodsc
Recommended Practical
Quantitation Limitsd,e
Metals (mg/kg dry weight)
Antimony PSEP/3050B -- 6010B/6020/B7041 50
Arsenic PSEP/3050B -- 6010B/6020/7061A 19
Cadmium PSEP/3050B -- 6010B/6020/7131A 1.7
Chromium PSEP/3050B -- 6010B/6020/7191 87
Copper PSEP/3050B -- 6010B/6020 130
Lead PSEP/3050B -- 6010B/6020 150
Mercury --f -- 7471A/245.5 0.14
Nickel PSEP/3050B 6010B/6020 47
Silver PSEP/3050B -- 6010B/6020 2
Zinc PSEP/3050B -- 6010B/6020 137
Nonionizable Organic Compounds (μg/kg dry weight or as listed)
LPAH Compounds Naphthalene 3540C/3550B/3545 3640A/3660B 8270C/1625C 700
Acenaphthylene 3540C/3550B/3545 3640A/3660B 8270C/1625C 433
Acenaphthene 3540C/3550B/3545 3640A/3660B 8270C/1625C 167
Fluorene 3540C/3550B/3545 3640A/3660B 8270C/1625C 180
Phenanthrene 3540C/3550B/3545 3640A/3660B 8270/1625C 500
Anthracene 3540C/3550B/3545 3640A/3660B 8270C/1625C 320
2-Methylnaphthalene 3540C/3550B/3545 3640A/3660B 8270C/1625C 223
HPAH Compounds Fluoranthene 3540C/3550B/3545 3640A/3660B 8270C/1625C 567
Pyrene 3540C/3550B/3545 3640A/3660B 8270C/1625C 867
Benz[a]anthracene 3540C/3550B/3545 3640A/3660B 8270Ch/1625C 433
Chrysene 3540C/3550B/3545 3640A/3660B 8270Ch/1625C 467
Total benzofluoranthenesg 3540C/3550B/3545 3640A/3660B 8270h/1625C 1067
Benzo[a]pyrene 3540C/3550B/3545 3640A/3660B 8270Ch/1625C 533
Indeno[1,2,3-cd]pyrene 3540C/3550B/3545 3640A/3660B 8270Ch/1625C 200
Dibenz[a,h]anthracene 3540C/3550B/3545 3640A/3660B 8270Ch/1625C 77
Benzo[ghi]perylene 3540C/3550B/3545 3640A/3660B 8270C/1625C 223
Chlorinated Benzenes 1,2-Dichlorobenzene 3540C/3550B/3545 3640A/3660B 8270Ch/1625C 35
1,3-Dichlorobenzene 3540C/3550B/3545 3640A/3660B 8270Ch/1625C 57
1,4-Dichlorobenzene 3540C/3550B/3545 3640A/3660B 8270Ch/1625C 37
1,2,4-Trichlorobenzene 3540C/3550B/3545 3640A/3660B 8270C/h/1625C 31
Hexachlorobenzene 3540C/3550B/3545 3640A/3660B 8270Ch/1625C 22
Phthalate Esters Dimethyl phthalate 3540C/3550B/3545 3640A/3660B 8270C/1625C 24
Diethyl phthalate 3540C/3550B/3545 3640/A3660B 8270C/1625C 67
Di-n-butyl phthalate 3540C/3550B/3545 3640A/3660B 8270C/1625C 467
Butyl benzyl phthalate 3540C/3550B/3545 3640A/3660B 8270C/1625C 21
Sediment Sampling and Analysis Plan Appendix February 2008
22
Sediment Sampling and Analysis Plan Appendix February 2008
23
Chemical
Recommended Sam-ple Preparation Met-
hodsa
Recommended Sample Cleanup Methodsb
Recommended Analytical Methodsc
Recommended Practical
Quantitation Limitsd,e
Bis[2-ethylhexyl]phthalate 3540C/3550B/3545 3640A/3660B 8270C/1625C 433
Di-n-octyl phthalate 3540C/3550B/3545 3640A/3660B 8270C/1625C 2067
Miscellaneous Extractable Compounds (μg/kg dry weight or as listed)
Dibenzofuran 3540C/3550B/3545 3640A/3660B 8270C/1625C 180
Hexachlorobutadiene 3540C/3550B/3545 3640A/3660B 8270C/1625C 11
Hexachloroethane 3540C/3550B/3545 3640A/3660B 8270C/1625C 47
N-nitrosodiphenylamine 3540C/3550B/3545 3640A/3660B 8270C/1625C 28
PCBs
PCB Aroclors® 3540/3550 3620B/3640A/3660B 8082 6
Chlorinated Pesticides
DDD 3540C/3550B/3545 3620B/3640A/3660B 8081A/8085 3.3
DDE 3540C/3550B/3545 3620B/3640A/3660B 8081A/8085 2.3
Total DDT 3540C/3550B/3545 3620B/3640A/3660B 8081A/8085 6.7
Aldrin 3540C/3550B/3545 3620B/3640A/3660B 8081A/8085 1.7
Chlordane 3540C/3550B/3545 3620B/3640A/3660B 8081A/8085 1.7
Dieldrin 3540C/3550B/3545 3620B/3640A/3660B 8081A/8085 2.3
Heptachlor 3540C/3550B/3545 3620B/3640A/3660B 8081A/8085 1.7
Lindane 3540C/3550B/3545 3620B/3640A/3660B 8081A/8085 1.7
Volatile Organic Compounds
Ethylbenzene --i -- 8260B/1624C 3.2
Tetrachloroethene --i -- 8260B/1624C 3.2
Total xylene --i -- 8260B/1624C 3.2
Trichloroethene --i -- 8260B/1624C 3.2
Ionizable Organic Compounds
Phenol 3540C/3550B/3545 3640A/3660B 8270C/1625C 140
2-Methylphenol 3540C/3550B/3545 3640A/3660B 8270C/1625C 63
4-Methylphenol 3540C/3550B/3545 3640A/3660B 8270C/1625C 223
2,4-Dimethylphenol 3540C/3550B/3545 3640A/3660B 8270C/1625C 29
Pentachlorophenol 3540C/3550B/3545 3640A/3660B 8270C/1625C 120
Benzyl alcohol 3540C/3550B/3545 3640A/3660B 8270C/1625C 57
Benzoic acid 3540C/3550B/3545 3640A/3660B 8270C/1625C 217
Conventional Sediment Variables
Ammonia --j -- Plumb (1981) 100 mg/L
Grain size --j -- Plumb (1981) 1%
Total solids --j -- PSEP 0.1% (wet wt)
Total organic carbon (TOC) --j -- 9060 0.1%
Total sulfides
Acid Volatile Sulfides
--j -- Plumb (1981)/ 9030B
AVS (U.S. EPA 1991)
10 (mg/kg)
10 (mg/kg)
Site Specific Compounds (μg/kg dry weight or as listed)
Ammonia --j -- See above 100
Other potentially toxic metals (e.g., antimony, beryllium, nickel)
PSEP -- See above Sb 50, Ni 47
Organotin complexes Bulk sediment: Krone (1989);
Interstitial water: Krone (1989) extraction,
performance based analysis
1 - 5
3 - 5 ug/L
Pesticides, herbicides 3540C/3550B 3620B/3640A/3660B 8081A/8085/8151A 1.7-6.7
Petroleum compounds (e.g., benzene, toluene, ethylbenzene, xylene)
-- -- 8021B/8260B/1624C 50
TABLE 5. (continued)
TABLE 5. (continued)
Sediment Sampling and Analysis Plan Appendix February 2008
24
Chemical
Recommended Sam-ple Preparation Met-
hodsa
Recommended Sample Cleanup Methodsb
Recommended Analytical Methodsc
Recommended Practical
Quantitation Limitsd,e
Total petroleum hydrocarbons -- -- 8440
Ecology method - pub. 97-602 (1997)
20 mg/kg (gasoline), 50 mg/kg (#2 diesel), 100 mg/kg (lmotor oil) based on 100% solids
Polychlorinated dibenzo-p-dioxins and polychlorinated dibenzofurans (PCDDs/PCDFs)
-- -- 1613 1 - 10 ng/kg
Guaiacols 3540C -- NCASI Method CP – 86.02 Chlorinated Phenols
50-100
Resin acids 3540C (using acetone) -- NCASI Method RA/FA 85.02 50-100
Radioactive substances, Explosive compounds
8330 -- 8095/8330 250-2200 (method 8330)
Note: AVS - acid volatile sulfide EPA - U.S. Environmental Protection Agency GPC - gel permeation chromatography HPAH - high molecular weight polycyclic aromatic hydrocarbon LPAH - low molecular weight polycyclic aromatic hydrocarbon PCB - polychlorinated biphenyl PSEP - Puget Sound Estuary Program TOC - total organic carbon
a Recommended sample preparation methods are: PSEP (1997a) Method 3050B and 3500 series - sample preparation methods from SW-846 (U.S. EPA 1996) and subjected to changes by
EPA updates. b Recommended sample cleanup methods are: Sample extracts subjected to GPC cleanup follow the procedures specified by EPA SW-846 Method 3640A. Special care
should be used during GPC to minimize loss of analytes. If sulfur is present in the samples (as is common in most marine sediments), cleanup procedures specified by EPA SW-846
Method 3660B should be used. All PCB extracts should be subjected to sulfuric acid/permanganate cleanup as specified by EPA SW-846 Method 3665A. Additional cleanup procedures may be necessary on a sample-by-sample basis. Alternative cleanup procedures are
described in PSEP (1997b) and U.S. EPA (1986). c Recommended analytical methods are: Method 6000, 7000, 8000, and 9000 series - analytical methods from SW-846 (U.S. EPA 1986) and updates The SW-846 and updates are available from the web site at: http://www.epa.gov/epaoswer/hazwaste/test/sw846.htm Method 1613 - analytical method from U.S. EPA-821/B-94-005 (1994) Method 1624C/1625C - isotope dilution method (U.S. EPA 1989) NCASI – analytical methods from the National Council for Air and Stream Improvement, Inc. Plumb (1981) - U.S. EPA/U.S. Army Corps of Engineers Technical Report EPA/CE-81-1 PSEP (1986a) Acid volatile sulfide method for sediment (U.S. EPA 1991).
Krone (1989) – Krone, C. A., D. W. Brown, D. G. Burrows, R. G. Bogar, S. L. Chan and U. Varanasi, 1989. A Method for the Analysis of Butyltin Species and the Measurement of Butyltins in Sediment and English Sole Livers from Puget Sound.
Marine Environmental Research 27:1-18. To achieve the recommended practical quantitation limits for organic compounds, it may be necessary to use a larger sample size approximately 100 g), a smaller final extract volume for gas chromatography/mass spectrometry analyses (0.5 mL), and one of the recommended sample cleanup methods as necessary to reduce interference, using different analytical methods with better sensitivity. Detection limits are on a dry-weight basis unless otherwise indicated. For sediment samples with low TOC, it may be necessary to achieve even lower detection limits for certain analytes in order to compare the TOC-normalized concentrations with applicable numerical criteria (see Table 1). (Footnotes continued on next page)
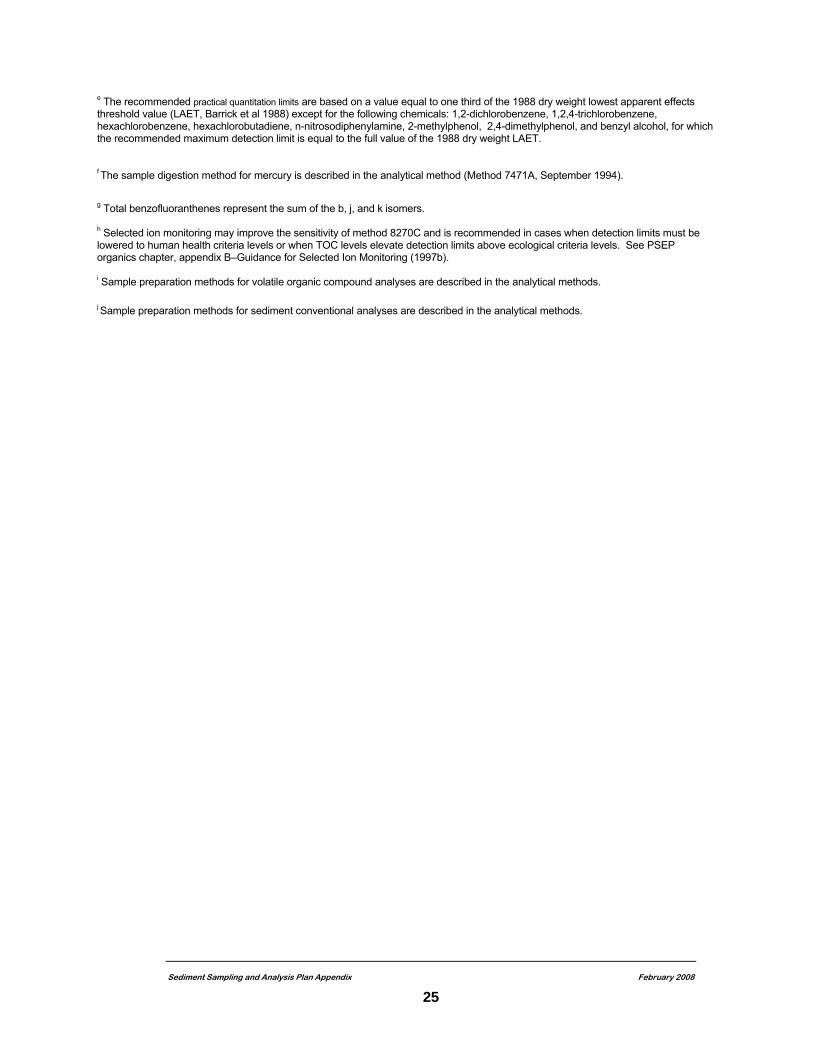
e The recommended practical quantitation limits are based on a value equal to one third of the 1988 dry weight lowest apparent effects threshold value (LAET, Barrick et al 1988) except for the following chemicals: 1,2-dichlorobenzene, 1,2,4-trichlorobenzene, hexachlorobenzene, hexachlorobutadiene, n-nitrosodiphenylamine, 2-methylphenol, 2,4-dimethylphenol, and benzyl alcohol, for which the recommended maximum detection limit is equal to the full value of the 1988 dry weight LAET. f The sample digestion method for mercury is described in the analytical method (Method 7471A, September 1994). g Total benzofluoranthenes represent the sum of the b, j, and k isomers.
h Selected ion monitoring may improve the sensitivity of method 8270C and is recommended in cases when detection limits must be lowered to human health criteria levels or when TOC levels elevate detection limits above ecological criteria levels. See PSEP organics chapter, appendix B–Guidance for Selected Ion Monitoring (1997b). i Sample preparation methods for volatile organic compound analyses are described in the analytical methods. j Sample preparation methods for sediment conventional analyses are described in the analytical methods.
Sediment Sampling and Analysis Plan Appendix February 2008
25
2.2. BIOLOGICAL ANALYSES OF SEDIMENTS
2.2.1. Selection of Biological Tests In marine and estuarine environments, biological testing may only be necessary if SMS chemical criteria are exceeded and biological confirmation is desired. However, if there is reason to believe that potentially toxic chemicals other than those with adopted SMS chemical criteria, biological testing may also be warranted. In certain cases (see Section 3.3), biological testing may even be conducted prior to or instead of analyses of chemical contaminants in the sediments. In freshwater environments, Ecology recommends and may require, on a case-by-case basis, that biological tests always be conducted to directly assess biological effects because of the current absence of adopted numerical criteria for chemical contaminants in freshwater sediments. Biological testing to assess existing sediment quality may include conducting sediment toxicity tests and/or assessing the naturally occurring community of benthic macroinver-tebrates in sediment samples. The applicable biological tests vary depending on whether the sediment environment is marine, estuarine, or freshwater. 2.2.1.1. Marine and Estuarine Sediment Biological Tests For marine sediments, the SMS require the use of two acute effects biological tests and one chronic effects biological test for each of the following purposes: To determine whether the SQS biological effects level is exceeded [WAC
173-204-310(2)(a)] To determine whether the SIZmax biological effects level is exceeded [WAC
173-204-420(3)(a)] To determine whether the CSL or MCUL biological effects levels are
exceeded [WAC 173-204-520(3)(b)]. Four of the biological tests that can be applied to assessments of marine sediment quality are laboratory sediment toxicity tests (Table 6). Assessment of the naturally occurring community of benthic macroinvertebrates is also considered to be a chronic/sublethal biological test. Although the biological tests described in the SMS are strictly applicable only to marine sediments (i.e., those with interstitial salinities ≥25 parts per thousand [ppt]), application of these tests, as appropriate, and the associated biological effects criteria may be approved by Ecology for low salinity estuarine sediments (i.e., those with interstitial salinities between 0.5 and 25 ppt) on a case-by-case basis. The five applicable marine biological tests include: Acute Effects Tests
– Amphipod: A 10-day acute sediment toxicity test that assesses mortality of one of the following amphipods: Rhepoxynius abronius, Ampelisca abdita or Eohaustorius estuaries, which is chosen based
Sediment Sampling and Analysis Plan Appendix February 2008
26
on the interstitial water salinity and the percentage of sediment fines as indicated in Figure 2.
– Larval: Any one of several acute sediment toxicity tests that
assess mortality and/or abnormality of larvae of the following organisms:
· Pacific oyster, Crassostrea gigas. · Blue mussel, Mytilus galloprovincialis · Purple sea urchin, Strongylocentrotus purpuratus. Green sea urchin, Strongylocentrotus droebachiensis . · Sand dollar, Dendraster excentricus. Chronic Effects Tests – Juvenile polychaete: A 20-day sublethal sediment toxicity test
that assesses decreases in biomass of the juvenile polychaete Neanthes sp.
– Microtox® 100 percent sediment porewater extract: A
15-minute toxicity test that assesses decreased bioluminescence of the bacteria Vibrio fischeri (strain NRRL B-11177) exposed to a pH, dissolved oxygen and salinity-adjusted 100 percent porewater extract of the marine and estuarine sediment sample. For more information of marine Microtox® 100 percent sediment porewater extract toxicity assessment, see Appendix B.
– Benthic Macroinvertebrate Abundance: This test assesses
statistically significant alterations in the naturally occurring abundances of the following major taxa: Crustacea, Mollusca, and Polychaeta.
Two acute effects tests and one chronic effects test are required. A project proponent must conduct the amphipod acute effects test, one of the larval acute effects tests, and one chronic effects test. It should be noted, however, that the SMS do not have a one-hit rule criteria for the marine Microtox® porewater test to be used for determining compliance with the SIZmax, CSL, or MCUL biological effects levels. The selection of the most appropriate amphipod species should follow the decision tree in Figure 2, considering both the interstitial salinity and grain size of the sediments to be tested. Among the three amphipod species (Table 6), R. abronius is considered to be a marine species and is generally appropriate for testing sediments having interstitial salinities ≥ 25 ppt. E. estuarius is tolerant of interstitial salinities < 25 ppt. A. abdita is euryhaline (i.e., tolerant of a wide range in interstitial salinities: 2–28 ppt). Note: If the interstitial salinity of the sediments is <25ppt, the choice of low salinity biological tests must be approved by Ecology in advance on a case-by-case basis. If the interstitial Sediment Sampling and Analysis Plan Appendix February 2008
27
salinity of the sediments to be analyzed in marine and estuarine environments is <25 ppt but ≥20 ppt, either A. abdita or E. estuarius could be used. At interstitial salinities <20 ppt but >2ppt, only A. abdita should be selected. If sediments with interstitial salinities between 15 and 24 ppt are being evaluated for dredging and disposal at a DMMP site, the PSEP (1995) protocols allow for upward adjustment of the interstitial salinity so that R. abronius can be used, but for other evaluation purposes, upward adjustment of the interstitial salinity is generally not considered appropriate for the amphipod toxicity tests. R. abronius is known to be adversely affected by sediments having a high proportion of fine sediments. Therefore, if the proportion of fines (i.e., particles having diameters <62.5 μm) is more than or equal to 60 percent, A. abdita should be selected because it is relatively tolerant of a wide range of sediment grain sizes. The primary factor affecting the selection of an appropriate species for the larval test is the time of the year. It is generally desirable to select a species that is naturally spawning at the time of the year the biological test will be conducted. The natural spawning seasons for the test species in the Puget Sound area are as follows: Oyster—summer Mussel—late spring through early summer Sea urchin—December through April Sand dollar—April through October. Although all of these species can be induced to spawn at other times of the year, the larvae may then be subject to higher mortality, so this practice is not recommended. The PSEP (1995) protocols recommend against use of the larval toxicity tests for sediments with interstitial salinities <10 ppt because of the limited experience with the tests at these salinities. However, all of the larval toxicity tests can probably be used over a wide range of interstitial salinities (from full-strength seawater to <1 ppt) because a small volume of sediments is mixed with a much larger volume of seawater, which has a salinity of 28 ppt, prior to testing. Use of the larval toxicity tests for such low salinity sediments should therefore be discussed with Ecology and considered on a case-by-case basis. Oyster larvae may be adversely affected by small sediment grain sizes. Use of oyster larvae for sediments known to have a high proportion of silt- and clay-size particles is therefore not recommended (PSEP 1995). Instead, either a sea urchin or sand dollar test would be preferable. Among the chronic effects tests, the benthic macroinvertebrate community analysis requires more time for the collection of samples because five replicate grab samples from each station are necessary for this analysis (in addition to sediment samples collected for chemical and other biological tests). The benthic macroinvertebrate community analysis is also generally more expensive than any of the sediment toxicity tests because of the additional sample processing time in the field and the cost of sorting and taxonomically identifying the samples. Ecology has identified additional procedures for benthic macroinvertebrate interpretation and is considering future revision of the SMS rule to Sediment Sampling and Analysis Plan Appendix February 2008
28
incorporate these decision criteria for interpreting the results of the benthic macroinver-tebrate test. The choice between the other two chronic tests may depend on the use of the data. The Microtox® test is quick, relatively inexpensive, unaffected by interstitial salinity or grain size characteristics, and available throughout the year, but the SMS do not have one-hit rule marine criteria for this test for determining compliance with the SIZmax, CSL, or MCUL biological effects levels. The SMS do have criteria for the juvenile polychaete test for any of these purposes. However, Neanthes sp. may be adversely affected by interstitial salinities <20 ppt. Use of the juvenile polychaete test for sediments having interstitial salinities <20 ppt will only be approved by Ecology on a case-by-case basis.
Sediment Sampling and Analysis Plan Appendix February 2008
29
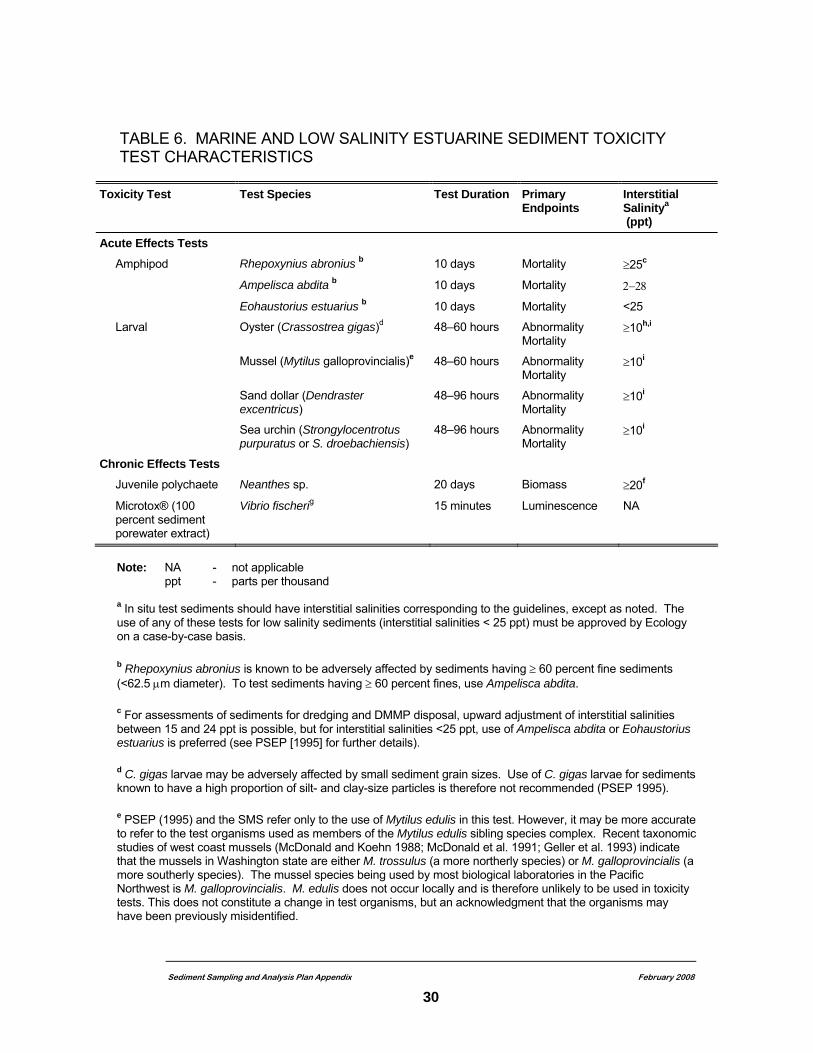
TABLE 6. MARINE AND LOW SALINITY ESTUARINE SEDIMENT TOXICITY TEST CHARACTERISTICS
Toxicity Test Test Species Test Duration Primary Endpoints
Interstitial Salinitya (ppt)
Acute Effects Tests
Amphipod Rhepoxynius abronius b 10 days Mortality ≥25c
Ampelisca abdita b 10 days Mortality 2−28
Eohaustorius estuarius b 10 days Mortality <25
Larval Oyster (Crassostrea gigas)d 48–60 hours Abnormality Mortality
≥10h,i
Mussel (Mytilus galloprovincialis)e 48–60 hours Abnormality Mortality
≥10i
Sand dollar (Dendraster excentricus)
48–96 hours Abnormality Mortality
≥10i
Sea urchin (Strongylocentrotus purpuratus or S. droebachiensis)
48–96 hours Abnormality Mortality
≥10i
Chronic Effects Tests Juvenile polychaete Neanthes sp. 20 days Biomass ≥20f
Microtox® (100 percent sediment porewater extract)
Vibrio fischerig 15 minutes Luminescence NA
Note: NA - not applicable ppt - parts per thousand a In situ test sediments should have interstitial salinities corresponding to the guidelines, except as noted. The use of any of these tests for low salinity sediments (interstitial salinities < 25 ppt) must be approved by Ecology on a case-by-case basis. b Rhepoxynius abronius is known to be adversely affected by sediments having ≥ 60 percent fine sediments (<62.5 μm diameter). To test sediments having ≥ 60 percent fines, use Ampelisca abdita.
c For assessments of sediments for dredging and DMMP disposal, upward adjustment of interstitial salinities between 15 and 24 ppt is possible, but for interstitial salinities <25 ppt, use of Ampelisca abdita or Eohaustorius estuarius is preferred (see PSEP [1995] for further details). d C. gigas larvae may be adversely affected by small sediment grain sizes. Use of C. gigas larvae for sediments known to have a high proportion of silt- and clay-size particles is therefore not recommended (PSEP 1995). e PSEP (1995) and the SMS refer only to the use of Mytilus edulis in this test. However, it may be more accurate to refer to the test organisms used as members of the Mytilus edulis sibling species complex. Recent taxonomic studies of west coast mussels (McDonald and Koehn 1988; McDonald et al. 1991; Geller et al. 1993) indicate that the mussels in Washington state are either M. trossulus (a more northerly species) or M. galloprovincialis (a more southerly species). The mussel species being used by most biological laboratories in the Pacific Northwest is M. galloprovincialis. M. edulis does not occur locally and is therefore unlikely to be used in toxicity tests. This does not constitute a change in test organisms, but an acknowledgment that the organisms may have been previously misidentified.
Sediment Sampling and Analysis Plan Appendix February 2008
30
f Neanthes sp. may be adversely affected by interstitial salinities <20 ppt. Use of the test for sediments having interstitial salinities <20 ppt will only be approved by Ecology on a case-by-case basis. g Formerly known as Photobacterium phosphoreum. h Oyster larvae may be adversely affected by small sediment grain sizes. Use of oyster larvae for sediments known to have a high proportion of silt- and clay-size particles is therefore not recommended (PSEP 1995). Instead, either a sea urchin or sand dollar test would be preferable. I The PSEP (1995) protocols recommend against use of the larval toxicity tests for sediments with interstitial salinities <10 ppt because of the limited experience with the tests at these salinities. However, all of the larval toxicity tests can probably be used over a wide range of interstitial salinities (from full-strength seawater to <1 ppt) because a small volume of sediments is mixed with a much larger volume of seawater, which has a salinity of 28 ppt, prior to testing. Use of the larval toxicity tests for such low salinity sediments should therefore be discussed with Ecology and considered on a case-by-case basis.
Sediment Sampling and Analysis Plan Appendix February 2008
31
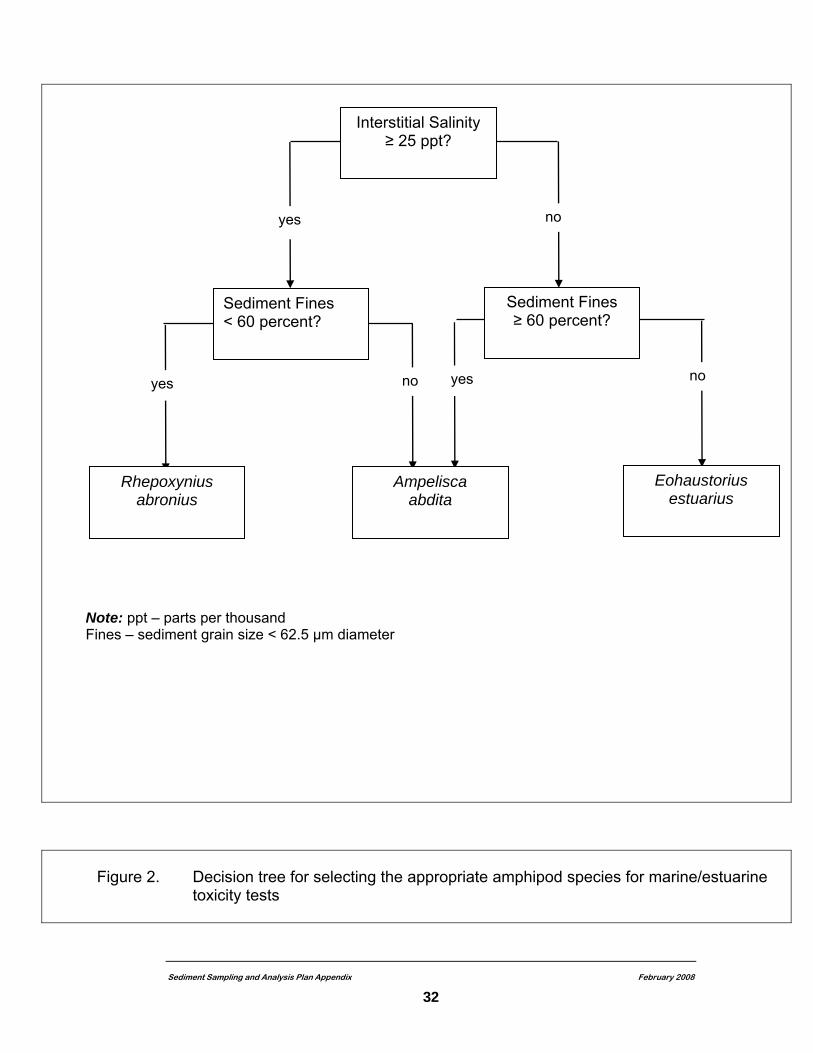
Note: ppt – parts per thousand Fines – sediment grain size < 62.5 µm diameter
Interstitial Salinity ≥ 25 ppt?
no yes
Figure 2. Decision tree for selecting the appropriate amphipod species for marine/estuarine
toxicity tests
no yes no yes
Rhepoxynius abronius
Ampelisca abdita
Eohaustorius estuarius
Sediment Fines < 60 percent?
Sediment Fines ≥ 60 percent?
Sediment Sampling and Analysis Plan Appendix February 2008
32
2.2.1.2. Freshwater Sediment Biological Tests The SMS do not recommend specific biological tests for use in freshwater sediment inves-tigations, nor do they provide decision criteria for interpreting the results of such tests. On a case-by-case basis, Ecology will recommend and may require biological testing as a routine component of freshwater sediment investigations to meet the intent of the narrative standards provided in WAC 173-204-100(3) and (7). Ecology recommends the following sediment toxicity tests (Table 7) for the evaluation of freshwater sediment quality: Amphipod: A 10-day and 28-day sediment toxicity test that assesses
mortality and growth of the amphipod Hyalella azteca Midge: A 10-day and 21-day sediment toxicity test that assesses mortality
and growth of the midge Chironomus tentans Frog embryo: A 96-hour sediment toxicity test that assesses mortality and
developmental malformations in embryos of the frog Xenopus laevis Microtox® 100 percent sediment porewater extract test: A 15-minute
toxicity test that assesses decreased bioluminescence of the bacteria Vibrio fischeri (strain NRRL B-11177) exposed to a pH, dissolved oxygen and salinity-adjusted 100 percent porewater extract of the freshwater sediment sample. For more information of freshwater marine Microtox® 100 percent sediment porewater extract toxicity assessment, see Appendix C.
All of the recommended freshwater sediment bioassay species are available year round. There are many other freshwater sediment toxicity tests that could potentially be applied (see, for example, Burton 1992). Selection of the most appropriate freshwater sediment toxicity tests should be discussed in advance with Ecology on a case-by-case basis.
2.2.2. Biological Laboratory Methods PSEP (1995) provides guidelines for conducting the amphipod, larval, and juvenile polychaete tests for marine sediments. Guidelines for conducting Microtox® 100 percent sediment porewater extract test for marine, estuarine and freshwater sediments are in Appendix B and C. Fore more specific questions in Microtox® 100 percent sediment porewater extract test , contact Peter Adolphson at (360)407-7557. Although PSEP (1995) refers to the use of only Mytilus edulis in the mussel larval test, M. galloprovincialis is the species routinely used in this test by biological laboratories in the Pacific Northwest. On a case-by-case basis, the marine sediment toxicity tests may be approved by Ecology for use in estuarine sediment investigations as well. In addition to the juvenile polychaete test listed in Table 6, assessment of the naturally occurring community of benthic macroinvertebrates is the third chronic effects test that can be applied under the SMS. Guidelines for collecting and analyzing benthic macroinvertebrate samples are provided in PSEP (1987).
Sediment Sampling and Analysis Plan Appendix February 2008
33
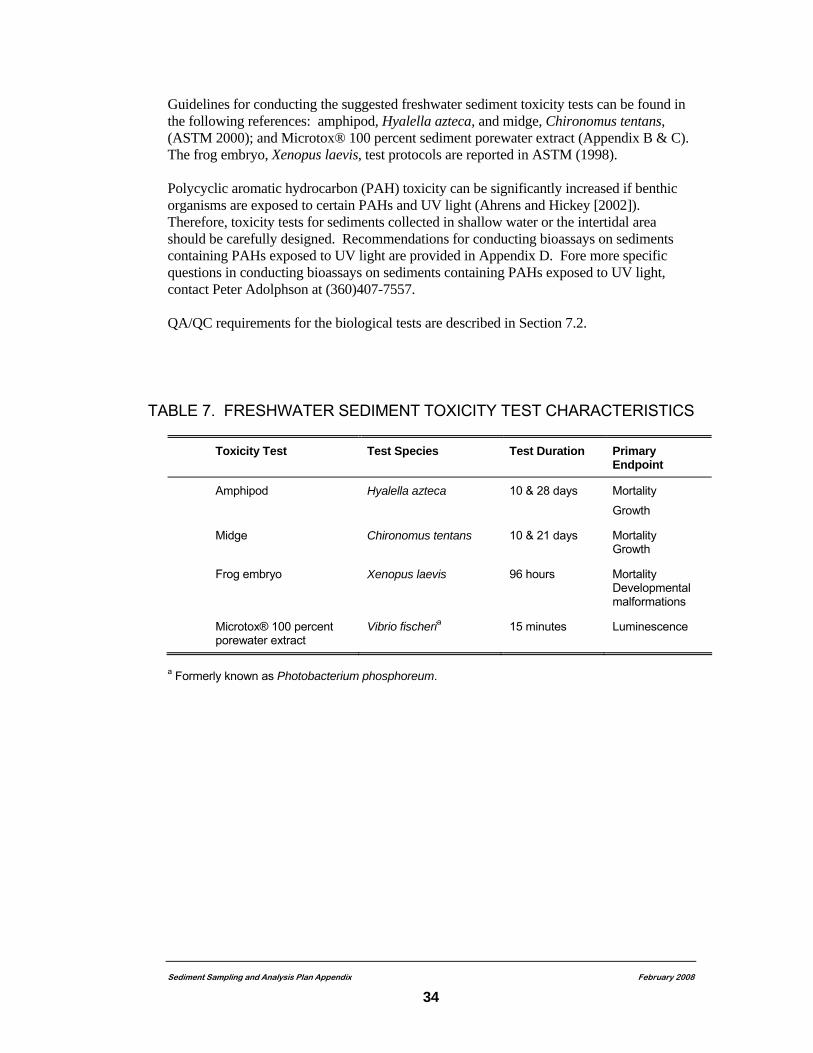
Sediment Sampling and Analysis Plan Appendix February 2008
34
Guidelines for conducting the suggested freshwater sediment toxicity tests can be found in the following references: amphipod, Hyalella azteca, and midge, Chironomus tentans, (ASTM 2000); and Microtox® 100 percent sediment porewater extract (Appendix B & C). The frog embryo, Xenopus laevis, test protocols are reported in ASTM (1998). Polycyclic aromatic hydrocarbon (PAH) toxicity can be significantly increased if benthic organisms are exposed to certain PAHs and UV light (Ahrens and Hickey [2002]). Therefore, toxicity tests for sediments collected in shallow water or the intertidal area should be carefully designed. Recommendations for conducting bioassays on sediments containing PAHs exposed to UV light are provided in Appendix D. Fore more specific questions in conducting bioassays on sediments containing PAHs exposed to UV light, contact Peter Adolphson at (360)407-7557. QA/QC requirements for the biological tests are described in Section 7.2.
TABLE 7. FRESHWATER SEDIMENT TOXICITY TEST CHARACTERISTICS
Toxicity Test Test Species Test Duration Primary Endpoint
Amphipod Hyalella azteca 10 & 28 days Mortality Growth
Midge Chironomus tentans 10 & 21 days Mortality Growth
Frog embryo Xenopus laevis 96 hours Mortality Developmental malformations
Microtox® 100 percent porewater extract
Vibrio fischeria 15 minutes Luminescence
a Formerly known as Photobacterium phosphoreum.
3. FREQUENCY AND TIME OF SAMPLING This section provides guidance on the appropriate frequency and time of sampling for different types of sediment investigations.
3.1 FREQUENCY OF SAMPLING
Certain types of sediment sampling (e.g., baseline monitoring) may occur only once; other types (e.g., SIZ maintenance monitoring, compliance monitoring, or cap monitoring) may occur periodically. In baseline monitoring, a single sampling event will generally suffice to determine the present state of sediment conditions. In situations where baseline monitoring identifies a problem (e.g., exceedance of applicable numerical chemical criteria or biological effects criteria), further sediment sampling and analysis may sometimes be required to define the spatial extent of the problem or to establish gradients that may be useful in interpreting the source of the problem. In other types of sediment investigations where the goal is to establish whether there are temporal changes in sediment conditions, the selection of an appropriate sampling frequency depends on the expected rate of change of sediment conditions. In relatively quiescent marine or estuarine environments away from large sources of sediments such as river deltas, conditions within the surface sediments are unlikely to change appreciably in less than 2 years, even if nearby sources of contaminants are totally eliminated. This slow rate of change is because 1) natural rates of sedimentation are very slow, 2) the sediments are subject to bioturbation by organisms (which may mix relatively clean, newly deposited sediments with more contaminated sediments at greater depth below the sediment surface), and 3) many of the contaminants of interest either are not subject to degradation or are only very slowly degraded in the environment. Therefore, in marine or estuarine areas with very slow rates of sedimentation, a period of 2 or more years may be required for appreciable changes to occur in surface sediment conditions. In freshwater environments, the rate of change in surface sediment conditions may also be relatively slow if there is little flow (e.g., in lakes, reservoirs, or ponds). However, the rate of change may be very rapid in rivers or streams, especially where there are large seasonal fluctuations in flow. Sediments may be deposited near sources during periods of low flow, only to be swept away and redeposited elsewhere during later periods of high flow. Knowledge of the local hydrological conditions is therefore essential in selecting an appropriate sampling frequency in freshwater environments subject to periodic variations in flow.
Sediment Sampling and Analysis Plan Appendix February 2008
35
3.2 TIME OF SAMPLING In many sediment investigations, the time of year when sampling is conducted is generally not an issue. However, factors that could influence the selection of an appropriate time of year may include the following: The seasonal availability of appropriate sediment toxicity test
organisms—As described in Sections 2.2.1.1 and 2.2.1.2, certain test organisms are only available during some times of the year, and, if it is necessary to use those organisms, sampling will have to be scheduled accordingly.
Normal seasonal variations in the abundance of benthic
macroinvertebrate organisms—Benthic macroinvertebrate assemblages are constantly changing over time. Although the ways in which they change over time are not always known in detail, it is preferable to sample when the population estimates are subject to the least natural variability. In Puget Sound, for example, both the numbers of individuals per sample and the variability among stations are lowest in late winter or early spring, making that the best time of the year for sampling benthic macroinvertebrate assemblages (PSEP 1987). Sampling of benthic macroinvertebrate assemblages can certainly occur at other times of the year, but the higher natural variability makes it more difficult to discern differences among stations. It may be necessary, for example, to collect and analyze additional replicate samples to achieve the same statistical power. Regardless of the time of year selected, however, it is essential that all samples being compared (e.g., site stations vs. reference stations, site stations vs. stations sampled historically) be collected at the same time of year. If multi-year temporal trends are of interest, sampling in successive years should be conducted during the same season.
Periodic variations in the quantity or quality of a wastewater discharge—
If the goal is to investigate potential effects of a wastewater discharge, periodic variations in the quantity or quality of the wastewater discharge must be taken into account. For example, sediments in the vicinity of a wastewater discharge from a seasonal food processing plant should be sampled during or soon after periods of high food processing activity.
Tidal stage—In coastal areas, the stage of the tide (e.g., neap tide, spring tide)
may influence selection of the time of sampling, either because of access restrictions to the site (e.g., a large sampling vessel may only have access during high spring tides; sediments may be sampled by personnel on foot during low spring tides) or because of the effect of tidal currents on the sediment regime (e.g., the strongest tidal currents occur during spring tides and may scour the bottom, while periods of neap tides may be relatively quiescent).
River stage—For sediment sampling in riverine environments subject to pro-
nounced seasonal variations in flow, it may be more appropriate to sample
Sediment Sampling and Analysis Plan Appendix February 2008
36
during or near the end of periods of low flow, when sedimentation is more likely to occur. Periods of low flow may also represent the optimal time for sampling if there is reason to believe upland contamination may be migrating to aquatic areas through seeps. Alternatively, periods of high flow may scour away a veneer of relatively clean sediments, exposing more contaminated sediments deposited earlier. Also, drawdown of the water level behind Columbia River dams for fish passage may be an important consideration.
3.3 PHASING OF SAMPLING AND/OR ANALYSES, IF APPROPRIATE In some cases, it may be desirable to conduct certain aspects of a sediment investigation before others. For example, when the results are to be compared with the marine SQS or SIZmax/CSL/MCUL (Table 1), it is often desirable to sample and analyze sediments for chemical contaminants first and then to conduct biological tests only in the event that chemical concentrations exceed applicable numerical criteria. Biological results from a full suite of acute and chronic tests can be used to override a determination based on numerical chemical criteria exceedances alone. The relatively high cost of biological testing generally represents a strong argument against its inclusion unless numerical chemical criteria are exceeded. Nevertheless, it is less time consuming and more economical to collect enough sediment samples during a single sampling event to perform both chemical and biological testing without having to remobilize and resample, when the need for biological testing is needed. This strategy is only practical, however, if the chemical analyses can be conducted and the results evaluated within the maximum holding times of the sediments for biological testing (see Section 6.1). Such a strategy is particularly valuable because both chemical analyses and biological tests can be conducted on subsamples of the same homogenized sediment sample, which facilitates interpretation of the data. If, on the other hand, a separate field sampling effort must be conducted to collect sediments for biological testing, it is generally impossible to resample the exact locations where the previous chemical samples were collected and chemical analyses may need to be repeated to facilitate biological test interpretation. There are at least three situations in which it may not be appropriate to wait for the results of chemical analyses before deciding whether to conduct biological tests. In freshwater environments where there are no adopted numerical chemical criteria under the SMS, Ecology recommends that biological testing be conducted first or concurrently with sediment chemistry to provide a direct assessment of whether there are any adverse biological effects. In marine and estuarine environments, Ecology may require that biological tests be conducted regardless of whether there are any exceedances of numerical chemical criteria in situations where there is reason to believe that there may be other potentially toxic contaminants in the sediments for which there are no numerical criteria. Biological testing may also be recommended if the chemicals of concern have numerical criteria, but there is reason to believe they may be present in a less bioavailable form (e.g., metals in sandblast grit, slag, or paint chips). Ecology has the authority to require such testing under the SMS rule, WAC 173-204. For sediment investigations conducted as part of a sediment cleanup evaluation, consideration may be given to conducting the biological testing before the sediment
Sediment Sampling and Analysis Plan Appendix February 2008
37
Sediment Sampling and Analysis Plan Appendix February 2008
38
chemical analyses. If it can be shown that there are no exceedances of the CSL biological effects criteria, there may be no need to chemically analyze the sediments because the biological results would override any determination based on SMS sediment chemistry criteria alone. If there are exceedances of the CSL biological effects criteria, chemical analyses of the sediments may then be required to attempt to identify the responsible chemical(s), define the spatial extent of contamination, and identify prospective potential liable parties (PLP). The strategy of conducting biological testing prior to and potentially in lieu of chemical analyses is generally not relevant to the sediment source control process, because information on sediment chemical contaminants is necessary to link observed effects to permitted discharges.
3.4 SCHEDULE Each sampling and analysis plan should include a schedule that clearly specifies the time when each element of the sediment investigation will be completed. Elements to be scheduled include: Field mobilization Field sampling Field demobilization Shipment of samples to laboratories Initiation and completion of chemical analyses Initiation and completion of biological testing Initiation and completion of data validation Submittal of draft report to Ecology Submittal of final report to Ecology. Maximum holding times for each type of sample should be explicitly specified. Along with the schedule, a brief discussion should be provided describing the rationale for the frequency, timing, and phasing (if any) of the sediment sampling and analyses.
4. SAMPLING STATION LOCATIONS Selecting locations for sampling is potentially one of the most subjective aspects of designing a sediment monitoring program and, therefore, one of the areas potentially requiring the most guidance. This section provides guidance on locating stations relative to known contaminant sources (e.g., permitted wastewater discharges) or known or suspected areas of sediment contamination, selecting appropriate water depths for sampling stations, and selecting the appropriate depth interval in the sediments to be sampled. A brief discussion is then provided of other factors that should be considered in the selection of appropriate sampling station locations.
4.1 LOCATIONS OF SAMPLING STATIONS RELATIVE TO POINT SOURCES Sediment sampling and analysis is conducted in the vicinity of known point sources (e.g., permitted wastewater discharges) under the sediment source control process to satisfy several purposes (see Section 1.2 of this document for a brief discussion or Chapter 8 of SCUM1 (Ecology 1993) for a detailed discussion). Most sediment investigations under the sediment source control process are expected to be either baseline monitoring or SIZ maintenance monitoring. In the following sections, the selection of appropriate sampling station locations in the vicinity of existing point sources (e.g., permitted wastewater discharges) is discussed in the context of whether it is baseline monitoring or SIZ maintenance monitoring.
4.1.1 Locations of Sampling Stations for Baseline Monitoring In developing baseline monitoring requirements, it is important to understand that the intent of such monitoring is only to determine whether there are current exceedances of SQS in depositional areas likely to be affected by a given discharge and whether those exceedances appear to be caused by the discharge. Baseline monitoring is generally not intended to accurately delimit the area over which there are exceedances of SQS or to definitively link those exceedances to the discharge. Baseline monitoring should provide for detection of such SQS exceedances and determination of whether those exceedances are greater in areas likely to be affected by the discharge or of a more general, area-wide nature, which might suggest contaminant inputs from other local sources. The selection of appropriate sampling station locations for baseline monitoring is highly site-specific. The number of sampling stations is not fixed, but Ecology has found that a range from about 6 to 18 stations will generally suffice for most situations. The following paragraphs provide some examples of station arrays using that range of numbers of stations. For discharges with a low likelihood of sediment impacts (e.g., those with relatively small volumes of wastewater and low concentrations of contaminants), an array of only six stations may suffice if the stations are located along a transect extending from the point of discharge to a point downstream (or in the direction of predominant current flow) sufficiently far away from the discharge to be beyond likely effects of the discharge (Figure 3). If flow is unidirectional (e.g., in a river), it may suffice to have one station of the
Sediment Sampling and Analysis Plan Appendix February 2008
39
transect upstream of the discharge to define background conditions. If flow is bidirectional (e.g., as in many Puget Sound marine environments where tidal currents predominate), the six stations might be arrayed along a transect spanning the discharge along the axis of predominant current flow. In general, these stations will be at a similar depth because currents typically flow along contours of equal depth. For discharges with a high likelihood of sediment impacts (e.g., those with relatively large volumes of wastewater and high concentrations of contaminants), or for discharges to more complex receiving environments, it may be necessary to have two to three transects, each with up to six stations extending out from the point of discharge (Figure 3). The appropriate spacing of stations along a transect will vary with both the volume of the discharge and the velocity of currents in the vicinity of the discharge. In the case of minor discharges and relatively weak currents, the entire transect may be on the order of several tens of meters in length. As the volume of the discharge or the velocity of currents in the receiving water increases, the length of the transect should increase. For the very largest volume discharges (e.g., major municipal sewage discharges of approximately 100 million gallons per day) to receiving waters with significantly stronger currents, an appropriate transect could be on the order of hundreds of meters in length. If the current in the immediate vicinity of the discharge is so strong that sediments are unlikely to accumulate there, the stations may not be positioned along a transect at all, but rather clustered in the nearest depositional area where sediments are likely to accumulate. In rivers and certain estuarine environments with strong currents, such depositional areas may be far removed from the point of discharge. Site-specific conditions will modify these general guidelines. For example, an appropriate baseline monitoring program for a permittee with multiple points of discharge all within the same general vicinity may require a larger number of stations, spread throughout the entire area, but not at the same station-to-discharge ratio as for an isolated single discharge. Figure 4 provides several examples of how stations might be positioned for a discharge with a moderate likelihood of sediment impacts, using a total of 10 stations, both with and without multiple points of discharge. A single point discharge into a complex receiving environment with multiple contaminant sources in the local area may require a larger number of stations arrayed along transects extending away from the single point discharge in the direction of other known or suspected contaminant sources. Without such a grid of stations, it would be impossible to evaluate whether any observed exceedances of applicable standards or criteria are attributable to a given discharge. For any such complex situations, the project proponent should work closely with Ecology on the development of appropriate sampling station locations.
4.1.2 Locations of Sampling Stations for SIZ Maintenance Monitoring The purpose of SIZ maintenance monitoring is to demonstrate that sediments within an authorized SIZ do not exceed the SIZmax numerical chemical criteria (Table 1), the SIZmax biological effects criteria (Table 2), or other SIZmax chemical or biological criteria established in the SIZ authorization. Furthermore, it is necessary to demonstrate that sediments beyond the authorized SIZ do not exceed the SQS numerical chemical criteria (Table 1), the SQS biological effects criteria (Table 2), or other SQS chemical or biological
Sediment Sampling and Analysis Plan Appendix February 2008
40
criteria established in the SIZ authorization. Hence, it is equally important to sample both within and just beyond the authorized SIZ. Although it is difficult to provide detailed guidance on the selection of appropriate sampling station locations for SIZ maintenance monitoring, it is possible to define the range of possible scenarios. For relatively small discharges in an area removed from other potential contaminant sources, an appropriate maintenance monitoring program might include approximately six stations (Figure 5). Although some discretion would be appropriate, four of the six monitoring stations should be placed within the SIZ and one each of the remaining two stations should be placed on opposite sides of the discharge, just beyond the SIZ, along the axis of predominant current flows.
For relatively large discharges or for those in an area where there are other nearby contaminant sources, an appropriate maintenance monitoring program might include as many as 15 stations (Figure 5). As many as nine of the monitoring stations might be placed within the SIZ for discharges far removed from other contaminant sources. However, if there are other nearby contaminant sources, it might be appropriate to position fewer stations within the SIZ, with the remaining stations arrayed along transects extending from just beyond the SIZ toward other contaminant sources, to investigate possible gradients in contaminant concentrations. The higher density of stations is warranted for major discharges to establish patterns of sediment contamination, investigate potential impacts from other contaminant sources, and collect representative samples of sediments within the potentially larger SIZ.
The locations of some maintenance monitoring stations may be selected to confirm predictions of the SIZ model. In some cases, the size of the authorized SIZ may be determined based on existing conditions but, because of expected decreases in contaminant loading as a result of upgrading the wastewater treatment, the area exceeding the SQS numerical criteria may be expected to decrease in the future. In such cases, some of the maintenance monitoring stations within the SIZ should target the area between the initially authorized SIZ and the area expected to exceed SQS numerical criteria under the improved discharge conditions. In other cases, the size of the authorized SIZ may be determined based on SIZ model predictions using higher loading rates than those at present. In such cases, the area currently exceeding the SQS numerical criteria may be expected to increase in the future, and some of the maintenance monitoring stations within the SIZ should target the area immediately beyond the sediments currently exceeding the SQS numerical criteria to confirm the SIZ model predictions. In all cases, some of the maintenance monitoring stations should be located just beyond the authorized SIZ boundary, because exceedances of SQS numerical or biological effects criteria beyond the SIZ that were attributable to the discharge would represent a violation of the SIZ authorization.
Sediment Sampling and Analysis Plan Appendix February 2008
41
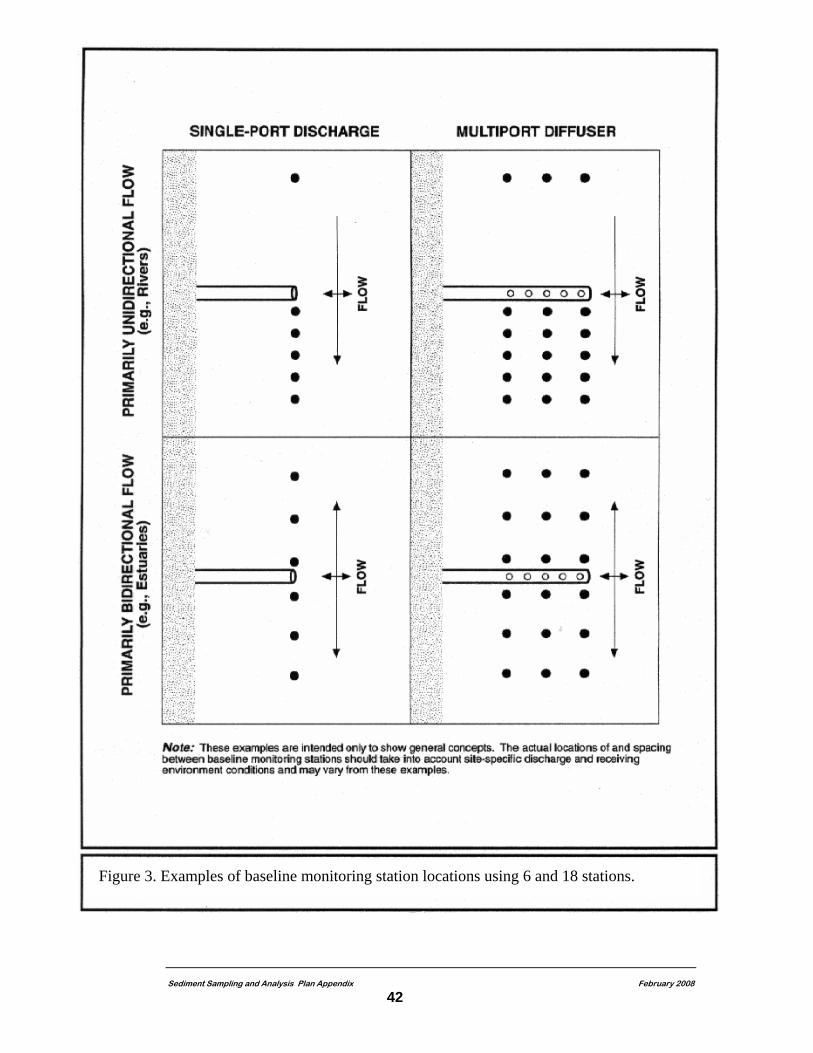
Sediment Sampling and Analysis Plan Appendix February 2008
42
Figure 3. Examples of baseline monitoring station locations using 6 and 18 stations.
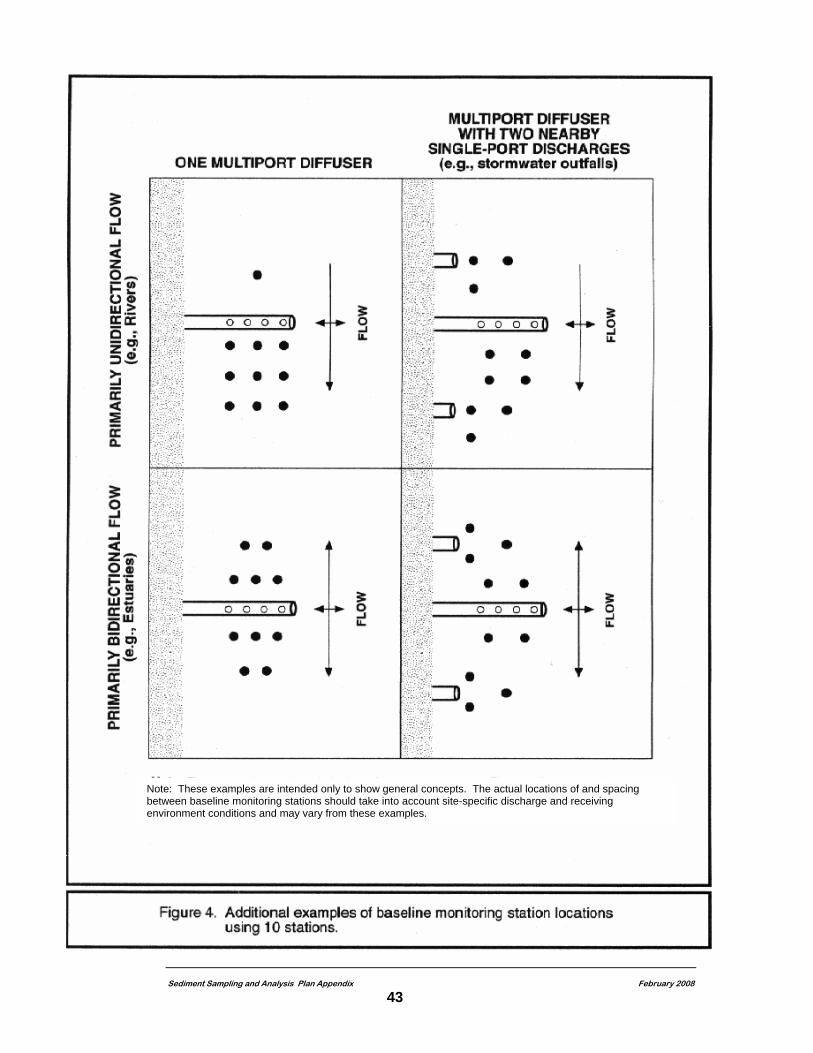
Sediment Sampling and Analysis Plan Appendix February 2008
43
Note: These examples are intended only to show general concepts. The actual locations of and spacing between baseline monitoring stations should take into account site-specific discharge and receiving environment conditions and may vary from these examples.
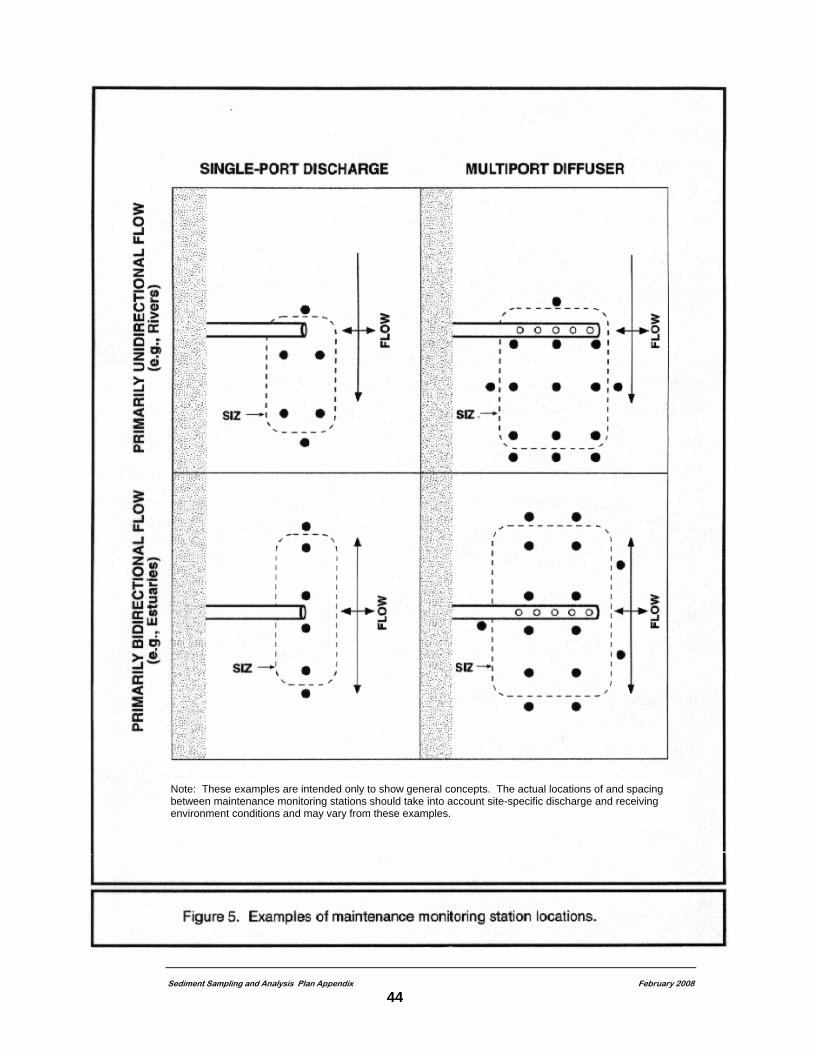
Sediment Sampling and Analysis Plan Appendix February 2008
44
Note: These examples are intended only to show general concepts. The actual locations of and spacing between maintenance monitoring stations should take into account site-specific discharge and receiving environment conditions and may vary from these examples.
4.2 LOCATIONS OF SAMPLING STATIONS RELATIVE TO
KNOWN OR SUSPECTED AREAS OF SEDIMENT CONTAMINATION The selection of appropriate sampling station locations for studies of areas of sediment con-tamination depends on whether the study is an initial investigation to determine whether there is sediment contamination (e.g., initial site investigation, due diligence [property transfer] investigation where sediment contamination is suspected) or a sediment cleanup investigation (e.g., where the existence [but not the spatial extent] of sediment con-tamination has already been documented).
4.2.1 Locations of Sampling Stations for an Initial Investigation of
Sediment Contamination For initial investigations of sediment contamination where there is no prior information available on sediment quality conditions, the appropriate number and locations of sampling stations will be largely dependent on site characteristics. Because station clusters of potential concern are defined in the SMS on the basis of sediment conditions at a minimum of three stations, it is necessary to locate at least three stations in any discrete area for which a decision is to be made. If the area is large or complex, more than three stations will generally be required to adequately characterize sediment conditions. If nothing is known about past uses of the site and there are no obvious sources of sediment contaminants, the stations may be placed randomly throughout the area. In most cases, however, available site information will provide an indication of areas that should be targeted for sediment sampling. The following guidelines should then be used in selecting appropriate sampling station locations: If there are areas of known or suspected upland soil contamination, some
stations should be placed adjacent to the shoreline, either evenly spaced or focused on areas adjacent to upland areas with high soil contamination.
Sampling stations should be placed in the vicinity of current or historic point
source discharges, including wastewater outfalls, storm drains, combined sewer overflows, oil/water separators, or ditches carrying runoff. If those point sources are located in an area of high flow (e.g., in rivers), it may be necessary to sample instead at the nearest area(s) where sediment deposition is likely to occur.
Sampling stations should be placed in the vicinity of loading docks,
particularly if pipelines carrying oil or other products were or are present. The sampling stations should be placed along the length of the dock where the pipelines were or are present, with some stations placed as close as possible to manifold or loading areas on the dock or at the shoreline.
If there are areas along the shoreline where boats were refueled, sandblasted,
or maintained, sampling stations should be placed offshore of those areas.
Sediment Sampling and Analysis Plan Appendix February 2008
45
Where groundwater is known or suspected to be contaminated, sampling stations should be placed in any areas (usually intertidal or shallow subtidal) where groundwater may be discharged to the water body (i.e., seeps).
Sampling stations should be placed in any areas where it is known or
suspected that wastes were discharged, spilled, or otherwise released. In leased areas and/or if upstream or general areawide contamination is
suspected, sampling stations should be placed along the property boun-daries.
If sediment toxicity testing is to be conducted, one or more reference stations
should also be sampled to match the sediment grain size of the site sediments. If benthic macroinvertebrate community assemblages are to be evaluated, water depths at reference area and site stations should be similar. Ecology may also allow use of benthic administrative reference performance standard on a case-by-case basis.
Sampling stations should be placed in depositional areas and/or areas shown to
have accumulated sediments over time (e.g., where bathymetric surveys show net accumulation over time).
4.2.2 Locations of Sampling Stations for a Sediment Cleanup Investigation For investigations where there is information available indicating that the sediments are contaminated, the appropriate number and locations of sampling stations should be selected to address the following objectives: Stations should be placed in any areas suggested for an initial investigation
(Section 4.2.1), if those areas have not been sampled previously. Stations should be placed to determine the spatial boundaries of the area
within which CSL numerical criteria (Table 1) or CSL biological effects criteria (Table 2) are exceeded. Stations should be placed closely enough together to provide a reasonably accurate estimate of the area(s) that might need to be considered for active remediation (e.g., dredging or capping). If practical, the areas where the SQS numerical criteria (Table 1) or SQS biological effects criteria (Table 2) are exceeded should also be determined.
Additional stations may be useful to identify gradients in contamination or the
sources of contaminants. Differentiation among various sources of the sediment contaminants is important to determine whether their areas of influence overlap or are separate, to establish whether there has been sufficient source control to proceed with cleanup, and to allocate liability among multiple parties.
Sediment Sampling and Analysis Plan Appendix February 2008
46
The use of sediment cores at selected stations will be necessary for calculation of the volume of contaminated sediments that must be considered for remedial alternatives that include dredging. Core samples may also be collected and dated to estimate sediment deposition rates (sediment traps also may be used) if a natural recovery evaluation or an evaluation of the potential for recontamination is needed. Analysis of both lead-210 and cesium-137 is highly recommended to assist in the interpretation of core dating results. Cores collected to evaluate the depth of contamination and cores collected for dating normally have different compositing intervals and analyses, and generally cannot be used for both purposes.
In rivers or other dynamic areas, downstream sampling in depositional areas
may be needed if such areas are removed from the original sources. A field survey of grain size and other sediment characteristics such as TOC may be helpful in identifying such areas.
In general, it is highly recommended that each station be specifically located to accomplish one or more of the above objectives, and that the purpose of each station is described in the sampling plan or work plan. This will help minimize the number of samples needed and will ensure that the objectives of sampling are clearly understood by all involved.
4.3 WATER DEPTH The depth of water at a given sampling station is an important consideration. After sampling stations have been located in close proximity to a specific area of interest (e.g., at the point of discharge from an outfall, at the location of an area of presumed sediment con-tamination), it is generally advisable to position additional stations with which the site stations will be compared (e.g., along a transect extending away from the source) at similar depth(s) because currents typically flow along contours of equal depth, rather than across them. Reference area stations for benthic macroinvertebrate investigations should also be at a similar depth to any site stations that they will be compared with because benthic macroinvertebrate assemblages are known to be stratified by depth. It is not important, however, that reference area sediments for use in sediment toxicity tests be collected from depths similar to those of the site stations. Although the guideline of locating stations to be compared with one another at similar depths is generally applicable, it will not always be possible to do so. For example, a grid of stations within an authorized SIZ or within an area of suspected sediment contamination may include stations at various depths. Also, transects designed to investigate potential gradients in sediment conditions between two point sources will, of necessity, include stations at different depths if the point sources are at different depths. Therefore, some flexibility in this general guideline will often be necessary.
4.4 DEPTH INTERVAL IN THE SEDIMENTS TO BE SAMPLED The numerical chemical criteria and biological effects criteria of the SMS (i.e., the SQS, SIZmax, CSL, and MCUL criteria; Tables 1 and 2) are to be used to characterize the condition of “surface sediments,” which are defined by the SMS as “the settled particulate
Sediment Sampling and Analysis Plan Appendix February 2008
47
matter located in the predominant biologically active aquatic zone,” or “the settled particulate matter exposed by human activity (e.g., dredging) to the biologically active aquatic zone or the water column.” Both the sediment source control process and the sediment cleanup process are therefore focused on assessing the condition of sediments where there may be a pathway to ecological or human receptors. Contamination of sediments at depths below the biologically active zone is generally not of as great a concern unless there are mechanisms for the release of the contaminants from the sediments such that exposure may occur. Past studies in Puget Sound have demonstrated that the majority of benthic macroinvertebrates are generally found within the uppermost 10 cm of the sediments. While some species may be found at deeper depths below the sediment surface, 10 cm is generally assumed to represent a reasonable estimate of the biologically active zone. Although information such as the vertical distribution of benthic macroinvertebrates or the depth to anoxic sediments could be gathered for each site to be investigated to attempt to delimit the biologically active zone, this procedure is generally not practical. In the absence of site-specific information to the contrary, Ecology has routinely been requiring sampling of the uppermost 10 cm of sediments for comparisons with the applicable criteria. If a project proponent believes that site-specific conditions warrant consideration of a different depth of the biologically active zone, they may submit data to Ecology in support of such a contention. In some cases, monitoring data may be used to interpret temporal changes in sediment conditions. Such cases may include, for example, ambient monitoring programs, monitoring of conditions in the vicinity of a permitted discharge, or monitoring of a cap placed over contaminated sediments as part of remediation. In such cases, it would be appropriate to limit the sampling to the uppermost 2 cm of sediments, which would represent the most recently deposited particulate matter. If deeper (e.g., 10 cm) sediment samples were collected and analyzed, older sediments would be included in the samples, making it more difficult to detect temporal changes in sediment conditions. The targeted depth of sediments to be sampled may influence the selection of appropriate sampling station locations because sediment grain size may vary spatially and affect the ability to collect samples from the targeted depth with the available sampling gear. The targeted depth of sediments to be sampled will also influence the selection of the most appropriate sampling gear (see Section 5.2.3). In sediment cleanup investigations, it will often be important to characterize sediment conditions below the biologically active zone to estimate the volume of sediments potentially requiring remediation. In general, it will be necessary to sample the sediments over the entire depth of suspected contamination, as well as to characterize the sediments just below the contaminated sediments, to predict the condition of surface sediments if the overburden is to be removed as part of remediation. Factors to be considered in assessing the depth of sediments that may be contaminated include: The depth of the sediment layer potentially subject to anthropogenic
influences (e.g., the depth of sediments that have accumulated over a known horizon such as the maximum dredged depth within a navigation channel or berth)
Sediment Sampling and Analysis Plan Appendix February 2008
48
Sediment Sampling and Analysis Plan Appendix February 2008
49
The depth of sediments potentially affected by historical activities, recent activities, or ongoing activities
Local sedimentation rates The potential for disturbance or exposure of the sediments, either through
intentional (e.g., maintenance or remedial dredging), unintentional (e.g., propeller scour, log-raft grounding), or natural (e.g., erosion) means
The pathway for introduction of the sediment contaminants (e.g., a one-time
spill, a long-term discharge, groundwater intrusion).
4.5 OTHER FACTORS TO BE CONSIDERED IN THE SELECTION OF SAMPLING STATION LOCATIONS Several additional factors may need to be considered in the selection of appropriate sampling station locations. To be most useful, reference area sediment samples for sediment toxicity tests or for evaluations of benthic macroinvertebrate assemblages should be collected from locations where the sediment grain size and organic content are similar to those in sediments with which they will be compared. Information on the sediment grain size, organic content, and contaminant concentrations of selected Puget Sound reference areas is available in PSEP (1991). Ecology recommends use of reference sediment stations from those areas for all Puget Sound investigations. Freshwater sediment biological tests are often compared against laboratory negative control sediments because recommended freshwater reference areas have not been identified However, Ecology may approve the use of freshwater reference stations on a case-by case basis. If used, reference stations for freshwater sediment investigations should be selected to match site stations as closely as possible, with the exception of documented contamination. Accordingly, they should be placed as far as practical from known or suspected contaminant sources. Depending on the purpose of the sediment investigation, it may be prudent to avoid locating sampling stations within areas that have recently been dredged, capped, or otherwise affected by construction activities. Factors such as bottom slope, currents, vessel traffic, and debris or obstructions on the bottom may also affect the ability to collect sediment samples from a given area and should, therefore, be considered in the selection of appropriate sampling station locations. In some cases, such factors may preclude sampling within an area of interest. In other cases, careful planning of the timing of sampling may allow access to locations during periods of slack currents or reduced vessel traffic.
5. FIELD SAMPLING METHODS This section provides guidance on the selection of appropriate field sampling methods for sediment investigations. Included are discussions of station positioning methods, sampling equipment, decontamination procedures, sample compositing, sample containers and labels, field documentation, and disposal of contaminated sediments.
5.1 STATION POSITIONING Station locations for sediment sampling should generally be accurate to within ±3 m. The sampling location shall be referenced to the actual deployment location of the sampler. Available station positioning methods are described in detail in PSEP (1998). Among the methods described therein, all, with the exception of Loran-C and variable range radar, have the capability of achieving this level of accuracy. Achieving that level of accuracy with a sextant is likely only possible near shore where the locations of fixed objects on shore are precisely known. Although they are capable of very high accuracy, many of the electronic positioning systems described in PSEP (1998) require manned or unmanned shore stations that must be accurately surveyed. Consequently, they are relatively costly. Most electronic positioning systems are also limited to line-of-sight, which may be impractical in confined locations. Recent advances in global positioning systems (GPS) use satellite telemetry to accurately report position information. Differential global positioning system (DGPS), which uses a reference receiver to greatly enhance the accuracy of standard GPS, is widely available and much less expensive. DGPS units now commercially available are capable of absolute accuracies less than 1 m. Some environmental consulting firms and vessel operators have purchased such equipment, which, if available, is now the station positioning method of choice. DGPS systems are also available for rent from various vendors on a short-term basis. For smaller sediment investigations, other electronic station positioning methods will achieve a similar level of accuracy, but these methods may not be as cost-effective for larger sediment investigations. For hard-to-reach areas such as under piers or other structures that may be out of line-of-sight, distances can also be measured using tape or other means from known surveyed points or structures. Station locations should be reported in latitudes and longitudes0 . (to the nearest hundredth of a second) or in state plane coordinates, and the North American datum (NAD) used should be specified. Ecology has recently revised its standard datum from NAD 1927 south zone to NAD 1983 south zone.
5.2 SAMPLING EQUIPMENT In all sediment investigations, the primary goal of sediment sampling is to collect a sample that accurately represents the sediment condition in situ. The sampling equipment selected to collect the sediment samples will depend on the study objectives, the numbers and types of analyses required, the available sampling vessel, weather conditions, the type(s) of sediment being collected, and the depth to which sediment is to be sampled.
Sediment Sampling and Analysis Plan Appendix February 2008
50
Sediment Sampling and Analysis Plan Appendix February 2008
51
There are two general types of sediment samplers: surface sediment samplers and subsurface sediment corers. Collection of surface sediment samples is usually required for physical and chemical analyses and biological tests. Sediment corers can provide samples and profiles of subsurface sediments in which in situ conditions are preserved, although the surface layer may be disturbed by some types of corers immediately prior to impact by the water pushed ahead by the corer. Distortion caused by compaction of the sediment during collection can also occur. Sediment corers are most often used for assessment of chemical concentrations in subsurface sediments and for bulk characterization of sediments for evaluation of dredging and disposal options. Although rotary drilling methods would also be capable of collecting long sediment cores, even in areas with consolidated sediments, they have only rarely been used in sediment investigations because of the greater cost of a drilling rig and the size of vessel required to support such a rig. The advantages and disadvantages of various sediment samplers are summarized in Table 8. In-depth discussions of sediment samplers can be found in Baudo (1990), Burton (1992), Mudroch and MacKnight (1991), APHA (1989), and ASTM (2002). An overview of the two general types of sediment samplers is presented in the following sections.
5.2.1 Surface Sediment Samplers Surface sediment samplers are usually designed as a box with a set of jaws, or a rotating bucket, that takes a wedge-shaped bite out of the surface sediment. These samplers allow the collection of small or large sample volumes and can be effective for a wide range of surface sediment types. They are easy to use, and the smaller grab samplers allow hand deployment and retrieval from a small boat. Grab samplers generally do not disturb the surface sediment significantly unless they overpenetrate. Penetration depth of grab samplers can be highly variable, depending on sampler design and sediment composition. Disadvantages of the grab sampler include the uncertainty of the depth of sediment penetration and the loss of sample integrity when the sampler is retrieved and opened. Box corers, which consist of a metal box with a closing mechanism to seal the bottom of the core, overcome these disadvantages but are generally heavier and require a winch and a larger sampling vessel. When selecting a surface sediment sampler, the method of retrieval, the type of sediment, the required sample volume, and the strength of currents at the site should be considered.
5.2.2 Subsurface Sediment Corers Sediment coring is generally accomplished by inserting a cylindrical tube into the sediment, closing the top of the tube, and withdrawing a sediment core. Subsurface sediment corers differ greatly in size and complexity. Small push corers and small gravity corers can be retrieved by hand and used from a small boat. Larger and more complicated corers such as piston corers, vibracorers, and impact corers require a lifting boom, a winch, larger sampling vessels, and more field crew. Problems in sediment coring are often associated with inadequate sediment penetration, core distortion, or inadequate core retention during corer retrieval. Heavy weights or vibrations applied to the core tube can improve penetration in dense sediments. Various types of core “catchers” installed at the lower end of the core tube can prevent sample loss in unconsolidated sediments; however, these catchers can also impede penetration in compacted sediment as well as disrupt surface sediments. Corer deployment can also be difficult under certain conditions. It may be necessary to 3-way anchor the sampling vessel to maintain a steady position while the corer pene-

Sediment Sampling and Analysis Plan Appendix February 2008
52
trates into the sediment. Trying to core in a strong current or wind, even with the vessel properly anchored, can result in the corer entering the sediment at an angle or core tubes being bent during retrieval.
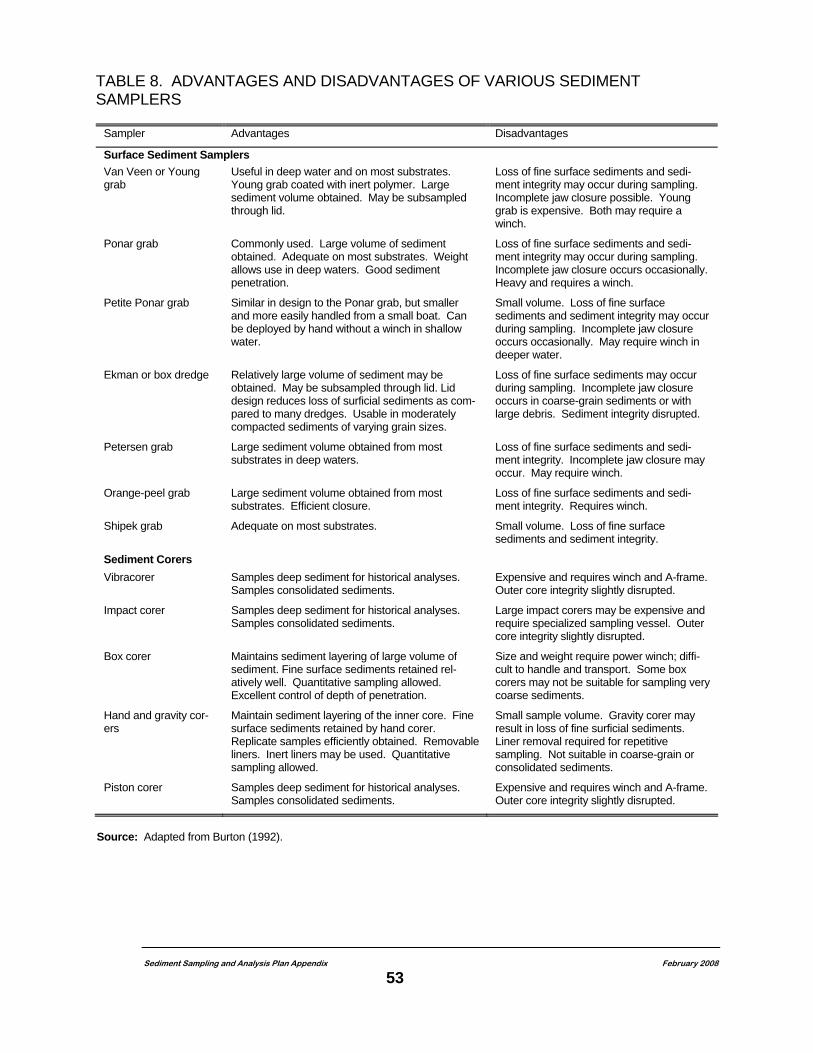
Sediment Sampling and Analysis Plan Appendix February 2008
53
TABLE 8. ADVANTAGES AND DISADVANTAGES OF VARIOUS SEDIMENT SAMPLERS
Sampler Advantages Disadvantages
Surface Sediment Samplers Van Veen or Young grab
Useful in deep water and on most substrates. Young grab coated with inert polymer. Large sediment volume obtained. May be subsampled through lid.
Loss of fine surface sediments and sedi-ment integrity may occur during sampling. Incomplete jaw closure possible. Young grab is expensive. Both may require a winch.
Ponar grab Commonly used. Large volume of sediment obtained. Adequate on most substrates. Weight allows use in deep waters. Good sediment penetration.
Loss of fine surface sediments and sedi-ment integrity may occur during sampling. Incomplete jaw closure occurs occasionally. Heavy and requires a winch.
Petite Ponar grab Similar in design to the Ponar grab, but smaller and more easily handled from a small boat. Can be deployed by hand without a winch in shallow water.
Small volume. Loss of fine surface sediments and sediment integrity may occur during sampling. Incomplete jaw closure occurs occasionally. May require winch in deeper water.
Ekman or box dredge Relatively large volume of sediment may be obtained. May be subsampled through lid. Lid design reduces loss of surficial sediments as com-pared to many dredges. Usable in moderately compacted sediments of varying grain sizes.
Loss of fine surface sediments may occur during sampling. Incomplete jaw closure occurs in coarse-grain sediments or with large debris. Sediment integrity disrupted.
Petersen grab Large sediment volume obtained from most substrates in deep waters.
Loss of fine surface sediments and sedi-ment integrity. Incomplete jaw closure may occur. May require winch.
Orange-peel grab Large sediment volume obtained from most substrates. Efficient closure.
Loss of fine surface sediments and sedi-ment integrity. Requires winch.
Shipek grab Adequate on most substrates. Small volume. Loss of fine surface sediments and sediment integrity.
Sediment Corers Vibracorer Samples deep sediment for historical analyses.
Samples consolidated sediments. Expensive and requires winch and A-frame. Outer core integrity slightly disrupted.
Impact corer Samples deep sediment for historical analyses. Samples consolidated sediments.
Large impact corers may be expensive and require specialized sampling vessel. Outer core integrity slightly disrupted.
Box corer Maintains sediment layering of large volume of sediment. Fine surface sediments retained rel-atively well. Quantitative sampling allowed. Excellent control of depth of penetration.
Size and weight require power winch; diffi-cult to handle and transport. Some box corers may not be suitable for sampling very coarse sediments.
Hand and gravity cor-ers
Maintain sediment layering of the inner core. Fine surface sediments retained by hand corer. Replicate samples efficiently obtained. Removable liners. Inert liners may be used. Quantitative sampling allowed.
Small sample volume. Gravity corer may result in loss of fine surficial sediments. Liner removal required for repetitive sampling. Not suitable in coarse-grain or consolidated sediments.
Piston corer Samples deep sediment for historical analyses. Samples consolidated sediments.
Expensive and requires winch and A-frame. Outer core integrity slightly disrupted.
Source: Adapted from Burton (1992).
Sediment Sampling and Analysis Plan Appendix February 2008
54
5.2.3 Recommended Sampling Equipment In shallow water that would be inaccessible to the large vessels required for deploying large grab samplers or sediment corers, collection of sediment samples is generally accomplished through the use of small grab samplers that can be operated by hand or through the use of hand-held sediment corers. In deeper water accessible to large sampling vessels with power winches, the most commonly used grab sampler in sediment investigations in the Puget Sound region is the modified 0.1-m2 Van Veen grab sampler. This grab sampler achieves good penetration (generally 10–20 cm in soft sediments), with minimal disturbance of the sediment surface, and is the recommended sampling equipment for collection of shallow surficial sediments (e.g., 0–2 cm). Recommended procedures for using sediment grab samplers are described in detail in the PSEP protocols (PSEP 1986). Sediment samples collected with a grab sampler should be carefully inspected to ensure that the following acceptability criteria are satisfied: The sampler is not over-filled with sample so that the sediment surface is
pressed against the top of the sampler Overlying water is present (indicates minimal leakage) The overlying water is not excessively turbid (indicates minimal sample
disturbance) The sediment surface is relatively flat (indicates minimal disturbance or win-
nowing) The desired penetration depth is achieved (e.g., several centimeters more than
the targeted sample depth). If a sediment sample does not meet all of these criteria, it should be rejected. Any sediment grab sampler proposed for use should be capable of achieving these acceptability criteria. In coarse, sandy sediments, the Van Veen grab may not yield sufficient penetration if the goal is to sample the upper 10 cm or so of the sediments. In that case, it may be necessary to employ a box corer, which is generally capable of acquiring relatively undisturbed sediment cores up to several tens of centimeters in depth. Box corers, however, are usually larger and heavier, requiring a larger sampling vessel for deployment. If the goal is collection of longer sediment cores, use of either vibracorers or impact corers is recommended.
Sediment Sampling and Analysis Plan Appendix February 2008
55
5.3 DECONTAMINATION PROCEDURES Procedures for decontaminating field sampling equipment are briefly described in PSEP (1997c). Some methods recommended therein (e.g., use of methylene chloride as a solvent) are no longer recommended. In general, decontamination procedures for field sampling equipment should include scrubbing the equipment with a brush and phosphate free detergent solution (e.g., AlconoxTM), rinsing with clean site water, rinsing with solvent (acetone, followed by hexane, is often recommended) and/or acid, and rinsing again with clean site water (for marine or estuarine investigations) or with deionized water (for freshwater investigations). The solvent rinse should be omitted if the samples are to be analyzed for volatile organic compounds. It is generally not necessary for sampling equipment to be decontaminated between collecting composite sediment samples from a single station. Decontamination procedures routinely applied in analytical laboratories (e.g., use of a hot water rinse) may represent an unnecessary burden in the field. Because the recommended field decontamination procedures are less rigorous, other precautions can be taken to minimize sample contamination. For example, it is generally recommended that the sediments collected for chemical analyses be collected away from the surfaces of the sampling device, thus minimizing the possibility of contaminating a sample with any residues left on the sampling device from earlier sampling. If the general distribution of contamination is known, the potential for cross-contamination can also be reduced by sampling the cleaner sites first and working into areas of highest contamination last. It should be recognized that most sediment sampling gear is lowered through the water column prior to collection of the sediment sample, so the surface of the sampling device will come in contact with potentially contaminated water overlying the sediment surface.
5.4 SAMPLE COMPOSITING Ideally, chemical analyses should be conducted on discrete sediment samples collected from a single cast of the sampling device at each station. In practice, it is often necessary to collect more than one cast of sediment sample per station when the proposed analyses (including chemical analyses, physical analyses, and toxicity testing) require larger volumes of sediment from the targeted depth (e.g., 0–10 cm) than can be acquired in a single cast of the sampling device. In such cases, multiple casts of the sampling device should be made at the same station, taking care to sample as close as possible to other casts at that station. Sediments collected from the targeted depth with each cast of the sampling device should be combined with the other sediments collected from that depth at that station and, after removal of unrepresentative material (e.g., woody debris, shells, rocks) at the discretion of the chief scientist, homogenized to a uniform appearance by stirring. Subsamples should then be taken from this composite sediment sample for chemical analyses, physical analyses, and toxicity testing. There are two cases when sediments collected for analysis should not be composited and/or homogenized. First, sediment samples collected for the analysis of potentially volatile chemicals (e.g., total sulfides, volatile organic compounds) should be taken from the sampling device immediately after retrieval and placed in appropriate sample containers prior to homogenization and subsampling for other analyses. Second, sediment samples collected for the analysis of benthic macroinvertebrate community assemblages should be
Sediment Sampling and Analysis Plan Appendix February 2008
56
handled as separate and distinct replicates and never be homogenized. Each cast of the sampler should be treated as a separate replicate and should be sieved in its entirety in the field. Sieving the entire sediment sample preserves the spatial representativeness of the benthic sample, which is vitally important because the abundances are expressed as numbers per unit area. Sediment required for chemical analyses, physical analyses, or toxicity testing should be collected in one or more casts of the sampling device separate from those used for sampling benthic macroinvertebrates at that station.
5.5 SAMPLE CONTAINERS AND LABELS Different amounts of sediment are required for different types of analyses (Table 9). In designing a sediment investigation, the total amount of sediment required from a given station should be calculated given the types of analyses that will be required. The total amount of sediment to be required will have an effect on the selection of appropriate field sampling equipment, the time required for collection of the samples, and on the provision of appropriately sized field equipment (e.g., bowls for homogenizing the sediments). Allowance should be made for collecting additional sediment that may be required for field duplicate samples, laboratory QA/QC samples, repeated analyses in the case of laboratory error or failure of a toxicity test, and archiving of sediment samples for future analyses, if appropriate. Consideration may be given to collecting twice the volume of sediments required for toxicity tests. Half of these sediments could be archived so that if the tests need to be rerun, resampling will not be necessary. For sediment investigations requiring a broad spectrum of chemical and biological analyses, the total volume of sediments may be rather large (10 L or more). Depending on the depth of sediments to be collected and analyzed, this total amount will, in most cases, require multiple casts to be made with the sampling equipment at each station. The appropriate types of sample containers depend on the analyses to be conducted (Table 9). If the same laboratory is to perform a number of the analyses, it is not necessary for each type of analysis to have a separate sediment sample jar; two or more sediment subsamples from the same station may be combined in a single sample jar as long as the required container types are the same (Table 9) and the sample preservation methods and maximum holding time are compatible (Table 10). The analytical laboratory should be consulted for guidance on which subsamples are appropriate to combine in the same jar. In most cases, the analytical laboratory should be responsible for providing the sample jars and ensuring that the jars have been cleaned and prepared in accordance with methods described in the PSEP protocols (PSEP 1997c). Self-adhesive labels should be attached to the outside of all sediment sample containers. The following information should be provided on each sample label in waterproof ink: a sample identification number, the site or project name, the station number, sampling date and time, sampling personnel, and preservative (if appropriate). Benthic macroinvertebrate samples that have been sieved and preserved with formalin should be inserted into sample containers with labels completed as above.
5.6 FIELD DOCUMENTATION
Sediment Sampling and Analysis Plan Appendix February 2008
57
To ensure proper record keeping, most environmental consulting firms or others who regularly conduct sediment investigations have standardized forms for recording field activities. Although the content of such forms may vary, the following represents a suggested list of appropriate forms: Field log—General information such as the names of the field crew, arrival
and departure dates and times, weather, and other miscellaneous obser-vations should be recorded in a field log.
Station/sample log—Each gear deployment event should be recorded on a
station log sheet. One or more station/sample log sheets may be completed for each station where sediment sampling is conducted. The station name, date, time, gear and cast number, water depth, and location coordinates should be recorded on each log sheet. Penetration depth, sediment type, sediment color, sediment odor, presence of any organisms, and obvious evidence of contamination (e.g., sheen, wood waste, oil droplets, sandblast grit, paint chips) should also be recorded, as well as the sample type, sample identifier, and unique sample number. If any materials such as woody debris, shells, or rocks are removed prior to homogenizing the sample, the type of material and approximate quantity should be noted. Any deviations from the sampling and analysis plan that were necessitated by field conditions should also be noted on the station/sample log sheet.
Sample analysis request form—Each set of samples sent to a laboratory
should be accompanied by a sample analysis request form that identifies the samples by their unique identification number. This form should identify any preservative or other sample pretreatment applied and the analyses to be conducted by referencing a list of specific analytes or the statement of work for the laboratory. One copy of this form should be retained by the chief scientist, and one copy should accompany the shipment of samples to the laboratory.
Chain-of-custody form—See Section 6.2. It should be the responsibility of the chief scientist to see that all of the necessary forms are completed accurately and that all pertinent information is recorded.
5.7 DISPOSAL OF CONTAMINATED SEDIMENTS In most sediment investigations, it is generally considered acceptable practice to return excess sediments collected and not needed for analysis to the water at the station where they were collected. Sediments with visible evidence of contamination (e.g., oily droplets, sheen, paint chips, sandblast grit, other wastes) should not be returned to the water, but instead they should be retained in a watertight drum on board the vessel for later disposal onshore. In addition, in some cases sediments may be brought to shore for compositing and subsampling and it may not be practical to return any excess sediments to the station where they were collected. In such cases, the excess sediments should also be retained for appropriate disposal onshore. Decisions regarding the appropriate disposal for excess
Sediment Sampling and Analysis Plan Appendix February 2008
58
sediments may have to await receipt of the results of chemical analyses of the sediments. Sediments are rarely sufficiently contaminated to require special handling and disposal as dangerous or hazardous wastes, but provisions must be made for appropriate disposal if that were the case.
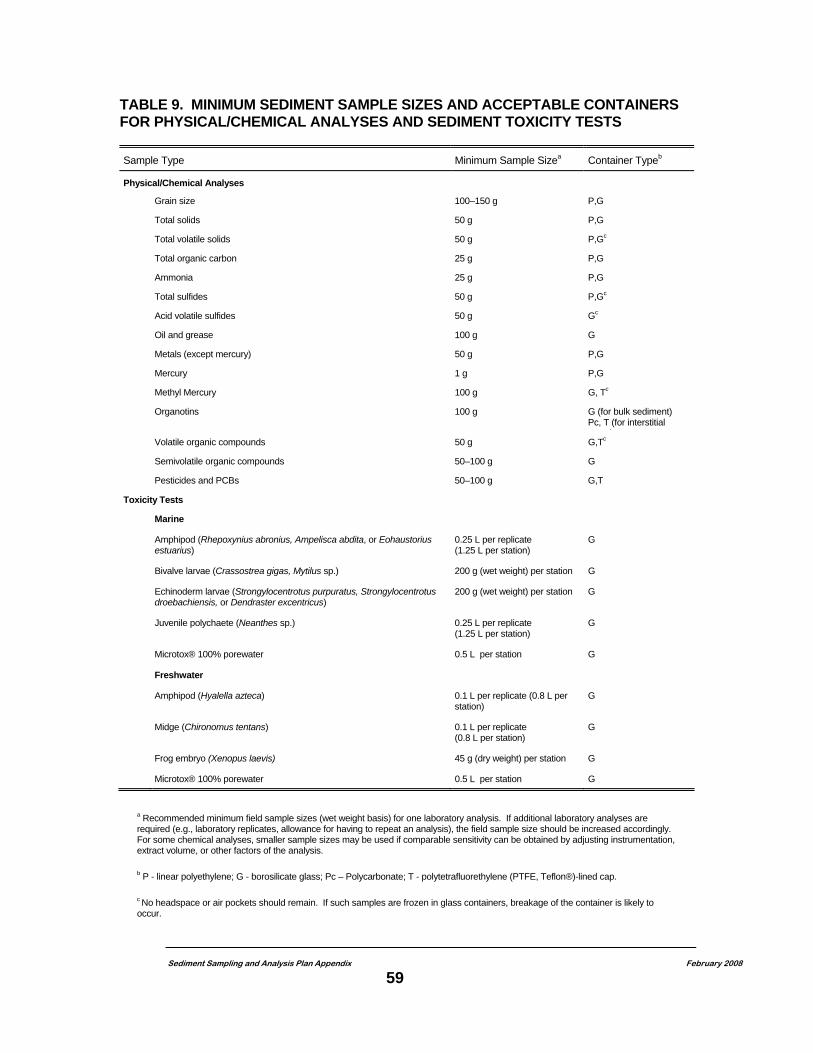
Sediment Sampling and Analysis Plan Appendix February 2008
59
TABLE 9. MINIMUM SEDIMENT SAMPLE SIZES AND ACCEPTABLE CONTAINERS FOR PHYSICAL/CHEMICAL ANALYSES AND SEDIMENT TOXICITY TESTS Sample Type Minimum Sample Sizea Container Typeb
Physical/Chemical Analyses
Grain size 100–150 g P,G
Total solids 50 g P,G
Total volatile solids 50 g P,Gc
Total organic carbon 25 g P,G
Ammonia 25 g P,G
Total sulfides 50 g P,Gc
Acid volatile sulfides 50 g Gc
Oil and grease 100 g G
Metals (except mercury) 50 g P,G
Mercury 1 g P,G
Methyl Mercury 100 g G, Tc
Organotins 100 g G (for bulk sediment) Pc, T (for interstitial
t ) Volatile organic compounds 50 g G,Tc
Semivolatile organic compounds 50–100 g G
Pesticides and PCBs 50–100 g G,T
Toxicity Tests
Marine
Amphipod (Rhepoxynius abronius, Ampelisca abdita, or Eohaustorius estuarius)
0.25 L per replicate (1.25 L per station)
G
Bivalve larvae (Crassostrea gigas, Mytilus sp.) 200 g (wet weight) per station G
Echinoderm larvae (Strongylocentrotus purpuratus, Strongylocentrotus droebachiensis, or Dendraster excentricus)
200 g (wet weight) per station G
Juvenile polychaete (Neanthes sp.) 0.25 L per replicate (1.25 L per station)
G
Microtox® 100% porewater 0.5 L per station G
Freshwater
Amphipod (Hyalella azteca) 0.1 L per replicate (0.8 L per station)
G
Midge (Chironomus tentans) 0.1 L per replicate (0.8 L per station)
G
Frog embryo (Xenopus laevis) 45 g (dry weight) per station G
Microtox® 100% porewater 0.5 L per station G
a Recommended minimum field sample sizes (wet weight basis) for one laboratory analysis. If additional laboratory analyses are required (e.g., laboratory replicates, allowance for having to repeat an analysis), the field sample size should be increased accordingly. For some chemical analyses, smaller sample sizes may be used if comparable sensitivity can be obtained by adjusting instrumentation, extract volume, or other factors of the analysis. b P - linear polyethylene; G - borosilicate glass; Pc – Polycarbonate; T - polytetrafluorethylene (PTFE, Teflon®)-lined cap. c No headspace or air pockets should remain. If such samples are frozen in glass containers, breakage of the container is likely to occur.
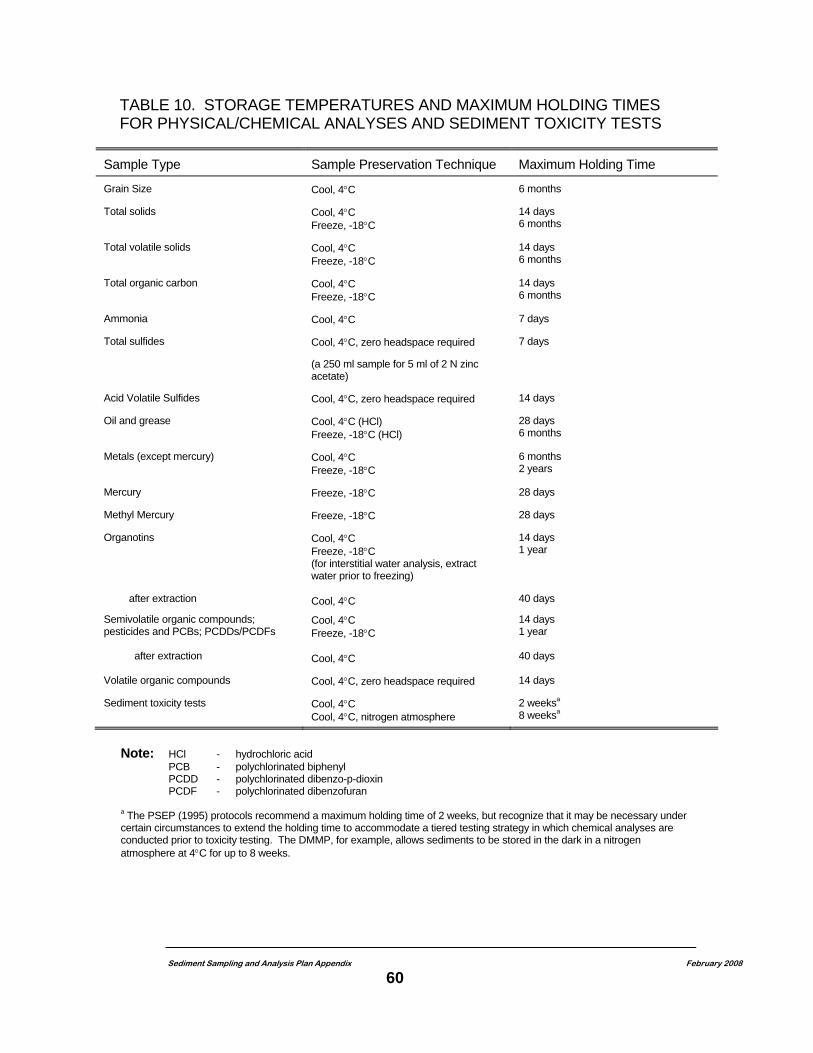
Sediment Sampling and Analysis Plan Appendix February 2008
60
TABLE 10. STORAGE TEMPERATURES AND MAXIMUM HOLDING TIMES FOR PHYSICAL/CHEMICAL ANALYSES AND SEDIMENT TOXICITY TESTS
Sample Type Sample Preservation Technique Maximum Holding Time
Grain Size Cool, 4°C 6 months
Total solids Cool, 4°C Freeze, -18°C
14 days 6 months
Total volatile solids Cool, 4°C Freeze, -18°C
14 days 6 months
Total organic carbon Cool, 4°C Freeze, -18°C
14 days 6 months
Ammonia Cool, 4°C 7 days
Total sulfides Cool, 4°C, zero headspace required
(a 250 ml sample for 5 ml of 2 N zinc acetate)
7 days
Acid Volatile Sulfides Cool, 4°C, zero headspace required 14 days
Oil and grease Cool, 4°C (HCl) Freeze, -18°C (HCl)
28 days 6 months
Metals (except mercury) Cool, 4°C Freeze, -18°C
6 months 2 years
Mercury Freeze, -18°C 28 days
Methyl Mercury Freeze, -18°C 28 days
Organotins after extraction
Cool, 4°C Freeze, -18°C (for interstitial water analysis, extract water prior to freezing) Cool, 4°C
14 days 1 year 40 days
Semivolatile organic compounds; pesticides and PCBs; PCDDs/PCDFs after extraction
Cool, 4°C Freeze, -18°C Cool, 4°C
14 days 1 year 40 days
Volatile organic compounds Cool, 4°C, zero headspace required 14 days
Sediment toxicity tests Cool, 4°C Cool, 4°C, nitrogen atmosphere
2 weeksa 8 weeksa
Note: HCl - hydrochloric acid PCB - polychlorinated biphenyl PCDD - polychlorinated dibenzo-p-dioxin PCDF - polychlorinated dibenzofuran a The PSEP (1995) protocols recommend a maximum holding time of 2 weeks, but recognize that it may be necessary under certain circumstances to extend the holding time to accommodate a tiered testing strategy in which chemical analyses are conducted prior to toxicity testing. The DMMP, for example, allows sediments to be stored in the dark in a nitrogen atmosphere at 4°C for up to 8 weeks.
6. SAMPLE HANDLING PROCEDURES This section provides guidance on procedures designed to ensure sample integrity between the time of field collection and the time of analysis in the laboratory. The best analytical methods and procedures can fail and yield incorrect data if samples are improperly handled and prepared. Guidance is included on sample storage requirements, chain-of-custody procedures, and delivery of the samples to analytical laboratories.
6.1 SAMPLE STORAGE REQUIREMENTS Appropriate methods for sample preservation (e.g., freezing, refrigerating, fixation) and sample storage (e.g., maximum holding time) are dependent on the type of analyses that a sample is to undergo (e.g, chemical/physical analyses, toxicity testing, analysis of benthic macroinvertebrate communities).
6.1.1 Sample Storage Requirements for Chemical/Physical Analyses All sediment samples intended for chemical/physical analyses should be transported to the analytical laboratory on ice at 4°C. Upon receipt at the laboratory, storage temperature and maximum holding time will be determined based on the analyses to be performed. In some cases, the requirements may vary, depending on how long it will be before the laboratory expects to analyze the samples. Required storage temperature and maximum holding time are presented in Table 10. Sediment samples may be archived for later analysis by freezing them and holding them at -18°C except for the analyses of grain size, ammonia, total sulfides and volatile organic compounds; allowance for expansion of the sample should be made to prevent breakage of the sample bottles upon freezing. The archived samples may be thawed within the maximum holding times listed in Table 10 and analyzed for any of the analytes, except for ammonia, total sulfides, volatile organic compounds, and grain size.
6.1.2 Sample Storage Requirements for Toxicity Testing All sediment samples intended for toxicity testing should be transported to the toxicology laboratory on ice at 4°C. The samples should be held in the laboratory in the dark at 4°C and should not be frozen. Note: There are special cases where freezing a sediment sample prior to conducting bioassays may be appropriate to eliminate indigenous species that may interfere bioassay test results. In these cases, Ecology must approve of such plans prior to freeezing the sample. According to the PSEP (1995) toxicity test guidelines, all toxicity tests should be initiated as soon as possible (ideally within 2 weeks of collecting the samples in the field). Maximum holding times are important in investigations that rely on tiered testing, in which chemical analyses are conducted prior to toxicity testing. This tiered approach is used by the DMMP for evaluating dredged sediments for unconfined, open-water disposal in Puget Sound. The DMMP allows sediment samples to be held at 4°C in the dark in a nitrogen atmosphere up to 8 weeks prior to toxicity testing. Because the results of recent studies evaluating the effects of sediment holding time on sediment toxicity Sediment Sampling and Analysis Plan Appendix February 2008
61
Sediment Sampling and Analysis Plan Appendix February 2008
62
have been variable, it is prudent to store sediments for as short time as possible after field collection. If there are no other compelling reasons (such as the tiered testing schedule under the DMMP), a maximum holding time of 2 weeks is recommended, based on the best professional judgment of regional investigators and on logistical constraints. If logistical constraints mandate a holding time greater than 2 weeks, the DMMP sample storage requirements should be followed. Regardless of the holding time used for an investigation, it is essential that the holding time and conditions be reported along with the toxicity test results.
6.1.3 Sample Storage Requirements for Analysis of Benthic Macroinvertebrate Communities Sediment samples to be analyzed for benthic macroinvertebrate community characteristics should generally be sieved and fixed in the field for the reasons described in the PSEP (1987) protocols. If sieving must be delayed, it is possible to fix the sediment samples in their entirety and sieve at a later time, but the precautions described in the PSEP (1987) protocols should be followed. Fixation of the material retained on the sieve is generally accomplished by the addition of formalin. A vital stain (e.g., rose bengal) may be added to facilitate sorting of the samples in the laboratory, and a relaxant (e.g., magnesium chloride) may be used to decrease breakage of the organisms and to facilitate taxonomic identification. The samples should remain exposed to formalin for a minimum of 24 hours (to ensure adequate fixation) and a maximum of 7–10 days (to reduce the risk of decal-cifying molluscs and echinoderms). Thereafter, the samples should be rinsed thoroughly and transferred to a 70-percent solution of ethanol for storage until taxonomic sorting and identification.
6.2 CHAIN-OF-CUSTODY PROCEDURES Provisions should be included in all sediment sampling and analysis plans for documenting the chain-of-custody between sample collection and arrival at the analytical laboratory. Each sample container should be recorded on a chain-of-custody form at the end of each day's sampling. The chain-of-custody form should be completed in duplicate or triplicate and should identify the sample collection date and time, the project, and the chief scientist. It is the chief scientist's responsibility to ensure that these forms are accurately completed and signed at the time of sample transfer. One copy of the form should be placed in a waterproof bag and attached to the inside of each sample cooler. The chief scientist should keep one copy of the form. In the event that sediment subsamples are being sent to different laboratories (e.g., chemistry laboratory, toxicology laboratory), separate chain-of-custody forms should be prepared for each laboratory and each sample cooler. The sample cooler should be sealed with chain-of-custody tape and kept in a secure location when not in the presence of the chief scientist or assigned crew.
6.3 DELIVERY OF SAMPLES TO ANALYTICAL LABORATORIES Individual sample bottles should be sealed with tape to prevent leakage, and glass bottles should be wrapped with a shock absorbent material (e.g., plastic bubble wrap) to prevent
Sediment Sampling and Analysis Plan Appendix February 2008
63
breakage during shipment. The sample bottles should then be placed in individual plastic bags and packed in an ice chest or other suitable container with bubble wrap, vermiculite, or other packing material to prevent shifting of the contents during transport. Sufficient ice to ensure that samples are kept at 4°C until delivery to the laboratory should be sealed in plastic bags to prevent contamination of the samples from melt water and placed in the ice chest or other container. Sample packaging and shipping procedures should follow U.S. Department of Transportation regulations specified in 49 CFR 173.6 and 49 CFR 173.24. The shipping containers should be clearly labeled with all pertinent information (e.g., name of project; time and date container was sealed; person sealing the container; name, address, and telephone number of the party sending the samples; name, address, and telephone number of the analytical laboratory). One copy of the chain-of-custody form should be placed in a waterproof bag and sealed inside the lid of the container, and a chain-of-custody seal should be placed on the outside of the container prior to shipment or transfer to the laboratory. To ensure timely delivery of samples to the analytical laboratories, couriers or overnight express delivery services are typically employed. Generally, the sampling and analysis plan should describe the method of delivery necessary to ensure receipt of the samples by the laboratory within 24 hours of being sealed. Upon receipt of the samples at the laboratory, the chain-of-custody seal should be broken, the condition of the samples should be noted and recorded, and the chain-of-custody form should be signed by laboratory personnel. The samples should be promptly placed in appropriate storage facilities, maintaining proper temperature, atmosphere, and light conditions until the samples can be analyzed.
7. QUALITY ASSURANCE AND QUALITY CONTROL REQUIREMENTS QA/QC procedures are generally discussed in detail elsewhere (e.g., PSEP and ASTM protocols). The following subsections summarize QA/QC requirements that should be part of each sediment sampling and analysis plan and direct the reader to pertinent source documents for more detailed information.
7.1 QUALITY ASSURANCE AND QUALITY CONTROL FOR SEDIMENT CHEMICAL ANALYSES Summaries of applicable QA/QC procedures to be performed by the laboratory in conjunction with environmental sample analysis are provided in Table 11 for analyses of organic compounds, Table 12 for analyses of metals, and Table 13 for analyses of conventional sediment variables. Control limits different from those specified in Table 12, 13 and 14 may be specified in project planning documents when appropriate. Project specific control limits must be developed in consultation with the laboratory. The analyst is responsible for monitoring the analysis, identifying analytical problems and taking corrective actions prior to the expiration of sample holding times. The laboratory should communicate analytical problems to the project manager during the analysis when the laboratory is having difficulty in meeting any project specific requirements, including detection limits. When reasonable corrective actions do not bring QC sample results into control limit, resulting data may need to be qualified, depending on specific project requirements as documented in the project planning document.
7.2 QUALITY ASSURANCE AND QUALITY CONTROL FOR BIOLOGICAL ANALYSES
Marine and Estuarine Sediment Toxicity Test Conditions QA/QC requirements for the various biological tests are described in detail in the protocols for each type of test (PSEP 1987; PSEP 1995; ASTM 2000, 1991; U.S. EPA 1994; Nebeker et al. 1984; Microbics Corporation 1992). Requirements for marine sediment toxicity tests generally deal with ensuring that water quality conditions remain within acceptable limits during the tests and do not contribute to observed effects and thereby confound interpretations regarding the toxicity of the sediments. For most of the marine sediment toxicity tests, there are control limits for temperature, salinity, and dissolved oxygen (Table 14); however, there are generally no control limits specified for pH except for Microtox®, although measurements of pH may sometimes be useful in interpreting test results. Monitoring of sulfides and ammonia in the test chambers is required for marine sediments where either of these chemicals is suspected as being a problem, and is also useful for interpreting test results. The marine sediment toxicity test protocols also require the testing of negative controls, positive controls, and reference sediments (Table 14). The reference sediments should have the percent fines within 20 % of the sample percent fines. The SMS include marine sediment performance standards for control and reference sediment toxicity test results (WAC 173-204-315(2)), which are summarized in Table 14.
Sediment Sampling and Analysis Plan Appendix April 2003
64
Sediment Sampling and Analysis Plan Appendix April 2003
65
QA/QC requirements for analyses of benthic macroinvertebrate assemblages are described in the PSEP (1987) protocols and generally deal with checks on the completeness of sorting the samples and the accuracy of taxonomic identifications. The SMS also include performance standards for reference area benthic macroinvertebrate assemblages in Puget Sound (WAC 173-204-315(2)(c)). The reference area benthic macroinvertebrate assemblage should be representative of areas of Puget Sound removed from significant sources of contaminants and, to the extent possible, should have the following characteristics: The taxonomic richness of benthic macroinvertebrates and the abundances of higher taxonomic groups should reflect seasonality and natural physical- chemical conditions (e.g., grain size composition and interstitial salinity of sediments, water depth) in a reference area and not be obviously depressed as a result of chemical toxicity Normally abundant species that are known to be sensitive to chemical contaminants
should be present Normally rare species that are known to become abundant only under chemically
disturbed conditions should be rare or absent The abundances of normally rare species that control community structure through
physical modification of the sediment should be similar to those observed at the test sediment site.
Since 1993, Ecology has been developing possible modifications to the SMS interpretive methods and decision criteria for analyses of benthic macroinvertebrate assemblages, as well as reevaluating Puget Sound reference area conditions. In addition to the current Major Taxa Abundance benthic endpoint in the SMS rule, Ecology is considering use of additional benthic endpoints recommended in Puget sound Reference Value Project Task3: Development of Benthic Effects Sediment Quality Standards, April 1999. Ecology is also considering use of benthic administrative reference ranges as identified in Development of Reference Ranges for Benthic Assessment Endpoints in Puget Sound, January 1996. Freshwater Sediment Toxicity Test Conditions QA/QC requirements for freshwater sediment toxicity tests generally deal with ensuring that water quality conditions remain within acceptable limits during the tests and do not contribute to observed effects and thereby confound interpretations regarding the toxicity of the sediments. For the freshwater sediment toxicity tests, there are control limits for temperature and dissolved oxygen (Table 15); however, there are generally no control limits specified for pH except for Microtox®, although measurements of pH may sometimes be useful in interpreting test results. Monitoring of sulfides and ammonia in the test chambers may be appropriate for freshwater sediments where either of these chemicals is suspected as being a problem, and may also be useful for interpreting test results. The freshwater sediment toxicity test protocols also require the testing of negative controls, positive controls, and reference sediments (Table 15). Freshwater sediment performance standards for control and reference sediment toxicity test results in Table 15 have been recently recommended by Ecology and are identified in MyEIM and in Development of Freshwater Sediment Quality Values For Use In Washington State, September 2002.
Sediment Sampling and Analysis Plan Appendix April 2003
66
7.3 DATA QUALITY ASSURANCE REVIEW
The project proponent is responsible for the quality assurance review of data generated in any sediment investigation. There are two levels of quality assurance review applicable for sediment data, referred to as QA1 and QA2 (PTI 1989a,b). The analytical elements evaluated under each level of review are identified in Tables 11-15. A QA1 review represents a level of quality assurance review acceptable for most sediment investigations conducted under the SMS, as well as for sediment sampling and analyses conducted to determine the suitability of dredged material for unconfined, open-water disposal at a DMMP site (PTI 1989a). A chemistry data review at this level evaluates field collection and handling, completeness, data presentation, detection limits (The PQL shall not be greater than the SQS of the SMS.), and the acceptability of test results for method blanks, certified reference materials, analytical replicates, matrix spikes and surrogate recoveries. A QA1 review of bioassay data covers similar field and reporting elements and evaluates the acceptability of test results for positive controls, negative controls, reference sediment, replicates, and experimental conditions (temperature, salinity, pH, dissolved oxygen). Detailed guidance on QA1 review procedures is provided in PTI (1989a) and is available from Ecology. A QA2 review represents a more vigorous level of quality assurance review, and is appropriate for sediment data that are to be used for the development of AET values and SMS numerical chemical criteria. A QA2 review is also recommended in cases where the data may be used in litigation. At this level a chemistry data review examines the complete analytical process from calculation of instrument and method detection limits, practical quantitation limits, final dilution volumes, sample size, and wet-to-dry ratios to quantification of calibration compounds and all analytes detected in blanks and environmental samples. QA2 review procedures are described in PTI (1989b), also available from Ecology.
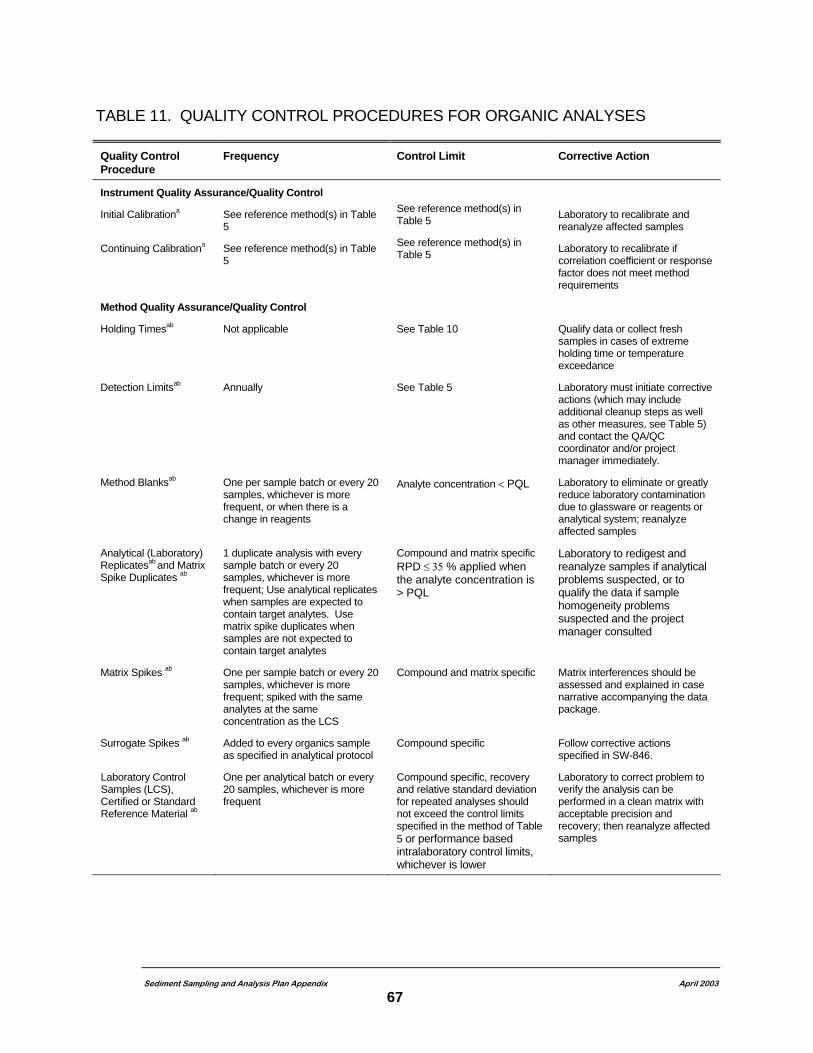
Sediment Sampling and Analysis Plan Appendix April 2003
67
TABLE 11. QUALITY CONTROL PROCEDURES FOR ORGANIC ANALYSES
Quality Control Procedure
Frequency Control Limit Corrective Action
Instrument Quality Assurance/Quality Control
Initial Calibrationa See reference method(s) in Table 5
See reference method(s) in Table 5 Laboratory to recalibrate and
reanalyze affected samples
Continuing Calibrationa See reference method(s) in Table 5
See reference method(s) in Table 5 Laboratory to recalibrate if
correlation coefficient or response factor does not meet method requirements
Method Quality Assurance/Quality Control
Holding Timesab Not applicable See Table 10 Qualify data or collect fresh samples in cases of extreme holding time or temperature exceedance
Detection Limitsab Annually See Table 5 Laboratory must initiate corrective actions (which may include additional cleanup steps as well as other measures, see Table 5) and contact the QA/QC coordinator and/or project manager immediately.
Method Blanksab One per sample batch or every 20 samples, whichever is more frequent, or when there is a change in reagents
Analyte concentration < PQL Laboratory to eliminate or greatly reduce laboratory contamination due to glassware or reagents or analytical system; reanalyze affected samples
Analytical (Laboratory) Replicatesab and Matrix Spike Duplicates ab
1 duplicate analysis with every sample batch or every 20 samples, whichever is more frequent; Use analytical replicates when samples are expected to contain target analytes. Use matrix spike duplicates when samples are not expected to contain target analytes
Compound and matrix specific RPD ≤ 35 % applied when the analyte concentration is > PQL
Laboratory to redigest and reanalyze samples if analytical problems suspected, or to qualify the data if sample homogeneity problems suspected and the project manager consulted
Matrix Spikes ab One per sample batch or every 20 samples, whichever is more frequent; spiked with the same analytes at the same concentration as the LCS
Compound and matrix specific Matrix interferences should be assessed and explained in case narrative accompanying the data package.
Surrogate Spikes ab Added to every organics sample as specified in analytical protocol
Compound specific Follow corrective actions specified in SW-846.
Laboratory Control Samples (LCS), Certified or Standard Reference Material ab
One per analytical batch or every 20 samples, whichever is more frequent
Compound specific, recovery and relative standard deviation for repeated analyses should not exceed the control limits specified in the method of Table 5 or performance based intralaboratory control limits, whichever is lower
Laboratory to correct problem to verify the analysis can be performed in a clean matrix with acceptable precision and recovery; then reanalyze affected samples
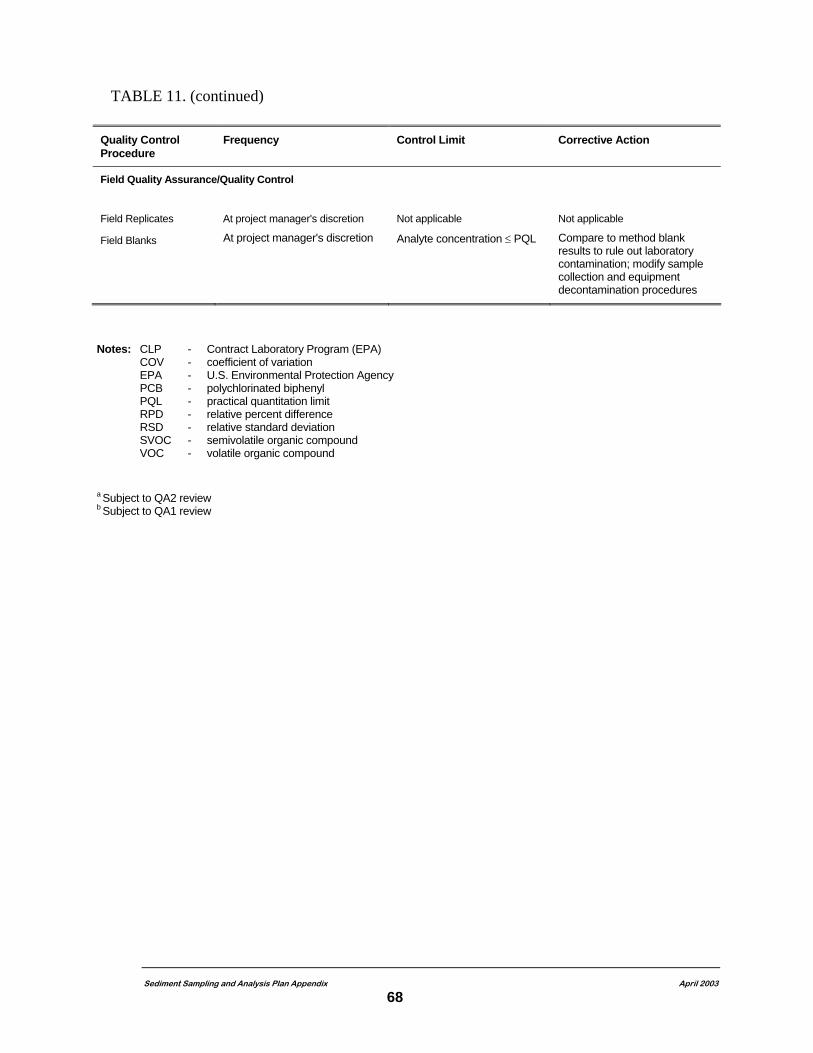
TABLE 11. (continued)
Quality Control Procedure
Frequency Control Limit Corrective Action
Field Quality Assurance/Quality Control
Field Replicates At project manager's discretion Not applicable Not applicable
Field Blanks At project manager's discretion Analyte concentration ≤ PQL Compare to method blank results to rule out laboratory contamination; modify sample collection and equipment decontamination procedures
Notes: CLP - Contract Laboratory Program (EPA) COV - coefficient of variation EPA - U.S. Environmental Protection Agency PCB - polychlorinated biphenyl PQL - practical quantitation limit RPD - relative percent difference RSD - relative standard deviation SVOC - semivolatile organic compound VOC - volatile organic compound a Subject to QA2 review b Subject to QA1 review
Sediment Sampling and Analysis Plan Appendix April 2003
68
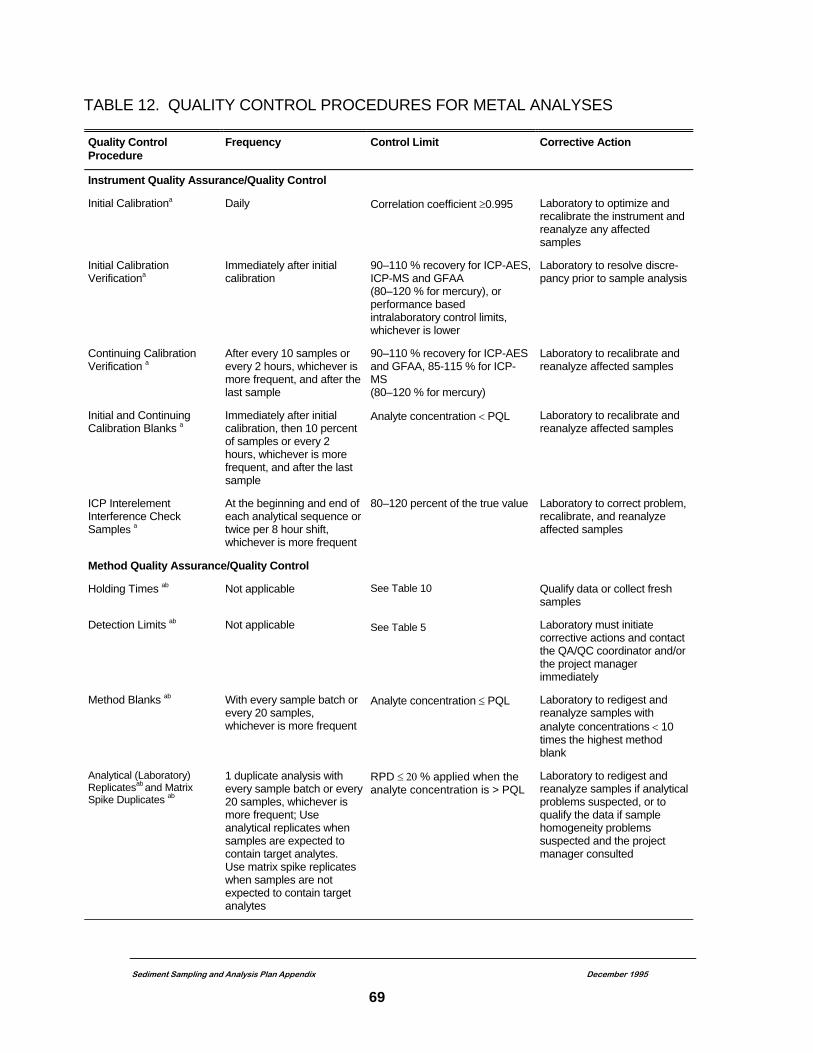
TABLE 12. QUALITY CONTROL PROCEDURES FOR METAL ANALYSES Quality Control Procedure
Frequency Control Limit Corrective Action
Instrument Quality Assurance/Quality Control
Initial Calibrationa Daily Correlation coefficient ≥0.995 Laboratory to optimize and recalibrate the instrument and reanalyze any affected samples
Initial Calibration Verificationa
Immediately after initial calibration
90–110 % recovery for ICP-AES, ICP-MS and GFAA (80–120 % for mercury), or performance based intralaboratory control limits, whichever is lower
Laboratory to resolve discre-pancy prior to sample analysis
Continuing Calibration Verification a
After every 10 samples or every 2 hours, whichever is more frequent, and after the last sample
90–110 % recovery for ICP-AES and GFAA, 85-115 % for ICP-MS (80–120 % for mercury)
Laboratory to recalibrate and reanalyze affected samples
Initial and Continuing Calibration Blanks a
Immediately after initial calibration, then 10 percent of samples or every 2 hours, whichever is more frequent, and after the last sample
Analyte concentration < PQL Laboratory to recalibrate and reanalyze affected samples
ICP Interelement Interference Check Samples a
At the beginning and end of each analytical sequence or twice per 8 hour shift, whichever is more frequent
80–120 percent of the true value Laboratory to correct problem, recalibrate, and reanalyze affected samples
Method Quality Assurance/Quality Control
Holding Times ab Not applicable See Table 10 Qualify data or collect fresh samples
Detection Limits ab Not applicable See Table 5 Laboratory must initiate corrective actions and contact the QA/QC coordinator and/or the project manager immediately
Method Blanks ab With every sample batch or every 20 samples, whichever is more frequent
Analyte concentration ≤ PQL Laboratory to redigest and reanalyze samples with analyte concentrations < 10 times the highest method blank
Analytical (Laboratory) Replicatesab and Matrix Spike Duplicates ab
1 duplicate analysis with every sample batch or every 20 samples, whichever is more frequent; Use analytical replicates when samples are expected to contain target analytes. Use matrix spike replicates when samples are not expected to contain target analytes
RPD ≤ 20 % applied when the analyte concentration is > PQL
Laboratory to redigest and reanalyze samples if analytical problems suspected, or to qualify the data if sample homogeneity problems suspected and the project manager consulted
Sediment Sampling and Analysis Plan Appendix December 1995
69
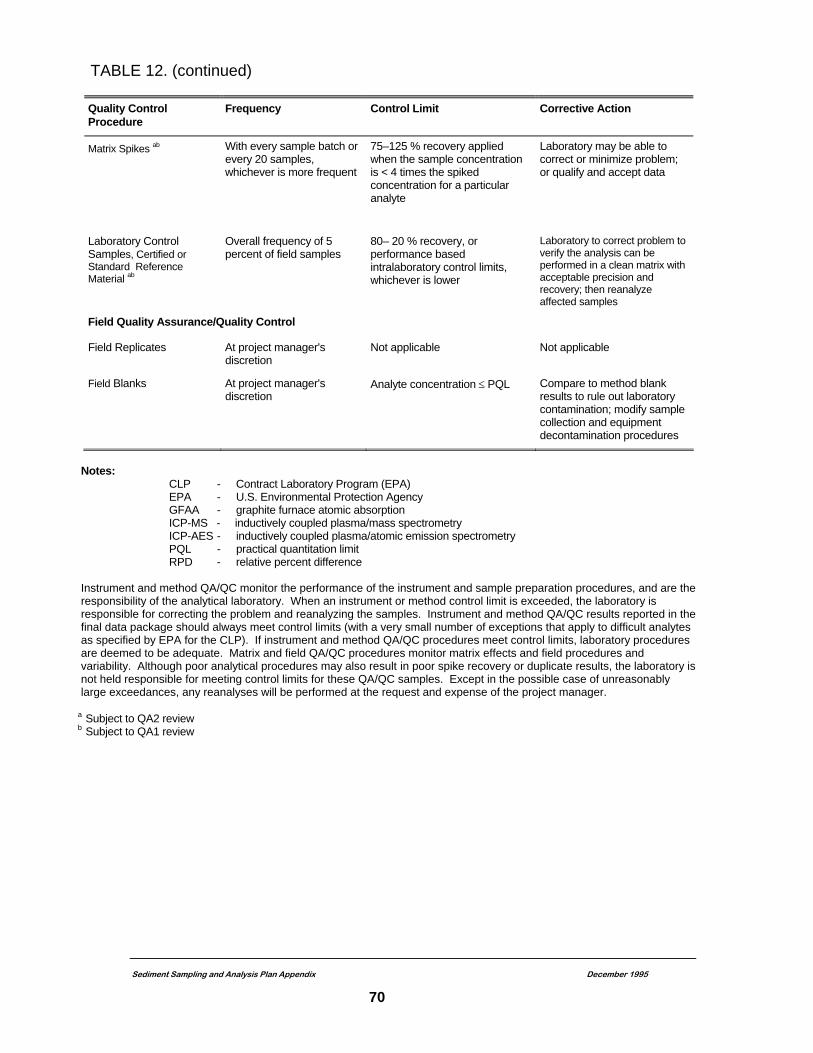
Sediment Sampling and Analysis Plan Appendix December 1995
70
Quality Control Procedure
Frequency Control Limit Corrective Action
Matrix Spikes ab With every sample batch or every 20 samples, whichever is more frequent
75–125 % recovery applied when the sample concentration is < 4 times the spiked concentration for a particular analyte
Laboratory may be able to correct or minimize problem; or qualify and accept data
Laboratory Control Samples, Certified or Standard Reference Material ab
Overall frequency of 5 percent of field samples
80– 20 % recovery, or performance based intralaboratory control limits, whichever is lower
Laboratory to correct problem to verify the analysis can be performed in a clean matrix with acceptable precision and recovery; then reanalyze affected samples
Field Quality Assurance/Quality Control
Field Replicates At project manager's discretion
Not applicable Not applicable
Field Blanks At project manager's discretion
Analyte concentration ≤ PQL Compare to method blank results to rule out laboratory contamination; modify sample collection and equipment decontamination procedures
Notes: CLP - Contract Laboratory Program (EPA) EPA - U.S. Environmental Protection Agency GFAA - graphite furnace atomic absorption ICP-MS - inductively coupled plasma/mass spectrometry ICP-AES - inductively coupled plasma/atomic emission spectrometry PQL - practical quantitation limit RPD - relative percent difference Instrument and method QA/QC monitor the performance of the instrument and sample preparation procedures, and are the responsibility of the analytical laboratory. When an instrument or method control limit is exceeded, the laboratory is responsible for correcting the problem and reanalyzing the samples. Instrument and method QA/QC results reported in the final data package should always meet control limits (with a very small number of exceptions that apply to difficult analytes as specified by EPA for the CLP). If instrument and method QA/QC procedures meet control limits, laboratory procedures are deemed to be adequate. Matrix and field QA/QC procedures monitor matrix effects and field procedures and variability. Although poor analytical procedures may also result in poor spike recovery or duplicate results, the laboratory is not held responsible for meeting control limits for these QA/QC samples. Except in the possible case of unreasonably large exceedances, any reanalyses will be performed at the request and expense of the project manager.
a Subject to QA2 review b Subject to QA1 review
TABLE 12. (continued)
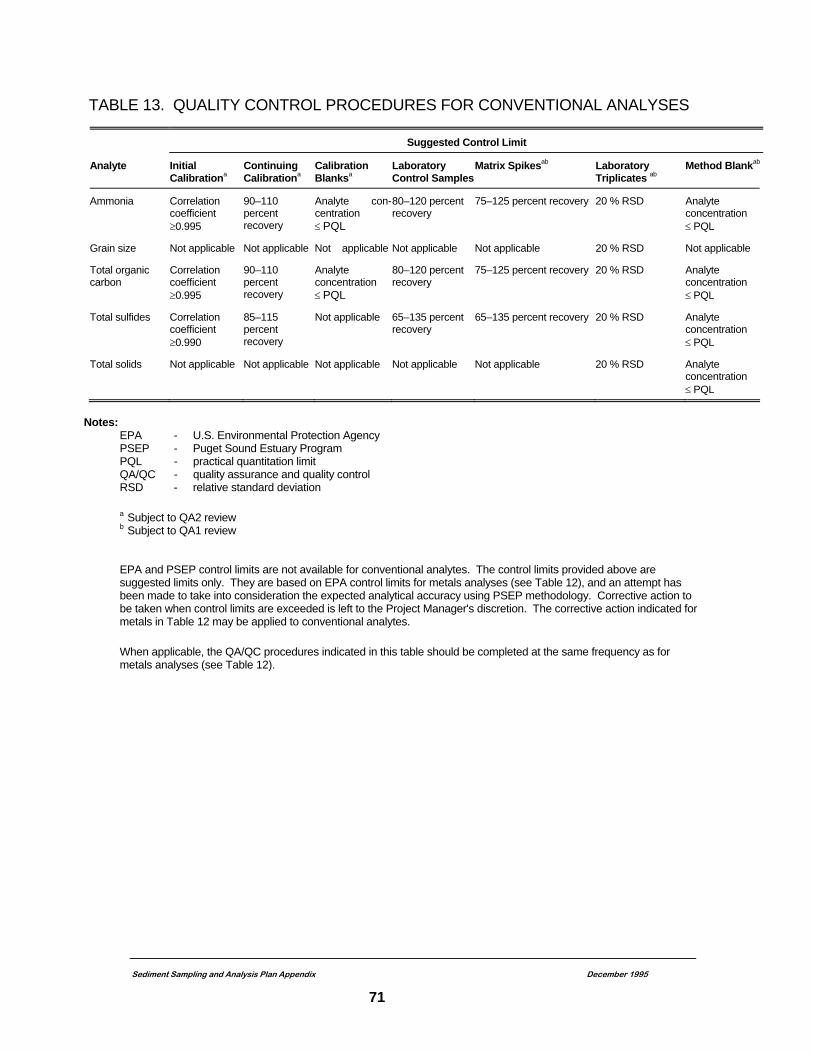
Sediment Sampling and Analysis Plan Appendix December 1995
71
TABLE 13. QUALITY CONTROL PROCEDURES FOR CONVENTIONAL ANALYSES
Suggested Control Limit
Analyte Initial Calibrationa
Continuing Calibrationa
Calibration Blanksa
Laboratory Control Samples
Matrix Spikesab Laboratory Triplicates ab
Method Blankab
Ammonia Correlation coefficient ≥0.995
90–110 percent recovery
Analyte con-centration ≤ PQL
80–120 percent recovery
75–125 percent recovery 20 % RSD
Analyte concentration ≤ PQL
Grain size Not applicable Not applicable Not applicable Not applicable Not applicable 20 % RSD Not applicable
Total organic carbon
Correlation coefficient ≥0.995
90–110 percent recovery
Analyte concentration ≤ PQL
80–120 percent recovery
75–125 percent recovery 20 % RSD Analyte concentration ≤ PQL
Total sulfides Correlation coefficient ≥0.990
85–115 percent recovery
Not applicable 65–135 percent recovery
65–135 percent recovery 20 % RSD Analyte concentration ≤ PQL
Total solids Not applicable Not applicable Not applicable Not applicable Not applicable 20 % RSD Analyte concentration ≤ PQL
Notes:
EPA - U.S. Environmental Protection Agency PSEP - Puget Sound Estuary Program PQL - practical quantitation limit QA/QC - quality assurance and quality control RSD - relative standard deviation
a Subject to QA2 review b Subject to QA1 review
EPA and PSEP control limits are not available for conventional analytes. The control limits provided above are
suggested limits only. They are based on EPA control limits for metals analyses (see Table 12), and an attempt has been made to take into consideration the expected analytical accuracy using PSEP methodology. Corrective action to be taken when control limits are exceeded is left to the Project Manager's discretion. The corrective action indicated for metals in Table 12 may be applied to conventional analytes.
When applicable, the QA/QC procedures indicated in this table should be completed at the same frequency as for
metals analyses (see Table 12).
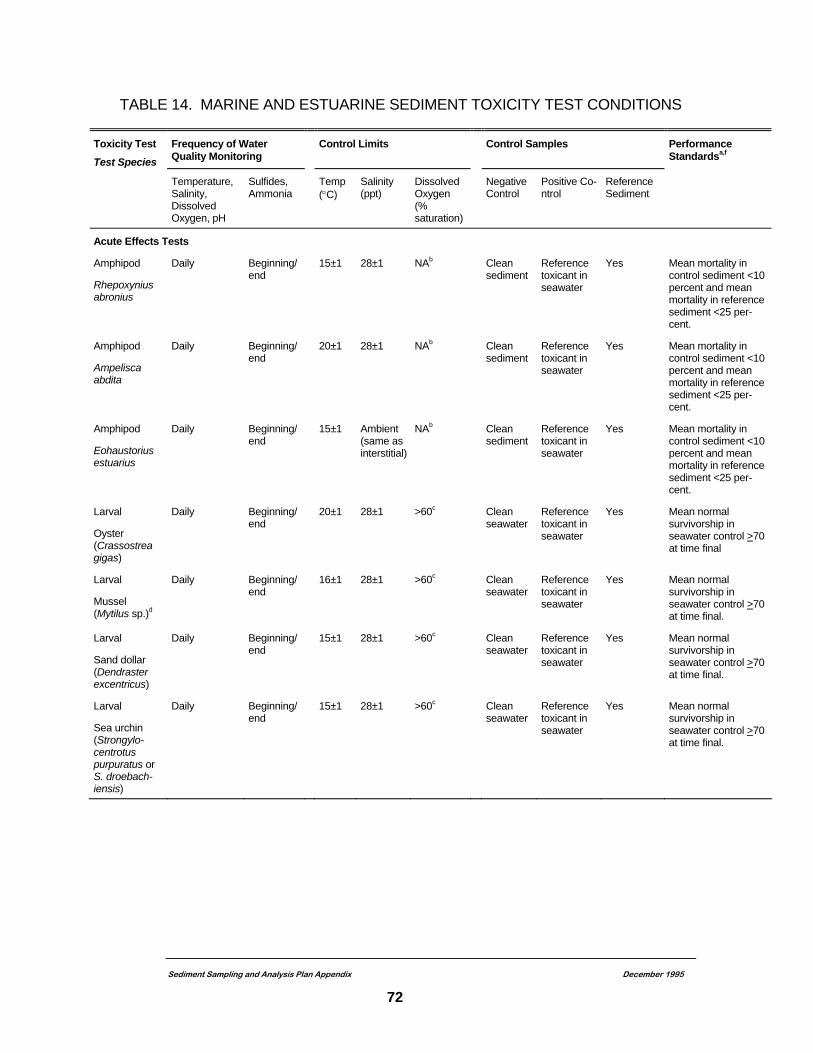
TABLE 14. MARINE AND ESTUARINE SEDIMENT TOXICITY TEST CONDITIONS
Toxicity Test Test Species
Frequency of Water Quality Monitoring
Control Limits Control Samples Performance Standardsa,f
Temperature, Salinity, Dissolved Oxygen, pH
Sulfides, Ammonia
Temp (°C)
Salinity (ppt)
Dissolved Oxygen (% saturation)
Negative Control
Positive Co-ntrol
Reference Sediment
Acute Effects Tests
Amphipod
Rhepoxynius abronius
Daily Beginning/ end
15±1 28±1 NAb Clean sediment
Reference toxicant in seawater
Yes Mean mortality in control sediment <10 percent and mean mortality in reference sediment <25 per-cent.
Amphipod
Ampelisca abdita
Daily Beginning/ end
20±1 28±1 NAb Clean sediment
Reference toxicant in seawater
Yes Mean mortality in control sediment <10 percent and mean mortality in reference sediment <25 per-cent.
Amphipod
Eohaustorius estuarius
Daily Beginning/ end
15±1 Ambient (same as interstitial)
NAb Clean sediment
Reference toxicant in seawater
Yes Mean mortality in control sediment <10 percent and mean mortality in reference sediment <25 per-cent.
Larval
Oyster (Crassostrea gigas)
Daily Beginning/ end
20±1 28±1 >60c Clean seawater
Reference toxicant in seawater
Yes Mean normal survivorship in seawater control >70 at time final
Larval
Mussel (Mytilus sp.)d
Daily Beginning/ end
16±1 28±1 >60c Clean seawater
Reference toxicant in seawater
Yes Mean normal survivorship in seawater control >70 at time final.
Larval
Sand dollar (Dendraster excentricus)
Daily Beginning/ end
15±1 28±1 >60c Clean seawater
Reference toxicant in seawater
Yes Mean normal survivorship in seawater control >70 at time final.
Larval
Sea urchin (Strongylo-centrotus purpuratus or S. droebach-iensis)
Daily Beginning/ end
15±1 28±1 >60c Clean seawater
Reference toxicant in seawater
Yes Mean normal survivorship in seawater control >70 at time final.
Sediment Sampling and Analysis Plan Appendix December 1995
72
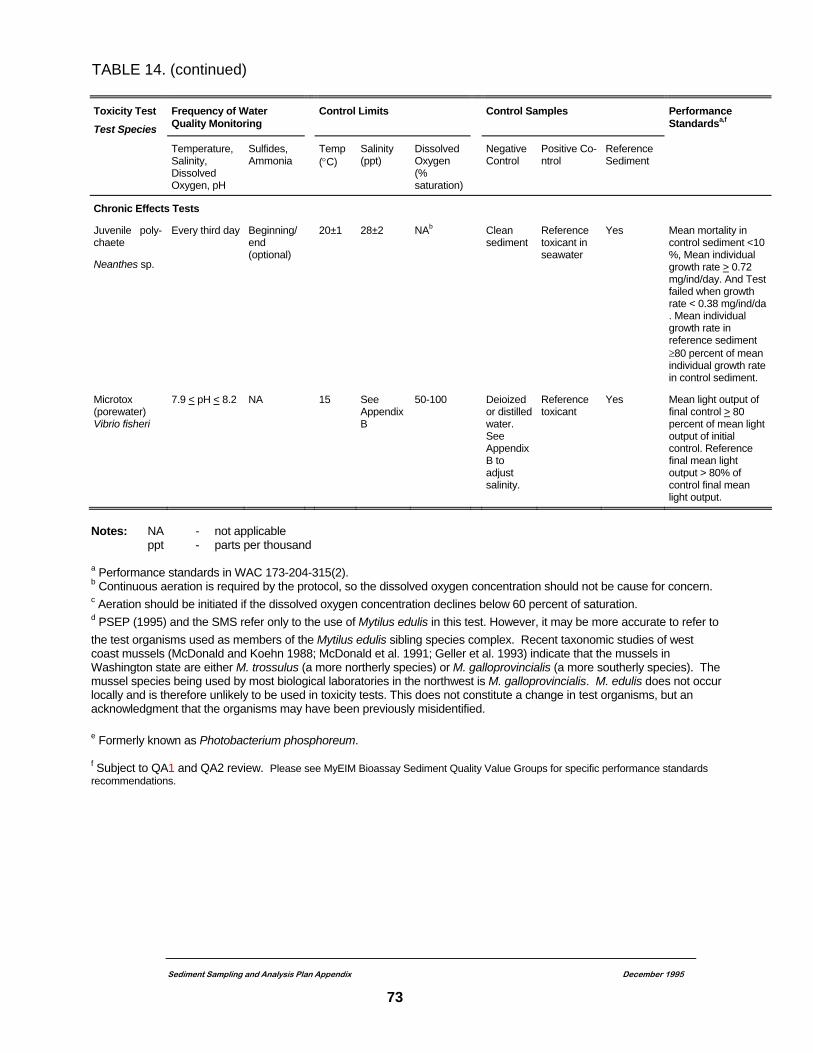
Sediment Sampling and Analysis Plan Appendix December 1995
73
Toxicity Test Test Species
Frequency of Water Quality Monitoring
Control Limits Control Samples Performance Standardsa,f
Temperature, Salinity, Dissolved Oxygen, pH
Sulfides, Ammonia
Temp (°C)
Salinity (ppt)
Dissolved Oxygen (% saturation)
Negative Control
Positive Co-ntrol
Reference Sediment
Chronic Effects Tests
Juvenile poly-chaete
Neanthes sp.
Every third day Beginning/ end (optional)
20±1 28±2 NAb Clean sediment
Reference toxicant in seawater
Yes Mean mortality in control sediment <10 %, Mean individual growth rate > 0.72 mg/ind/day. And Test failed when growth rate < 0.38 mg/ind/da . Mean individual growth rate in reference sediment ≥80 percent of mean individual growth rate in control sediment.
Microtox (porewater) Vibrio fisheri
7.9 < pH < 8.2 NA 15 See Appendix B
50-100 Deioized or distilled water. See Appendix B to adjust salinity.
Reference toxicant
Yes Mean light output of final control > 80 percent of mean light output of initial control. Reference final mean light output > 80% of control final mean light output.
Notes: NA - not applicable ppt - parts per thousand a Performance standards in WAC 173-204-315(2). b Continuous aeration is required by the protocol, so the dissolved oxygen concentration should not be cause for concern. c Aeration should be initiated if the dissolved oxygen concentration declines below 60 percent of saturation. d PSEP (1995) and the SMS refer only to the use of Mytilus edulis in this test. However, it may be more accurate to refer to the test organisms used as members of the Mytilus edulis sibling species complex. Recent taxonomic studies of west coast mussels (McDonald and Koehn 1988; McDonald et al. 1991; Geller et al. 1993) indicate that the mussels in Washington state are either M. trossulus (a more northerly species) or M. galloprovincialis (a more southerly species). The mussel species being used by most biological laboratories in the northwest is M. galloprovincialis. M. edulis does not occur locally and is therefore unlikely to be used in toxicity tests. This does not constitute a change in test organisms, but an acknowledgment that the organisms may have been previously misidentified. e Formerly known as Photobacterium phosphoreum. f Subject to QA1 and QA2 review. Please see MyEIM Bioassay Sediment Quality Value Groups for specific performance standards recommendations.
TABLE 14. (continued)
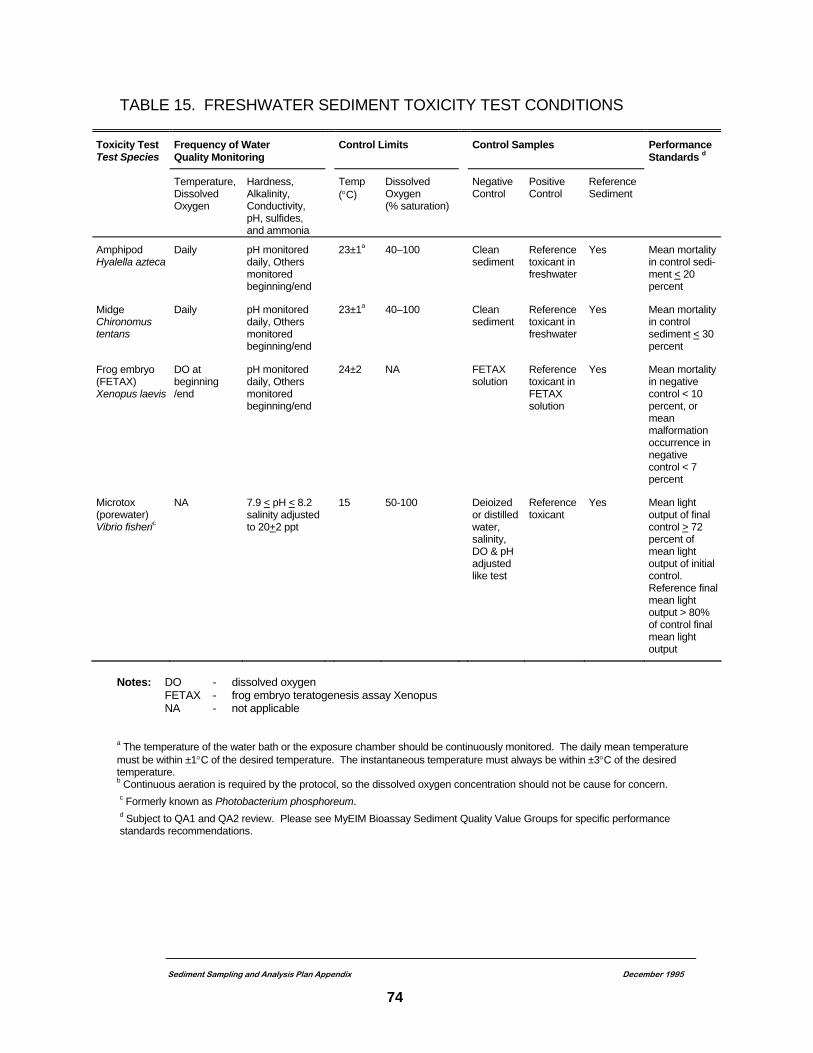
TABLE 15. FRESHWATER SEDIMENT TOXICITY TEST CONDITIONS
Toxicity Test Test Species
Frequency of Water Quality Monitoring
Control Limits Control Samples Performance Standards d
Temperature, Dissolved Oxygen
Hardness, Alkalinity, Conductivity, pH, sulfides, and ammonia
Temp (°C)
Dissolved Oxygen (% saturation)
Negative Control
Positive Control
Reference Sediment
Amphipod Hyalella azteca
Daily pH monitored daily, Others monitored beginning/end
23±1a 40–100 Clean sediment
Reference toxicant in freshwater
Yes Mean mortality in control sedi-ment < 20 percent
Midge Chironomus tentans
Daily pH monitored daily, Others monitored beginning/end
23±1a 40–100 Clean sediment
Reference toxicant in freshwater
Yes Mean mortality in control sediment < 30 percent
Frog embryo (FETAX) Xenopus laevis
DO at beginning /end
pH monitored daily, Others monitored beginning/end
24±2 NA FETAX solution
Reference toxicant in FETAX solution
Yes Mean mortality in negative control < 10 percent, or mean malformation occurrence in negative control < 7 percent
Microtox (porewater) Vibrio fisheric
NA 7.9 < pH < 8.2 salinity adjusted to 20+2 ppt
15 50-100 Deioized or distilled water, salinity, DO & pH adjusted like test
Reference toxicant
Yes Mean light output of final control > 72 percent of mean light output of initial control. Reference final mean light output > 80% of control final mean light output
Notes: DO - dissolved oxygen FETAX - frog embryo teratogenesis assay Xenopus NA - not applicable a The temperature of the water bath or the exposure chamber should be continuously monitored. The daily mean temperature must be within ±1°C of the desired temperature. The instantaneous temperature must always be within ±3°C of the desired temperature. b Continuous aeration is required by the protocol, so the dissolved oxygen concentration should not be cause for concern. c Formerly known as Photobacterium phosphoreum. d Subject to QA1 and QA2 review. Please see MyEIM Bioassay Sediment Quality Value Groups for specific performance standards recommendations.
Sediment Sampling and Analysis Plan Appendix December 1995
74
8. DATA ANALYSIS, RECORD KEEPING, AND REPORTING REQUIREMENTS This section provides guidance on a project proponent's responsibilities with regard to data analysis, record keeping, and reporting. Sediment sampling and analysis plans should describe the proposed approach to each of these issues.
8.1 DATA ANALYSIS Data analysis means the numerical and/or statistical analysis of chemistry and biological tests to determine whether there is exceedance of sediment chemistry and biological SQS and CSL criteria and exceedance of detection limits over chemical SQS and/or CSL for the undetected results, and the identification of these exceedance stations on the map, to plan for a cleanup and/or source control, to determine whether a cleanup and/or source control was successful, and to support other decisions relating to the investigation, cleanup and source control of contaminated sediments. In general, analysis of the data collected in a sediment investigation is the responsibility of a project proponent. Laboratory results should be evaluated by providing general descriptions of the sediment chemistry data and any biological data. Stations exhibiting exceedances of adopted SMS marine or user proposed freshwater/low salinity sediment quality criteria (e.g., marine SQS or CSL numerical criteria for individual chemicals [Table 1], marine SQS or CSL biological effects criteria [Table 2]) and exceedances of detection limits over chemical SQS and/or CSL for the undetected chemical results should be clearly identified, and the areas exhibiting such exceedances should be indicated on a map.
8.1.1 Sediment Chemistry Data Sediment chemistry data should be tabulated for all measured analytes (including conventional sediment variables), whether or not there are applicable numerical criteria for evaluating the data. The reported chemical concentration should be reported in dry weight measurement basis, and then be converted to TOC normalized concentrations with MyEIM for direct comparison with the SMS numerical criteria in TOC measurement basis. When the dry-weight concentrations may be useful in cases where TOC values are either very high or very low, Ecology may decide to compare the data with the dry-weight AET values (Barrick et al. 1988). For further discussion of TOC-normalization, the reader is referred to Michelsen (1992). Additionally, freshwater and low-salinity sediment chemical data should be similarly tabulated and compared to Ecology recommended and/or user-recommended sediment criteria. Ancillary data that should be reported in these tables include station numbers, sample identification numbers (corresponding to those on laboratory data sheets), the date of sample collection, and the sediment sampling interval (upper and lower depths within the sediments relative to the sediment-water interface), location latitude and longititude in NAD83 or NAD83 HARN (High Accuracy Reference Network), and water depth from the Meal Lower Low Water to the sediment-water interface. A suggested table format is to have a column for each individual sample and a row for each individual analyte. The results for field duplicate samples should be identified as such and reported separately Sediment Sampling and Analysis Plan Appendix February 2008
75
Sediment Sampling and Analysis Plan Appendix February 2008
76
(i.e., not averaged). More detailed help document on how to enter field replicate data is available at http://www.ecy.wa.gov/eim/helpDocs.htm. Appropriate data qualifiers should be reported with the chemical concentrations, if QA/QC criteria are not met. Where chemical analysis indicates a chemical is not detected in a sediment sample, the lowest detection limit shall be reported with U (Undetected) qualifier. The practical quantitation limit shall be provided and be at or below the Marine Sediment Quality Standards chemical criteria value set in WAC 173-204-320. MyEIM chemistry analysis tool is able to compare the sediment chemistry data to selected chemical numeric criteria, and show the exceedance (hit) stations on the map. Some of the applicable numerical criteria (e.g., SQS, CSL) are for the sum of individual compounds (e.g., total low molecular weight polycyclic aromatic hydrocarbons [total LPAHs], total high molecular weight polycyclic aromatic hydrocarbons [total HPAHs]), isomers (e.g., total benzofluoranthenes), or groups of compounds (e.g., total polychlorinated biphenyls [PCBs]). For these chemicals, the following rules should be used in generating the sums: Under the SMS WAC 173-204-320, 420 and 520(2)(b) and the DMMP, only
the single highest individual chemical detection limit in a group is reported when all chemicals in that group are undetected; when one or more chemicals in a group are detected, only the detected concentrations are included in the sum.
Under the SMS WAC 173-204-320, 420 and 520(2)(d), total LPAH represents
the sum of the concentrations of the following LPAH compounds: naphthalene, acenaphthylene, acenaphthene, fluorene, phenanthrene, and anthracene. 2-Methylnaphthalene is not included in the sum of the LPAH criteria values under the SMS.
Under the SMS WAC 173-204-320, 420 and 520(2)(e), total HPAH
represents the sum of the concentrations of the following HPAH compounds: fluoranthene, pyrene, benz[a]anthracene, chrysene, total benzofluoranthenes, benzo[a]pyrene, indeno[1,2,3-c,d]pyrene, dibenzo[a,h]anthracene, and benzo[g,h.i]perylene.
Under the SMS WAC 173-204-320, 420 and 520(2)(f), total
benzofluoranthenes represents the sum of concentrations of the b, j, and k isomers of benzofluoranthenes.
Under the SMS WAC 173-204-320, 420 and 520, total PCB criteria were
derived based on the sum of the concentrations of Aroclors® 1016, 1221, 1232, 1242, 1248, 1254 and 1260.
Laboratory chemistry data should be reported to Ecology in electronic EIM template format (EIM result data spreadsheets) which can be downloaded through EIM Spreadsheets, Submittal Guidelines, and Help zip file. Laboratory chemistry data tabulated in spreadsheets should also be reported to Ecology in hardcopy format. For additional helps in EIM data entry, refer to the sediment chemistry EIM data entry business rule in Subappendix E and help documents at http://www.ecy.wa.gov/eim/helpDocs.htm.
Sediment Sampling and Analysis Plan Appendix February 2008
77
8.1.2 Biological Test Data Laboratory bioassay test data should be tabulated and reported in hard-copy and electronic formats to Ecology. Reported data should include all test, reference, negative control and positive control data. Positive control charts should be submitted showing at least the last 12 months of positive control data or the last 15 control tests whichever is greater. The laboratory bioassay test, control and reference results should be tabulated in the EIM Bioassay data spreadsheets following Ecology’s EIM data submittal guidelines and the bioassay data entry business rule in Subappendix E. The EIM spreadsheets, Submittal Guidelines and Data Entry Help documents are available through the following two links. https://fortress.wa.gov/ecy/eimimport/submit.htm http://www.ecy.wa.gov/eim/helpDocs.htm Laboratory bioassay data tabulated in spreadsheets and copies of the actual bench sheet raw data should also be reported to Ecology in hard copy format. Finally, all other pertinent test data listed under Data Reporting Requirements in the protocols for each sediment toxicity test (PSEP 1995, ASTM E1706-00) should also be included in an appendix to the data report.
8.1.3 Data Interpretation Project proponents should submit a data summary report that interprets chemical and/or biological test results compared to the legally applicable or recommended chemical and/or biological effects criteria (see Table 1 & 2) identified in the SMS rule and MyEIM. Samples that exceed criteria and their respective values should be identified by footnoting, underlining, shading, or other similar means in the hardcopy data report summary. Ecology will primarily use the MyEIM automated chemistry and bioassay analysis tools to interpret all laboratory results. Although Ecology does not require laboratories to conduct statistical and/or numerical interpretations of the test data, such testing may be useful for the laboratory to evaluate laboratory performance. Bioassay laboratories are required to conduct evaluations of positive control data for all laboratory bioassay animals. Bioassay laboratories should maintain a “running account” of the mean + 2 standard deviation for each animal type and each positive control result. Ecology does require project proponents to conduct and report interpretations of the laboratory reported data. We recommend project proponents use the MyEIM analysis tools report export formats to create and report interpretation results, as these tools are developed, approved and supported by Ecology. However, project proponents may use other interpretation tools and/or methods identified in the sampling and analysis plan, if approval is obtained from Ecology prior to implementation. Additionally, procedures for interpreting sediment chemistry and biological data in the context of the sediment source control process of the SMS are described in Chapter 8 of SCUM1 (Ecology 1993). Procedures for interpreting sediment chemistry and biological data in the context of the sediment cleanup process of the SMS are described in Chapters 2, 3, and 4 of SCUM2 (Ecology 1991). Example worksheets
Sediment Sampling and Analysis Plan Appendix February 2008
78
presented in SCUM1 (Ecology 1993) or SCUM2 (Ecology 1991) are helpful aids to inter-pret the data in light of the sediment source control standards or sediment cleanup standards of the SMS, as appropriate for the specific sediment investigation.
8.2 RECORD KEEPING Provisions should be included in all sediment sampling and analysis plans for record keeping in accordance with the requirements of the Records Management section of the SMS (WAC 173-204-610). The project proponent is required to keep on file copies of the sediment sampling and analysis plan and the associated quality assurance project plan that document the proposed approach to the collection and analysis of samples. In addition, records (including field logs) that document any departures from the sampling and analysis plan and/or quality assurance project plan should also be kept on file. The results of all analyses, including laboratory reports and any summary tables or interpretive reports, should also be retained. All such records should be maintained for a period of not less than 10 years after the issuance, modification, or renewal of the applicable permit, or administrative order, or certification, or cleanup site delisting, whichever is later. These records must be furnished upon request or made available for inspection by any authorized representative of Ecology.
8.3 REPORTING
The results of sediment sampling and analyses should be provided to Ecology in written reports. Additional requirements for cleanup studies and remedial investigations are described in Chapter 7 of SCUM2 (Ecology 1991). The guidance below will help ensure that consistent and complete sediment data are provided to comply with cleanup and source control investigation requirements. Additionally, the guidance will help ensure compatibility with the Ecology EIM and MyEIM and will decrease Ecology review time. Compliance with these procedures will allow for efficient review of the data by Ecology staff and should result in timely and accurate decision making and evaluation of the data. The minimum information to be included in the written report is listed below.
A brief statement of the purpose of the sediment investigation. A brief summary of the field sampling and laboratory analytical procedures
followed. In lieu of repeating information already reported in a previously submitted sampling and analysis plan, reference can be made to the sampling and analysis plan, and any deviations from that plan that were necessitated by conditions encountered during monitoring should be noted.
A general vicinity map showing the location of the site with respect to familiar
landmarks and a sampling station map showing the relationship of the station locations to outfalls, storm drains, or other pertinent nearby features. Coordinate values (i.e., latitude and longitude) and their datum should be reported in an accompanying table for all stations, including background or reference stations; stormwater/CSO outfalls; and the outfall diffuser beginning and end points. An electronic GIS (Geographic Information Systems) shape
Sediment Sampling and Analysis Plan Appendix February 2008
79
file with projection details enabling Ecology to view proposed sampling stations relative to, but not limited to, outfall with diffuser delineated, storm water/CSO outfalls, creeks/streams/rivers entering the main water body, pier structures, pilings, bulk heads, and sites of interest to the project to support current and future Ecology data analyses is recommended to use.
Sediment data tables summarizing the chemical and conventional variables
results, as well as pertinent QA/QC data. The data tables should include station numbers and sample numbers (corresponding to laboratory data sheets), station elevation (water depth), sample collection date, sediment sampling interval (upper and lower sediment sampling depth in specified units of measurement, such as cm, m, ft, in), and whether samples are replicates. Chemical data should be converted the same units as the to be compared criteria (e.g., mg/kg dry weight for metals, mg/kg TOC for nonionizable organics, ppm). Additionally, chemical data for most organic compounds should also be reported as dry-weight concentrations (ug/kg dry weight, ppb). Practical Quantitation limits should be reported for the results qualified with JT (See Subappendix E for qualifier description) or U (Undetected) or U containing qualifiers.
Sediment data table summarizing all biological results, including the results of
any statistical analyses of the biological results. Biological test data and statistical analysis should be reported according to the endpoints established by the SMS (For marine tests, WAC 173-204-320(3)). For example amphipod bioassays should be reported as percent mortality, and benthic infaunal evaluations should be reported as test sediment abundance of major taxa (Crustacea, Mollusca, and Polychaeta) relative to the reference sediment mean abundance.
The project proponent's interpretation of the results of the sediment
investigation. This section should include discussion of any chemical or biological exceedances of the SQS, CSL, MCUL, or SIZmax, as appropriate to the purpose of the sediment investigation. Comparison with the SQS should be discussed in all cases. Comparisons with the CSL should be discussed for contaminated areas that have not yet been ranked and placed on state or federal site lists. Comparisons with the MCUL should be discussed for cleanup study reports and RI/FS reports. Comparisons with the SIZmax should be discussed for data associated with permitted discharges. Maps should also be provided that clearly indicate the areas that exceed the SQS and CSL/MCUL/SIZmax (whichever is appropriate).
Copies of complete laboratory data packages, as appendices or attachments. Quality assurance reports, as appendices or attachments. Copies of field logs, as appendices or attachments. Copies of signed chain-of-custody forms, as appendices or attachments.
Sediment Sampling and Analysis Plan Appendix February 2008
80
In addition to a written report, Ecology requires that all data be submitted electronically using EIM templates (XML or comma/tab-delimited formats). Sometimes the XLS format is requested when the Ecology data coordinator is asked to edit the data to correct the minor data entry errors by the data submitter. Ecology uses MyEIM to compile and analyze sediment data. For the most updated electronic EIM data entry templates, please see the Ecology EIM website at http://www.ecy.wa.gov/eim/ The sediment related EIM data entry business rule in Subappendix E depicts the business rules for the valid values, required or recommended format of data or information going into required fields on three major parts of EIMM data loading electronic templates: Study Form, Location Spreadsheet, and Results Data or Bioassay Data Spreadsheet. The EIM spreadsheets, Submittal Guidelines, data dictionary and Data Entry Help documents are available through the following two links. https://fortress.wa.gov/ecy/eimimport/submit.htm http://www.ecy.wa.gov/eim/helpDocs.htm The Toxics Cleanup Program’s EIM Sediment Data Coordinator, Tuan Vu - [email protected] or (360) 407-7449, is available for sediment data submittal technical help to site managers and consultants using EIM. Different sections within Ecology may need to review or access the data in the final report. Listed below are the appropriate locations for data submittals. One or more of the following may apply. Reports for all source control investigations and NPDES permit required monitoring should be sent to BOTH of the following:
The facility NPDES permit manager, AND Sharon R. Brown or Donna Podger, Sediment Source Control Specialist Toxics Cleanup Program Sediment Management Unit Department of Ecology P.O. Box 47600 Olympia, WA 98504-7600
All cleanup studies/investigations should be sent to Two of the following: The Cleanup site manager, AND
For the Northwest Region (from King County north) Bradley Helland or Grant Yang, Sediment Cleanup Specialists Toxics Cleanup Program - NWRO Department of Ecology 3190 - 160th Ave SE Bellevue, WA 98008-5452
Sediment Sampling and Analysis Plan Appendix February 2008
81
For the Southwest Region (from Pierce County south) Cynthia Erickson, Sediment Cleanup Specialist Toxics Cleanup Program - SWRO Department of Ecology P.O. Box 47775 Olympia, WA 98504-7775
For the Headquarter (Puget Sound Initiative Sites)
Pete Adolphson, Ted Benson, Kevin Maclachlan, Russ McMillan, Stacie Singleton, Sediment Cleanup Specialists Toxics Cleanup Program - HQ Department of Ecology P.O. Box 47600 Olympia, WA 98504-7600
9. HEALTH AND SAFETY PLAN
The health and safety of the sampling team is a primary concern during sampling operations. The process for addressing these topics should be organized, comprehensive and well documented while ensuring that such concerns do not interfere with the collection of quality data. All sediment sampling and analysis plans should include as an appendix or attachment a health and safety plan (HSP) that covers all aspects of worker safety while employees are engaged in sediment sampling and analyses. A HSP is required for sediment sampling at sites listed under one or more of the following: Sediment Management Standards (SMS, WAC 173-204-560(6) ), Model Toxics Control Act (MTCA, WAC 173-340-810), and Comprehensive Environmental Response, Compensation, and Liability Act (CERCLA). A HSP is also required for any other area that is known to be contaminated by toxic materials. The HSP must meet the requirements of the Occupational Safety and Health Act of 1970(29 U.S.C. Sec. 651 et seq.) and the Washington Industrial Safety and Health Act (Chapter 49.17 RCW). At a minimum, the following contents should be included:
Description of tasks to be performed Key personnel and responsibilities Chemical and physical hazards associated with the site, including potential
contaminants and chemicals used during the investigation, hazards associated with these substances, physical hazards associated with shipboard and land-based sampling activities, heat and cold stress, locations of subsurface utilities and obstructions on the site, falling hazards, and confined spaces
Safety and health risk analysis for each task and operation Air monitoring plan, including ambient air monitoring, personal monitoring,
monitoring equipment, and use and calibration of monitoring equipment Personal protective equipment that will be used for site tasks, and criteria for
upgrading and downgrading protective equipment based on monitoring and changes in ambient contaminant levels or other site hazards
Work zones, including control zone, decontamination zone, and exclusion
zone, and the methods used to demarcate these areas Decontamination procedures for personnel, protective equipment, and
sampling equipment Procedures for disposal of contaminated media and equipment
Sediment Sampling and Analysis Plan Appendix February 2008
82
Sediment Sampling and Analysis Plan Appendix February 2008
83
Safe work practices, including operation of sampling equipment and general site safety
Standard operating procedures, including fit tests for respirators Contingency plan, including evacuation procedures and criteria, emergency
phone numbers (e.g. the telephone number of the 13th Coast Guard District Rescue Coordination Center when operating on a vessel), addresses of hospitals, and maps showing routes to hospitals
Personnel training requirements, including health and safety training courses
and site briefings Medical surveillance program Record keeping procedures.
All members of a sampling team working at a hazardous site must receive 40 hours of hazardous waste operations (HAZWOPER) training as prescribed by OSHA Regulation 29 CFR 1910.120, and at least one member must receive supervisory training. Employers must make a medical monitoring program available to all crew members conducting sampling operations at hazardous sites. All sampling team members must read and understand the contents of the HSP prior to the commencement of field work, and verify such by signature on the original HSP document. Special attention should be given to physical dangers such as slip, trip and fall hazards when working around water. In general, it is recommended that the sample collector(s) avoid skin contact with all sediments and inhalation of odor should be avoided. Special precautions may have to be taken when working with contaminated sediments especially near potential or known contaminant sources such as unpermitted outfalls, NPDES permitted outfalls, landfills or hazardous waste sites.
10. PROJECT PERSONNEL AND RESPONSIBILITIES Sediment sampling and analysis plans should include a brief description of the responsi-bilities of the sediment sampling program personnel. For most sediment sampling programs, the field crew will generally consist of a chief scientist and one or more field technicians. The chief scientist is responsible for overseeing all aspects of the field sampling, ensuring adherence to the sampling plan, ensuring accurate station locations, making decisions on deviations from the plan necessitated by field conditions, completing chain-of-custody forms, and keeping necessary records (e.g., field logs). The field technicians are generally responsible for assisting with sample collection, handling, and storage. One member of the field crew should be designated as the field safety officer. In addition to the field crew, the sampling and analysis plan should indicate the project manager, who is responsible for overall management of the investigation and who serves as the point of contact with Ecology, and a QA/QC coordinator, who is responsible for preparation of the quality assurance project plan, interactions with the analytical laboratories, and data validation activities. A table specifically identifying the individual(s) and their project responsibilities should be included in any sampling and analysis plan. The overall quality of a sediment investigation is highly dependent on the level of oversight provided by project personnel, especially during the analytical phase. It is critical that the laboratory technicians know the applicable practical quantitation limits (see Table 5) and QA/QC requirements (see Section 7) for each of the analyses. In the event of failure to meet these requirements, reanalysis needs to be undertaken with appropriate corrective measures (e.g., additional sample cleanup steps). The QA/QC coordinator and/or project manager should also be contacted immediately regarding failure to meet the QA/QC and/or practical quantitation limit requirements. The most common failure in the laboratory tests of the sampling and analysis investigations has been the failure of the laboratory to meet control limits and/or practical quantitation limits and no effort has been made to re-analyze or to conduct additional cleanup on the extract and then re-analyze. This can only be prevented when the responsible QA/QC coordinator and project manager maintain contact with the laboratory throughout the analyses to ensure that the required practical quantitation limits and QA/QC requirements are met. When a failure to meet these conditions occurs, appropriate measures need to be initiated immediately to avoid exceedance of maximum sample holding time.
Sediment Sampling and Analysis Plan Appendix February 2008
84
11. REFERENCES Ahrens, M. J. and C. Hickey. 2002. UV-photoactivation of polycyclic aromatic hydrocarbons and the sensitivity of sediment-dwelling estuarine organisms. National Institute of Water & Atmospheric Research Conference: UV Radiation and its Effects: an update. 26–28 March 2002. Antarctic Centre, Christchurch, New Zealand. APHA. 1989. Standard methods for the examination of water and wastewater. 17th Edition. L.S. Clesceri, A.E. Greenberg, and R.R. Trussel (eds). American Public Health Association, Washington, DC. ASTM. 2002. Standard guide for collection, storage, characterization, and manipulation of sediments for toxicological testing. ASTM Standard No. E1391-02. American Society for Testing and Materials, Philadelphia, PA. ASTM. 1998. Standard guide for conducting the frog embryo teratogenesis assay-Xenopus (FETAX). E1439-98. American Society for Testing and Materials, Philadelphia, PA. ASTM. 2000. Test method for measuring the toxicity of sediment – associated contaminants with freshwater invertebrates. ASTM Standard No. E1706-00e1. American Society for Testing and Materials, Philadelphia, PA. Barrick, R.C., D.S. Becker, L.B. Brown, H. Beller, and R. Pastorok. 1988. Sediment quality values refinement: 1988 update and evaluation of Puget Sound AET. Volume I. Final Report. Prepared for Tetra Tech, Inc., Bellevue, WA, and the U.S. Environmental Protection Agency, Seattle, WA. PTI Environmental Services, Bellevue, WA. Baudo, R. 1990. Sediment sampling, mapping and data analysis. pp. 15–60. In: Sediments: Chemistry and Toxicity of In-Place Pollutants. R. Baudo, J. Giesy, and H. Muntau (eds). Lewis Publishers, Ann Arbor, MI. Betts, B. 1995. Review of new scientific information and proposed modifications to the SMS rule: amphipod bioassay. Memorandum dated May 1995. Washington Department of Ecology, Olympia, WA. Bragdon-Cook, K. 1995. Review of new scientific information for SMS rule triennial review: Sediment Management Standards detection limits. Memorandum dated May 1995. Washington Department of Ecology, Olympia, WA. Burton, G.A., Jr. (ed.) 1992. Sediment toxicity assessment. Lewis Publishers, Boca Raton, FL. Ecology. 1991. Sediment cleanup standards user manual (SCUM2). First Edition. Washington Department of Ecology, Sediment Management Unit, Olympia, WA. Ecology. 1993. Sediment source control standards user manual (SCUM1). Washington Department of Ecology, Sediment Management Unit, Olympia, WA. Sediment Sampling and Analysis Plan Appendix February 2008
85
Sediment Sampling and Analysis Plan Appendix February 2008
86
Ecology, 2001. Model Toxics Control Act (MTCA) Cleanup Regulation, Chapter 173-340 WAC, Publication No. 94-06. Washington Department of Ecology, Toxics Cleanup Program, Olympia, WA. Ecology, 1995. Sediment Management Standards (SMS), Chapter 173-204 WAC, Publication No. 96-252, Olympia, WA. Geller, J.B., J.T. Carlton, and D.A. Powers. 1993. Interspecific and intrapopulation variation in mitochondrial ribosomal DNA sequences of Mytilus spp. (Bivalvia: Mollusca). Molecular Mar. Biol. and Technol. 2:44–50. McDonald, J.H., and R.K. Koehn. 1988. The mussels Mytilus galloprovincialis and M. trossulus on the Pacific coast of North America. Mar. Biol. 99:111–118. McDonald, J.H., R. Seed, and R.K. Koehn. 1991. Allozymes and morphometric characters of three species of Mytilus in the Northern and Southern Hemispheres. Mar. Biol. 111:323–333. Michelsen, T.C. 1992. Organic carbon normalization of sediment data. Technical Information Memorandum. Washington Department of Ecology, Olympia, WA. Michelsen, T.C., and D. Turner. 1992. Recommendations for reporting sediment data. Technical Information Memorandum. Washington Department of Ecology, Olympia, WA. Microbics Corporation. 1992. Microtox® manual, Volume 2: detailed protocols, 1992 edition. Microbics Corporation, Carlsbad, CA. Mudroch, A., and S.D. MacKnight. 1991. Handbook of techniques for aquatic sediments sampling. CRC Press, Boca Raton, FL. Nebeker, A.V., M.A. Cairns, J.H. Gakstatter, K.W. Malveg, G.S. Schuytema, and D.F. Krawczyk. 1984. Biological methods for determining toxicity of contaminated freshwater sediments to invertebrates. Environ. Toxicol. Chem. 3:617–630. Plumb, R.H., Jr. 1981. Procedure for handling and chemical analysis of sediment and water samples. Technical Report EPA/CE-81-1. U.S. Environmental Protection Agency and U.S. Corps of Engineers, Waterways Experiment Station, Vicksburg, MS. PSEP. 1986. Recommended protocols for measuring conventional sediment variables in Puget Sound. Final Report. Prepared for U.S. Environmental Protection Agency, Seattle, WA. PSEP. 1998. Recommended protocols for station positioning in Puget Sound. Final Report. Prepared for U.S. Environmental Protection Agency, Seattle, WA. PSEP. 1987. Recommended protocols for sampling and analyzing subtidal benthic macroinvertebrate assemblages in Puget Sound. Final Report. Prepared for U.S. Environmental Protection Agency, Seattle, WA.
Sediment Sampling and Analysis Plan Appendix February 2008
87
PSEP. 1997a. Recommended protocols for measuring metals in Puget Sound marine water, sediment, and tissue samples. Final Report. Prepared for U.S. Environmental Protection Agency, Seattle, WA. PSEP. 1997b. Recommended guidelines for measuring organic compounds in Puget Sound water, sediment and tissue samples. Final Report. Prepared for U.S. Environmental Protection Agency, Seattle, WA. PSEP. 1997c. Recommended guidelines for sampling marine sediment, water column, and tissue in Puget Sound. Final Report. Prepared for U.S. Environmental Protection Agency, Seattle, WA. PSEP. 1991. Reference area performance standards for Puget Sound. EPA 910/9-91-041. Puget Sound Estuary Program, U.S. Environmental Protection Agency Region 10, Seattle, WA. PSEP. 1995. Recommended guidelines for conducting laboratory bioassays on Puget Sound sediments. Interim Final Report. Puget Sound Estuary Program, U.S. Env-ironmental Protection Agency Region 10, Seattle, WA. PTI. 1989a. Puget Sound Dredged Disposal Analysis guidance manual: data quality evaluation for proposed dredged material disposal projects. Prepared for the Washington Department of Ecology, Olympia, WA. PTI Environmental Services, Bellevue, WA. PTI. 1989b. Data validation guidance manual for selected sediment variables. Prepared for the Washington Department of Ecology, Olympia, WA. PTI Environmental Services, Bellevue, WA. Rantala, R.T.T., and D.H. Loring. 1975. Multi-element analysis of silicate rocks and marine sediments by atomic absorption spectrophotometry. Atomic Abs. Newsletter 14(5)117–120. U.S. EPA. 1983. Methods for chemical analysis of water and wastes. EPA 600/4-79-020. U.S. Environmental Protection Agency, Environmental Monitoring and Support Lab-oratory, Cincinnati, OH. U.S. EPA. 1986. Method 9060: Total Organic Carbon, Test procedures for solid waste. 3rd Edition. SW-846. U.S. Environmental Protection Agency, Office of Solid Waste and Emergency Response, Washington, DC. U.S. EPA. 1991. Method 1624C: volatile organic compounds by isotope dilution GC/MS. Method 1625C: semivolatile organic compounds by isotope dilution GC/MS. U.S. Environmental Protection Agency, Office of Water Regulations and Standards, Industrial Technology Division, Washington, DC. U.S. EPA. 1991. Analytical method for determination of acid volatile sulfide in sediment. U.S. Environmental Protection Agency, Office of Science and Technology, Health and Ecological Criteria Division, Washington, DC.
Sediment Sampling and Analysis Plan Appendix February 2008
88
U.S. EPA. 1994. Methods for measuring the toxicity and bioaccumulation of sediment-associated contaminants with freshwater invertebrates. EPA 600/R-94/024. U.S. Environmental Protection Agency, Office of Research and Development, Washington, DC. U.S. EPA. 1994. Method 7471A: Mercury in Solid or Semisolid Waste (Manual Cold-Vapor Technique). U.S. Environmental Protection Agency, Office of Solid Waste and Emergency Response, Washington, DC. U.S. EPA. 1994. Method 1613: Tetra- through Octa-Chlorinated Dioxins and Furans by Isotope Dilution HRGC/HRMS. EPA 821/B-94/005. U.S. Environmental Protection Agency, Office of Water Engineering and Analysis Division, Washington, DC. U.S. EPA. 1996. Method 8270C: Semivolatile organic compounds by Gas Chromatography/Mass Spectrometry (GC/MS). U.S. Environmental Protection Agency, Office of Solid Waste and Emergency Response, Washington, DC.
SUBAPPENDIX A
SEDIMENT MANAGEMENT CONTACT LIST
Sediment Sampling and Analysis Plan Appendix February 2008
A-1

Sediment Sampling and Analysis Plan Appendix February 2008
A-2
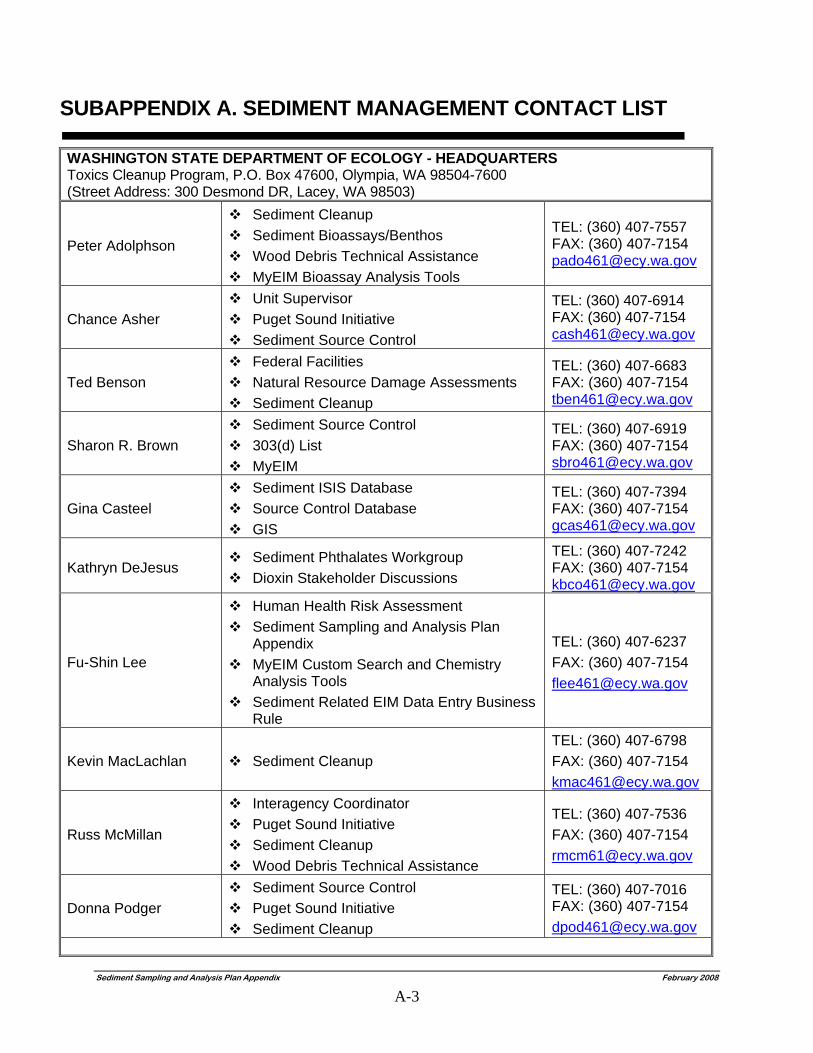
Sediment Sampling and Analysis Plan Appendix February 2008
A-3
SUBAPPENDIX A. SEDIMENT MANAGEMENT CONTACT LIST
WASHINGTON STATE DEPARTMENT OF ECOLOGY - HEADQUARTERS Toxics Cleanup Program, P.O. Box 47600, Olympia, WA 98504-7600 (Street Address: 300 Desmond DR, Lacey, WA 98503)
Peter Adolphson
Sediment Cleanup Sediment Bioassays/Benthos Wood Debris Technical Assistance MyEIM Bioassay Analysis Tools
TEL: (360) 407-7557 FAX: (360) 407-7154 [email protected]
Chance Asher Unit Supervisor Puget Sound Initiative Sediment Source Control
TEL: (360) 407-6914 FAX: (360) 407-7154 [email protected]
Ted Benson Federal Facilities Natural Resource Damage Assessments Sediment Cleanup
TEL: (360) 407-6683 FAX: (360) 407-7154 [email protected]
Sharon R. Brown Sediment Source Control 303(d) List MyEIM
TEL: (360) 407-6919 FAX: (360) 407-7154 [email protected]
Gina Casteel Sediment ISIS Database Source Control Database GIS
TEL: (360) 407-7394 FAX: (360) 407-7154 [email protected]
Kathryn DeJesus Sediment Phthalates Workgroup Dioxin Stakeholder Discussions
TEL: (360) 407-7242 FAX: (360) 407-7154 [email protected]
Fu-Shin Lee
Human Health Risk Assessment Sediment Sampling and Analysis Plan
Appendix MyEIM Custom Search and Chemistry
Analysis Tools Sediment Related EIM Data Entry Business
Rule
TEL: (360) 407-6237 FAX: (360) 407-7154 [email protected]
Kevin MacLachlan Sediment Cleanup TEL: (360) 407-6798 FAX: (360) 407-7154 [email protected]
Russ McMillan
Interagency Coordinator Puget Sound Initiative Sediment Cleanup Wood Debris Technical Assistance
TEL: (360) 407-7536 FAX: (360) 407-7154 [email protected]
Donna Podger Sediment Source Control Puget Sound Initiative Sediment Cleanup
TEL: (360) 407-7016 FAX: (360) 407-7154 [email protected]
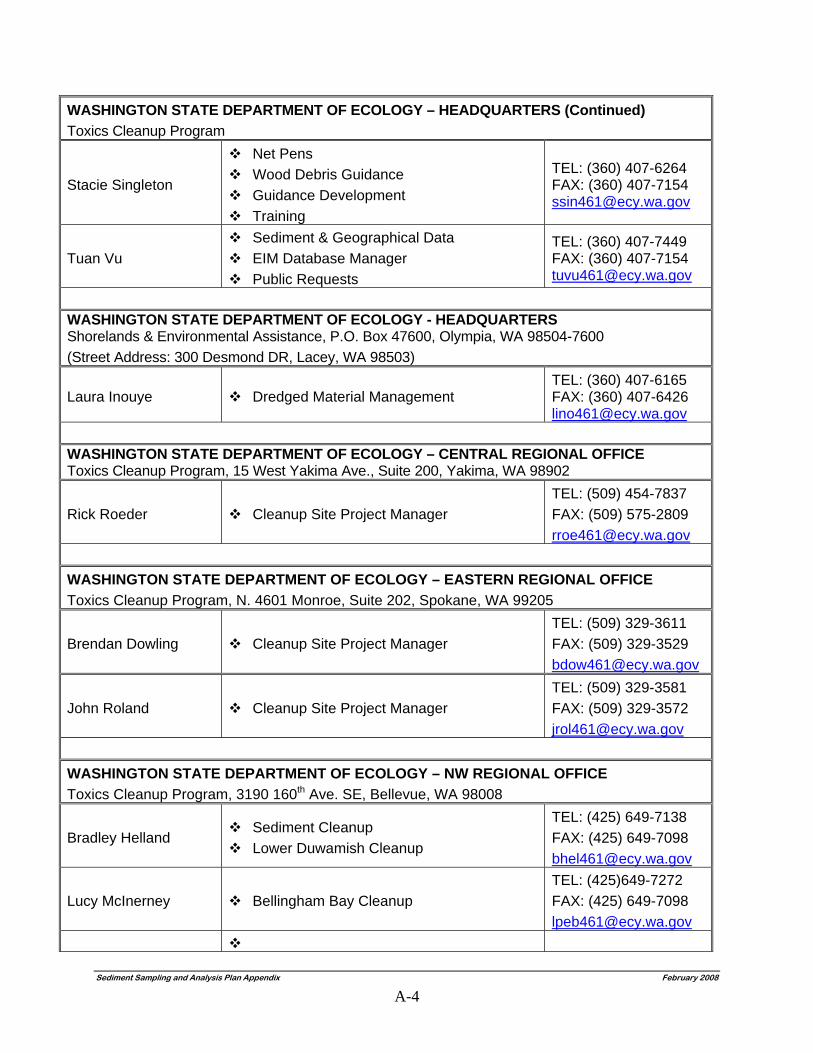
Sediment Sampling and Analysis Plan Appendix February 2008
A-4
WASHINGTON STATE DEPARTMENT OF ECOLOGY – HEADQUARTERS (Continued) Toxics Cleanup Program
Stacie Singleton
Net Pens Wood Debris Guidance Guidance Development Training
TEL: (360) 407-6264 FAX: (360) 407-7154 [email protected]
Tuan Vu Sediment & Geographical Data EIM Database Manager Public Requests
TEL: (360) 407-7449 FAX: (360) 407-7154 [email protected]
WASHINGTON STATE DEPARTMENT OF ECOLOGY - HEADQUARTERS Shorelands & Environmental Assistance, P.O. Box 47600, Olympia, WA 98504-7600 (Street Address: 300 Desmond DR, Lacey, WA 98503)
Laura Inouye Dredged Material Management TEL: (360) 407-6165 FAX: (360) 407-6426 [email protected]
WASHINGTON STATE DEPARTMENT OF ECOLOGY – CENTRAL REGIONAL OFFICE Toxics Cleanup Program, 15 West Yakima Ave., Suite 200, Yakima, WA 98902
Rick Roeder Cleanup Site Project Manager TEL: (509) 454-7837 FAX: (509) 575-2809 [email protected]
WASHINGTON STATE DEPARTMENT OF ECOLOGY – EASTERN REGIONAL OFFICE Toxics Cleanup Program, N. 4601 Monroe, Suite 202, Spokane, WA 99205
Brendan Dowling Cleanup Site Project Manager TEL: (509) 329-3611 FAX: (509) 329-3529 [email protected]
John Roland Cleanup Site Project Manager TEL: (509) 329-3581 FAX: (509) 329-3572 [email protected]
WASHINGTON STATE DEPARTMENT OF ECOLOGY – NW REGIONAL OFFICE Toxics Cleanup Program, 3190 160th Ave. SE, Bellevue, WA 98008
Bradley Helland Sediment Cleanup Lower Duwamish Cleanup
TEL: (425) 649-7138 FAX: (425) 649-7098 [email protected]
Lucy McInerney Bellingham Bay Cleanup TEL: (425)649-7272 FAX: (425) 649-7098 [email protected]
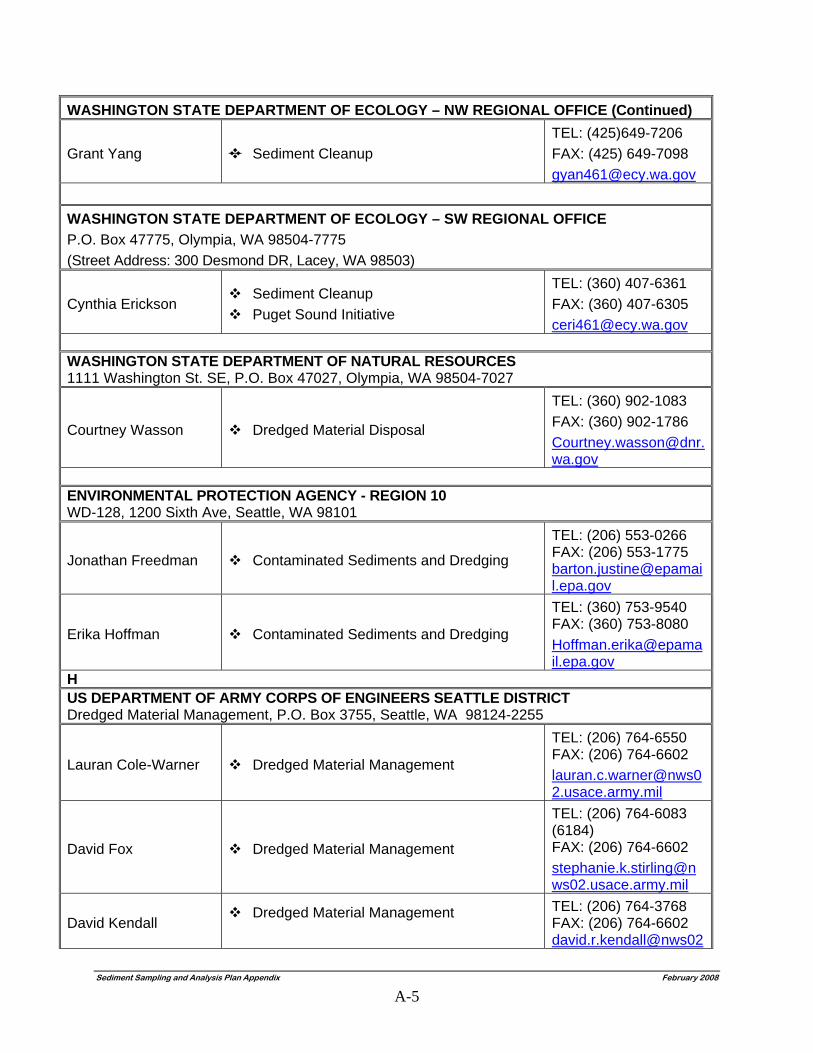
Sediment Sampling and Analysis Plan Appendix February 2008
A-5
WASHINGTON STATE DEPARTMENT OF ECOLOGY – NW REGIONAL OFFICE (Continued)
Grant Yang Sediment Cleanup TEL: (425)649-7206 FAX: (425) 649-7098 [email protected]
WASHINGTON STATE DEPARTMENT OF ECOLOGY – SW REGIONAL OFFICE P.O. Box 47775, Olympia, WA 98504-7775 (Street Address: 300 Desmond DR, Lacey, WA 98503)
Cynthia Erickson Sediment Cleanup Puget Sound Initiative
TEL: (360) 407-6361 FAX: (360) 407-6305 [email protected]
WASHINGTON STATE DEPARTMENT OF NATURAL RESOURCES 1111 Washington St. SE, P.O. Box 47027, Olympia, WA 98504-7027
Courtney Wasson Dredged Material Disposal
TEL: (360) 902-1083 FAX: (360) 902-1786 [email protected]
ENVIRONMENTAL PROTECTION AGENCY - REGION 10 WD-128, 1200 Sixth Ave, Seattle, WA 98101
Jonathan Freedman Contaminated Sediments and Dredging
TEL: (206) 553-0266 FAX: (206) 553-1775 [email protected]
Erika Hoffman Contaminated Sediments and Dredging
TEL: (360) 753-9540 FAX: (360) 753-8080 [email protected]
H US DEPARTMENT OF ARMY CORPS OF ENGINEERS SEATTLE DISTRICT Dredged Material Management, P.O. Box 3755, Seattle, WA 98124-2255
Lauran Cole-Warner Dredged Material Management
TEL: (206) 764-6550 FAX: (206) 764-6602 [email protected]
David Fox Dredged Material Management
TEL: (206) 764-6083 (6184) FAX: (206) 764-6602 [email protected]
David Kendall Dredged Material Management
TEL: (206) 764-3768 FAX: (206) 764-6602 david.r.kendall@nws02
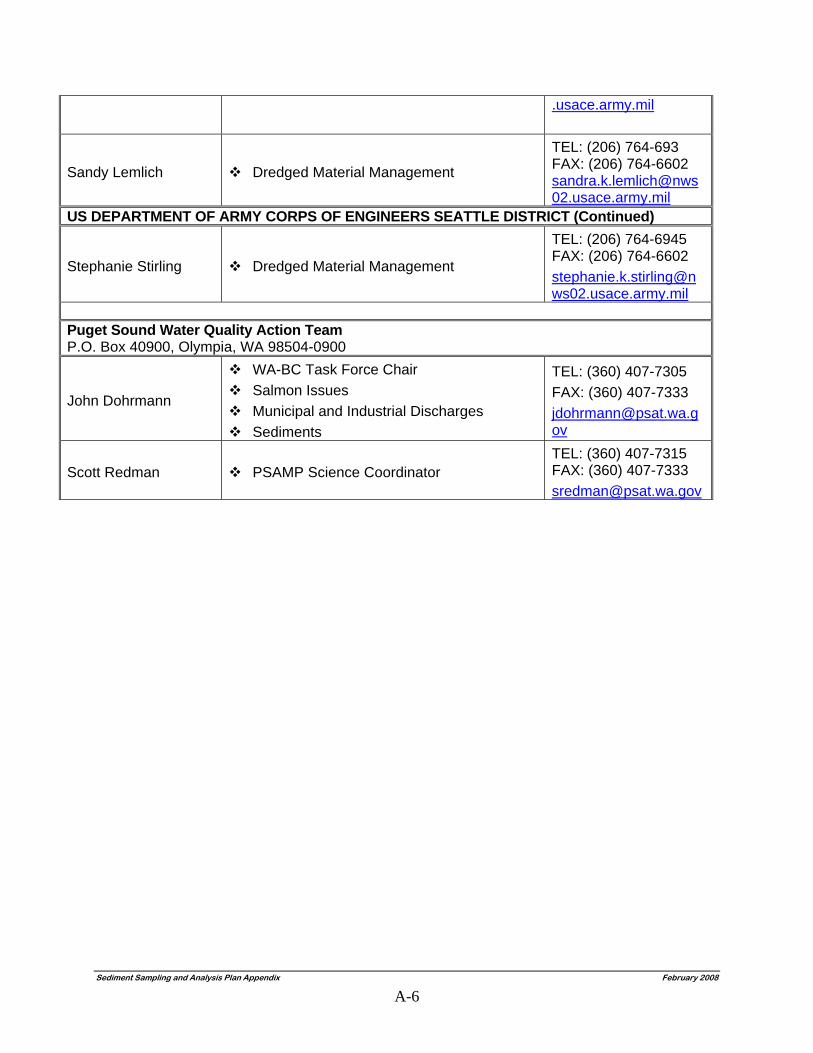
Sediment Sampling and Analysis Plan Appendix February 2008
A-6
.usace.army.mil
Sandy Lemlich Dredged Material Management
TEL: (206) 764-693 FAX: (206) 764-6602 [email protected]
US DEPARTMENT OF ARMY CORPS OF ENGINEERS SEATTLE DISTRICT (Continued)
Stephanie Stirling Dredged Material Management
TEL: (206) 764-6945 FAX: (206) 764-6602 [email protected]
Puget Sound Water Quality Action Team P.O. Box 40900, Olympia, WA 98504-0900
John Dohrmann
WA-BC Task Force Chair Salmon Issues Municipal and Industrial Discharges Sediments
TEL: (360) 407-7305 FAX: (360) 407-7333 [email protected]
Scott Redman PSAMP Science Coordinator TEL: (360) 407-7315 FAX: (360) 407-7333 [email protected]
APPENDIX B
MARINE MICROTOX® 100 PERCENT SEDIMENT POREWATER TOXICITY ASSESSMENT
Prepared by: Peter Adolphson Sediment Management Unit Toxics Cleanup Program Washington State Department of Ecology
Sediment Sampling and Analysis Plan Appendix February 2008
B-1

Sediment Sampling and Analysis Plan Appendix February 2008
B-2
APPENDIX B. MARINE MICROTOX® 100 PERCENT SEDIMENT POREWATER TOXICITY ASSESSMENT Background Microtox is a rapid method of assessing toxicity in aqueous media by utilizing the bioluminescent properties of the marine bacteria Vibrio fischeri. The test method assumes that light emitted by the bacteria can be used as an accurate assessment of the overall biological condition of the bacteria exposed to chemical compounds and mixtures. Light emitted by the bacteria exposed to potentially toxic samples is compared to light emitted to unexposed bacterial controls. Differences in luminescence are therefore deemed an indication of relative toxicity. EPA (EPA/600/2-88/070) has recommended Microtox for TIE/TRE (Toxicity Identification Evaluation/Toxicity Reduction Evaluation) applications as well as stormwater investigations. Successful applications also include NPDES compliance and sediment evaluations in freshwater, estuarine and marine applications. Washington State PSEP (1995) uses both an organic and a saline extraction protocol to assess sediment toxicity. True and Heyward (1989) demonstrated that the Microtox test on undiluted interstitial water showed greater sensitivity than that with the saline extract. Recognizing that the goal of most sediment toxicity studies is to determine if ecologically/toxicologically significant differences exist between reference and investigative site sediments, four significant differences exist between the PSEP protocol and this revised protocol. 1) Extraction procedures are 100% pore water extraction rather than complex organic and aqueous extractions; 2) No serial dilutions are performed because LC50 calculations are not required to assess sediment toxicity between reference and site sediments; 3) No MOAS (Microtox Osmotic Adjusting Solution) is utilized; and 4) Statistical procedures utilize standard Analysis of Variance (ANOVA) or t-test procedures. Microtox Test Procedure: Porewater Extraction and Adjustment The general Microtox procedure involves centrifugation of 500ml of both reference and test sediments at approximately 4500G in for 30 minutes resulting in approximately 50 ml of pore water. Minimal disturbance of the field-collected samples prior to centrifugation is (e.g. compositing of numerous subsamples followed by homogenization) is highly recommended in order to reduce volatilization of potential contaminants. After centrifugation, approximately 25mls of pore water is then pipetted into a clean glass container. The remaining porewater volume is set aside if needed for reducing salinity should the initial salinity adjustments steps outlined below result in the sample exceeding 22ppt. Samples should be adjusted and analyzed within approximately 3 hours of extraction to reduce volatilization of potential chemical contaminants.
Sediment Sampling and Analysis Plan Appendix February 2008
B-3
The sample is then adjusted for salinity, dissolved oxygen and pH in the following order. 1) Salinity is adjusted to 20+ 2ppt using commercially available dry bulk marine
aquarium reef salts (e.g. Forty Fathoms Reef®). [Note: The salinity adjustment step is omitted for Marine and estuarine sediments whose porewater exceeds 20ppt salinity. If porewater salinity exceeds 20ppt, the artificial seawater control should be adjusted to match the test sample salinity + 2ppt; e.g. sample 26ppt, control 24-28ppt].
2) The dissolved oxygen (DO) is then adjusted by gentle aeration or agitation until it is between 50-100% saturation.
3) The pH of the salinity and DO adjusted reference and test sediment pore water should not differ from each other by more than 0.4 pH units. The pH is adjusted to 7.9-8.2 (if necessary) using a micropipette and a dilute solution (0.5 N) NaOH or HCl. Total volume of NaOH and/or HCl should be recorded. Final concentration [compared with 100% porewater extracted] can then be calculated using these data. Final dilution should not be reduced below 90% of the pore water extract. [Note: The control solution is prepared by using deionized or distilled water and adjusting salinity, DO and pH as described above.]
Preparation of Bacterial Suspension and Bioassay Test Setup A vial of freeze-dried bacteria is rehydrated with 1.0 ml of Microtox® Reconstitution solution and allowed to equilibrate for 30-90 minutes in the 4-degree Microtox Analyzer well. [NOTE: Mixing of the reconstituted bacteria is essential. Mix the reconstituted solution with a 1 ml pipette a minimum of 20 times by pipetting. First pipette the solution from the bottom of the cuvette and deposit the pipetted solution on the surface of the liquid remaining in the cuvette. Then pipette 1 ml of solution from the bottom of the cuvette and slowly pipette the liquid into the bottom of the cuvette.] One (1.0) ml of control solution is then placed in each of 5 test cuvettes and placed into the 15-degree incubation chambers. This procedure is followed for the laboratory control solution, reference sediment porewater samples, and test sediment porewater samples, for up to 4 test sediments/batch (5 pseudo-replicates per site). In each of the test, reference, and control sample cuvettes, 10 uL of rehydrated bacteria suspension are added at approximately 10 second intervals, immediately mixed using a 1ml pipette and allowed to incubate (Initial Incubation) for 5 minutes. It is nearly essential at this stage for two technicians to coordinate addition and mixture of the bacterial suspension; one technician adds the bacterial suspension and the second follows performing the mixing procedure. Begin the 5-minute Initial Incubation timer as soon as the 10ul bacterial suspension is placed into the cuvette containing the control sample at position A1. Used pipette tips are replaced with clean tips after each series of 5 pseudo-replicates (ref, control, and each test series eg: A1-A5 etc.). [NOTE: Extreme care must be used when pipetting these low volumes as slight residual amounts or presence of air bubbles in the pipette may cause variation due to error by as much as 100%.]
Sediment Sampling and Analysis Plan Appendix February 2008
B-4
Data collection At the end of the 5-minute Initial Incubation period, the first control vial is placed into the read chamber to “set” the instrument. At this time, start the data collection timer. This is the start of the (I0) 5-minute analysis period. At approximately 10-second intervals each cuvette (inclusive of A1) is placed into the read chamber for the initial reading (I0). After 5 additional minutes a second reading (I5) is obtained following the above procedure. A 15-minute (I15) is obtained in an additional 10 minutes. Data Preparation Ft/It=T1 Fr/Ir=R1 Fc/Ic=C1
This is performed for each replicate: (Example): (T1 +T2 +T3 +T4 +T5 )/5 to provide a mean (Tmean). Where:
I=Initial light reading (This is I0) F=Final light reading (This is either I5 or I15 above depending upon the endpoint) c=control r=reference t=test (sediment station) Example: It=(Initial light output of Test)
Calculation Tmean/Rmean: Data Analysis Statistical calculations are performed using a standard t-test by comparing reference with test site data (see calculation above). No gamma correction is required. Statistically significant differences with α = 0.05 and the following relative differences are indications of test failure. Data Interpretation1 Test mean output (Tmean ) less than 80% of Reference mean output (Tmean/Rmean less than 80%) AND statistically significantly different (α= 0.05) from Reference mean output indicates an SQS failure or “hit”. There is no CSL failure criteria in the Sediment Management Standards (SMS) rule for marine sediments. Quality Control
Sediment Sampling and Analysis Plan Appendix February 2008
B-5
Sediment Sampling and Analysis Plan Appendix February 2008
B-6
1) Control Final mean output should be greater than or equal to 80% of Control Initial mean output. Fc(mean)/Ic(mean) > 0.80.
2) Reference Final mean output should be greater than or equal to 80% of Control Final mean output. Fr(mean)/Fc(mean) > 0.80. Note 1: If reference criteria are not met, Control output may be used for comparison with sediment site light output.
3) Reference Initial mean output (Ir(mean)) must be greater than or equal to 80% of Control Initial mean output (Ic(mean)). Note 2: If Reference Initial mean output is less than 80% of Control Initial mean output, then the Control Initial mean output should be used in place of each of the individual Reference Initial values. (When Ir(mean) < 0.80 of Ic(mean), Ic(mean) is used in place of each Ir.) This may be necessary when the light reduction response occurs so rapidly that the initial test response falls below 80% before the initial measurement is taken.
4) Test Initial mean output (It(mean)) must be greater than or equal to 80% of Control Initial mean output (Ic(mean)). Note 3: If Test Initial mean output is less than 80% of Control Initial mean output, then the Control Initial mean output should be used in place of each of the individual Test Initial values. (When It(mean) < 0.80 of Ic(mean), n Ic(mean) is used in place of each It.) This may be necessary when the light reduction response occurs so rapidly that the initial test response falls below 80% before the initial measurement is taken.
References: U.S. EPA. 1989. Generalized Methodology for Conducting Industrial Toxicity Reduction Evaluations. EPA-600-2-88-070. Office of Research and Development, Cincinnati, OH. PSEP. 1995. Recommended guidelines for conducting laboratory bioassays on Puget Sound sediments. Interim Final Report. Puget Sound Estuary Program, U.S. Environmental Protection Agency Region 10, Seattle, WA. t True, C.J., and A.A. Heywood. 1989. Relationships between Microtox test results, extraction methods, and physical and chemical compositions of marine sediment samples. Toxicity Assessment.
APPENDIX C
FRESHWATER MICROTOX® 100 PERCENT SEDIMENT POREWATER TOXICITY
ASSESSMENT Prepared by: Peter Adolphson Sediment Management Unit Toxics Cleanup Program Washington State Department of Ecology
Sediment Sampling and Analysis Plan Appendix February 2008
C-1

Sediment Sampling and Analysis Plan Appendix February 2008
C-2
APPENDIX C. FRESHWATER MICROTOX® 100 PERCENT SEDIMENT POREWATER TOXICITY ASSESSMENT Background: Microtox is a rapid method of assessing toxicity in aqueous media by utilizing the bioluminescent properties of the marine bacteria Vibrio fischeri. The test method assumes that light emitted by the bacteria can be used as an accurate assessment of the overall biological condition of the bacteria exposed to chemical compounds and mixtures. Light emitted by the bacteria exposed to potentially toxic samples is compared to light emitted to unexposed bacterial controls. Differences in luminescence are therefore deemed an indication of relative toxicity. EPA (EPA/600/2-88/070) has recommended Microtox for TIE/TRE (Toxicity Identification Evaluation/Toxicity Reduction Evaluation) applications as well as stormwater investigations. Successful applications also include NPDES compliance and sediment evaluations in freshwater, estuarine and marine applications. Washington State PSEP (1995) uses both an organic and a saline extraction protocol to assess sediment toxicity. True and Heyward (1989) demonstrated that the Microtox test on undiluted interstitial water showed greater sensitivity than that with the saline extract. Recognizing that the goal of most sediment toxicity studies is to determine if ecologically/toxicologically significant differences exist between reference and investigative site sediments, four significant differences exist between the PSEP protocol and this revised protocol. 1) Extraction procedures are 100% pore water extraction rather than complex organic and aqueous extractions; 2) No serial dilutions are performed because LC50 calculations are not required to assess sediment toxicity between reference and site sediments; 3) No MOAS (Microtox Osmotic Adjusting Solution) is utilized; and 4) Statistical procedures utilize standard Analysis of Variance (ANOVA) or t-test procedures. A significant issue of concern which has persisted over the years due a basic misunderstanding of Vibrio fisheri luminescent response is that of “overluminescence” or light “enhancement”. The term is more appropriately referred to simply as increased light output in order to thwart the notion that an increase in light output is an unknown, unexpected or unnatural phenomenon. Quite the contrary is true. An increase in light output is a natural response of the bacteria to a number of unmeasured factors. These include hardness, alkalinity, TOC, dissolved energy sources, colloids and potentially many others. The purpose of the reference and control samples is to account for these factors, which may cause a decrease or increase in light output. Of greatest importance, however, is the comparison or response between test porewater and that of the control/reference. It is therefore, critical to understand how the Microtox procedure works and what is being measured. Microtox test results are unitless numbers of light output. Values indicated are not percentages. The first step performed with each batch of vials prior to recording
Sediment Sampling and Analysis Plan Appendix February 2008
C-3
Microtox data is “setting” the machine to a baseline output value. This is a type of calibration to the current bacterial batch being used as well as to any uncontrolled test conditions. The baseline output value is normally set with a control vial containing 10µl of bacterial suspension. When this vial is immediately read, its value range is approximately 93-107. For each new batch run, a new “set” procedure is performed.
Knowing this, it should be clear that increase in light output is a normal biological response and can be expected with similar frequency as that of light reduction. Both light increase and light reduction are expected outcomes in controls, reference and test porewater.
Because of this, it is important to compare temporal changes in reference or control light output to temporal changes in test light output. The null hypothesis would be that there is no difference between temporal changes in test light output and temporal changes in reference/control light output. (H0: There is no temporal reduction in test light output compared with reference/control light output.) It is assumed, however, that only light reduction (relative to the reference/control) is an indication of toxicity. The alternative is that there is reduction between temporal changes in test light output and temporal changes in reference/control light output. (H1: The temporal reduction in test light output is greater than temporal reduction in control/reference light output.) Since there is only one possibility for the alternative hypothesis, the statistical analysis is one-tailed t-test.
In order to be conservative with respect to ecological significance, an established benchmark difference between reference and test must also be met. Although statistical differences may exist between test and reference/control, it has been agreed that no significant ecological difference exists between reference/control and test unless the test indicates a temporal reduction in test light output of greater than 10% compared with the change that has occurred in the reference/control. In other words, 10% is an acceptable range of reduction within the normal bounds of ecological variability (noise) in the freshwater environment.
Because of this 10% benchmark of acceptability for reduction, it has been similarly adopted that a 10% increase in temporal light output in the control/reference or test sediments is also within the bounds of normal ecological range. This allows for increases in light output and leads to acceptability up to the limits expressed in QA criteria #3 and #4 below. Beyond these limits, (above 110% Control (Cmean) light output) however, some concern exists with respect to test procedures or organism performance and the tests are determined not to be interpretable. Additionally, if the ratio of Reference mean (Rmean) to Test mean (Tmean) temporal change results in a 10% difference, concern exists that test procedures or organism performance are compromised.
Sediment Sampling and Analysis Plan Appendix February 2008
C-4
Microtox Test Procedure Porewater Extraction and Adjustment The general Microtox procedure involves centrifugation of 500ml of both reference and test sediments at approximately 4500G in for 30 minutes resulting in approximately 50 ml of pore water. Minimal disturbance of the field-collected samples prior to centrifugation is (e.g. compositing of numerous subsamples followed by homogenization) is highly recommended in order to reduce volatilization of potential contaminants. After centrifugation, approximately 25mls of pore water is then pipetted into a clean glass container. The remaining porewater volume is set aside if needed for reducing salinity should the initial salinity adjustments steps outlined below result in the sample exceeding 22ppt. Samples should be adjusted and analyzed within approximately 3 hours of extraction to reduce volatilization of potential chemical contaminants. The sample is then adjusted for salinity, dissolved oxygen and pH in the following order. 1) Salinity is adjusted to 20+ 2ppt using commercially available dry bulk marine
aquarium reef salts (e.g. Forty Fathoms Reef®). 2) The dissolved oxygen (DO) is then adjusted by gentle aeration or agitation until it is
between 50-100% saturation. 3) The pH of the salinity and DO adjusted reference and test sediment pore water should
not differ from each other by more than 0.4 pH units. The pH is adjusted to 7.9-8.2 (if necessary) using a micropipette and a dilute solution (0.5 N) NaOH or HCl. Total volume of NaOH and/or HCl should be recorded. Final concentration [compared with 100% porewater extracted] can then be calculated using these data. Final dilution should not be reduced below 90% of the pore water extract. [Note: The control solution is prepared by using deionized or distilled water and adjusting salinity, DO and pH as described above.]
Preparation of Bacterial Suspension and Bioassay Test Setup A vial of freeze-dried bacteria is rehydrated with 1.0 ml of Microtox® Reconstitution solution and allowed to equilibrate for 30-90 minutes in the 4-degree Microtox Analyzer well. [NOTE: Mixing of the reconstituted bacteria is essential. Mix the reconstituted solution with a 1 ml pipette a minimum of 20 times by pipetting. First pipette the solution from the bottom of the cuvette and deposit the pipetted solution on the surface of the liquid remaining in the cuvette. Then pipette 1 ml of solution from the bottom of the cuvette and slowly pipette the liquid into the bottom of the cuvette.] One (1.0) ml of control solution is then placed in each of 5 test cuvettes and placed into the 15-degree incubation chambers. This procedure is followed for the laboratory control solution, reference sediment porewater samples, and test sediment porewater samples, for up to 4 test sediments/batch (5 pseudo-replicates per site).
Sediment Sampling and Analysis Plan Appendix February 2008
C-5
In each of the test, reference, and control sample cuvettes, 10 uL of rehydrated bacteria suspension are added at approximately 10 second intervals, immediately mixed using a 1ml pipette and allowed to incubate (Initial Incubation) for 5 minutes. It is nearly essential at this stage for two technicians to coordinate addition and mixture of the bacterial suspension; one technician adds the bacterial suspension and the second follows performing the mixing procedure. Begin the 5-minute Initial Incubation timer as soon as the 10ul bacterial suspension is placed into the cuvette containing the control sample at position A1. Used pipette tips are replaced with clean tips after each series of 5 pseudo-replicates (ref, control, and each test series eg: A1-A5 etc.). [NOTE: Extreme care must be used when pipetting these low volumes as slight residual amounts or presence of air bubbles in the pipette may cause variation due to error by as much as 100%.] Data collection At the end of the 5-minute Initial Incubation period, the first control vial is placed into the read chamber to “set” the instrument. At this time, start the data collection timer. This is the start of the (I0) 5-minute analysis period. At approximately 10-second intervals each cuvette (inclusive of A1) is placed into the read chamber for the initial reading (I0). After 5 additional minutes a second reading (I5) is obtained following the above procedure. A 15-minute (I15) is obtained in an additional 10 minutes. Data Preparation Ft/It=T1 Fr/Ir=R1 Fc/Ic=C1
This is performed for each replicate: (Example): (T1 +T2 +T3 +T4 +T5 )/5 to provide a mean (Tmean). Where:
I=Initial light reading (This is I0) F=Final light reading (This is either I5 or I15 above depending upon the endpoint) c=control r=reference t=test (sediment station) Example: It=(Initial light output of Test)
Calculation Tmean/Cmean (Preferred)*1
*If Control quality control performance criteria (see below) are not met Tmean/Rmean may be authorized on a case by case basis for comparison by Ecology. Data Analysis
Sediment Sampling and Analysis Plan Appendix February 2008
C-6
Statistical calculations are performed using a standard t-test by comparing control with test site data (see calculation above). No gamma correction is required. Statistically significant differences with α = 0.05 AND the following relative differences are indications of test failure or test “hit”. Data Interpretation1
Test mean output (Tmean ) less than 90% of Control/Reference mean output (Cmean/Tmean) AND statistically significantly different (α= 0.05) from Control/Reference mean output indicates a SQS “hit” 2,3. Test mean output less than 75% of Control/Reference mean output AND statistically significantly different (α= 0.05) from Control/Reference mean output indicates a CSL “hit”. 1 Data Interpretation is draft guidance and currently under review. This may be modified by Ecology in subsequent guidance. 2,3 See the footnotes 2 & 3 In Quality Control section. Quality Control 1) Control Final mean output should be greater than or equal to 72% of Control Initial
mean output. Fc(mean)/Ic(mean) > 0.72. Note: If Control criteria are not met, Reference output may be used for comparison with test sediment light output.
2) Reference final mean output should be greater than or equal to 80% of Control Final mean output. Fr(mean)/Fc(mean) > 0.80.
3) 2Tmean/Cmean > 1.10 is not interpretable. (see discussion above) 4) 3Tmean/Rmean > 1.10 is not interpretable.(see discussion above) References: U.S. EPA. 1989. Generalized Methodology for Conducting Industrial Toxicity Reduction Evaluations. EPA-600-2-88-070. Office of Research and Development, Cincinnati, OH. PSEP. 1995. Recommended guidelines for conducting laboratory bioassays on Puget Sound sediments. Interim Final Report. Puget Sound Estuary Program, U.S. Environmental Protection Agency Region 10, Seattle, WA. True, C.J., and A.A. Heywood. 1989. Relationships between Microtox test results, extraction methods, and physical and chemical compositions of marine sediment samples. Toxicity Assessment.
Sediment Sampling and Analysis Plan Appendix February 2008
C-7

Sediment Sampling and Analysis Plan Appendix February 2008
C-8
APPENDIX D
RECOMMENDATIONS FOR CONDUCTING BIOASSAYS ON SEDIMENTS CONTAINING
POLYCYCLIC AROMATIC HYDROCARBONS EXPOSED TO ULTRA-VIOLET (UV) RADIATION
Prepared by: Peter Adolphson Sediment Management Unit Toxics Cleanup Program Washington State Department of Ecology
Sediment Sampling and Analysis Plan Appendix February 2008
D-1

Sediment Sampling and Analysis Plan Appendix February 2008
D-2
APPENDIX D. RECOMMENDATIONS FOR CONDUCTING BIOASSAYS ON SEDIMENTS CONTAINING POLYCYCLIC AROMATIC HYDROCARBONS (PAHS)
EXPOSED TO ULTRA-VIOLET (UV) RADIATION When selected polycyclic aromatic hydrocarbons (PAHs) are exposed to ultra-violet radiation, of sufficient quality and quantity, the result is atomic excitation of electron states (Kosian et. al., 1998). This is known as photoactivation. Photoactivation often results in an increase in molecular reactivity or binding capability to other molecules. When this reactivity occurs with molecules that compose organ/tissues of organisms, the result is often increased toxicity to those organisms. This toxicity may manifest itself in whole organism toxicity and death, or sublethal toxicity endpoints including decreased immune response, decreased reproduction or growth, or increased malignant tumor development (Arfsten, et al., 1996). Whatever the individual endpoint, the overall result is decreased individual fitness and potentially detrimental population-level effects. Benthic-dwelling and water column organisms exposed to selected PAHs that are exposed simultaneously to specific wavelengths and intensities of ultra-violet radiation may be at significantly greater risk to toxic effects than organisms exposed to the same concentrations of identical mixtures and concentrations of PAHs in the absence of UV (Ahrens and Hickey , 2002). It has been demonstrated that this increase is often on the order of magnitude. Although these toxic effects have been known and studied for well over 50 years, until recently, this interaction between solar radiation and PAHs has been largely ignored in the regulatory realm.
The PSEP (Puget Sound Estuarine Protocols) do not address the potentially significant increase in toxicity due to PAH photoactivation. The following guidelines are meant to give the regulator a general understanding of the interactions between UV radiation and PAHs in contaminated sediments. The intent of these guidelines is to assist the regulator in the evaluation and decision-making process surrounding these issues. The following guidelines should be used under the conditions specified below when both the listed PAHs are present and solar radiation is expected at the site under investigation. When both of the following site conditions are encountered in either freshwater or marine sediment sites, bioassays should be performed in the presence of full spectrum laboratory lighting that includes ultraviolet wavelengths of sufficient intensity to mimic the conditions at the site. Site conditions: 1) Sediment depth (MLLW): For marine or estuarine sites, if either of
>25% of the surface sediments or ½ acre of the surface sediments at the site are 4 meters/12 feet or less including intertidal and subtidal zones. For freshwater areas, if seasonal water depth at the lowest stage has been 4 meters/12 feet or less in the past 10 years for either >25% of the surface sediments or ½ acre of the surface sediments at the site (Kirk 1994a, 1994b). These depths are
Sediment Sampling and Analysis Plan Appendix February 2008
D-3
relatively conservative, however, recent investigations have shown pronounced sensitivity to solar UV-B and effects throughout the top 10-15 m of the water column, indicating significant penetration to those depths (UNEP, 1998).
2) Presence or presumed presence of any of the following
photoactivated PAHs (Nagpal, 1993) listed in Table 1: A) If chemistry data is available:
i) For those parameters for which there are SMS chemical standards, bioassays should be performed if standards are exceeded. If none of those standards are exceeded, but PAHs or sums of PAHs are exceeded by (>25%) of the standard in conjunction with site conditions outlined in #1 above, bioassays should be performed in the presence of full spectrum-UV light.
ii) For those parameters for which no SMS chemical standards are available, best professional judgment and best available science should be used on a case-by-case basis. This applies to all freshwater sites and marine and estuarine sites where PAHs without state standards are either present or anticipated to be present based upon such information as potential co-location with PAHs with State marine sediment standards, current or historical site information, tides and/or currents, adjacent upland or in-water activities, or inputs from outside sources, either natural or artificial (e.g. storm-water, effluent waste-streams)
B) If no chemistry data is available best professional judgment and best available science should be used on a case-by-case basis. This applies to all freshwater sites and marine and estuarine sites where PAHs are anticipated to be present based upon such information as current or historical site information, tides and/or currents, adjacent upland or in-water activities, or inputs from outside sources, either natural or artificial (e.g. storm-water, effluent waste-streams).
Sediment Sampling and Analysis Plan Appendix February 2008
D-4
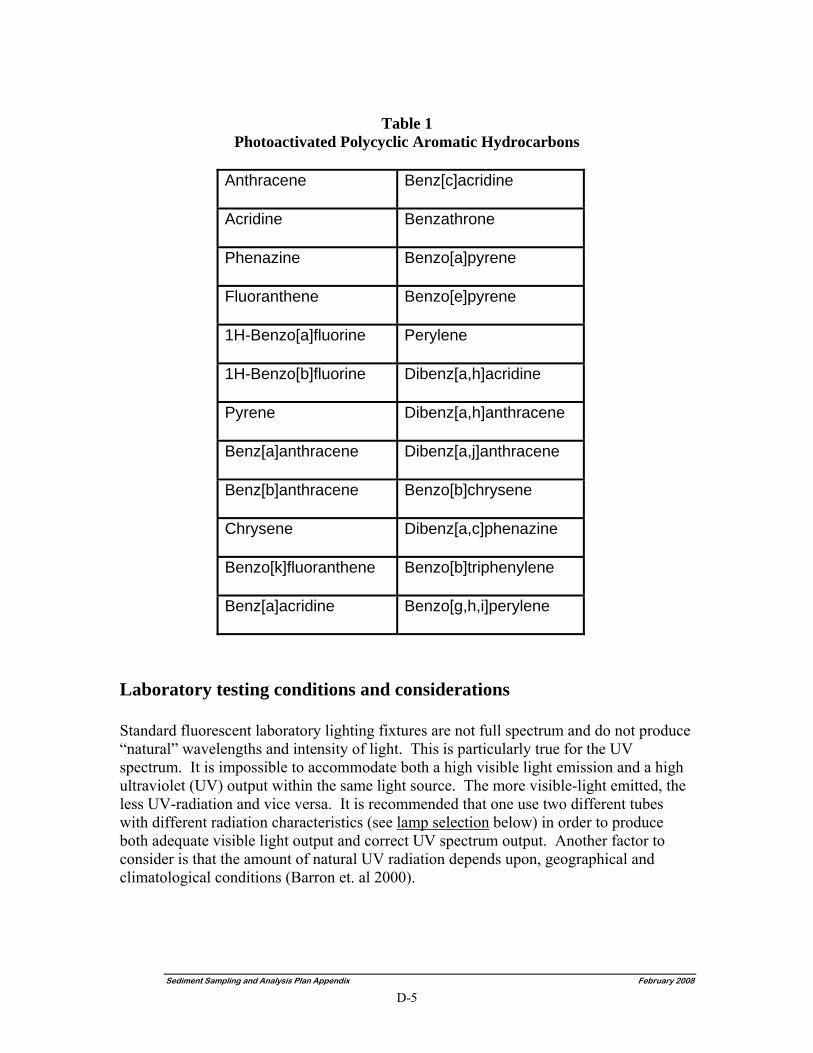
Table 1
Photoactivated Polycyclic Aromatic Hydrocarbons
Anthracene
Benz[c]acridine
Acridine
Benzathrone
Phenazine
Benzo[a]pyrene
Fluoranthene
Benzo[e]pyrene
1H-Benzo[a]fluorine Perylene
1H-Benzo[b]fluorine
Dibenz[a,h]acridine
Pyrene
Dibenz[a,h]anthracene
Benz[a]anthracene
Dibenz[a,j]anthracene
Benz[b]anthracene
Benzo[b]chrysene
Chrysene
Dibenz[a,c]phenazine
Benzo[k]fluoranthene
Benzo[b]triphenylene
Benz[a]acridine
Benzo[g,h,i]perylene
Laboratory testing conditions and considerations Standard fluorescent laboratory lighting fixtures are not full spectrum and do not produce “natural” wavelengths and intensity of light. This is particularly true for the UV spectrum. It is impossible to accommodate both a high visible light emission and a high ultraviolet (UV) output within the same light source. The more visible-light emitted, the less UV-radiation and vice versa. It is recommended that one use two different tubes with different radiation characteristics (see lamp selection below) in order to produce both adequate visible light output and correct UV spectrum output. Another factor to consider is that the amount of natural UV radiation depends upon, geographical and climatological conditions (Barron et. al 2000).
Sediment Sampling and Analysis Plan Appendix February 2008
D-5
Lamp selection Four important features that a full-spectrum fluorescent lamp must possessare listed below: 1. UVB output (280nm< λ < 315nm) photoactivating wavelengths. 2. UVA output (315nm < λ < 400nm), this may have an effect upon burial and feeding behavior. 3. Correct Color temperature - 'warm' red to 'cold' blue expressed in degrees Kelvin. Daylight at noon is typically estimated at 5,5000K. 4. High Color Rendering Index - Color rendering is the degree to which a light source shows the true colors of the objects it illuminates. This is measured on a color rendering index, rated from 0-100. A normal fluorescent lamp, for example, rates 54 on the CRI scale. High quality fluorescent lamps will rate 90-98 on the same scale. The combination of sufficient UVA content and a 'natural' >5,5000K color temperature is what improves activity patterns and feeding when high quality full spectrum lighting is utilized. In addition to the quality of the lamp, its proximity to the animal, its output intensity and duration of use are also critical. The illumination intensity of tubes is primarily dependent upon their size. Typically, a 24" (60 cm) tube produces less than half the light output of a 48" (120 cm) tube. An example of an acceptable UV spectral output is shown in Figure 1 and 2. Spectral output will differ depending upon lamp manufacturer specifications and lamp age. When installing full spectrum or UVB producing tubes, it is absolutely critical that nothing is placed between the envelope of the tube and the recipient animal or vessel. UVB is greatly attenuated by glass, plastic and ultra fine mesh. A normal mesh allows the highest transmission, but the UVB rays are still reduced to about 90% of their normal power. The amount of UVB received also diminishes with distance. It is generally recommended that any UVB tubes be no further than 12" (30 cm) away from the subject. At greater distances than this, the amount of UVB actually received will be minimal. This may encumber some monitoring activities, therefore allowances should be made for temporary vessel or lamp removal to enable ease of required monitoring activities. Tubes also have a limited life and require changing at least every 5000 hours in order to guarantee continued UVB output. Although there may be no visible deterioration in the performance of the tube, the invisible UV content decays as the tube ages. It is a good idea to place a small adhesive label near each fitting with the total hours the tube has been used, replacing the tubes when 5000 hours has been reached. Most full spectrum fluorescent tubes designed for aquarium use are classified according to their percentage UVB output. The most popular tubes offer 5% to 8% UVB. An exposure duration of 14 -16 hours is suitable in most species. The higher the UV output (invisible light) the less light (visual) is emitted. The light also gets a bluer appearance. Therefore it is recommended to combine a tube with a high UV output with a tube with a very high visual light output for the best results.
Sediment Sampling and Analysis Plan Appendix February 2008
D-6
Sediment Sampling and Analysis Plan Appendix February 2008
D-7
Recommended Lab conditions Light intensity: 50-100 foot candles Light duration; 16/8 (Light/Dark) Overlying Water Depth: Not greater than 15 cm (6 inches) Lamp to water surface distance: Not greater than 30 cm (12 inches) UV wavelength range: 3-8% UV-B range (280nm< λ < 315nm) (3-5% preferred)
20-35% UV-A (315nm < λ < 400nm)
For additional review, discussion and examples of laboratory conditions, methods and ambient field considerations such as oxygenation, mineralization, humic and fulvic acids and presence of primary activators see ASTM 1997, Barron et al. 2003, Barron et al. 1999, Barron et al. 2001, Boese et al. 1997, Little et al. 2000, Mekenyan et al. 1994, Pelletier et. al 1997, and Weinstein 2001.
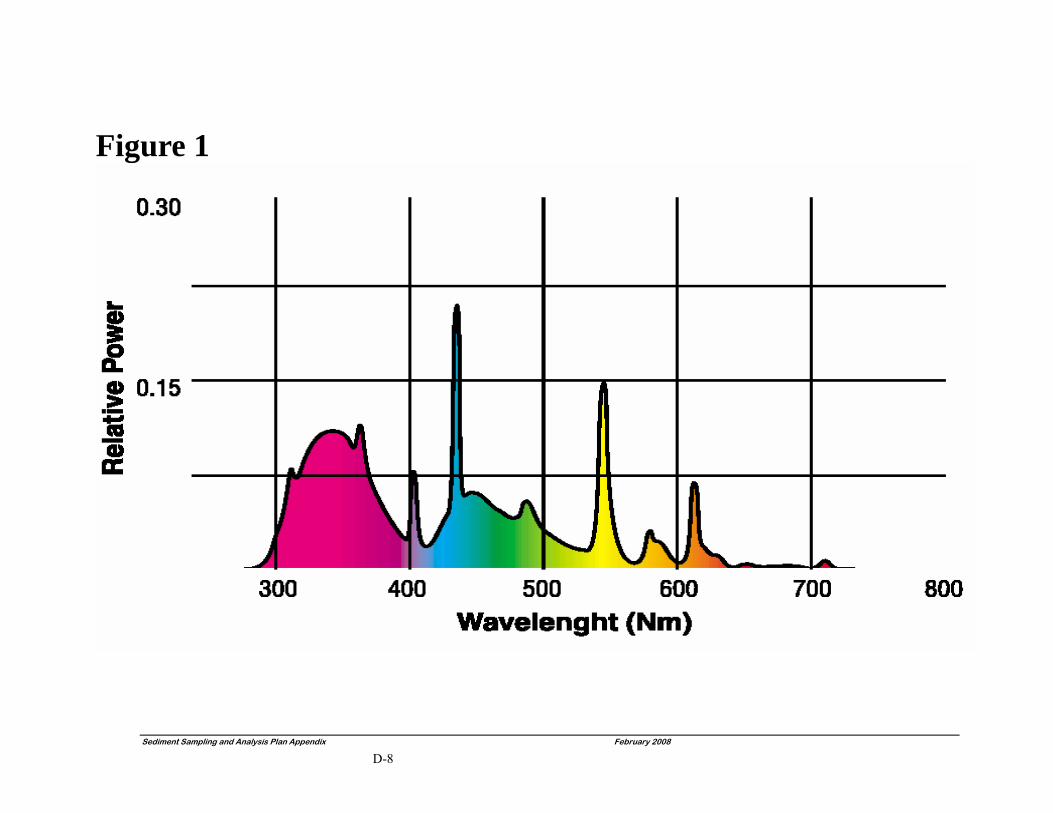
Figure 1
Sediment Sampling and Analysis Plan Appendix February 2008
D-8
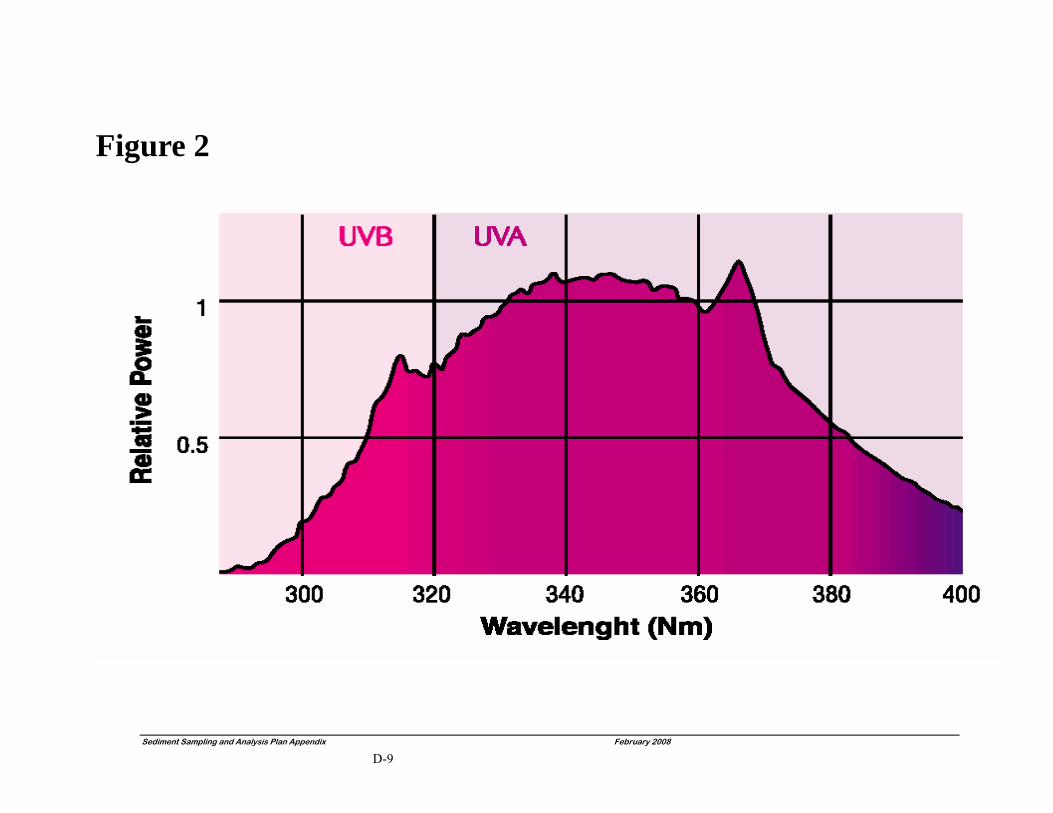
Figure 2
Sediment Sampling and Analysis Plan Appendix February 2008
D-9
Selected References ASTM. 1997. Standard Methods for Conducting Aqueous Direct Photolysis Tests.
Annual Book of ASTM Standards. Vol 11.04. E896-92. pp.635-641. Ahrens, M. J. and C. Hickey. 2002. UV-photoactivation of polycyclic aromatic
hydrocarbons and the sensitivity of sediment-dwelling estuarine organisms. National Institute of Water & Atmospheric Research Conference: UV Radiation and its Effects: an update. 26–28 March 2002. Antarctic Centre, Christchurch, New Zealand.
Arfsten, D.P., Schaeffer, D.J. and Mulveny, D.C. (1996) The effects of near ultraviolet
radiation on the toxic effects of poly-cyclic aromatic hydrocarbons in animals and plants: a review. Ecotoxicol. Environ. Saf. 33, 1-24.
Barron, M.G., Carls, M.G., Short, J.W., and Rice, S.D. 2003. Photoenhanced Toxicity of Aqueous Phase and Chemically Dispersed Weathered Alaska North Slope Crude Oil to Pacific Herring Eggs and Larvae. Environmental Toxicology and Chemisry, Vol. 22, No 3, 650-660.
Barron, M.G., T. Podrabsky, S. Ogle, and R.W. Ricker. 1999. Do aromatic hydrocarbons determine petroleum toxicity to aquatic organisms? Aquat. Toxicol. 46:253-268.
Barron, M.G., Little, E.E., Calfee, R.D. and Diamond, S. 2000. Quantifying solar spectral
irradiance in aquatic habitats for the assessment of photoenhanced toxicity. Environ. Toxicol. Chem. 19, 19: 920-925.
Barron, M.G. and L. Ka’aihue. 2001. Potential for photenhanced toxicity of spilled oil in
Prince William Sound and Gulf of Alaska waters. Marine Poll. Bull. 43:86-92. Boese, B. L., J. O. Lamberson, R. C. Swartz, and R. J. Ozretich. 1997. Photoinduced
toxicity of fluoranthene to seven marine benthic crustaceans. Archives of Environmental Contamination and Toxicology 32:389-393.
Johnson, F.S., Mo, T., Green, A.E. 1976. Average latitudinal ultraviolet radiation at the
earth's surface. Photochemistry and Photobiology, 23, 179-188. Kirk JTO (1994a) Light and photosynthesis in aquatic ecosystems. Cambridge University Press, Cambridge Kirk JTO (1994b) Optics of UV-B radiation in natural waters. Arch Hydrobiol Beih Ergebn Limnol 43:1–16 Kosian, P. A., E. A. Makynen, P. D. Monson, D. R. Mount, A. Spacie, O. G. Mekenyan,
and G. T. Ankley. 1998. Application of toxicity-based fractionation techniques and structure-activity relationship models for the identification of phototoxic
Sediment Sampling and Analysis Plan Appendix February 2008
D-10
polycyclic aromatic hydrocarbons in sediment pore water. Environ. Tox. Chem. 17:1021-1033.
Little, E.E., Cleveland, L., Hurtubise, R. and Barron, M.G. 2000 Assessment of the
photoenhanced toxicity of a weathered petroleum to the tidewater silverside. Environ. Toxicol. Chem. 19, 926-932.
Mekenyan, O.G., Ankley, G.T., Veith, G.D. and Call, D.J. (1994) QSARs for
photoinduced toxicity: I. Acute lethality of polycyclic aromatic hydrocarbons to Daphnia magna. Chemosphere 28, 567-582.
Nagpal, N. K. 1993. Ambient Water Quality Criteria For Polycyclic Aromatic
Hydrocarbons (PAHs), Ministry of Environment, Lands and Parks Province of British Columbia, Water Quality Branch, Water Management Division, Vancouver, BC
Pelletier M.C., Burgess R.M., Ho K.T., Kuhn A., McKinney R.A. and S.A. Ryba. 1997.
Phototoxicity of individual polycyclic aromatic hydrocarbons and petroleum to marine invertebrate larvae and juveniles. Environ. Toxicol. Chem. 16:2190-2199.
UNEP, Environmental Effects of Ozone Depletion: 1998 Assessment, United Nations
Environment Programme, 205pp, 1998. ISBN 92-807-1724-3 Weinstein, J. E. 2001. Characterization of the acute toxicity of photoactivated
fluoranthene to glochidia of the freshwater mussel, Utterbackia imbecillis. Environ. Tox. Chem. 20:412-419.
Sediment Sampling and Analysis Plan Appendix February 2008
D-11

Sediment Sampling and Analysis Plan Appendix February 2008
D-12
SUBAPPENDIX E
SEDIMENT RELATED EIM DATA ENTRY BUSINESS RULES
Sediment Sampling and Analysis Plan Appendix February 2008
E-1

Sediment Sampling and Analysis Plan Appendix February 2008
E-2
SEDIMENT RELATED EIM DATA ENTRY BUSINESS RULES
There are three major parts of sediment-related data that need to be entered into the Environmental Information Management system (EIM) using the following form and spreadsheets: 1. EIM Study Form: Study or Project information. 2. EIM Location Spreadsheet: Location or Station ID with its horizontal information
(latitude/longitude) and vertical information (water depth from Mean Lower Low Water to the sediment bed surface, upper and lower sediment sampling depth).
3. EIM Results Data or Bioassay Data Spreadsheets: The following sediment related
analyzed or observed results shall be submitted using the EIM Results Data or EIM Bioassay Data Spreadsheets:
3.1 Sediment Chemistry: Sediment chemical concentrations. 3.2 Sediment Bioassay: Bioassay Test, Reference, Positive and Negative Control
results. 3.3 Benthic Infauna or Taxonomy Abundance: Species abundance and diversity. 3.4 Tissue Bioaccumulation or Chemistry: Tissue chemical concentrations,
taxonomic name of the organism collected and/or tissue type analyzed. 3.5 Tissue Pathology: Reports tissue pathology such as tumors or lesions, describes
the taxonomic name of the organism collected and/or tissue type analyzed. It’s important to know what information must be provided to submit the data package to the EIM when writing the Sampling and Analysis Plan (SAP) or Quality Assurance Project Plan (QAPP). The required information on the EIM Study Form is mostly available in the SAP or QAPP or the data report. The required information on the EIM Location Spreadsheet is recorded mostly during the sampling stage. The required information on the EIM Results or Bioassay Data Spreadsheet is mostly obtained from the laboratory during the analysis stage. Explanation of Field Designation Required, Optional, or Proposed fields are distinguished by the font style in the Header column of the following tables. The Required and Optional fields may be subject to further modification or changes. • Required fields are denoted by BOLD CAPS and all information must be provided. • Required (if applicable or available) fields are denoted by bold regular font and cannot be left
blank if the circumstance is applicable or the information is available. • Optional fields appear in regular font, can be filled with information to fit the end data user’s
needs, or left blank. • Proposed future fields are underlined with BOLD CAPS or bold or non-bold regular font to
distinguish the field as REQUIRED or Required (if applicable or available) or Optional.
Sediment Sampling and Analysis Plan Appendix February 2008
E-3
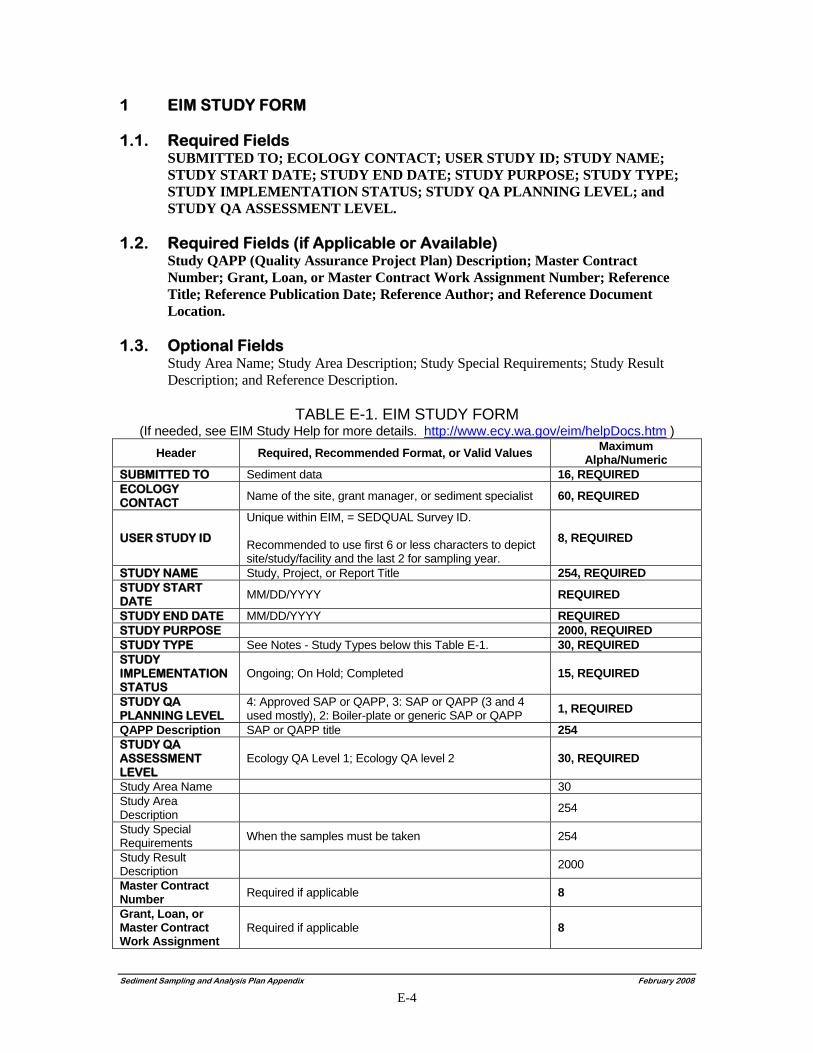
1 EIM STUDY FORM 1.1. Required Fields
SUBMITTED TO; ECOLOGY CONTACT; USER STUDY ID; STUDY NAME; STUDY START DATE; STUDY END DATE; STUDY PURPOSE; STUDY TYPE; STUDY IMPLEMENTATION STATUS; STUDY QA PLANNING LEVEL; and STUDY QA ASSESSMENT LEVEL.
1.2. Required Fields (if Applicable or Available)
Study QAPP (Quality Assurance Project Plan) Description; Master Contract Number; Grant, Loan, or Master Contract Work Assignment Number; Reference Title; Reference Publication Date; Reference Author; and Reference Document Location.
1.3. Optional Fields
Study Area Name; Study Area Description; Study Special Requirements; Study Result Description; and Reference Description.
TABLE E-1. EIM STUDY FORM (If needed, see EIM Study Help for more details. http://www.ecy.wa.gov/eim/helpDocs.htm )
Header Required, Recommended Format, or Valid Values Maximum Alpha/Numeric
SUBMITTED TO Sediment data 16, REQUIRED ECOLOGY CONTACT
Name of the site, grant manager, or sediment specialist 60, REQUIRED
USER STUDY ID
Unique within EIM, = SEDQUAL Survey ID. Recommended to use first 6 or less characters to depict site/study/facility and the last 2 for sampling year.
8, REQUIRED
STUDY NAME Study, Project, or Report Title 254, REQUIRED STUDY START DATE
MM/DD/YYYY REQUIRED
STUDY END DATE MM/DD/YYYY REQUIRED STUDY PURPOSE 2000, REQUIRED STUDY TYPE See Notes - Study Types below this Table E-1. 30, REQUIRED STUDY IMPLEMENTATION STATUS
Ongoing; On Hold; Completed 15, REQUIRED
STUDY QA PLANNING LEVEL
4: Approved SAP or QAPP, 3: SAP or QAPP (3 and 4 used mostly), 2: Boiler-plate or generic SAP or QAPP 1, REQUIRED
QAPP Description SAP or QAPP title 254 STUDY QA ASSESSMENT LEVEL
Ecology QA Level 1; Ecology QA level 2 30, REQUIRED
Study Area Name 30 Study Area Description 254
Study Special Requirements When the samples must be taken 254
Study Result Description 2000
Master Contract Number Required if applicable 8
Grant, Loan, or Master Contract Work Assignment
Required if applicable 8
Sediment Sampling and Analysis Plan Appendix February 2008
E-4
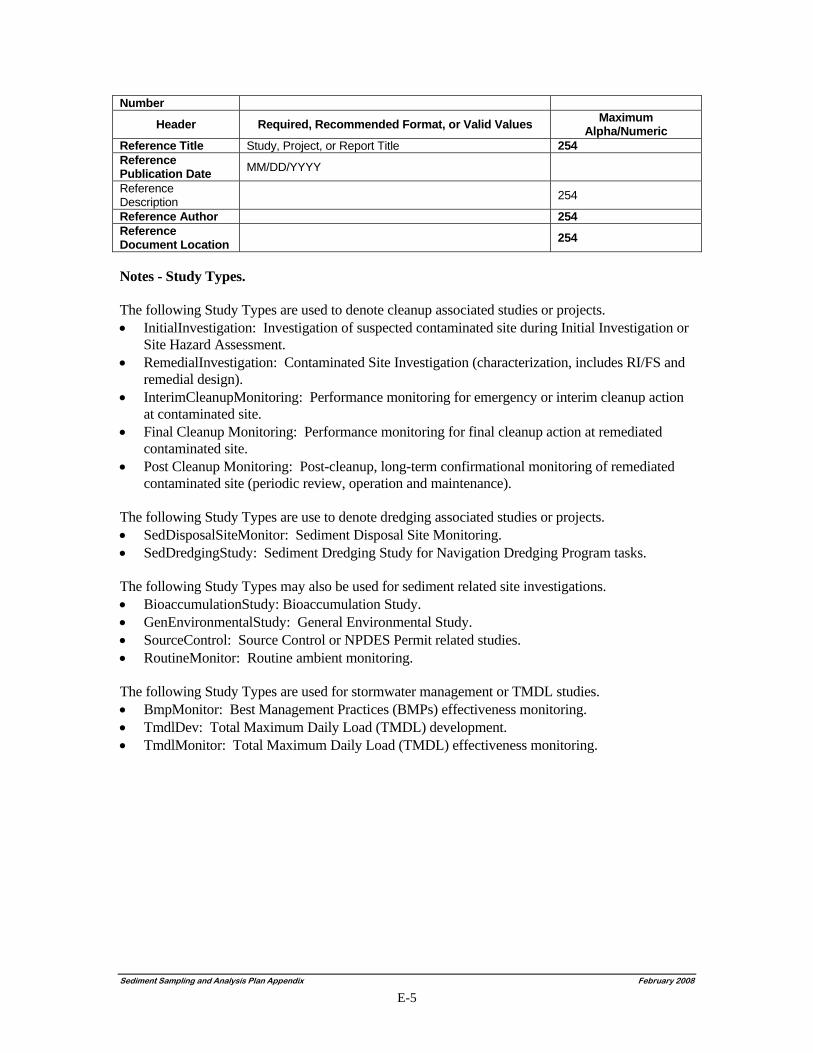
Number
Header Required, Recommended Format, or Valid Values Maximum Alpha/Numeric
Reference Title Study, Project, or Report Title 254 Reference Publication Date MM/DD/YYYY
Reference Description 254
Reference Author 254 Reference Document Location 254
Notes - Study Types. The following Study Types are used to denote cleanup associated studies or projects. • InitialInvestigation: Investigation of suspected contaminated site during Initial Investigation or
Site Hazard Assessment. • RemedialInvestigation: Contaminated Site Investigation (characterization, includes RI/FS and
remedial design). • InterimCleanupMonitoring: Performance monitoring for emergency or interim cleanup action
at contaminated site. • Final Cleanup Monitoring: Performance monitoring for final cleanup action at remediated
contaminated site. • Post Cleanup Monitoring: Post-cleanup, long-term confirmational monitoring of remediated
contaminated site (periodic review, operation and maintenance). The following Study Types are use to denote dredging associated studies or projects. • SedDisposalSiteMonitor: Sediment Disposal Site Monitoring. • SedDredgingStudy: Sediment Dredging Study for Navigation Dredging Program tasks. The following Study Types may also be used for sediment related site investigations. • BioaccumulationStudy: Bioaccumulation Study. • GenEnvironmentalStudy: General Environmental Study. • SourceControl: Source Control or NPDES Permit related studies. • RoutineMonitor: Routine ambient monitoring. The following Study Types are used for stormwater management or TMDL studies. • BmpMonitor: Best Management Practices (BMPs) effectiveness monitoring. • TmdlDev: Total Maximum Daily Load (TMDL) development. • TmdlMonitor: Total Maximum Daily Load (TMDL) effectiveness monitoring.
Sediment Sampling and Analysis Plan Appendix February 2008
E-5
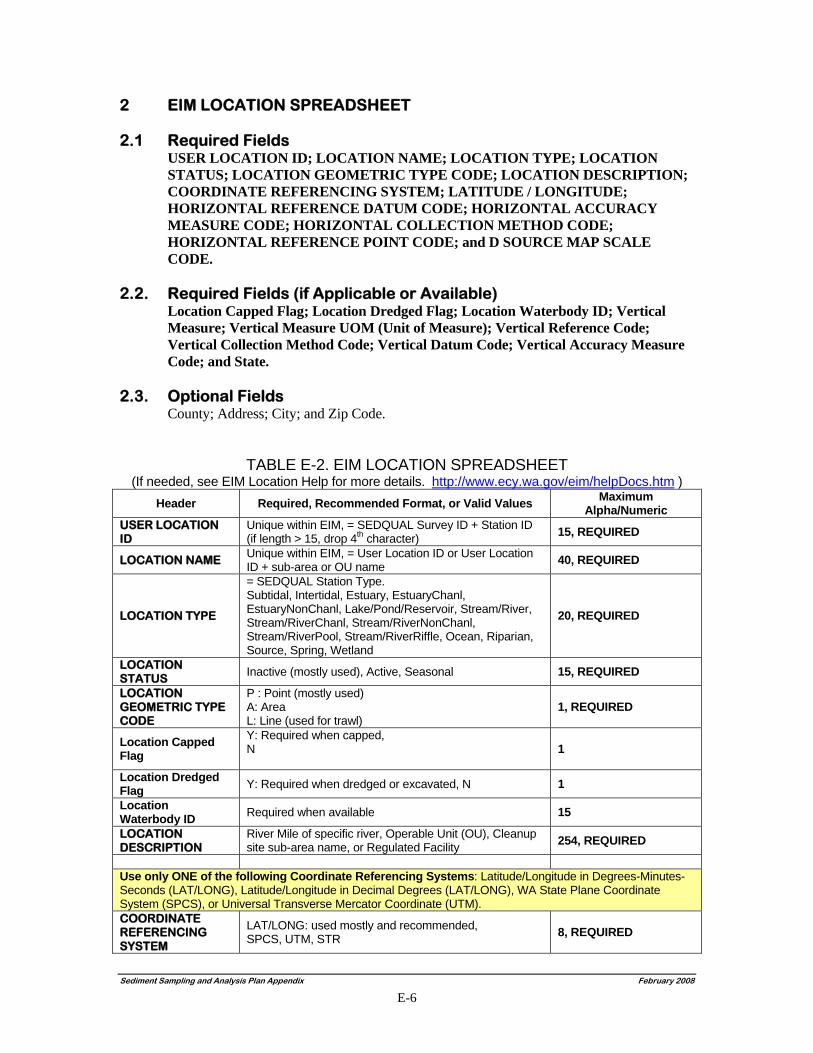
2 EIM LOCATION SPREADSHEET 2.1 Required Fields
USER LOCATION ID; LOCATION NAME; LOCATION TYPE; LOCATION STATUS; LOCATION GEOMETRIC TYPE CODE; LOCATION DESCRIPTION; COORDINATE REFERENCING SYSTEM; LATITUDE / LONGITUDE; HORIZONTAL REFERENCE DATUM CODE; HORIZONTAL ACCURACY MEASURE CODE; HORIZONTAL COLLECTION METHOD CODE; HORIZONTAL REFERENCE POINT CODE; and D SOURCE MAP SCALE CODE.
2.2. Required Fields (if Applicable or Available)
Location Capped Flag; Location Dredged Flag; Location Waterbody ID; Vertical Measure; Vertical Measure UOM (Unit of Measure); Vertical Reference Code; Vertical Collection Method Code; Vertical Datum Code; Vertical Accuracy Measure Code; and State.
2.3. Optional Fields
County; Address; City; and Zip Code.
TABLE E-2. EIM LOCATION SPREADSHEET (If needed, see EIM Location Help for more details. http://www.ecy.wa.gov/eim/helpDocs.htm )
Header Required, Recommended Format, or Valid Values Maximum Alpha/Numeric
USER LOCATION ID
Unique within EIM, = SEDQUAL Survey ID + Station ID (if length > 15, drop 4th character) 15, REQUIRED
LOCATION NAME Unique within EIM, = User Location ID or User Location ID + sub-area or OU name 40, REQUIRED
LOCATION TYPE
= SEDQUAL Station Type. Subtidal, Intertidal, Estuary, EstuaryChanl, EstuaryNonChanl, Lake/Pond/Reservoir, Stream/River, Stream/RiverChanl, Stream/RiverNonChanl, Stream/RiverPool, Stream/RiverRiffle, Ocean, Riparian, Source, Spring, Wetland
20, REQUIRED
LOCATION STATUS
Inactive (mostly used), Active, Seasonal 15, REQUIRED
LOCATION GEOMETRIC TYPE CODE
P : Point (mostly used) A: Area L: Line (used for trawl)
1, REQUIRED
Location Capped Flag
Y: Required when capped, N
1
Location Dredged Flag Y: Required when dredged or excavated, N 1
Location Waterbody ID Required when available 15
LOCATION DESCRIPTION
River Mile of specific river, Operable Unit (OU), Cleanup site sub-area name, or Regulated Facility 254, REQUIRED
Use only ONE of the following Coordinate Referencing Systems: Latitude/Longitude in Degrees-Minutes-Seconds (LAT/LONG), Latitude/Longitude in Decimal Degrees (LAT/LONG), WA State Plane Coordinate System (SPCS), or Universal Transverse Mercator Coordinate (UTM). COORDINATE REFERENCING SYSTEM
LAT/LONG: used mostly and recommended, SPCS, UTM, STR 8, REQUIRED
Sediment Sampling and Analysis Plan Appendix February 2008
E-6
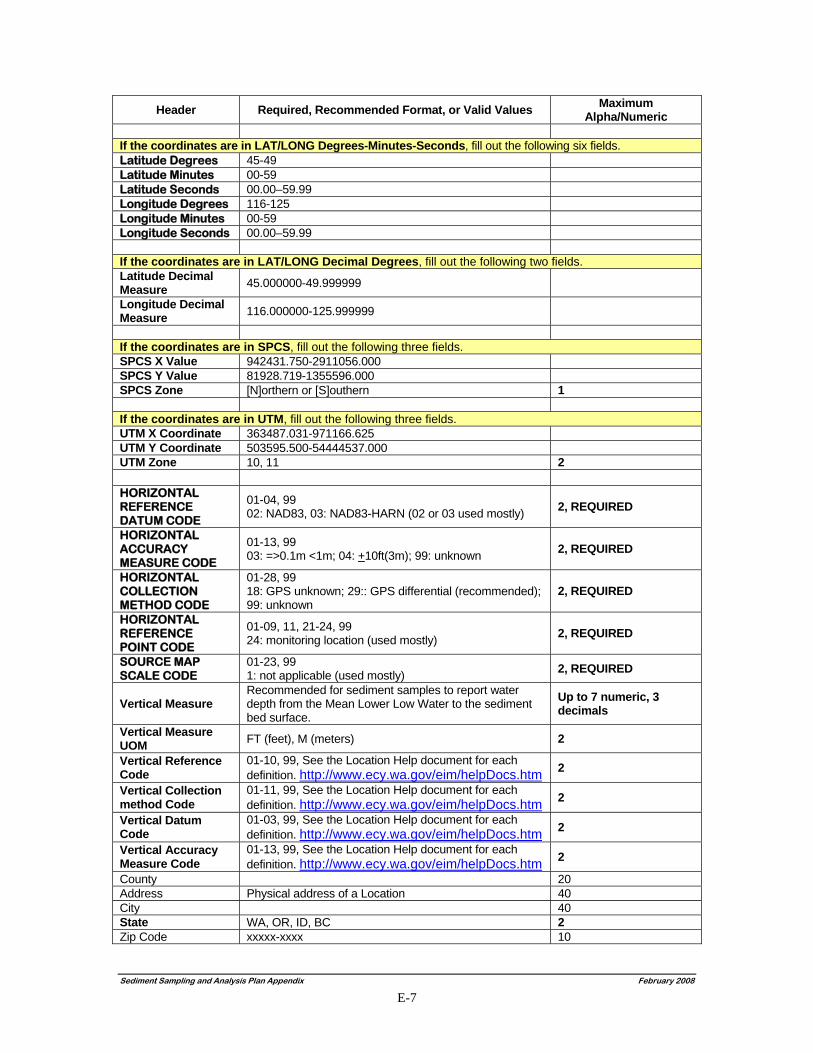
Sediment Sampling and Analysis Plan Appendix February 2008
E-7
Header Required, Recommended Format, or Valid Values Maximum Alpha/Numeric
If the coordinates are in LAT/LONG Degrees-Minutes-Seconds, fill out the following six fields. Latitude Degrees 45-49 Latitude Minutes 00-59 Latitude Seconds 00.00–59.99 Longitude Degrees 116-125 Longitude Minutes 00-59 Longitude Seconds 00.00–59.99 If the coordinates are in LAT/LONG Decimal Degrees, fill out the following two fields. Latitude Decimal Measure 45.000000-49.999999
Longitude Decimal Measure 116.000000-125.999999
If the coordinates are in SPCS, fill out the following three fields. SPCS X Value 942431.750-2911056.000 SPCS Y Value 81928.719-1355596.000 SPCS Zone [N]orthern or [S]outhern 1 If the coordinates are in UTM, fill out the following three fields. UTM X Coordinate 363487.031-971166.625 UTM Y Coordinate 503595.500-54444537.000 UTM Zone 10, 11 2 HORIZONTAL REFERENCE DATUM CODE
01-04, 99 02: NAD83, 03: NAD83-HARN (02 or 03 used mostly) 2, REQUIRED
HORIZONTAL ACCURACY MEASURE CODE
01-13, 99 03: =>0.1m <1m; 04: +10ft(3m); 99: unknown 2, REQUIRED
HORIZONTAL COLLECTION METHOD CODE
01-28, 99 18: GPS unknown; 29:: GPS differential (recommended); 99: unknown
2, REQUIRED
HORIZONTAL REFERENCE POINT CODE
01-09, 11, 21-24, 99 24: monitoring location (used mostly) 2, REQUIRED
SOURCE MAP SCALE CODE
01-23, 99 1: not applicable (used mostly) 2, REQUIRED
Vertical Measure Recommended for sediment samples to report water depth from the Mean Lower Low Water to the sediment bed surface.
Up to 7 numeric, 3 decimals
Vertical Measure UOM FT (feet), M (meters) 2
Vertical Reference Code
01-10, 99, See the Location Help document for each definition. http://www.ecy.wa.gov/eim/helpDocs.htm
2
Vertical Collection method Code
01-11, 99, See the Location Help document for each definition. http://www.ecy.wa.gov/eim/helpDocs.htm
2
Vertical Datum Code
01-03, 99, See the Location Help document for each definition. http://www.ecy.wa.gov/eim/helpDocs.htm
2
Vertical Accuracy Measure Code
01-13, 99, See the Location Help document for each definition. http://www.ecy.wa.gov/eim/helpDocs.htm
2
County 20 Address Physical address of a Location 40 City 40 State WA, OR, ID, BC 2 Zip Code xxxxx-xxxx 10
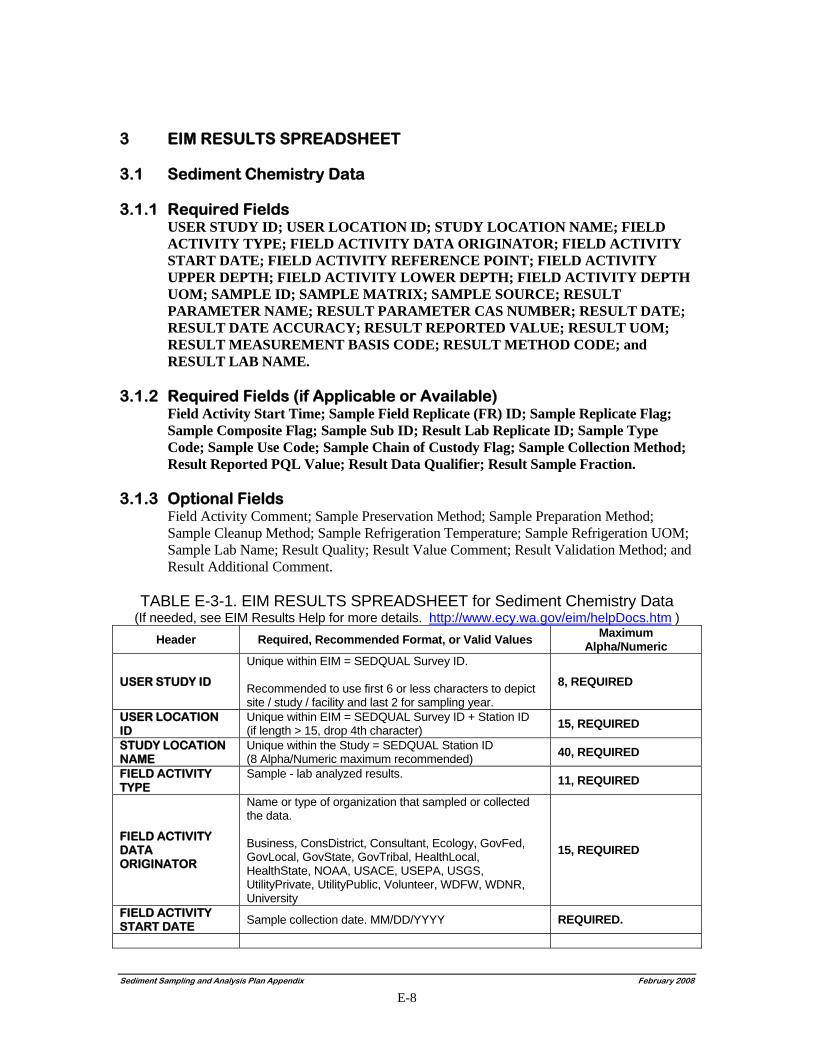
3 EIM RESULTS SPREADSHEET 3.1 Sediment Chemistry Data 3.1.1 Required Fields
USER STUDY ID; USER LOCATION ID; STUDY LOCATION NAME; FIELD ACTIVITY TYPE; FIELD ACTIVITY DATA ORIGINATOR; FIELD ACTIVITY START DATE; FIELD ACTIVITY REFERENCE POINT; FIELD ACTIVITY UPPER DEPTH; FIELD ACTIVITY LOWER DEPTH; FIELD ACTIVITY DEPTH UOM; SAMPLE ID; SAMPLE MATRIX; SAMPLE SOURCE; RESULT PARAMETER NAME; RESULT PARAMETER CAS NUMBER; RESULT DATE; RESULT DATE ACCURACY; RESULT REPORTED VALUE; RESULT UOM; RESULT MEASUREMENT BASIS CODE; RESULT METHOD CODE; and RESULT LAB NAME.
3.1.2 Required Fields (if Applicable or Available)
Field Activity Start Time; Sample Field Replicate (FR) ID; Sample Replicate Flag; Sample Composite Flag; Sample Sub ID; Result Lab Replicate ID; Sample Type Code; Sample Use Code; Sample Chain of Custody Flag; Sample Collection Method; Result Reported PQL Value; Result Data Qualifier; Result Sample Fraction.
3.1.3 Optional Fields
Field Activity Comment; Sample Preservation Method; Sample Preparation Method; Sample Cleanup Method; Sample Refrigeration Temperature; Sample Refrigeration UOM; Sample Lab Name; Result Quality; Result Value Comment; Result Validation Method; and Result Additional Comment.
TABLE E-3-1. EIM RESULTS SPREADSHEET for Sediment Chemistry Data
(If needed, see EIM Results Help for more details. http://www.ecy.wa.gov/eim/helpDocs.htm ) Header Required, Recommended Format, or Valid Values Maximum
Alpha/Numeric
USER STUDY ID
Unique within EIM = SEDQUAL Survey ID. Recommended to use first 6 or less characters to depict site / study / facility and last 2 for sampling year.
8, REQUIRED
USER LOCATION ID
Unique within EIM = SEDQUAL Survey ID + Station ID (if length > 15, drop 4th character) 15, REQUIRED
STUDY LOCATION NAME
Unique within the Study = SEDQUAL Station ID (8 Alpha/Numeric maximum recommended) 40, REQUIRED
FIELD ACTIVITY TYPE
Sample - lab analyzed results. 11, REQUIRED
FIELD ACTIVITY DATA ORIGINATOR
Name or type of organization that sampled or collected the data. Business, ConsDistrict, Consultant, Ecology, GovFed, GovLocal, GovState, GovTribal, HealthLocal, HealthState, NOAA, USACE, USEPA, USGS, UtilityPrivate, UtilityPublic, Volunteer, WDFW, WDNR, University
15, REQUIRED
FIELD ACTIVITY START DATE
Sample collection date. MM/DD/YYYY REQUIRED.
Sediment Sampling and Analysis Plan Appendix February 2008
E-8
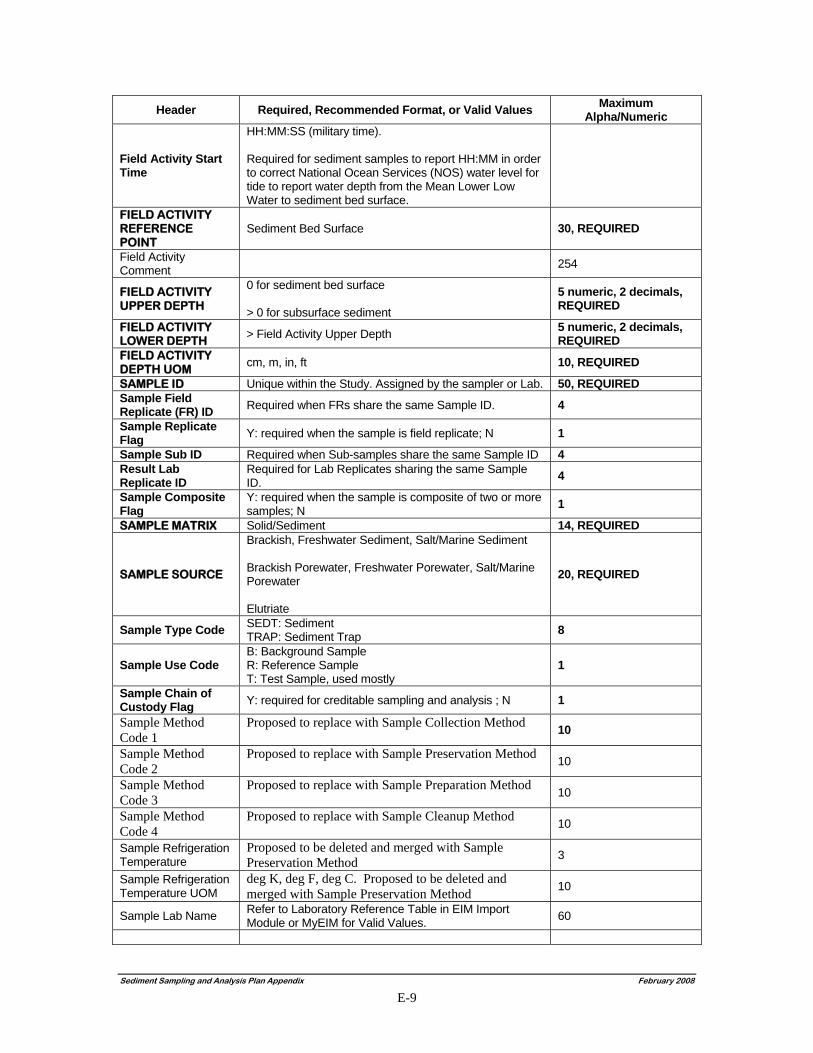
Header Required, Recommended Format, or Valid Values Maximum Alpha/Numeric
Field Activity Start Time
HH:MM:SS (military time). Required for sediment samples to report HH:MM in order to correct National Ocean Services (NOS) water level for tide to report water depth from the Mean Lower Low Water to sediment bed surface.
FIELD ACTIVITY REFERENCE POINT
Sediment Bed Surface 30, REQUIRED
Field Activity Comment 254
FIELD ACTIVITY UPPER DEPTH
0 for sediment bed surface > 0 for subsurface sediment
5 numeric, 2 decimals, REQUIRED
FIELD ACTIVITY LOWER DEPTH
> Field Activity Upper Depth 5 numeric, 2 decimals, REQUIRED
FIELD ACTIVITY DEPTH UOM
cm, m, in, ft 10, REQUIRED
SAMPLE ID Unique within the Study. Assigned by the sampler or Lab. 50, REQUIRED Sample Field Replicate (FR) ID Required when FRs share the same Sample ID. 4
Sample Replicate Flag Y: required when the sample is field replicate; N 1
Sample Sub ID Required when Sub-samples share the same Sample ID 4 Result Lab Replicate ID
Required for Lab Replicates sharing the same Sample ID. 4
Sample Composite Flag
Y: required when the sample is composite of two or more samples; N 1
SAMPLE MATRIX Solid/Sediment 14, REQUIRED
SAMPLE SOURCE
Brackish, Freshwater Sediment, Salt/Marine Sediment Brackish Porewater, Freshwater Porewater, Salt/Marine Porewater Elutriate
20, REQUIRED
Sample Type Code SEDT: Sediment TRAP: Sediment Trap 8
Sample Use Code B: Background Sample R: Reference Sample T: Test Sample, used mostly
1
Sample Chain of Custody Flag Y: required for creditable sampling and analysis ; N 1
Sample Method Code 1
Proposed to replace with Sample Collection Method 10
Sample Method Code 2
Proposed to replace with Sample Preservation Method 10
Sample Method Code 3
Proposed to replace with Sample Preparation Method 10
Sample Method Code 4
Proposed to replace with Sample Cleanup Method 10
Sample Refrigeration Temperature
Proposed to be deleted and merged with Sample Preservation Method 3
Sample Refrigeration Temperature UOM
deg K, deg F, deg C. Proposed to be deleted and merged with Sample Preservation Method 10
Sample Lab Name Refer to Laboratory Reference Table in EIM Import Module or MyEIM for Valid Values. 60
Sediment Sampling and Analysis Plan Appendix February 2008
E-9
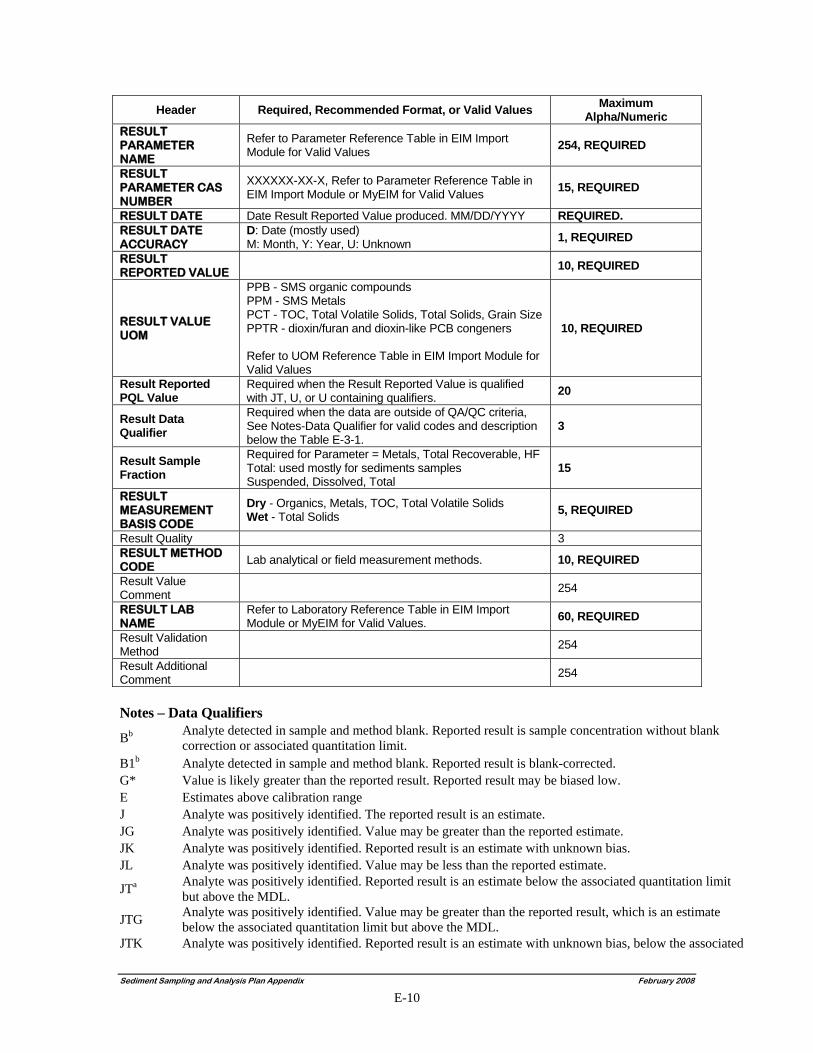
Header Required, Recommended Format, or Valid Values Maximum Alpha/Numeric
RESULT PARAMETER NAME
Refer to Parameter Reference Table in EIM Import Module for Valid Values 254, REQUIRED
RESULT PARAMETER CAS NUMBER
XXXXXX-XX-X, Refer to Parameter Reference Table in EIM Import Module or MyEIM for Valid Values 15, REQUIRED
RESULT DATE Date Result Reported Value produced. MM/DD/YYYY REQUIRED. RESULT DATE ACCURACY
D: Date (mostly used) M: Month, Y: Year, U: Unknown 1, REQUIRED
RESULT REPORTED VALUE
10, REQUIRED
RESULT VALUE UOM
PPB - SMS organic compounds PPM - SMS Metals PCT - TOC, Total Volatile Solids, Total Solids, Grain Size PPTR - dioxin/furan and dioxin-like PCB congeners Refer to UOM Reference Table in EIM Import Module for Valid Values
10, REQUIRED
Result Reported PQL Value
Required when the Result Reported Value is qualified with JT, U, or U containing qualifiers. 20
Result Data Qualifier
Required when the data are outside of QA/QC criteria, See Notes-Data Qualifier for valid codes and description below the Table E-3-1.
3
Result Sample Fraction
Required for Parameter = Metals, Total Recoverable, HF Total: used mostly for sediments samples Suspended, Dissolved, Total
15
RESULT MEASUREMENT BASIS CODE
Dry - Organics, Metals, TOC, Total Volatile Solids Wet - Total Solids 5, REQUIRED
Result Quality 3 RESULT METHOD CODE
Lab analytical or field measurement methods. 10, REQUIRED
Result Value Comment 254
RESULT LAB NAME
Refer to Laboratory Reference Table in EIM Import Module or MyEIM for Valid Values. 60, REQUIRED
Result Validation Method 254
Result Additional Comment 254
Notes – Data Qualifiers
Bb Analyte detected in sample and method blank. Reported result is sample concentration without blank correction or associated quantitation limit.
B1b Analyte detected in sample and method blank. Reported result is blank-corrected. G* Value is likely greater than the reported result. Reported result may be biased low. E Estimates above calibration range J Analyte was positively identified. The reported result is an estimate. JG Analyte was positively identified. Value may be greater than the reported estimate. JK Analyte was positively identified. Reported result is an estimate with unknown bias. JL Analyte was positively identified. Value may be less than the reported estimate.
JTa Analyte was positively identified. Reported result is an estimate below the associated quantitation limit but above the MDL.
JTG Analyte was positively identified. Value may be greater than the reported result, which is an estimate below the associated quantitation limit but above the MDL.
JTK Analyte was positively identified. Reported result is an estimate with unknown bias, below the associated
Sediment Sampling and Analysis Plan Appendix February 2008
E-10
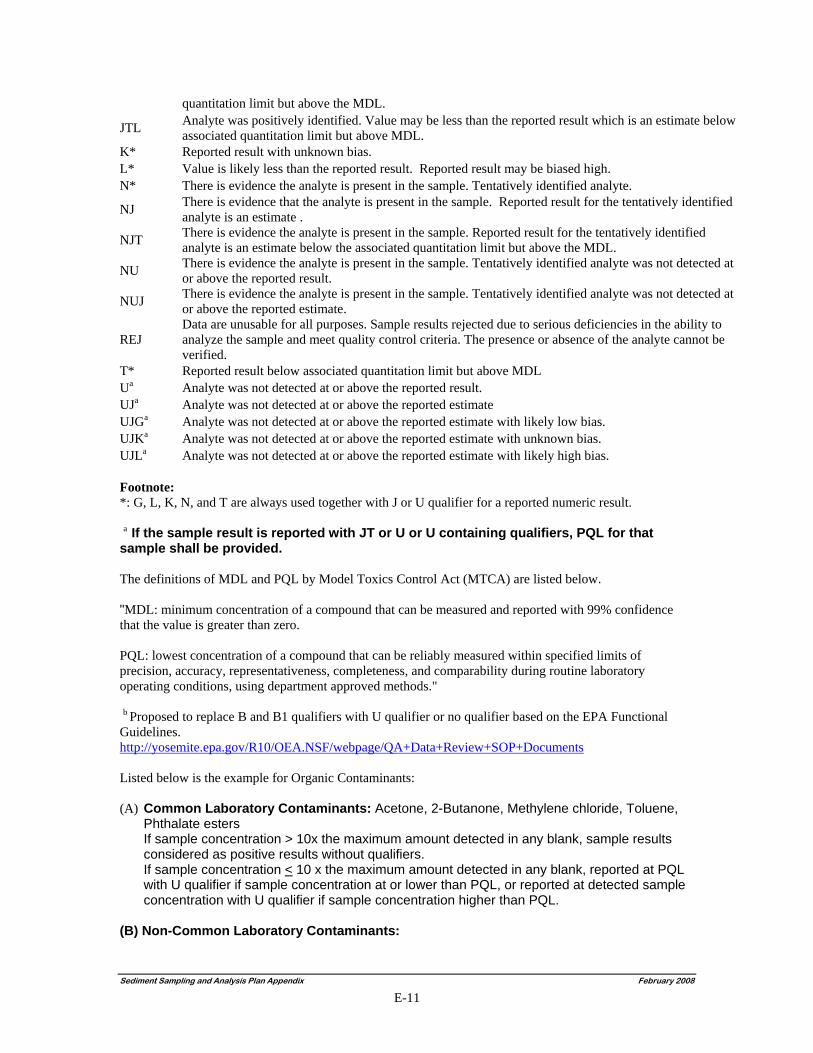
quantitation limit but above the MDL.
JTL Analyte was positively identified. Value may be less than the reported result which is an estimate below associated quantitation limit but above MDL.
K* Reported result with unknown bias. L* Value is likely less than the reported result. Reported result may be biased high. N* There is evidence the analyte is present in the sample. Tentatively identified analyte.
NJ There is evidence that the analyte is present in the sample. Reported result for the tentatively identified analyte is an estimate .
NJT There is evidence the analyte is present in the sample. Reported result for the tentatively identified analyte is an estimate below the associated quantitation limit but above the MDL.
NU There is evidence the analyte is present in the sample. Tentatively identified analyte was not detected at or above the reported result.
NUJ There is evidence the analyte is present in the sample. Tentatively identified analyte was not detected at or above the reported estimate.
REJ Data are unusable for all purposes. Sample results rejected due to serious deficiencies in the ability to analyze the sample and meet quality control criteria. The presence or absence of the analyte cannot be verified.
T* Reported result below associated quantitation limit but above MDL Ua Analyte was not detected at or above the reported result. UJa Analyte was not detected at or above the reported estimate UJGa Analyte was not detected at or above the reported estimate with likely low bias. UJKa Analyte was not detected at or above the reported estimate with unknown bias. UJLa Analyte was not detected at or above the reported estimate with likely high bias. Footnote: *: G, L, K, N, and T are always used together with J or U qualifier for a reported numeric result. a If the sample result is reported with JT or U or U containing qualifiers, PQL for that sample shall be provided. The definitions of MDL and PQL by Model Toxics Control Act (MTCA) are listed below. "MDL: minimum concentration of a compound that can be measured and reported with 99% confidence that the value is greater than zero. PQL: lowest concentration of a compound that can be reliably measured within specified limits of precision, accuracy, representativeness, completeness, and comparability during routine laboratory operating conditions, using department approved methods." b Proposed to replace B and B1 qualifiers with U qualifier or no qualifier based on the EPA Functional Guidelines. http://yosemite.epa.gov/R10/OEA.NSF/webpage/QA+Data+Review+SOP+Documents Listed below is the example for Organic Contaminants: (A) Common Laboratory Contaminants: Acetone, 2-Butanone, Methylene chloride, Toluene,
Phthalate esters If sample concentration > 10x the maximum amount detected in any blank, sample results considered as positive results without qualifiers. If sample concentration < 10 x the maximum amount detected in any blank, reported at PQL with U qualifier if sample concentration at or lower than PQL, or reported at detected sample concentration with U qualifier if sample concentration higher than PQL.
(B) Non-Common Laboratory Contaminants:
Sediment Sampling and Analysis Plan Appendix February 2008
E-11
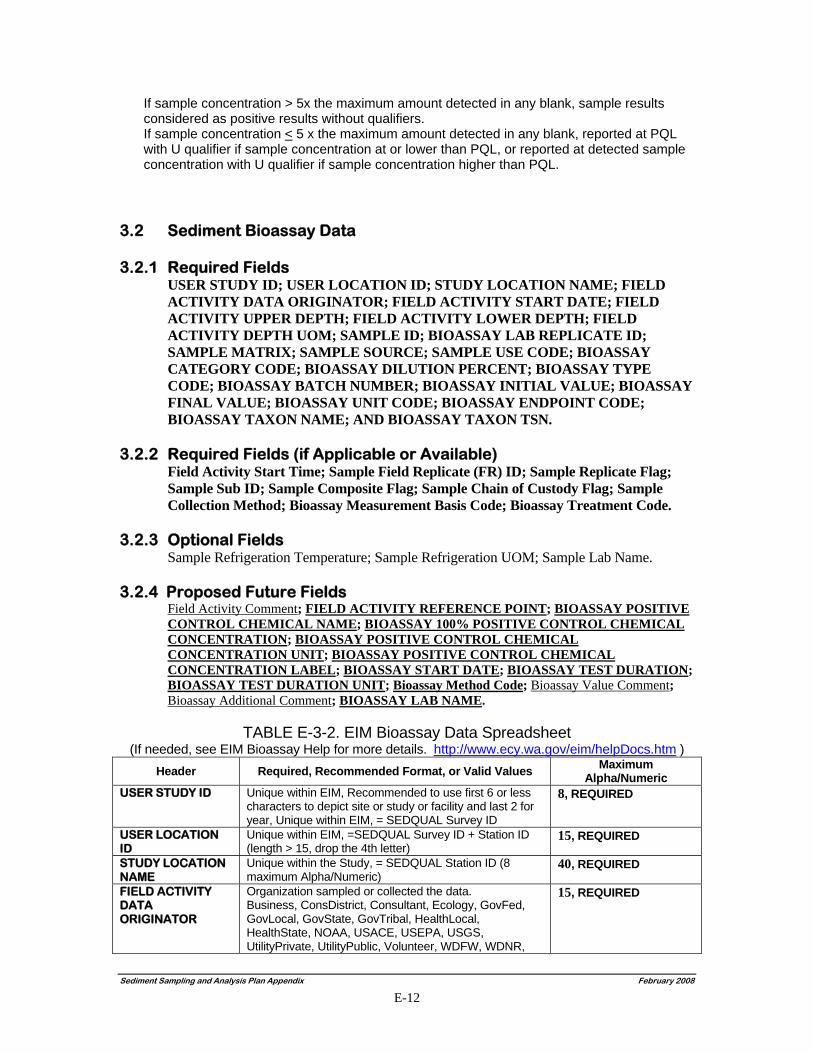
If sample concentration > 5x the maximum amount detected in any blank, sample results considered as positive results without qualifiers. If sample concentration < 5 x the maximum amount detected in any blank, reported at PQL with U qualifier if sample concentration at or lower than PQL, or reported at detected sample concentration with U qualifier if sample concentration higher than PQL.
3.2 Sediment Bioassay Data 3.2.1 Required Fields
USER STUDY ID; USER LOCATION ID; STUDY LOCATION NAME; FIELD ACTIVITY DATA ORIGINATOR; FIELD ACTIVITY START DATE; FIELD ACTIVITY UPPER DEPTH; FIELD ACTIVITY LOWER DEPTH; FIELD ACTIVITY DEPTH UOM; SAMPLE ID; BIOASSAY LAB REPLICATE ID; SAMPLE MATRIX; SAMPLE SOURCE; SAMPLE USE CODE; BIOASSAY CATEGORY CODE; BIOASSAY DILUTION PERCENT; BIOASSAY TYPE CODE; BIOASSAY BATCH NUMBER; BIOASSAY INITIAL VALUE; BIOASSAY FINAL VALUE; BIOASSAY UNIT CODE; BIOASSAY ENDPOINT CODE; BIOASSAY TAXON NAME; AND BIOASSAY TAXON TSN.
3.2.2 Required Fields (if Applicable or Available) Field Activity Start Time; Sample Field Replicate (FR) ID; Sample Replicate Flag; Sample Sub ID; Sample Composite Flag; Sample Chain of Custody Flag; Sample Collection Method; Bioassay Measurement Basis Code; Bioassay Treatment Code.
3.2.3 Optional Fields Sample Refrigeration Temperature; Sample Refrigeration UOM; Sample Lab Name.
3.2.4 Proposed Future Fields Field Activity Comment; FIELD ACTIVITY REFERENCE POINT; BIOASSAY POSITIVE CONTROL CHEMICAL NAME; BIOASSAY 100% POSITIVE CONTROL CHEMICAL CONCENTRATION; BIOASSAY POSITIVE CONTROL CHEMICAL CONCENTRATION UNIT; BIOASSAY POSITIVE CONTROL CHEMICAL CONCENTRATION LABEL; BIOASSAY START DATE; BIOASSAY TEST DURATION; BIOASSAY TEST DURATION UNIT; Bioassay Method Code; Bioassay Value Comment; Bioassay Additional Comment; BIOASSAY LAB NAME.
TABLE E-3-2. EIM Bioassay Data Spreadsheet
(If needed, see EIM Bioassay Help for more details. http://www.ecy.wa.gov/eim/helpDocs.htm ) Header Required, Recommended Format, or Valid Values Maximum
Alpha/Numeric USER STUDY ID Unique within EIM, Recommended to use first 6 or less
characters to depict site or study or facility and last 2 for year, Unique within EIM, = SEDQUAL Survey ID
8, REQUIRED
USER LOCATION ID
Unique within EIM, =SEDQUAL Survey ID + Station ID (length > 15, drop the 4th letter)
15, REQUIRED
STUDY LOCATION NAME
Unique within the Study, = SEDQUAL Station ID (8 maximum Alpha/Numeric)
40, REQUIRED
FIELD ACTIVITY DATA ORIGINATOR
Organization sampled or collected the data. Business, ConsDistrict, Consultant, Ecology, GovFed, GovLocal, GovState, GovTribal, HealthLocal, HealthState, NOAA, USACE, USEPA, USGS, UtilityPrivate, UtilityPublic, Volunteer, WDFW, WDNR,
15, REQUIRED
Sediment Sampling and Analysis Plan Appendix February 2008
E-12
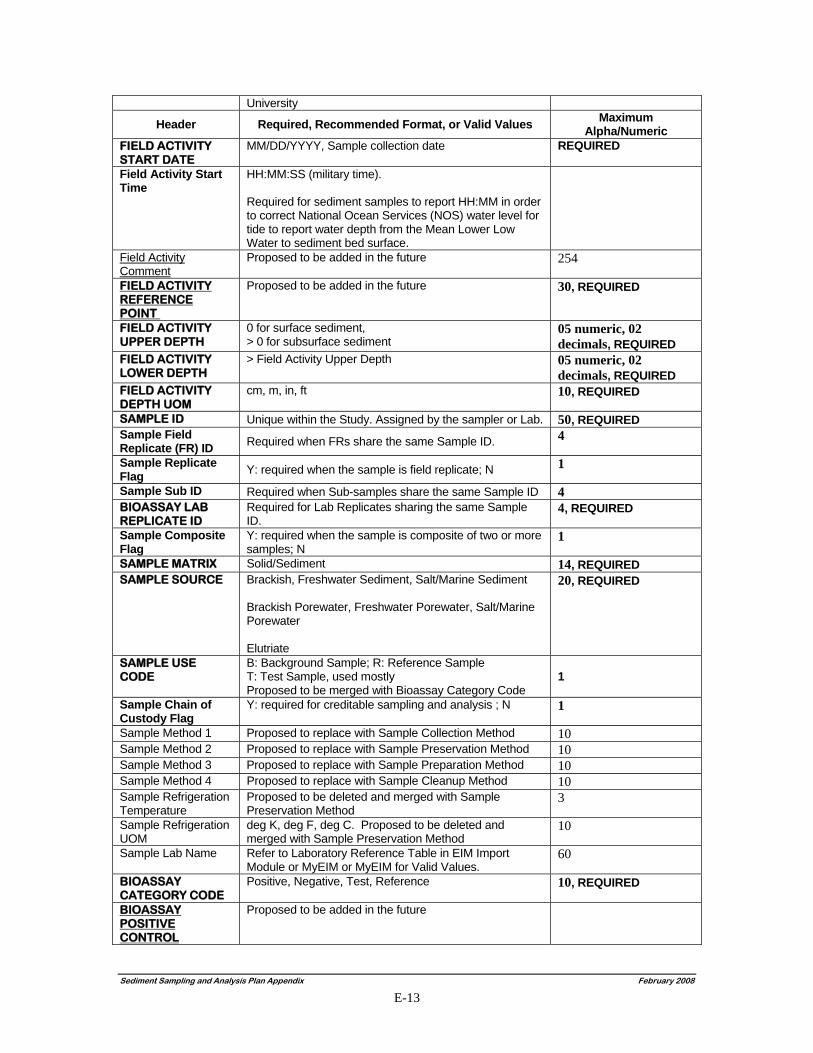
Sediment Sampling and Analysis Plan Appendix February 2008
E-13
University
Header Required, Recommended Format, or Valid Values Maximum Alpha/Numeric
FIELD ACTIVITY START DATE
MM/DD/YYYY, Sample collection date REQUIRED
Field Activity Start Time
HH:MM:SS (military time). Required for sediment samples to report HH:MM in order to correct National Ocean Services (NOS) water level for tide to report water depth from the Mean Lower Low Water to sediment bed surface.
Field Activity Comment
Proposed to be added in the future 254
FIELD ACTIVITY REFERENCE POINT
Proposed to be added in the future 30, REQUIRED
FIELD ACTIVITY UPPER DEPTH
0 for surface sediment, > 0 for subsurface sediment
05 numeric, 02 decimals, REQUIRED
FIELD ACTIVITY LOWER DEPTH
> Field Activity Upper Depth 05 numeric, 02 decimals, REQUIRED
FIELD ACTIVITY DEPTH UOM
cm, m, in, ft 10, REQUIRED
SAMPLE ID Unique within the Study. Assigned by the sampler or Lab. 50, REQUIRED Sample Field Replicate (FR) ID Required when FRs share the same Sample ID. 4
Sample Replicate Flag Y: required when the sample is field replicate; N 1
Sample Sub ID Required when Sub-samples share the same Sample ID 4 BIOASSAY LAB REPLICATE ID
Required for Lab Replicates sharing the same Sample ID.
4, REQUIRED
Sample Composite Flag
Y: required when the sample is composite of two or more samples; N
1
SAMPLE MATRIX Solid/Sediment 14, REQUIRED SAMPLE SOURCE Brackish, Freshwater Sediment, Salt/Marine Sediment
Brackish Porewater, Freshwater Porewater, Salt/Marine Porewater Elutriate
20, REQUIRED
SAMPLE USE CODE
B: Background Sample; R: Reference Sample T: Test Sample, used mostly Proposed to be merged with Bioassay Category Code
1
Sample Chain of Custody Flag
Y: required for creditable sampling and analysis ; N 1
Sample Method 1 Proposed to replace with Sample Collection Method 10 Sample Method 2 Proposed to replace with Sample Preservation Method 10 Sample Method 3 Proposed to replace with Sample Preparation Method 10 Sample Method 4 Proposed to replace with Sample Cleanup Method 10 Sample Refrigeration Temperature
Proposed to be deleted and merged with Sample Preservation Method
3
Sample Refrigeration UOM
deg K, deg F, deg C. Proposed to be deleted and merged with Sample Preservation Method
10
Sample Lab Name
Refer to Laboratory Reference Table in EIM Import Module or MyEIM or MyEIM for Valid Values.
60
BIOASSAY CATEGORY CODE
Positive, Negative, Test, Reference 10, REQUIRED
BIOASSAY POSITIVE CONTROL
Proposed to be added in the future
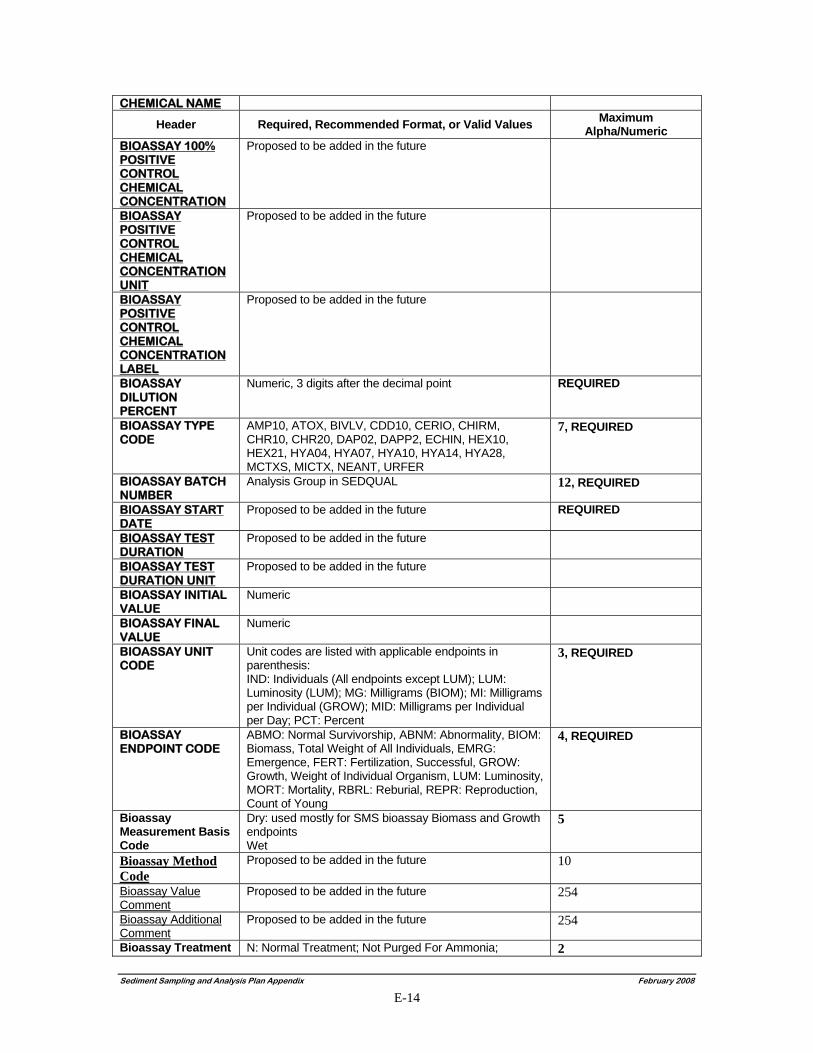
Sediment Sampling and Analysis Plan Appendix February 2008
E-14
CHEMICAL NAME
Header Required, Recommended Format, or Valid Values Maximum Alpha/Numeric
BIOASSAY 100% POSITIVE CONTROL CHEMICAL CONCENTRATION
Proposed to be added in the future
BIOASSAY POSITIVE CONTROL CHEMICAL CONCENTRATION UNIT
Proposed to be added in the future
BIOASSAY POSITIVE CONTROL CHEMICAL CONCENTRATION LABEL
Proposed to be added in the future
BIOASSAY DILUTION PERCENT
Numeric, 3 digits after the decimal point REQUIRED
BIOASSAY TYPE CODE
AMP10, ATOX, BIVLV, CDD10, CERIO, CHIRM, CHR10, CHR20, DAP02, DAPP2, ECHIN, HEX10, HEX21, HYA04, HYA07, HYA10, HYA14, HYA28, MCTXS, MICTX, NEANT, URFER
7, REQUIRED
BIOASSAY BATCH NUMBER
Analysis Group in SEDQUAL 12, REQUIRED
BIOASSAY START DATE
Proposed to be added in the future REQUIRED
BIOASSAY TEST DURATION
Proposed to be added in the future
BIOASSAY TEST DURATION UNIT
Proposed to be added in the future
BIOASSAY INITIAL VALUE
Numeric
BIOASSAY FINAL VALUE
Numeric
BIOASSAY UNIT CODE
Unit codes are listed with applicable endpoints in parenthesis: IND: Individuals (All endpoints except LUM); LUM: Luminosity (LUM); MG: Milligrams (BIOM); MI: Milligrams per Individual (GROW); MID: Milligrams per Individual per Day; PCT: Percent
3, REQUIRED
BIOASSAY ENDPOINT CODE
ABMO: Normal Survivorship, ABNM: Abnormality, BIOM: Biomass, Total Weight of All Individuals, EMRG: Emergence, FERT: Fertilization, Successful, GROW: Growth, Weight of Individual Organism, LUM: Luminosity, MORT: Mortality, RBRL: Reburial, REPR: Reproduction, Count of Young
4, REQUIRED
Bioassay Measurement Basis Code
Dry: used mostly for SMS bioassay Biomass and Growth endpoints Wet
5
Bioassay Method Code
Proposed to be added in the future 10
Bioassay Value Comment
Proposed to be added in the future 254
Bioassay Additional Comment
Proposed to be added in the future 254
Bioassay Treatment N: Normal Treatment; Not Purged For Ammonia; 2
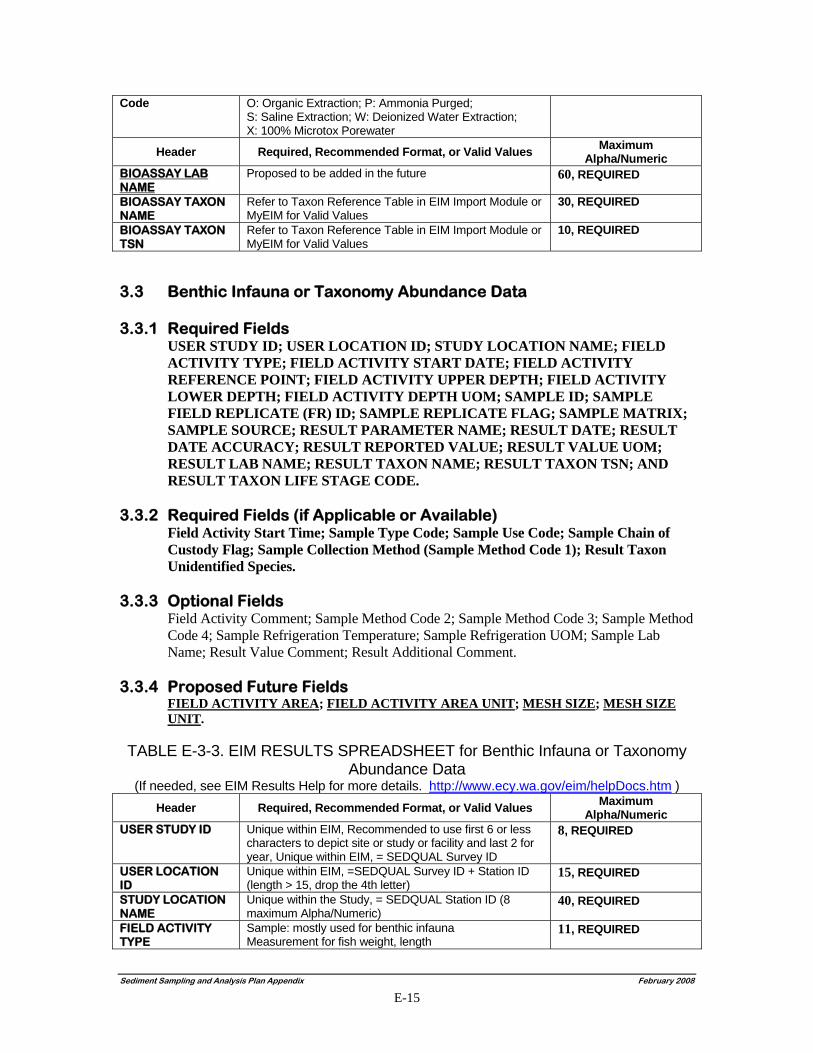
Sediment Sampling and Analysis Plan Appendix February 2008
E-15
Code O: Organic Extraction; P: Ammonia Purged; S: Saline Extraction; W: Deionized Water Extraction; X: 100% Microtox Porewater
Header Required, Recommended Format, or Valid Values Maximum Alpha/Numeric
BIOASSAY LAB NAME
Proposed to be added in the future 60, REQUIRED
BIOASSAY TAXON NAME
Refer to Taxon Reference Table in EIM Import Module or MyEIM for Valid Values
30, REQUIRED
BIOASSAY TAXON TSN
Refer to Taxon Reference Table in EIM Import Module or MyEIM for Valid Values
10, REQUIRED
3.3 Benthic Infauna or Taxonomy Abundance Data 3.3.1 Required Fields
USER STUDY ID; USER LOCATION ID; STUDY LOCATION NAME; FIELD ACTIVITY TYPE; FIELD ACTIVITY START DATE; FIELD ACTIVITY REFERENCE POINT; FIELD ACTIVITY UPPER DEPTH; FIELD ACTIVITY LOWER DEPTH; FIELD ACTIVITY DEPTH UOM; SAMPLE ID; SAMPLE FIELD REPLICATE (FR) ID; SAMPLE REPLICATE FLAG; SAMPLE MATRIX; SAMPLE SOURCE; RESULT PARAMETER NAME; RESULT DATE; RESULT DATE ACCURACY; RESULT REPORTED VALUE; RESULT VALUE UOM; RESULT LAB NAME; RESULT TAXON NAME; RESULT TAXON TSN; AND RESULT TAXON LIFE STAGE CODE.
3.3.2 Required Fields (if Applicable or Available) Field Activity Start Time; Sample Type Code; Sample Use Code; Sample Chain of Custody Flag; Sample Collection Method (Sample Method Code 1); Result Taxon Unidentified Species.
3.3.3 Optional Fields Field Activity Comment; Sample Method Code 2; Sample Method Code 3; Sample Method Code 4; Sample Refrigeration Temperature; Sample Refrigeration UOM; Sample Lab Name; Result Value Comment; Result Additional Comment.
3.3.4 Proposed Future Fields FIELD ACTIVITY AREA; FIELD ACTIVITY AREA UNIT; MESH SIZE; MESH SIZE UNIT.
TABLE E-3-3. EIM RESULTS SPREADSHEET for Benthic Infauna or Taxonomy
Abundance Data (If needed, see EIM Results Help for more details. http://www.ecy.wa.gov/eim/helpDocs.htm )
Header Required, Recommended Format, or Valid Values Maximum Alpha/Numeric
USER STUDY ID Unique within EIM, Recommended to use first 6 or less characters to depict site or study or facility and last 2 for year, Unique within EIM, = SEDQUAL Survey ID
8, REQUIRED
USER LOCATION ID
Unique within EIM, =SEDQUAL Survey ID + Station ID (length > 15, drop the 4th letter)
15, REQUIRED
STUDY LOCATION NAME
Unique within the Study, = SEDQUAL Station ID (8 maximum Alpha/Numeric)
40, REQUIRED
FIELD ACTIVITY TYPE
Sample: mostly used for benthic infauna Measurement for fish weight, length
11, REQUIRED
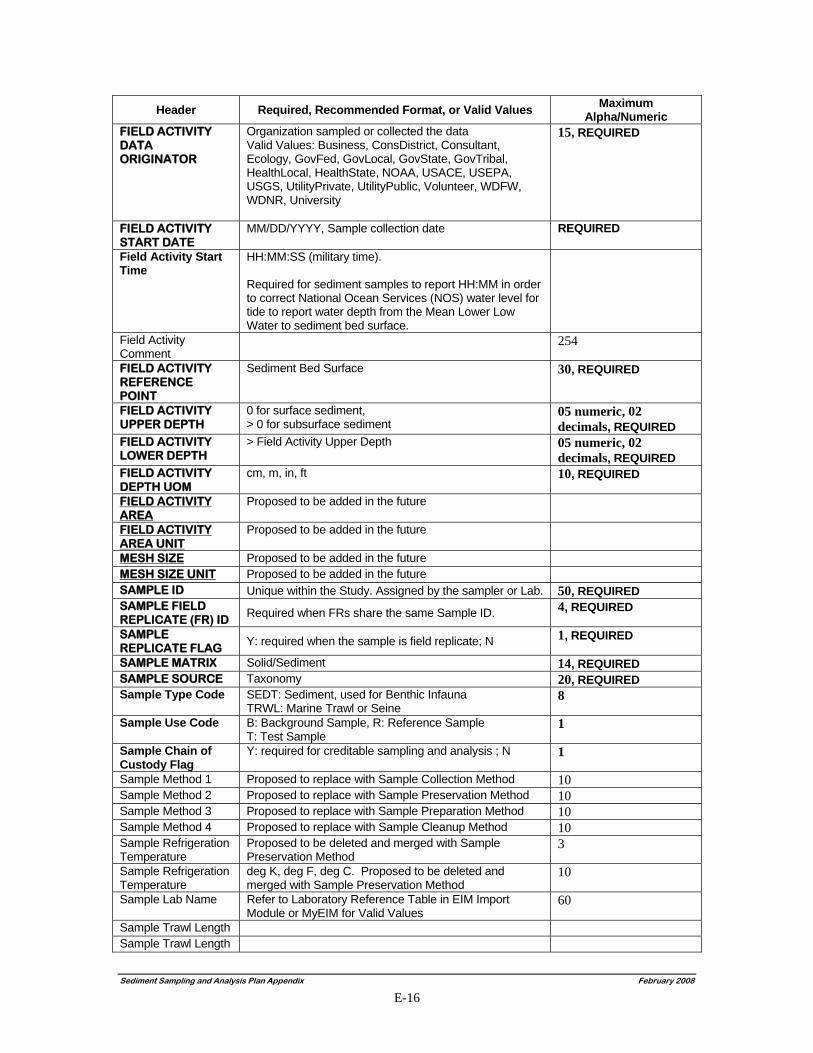
Sediment Sampling and Analysis Plan Appendix February 2008
E-16
Header Required, Recommended Format, or Valid Values Maximum Alpha/Numeric
FIELD ACTIVITY DATA ORIGINATOR
Organization sampled or collected the data Valid Values: Business, ConsDistrict, Consultant, Ecology, GovFed, GovLocal, GovState, GovTribal, HealthLocal, HealthState, NOAA, USACE, USEPA, USGS, UtilityPrivate, UtilityPublic, Volunteer, WDFW, WDNR, University
15, REQUIRED
FIELD ACTIVITY START DATE
MM/DD/YYYY, Sample collection date REQUIRED
Field Activity Start Time
HH:MM:SS (military time). Required for sediment samples to report HH:MM in order to correct National Ocean Services (NOS) water level for tide to report water depth from the Mean Lower Low Water to sediment bed surface.
Field Activity Comment
254
FIELD ACTIVITY REFERENCE POINT
Sediment Bed Surface 30, REQUIRED
FIELD ACTIVITY UPPER DEPTH
0 for surface sediment, > 0 for subsurface sediment
05 numeric, 02 decimals, REQUIRED
FIELD ACTIVITY LOWER DEPTH
> Field Activity Upper Depth 05 numeric, 02 decimals, REQUIRED
FIELD ACTIVITY DEPTH UOM
cm, m, in, ft 10, REQUIRED
FIELD ACTIVITY AREA
Proposed to be added in the future
FIELD ACTIVITY AREA UNIT
Proposed to be added in the future
MESH SIZE Proposed to be added in the future MESH SIZE UNIT Proposed to be added in the future SAMPLE ID Unique within the Study. Assigned by the sampler or Lab. 50, REQUIRED SAMPLE FIELD REPLICATE (FR) ID
Required when FRs share the same Sample ID. 4, REQUIRED
SAMPLE REPLICATE FLAG
Y: required when the sample is field replicate; N 1, REQUIRED
SAMPLE MATRIX Solid/Sediment 14, REQUIRED SAMPLE SOURCE Taxonomy 20, REQUIRED Sample Type Code SEDT: Sediment, used for Benthic Infauna
TRWL: Marine Trawl or Seine 8
Sample Use Code B: Background Sample, R: Reference Sample T: Test Sample
1
Sample Chain of Custody Flag
Y: required for creditable sampling and analysis ; N 1
Sample Method 1 Proposed to replace with Sample Collection Method 10 Sample Method 2 Proposed to replace with Sample Preservation Method 10 Sample Method 3 Proposed to replace with Sample Preparation Method 10 Sample Method 4 Proposed to replace with Sample Cleanup Method 10 Sample Refrigeration Temperature
Proposed to be deleted and merged with Sample Preservation Method
3
Sample Refrigeration Temperature
deg K, deg F, deg C. Proposed to be deleted and merged with Sample Preservation Method
10
Sample Lab Name Refer to Laboratory Reference Table in EIM Import Module or MyEIM for Valid Values
60
Sample Trawl Length Sample Trawl Length
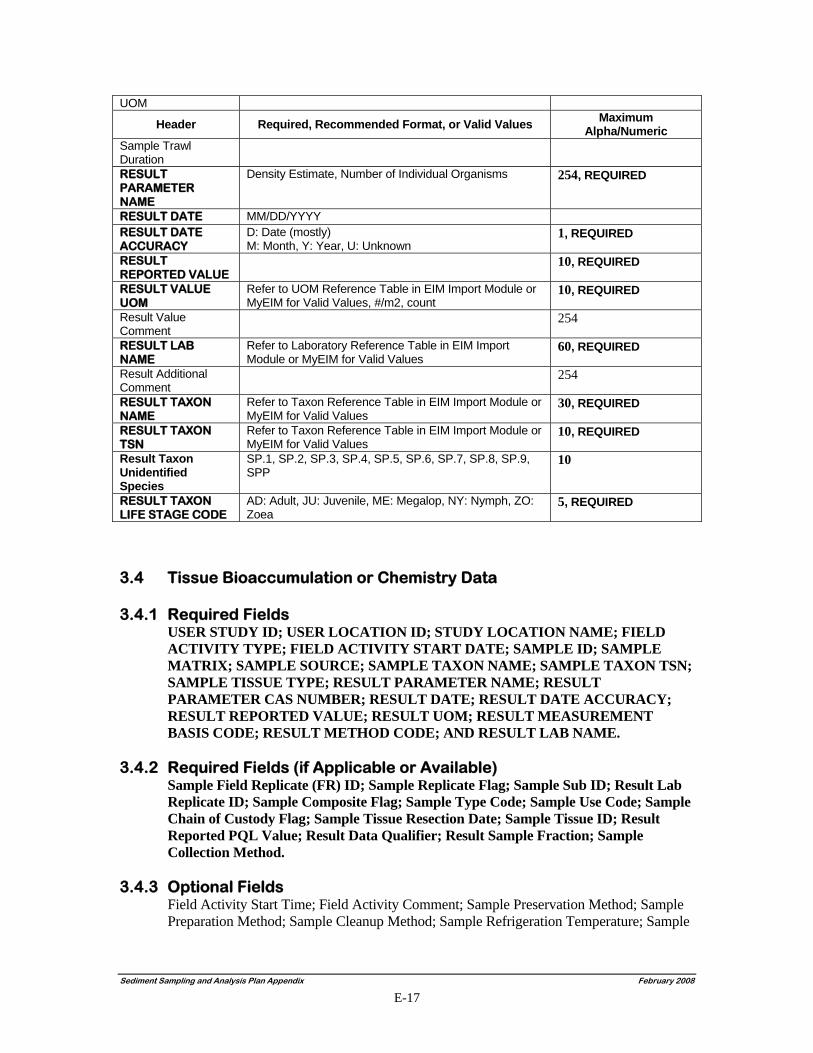
UOM
Header Required, Recommended Format, or Valid Values Maximum Alpha/Numeric
Sample Trawl Duration
RESULT PARAMETER NAME
Density Estimate, Number of Individual Organisms
254, REQUIRED
RESULT DATE MM/DD/YYYY RESULT DATE ACCURACY
D: Date (mostly) M: Month, Y: Year, U: Unknown
1, REQUIRED
RESULT REPORTED VALUE
10, REQUIRED
RESULT VALUE UOM
Refer to UOM Reference Table in EIM Import Module or MyEIM for Valid Values, #/m2, count
10, REQUIRED
Result Value Comment
254
RESULT LAB NAME
Refer to Laboratory Reference Table in EIM Import Module or MyEIM for Valid Values
60, REQUIRED
Result Additional Comment
254
RESULT TAXON NAME
Refer to Taxon Reference Table in EIM Import Module or MyEIM for Valid Values
30, REQUIRED
RESULT TAXON TSN
Refer to Taxon Reference Table in EIM Import Module or MyEIM for Valid Values
10, REQUIRED
Result Taxon Unidentified Species
SP.1, SP.2, SP.3, SP.4, SP.5, SP.6, SP.7, SP.8, SP.9, SPP
10
RESULT TAXON LIFE STAGE CODE
AD: Adult, JU: Juvenile, ME: Megalop, NY: Nymph, ZO: Zoea
5, REQUIRED
3.4 Tissue Bioaccumulation or Chemistry Data 3.4.1 Required Fields
USER STUDY ID; USER LOCATION ID; STUDY LOCATION NAME; FIELD ACTIVITY TYPE; FIELD ACTIVITY START DATE; SAMPLE ID; SAMPLE MATRIX; SAMPLE SOURCE; SAMPLE TAXON NAME; SAMPLE TAXON TSN; SAMPLE TISSUE TYPE; RESULT PARAMETER NAME; RESULT PARAMETER CAS NUMBER; RESULT DATE; RESULT DATE ACCURACY; RESULT REPORTED VALUE; RESULT UOM; RESULT MEASUREMENT BASIS CODE; RESULT METHOD CODE; AND RESULT LAB NAME.
3.4.2 Required Fields (if Applicable or Available) Sample Field Replicate (FR) ID; Sample Replicate Flag; Sample Sub ID; Result Lab Replicate ID; Sample Composite Flag; Sample Type Code; Sample Use Code; Sample Chain of Custody Flag; Sample Tissue Resection Date; Sample Tissue ID; Result Reported PQL Value; Result Data Qualifier; Result Sample Fraction; Sample Collection Method.
3.4.3 Optional Fields Field Activity Start Time; Field Activity Comment; Sample Preservation Method; Sample Preparation Method; Sample Cleanup Method; Sample Refrigeration Temperature; Sample
Sediment Sampling and Analysis Plan Appendix February 2008
E-17
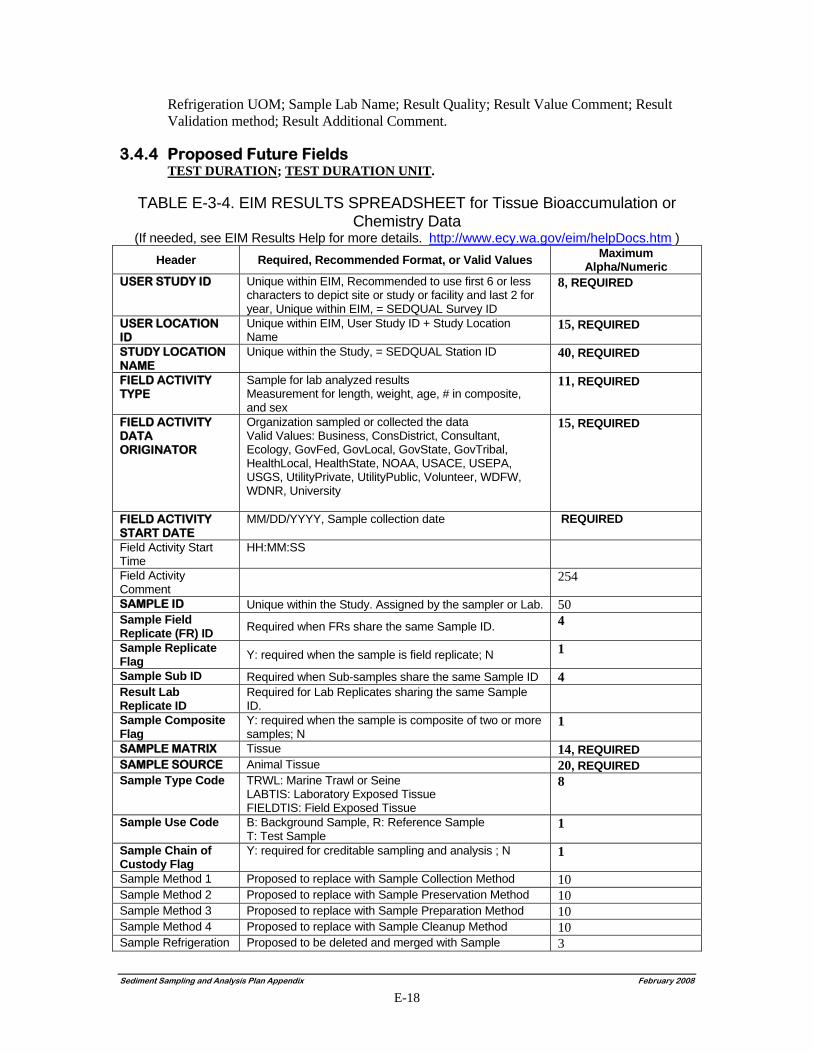
Refrigeration UOM; Sample Lab Name; Result Quality; Result Value Comment; Result Validation method; Result Additional Comment.
3.4.4 Proposed Future Fields TEST DURATION; TEST DURATION UNIT.
TABLE E-3-4. EIM RESULTS SPREADSHEET for Tissue Bioaccumulation or
Chemistry Data (If needed, see EIM Results Help for more details. http://www.ecy.wa.gov/eim/helpDocs.htm )
Header Required, Recommended Format, or Valid Values Maximum Alpha/Numeric
USER STUDY ID Unique within EIM, Recommended to use first 6 or less characters to depict site or study or facility and last 2 for year, Unique within EIM, = SEDQUAL Survey ID
8, REQUIRED
USER LOCATION ID
Unique within EIM, User Study ID + Study Location Name
15, REQUIRED
STUDY LOCATION NAME
Unique within the Study, = SEDQUAL Station ID 40, REQUIRED
FIELD ACTIVITY TYPE
Sample for lab analyzed results Measurement for length, weight, age, # in composite, and sex
11, REQUIRED
FIELD ACTIVITY DATA ORIGINATOR
Organization sampled or collected the data Valid Values: Business, ConsDistrict, Consultant, Ecology, GovFed, GovLocal, GovState, GovTribal, HealthLocal, HealthState, NOAA, USACE, USEPA, USGS, UtilityPrivate, UtilityPublic, Volunteer, WDFW, WDNR, University
15, REQUIRED
FIELD ACTIVITY START DATE
MM/DD/YYYY, Sample collection date REQUIRED
Field Activity Start Time
HH:MM:SS
Field Activity Comment
254
SAMPLE ID Unique within the Study. Assigned by the sampler or Lab. 50 Sample Field Replicate (FR) ID Required when FRs share the same Sample ID. 4
Sample Replicate Flag Y: required when the sample is field replicate; N 1
Sample Sub ID Required when Sub-samples share the same Sample ID 4 Result Lab Replicate ID
Required for Lab Replicates sharing the same Sample ID.
Sample Composite Flag
Y: required when the sample is composite of two or more samples; N
1
SAMPLE MATRIX Tissue 14, REQUIRED SAMPLE SOURCE Animal Tissue 20, REQUIRED Sample Type Code TRWL: Marine Trawl or Seine
LABTIS: Laboratory Exposed Tissue FIELDTIS: Field Exposed Tissue
8
Sample Use Code B: Background Sample, R: Reference Sample T: Test Sample
1
Sample Chain of Custody Flag
Y: required for creditable sampling and analysis ; N 1
Sample Method 1 Proposed to replace with Sample Collection Method 10 Sample Method 2 Proposed to replace with Sample Preservation Method 10 Sample Method 3 Proposed to replace with Sample Preparation Method 10 Sample Method 4 Proposed to replace with Sample Cleanup Method 10 Sample Refrigeration Proposed to be deleted and merged with Sample 3
Sediment Sampling and Analysis Plan Appendix February 2008
E-18
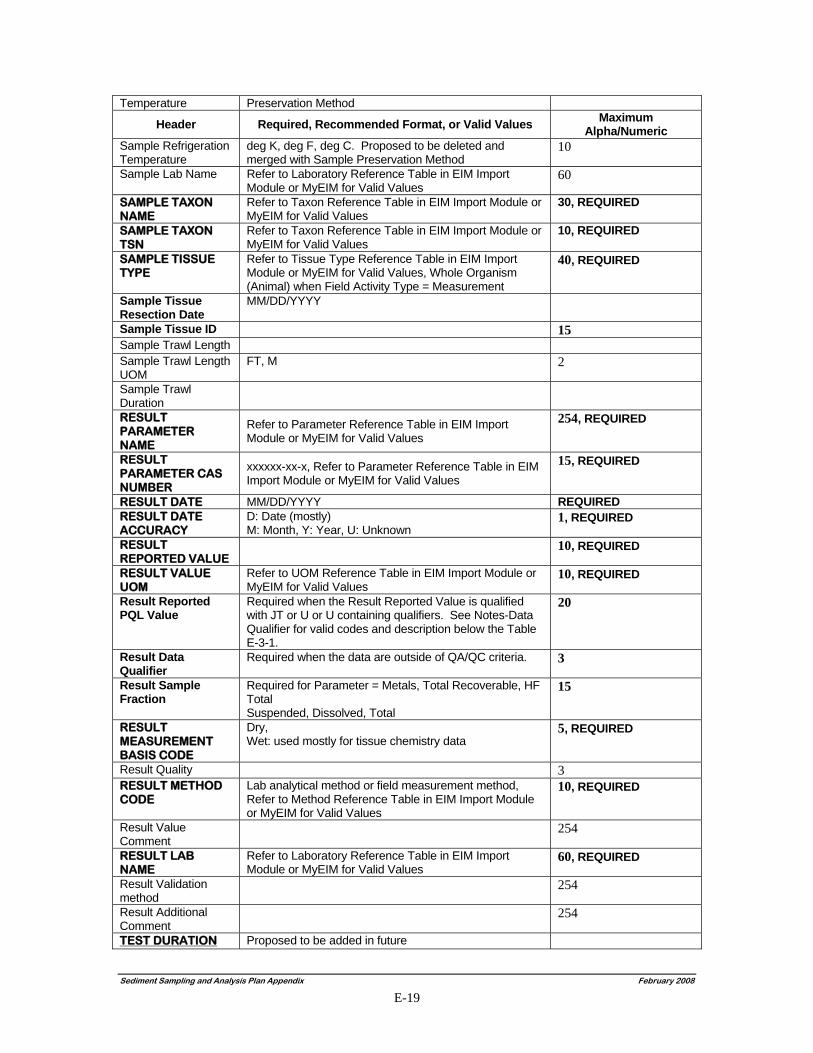
Sediment Sampling and Analysis Plan Appendix February 2008
E-19
Temperature Preservation Method
Header Required, Recommended Format, or Valid Values Maximum Alpha/Numeric
Sample Refrigeration Temperature
deg K, deg F, deg C. Proposed to be deleted and merged with Sample Preservation Method
10
Sample Lab Name Refer to Laboratory Reference Table in EIM Import Module or MyEIM for Valid Values
60
SAMPLE TAXON NAME
Refer to Taxon Reference Table in EIM Import Module or MyEIM for Valid Values
30, REQUIRED
SAMPLE TAXON TSN
Refer to Taxon Reference Table in EIM Import Module or MyEIM for Valid Values
10, REQUIRED
SAMPLE TISSUE TYPE
Refer to Tissue Type Reference Table in EIM Import Module or MyEIM for Valid Values, Whole Organism (Animal) when Field Activity Type = Measurement
40, REQUIRED
Sample Tissue Resection Date
MM/DD/YYYY
Sample Tissue ID 15 Sample Trawl Length Sample Trawl Length UOM
FT, M 2
Sample Trawl Duration
RESULT PARAMETER NAME
Refer to Parameter Reference Table in EIM Import Module or MyEIM for Valid Values
254, REQUIRED
RESULT PARAMETER CAS NUMBER
xxxxxx-xx-x, Refer to Parameter Reference Table in EIM Import Module or MyEIM for Valid Values
15, REQUIRED
RESULT DATE MM/DD/YYYY REQUIRED RESULT DATE ACCURACY
D: Date (mostly) M: Month, Y: Year, U: Unknown
1, REQUIRED
RESULT REPORTED VALUE
10, REQUIRED
RESULT VALUE UOM
Refer to UOM Reference Table in EIM Import Module or MyEIM for Valid Values
10, REQUIRED
Result Reported PQL Value
Required when the Result Reported Value is qualified with JT or U or U containing qualifiers. See Notes-Data Qualifier for valid codes and description below the Table E-3-1.
20
Result Data Qualifier
Required when the data are outside of QA/QC criteria. 3
Result Sample Fraction
Required for Parameter = Metals, Total Recoverable, HF Total Suspended, Dissolved, Total
15
RESULT MEASUREMENT BASIS CODE
Dry, Wet: used mostly for tissue chemistry data
5, REQUIRED
Result Quality 3 RESULT METHOD CODE
Lab analytical method or field measurement method, Refer to Method Reference Table in EIM Import Module or MyEIM for Valid Values
10, REQUIRED
Result Value Comment
254
RESULT LAB NAME
Refer to Laboratory Reference Table in EIM Import Module or MyEIM for Valid Values
60, REQUIRED
Result Validation method
254
Result Additional Comment
254
TEST DURATION Proposed to be added in future
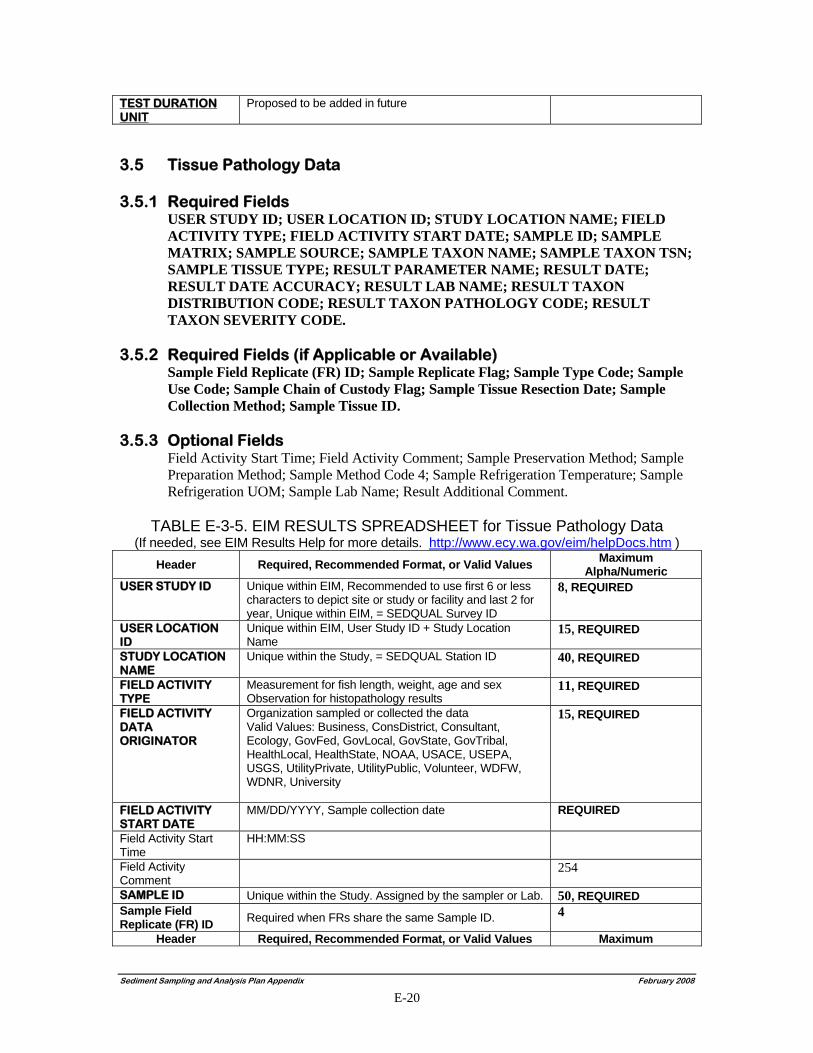
Sediment Sampling and Analysis Plan Appendix February 2008
E-20
TEST DURATION UNIT
Proposed to be added in future
3.5 Tissue Pathology Data 3.5.1 Required Fields
USER STUDY ID; USER LOCATION ID; STUDY LOCATION NAME; FIELD ACTIVITY TYPE; FIELD ACTIVITY START DATE; SAMPLE ID; SAMPLE MATRIX; SAMPLE SOURCE; SAMPLE TAXON NAME; SAMPLE TAXON TSN; SAMPLE TISSUE TYPE; RESULT PARAMETER NAME; RESULT DATE; RESULT DATE ACCURACY; RESULT LAB NAME; RESULT TAXON DISTRIBUTION CODE; RESULT TAXON PATHOLOGY CODE; RESULT TAXON SEVERITY CODE.
3.5.2 Required Fields (if Applicable or Available) Sample Field Replicate (FR) ID; Sample Replicate Flag; Sample Type Code; Sample Use Code; Sample Chain of Custody Flag; Sample Tissue Resection Date; Sample Collection Method; Sample Tissue ID.
3.5.3 Optional Fields Field Activity Start Time; Field Activity Comment; Sample Preservation Method; Sample Preparation Method; Sample Method Code 4; Sample Refrigeration Temperature; Sample Refrigeration UOM; Sample Lab Name; Result Additional Comment.
TABLE E-3-5. EIM RESULTS SPREADSHEET for Tissue Pathology Data (If needed, see EIM Results Help for more details. http://www.ecy.wa.gov/eim/helpDocs.htm )
Header Required, Recommended Format, or Valid Values Maximum Alpha/Numeric
USER STUDY ID Unique within EIM, Recommended to use first 6 or less characters to depict site or study or facility and last 2 for year, Unique within EIM, = SEDQUAL Survey ID
8, REQUIRED
USER LOCATION ID
Unique within EIM, User Study ID + Study Location Name
15, REQUIRED
STUDY LOCATION NAME
Unique within the Study, = SEDQUAL Station ID 40, REQUIRED
FIELD ACTIVITY TYPE
Measurement for fish length, weight, age and sex Observation for histopathology results
11, REQUIRED
FIELD ACTIVITY DATA ORIGINATOR
Organization sampled or collected the data Valid Values: Business, ConsDistrict, Consultant, Ecology, GovFed, GovLocal, GovState, GovTribal, HealthLocal, HealthState, NOAA, USACE, USEPA, USGS, UtilityPrivate, UtilityPublic, Volunteer, WDFW, WDNR, University
15, REQUIRED
FIELD ACTIVITY START DATE
MM/DD/YYYY, Sample collection date REQUIRED
Field Activity Start Time
HH:MM:SS
Field Activity Comment
254
SAMPLE ID Unique within the Study. Assigned by the sampler or Lab. 50, REQUIRED Sample Field Replicate (FR) ID Required when FRs share the same Sample ID. 4
Header Required, Recommended Format, or Valid Values Maximum
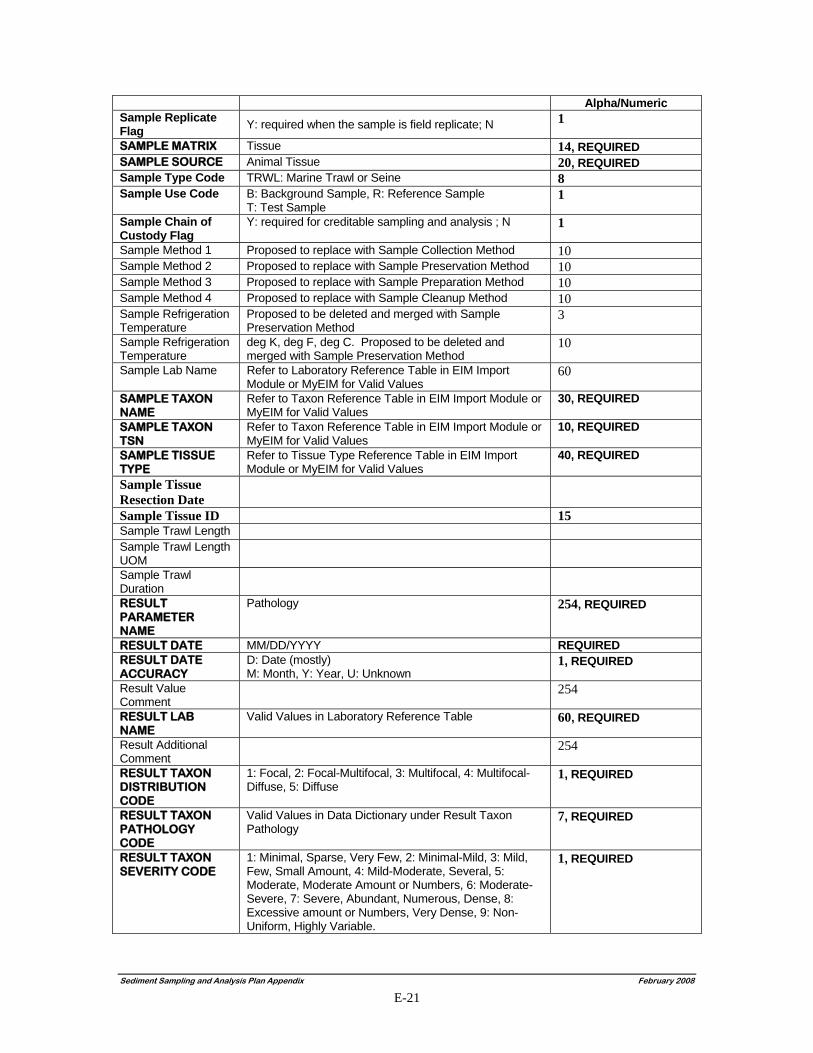
Alpha/Numeric Sample Replicate Flag Y: required when the sample is field replicate; N 1
SAMPLE MATRIX Tissue 14, REQUIRED SAMPLE SOURCE Animal Tissue 20, REQUIRED Sample Type Code TRWL: Marine Trawl or Seine 8 Sample Use Code B: Background Sample, R: Reference Sample
T: Test Sample 1
Sample Chain of Custody Flag
Y: required for creditable sampling and analysis ; N 1
Sample Method 1 Proposed to replace with Sample Collection Method 10 Sample Method 2 Proposed to replace with Sample Preservation Method 10 Sample Method 3 Proposed to replace with Sample Preparation Method 10 Sample Method 4 Proposed to replace with Sample Cleanup Method 10 Sample Refrigeration Temperature
Proposed to be deleted and merged with Sample Preservation Method
3
Sample Refrigeration Temperature
deg K, deg F, deg C. Proposed to be deleted and merged with Sample Preservation Method
10
Sample Lab Name Refer to Laboratory Reference Table in EIM Import Module or MyEIM for Valid Values
60
SAMPLE TAXON NAME
Refer to Taxon Reference Table in EIM Import Module or MyEIM for Valid Values
30, REQUIRED
SAMPLE TAXON TSN
Refer to Taxon Reference Table in EIM Import Module or MyEIM for Valid Values
10, REQUIRED
SAMPLE TISSUE TYPE
Refer to Tissue Type Reference Table in EIM Import Module or MyEIM for Valid Values
40, REQUIRED
Sample Tissue Resection Date
Sample Tissue ID 15 Sample Trawl Length Sample Trawl Length UOM
Sample Trawl Duration
RESULT PARAMETER NAME
Pathology 254, REQUIRED
RESULT DATE MM/DD/YYYY REQUIRED RESULT DATE ACCURACY
D: Date (mostly) M: Month, Y: Year, U: Unknown
1, REQUIRED
Result Value Comment
254
RESULT LAB NAME
Valid Values in Laboratory Reference Table 60, REQUIRED
Result Additional Comment
254
RESULT TAXON DISTRIBUTION CODE
1: Focal, 2: Focal-Multifocal, 3: Multifocal, 4: Multifocal-Diffuse, 5: Diffuse
1, REQUIRED
RESULT TAXON PATHOLOGY CODE
Valid Values in Data Dictionary under Result Taxon Pathology
7, REQUIRED
RESULT TAXON SEVERITY CODE
1: Minimal, Sparse, Very Few, 2: Minimal-Mild, 3: Mild, Few, Small Amount, 4: Mild-Moderate, Several, 5: Moderate, Moderate Amount or Numbers, 6: Moderate-Severe, 7: Severe, Abundant, Numerous, Dense, 8: Excessive amount or Numbers, Very Dense, 9: Non-Uniform, Highly Variable.
1, REQUIRED
Sediment Sampling and Analysis Plan Appendix February 2008
E-21

Sediment Sampling and Analysis Plan Appendix February 2008
E-22