Embed Size (px)
Citation preview

Page 1/13
Spatial Occurrence and Sources of Polycyclic Aromatic Hydrocarbons inSediments Drive the Ecological Risk of Taihu Lake, ChinaXiulu Lang
Nanjing Normal UniversityXinghua He
Nanjing Normal UniversityYanhua Wang ( [email protected] )
Nanjing Normal UniversityXi Chen
Chuzhou UniversityMingli Zhang
Nanjing Normal UniversityZihan Zhao
Nanjing Normal UniversityTian Sun
Nanjing Normal University
Research Article
Keywords: Polycyclic aromatic hydrocarbons (PAHs), Sediments, Source appointment, Health risks, Taihu Lake
Posted Date: November 23rd, 2021
DOI: https://doi.org/10.21203/rs.3.rs-1076560/v1
License: This work is licensed under a Creative Commons Attribution 4.0 International License. Read Full License

Page 2/13
AbstractTo study the spatial occurrence, sources, and ecological risks of 16 PAHs, surface sediments had been collected from seven major areas of Taihu Lake, Chinain April 2021. Results showed that the concentrations of ∑16PAHs varied between 1381.48~4682.16 ng g-1, and the contents of BghiP in each sample werethe highest. The PAHs concentrations in the sediments near the lakeshore were much higher than those in the central area of the lake. The sedimentary∑16PAHs were mainly composed of molecular-weight monomers and 4-ring PAHs showed superiority (35.69%~45.02%). According to the ratio of PAHmonomer, the sedimentary PAHs in Taihu Lake were dominantly derived from the combustion. Through the biological toxicity assessment and the BaPequivalent (BaPE), great biological risks of PAHs monomers i.e. DahA and IcdP were found. Both concentrations of ∑16PAHs and dominant 4~6-ringmonomers accompanied by carcinogenic risks in many areas of Taihu Lake increased. It is necessary to strengthen monitoring and take measures to controlthe input of organic pollutants.
IntroductionPolycyclic aromatic hydrocarbons (PAHs) are typical persistent organic pollutants, which have mutagens, carcinogens, teratogens, and gene toxins, and existin different environmental media for a long time1–3. PAHs could be accumulated through atmospheric deposition, growth of surface vegetation in soil andplants, and then enter the aquatic environment through surface runoff, thereby affecting water ecological security and food chain transmission4. Besides,PAHs in the aquatic environment may be derived from fuels, incomplete combustion, bioorganic metabolism, and the transformation process in sediment5.Among them, fuels and incomplete combustion were anthropogenic-driven, an important contributor to PAHs pollution in aquatic ecosystems.
Sediment, as a repository of PAHs, plays an important role in environmental information archives6–9. Due to the rapid social-economical development and thewidespread use of fossil fuels, the deposition �ux of PAHs showed an increasing trend year by year10. The global total PAHs emissions in 2004 were 520 Gg,and China contributed the most (21.9%), with a high proportion of high-ring PAHs11. With the development of China's economy, PAHs emissions are increasing.More than 50% of the discharged PAHs entered the water environment.
Taihu Lake, located on the southern edge of the Yangtze River Delta, is the third-largest freshwater lake in China. The Taihu Lake Basin is densely populated,and its economy and industry are also relatively developed12. Whether the concentration of PAHs in the Taihu Lake Basin exceeded the standard and whetherit posed a health threat to the surrounding population had received widespread attention13–15. Since 2000, the concentration of PAHs in the sediments of theTaihu Lake Basin had ranged between 698.00~962.00 ng g−1, after 209.00~3842.00 ng g−1 in 2010, and gradually changed to 4900.00~16800.00 ng g−1 in202116–18, showing a continuous upward trend. To investigate the annual occurrence and source changes of PAHs in Taihu Lake sediments is urgent. Theaims of this study were to 1) quantify 16 PAHs in the sediments of different lake areas in Taihu Lake by gas chromatography-mass spectrometry (GC-MS), 2)explore the occurrence and origins of PAHs in sediments of various-type zones; 3) assess the potential ecological and carcinogenic risks of different PAHsspecies in Taihu Lake.
Materials And Methods
Study site and samples collectionTaihu Lake (30°55'40"~31°32'58" N, 119°52'32"~120°36'10" E) located in the lower reaches of Yangtze River, China included Zhushan Bay (ZB), Meiliang Bay(MB), Gonghu Bay (GB), East Taihu area (ETA), South Taihu area (STA), West Taihu area (WTA) and Lake Center (LC). Fifty-two surface sediment samples(Z1~Z6, M1~M11, G1~G6, E1~E11, S1~S4, W1~W4, C1~C10) in above different lake areas of Taihu Lake were sampled through the grab bucket in April 2021(Fig. 1). The samples were collected into sealed polyethylene bags sterilized by ethylene oxide (Nasco, USA) and placed in an incubator covered with icepacks. The latitudes and longitudes of the sampling locations were obtained through a handheld GPS device (Jiaming, eTrex 221x). After that, the sampleswere transported to the laboratory and stored in a refrigerator at 4°C for further analysis.
Extraction methods of organic materialsAfter vacuum freeze-drying, the shell�sh and large plant roots in the sediment were removed, the samples were ground with an agate mortar and then sievedwith a standard 100-mesh sieve (particle size <0.15 mm).
Approximately (2±0.0001) g of the freeze-dried sample was transferred into a 34-mL extraction cell that had been pre-covered with a gasket and well mixed.Using n-hexane/dichloromethane solution (1:1, v:v) as the solvent, the mixed sample was put into the accelerated solvent extractor (ASE) with a 350 system(Thermo Scienti�c, USA). The reaction condition in the system was set as follows: heating at 100°C for 5 min and extracting at 1500 psi (10 MPa) for 5 min.N2 purge was applied for 90 s to collect the extract in the collection bottle. The extract was transferred to a round bottom �ask and concentrated to 2 mL by avacuum rotary evaporator in a 40℃ water bath. Anhydrous sodium sulfate and silica gel were activated at 450°C and 180°C for 4 h and 6 h, respectively. Aftercooling to room temperature, a chromatographic column was successfully prepared by �lling 1.5 g of anhydrous sodium sulfate, 1 g of silica gel, and 1.5 g ofanhydrous sodium sulfate from top to bottom. Subsequently, the extract was transferred to the prepared chromatographic column and washed with 15 mL ofn-hexane/dichloromethane mixture (1:1, v:v) and 5 mL of n-hexane, and the rinsing �uid was collected to the corresponding �ask. The collected liquid wasevaporated to 0.5 mL by the rotary evaporator again. The residual collection liquid in the �ask was rinsed with n-hexane, and the �nal volume was adjusted to1 mL19–21.
Determination of PAHs concentration and composition

Page 3/13
In a GC-MS system (Agilent 8860-5977, USA), the pretreated sample was analyzed after passing through a B-5MS (0.25-µm �lm thickness, 30 m × 0.25 mmi.d.) silica capillary column. The system used 1 µL splitless injection and 1 mL min−1 of high purity (99.999%) helium as the carrier gas. The temperature ofthe injector was 250°C while the detector was 280°C. The system procedure was as follows: hold at 50°C for 1 min, to 180°C at 15°C min−1, then to 280°C at5°C min−1, and hold for 5 min. The mass detector was maintained at 70 eV and the ion source temperature was 280°C. 16 PAHs were measured in full scanmode (50~550 amu).
Assessment of PAHs pollution levelThe ecological risk assessment of PAHs in sediments was frequently carried out using effects range-low (ERL) and effects range-median (ERM)22,23.According to the evaluation criteria, when the concentration of PAHs was lower than the concentration of ERL, there was no adverse effect of the PAHS in thearea; while the concentration of PAHs was higher than the concentration of ERM, it indicated that the regional PAHs was harmful to the biologicalcommunity24,25.
The carcinogenic potential of PAHs was appraised through the equivalent of Benzo(a)pyrene (BaPE)26. The value of BaPE was calculated by theconcentrations weighted of PAH with the carcinogenic potential of individual PAHs (Ji et al. 2007). The calculation formula of BaPE was shown in EQ. (1).
1where V represents the value of BaPE; BaA, BbF, BkF, BaP, DahA and IcdP mean Benzo(a)anthracene, Benzo(b)�uoranthene, Benzo(k)�uoranthene,Benzo(a)pyrene, Dibenzo(a,h)anthracene and Indeno(1,2,3-cd)pyrene, respectively.
Quality control and quality assuranceAll glass containers involved in the experiment were baked at 500℃ for 4 h in advance. A seven-point calibration curve (50, 100, 250, 500, 1000, 2000, and2500 ng mL−1) with correlation coe�cients (r2 > 0.996) was selected in combination with an external standard method to quantify PAHs. No target compoundwas detected in the method blanks The average recovery rates of PAHs were >75% in all samples, and the obtained concentration does not pass the recoveryrate correction. In repeated samples, the relative standard deviations of PAHs were less than 10%. This study was based on the dry weight of surfacesediments samples.
Statistical analysisAll statistical data were conducted using the statistical procedures SPSS 21.0 (SPSS Inc. Chicago, USA). The probable origin of the PAHs, including pyrogenicor petrogenic was determined, the following isomeric relationships were calculated: Ant/(Ant+Phe), Flua/(Flua+Pyr), and IcdP/(IcdP+BghiP). Principalcomponent analysis (PCA) was applied to perform dimensionality reduction processing analysis on the original data. The correlation coe�cients between thevariables were combined into fewer factors, through the correlation between factors to determine the pollution source of PAHs in sediments.
Results And Discussion
Spatial characteristics of PAHs concentration in surface sedimentsThe total and individual concentrations of PAHs in surface sediments collected from the different locations of Taihu Lake were shown in Table 1. 16 kinds ofPAH were detected in the surface sediments of Lake Taihu in this study, with concentrations ranging between 1381.48~4682.16 ng g−1. There were obviousdifferences in the concentration of 16 PAHs. The values of DahA and IcdP were below the detection limit in some samples, while the concentrations of BghiPin each sample were higher. Ace had the lowest contents in each sample. The concentrations of PAHs in ZB were higher than those in other regions, and theconcentrations of pollutants in the central area of the lake were the lowest. Compared with those in 2000 and 2010, the concentrations of PAHs had a clearupward trend16,17.
Page 4/13
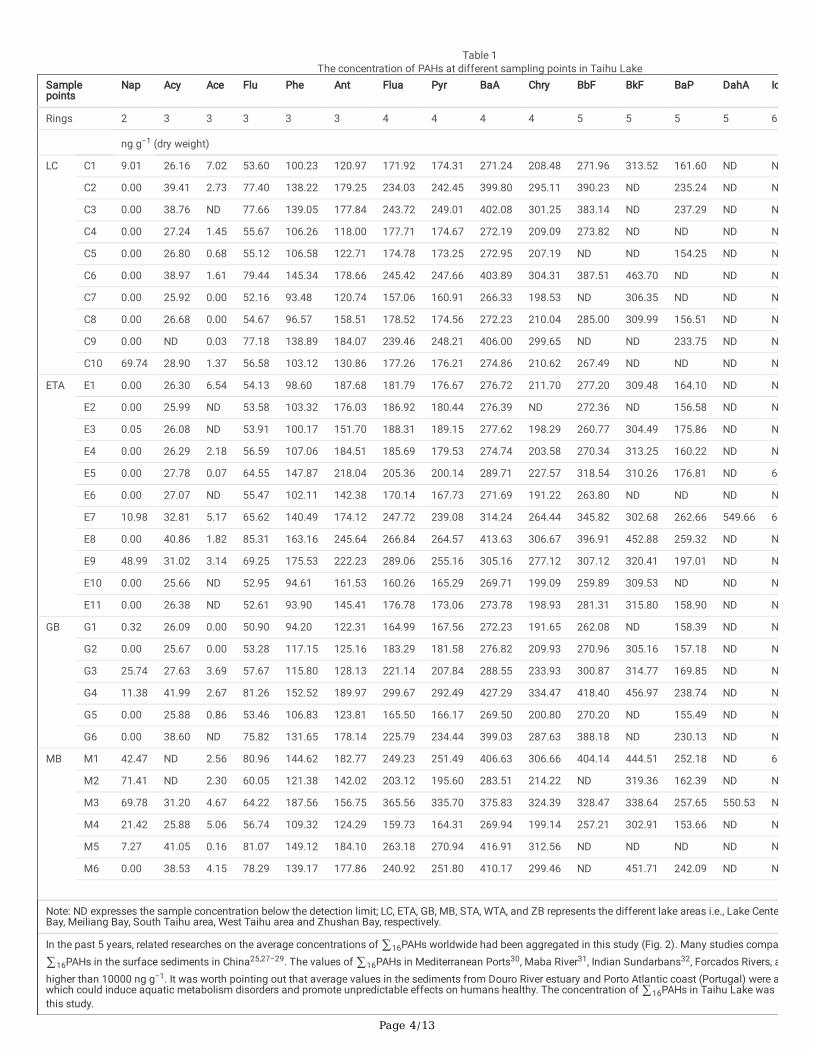
Table 1The concentration of PAHs at different sampling points in Taihu Lake
Samplepoints
Nap Acy Ace Flu Phe Ant Flua Pyr BaA Chry BbF BkF BaP DahA Ic
Rings 2 3 3 3 3 3 4 4 4 4 5 5 5 5 6
ng g−1 (dry weight)
LC C1 9.01 26.16 7.02 53.60 100.23 120.97 171.92 174.31 271.24 208.48 271.96 313.52 161.60 ND N
C2 0.00 39.41 2.73 77.40 138.22 179.25 234.03 242.45 399.80 295.11 390.23 ND 235.24 ND N
C3 0.00 38.76 ND 77.66 139.05 177.84 243.72 249.01 402.08 301.25 383.14 ND 237.29 ND N
C4 0.00 27.24 1.45 55.67 106.26 118.00 177.71 174.67 272.19 209.09 273.82 ND ND ND N
C5 0.00 26.80 0.68 55.12 106.58 122.71 174.78 173.25 272.95 207.19 ND ND 154.25 ND N
C6 0.00 38.97 1.61 79.44 145.34 178.66 245.42 247.66 403.89 304.31 387.51 463.70 ND ND N
C7 0.00 25.92 0.00 52.16 93.48 120.74 157.06 160.91 266.33 198.53 ND 306.35 ND ND N
C8 0.00 26.68 0.00 54.67 96.57 158.51 178.52 174.56 272.23 210.04 285.00 309.99 156.51 ND N
C9 0.00 ND 0.03 77.18 138.89 184.07 239.46 248.21 406.00 299.65 ND ND 233.75 ND N
C10 69.74 28.90 1.37 56.58 103.12 130.86 177.26 176.21 274.86 210.62 267.49 ND ND ND N
ETA E1 0.00 26.30 6.54 54.13 98.60 187.68 181.79 176.67 276.72 211.70 277.20 309.48 164.10 ND N
E2 0.00 25.99 ND 53.58 103.32 176.03 186.92 180.44 276.39 ND 272.36 ND 156.58 ND N
E3 0.05 26.08 ND 53.91 100.17 151.70 188.31 189.15 277.62 198.29 260.77 304.49 175.86 ND N
E4 0.00 26.29 2.18 56.59 107.06 184.51 185.69 179.53 274.74 203.58 270.34 313.25 160.22 ND N
E5 0.00 27.78 0.07 64.55 147.87 218.04 205.36 200.14 289.71 227.57 318.54 310.26 176.81 ND 64
E6 0.00 27.07 ND 55.47 102.11 142.38 170.14 167.73 271.69 191.22 263.80 ND ND ND N
E7 10.98 32.81 5.17 65.62 140.49 174.12 247.72 239.08 314.24 264.44 345.82 302.68 262.66 549.66 64
E8 0.00 40.86 1.82 85.31 163.16 245.64 266.84 264.57 413.63 306.67 396.91 452.88 259.32 ND N
E9 48.99 31.02 3.14 69.25 175.53 222.23 289.06 255.16 305.16 277.12 307.12 320.41 197.01 ND N
E10 0.00 25.66 ND 52.95 94.61 161.53 160.26 165.29 269.71 199.09 259.89 309.53 ND ND N
E11 0.00 26.38 ND 52.61 93.90 145.41 176.78 173.06 273.78 198.93 281.31 315.80 158.90 ND N
GB G1 0.32 26.09 0.00 50.90 94.20 122.31 164.99 167.56 272.23 191.65 262.08 ND 158.39 ND N
G2 0.00 25.67 0.00 53.28 117.15 125.16 183.29 181.58 276.82 209.93 270.96 305.16 157.18 ND N
G3 25.74 27.63 3.69 57.67 115.80 128.13 221.14 207.84 288.55 233.93 300.87 314.77 169.85 ND N
G4 11.38 41.99 2.67 81.26 152.52 189.97 299.67 292.49 427.29 334.47 418.40 456.97 238.74 ND N
G5 0.00 25.88 0.86 53.46 106.83 123.81 165.50 166.17 269.50 200.80 270.20 ND 155.49 ND N
G6 0.00 38.60 ND 75.82 131.65 178.14 225.79 234.44 399.03 287.63 388.18 ND 230.13 ND N
MB M1 42.47 ND 2.56 80.96 144.62 182.77 249.23 251.49 406.63 306.66 404.14 444.51 252.18 ND 62
M2 71.41 ND 2.30 60.05 121.38 142.02 203.12 195.60 283.51 214.22 ND 319.36 162.39 ND N
M3 69.78 31.20 4.67 64.22 187.56 156.75 365.56 335.70 375.83 324.39 328.47 338.64 257.65 550.53 N
M4 21.42 25.88 5.06 56.74 109.32 124.29 159.73 164.31 269.94 199.14 257.21 302.91 153.66 ND N
M5 7.27 41.05 0.16 81.07 149.12 184.10 263.18 270.94 416.91 312.56 ND ND ND ND N
M6 0.00 38.53 4.15 78.29 139.17 177.86 240.92 251.80 410.17 299.46 ND 451.71 242.09 ND N
Note: ND expresses the sample concentration below the detection limit; LC, ETA, GB, MB, STA, WTA, and ZB represents the different lake areas i.e., Lake CenteBay, Meiliang Bay, South Taihu area, West Taihu area and Zhushan Bay, respectively.
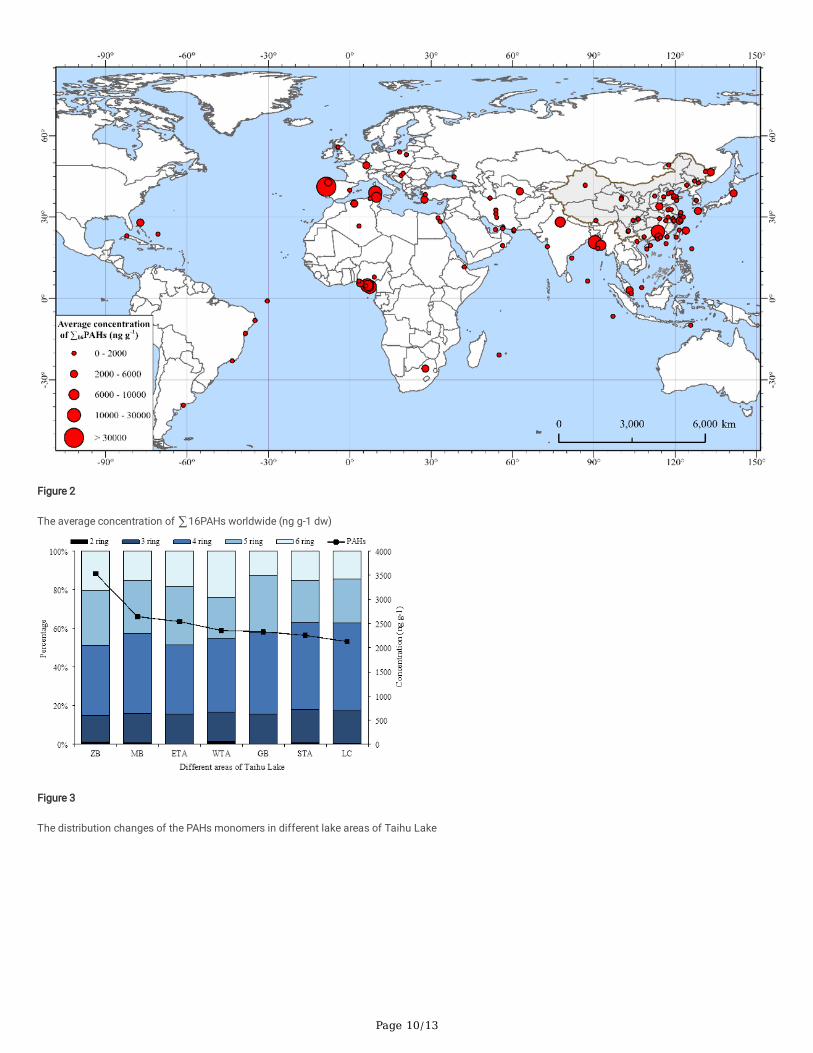
In the past 5 years, related researches on the average concentrations of ∑16PAHs worldwide had been aggregated in this study (Fig. 2). Many studies compa∑16PAHs in the surface sediments in China25,27−29. The values of ∑16PAHs in Mediterranean Ports30, Maba River31, Indian Sundarbans32, Forcados Rivers, ahigher than 10000 ng g−1. It was worth pointing out that average values in the sediments from Douro River estuary and Porto Atlantic coast (Portugal) were awhich could induce aquatic metabolism disorders and promote unpredictable effects on humans healthy. The concentration of ∑16PAHs in Taihu Lake was athis study.

Page 5/13
Samplepoints
Nap Acy Ace Flu Phe Ant Flua Pyr BaA Chry BbF BkF BaP DahA Ic
M7 49.39 29.59 4.15 64.29 144.29 142.51 236.37 223.03 302.92 242.52 317.38 308.15 183.74 ND N
M8 0.00 38.85 ND 78.67 156.97 186.38 299.80 298.40 437.93 332.15 443.84 468.33 250.84 ND N
M9 0.00 26.85 1.54 57.54 114.45 134.38 204.27 200.42 288.68 226.21 280.05 314.10 165.31 ND N
M10 16.19 26.60 ND 54.53 102.36 127.17 177.27 174.80 274.88 205.07 262.19 ND ND ND N
M11 0.00 38.92 8.44 77.20 136.29 181.26 242.95 247.37 406.50 299.80 ND 448.16 ND ND N
STA S1 0.00 27.28 3.40 53.30 97.36 163.02 167.68 169.49 270.00 205.80 264.17 306.54 ND ND N
S2 0.00 38.75 0.00 76.53 143.56 177.52 252.47 259.07 409.71 305.27 426.65 ND ND ND N
S3 18.90 38.44 2.21 76.53 138.35 176.07 232.58 241.23 399.27 294.42 ND ND 233.03 ND 62
S4 63.37 27.67 5.62 60.96 121.27 124.51 182.80 180.50 273.57 216.96 282.45 304.02 154.90 ND N
WTA W1 78.15 ND 6.57 65.42 146.75 141.95 248.17 234.96 305.03 247.55 289.74 326.22 - ND N
W2 0.00 29.14 4.23 62.77 133.21 152.42 209.60 210.30 290.97 224.43 289.14 308.11 199.40 ND N
W3 49.50 27.76 1.95 58.77 110.91 123.05 174.66 168.76 272.97 186.93 285.68 301.34 - ND N
W4 31.27 25.72 3.20 62.90 114.37 130.26 174.95 177.06 274.52 206.78 ND ND - ND N
ZB Z1 63.10 28.98 5.23 63.38 135.29 146.74 198.30 198.06 285.57 220.16 276.24 ND 183.60 ND 70
Z2 41.89 42.18 0.00 93.48 184.75 204.60 280.61 289.34 419.03 317.72 412.27 463.39 240.43 ND N
Z3 94.80 32.33 9.95 68.93 182.79 171.18 293.40 286.80 328.45 289.14 283.37 329.59 194.13 551.50 9
Z4 44.42 46.39 6.40 92.44 212.31 237.40 328.17 349.91 439.20 355.34 ND 448.49 298.08 ND N
Z5 38.96 30.18 4.00 68.39 143.42 164.95 325.77 322.39 416.24 387.20 503.08 415.11 360.92 ND N
Z6 1.35 41.34 0.00 83.01 159.48 212.66 281.45 285.59 426.33 331.13 406.85 476.68 259.13 ND N
Note: ND expresses the sample concentration below the detection limit; LC, ETA, GB, MB, STA, WTA, and ZB represents the different lake areas i.e., Lake CenteBay, Meiliang Bay, South Taihu area, West Taihu area and Zhushan Bay, respectively.
In the past 5 years, related researches on the average concentrations of ∑16PAHs worldwide had been aggregated in this study (Fig. 2). Many studies compa∑16PAHs in the surface sediments in China25,27−29. The values of ∑16PAHs in Mediterranean Ports30, Maba River31, Indian Sundarbans32, Forcados Rivers, ahigher than 10000 ng g−1. It was worth pointing out that average values in the sediments from Douro River estuary and Porto Atlantic coast (Portugal) were awhich could induce aquatic metabolism disorders and promote unpredictable effects on humans healthy. The concentration of ∑16PAHs in Taihu Lake was athis study.
Occurrence and compositions of PAHs in different lake areasThe values of ∑16PAHs in different regions were calculated, and the proportions of different monomers of PAHs were analyzed. Figure 3 showed that theconcentration of ∑16PAHs in the ZB lake area was much higher than in the other regions, and the same research results have appeared many times in
previous studies35,36. The sources of agricultural, industrial, and domestic sewage in the surrounding watershed of ZB were higher than the other locations37,resulting in higher PAHs concentrations than other areas. The concentration in the north of Taihu Lake was higher than that in the south, and the surroundingconcentration was higher than the central region, which mainly depended on the anthropogenic activities, i.e., industrial and agricultural development aroundthe area38. The 4-ring PAHs were dominant, accounting for 35.69%~45.02%. A previous Suzhou Industrial Park study pointed out that medium-molecular-weight PAHs (4-ring) were predominant in stream sediments39, but in this study, the top 4 regions with higher average PAHs concentrations (ZB, MB, ETA,WTA) showed high-molecular-weight PAHs (5~6-ring) were dominant. The low-molecular-weight (2~3-ring) PAHs were mainly derived from the release andcombustion of petroleum emissions, and medium to high-molecular-weight (4~6 rings) PAHs were mainly derived from pyrolysis40, of which 5 and 6 ringswere sources from anthropogenic pyrolysis41,42, which preliminarily proved the main source of the study area in Taihu La
Source appointment of PAHs in the sediments and in�uencing factorsThe sources of PAHs could be identi�ed based on the molecular diagnostic ratio of PAH in the samples43,44. The proportion of PAH monomer was calculatedin this study (Fig. 4). The ratios of Ant/(Ant+Phe) in most sediment samples from Lake Taihu were greater than 0.10, while in ZB was less than 0.10. Thesame phenomenon appeared in the BaA/(BaA+Chr) ratios, in addition to ZB, ratios were greater than 0.35, indicating that except for ZB, where was thepetroleum source, the main sources of PAHs in other regions from Taihu Lake were combustion. The values of Flua/(Flua+Pyr) were mainly greater than 0.50,and the values of LC and STA were between 0.40 and 0.50, which represented the PAHs in LC and STA came from liquid fossil fuels (vehicles and crude oil).IcdP/(IcdP+BghiP) of ETA and WTA between 0.20 and 0.50, which meant the burning of liquid fossil fuels43,45. Based on the above results, it was furtherderived the PAHs in ZB mainly were the petroleum source, the main sources of GB and MB were the burning of grass, wood and coal, while PAHs in other areasof Taihu Lake were the combustion of liquid fossil fuels, which was consistent with the previous studies46,47.

Page 6/13
To further determine the source of PAHs, PCA was selected as an effective identi�cation tool. Figure 5 illustrated the score plot of the �rst two components(PC) of PAHs in surface sediments of Taihu Lake, accounting for 96.8% of the variance. PC1 was responsible for 92.5% of the total variance and exhibited highloading for BghiP, BaA, BbF, Chry, BkF, Flua, and Pyr (4.43, 3.85, 2.30, 2.06, 1.66, 1.41, and 1.40). PC2 was responsible for 4.3% of the total variance, and mostlydue to IcdP, BghiP, and DahA (1.56, 0.47, and 0.15). It has been proved in previous studies, BghiP, BkF, and IcdP were derived from vehicle exhaust, BaA andChry were the products of petroleum combustion, BbF was a product of the high-temperature combustion, and Flua and Pyr came from coal-burning48–50. Tofurther derive, the main sources of PAHs in the surface sediments from Taihu Lake were the man-made sources, including vehicle exhaust and combustion,which was consistent with the results of PAH molecular diagnostic ratio.
Risk assessment and ecological suggestionsThe biological toxicity assessment of PAHs in different sediments from Taihu Lake was compared. It was shown (Table 2) that the concentrations of Nap,Ace, Phe, Flua, Pyr, and BaP in all sampling sites were lower than those of ERL value, which would not cause adverse effects on the environment. Theconcentrations of Chry, BkF, BbF, and BghiP at some sampling points were higher than ERL value but lower than ERM value, which had little impact on theenvironment, which was the same as Acy, Flu, Ant, BaA. It was worth noting that both DahA and IcdP were much higher than ERM values, in�uencing greatlyon the ecological community.
Table 2
The biological toxicity assessment form of PAHs in different sediments of Taihu Lake (ng g−1 dw)PAHs ERL ERM Average concentration in different lake areas Concentration range
ZB MB GB ETA STA WTA LC
Nap 160.00 2100.00 47.42 25.27 6.24 5.46 20.57 39.73 7.87 0.00~94.80
Acy 16.00 500.00 36.90 27.04 30.98 28.75 33.04 20.66 27.88 NA~46.39
Ace 44.00 640.00 4.26 3.00 1.20 1.72 2.80 3.99 1.49 NA~9.95
Flu 19.00 540.00 78.27 68.51 62.07 60.36 66.83 62.47 63.95 50.90~93.48
Phe 240.00 1500.00 169.67 136.87 119.69 120.62 125.14 126.31 116.77 93.48~212.31
Ant 85.30 1100.00 189.59 158.14 144.59 182.66 160.28 136.92 149.16 118.00~245.64
Flua 600.00 5100.00 284.62 240.21 210.06 205.35 208.88 201.85 199.99 157.06~365.56
Pyr 665.00 2500.00 288.68 237.62 208.35 199.17 212.57 197.99 202.12 160.91~349.91
BaA 261.00 1600.00 385.80 352.17 322.24 294.85 338.14 285.87 324.16 266.33~439.20
Chry 384.00 2800.00 316.78 269.29 243.06 207.15 255.61 216.42 244.43 NA~387.20
BkF 280.00 1620.00 355.54 308.72 179.48 267.16 152.64 233.92 139.36 NA~503.08
BbF 320.00 1880.00 313.63 208.48 318.45 295.82 243.31 216.14 225.91 NA~ 476.68
BaP 430.00 1600.00 256.05 151.62 184.96 155.59 96.98 49.85 117.86 NA~ 360.92
DahA 63.40 260.00 91.92 50.05 NA 19.97 NA NA NA NA~ 551.50
IcdP - - 269.28 56.60 NA 117.72 NA 155.32 NA NA~ 913.86
BghiP 430.00 1600.00 444.85 348.05 297.97 347.68 338.07 408.85 304.70 NA~ 615.11
Note: ZB, MB, ETA, WTA, GB, STA, and LC represent the Zhushan Bay, Meiliang Bay, East Taihu area, West Taihu area Gonghu Bay, South Taihu area, andLake Center, respectively.
Due to the high carcinogenicity of DahA and IcdP51,52, the carcinogenic risk of DahA and IcdP had been further studied in this study. The BaPE was a usefulindicator for quantitative assess the potential carcinogenic risks of PAHs53,54.
The BaPE in this study was calculated through the data of Table 1, and the calculation results were shown in Fig. 6. It could be seen from Fig. 6 that BaPEvalues for 52 surface sediments samples of Taihu Lake varied from 16.47 to 708.62 ng g−1 dw. The high BaPE levels were noticed at sites E7, M3, Z3, and Z5indicating that PAHs in these sites showed relatively high toxicity compared to other sites. The PAHs in ZB, MB, and southeast area of Taihu Lake had highercarcinogenic risks, compared with 2012, the risk of PAHs had increased obviously37.
ConclusionsIn this work, 16 priority PAHs in spatial sediments from Taihu Lake, China were compared, and the possible new input contributions were estimated. Thecurrent pollution levels of PAHs in different lake areas were at a medium-to-high global level with an increasing dominant high-ring PAHs. The distributions ofPAHs around the basin were higher than those in the central areas of the lake indicating the high frequency of anthropogenic activities, high economic anddevelopment levels in the lake area. The high population density in the study area presented a more comprehensive view to evaluate the regional impact onPAHs sources. PAHs in Zhushan Bay were mainly sourced from petroleum, however, the main origins of PAHs in both Gonghu Bay and Meiliang Bay werederived from the burning of grass, wood, and coal. For other lake areas, the combustion of liquid fossil fuels contributed greatly. ERL and ERM values

Page 7/13
combining BaPE values with the difference of lake areas were calculated to evaluate regional impact more comprehensively, which was different fromprevious results that grass-type lake zones may not necessarily present high regional impacts. PAHs in Zhushan Bay, Meiliang Bay, and the southeast of TaihuLake had a high risk of carcinogenesis and showed an upward trend year by year.
Declarations
AcknowledgementsThis work was supported by the National Natural Science Foundation of China (No. 41673107) and the Major Project of Jiangsu Provincial Department ofEducation (No. 20KJA170001)
Author contributionsXiulu Lang wrote the original draft; Xinghua He and Tian Sun drew the pictures involved in the article; Yanhua Wang conceived and revised the manuscript; XiChen, Zihan Zhao and Mingli Zhang collected the samples. All authors discussed the results. All authors have read and agreed with this manuscript version.
Competing interestsThe authors declare no competing interests.
References1. Froehner, S., Rizzi, J., Vieira, L. M. & Sanez, J. PAHs in water, sediment and biota in an area with port activities. Archives of Environmental Contamination
and Toxicology, 75, 236–246 https://doi.org/10.1007/s00244-018-0538-6 (2018).
2. Anyanwu, I. N., Sikoki, F. D. & Semple, K. T. Risk assessment of PAHs and N-PAH analogues in sediment cores from the Niger Delta. Mar. Pollut. Bull, 161,111684 https://doi.org/10.1016/j.marpolbul.2020.111684 (2020).
3. Han, B., Cui, D. Y., Liu, A., Li, Q. & Zheng, L. Distribution, sources, and risk assessment of polycyclic aromatic hydrocarbons (PAHs) in surface sedimentsfrom Daya Bay, South China. Environmental Science and Pollution Research, 28, 25858–25865 https://doi.org/10.1007/s11356-020-11956-w (2021).
4. Li, J. W. et al. Polycyclic aromatic hydrocarbons in water, sediment, soil, and plants of the Aojiang River waterway in Wenzhou, China. Journal ofHazardous Materials, 173, 75–81 https://doi.org/10.1016/j.jhazmat.2009.08.050 (2010).
5. Honda, M. & Suzuki, N. Toxicities of polycyclic aromatic hydrocarbons for aquatic animals. International Journal of Environmental Research and PublicHealth, 17, 1363 https://doi.org/10.3390/ijerph17041363 (2020).
�. Lu, G. N., Tao, X. Q., Dang, Z., Yi, X. Y. & Yang, C. Estimation of n-octanol/water partition coe�cients of polycyclic aromatic hydrocarbons by quantumchemical descriptors. Central European Journal of Chemistry 6, 310–318 https://doi.org/10.2478/s11532-008-0010-y (2008).
7. Yuan, H. Z., Zhang, E. L., Lin, Q., Wang, R. & Liu, E. F. Sources appointment and ecological risk assessment of polycyclic aromatic hydrocarbons (PAHs) insediments of Erhai Lake, a low-latitude and high-altitude lake in southwest China. Environmental Science and Pollution Research, 23, 4430–4441https://doi.org/10.1007/s11356-015-5626-9 (2016).
�. Souza, M. R. R. et al. Concentration, distribution and source apportionment of polycyclic aromatic hydrocarbons (PAH) in Poxim River sediments, Brazil.Mar. Pollut. Bull, 127, 478–483 https://doi.org/10.1016/j.marpolbul.2017.12.045 (2018).
9. Davis, E. et al. Source apportionment of polycyclic aromatic hydrocarbons (PAHs) in small craft harbor (SCH) sur�cial sediments in Nova Scotia, Canada.Science of the Total Environment, 691, 528–537 https://doi.org/10.1016/j.scitotenv.2019.07.114 (2019).
10. Dreyer, A., Radke, M., Turunen, J. & Blodau, C. Long-term change of polycyclic aromatic hydrocarbon deposition to peatlands of eastern Canada.Environmental Science and Technology, 39, 3918–3924 https://doi.org/10.1021/es0481880 (2005).
11. Zhang, Y. X. Polycyclic aromatic hydrocarbons in China: emission, atmospheric transport and lung cancer risk (Beijing University, Beijing, 2010).
12. Zhang, L., Zhu, B., Gao, J. H. & Kang, H. Q. Impact of Taihu Lake on city ozone in the Yangtze River Delta. Advances in Atmospheric Sciences, 34, 226–234https://doi.org/10.1007/s00376-016-6099-6 (2017).
13. Huang, S. B., Qiao, M., Wang, H. & Wang, Z. J. Organchlorinated pesticides in surface sediments of meiliang bay in Taihu Lake, China. Journal ofEnvironmental Science and Health Part a-Toxic/Hazardous Substances and Environmental Engineering, 41, 223–234https://doi.org/10.1080/10934520500354664 (2006).
14. Su, H. L. et al. Distribution characteristics and risk assessments of PAHs in �sh from Lake Taihu, China. Human and Ecological Risk Assessment, 21,1753–1765 https://doi.org/10.1080/10807039.2014.975003 (2015).
15. Wang, W. W., Qu, X. L., Lin, D. H. & Yang, K. Octanol-water partition coe�cient (logKow) dependent movement and time lagging of polycyclic aromatichydrocarbons (PAHs) from emission sources to lake sediments: A case study of Taihu Lake, China. Environ. Pollut, 288, 117709https://doi.org/10.1016/j.envpol.2021.117709 (2021).
1�. Peng, X. Z., Zhang, G., Zheng, L. P., Mai, B. X. & Zeng, S. W. The vertical variations of hydrocarbon pollutants and organochlorine pesticide residues in asediment core in Lake Taihu, East China. Geochemistry-exploration Environment Analysis, 5, 99–104 https://doi.org/10.1144/1467-7873/03-038 (2005).

Page 8/13
17. Zhang, Y., Lu, Y. & Zhao, W. Y. Spatial distribution of Polycyclic Aromatic Hydrocarbons from Lake Taihu, China. Bulletin of Environmental Contaminationand Toxicology, 87, 80–85 https://doi.org/10.1007/s00128-011-0292-1 (2011).
1�. Dong, Y. B. et al. Polycyclic aromatic hydrocarbons in sediments from typical Algae, Macrophyte Lake Bay and adjoining river of Taihu Lake, China:distribution, sources, and risk assessment., 13, 470 https://doi.org/10.3390/w13040470 (2021).
19. Chen, P. & Liang, J. Polycyclic aromatic hydrocarbons in green space soils in Shanghai: source, distribution, and risk assessment. Journal of Soils andSediments, 21, 967–977 https://doi.org/10.1007/s11368-020-02838-2 (2021).
20. Xia, Z. et al. New approaches to reduce sample processing times for the determination of polycyclic aromatic compounds in environmental samples., 274,129738 https://doi.org/10.1016/j.chemosphere.2021.129738 (2021).
21. Sun, T., Wang, Y. H., Tian, J. M. & Kong, X. G. Characteristics of PAHs in soils under different land-use types and their associated health risks in thenorthern Taihu Basin, China. Journal of Soils and Sediments, online. https://doi.org/10.1007/s11368-021-03050-6 (2021)
22. Abdollahi, S. et al. Contamination levels and spatial distributions of heavy metals and PAHs in surface sediment of Imam Khomeini Port, Persian Gulf,Iran. Mar. Pollut. Bull, 72, 336–345 https://doi.org/10.1016/j.marpolbul.2013.01.025 (2013).
23. Santos, E. et al. Polycyclic aromatic hydrocarbons (PAH) in super�cial water from a tropical estuarine system: Distribution, seasonal variations, sourcesand ecological risk assessment. Mar. Pollut. Bull, 127, 352–358 https://doi.org/10.1016/j.marpolbul.2017.12.014 (2018).
24. Long, E. R., Field, L. J. & Macdonald, D. D. Predicting toxicity in marine sediments with numerical sediment quality guidelines. Environmental Toxicologyand Chemistry, 17, 714–727 https://doi.org/10.1002/etc.5620170428 (1998).
25. Han, B., Liu, A., He, S., Li, Q. & Zheng, L. Composition, content, source, and risk assessment of PAHs in intertidal sediment in Shilaoren Bay, Qingdao,China. Mar. Pollut. Bull, 159, 111499 https://doi.org/10.1016/j.marpolbul.2020.111499 (2020).
2�. Abba, E. J., Unnikrishnan, S., Kumar, R., Yeole, B. & Chowdhury, Z. Fine aerosol and PAH carcinogenicity estimation in outdoor environment of Mumbai City,India. International Journal of Environmental Health Research, 22, 134–149 https://doi.org/10.1080/09603123.2011.613112 (2012).
27. Zhang, J. M., Huang, H., Wang, R. J. & Sun, R. Y. Historical pollution and source contributions of PAHs in sediment cores from the middle reach of HuaiRiver, China. Bulletin of Environmental Contamination and Toxicology, 102, 531–537 https://doi.org/10.1007/s00128-019-02576-3 (2019).
2�. Niu, L. X. et al. Field analysis of PAHs in surface sediments of the Pearl River Estuary and their environmental impacts. Environmental Science andPollution Research, 27, 10925–10938 https://doi.org/10.1007/s11356-020-07689-5 (2020).
29. Han, B., Li, Q., Liu, A., Gong, J. W. & Zheng, L. Polycyclic aromatic hydrocarbon (PAH) distribution in surface sediments from Yazhou Bay of Sanya, SouthChina, and their source and risk assessment. Mar. Pollut. Bull, 162, 1118000 https://doi.org/10.1016/j.marpolbul.2020.111800 (2021).
30. Vitali, F. et al. Benthic Prokaryotic Community Response to Polycyclic Aromatic Hydrocarbon Chronic Exposure: Importance of Emission Sources inMediterranean Ports. Frontiers in Marine Science, 6, 590 https://doi.org/10.3389/fmars.2019.00590 (2019).
31. Chen, J. D., Liao, J. B. & Wei, C. H. Coking wastewater treatment plant as a sources of polycyclic aromatic hydrocarbons (PAHs) in sediments andecological risk assessment. Sci. Rep, 10, 7833 https://doi.org/10.1038/s41598-020-64835-2 (2020).
32. Balu, S., Bhunia, S., Gachhui, R. & Mukherjee, J. Assessment of polycyclic aromatic hydrocarbon contamination in the Sundarbans, the world's largest tidalmangrove forest and indigenous microbial mixed bio�lm-based removal of the contaminants. Environ. Pollut, 266, 115270https://doi.org/10.1016/j.envpol.2020.115270 (2020).
33. Iwegbue, C. M. A. et al. Polycyclic aromatic hydrocarbons (PAHs) in sur�cial sediments from selected rivers in the western Niger Delta of Nigeria: Spatialdistribution, sources, and ecological and human health risks. Mar. Pollut. Bull, 167, 112351 https://doi.org/10.1016/j.marpolbul.2021.112351 (2021).
34. Rocha, M. J., Dores-Sousa, J. L., Cruzeiro, C. & Rocha, E. PAHs in water and surface sediments from Douro River estuary and Porto Atlantic coast(Portugal)-impacts on human health. Environmental Monitoring and Assessment, 189, 425 https://doi.org/10.1007/s10661-017-6137-6 (2017).
35. Lei, P., Zhang, H. & Shan, B. Q. Vertical records of sedimentary PAHs and their freely dissolved fractions in porewater pro�les from the northern bays ofTaihu Lake, Eastern China. RSC Advances, 6, 98835–98844 https://doi.org/10.1039/c6ra11180g (2016).
3�. Li, A. L. et al. Sedimentary archive of Polycyclic Aromatic Hydrocarbons and perylene sources in the northern part of Taihu Lake, China. Environ. Pollut,246, 198–206 https://doi.org/10.1016/j.envpol.2018.11.112 (2019).
37. Zhang, Y. et al. Potential source contributions and risk assessment of PAHs in sediments from Taihu Lake, China: Comparison of three receptor models.Water Res, 46, 3065–3073 https://doi.org/10.1016/j.watres.2012.03.006 (2012).
3�. Qiao, M., Wang, C. X., Huang, S. B., Wang, D. H. & Wang, Z. J. Composition, sources, and potential toxicological signi�cance of PAHs in the surfacesediments of the Meiliang Bay, Taihu Lake, China. Environ. Int, 32, 28–33 https://doi.org/10.1016/j.envint.2005.04.005 (2016).
39. Yuan, Z. J. et al. Polycyclic aromatic hydrocarbons (PAHs) in urban stream sediments of Suzhou Industrial Park, an emerging eco-industrial park in China:Occurrence, sources and potential risk. Ecotoxicology and Environmental Safety, 214, 112095 https://doi.org/10.1016/10.1016/j.ecoenv.2021.112095(2021).
40. Yan, W., Chi, J. S., Wang, Z. Y., Huang, W. X. & Zhang, G. Spatial and temporal distribution of polycyclic aromatic hydrocarbons (PAHs) in sediments fromDaya Bay, South China. Environ. Pollut, 157, 1823–1830 https://doi.org/10.1016/j.envpol.2009.01.023 (2009).
41. Arias, A. H. et al. Presence, distribution, and origins of polycyclic aromatic hydrocarbons (PAHs) in sediments from Bahia Blanca estuary, Argentina.Environmental Monitoring and Assessment, 160, 301–314 https://doi.org/10.1007/s10661-008-0696-5 (2010).
42. Yuan, H. Z., Zhang, E. L., Lin, Q., Wang, R. & Liu, E. F. Sources appointment and ecological risk assessment of polycyclic aromatic hydrocarbons (PAHs) insediments of Erhai Lake, a low-latitude and high-altitude lake in southwest China. Environmental Science and Pollution Research, 23, 4430–4441https://doi.org/10.1007/s11356-015-5626-9 (2016).

Page 9/13
43. Yunker, M. B. et al. PAHs in the Fraser River basin: a critical appraisal of PAH ratios as indicators of PAH source and composition. Org. Geochem, 33, 489–515 https://doi.org/10.1016/S0146-6380(02)00002-5 (2002).
44. Tobiszewski, M. & Namiesnik, J. PAH diagnostic ratios for the identi�cation of pollution emission sources. Environ. Pollut, 162, 110–119https://doi.org/10.1016/j.envpol.2011.10.025 (2012).
45. Zhao, Q., Yu, Q. & Chen, L. M. Particulate matter and particle-bound polycyclic aromatic hydrocarbons in the Dapu road tunnel in Shanghai. InternationalJournal of Environment and Pollution 41, 21–37 https://doi.org/10.1504/IJEP.2010.032243 (2010).
4�. Tian, Y. Z. et al. Source contributions and spatiotemporal characteristics of PAHs in sediments: using three-way source apportionment approach.Environmental Toxicology and Chemistry, 33, 1747–1753 https://doi.org/10.1002/etc.2628 (2014).
47. Zhang, F. et al. Polycyclic aromatic hydrocarbons (PAHs) and Pb isotopic ratios in a sediment core from Shilianghe Reservoir, eastern China: Implyingpollution sources. Appl. Geochem, 66, 140–148 https://doi.org/10.1016/j.apgeochem.2015.12.010 (2016).
4�. Harrison, R. M., Smith, D. J. T. & Luhana, L. Source apportionment of atmospheric polycyclic aromatic hydrocarbons collected from an urban location inBirmingham, U.K.. Environmental Science and Technology 30, 825–832. https://doi.org/10.1021/es950252d (1996)
49. Simcik, M. F., Eisenreich, S. J. & Lioy, P. J. Source apportionment and source/sink relationships of PAHs in the coastal atmosphere of Chicago and LakeMichigan. Atmos. Environ, 33, 5071–5079 https://doi.org/10.1016/S1352-2310(99)00233-2 (1999).
50. Yang, J., Xu, W. L. & Cheng, H. Y. Seasonal variations and sources of airborne polycyclic aromatic hydrocarbons (PAHs) in Chengdu, China. Atmosphere, 9,63 https://doi.org/10.3390/atmos9020063 (2018).
51. Cetin, B. Investigation of PAHs, PCBs and PCNs in soils around a Heavily Industrialized Area in Kocaeli, Turkey: Concentrations, distributions, sources andtoxicological effects. Science of the Total Environment, 560, 160–169 https://doi.org/10.1016/j.scitotenv.2016.04.037 (2016).
52. Ali-Taleshi, M. S., Squizzato, S., Riyahi Bakhtiari, A., Moeinaddini, M. & Masiol, M. Using a hybrid approach to apportion potential source locationscontributing to excess cancer risk of PM2.5-bound PAHs during heating and non-heating periods in a megacity in the Middle East. Environmental research,201, 111617 https://doi.org/10.1016/j.envres.2021.111617 (2021).
53. Xu, J. et al. Historical trends of concentrations, source contributions and toxicities for PAHs in dated sediment cores from �ve lakes in western China.Science of the Total Environment, 470, 519–526 https://doi.org/10.1016/j.scitotenv.2013.10.022 (2014).
54. Wei, H., Liu, G. B., Yong, T. & Qin, Z. Emission of polycyclic aromatic hydrocarbons from different types of motor vehicles' exhaust. Environ. Earth Sci, 74,5557–5564 https://doi.org/10.1007/s12665-015-4570-9 (2015).
Figures
Figure 1
The distributions of speci�c sampling points
Page 10/13
Figure 2
The average concentration of ∑16PAHs worldwide (ng g-1 dw)
Figure 3
The distribution changes of the PAHs monomers in different lake areas of Taihu Lake

Page 11/13
Figure 4
Source apportionment of PAHs in the sediments of Taihu Lake

Page 12/13
Figure 5
PCA determination of PAHs sources in the sediments of Taihu Lake

Page 13/13
Figure 6
The spatial distribution of BaPE in sediments of Taihu Lake (ng g-1 dw)
Supplementary Files
This is a list of supplementary �les associated with this preprint. Click to download.
Supplementarymaterials.docx


![Ecological Risk Assessment of Heavy Metals in Coastal ...the highest concentrations of toxic heavy metals in marine environment are found in sediments [1,6,7]. Coastal sediments are](https://img.pdfslide.net/doc/110x75/60777613a46f6a043806f637/ecological-risk-assessment-of-heavy-metals-in-coastal-the-highest-concentrations.jpg)