Embed Size (px)
Citation preview

J. Bio. & Env. Sci. 2016
40 | Haider
RESEARCH PAPER OPEN ACCESS
Sediments grain size analysis from the Eastern Makran coast
line area, Pakistan
Syed Waseem Haider*
National Institute of Oceanography, Karachi, Pakistan
Article published on July 13, 2016
Key words: Grain Size analysis, Makran coastal area, Statistical parameters.
Abstract
The grain size analysis for the surficial sediment samples from Sur Bandar, Koh Mehdi, Ganz, Pishukan, Gwader
and Jiwani area of Balochistan was carried out. Eighteen stations marked on the ground for the collection of
sediment samples. A 3-Dimensional Mechanical Sieve shaker Octagon Digital shaker was selected for the grain
size analysis. Probability paper prepared for cumulative frequency curve by plotting grain size (in phi scale)
versus cumulative percent. Cumulative frequency curve used to obtain the phi value of the percentiles 5%, 16%,
25%, 50%, 75%, 84% and 95% from the plot. These phi values were used in calculation of some important
statistical parameters just like mean, kurtosis, skewness and standard deviation. Graphic mean distribution of
grain size for the analyzed sediments suggested that most of samples are very fine to fine grained sand with only
two being medium grained sand. Standard deviation explain the sorting of the grain size of the sediment sample
which are very well sorted to moderated sorted with few poorly sorted. Skwness showed that particle population
are very fine skewed to very coarse skewed. The results of kurtosis explained that 11 % of sediment samples are in
category of extremely Leptokuritc, 38.8 % are very Leptokurtic, 16.6% are Leptokuritc, 16.6 % are very Platykurtic
and 11% are Mesokurtic. Physical characteristic of the samples shows that 91.3% to 100% are sand in the samples
and 0 to 8.7 % are Silt/Clay.
*Corresponding Author: Syed Waseem Haider [email protected]
Journal of Biodiversity and Environmental Sciences (JBES) ISSN: 2220-6663 (Print) 2222-3045 (Online)
Vol. 9, No. 1, p. 40-56, 2016
http://www.innspub.net
J. Bio. & Env. Sci. 2016
41 | Haider
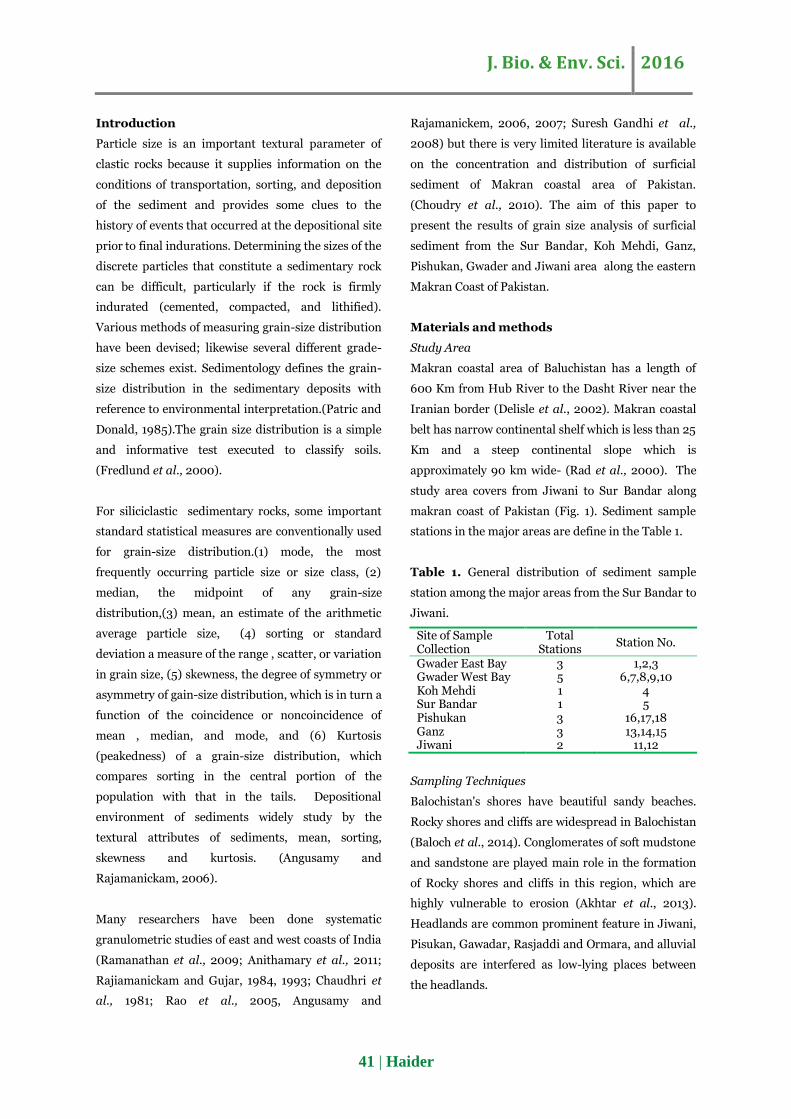
Introduction
Particle size is an important textural parameter of
clastic rocks because it supplies information on the
conditions of transportation, sorting, and deposition
of the sediment and provides some clues to the
history of events that occurred at the depositional site
prior to final indurations. Determining the sizes of the
discrete particles that constitute a sedimentary rock
can be difficult, particularly if the rock is firmly
indurated (cemented, compacted, and lithified).
Various methods of measuring grain-size distribution
have been devised; likewise several different grade-
size schemes exist. Sedimentology defines the grain-
size distribution in the sedimentary deposits with
reference to environmental interpretation.(Patric and
Donald, 1985).The grain size distribution is a simple
and informative test executed to classify soils.
(Fredlund et al., 2000).
For siliciclastic sedimentary rocks, some important
standard statistical measures are conventionally used
for grain-size distribution.(1) mode, the most
frequently occurring particle size or size class, (2)
median, the midpoint of any grain-size
distribution,(3) mean, an estimate of the arithmetic
average particle size, (4) sorting or standard
deviation a measure of the range , scatter, or variation
in grain size, (5) skewness, the degree of symmetry or
asymmetry of gain-size distribution, which is in turn a
function of the coincidence or noncoincidence of
mean , median, and mode, and (6) Kurtosis
(peakedness) of a grain-size distribution, which
compares sorting in the central portion of the
population with that in the tails. Depositional
environment of sediments widely study by the
textural attributes of sediments, mean, sorting,
skewness and kurtosis. (Angusamy and
Rajamanickam, 2006).
Many researchers have been done systematic
granulometric studies of east and west coasts of India
(Ramanathan et al., 2009; Anithamary et al., 2011;
Rajiamanickam and Gujar, 1984, 1993; Chaudhri et
al., 1981; Rao et al., 2005, Angusamy and
Rajamanickem, 2006, 2007; Suresh Gandhi et al.,
2008) but there is very limited literature is available
on the concentration and distribution of surficial
sediment of Makran coastal area of Pakistan.
(Choudry et al., 2010). The aim of this paper to
present the results of grain size analysis of surficial
sediment from the Sur Bandar, Koh Mehdi, Ganz,
Pishukan, Gwader and Jiwani area along the eastern
Makran Coast of Pakistan.
Materials and methods
Study Area
Makran coastal area of Baluchistan has a length of
600 Km from Hub River to the Dasht River near the
Iranian border (Delisle et al., 2002). Makran coastal
belt has narrow continental shelf which is less than 25
Km and a steep continental slope which is
approximately 90 km wide- (Rad et al., 2000). The
study area covers from Jiwani to Sur Bandar along
makran coast of Pakistan (Fig. 1). Sediment sample
stations in the major areas are define in the Table 1.
Table 1. General distribution of sediment sample
station among the major areas from the Sur Bandar to
Jiwani.
Site of Sample Collection
Total Stations
Station No.
Gwader East Bay 3 1,2,3 Gwader West Bay 5 6,7,8,9,10 Koh Mehdi 1 4 Sur Bandar 1 5 Pishukan 3 16,17,18 Ganz 3 13,14,15 Jiwani 2 11,12
Sampling Techniques
Balochistan's shores have beautiful sandy beaches.
Rocky shores and cliffs are widespread in Balochistan
(Baloch et al., 2014). Conglomerates of soft mudstone
and sandstone are played main role in the formation
of Rocky shores and cliffs in this region, which are
highly vulnerable to erosion (Akhtar et al., 2013).
Headlands are common prominent feature in Jiwani,
Pisukan, Gawadar, Rasjaddi and Ormara, and alluvial
deposits are interfered as low-lying places between
the headlands.
J. Bio. & Env. Sci. 2016
42 | Haider
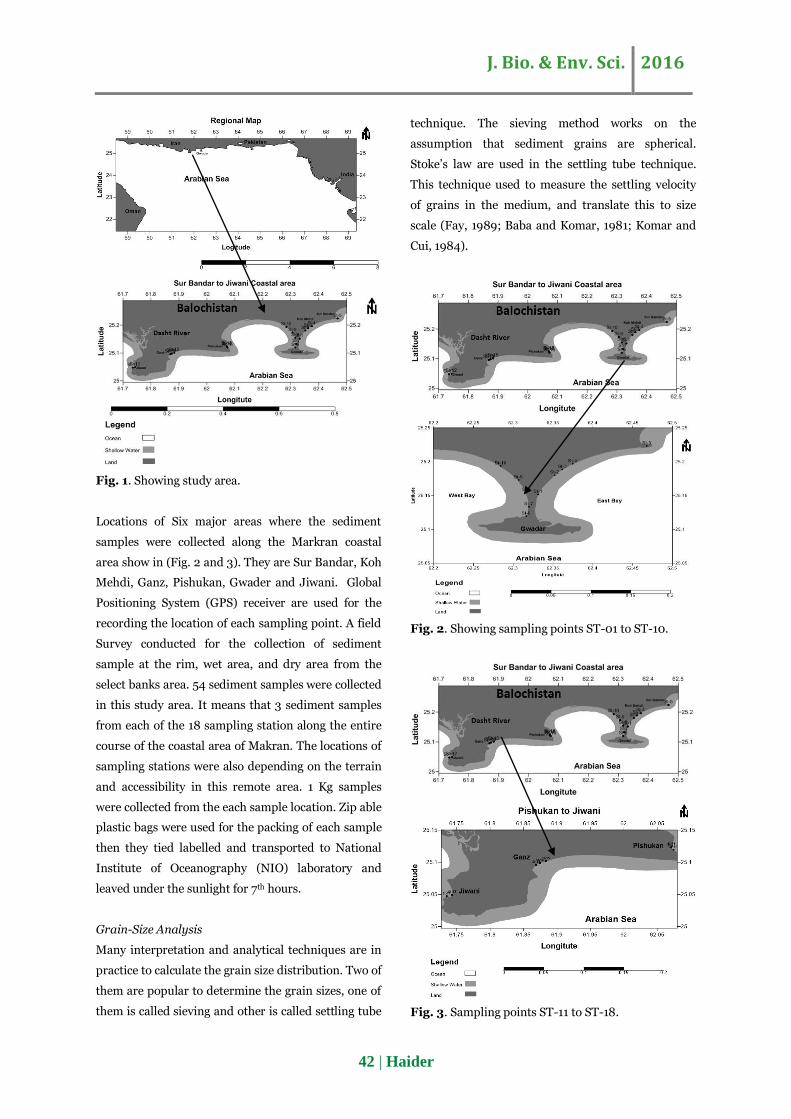
Fig. 1. Showing study area.
Locations of Six major areas where the sediment
samples were collected along the Markran coastal
area show in (Fig. 2 and 3). They are Sur Bandar, Koh
Mehdi, Ganz, Pishukan, Gwader and Jiwani. Global
Positioning System (GPS) receiver are used for the
recording the location of each sampling point. A field
Survey conducted for the collection of sediment
sample at the rim, wet area, and dry area from the
select banks area. 54 sediment samples were collected
in this study area. It means that 3 sediment samples
from each of the 18 sampling station along the entire
course of the coastal area of Makran. The locations of
sampling stations were also depending on the terrain
and accessibility in this remote area. 1 Kg samples
were collected from the each sample location. Zip able
plastic bags were used for the packing of each sample
then they tied labelled and transported to National
Institute of Oceanography (NIO) laboratory and
leaved under the sunlight for 7th hours.
Grain-Size Analysis
Many interpretation and analytical techniques are in
practice to calculate the grain size distribution. Two of
them are popular to determine the grain sizes, one of
them is called sieving and other is called settling tube
technique. The sieving method works on the
assumption that sediment grains are spherical.
Stoke’s law are used in the settling tube technique.
This technique used to measure the settling velocity
of grains in the medium, and translate this to size
scale (Fay, 1989; Baba and Komar, 1981; Komar and
Cui, 1984).
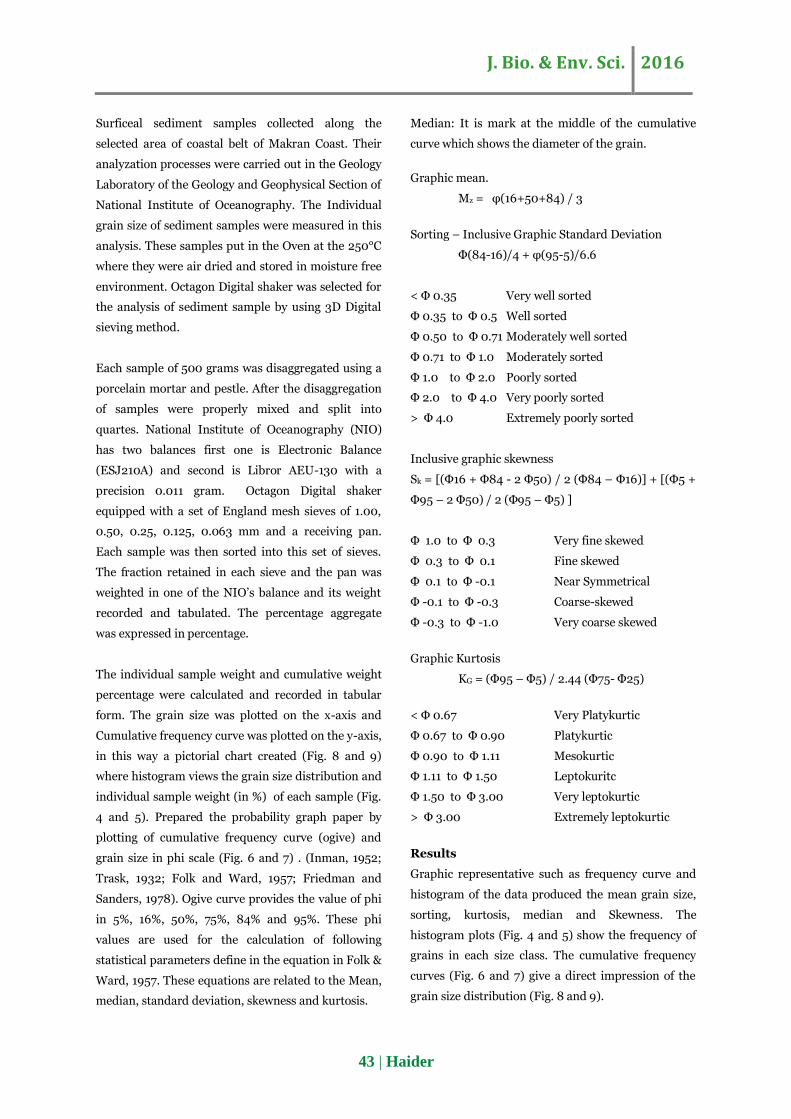
Fig. 2. Showing sampling points ST-01 to ST-10.
Fig. 3. Sampling points ST-11 to ST-18.
J. Bio. & Env. Sci. 2016
43 | Haider
Surficeal sediment samples collected along the
selected area of coastal belt of Makran Coast. Their
analyzation processes were carried out in the Geology
Laboratory of the Geology and Geophysical Section of
National Institute of Oceanography. The Individual
grain size of sediment samples were measured in this
analysis. These samples put in the Oven at the 250°C
where they were air dried and stored in moisture free
environment. Octagon Digital shaker was selected for
the analysis of sediment sample by using 3D Digital
sieving method.
Each sample of 500 grams was disaggregated using a
porcelain mortar and pestle. After the disaggregation
of samples were properly mixed and split into
quartes. National Institute of Oceanography (NIO)
has two balances first one is Electronic Balance
(ESJ210A) and second is Libror AEU-130 with a
precision 0.011 gram. Octagon Digital shaker
equipped with a set of England mesh sieves of 1.00,
0.50, 0.25, 0.125, 0.063 mm and a receiving pan.
Each sample was then sorted into this set of sieves.
The fraction retained in each sieve and the pan was
weighted in one of the NIO’s balance and its weight
recorded and tabulated. The percentage aggregate
was expressed in percentage.
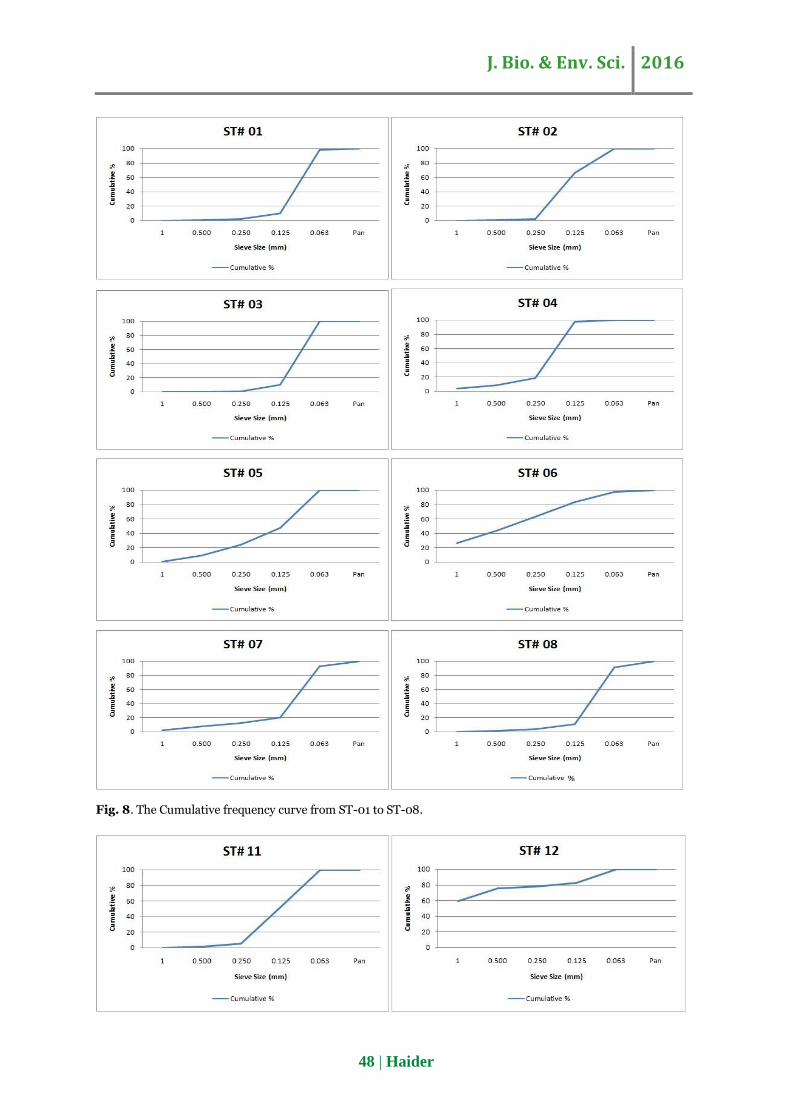
The individual sample weight and cumulative weight
percentage were calculated and recorded in tabular
form. The grain size was plotted on the x-axis and
Cumulative frequency curve was plotted on the y-axis,
in this way a pictorial chart created (Fig. 8 and 9)
where histogram views the grain size distribution and
individual sample weight (in %) of each sample (Fig.
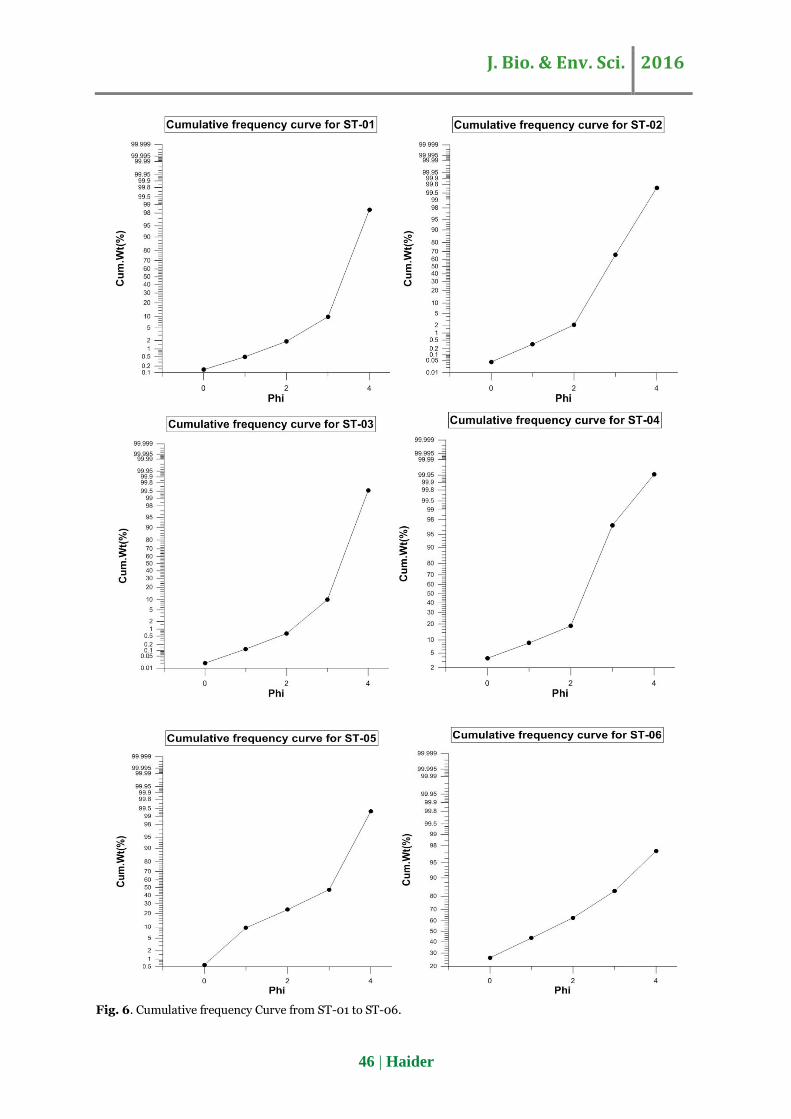
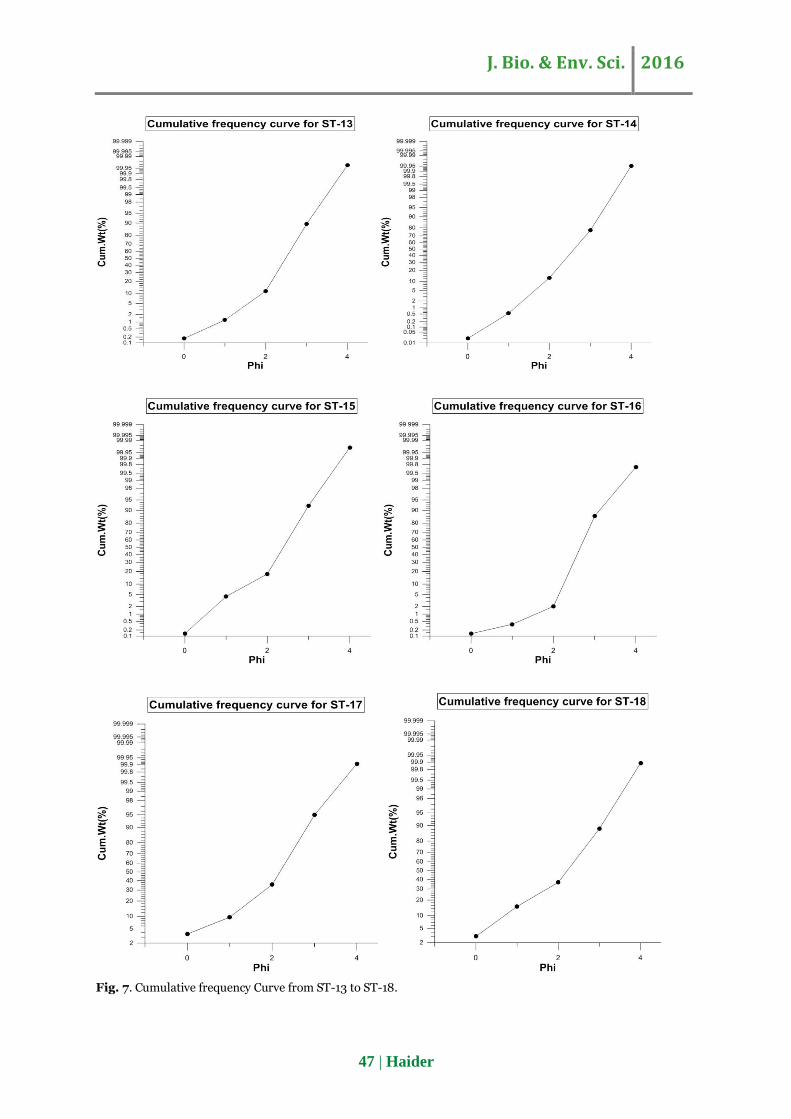
4 and 5). Prepared the probability graph paper by
plotting of cumulative frequency curve (ogive) and
grain size in phi scale (Fig. 6 and 7) . (Inman, 1952;
Trask, 1932; Folk and Ward, 1957; Friedman and
Sanders, 1978). Ogive curve provides the value of phi
in 5%, 16%, 50%, 75%, 84% and 95%. These phi
values are used for the calculation of following
statistical parameters define in the equation in Folk &
Ward, 1957. These equations are related to the Mean,
median, standard deviation, skewness and kurtosis.
Median: It is mark at the middle of the cumulative
curve which shows the diameter of the grain.
Graphic mean.
Mz = φ(16+50+84) / 3
Sorting – Inclusive Graphic Standard Deviation
Φ(84-16)/4 + φ(95-5)/6.6
< Φ 0.35 Very well sorted
Φ 0.35 to Φ 0.5 Well sorted
Φ 0.50 to Φ 0.71 Moderately well sorted
Φ 0.71 to Φ 1.0 Moderately sorted
Φ 1.0 to Φ 2.0 Poorly sorted
Φ 2.0 to Φ 4.0 Very poorly sorted
> Φ 4.0 Extremely poorly sorted
Inclusive graphic skewness
Sk = [(Φ16 + Φ84 - 2 Φ50) / 2 (Φ84 – Φ16)] + [(Φ5 +
Φ95 – 2 Φ50) / 2 (Φ95 – Φ5) ]
Φ 1.0 to Φ 0.3 Very fine skewed
Φ 0.3 to Φ 0.1 Fine skewed
Φ 0.1 to Φ -0.1 Near Symmetrical
Φ -0.1 to Φ -0.3 Coarse-skewed
Φ -0.3 to Φ -1.0 Very coarse skewed
Graphic Kurtosis
KG = (Φ95 – Φ5) / 2.44 (Φ75- Φ25)
< Φ 0.67 Very Platykurtic
Φ 0.67 to Φ 0.90 Platykurtic
Φ 0.90 to Φ 1.11 Mesokurtic
Φ 1.11 to Φ 1.50 Leptokuritc
Φ 1.50 to Φ 3.00 Very leptokurtic
> Φ 3.00 Extremely leptokurtic
Results
Graphic representative such as frequency curve and
histogram of the data produced the mean grain size,
sorting, kurtosis, median and Skewness. The
histogram plots (Fig. 4 and 5) show the frequency of
grains in each size class. The cumulative frequency
curves (Fig. 6 and 7) give a direct impression of the
grain size distribution (Fig. 8 and 9).
J. Bio. & Env. Sci. 2016
44 | Haider
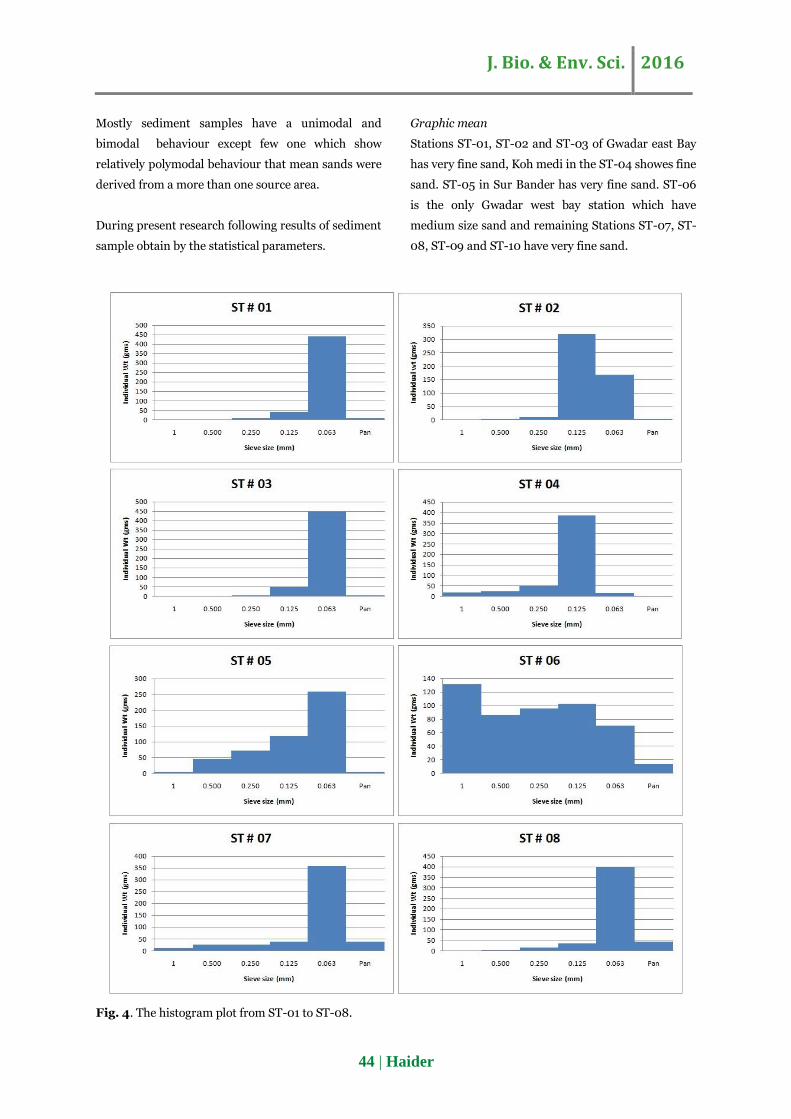
Mostly sediment samples have a unimodal and
bimodal behaviour except few one which show
relatively polymodal behaviour that mean sands were
derived from a more than one source area.
During present research following results of sediment
sample obtain by the statistical parameters.
Graphic mean
Stations ST-01, ST-02 and ST-03 of Gwadar east Bay
has very fine sand, Koh medi in the ST-04 showes fine
sand. ST-05 in Sur Bander has very fine sand. ST-06
is the only Gwadar west bay station which have
medium size sand and remaining Stations ST-07, ST-
08, ST-09 and ST-10 have very fine sand.
Fig. 4. The histogram plot from ST-01 to ST-08.
J. Bio. & Env. Sci. 2016
45 | Haider
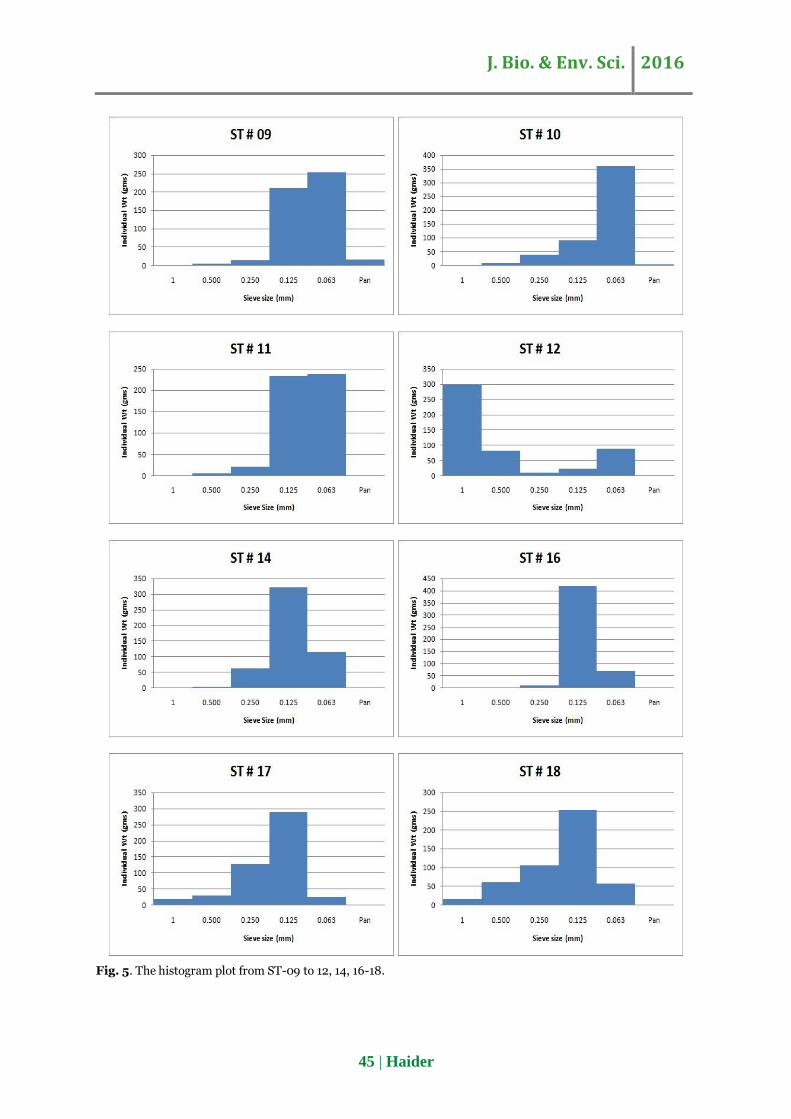
Fig. 5. The histogram plot from ST-09 to 12, 14, 16-18.
J. Bio. & Env. Sci. 2016
46 | Haider
Fig. 6. Cumulative frequency Curve from ST-01 to ST-06.
J. Bio. & Env. Sci. 2016
47 | Haider
Fig. 7. Cumulative frequency Curve from ST-13 to ST-18.
J. Bio. & Env. Sci. 2016
48 | Haider
Fig. 8. The Cumulative frequency curve from ST-01 to ST-08.
J. Bio. & Env. Sci. 2016
49 | Haider
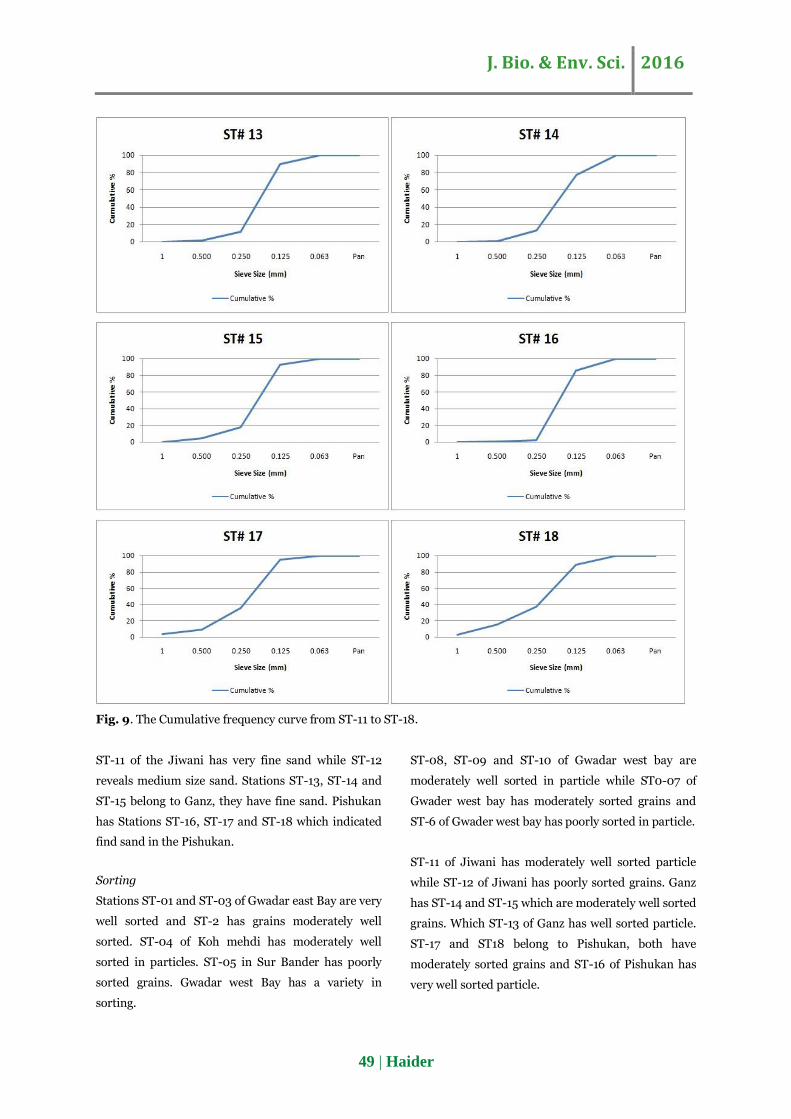
Fig. 9. The Cumulative frequency curve from ST-11 to ST-18.
ST-11 of the Jiwani has very fine sand while ST-12
reveals medium size sand. Stations ST-13, ST-14 and
ST-15 belong to Ganz, they have fine sand. Pishukan
has Stations ST-16, ST-17 and ST-18 which indicated
find sand in the Pishukan.
Sorting
Stations ST-01 and ST-03 of Gwadar east Bay are very
well sorted and ST-2 has grains moderately well
sorted. ST-04 of Koh mehdi has moderately well
sorted in particles. ST-05 in Sur Bander has poorly
sorted grains. Gwadar west Bay has a variety in
sorting.
ST-08, ST-09 and ST-10 of Gwadar west bay are
moderately well sorted in particle while ST0-07 of
Gwader west bay has moderately sorted grains and
ST-6 of Gwader west bay has poorly sorted in particle.
ST-11 of Jiwani has moderately well sorted particle
while ST-12 of Jiwani has poorly sorted grains. Ganz
has ST-14 and ST-15 which are moderately well sorted
grains. Which ST-13 of Ganz has well sorted particle.
ST-17 and ST18 belong to Pishukan, both have
moderately sorted grains and ST-16 of Pishukan has
very well sorted particle.
J. Bio. & Env. Sci. 2016
50 | Haider
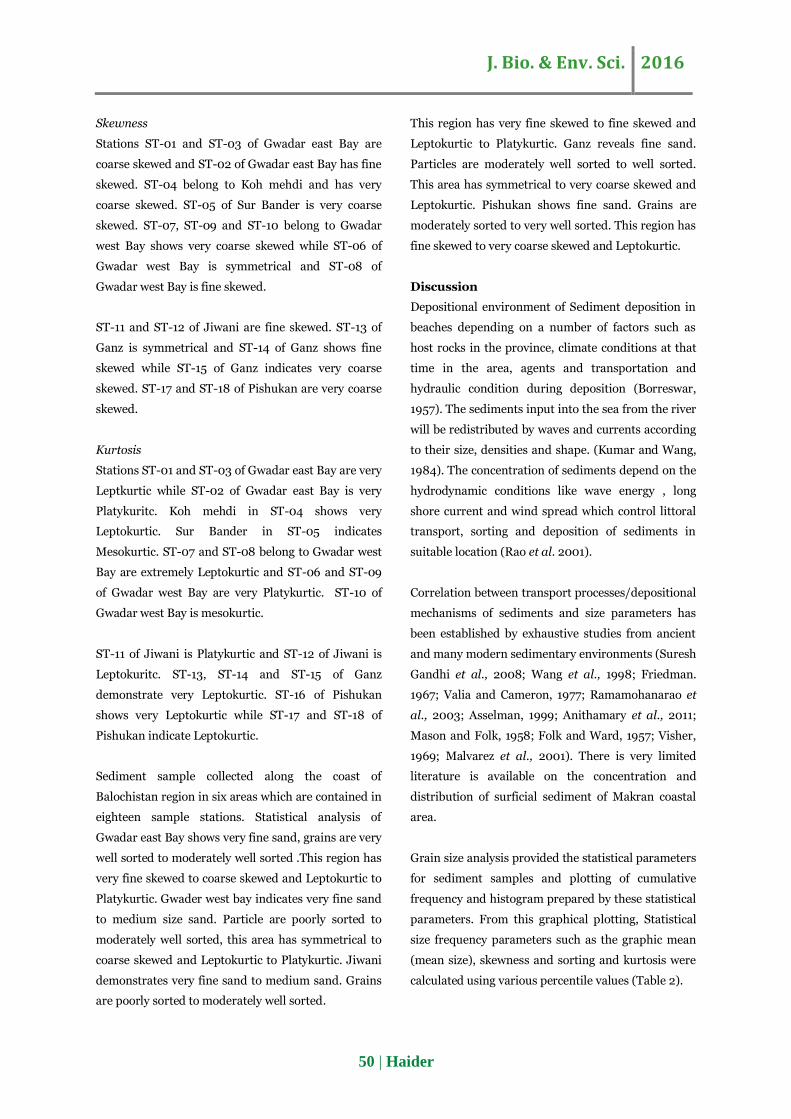
Skewness
Stations ST-01 and ST-03 of Gwadar east Bay are
coarse skewed and ST-02 of Gwadar east Bay has fine
skewed. ST-04 belong to Koh mehdi and has very
coarse skewed. ST-05 of Sur Bander is very coarse
skewed. ST-07, ST-09 and ST-10 belong to Gwadar
west Bay shows very coarse skewed while ST-06 of
Gwadar west Bay is symmetrical and ST-08 of
Gwadar west Bay is fine skewed.
ST-11 and ST-12 of Jiwani are fine skewed. ST-13 of
Ganz is symmetrical and ST-14 of Ganz shows fine
skewed while ST-15 of Ganz indicates very coarse
skewed. ST-17 and ST-18 of Pishukan are very coarse
skewed.
Kurtosis
Stations ST-01 and ST-03 of Gwadar east Bay are very
Leptkurtic while ST-02 of Gwadar east Bay is very
Platykuritc. Koh mehdi in ST-04 shows very
Leptokurtic. Sur Bander in ST-05 indicates
Mesokurtic. ST-07 and ST-08 belong to Gwadar west
Bay are extremely Leptokurtic and ST-06 and ST-09
of Gwadar west Bay are very Platykurtic. ST-10 of
Gwadar west Bay is mesokurtic.
ST-11 of Jiwani is Platykurtic and ST-12 of Jiwani is
Leptokuritc. ST-13, ST-14 and ST-15 of Ganz
demonstrate very Leptokurtic. ST-16 of Pishukan
shows very Leptokurtic while ST-17 and ST-18 of
Pishukan indicate Leptokurtic.
Sediment sample collected along the coast of
Balochistan region in six areas which are contained in
eighteen sample stations. Statistical analysis of
Gwadar east Bay shows very fine sand, grains are very
well sorted to moderately well sorted .This region has
very fine skewed to coarse skewed and Leptokurtic to
Platykurtic. Gwader west bay indicates very fine sand
to medium size sand. Particle are poorly sorted to
moderately well sorted, this area has symmetrical to
coarse skewed and Leptokurtic to Platykurtic. Jiwani
demonstrates very fine sand to medium sand. Grains
are poorly sorted to moderately well sorted.
This region has very fine skewed to fine skewed and
Leptokurtic to Platykurtic. Ganz reveals fine sand.
Particles are moderately well sorted to well sorted.
This area has symmetrical to very coarse skewed and
Leptokurtic. Pishukan shows fine sand. Grains are
moderately sorted to very well sorted. This region has
fine skewed to very coarse skewed and Leptokurtic.
Discussion
Depositional environment of Sediment deposition in
beaches depending on a number of factors such as
host rocks in the province, climate conditions at that
time in the area, agents and transportation and
hydraulic condition during deposition (Borreswar,
1957). The sediments input into the sea from the river
will be redistributed by waves and currents according
to their size, densities and shape. (Kumar and Wang,
1984). The concentration of sediments depend on the
hydrodynamic conditions like wave energy , long
shore current and wind spread which control littoral
transport, sorting and deposition of sediments in
suitable location (Rao et al. 2001).
Correlation between transport processes/depositional
mechanisms of sediments and size parameters has
been established by exhaustive studies from ancient
and many modern sedimentary environments (Suresh
Gandhi et al., 2008; Wang et al., 1998; Friedman.
1967; Valia and Cameron, 1977; Ramamohanarao et
al., 2003; Asselman, 1999; Anithamary et al., 2011;
Mason and Folk, 1958; Folk and Ward, 1957; Visher,
1969; Malvarez et al., 2001). There is very limited
literature is available on the concentration and
distribution of surficial sediment of Makran coastal
area.
Grain size analysis provided the statistical parameters
for sediment samples and plotting of cumulative
frequency and histogram prepared by these statistical
parameters. From this graphical plotting, Statistical
size frequency parameters such as the graphic mean
(mean size), skewness and sorting and kurtosis were
calculated using various percentile values (Table 2).
J. Bio. & Env. Sci. 2016
51 | Haider
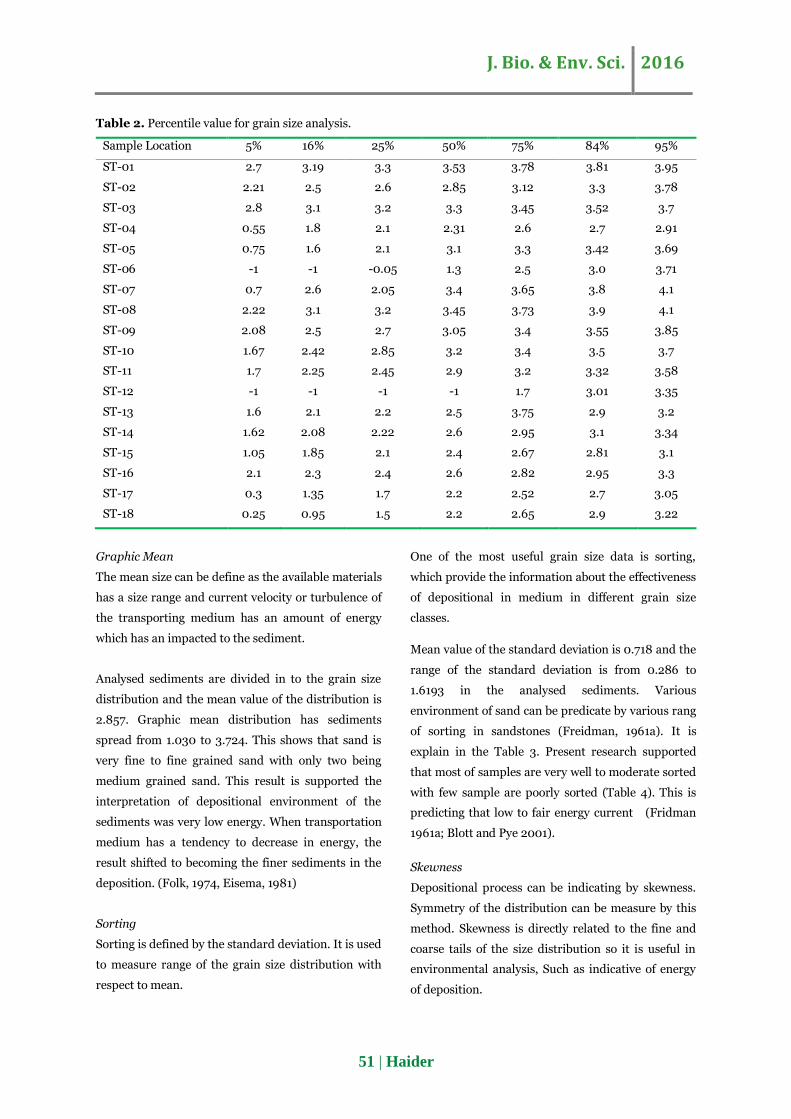
Table 2. Percentile value for grain size analysis.
Sample Location 5% 16% 25% 50% 75% 84% 95%
ST-01 2.7 3.19 3.3 3.53 3.78 3.81 3.95
ST-02 2.21 2.5 2.6 2.85 3.12 3.3 3.78
ST-03 2.8 3.1 3.2 3.3 3.45 3.52 3.7
ST-04 0.55 1.8 2.1 2.31 2.6 2.7 2.91
ST-05 0.75 1.6 2.1 3.1 3.3 3.42 3.69
ST-06 -1 -1 -0.05 1.3 2.5 3.0 3.71
ST-07 0.7 2.6 2.05 3.4 3.65 3.8 4.1
ST-08 2.22 3.1 3.2 3.45 3.73 3.9 4.1
ST-09 2.08 2.5 2.7 3.05 3.4 3.55 3.85
ST-10 1.67 2.42 2.85 3.2 3.4 3.5 3.7
ST-11 1.7 2.25 2.45 2.9 3.2 3.32 3.58
ST-12 -1 -1 -1 -1 1.7 3.01 3.35
ST-13 1.6 2.1 2.2 2.5 3.75 2.9 3.2
ST-14 1.62 2.08 2.22 2.6 2.95 3.1 3.34
ST-15 1.05 1.85 2.1 2.4 2.67 2.81 3.1
ST-16 2.1 2.3 2.4 2.6 2.82 2.95 3.3
ST-17 0.3 1.35 1.7 2.2 2.52 2.7 3.05
ST-18 0.25 0.95 1.5 2.2 2.65 2.9 3.22
Graphic Mean
The mean size can be define as the available materials
has a size range and current velocity or turbulence of
the transporting medium has an amount of energy
which has an impacted to the sediment.
Analysed sediments are divided in to the grain size
distribution and the mean value of the distribution is
2.857. Graphic mean distribution has sediments
spread from 1.030 to 3.724. This shows that sand is
very fine to fine grained sand with only two being
medium grained sand. This result is supported the
interpretation of depositional environment of the
sediments was very low energy. When transportation
medium has a tendency to decrease in energy, the
result shifted to becoming the finer sediments in the
deposition. (Folk, 1974, Eisema, 1981)
Sorting
Sorting is defined by the standard deviation. It is used
to measure range of the grain size distribution with
respect to mean.
One of the most useful grain size data is sorting,
which provide the information about the effectiveness
of depositional in medium in different grain size
classes.
Mean value of the standard deviation is 0.718 and the
range of the standard deviation is from 0.286 to
1.6193 in the analysed sediments. Various
environment of sand can be predicate by various rang
of sorting in sandstones (Freidman, 1961a). It is
explain in the Table 3. Present research supported
that most of samples are very well to moderate sorted
with few sample are poorly sorted (Table 4). This is
predicting that low to fair energy current (Fridman
1961a; Blott and Pye 2001).
Skewness
Depositional process can be indicating by skewness.
Symmetry of the distribution can be measure by this
method. Skewness is directly related to the fine and
coarse tails of the size distribution so it is useful in
environmental analysis, Such as indicative of energy
of deposition.
J. Bio. & Env. Sci. 2016
52 | Haider
Finer grain sizes indicate towards the positive values
in the skewness and coarser grain sizes indicate
towards the negative values. Here analysed sediment
sample has a values range from -0.701 to 0.8424 thus
skweness supported the statement that sediments are
very fine to very coarse skewed in population of
particles. Analysed sediment samples has a tendency
toward the finer grain size, to it may be river
sediments.
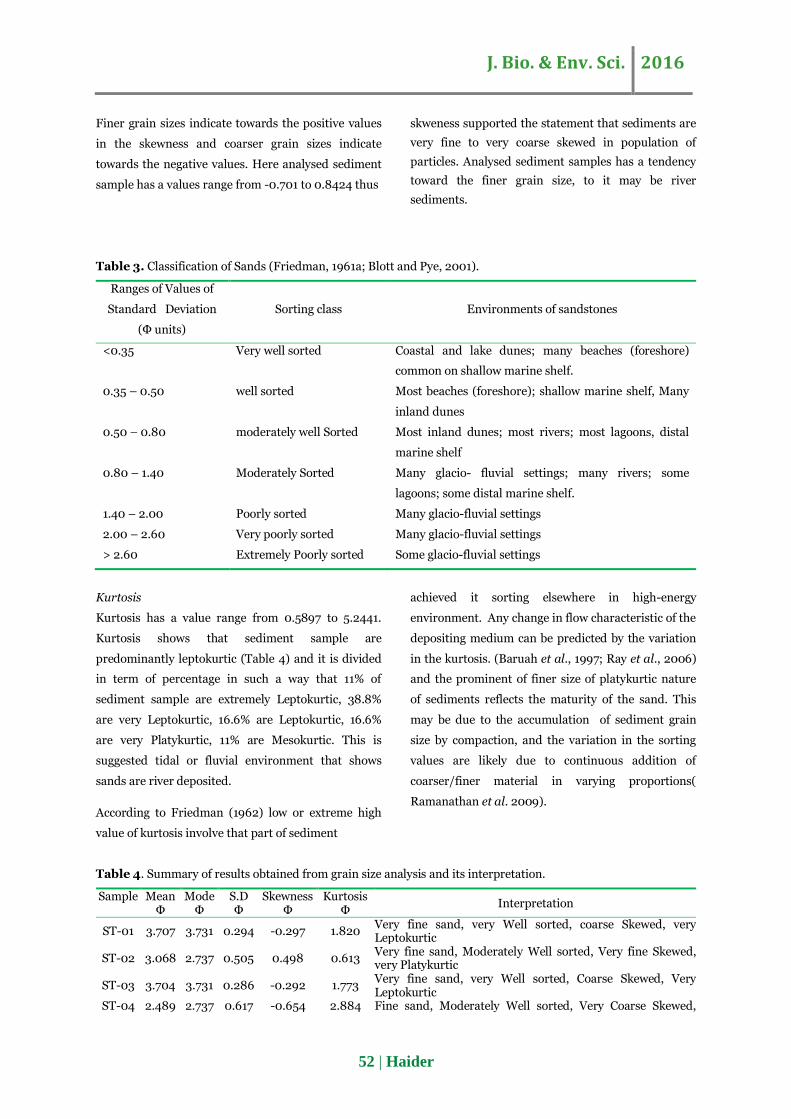
Table 3. Classification of Sands (Friedman, 1961a; Blott and Pye, 2001).
Ranges of Values of
Standard Deviation
(Φ units)
Sorting class Environments of sandstones
<0.35 Very well sorted Coastal and lake dunes; many beaches (foreshore)
common on shallow marine shelf.
0.35 – 0.50 well sorted Most beaches (foreshore); shallow marine shelf, Many
inland dunes
0.50 – 0.80 moderately well Sorted Most inland dunes; most rivers; most lagoons, distal
marine shelf
0.80 – 1.40 Moderately Sorted Many glacio- fluvial settings; many rivers; some
lagoons; some distal marine shelf.
1.40 – 2.00 Poorly sorted Many glacio-fluvial settings
2.00 – 2.60 Very poorly sorted Many glacio-fluvial settings
> 2.60 Extremely Poorly sorted Some glacio-fluvial settings
Kurtosis
Kurtosis has a value range from 0.5897 to 5.2441.
Kurtosis shows that sediment sample are
predominantly leptokurtic (Table 4) and it is divided
in term of percentage in such a way that 11% of
sediment sample are extremely Leptokurtic, 38.8%
are very Leptokurtic, 16.6% are Leptokurtic, 16.6%
are very Platykurtic, 11% are Mesokurtic. This is
suggested tidal or fluvial environment that shows
sands are river deposited.
According to Friedman (1962) low or extreme high
value of kurtosis involve that part of sediment
achieved it sorting elsewhere in high-energy
environment. Any change in flow characteristic of the
depositing medium can be predicted by the variation
in the kurtosis. (Baruah et al., 1997; Ray et al., 2006)
and the prominent of finer size of platykurtic nature
of sediments reflects the maturity of the sand. This
may be due to the accumulation of sediment grain
size by compaction, and the variation in the sorting
values are likely due to continuous addition of
coarser/finer material in varying proportions(
Ramanathan et al. 2009).
Table 4. Summary of results obtained from grain size analysis and its interpretation.
Sample Mean Φ
Mode Φ
S.D Φ
Skewness Φ
Kurtosis Φ
Interpretation
ST-01 3.707 3.731 0.294 -0.297 1.820 Very fine sand, very Well sorted, coarse Skewed, very Leptokurtic
ST-02 3.068 2.737 0.505 0.498 0.613 Very fine sand, Moderately Well sorted, Very fine Skewed, very Platykurtic
ST-03 3.704 3.731 0.286 -0.292 1.773 Very fine sand, very Well sorted, Coarse Skewed, Very Leptokurtic
ST-04 2.489 2.737 0.617 -0.654 2.884 Fine sand, Moderately Well sorted, Very Coarse Skewed,
J. Bio. & Env. Sci. 2016
53 | Haider
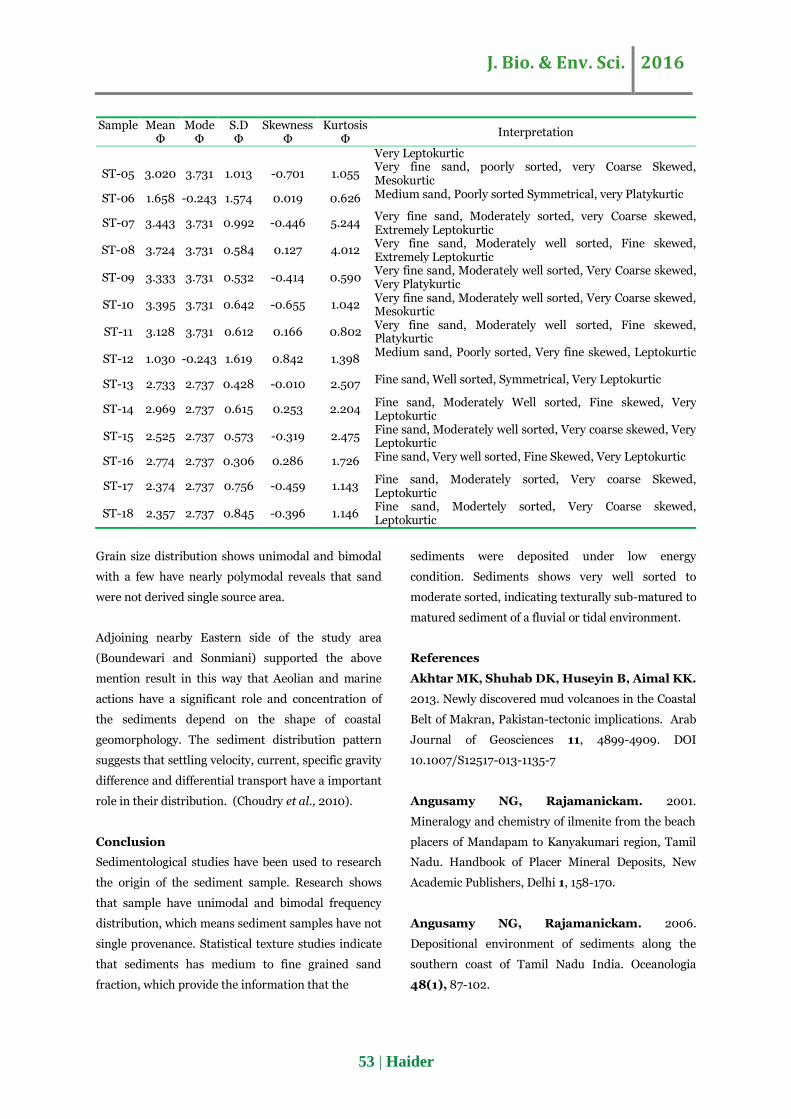
Sample Mean Φ
Mode Φ
S.D Φ
Skewness Φ
Kurtosis Φ
Interpretation
Very Leptokurtic
ST-05 3.020 3.731 1.013 -0.701 1.055 Very fine sand, poorly sorted, very Coarse Skewed, Mesokurtic
ST-06 1.658 -0.243 1.574 0.019 0.626 Medium sand, Poorly sorted Symmetrical, very Platykurtic
ST-07 3.443 3.731 0.992 -0.446 5.244 Very fine sand, Moderately sorted, very Coarse skewed, Extremely Leptokurtic
ST-08 3.724 3.731 0.584 0.127 4.012 Very fine sand, Moderately well sorted, Fine skewed, Extremely Leptokurtic
ST-09 3.333 3.731 0.532 -0.414 0.590 Very fine sand, Moderately well sorted, Very Coarse skewed, Very Platykurtic
ST-10 3.395 3.731 0.642 -0.655 1.042 Very fine sand, Moderately well sorted, Very Coarse skewed, Mesokurtic
ST-11 3.128 3.731 0.612 0.166 0.802 Very fine sand, Moderately well sorted, Fine skewed, Platykurtic
ST-12 1.030 -0.243 1.619 0.842 1.398 Medium sand, Poorly sorted, Very fine skewed, Leptokurtic
ST-13 2.733 2.737 0.428 -0.010 2.507 Fine sand, Well sorted, Symmetrical, Very Leptokurtic
ST-14 2.969 2.737 0.615 0.253 2.204 Fine sand, Moderately Well sorted, Fine skewed, Very Leptokurtic
ST-15 2.525 2.737 0.573 -0.319 2.475 Fine sand, Moderately well sorted, Very coarse skewed, Very Leptokurtic
ST-16 2.774 2.737 0.306 0.286 1.726 Fine sand, Very well sorted, Fine Skewed, Very Leptokurtic
ST-17 2.374 2.737 0.756 -0.459 1.143 Fine sand, Moderately sorted, Very coarse Skewed, Leptokurtic
ST-18 2.357 2.737 0.845 -0.396 1.146 Fine sand, Modertely sorted, Very Coarse skewed, Leptokurtic
Grain size distribution shows unimodal and bimodal
with a few have nearly polymodal reveals that sand
were not derived single source area.
Adjoining nearby Eastern side of the study area
(Boundewari and Sonmiani) supported the above
mention result in this way that Aeolian and marine
actions have a significant role and concentration of
the sediments depend on the shape of coastal
geomorphology. The sediment distribution pattern
suggests that settling velocity, current, specific gravity
difference and differential transport have a important
role in their distribution. (Choudry et al., 2010).
Conclusion
Sedimentological studies have been used to research
the origin of the sediment sample. Research shows
that sample have unimodal and bimodal frequency
distribution, which means sediment samples have not
single provenance. Statistical texture studies indicate
that sediments has medium to fine grained sand
fraction, which provide the information that the
sediments were deposited under low energy
condition. Sediments shows very well sorted to
moderate sorted, indicating texturally sub-matured to
matured sediment of a fluvial or tidal environment.
References
Akhtar MK, Shuhab DK, Huseyin B, Aimal KK.
2013. Newly discovered mud volcanoes in the Coastal
Belt of Makran, Pakistan-tectonic implications. Arab
Journal of Geosciences 11, 4899-4909. DOI
10.1007/S12517-013-1135-7
Angusamy NG, Rajamanickam. 2001.
Mineralogy and chemistry of ilmenite from the beach
placers of Mandapam to Kanyakumari region, Tamil
Nadu. Handbook of Placer Mineral Deposits, New
Academic Publishers, Delhi 1, 158-170.
Angusamy NG, Rajamanickam. 2006.
Depositional environment of sediments along the
southern coast of Tamil Nadu India. Oceanologia
48(1), 87-102.
J. Bio. & Env. Sci. 2016
54 | Haider
Angusamy NG, Rajamanickam. 2007. Coastal
processes of Central Tamil Nadu, India; clues from
grain size studies. Ocenologia 49(1), 41-57.
Anithamary I, Ramkumar T, Venkatramanan
S. 2011. Grain size characteristics of coleroon estuary
sediments, Tamilnadu, east coast of India. Carpathian
Journal of Earth and Environmental Science 6(2),
151-157.
Asselman NEM, 1999. Grain size trends used to assess
the effective dishcharge for flood plain sedimentation.
River Wall, the Netherlands. International Journal of
Sediment Research 69, 51-61.
Baba J, Komar PD. 1981. Measurements and
analysis of settling velocities of natural quartz sand
grains. Journal of Sedimentary Petrology 51, 631-640.
Baloch AH, Rehman H, Saeed M, Kalhoro MA,
Buzdar MA. 2014. The Curious Case of Mangroves
Forest at the Sonmiani bay Area, Lasbela District,
Pakistan: A review. Lasbela University Journal of
Science and Technology 3, 61-74.
Baruah J, Kotoky P, Sarma J. 1997. Textural and
geochemical study on river sediments; a case study on
the Jhanji River, Assam. Journal Indian Association
of Sedimentoloists 16, 195-206.
Blott SJ, Pye K. 1984.GRADSTAT: A grain size
distribution and statistics package for the analysis of
unconsolidated sediments. Earth surfaces processes
and landforms 26, 1237-1248 .
Borreswar RC. 1957. Beach erosion and
concentration of heavy minerals. Journal sedimentary
Petrology 27, 143-147.
Chaudhri RS, Khan HMM, Kaur S. 1981.
Sedimentology of beach sediments of the West coast
of India. Sedimentary Geology Journal 30, 79-94.
Choudry MAF, Nurgis Y, Hussain A, Abbasi
HN. 2010, Distribution and percentage of Heavy
Mineral along Makran Coasline of Pakistan.
American Journal of Scientific Research 11, 86-91.
Deslisle G, Rad VU, Andruleit H, Daniels CHV,
Tabrez AR, Inam A. 2002. Active mud volcanoes
on and offshore eastern Makran, Pakistan.
International Journal of Earth Sciences (Geologische
Rundschas) 81, 93-110. DOI 10.1007/S00531
0100203.
Eisema D. 1981. Supply and deposition of
suspended matter in the north sea. special publication
of the International association of Sedimentologists 5,
415-428.
Fay MB. 1989. Grain-size analysis program package,
Department of Geology, University of Dar es Salaam,
Tanzania.
Folk RL, Ward WC. 1957. Brazos river bar: A study
in the significance of grain size parameters. Journal of
Sedimentary Petrology 27, 3-26.
Folk RL. 1974. Petrology of sedimentary rocks.
Austin Texas: Hemphili Publication, Company 182.
Fredlund MD, Fredlund DG, Wilson GW. 2000.
An equation to represent grain size distribution.
Canadian Geotechnical Journal 37, 817-827. http://
dx.doi.org/10.1139/t00-015
Friedman GM, Sanders JE. 1978. Principles of
Sedimentology, Wiley, New York 792 .
Friedman GM. 1961a. Distinction between dune
beach and river sands from textural characteristics.
Journal of Sedimentary Petrology 31, 514-529.
Friedman GM. 1961b. On sorting, sorting
coefficients and the log normality of the grain-size
distribution of sandstones. Journal of Geology 70,
737-753.
Friedman GM. 1967. Dynamic processes and
statistical parameters compared for size frequency
distribution of beach river sands. Journal of
Sedimentary Petrology 37, 327-354.
J. Bio. & Env. Sci. 2016
55 | Haider
Gandhi SM, Solai A, Chandrasekaran K,
Rammohan V. 2008. Sediment characteristics and
heavy mineral distribution in Tamiraparani estuary
and off Tuticorin, Tamil Nadu- SEM studies. E-
journal Earth Science India 1(III), 102-118
Inman DL. 1952. Measures for describing the size
distribution of sediments. Journal of Sedimentary
Petrology 22, 125-145.
Jones HA, Hockey RD. 1964. The geology of South
western Nigeria. Bulletin, Geological Survey 31-100.
Komar PD, Cui B. 1984. The analysis of grain-size
measurements by sieving and settling-tube
techniques. Journal of Sedimentary Petrology 54,
603-614.
Malvarez GC, Cooper JAG, Jackson DWT.
2001. Relationship between waves induced currents
and sediment grain size on a sandy tidal flat. Journal
of Sedimentary Petrology 71, 705-712.
Mason C, Folk RL. 1958. Differentiation of beach,
dune and Aeolian flat environments by size analysis,
Mustang Island, Texas. Journal of Sedimentary
Petrology 28, 211-226
Patric M, Donald B. 1985. The effects of sediment
transport on grain size distribution. Journal of
Sedimentary Petrology 55(4), 0457-0470 .
Rad UV, Berner U, Delisle G, Dosse-Rolinski
H, Fechner N, Linke P, Luckge A, Roeser HA,
Schmaljohann R, Wiedicke. 2000. Gas and Fluid
venting at the Makran accretionary wedge off
Pakistan. (Geo-Marine letter 2000) Springer-Verlag
20, 10-19.
Rajamanickam GV, Gujar AR. 1984. Sediment
depositional environment in some bays on the Central
West Coast of India. India Journal of Geo-Marine
Sciences 13, 53-59.
Rajamanickam GV, Gujar AR. 1993. Depositional
processes inferred from the log probability
distribution. In; Jhingran V (ed) Recent researches in
sedimentology. Hindustan Publishing Corporation.
Delhi, 154-164.
Ramamohanarao T, Sairam K,
Venkateswararao Y, Nagamalleswararao B,
Viswanath K, 2003. Sedimentological
characteristics and depositional environment of
Upper Gondwana rocks in the Chintalapudi sub-basin
of the Godavari valley, Andhra Pradesh, India.
Journal of Asian Earth Sciences 21, 691-703.
Ramanathan AL, Rajkumar K, Majumdar J,
Singh G, Behera PN, Santra SC, Chidambaram
S. 2009. Textural characteristics of the surface
sediments of a tropical mangrove Sundardban
ecosystem India. Indian Journal of Geo-Marine
Sciences 38(4), 397-403.
Rao PS, Ramaswamy V, Thwin S. 2005.
Sediment texture, distribution and transport on the
Ayeyarwady continental shelf, Andaman Sea. Marine
Geology 216(4), 239-247.
Rao RG, Sahoo P, Panda NK. 2001. Heavy
mineral sand deposit of Orissa. Exploration and
Research for atomic Minerals 13, 23-52.
Ray AK, Tripathy SC, Patra S, Sarma VV. 2006.
Assessment of Godavari estuarine mangrove
econsystem through trace metal studies, Environment
International Journal 32, 219-247.
Trask PD. 1932. Origin and Environment of Source
Sediments of Petroleum. Gulf Publishing Company,
Houston 323.
Valia HS, Cameron B. 1977. Skewness as paleo
environmental indicators. Journal of Sedimentary
Petrology 4, 784-793.

J. Bio. & Env. Sci. 2016
56 | Haider
Visher GS. 1969. Grain Size distribution and
depositional process. Journal of Sedimentary
Petrology 39, 1074-1106.
Wang P, Davis RA, Kraus NC. 1998. Cross shore
distinction of sediment texture under breaking waves
along low energy coasts. International Journal of
Sediment Research 68, 497-506.