Embed Size (px)
Citation preview
1
Seeds of Gold: How Environmental Considerations Influence Cacao Production Decisions
for Small Landholder Households in Northwestern Ecuador
Pilar Useche and Trent Blare
University of Florida Department of Food and Resource Economics
P.O. Box 110240, Gainesville, Florida
(352)392-1826
[email protected] [email protected]
Selected Paper prepared for presentation at the Agricultural & Applied Economics
Association’s 2012 AAEA Annual Meeting, Seattle, Washington, August 12-14, 2012
Copyright 2012 by Pilar Useche and Trent Blare. All rights reserved. Readers may make
verbatim copies of this document for non-commercial purposes by any means, provided that this
copyright notice appears on all such copies.
2
Abstract
Many factors besides profit maximization such as nonmarket ecological and social benefits
influence smallholder households to adopt one agricultural production system or another. Thus,
different techniques are needed that take into consideration more than monetary income to fully
capture these additional benefits in order to better understand the production decision of
smallholder farmers. We build upon previous work on the household model and shadow wage
estimation to develop a shadow wage for Ecuadorian cacao producers that includes these
nonmarket benefits. We found that the shadow wage correctly indicated that these households
would prefer to use an agroforestry production system instead of the more profitable modern
system because these additional nonmarket benefits in additional to the economic benefits from
participating in specialty markets make the traditional cropping system more attractive to these
households.
The Role of Specialty Crop Markets in Development and Environmental Protection
Increasing awareness of environmental degradation and socioeconomic inequality has impacted
consumers throughout the world, who desire to confront these challenges through their
purchasing behavior. This behavior has become increasingly prevalent in developed countries
and even in urban centers of developing countries. The demand for environmentally and socially
differentiated products has led to the creation of organic and fair trade (FT) commodities
(LeClair 2002; Smith 2009). Indeed, great complementarities of the social and environmental
objectives linked to these markets has lead to increased integration of FT and other eco-labels
through multiple-certification providers, which verify that a good is not only fair trade but also
organic and meets strict environmental standards (de Janvry, McIntosh and Sadoulet 2010). This
has tightened the link between the price premiums paid by affluent consumers in the North and
the sustainability of the production practices of farmers in the South.
In the regions where alternative markets operate, smallholder producers have found
renewed incentives to invest their time and effort in using sustainable production systems, which
include many traditional farming practices such as the use of agroforestry systems. These
production systems provide farmers with economic and non-economic benefits, such as food,
medicine and cultural rewards. Yet, the need for cash, for education and other investments,
benefits the adoption of modern, more productive but more genetically uniform, high-yielding
crops (Harlan 1975; Brush, Taylor and Bellon 1992). The perspective of selling in alternative
3
markets may provide incentives to move away from modern production systems, yet
smallholders’ decisions about what type of system to prioritize goes beyond a plain comparison
of economic benefits. Especially in areas with pervasive market imperfections, household
preferences and endowments have a strong influence on production decisions (Eswaran and
Kotwal 1984; Carter and Yao 2002; Key, de Janvry and Sadoulet 2000; Benjamin et al. 1993).
While many studies have tried to quantify the impact of participation in alternative
markets on farmer’s welfare, most of the focus has been on examining the price premium or
additional income received by farmers, compared to income in regular markets (Giovannucci,
Barham, and Pirog 2010; Calo and Wise 2005; de Janvry, McIntosh and Sadoulet 2010; Ruben,
Ford, and Zùñiga-Arias 2009; Ronchi 2006; Wollni and Zeller 2007). These studies ignore the
environmental attributes associated with the production of these specialty products and their
interaction with farm-household’s decisions. A few authors have looked at a wider notion of
living standards (Bacon 2005) and non-market benefits of participation (Bechetti and
Constantino 2008), but these works have been mostly descriptive and do not integrate their
analysis into a broader conceptual framework of farmer decision making.
In this study we develop a farm-household model to explain how environmental factors,
such as biodiversity, interact with price premiums received in specialty markets to impact the
allocation of labor of smallholder households across different productive activities. Building on
the seminal work of Jacoby (1993) and Skoufias (1994), we develop a link between the marginal
benefits that the household receives from planned biodiversity (Vandermeer and Perfecto 1995)
and the effective remuneration that its members receive for their work. This leads to a nuanced
explanation of why farmers may prefer to work on farm and not participate in the labor market –
environmental non-market benefits -- which goes beyond the standard logic of transaction costs
and typical market imperfections. It also shows how farmer’s valuation of environmental benefits
influences their economic behavior and widens the spectrum of reasons for the strong influence
of factor endowments on small producer’s decisions (known in the development literature as lack
of separability or recursivity of household models). We also find that the identification strategy
proposed by Jacoby (1993) and Skoufias (1994) to enable estimation of the shadow wage for
household members, does not deliver point identification in a setting with positive environmental
benefits derived from farm labor. However, the implications of the effect of these ecological and
social nonmarket goods on producer behavior can be derived.
4
The issue is inherently a crosscutting one that thematically falls in the growing body of
research that integrates development economics with environmental economics. Our effort to
formally integrate a micro-household model with environmental questions contributes to two
major fields of applied economics. First, to the recent research in environmental and ecological
economics that has put considerable emphasis on valuing biodiversity, but has not tended to root
it in a deeper portrayal of the household’s full resource allocation problem (Nunes and van den
Bergh 2001; Nijkamp, Vindigni, and Nunes 2008). And second, to the slowly growing body of
work in development economics that addresses environmental questions. This work blends both
lines of work, in the context of biodiversity effects on household behavior. As such, it also
provides the grounding for analyzing other dimensions related to smallholder participation in
alternative commodity markets, than has previously been available in the literature.
We apply this framework to the Ecuadorian case of cacao production, where two different
farming systems for the production of cacao are utilized. One method raises a traditional variety
of cacao known locally in cacao nacional in an agroforestry system that can be sold in specialty
markets for a premium because of its flavor characteristics, which are demanded in by gourmet
chocolate makers. This cacao is often certified with FT, shade-grown, organic, and origin
certifications in order to access these markets. The other method raises a modern, hybrid variety,
referred to in Ecuador by the name CCN-51, in a shade less, monoculture system with chemical
inputs. The latter is on average more productive and profitable than the former. Yet, many
smallholder producers continue to raise the former (El Cacao Volvió Ser la Pepa de Oro 2007;
Coporación de Promoción de Exportaciones e Inversiones 2009; Bentley, Boa, and Stonehouse
2004). This study found that the benefits of a diverse production system are an important
component of the opportunity cost of time that families consider when they make decisions about
how to allocate their labor to different production activities.
Evaluating the effect of agroforestry systems on farmers’ labor decisions
Traditional production systems in high biodiversity areas, such as the cacao agroforestry system
in Ecuador, use seed varieties that are optimal for agroforestry systems and provide households
with not only economic benefits but also a source of food, medicine, reduced agrochemical
contamination, as well as social and cultural benefits (Bentley, Boa, and Stonehouse 2004; Beer
et al. 1998).These traditional cropping systems are more biodiverse than commercial systems and
reduce the need for agrochemicals, as they control the spread of pathogens (plagues that affect
5
one crop are buffered from affecting other crops). The agroforesty system often mimics the
planting structure of a native forest whose structure naturally prevents the spread of diseases
through the spacing and random arrangement of diverse species (Reitsma, Parrish, and
McLarney 2001). In addition, these intensive cropping systems provide shading that inhibits the
growth of weeds and provide an abundance of organic matter that enhances the quality of the
soil, so the need for chemical fertilizers is greatly reduced to meet the nutrient needs of the crops
(Beer et al. 1998). Indeed, in many agroforestry systems several varieties of leguminous plants
are included in this system which provides natural nitrogen to the system as well (Duguma
2001).
There are two distinct components of biodiversity which can be recognized in
agroecosystems (Vandermeer and Perfecto 1995). The first component, planned biodiversity, is
the biodiversity that is associated with the crops and which is purposely included in the
agroecosystem by the farmer, and that will vary depending on farmer management. The second,
associated biodiversity includes all soil floras and faunas, as well as other living organisms that
colonize the agroecosystem from surrounding environments. Planned biodiversity is the
component of biodiversity that the farmer manages and which has a dual function in the system.
It directly promotes ecosystem functions such as pest regulation and nutrient cycling, but it also,
indirectly, creates conditions for the survival of associated biodiversity such as insects and birds
that are attracted to shade trees. Thus, cacao agroforesty systems create a synergy with the
planned biodiversity creating an environment welcoming to additional species.
In contrast, a principal cause of genetic erosion has been found to be the replacement by
farmers of multiple local varieties and landraces for genetically uniform, high-yielding varieties
such as that of the replace of cacao nacional for cacao CCN-51(Harlan 1975; Brush, Taylor and
Bellon 1992). The adoption of these modern varieties has increased short term crop productivity
for some farmers, but the consequent loss of genetic resources has contributed to increased
vulnerability of farmers to environmental change, pest and pathogens. These problems have
exacerbated poverty and increased levels of food insecurity (Dasgupta 1995). This phenomenon
is also present in Ecuador where the farmers had been encouraged to replace their traditional
agoforestry cacao fields with high yielding monoculture systems (Bentley, Boa, and Stonehouse
2004). Indeed, the loss of diversity is an acute problem in Ecuador as it is included in the
6
world’s biodiversity hot spots, with a high concentration of threatened or endangered plants or
species live (Myers et al. 2000).
In addition to the environmental benefits, social and cultural benefits have shown to be
important in the planting decisions of smallholder farmers. Bechetti and Costantino (2008)
found that family welfare is very important to production decisions. They found that farmers
chose to participate in organic markets not just for the price advantage. They also participated in
these markets because of the additional welfare benefits that could be purchased with the
additional income but also are obtained as externalities from the production such as access
nutritious, safe food source. Furthermore, the additional food source provided by intercropping
of cash crops such as cacao with subsistence crops encourages the planting of various crops and
agroforestry production systems as occurs in the traditional Ecuadorian cacao production system.
Farmers recognize these benefits when choosing to invest their time in these cropping
systems to maximize monetary, social, and environmental benefits. This is the type of decision
framework that faces Ecuadorian cacao farmers as well as many smallholder producers
throughout the world. Barnum and Squire (1979) developed the household model to show how
all decisions of smallholder families are interrelated. Production and consumptions decisions are
not made independently. Agricultural production, schooling, migration and fertility choices, and
even the allocation of food among house-hold members, are thought to depend upon current or
future opportunity costs of time (Rosenzweig and Evenson 1977; Rosenzweig and Schultz
1982; Jacoby 1993; Skoufieas 1994; Le 2010).
The opportunity cost of time is a key articulating variable that is able to capture, both,
market and non-market benefits of productive activities, because it is a measure defined in terms
of utility, not economic profits. This is relevant because smallholders’ decisions in developing
countries are equally affected by market and non-market factors. For example, Arslan and Taylor
(2009) discovered that Mexican families’ choose to plant traditional maize instead of the hybrid
variety because of the extra utility received from their taste; even though the hybrid variety was
more productive and profitable. Furthermore, Indonesian farmers were found to be willing to
accept a price lower than full compensation for lost profit when growing cacao in a traditional
agroforestry system instead of the more productive modern system because of the additional
nonmarket ecological services provided in agroforests (Steffen-Dewenter et al.2007). Floridian
ranchers also prefer agroforerstry practices in spite of lower returns compared to more intensive
7
agriculture systems (Shrestha and Alavalpati 2003). Thus, to truly understand smallholder
farmers’ production decisions these nonmarket as well as market values must be considered.
Conceptual Framework to Value Biodiversity
One way in which farmers can receive incentives for in situ biodiversity conservation is through
receiving higher prices for their products, to partially cover the cost of producing those services.
The proliferation of fair trade, organic and other certification schemes have allowed farmers who
use traditional production systems to receive an additional monetary incentive to raise these
crops as they receive a price premium for their products. One weakness of standard economic
frameworks used to analyze the benefits and costs of specialty crops is that it generally includes
only monetary benefits. LeClair (2002, 2008) argued that the additional income farmers receive
would distort labor and product markets, by encouraging the household to produce more than the
efficient level. Hayes (2008) critiqued these conclusions about the price premium on the grounds
of labor market imperfections, but did not formalize his view. These authors base their analyses
on standard consumer-worker utility models, which do not take into account that commodity
producing households face multiple complex decisions in their producer-consumer-worker role.
These complexities not only yield standard economic frameworks inadequate for estimating the
price premium effects on producers’ labor and production behavior, but also completely ignore
the ecological externalities that arise from environmental standards.
To explain the impact environmental services provided by agroforestry systems have on
the production decisions of smallholder households, we propose a farm-household model that
includes the production decisions of the household and the associated potential biodiversity
nonmarket benefits linked to this production, in addition to the standard consumption dimension.
We focus on capturing the effect of planned biodiversity, which, as we explained earlier, is the
component of biodiversity that the farmer manages and which provides direct and indirect
benefits (see section two). We further allow for the presence of market imperfections, which are
prevalent in rural economies and are particularly important to explain smallholder producers’
economic behavior.1
1 Several authors have shown that when markets are imperfect or missing, production decisions become functions of
household characteristics and preferences (See Eswaran and Kotwal(1984) for the case of imperfect credit markets
or Carter and Yao (2004) for imperfect land rental markets). This situation is due to the fact that the farm-household
problem becomes non-separable, as decisions are based upon endogenous shadow prices, as opposed to exogenous
market prices.
8
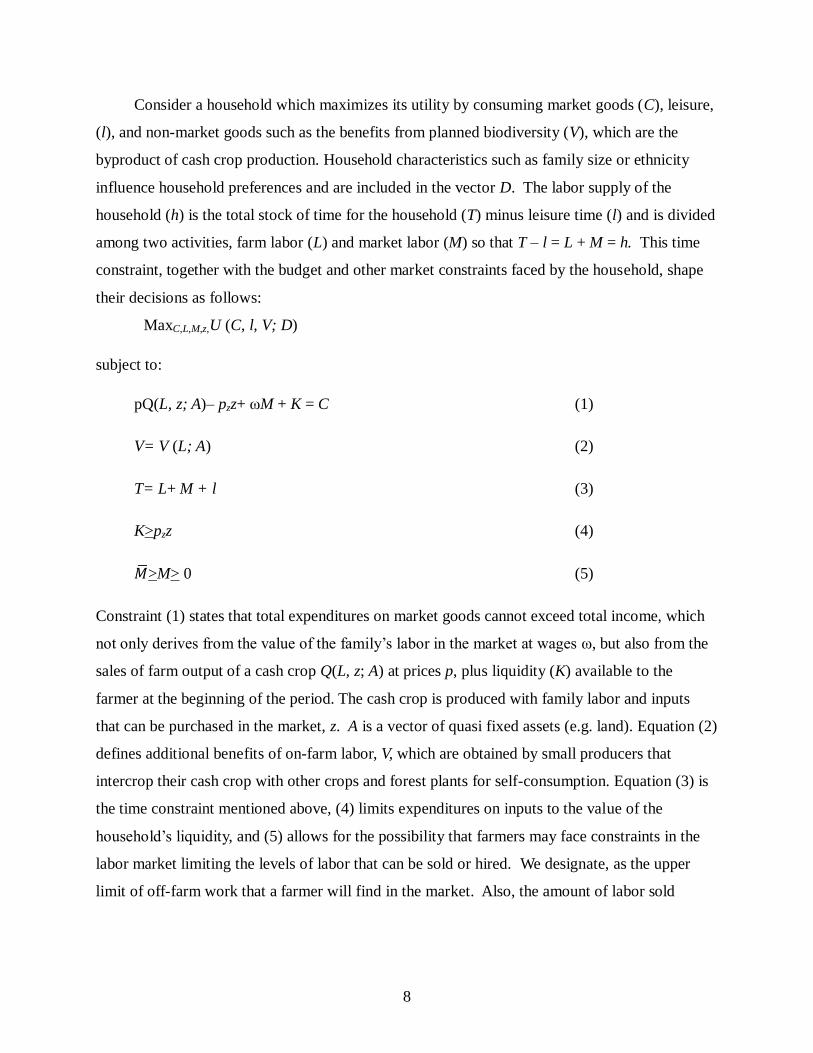
Consider a household which maximizes its utility by consuming market goods (C), leisure,
(l), and non-market goods such as the benefits from planned biodiversity (V), which are the
byproduct of cash crop production. Household characteristics such as family size or ethnicity
influence household preferences and are included in the vector D. The labor supply of the
household (h) is the total stock of time for the household (T) minus leisure time (l) and is divided
among two activities, farm labor (L) and market labor (M) so that T – l = L + M = h. This time
constraint, together with the budget and other market constraints faced by the household, shape
their decisions as follows:
MaxC,L,M,z,U (C, l, V; D)
subject to:
pQ(L, z; A)– pzz+ ωM + K = C (1)
V= V (L; A) (2)
T= L+ M + l (3)
K>pzz (4)
𝑀 >M> 0 (5)
Constraint (1) states that total expenditures on market goods cannot exceed total income, which
not only derives from the value of the family’s labor in the market at wages ω, but also from the
sales of farm output of a cash crop Q(L, z; A) at prices p, plus liquidity (K) available to the
farmer at the beginning of the period. The cash crop is produced with family labor and inputs
that can be purchased in the market, z. A is a vector of quasi fixed assets (e.g. land). Equation (2)
defines additional benefits of on-farm labor, V, which are obtained by small producers that
intercrop their cash crop with other crops and forest plants for self-consumption. Equation (3) is
the time constraint mentioned above, (4) limits expenditures on inputs to the value of the
household’s liquidity, and (5) allows for the possibility that farmers may face constraints in the
labor market limiting the levels of labor that can be sold or hired. We designate, as the upper
limit of off-farm work that a farmer will find in the market. Also, the amount of labor sold
9
cannot be negative, but may be zero. The production and utility function are assumed to be
increasing, strictly concave and continuously differentiable in their arguments.2
In sum, we assume that small cacao farmers face different constraints which limit the
amount of utility they can receive and shape their production decisions. In particular, the
standard logic that a price premium received for a product directly increases farmers´supply of
labor to produce more of that good (LeClair 2002), may not hold here, since these households
face constraints and have preferences that determine limitations to and trade-offs of increasing
some product amount.
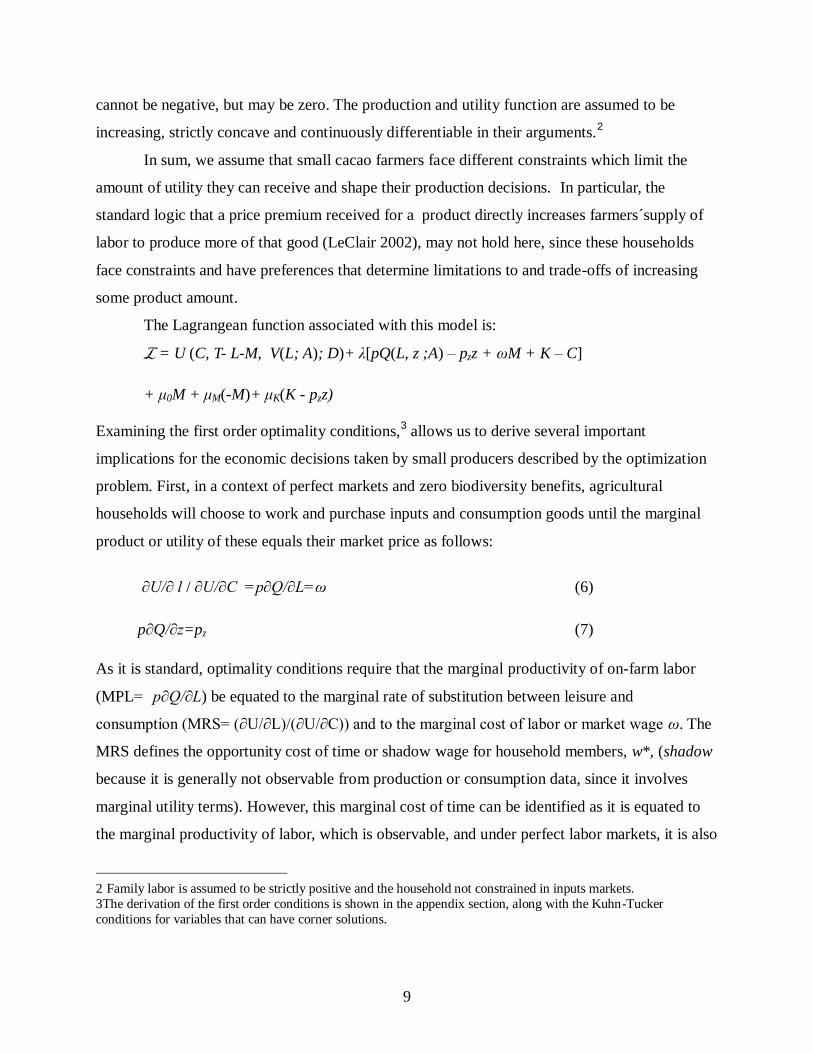
The Lagrangean function associated with this model is:
L = U (C, T- L-M, V(L; A); D)+ λ[pQ(L, z ;A) – pzz + ωM + K – C]
+ μ0M + μM(-M)+ μK(K - pzz)
Examining the first order optimality conditions,3 allows us to derive several important
implications for the economic decisions taken by small producers described by the optimization
problem. First, in a context of perfect markets and zero biodiversity benefits, agricultural
households will choose to work and purchase inputs and consumption goods until the marginal
product or utility of these equals their market price as follows:
∂U/∂ l / ∂U/∂C =p∂Q/∂L=ω (6)
p∂Q/∂z=pz (7)
As it is standard, optimality conditions require that the marginal productivity of on-farm labor
(MPL= p∂Q/∂L) be equated to the marginal rate of substitution between leisure and
consumption (MRS= (∂U/∂L)/(∂U/∂C)) and to the marginal cost of labor or market wage ω. The
MRS defines the opportunity cost of time or shadow wage for household members, w*, (shadow
because it is generally not observable from production or consumption data, since it involves
marginal utility terms). However, this marginal cost of time can be identified as it is equated to
the marginal productivity of labor, which is observable, and under perfect labor markets, it is also
2 Family labor is assumed to be strictly positive and the household not constrained in inputs markets. 3The derivation of the first order conditions is shown in the appendix section, along with the Kuhn-Tucker
conditions for variables that can have corner solutions.
10
equated to the market wage. Similarly, the marginal productivity of other inputs should be
equated to their marginal cost, which is their market price.
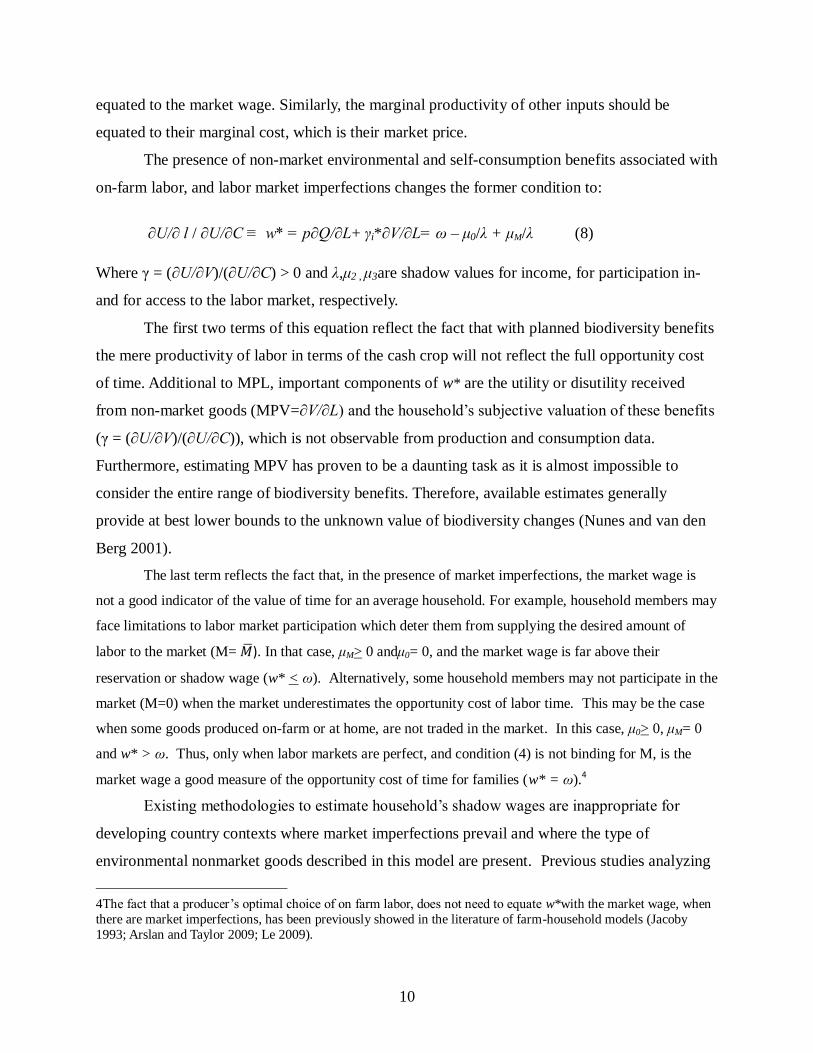
The presence of non-market environmental and self-consumption benefits associated with
on-farm labor, and labor market imperfections changes the former condition to:
∂U/∂ l / ∂U/∂C ≡ w* = p∂Q/∂L+ γi*∂V/∂L= ω – μ0/λ + μM/λ (8)
Where γ = (∂U/∂V)/(∂U/∂C) > 0 and λ,μ2 , μ3are shadow values for income, for participation in-
and for access to the labor market, respectively.
The first two terms of this equation reflect the fact that with planned biodiversity benefits
the mere productivity of labor in terms of the cash crop will not reflect the full opportunity cost
of time. Additional to MPL, important components of w* are the utility or disutility received
from non-market goods (MPV=∂V/∂L) and the household’s subjective valuation of these benefits
(γ = (∂U/∂V)/(∂U/∂C)), which is not observable from production and consumption data.
Furthermore, estimating MPV has proven to be a daunting task as it is almost impossible to
consider the entire range of biodiversity benefits. Therefore, available estimates generally
provide at best lower bounds to the unknown value of biodiversity changes (Nunes and van den
Berg 2001).
The last term reflects the fact that, in the presence of market imperfections, the market wage is
not a good indicator of the value of time for an average household. For example, household members may
face limitations to labor market participation which deter them from supplying the desired amount of
labor to the market (M= 𝑀 ). In that case, μM> 0 andμ0= 0, and the market wage is far above their
reservation or shadow wage (w* < ω). Alternatively, some household members may not participate in the
market (M=0) when the market underestimates the opportunity cost of labor time. This may be the case
when some goods produced on-farm or at home, are not traded in the market. In this case, μ0> 0, μM= 0
and w* > ω. Thus, only when labor markets are perfect, and condition (4) is not binding for M, is the
market wage a good measure of the opportunity cost of time for families (w* = ω).4
Existing methodologies to estimate household’s shadow wages are inappropriate for
developing country contexts where market imperfections prevail and where the type of
environmental nonmarket goods described in this model are present. Previous studies analyzing
4The fact that a producer’s optimal choice of on farm labor, does not need to equate w*with the market wage, when
there are market imperfections, has been previously showed in the literature of farm-household models (Jacoby
1993; Arslan and Taylor 2009; Le 2009).
11
developing country contexts have relied on the equalization of the shadow wage with the MPL to
identify the cost of time for households who do not participate in the market, yet none of these
models has analyzed environmental effects of production. Our model explains why economic
models neglect the analysis of the environmental component: it is an impediment to point-
identify the shadow wage estimates and to perform labor supply estimations.
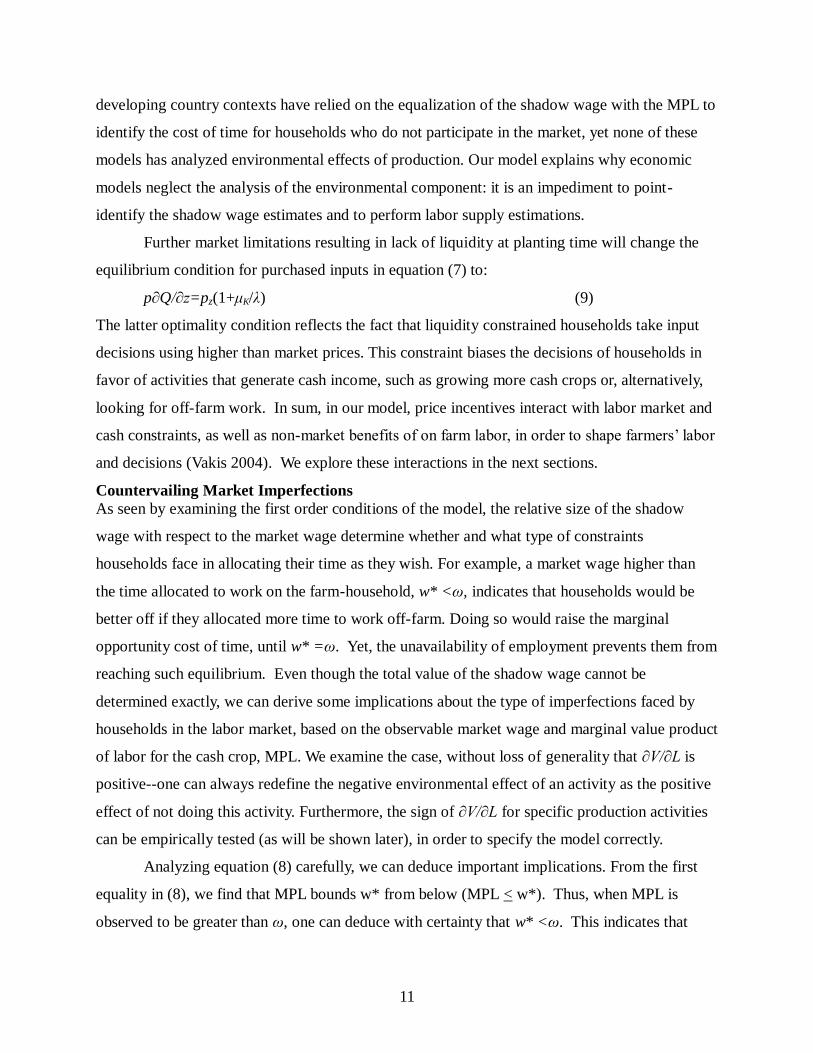
Further market limitations resulting in lack of liquidity at planting time will change the
equilibrium condition for purchased inputs in equation (7) to:
p∂Q/∂z=pz(1+μK/λ) (9)
The latter optimality condition reflects the fact that liquidity constrained households take input
decisions using higher than market prices. This constraint biases the decisions of households in
favor of activities that generate cash income, such as growing more cash crops or, alternatively,
looking for off-farm work. In sum, in our model, price incentives interact with labor market and
cash constraints, as well as non-market benefits of on farm labor, in order to shape farmers’ labor
and decisions (Vakis 2004). We explore these interactions in the next sections.
Countervailing Market Imperfections
As seen by examining the first order conditions of the model, the relative size of the shadow
wage with respect to the market wage determine whether and what type of constraints
households face in allocating their time as they wish. For example, a market wage higher than
the time allocated to work on the farm-household, w* <ω, indicates that households would be
better off if they allocated more time to work off-farm. Doing so would raise the marginal
opportunity cost of time, until w* =ω. Yet, the unavailability of employment prevents them from
reaching such equilibrium. Even though the total value of the shadow wage cannot be
determined exactly, we can derive some implications about the type of imperfections faced by
households in the labor market, based on the observable market wage and marginal value product
of labor for the cash crop, MPL. We examine the case, without loss of generality that ∂V/∂L is
positive--one can always redefine the negative environmental effect of an activity as the positive
effect of not doing this activity. Furthermore, the sign of ∂V/∂L for specific production activities
can be empirically tested (as will be shown later), in order to specify the model correctly.
Analyzing equation (8) carefully, we can deduce important implications. From the first
equality in (8), we find that MPL bounds w* from below (MPL < w*). Thus, when MPL is
observed to be greater than ω, one can deduce with certainty that w* <ω. This indicates that
12
households face under- or unemployment. To the contrary, the case where MPL is observed to be
lower than the market wage calls for additional information about the size of the non-market
benefits from on-farm labor, and the valuation by households of these benefits, in order to know
whether a household is constrained in its ability to allocate labor across activities or not.
Specifically, we can separate two different cases:
i. γ*∂V/∂Lf> (ω – MVPL) => w* > ω
Market undervalues opportunity cost of time
ii. γ*∂V/∂Lf< (ω – MVPL) => w* < ω
Household faces unemployment
These equations show that the value of environmental benefits associated with planned
biodiversity can be seen as a countervailing effect to labor market constraints. These non-market
benefits help offset the difference between market and shadow wages; if large enough may fully
change the relative value of the opportunity cost of on-farm work. In other words, lack of labor
market participation could be explained by a growth in productivity due to biodiversity which
increases the shadow wage high enough so that higher benefits of on farm work exist relative to
market work.
The regime to which the households in a specific context belong can then be explored in
the estimation. Although the term reflecting marginal side products of the labor used in
production, ∂V/∂L, is difficult to measure because of both the multidimensionality of V
(composed of self-consumption, medicinal plants, shade for the cacao, education of children,
continuation of cultural identity) and the missing markets for some of its components (such as
cultural or traditional values), a proxy measure can be used (see the estimation section below),
which allows for the estimation of a second lower bound for the shadow wage (a lower bound
that lies between MPL and the real w*).
Application to the Ecuadorian Cacao Market
So far we have treated all types of on farm work as homogeneous in terms of the opportunity
cost of time that they entail. Yet examining the terms that enter the calculation of w*, (p∂Q/∂L+
γi*∂V/∂L), shows that the labor invested in different types of crops or crop varieties may have
systematically different shadow wages when: a) the crops are sold in different markets or at
different prices, b) the marginal productivity of labor differs consistently across the crops or crop
varieties, and c) the planned biodiversity or degree to which crops are intercropped differ
13
systematically. The production of cacao Ecuador provides a particularly relevant example of
how differences in the cacao production systems allow for these differences in the shadow wage
for traditional and modern production methods.
As noted above, the Ecuadorian cacao industry consists of two varieties, cacao nacional
raised in traditional agroforestry systems and cacao CCN-51 grown using monoculture
production methods. In addition, there are two principle markets for cacao in Ecuador, the
commercial market where cacao nacional and cacao CCN-51 can be sold and the specialty
market that pays a premium for cacao nacional for it flavor characteristics. However, the main
distinction between these two cropping systems is the difference in labor productivity given other
inputs of both the production of cacao and the abundance of planned and associated biodiversity
with the additional social and ecological benefits that accompany biodiversity. Thus, Ecuadorian
cacao production can be described using three distinct shadow wages. The shadow wage for
each market can be written using the following equations where Q2 represents the quantity
produced using the modern cacao CCN-51 production system with Q2/∂L> ∂Q1/∂L and
*∂V2/∂L<*∂V1/∂L. For the two markets we designate pc for the conventional market and pS=(pc+
a) for the specialty market where a represents the premium earned in the specialty market for
cacao nacional.
Conventional market for cacao nacional: w1* = pc∂Q1/∂L+ γ*∂V1/∂L
Conventional market for cacaco CCN-51 : w2* = pc∂Q2/∂L & ∂Q2/∂L> ∂Q1/∂L
Specialty market for cacao nacional: w3*= (pc+ a) ∂Q1/∂L+ γ*∂V1/∂L
The difference in the three shadow wages is that the inclusion of the nonmarket benefits
for the cacao nacional production, which is not included for CCN-51 production. The first
observation that can be made is that cacao nacional farmers will clearly prefer to switch to the
specialty market if they have the option. The marginal value product from labor is much larger
for cacao CCN-51. The additional nonmarket benefits as explained about may make the cacao
nacional markets more attractive. In addition, liquidity constraints could have a large impact on
these household decisions. A household that does not have enough liquidity, cash income, to
meet its needs would desire to switch production to cacao CCN-51 because of its higher profits.
So, without considering the nonmarket biodiversity/environmental benefits a liquidity
constrained household would be expected to prefer cacao CCN-51. When including these
14
benefits, the household would prefer to exclusively raise cacao nacional if it were not liquidity
constrained and diversity between the two varieties if where liquidity constrained.
Another practice that is used in the literature to simplify the analysis is the normalization
of the market price p, by dividing all variables expressed in dollar terms by an index that reflects
the market price of produced goods. The problem with this strategy in a setting of imperfect or
segmented markets is that farmers often face heterogeneous prices, depending on whether they
have access to markets or not. In our specific case, this type of imperfection arises because of the
existence of specialty markets with limited demand. Thus, separate shadow wages are estimated
depending on whether farmers have access to specialty markets or not.
If the shadow wage is larger than the market wage, we can clearly conclude the household
will wish to expand production as the additional benefit from the non market goods will make
this option more attractive. However, the household likely faces a liquidity constraint in that it
does not have the resources to purchase the necessary inputs to complete this expansion and/or
faces a segmented market where family labor is more desired than outside labor but family labor
is constrained by other household activities. If this estimation of the shadow wage is less than
the market wage, the household would use the environmental nonmarket goods to offset at least
some if not all of the lost consumption from underemployment. If the nonmarket benefits are
large enough to offset this difference, this household would expand production. This action
cannot be determined since the value of the nonmarket goods is unknown. So, only a lower
bound of the shadow wage can be determined.
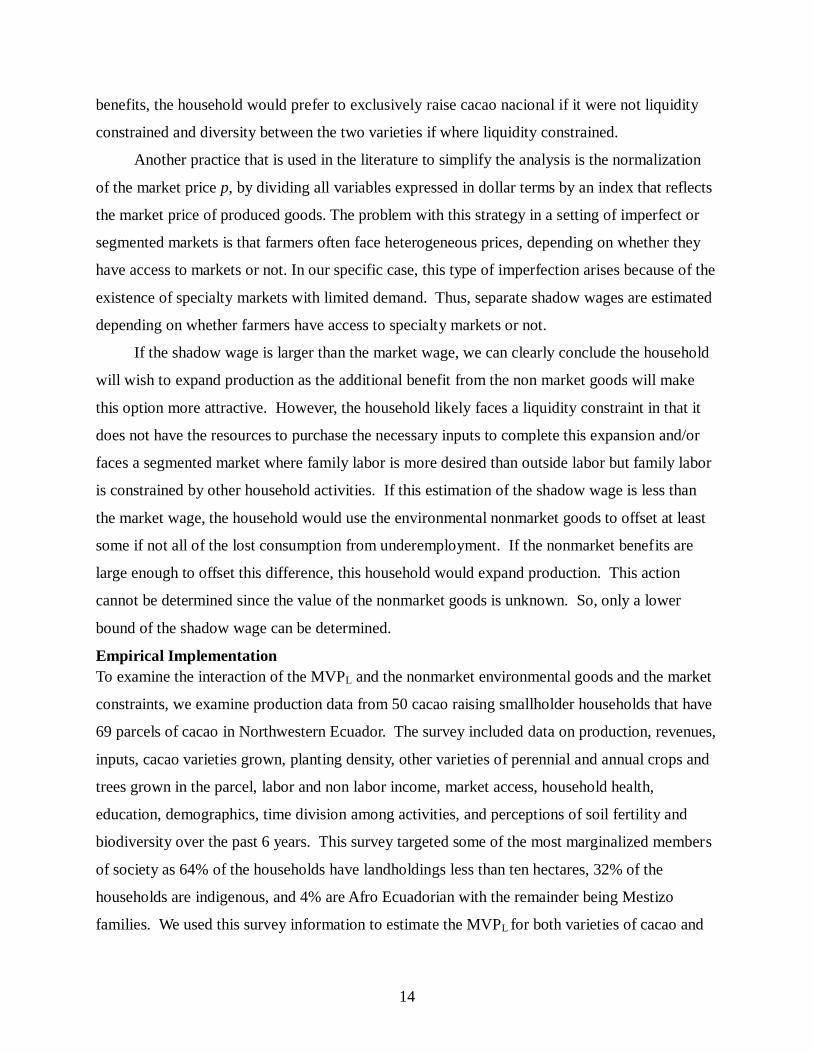
Empirical Implementation
To examine the interaction of the MVPL and the nonmarket environmental goods and the market
constraints, we examine production data from 50 cacao raising smallholder households that have
69 parcels of cacao in Northwestern Ecuador. The survey included data on production, revenues,
inputs, cacao varieties grown, planting density, other varieties of perennial and annual crops and
trees grown in the parcel, labor and non labor income, market access, household health,
education, demographics, time division among activities, and perceptions of soil fertility and
biodiversity over the past 6 years. This survey targeted some of the most marginalized members
of society as 64% of the households have landholdings less than ten hectares, 32% of the
households are indigenous, and 4% are Afro Ecuadorian with the remainder being Mestizo
families. We used this survey information to estimate the MVPL for both varieties of cacao and
15
used the market value of other agricultural goods planted in the cacao agroforest as a way to
estimate some of the additional values the household captures by raising cacao nacional
agroforests to make an estimate of the shadow wage for each of the three markets.
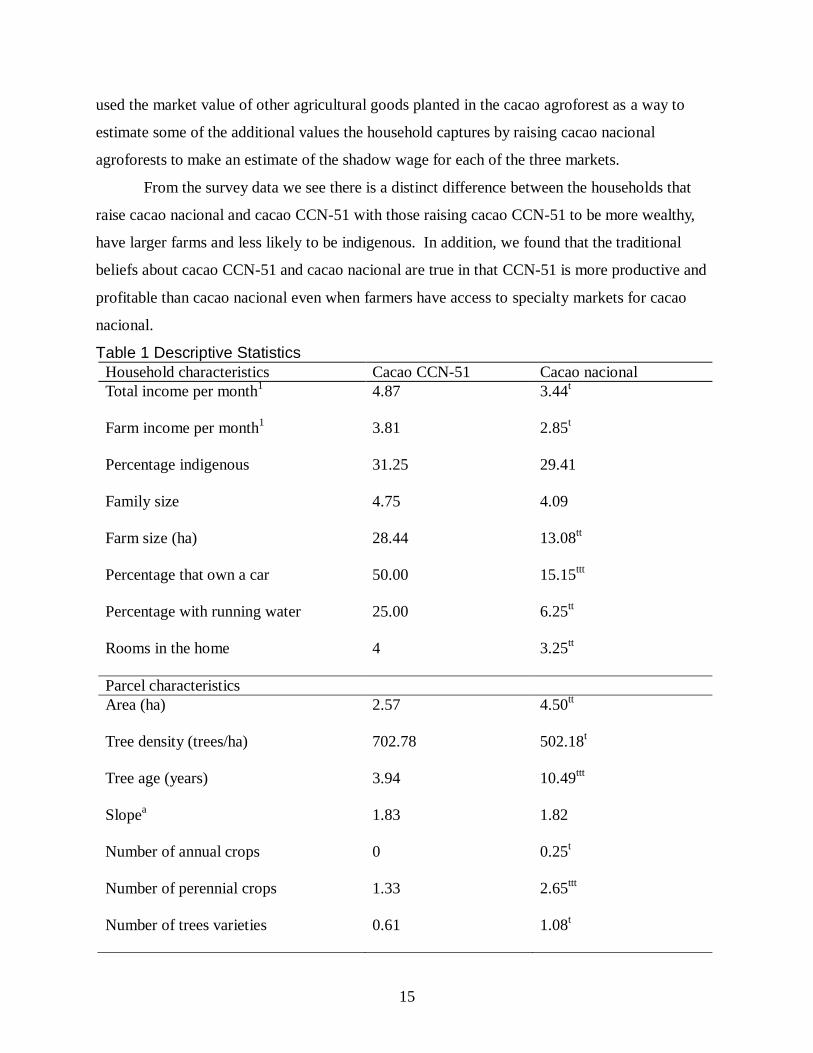
From the survey data we see there is a distinct difference between the households that
raise cacao nacional and cacao CCN-51 with those raising cacao CCN-51 to be more wealthy,
have larger farms and less likely to be indigenous. In addition, we found that the traditional
beliefs about cacao CCN-51 and cacao nacional are true in that CCN-51 is more productive and
profitable than cacao nacional even when farmers have access to specialty markets for cacao
nacional.
Table 1 Descriptive Statistics
Household characteristics Cacao CCN-51 Cacao nacional
Total income per month1
4.87
3.44t
Farm income per month1
3.81
2.85t
Percentage indigenous
31.25 29.41
Family size
4.75
4.09
Farm size (ha)
28.44 13.08tt
Percentage that own a car
50.00
15.15ttt
Percentage with running water
25.00
6.25tt
Rooms in the home
4 3.25tt
Parcel characteristics
Area (ha)
2.57 4.50tt
Tree density (trees/ha)
702.78
502.18t
Tree age (years)
3.94
10.49ttt
Slopea
1.83
1.82
Number of annual crops 0 0.25t
Number of perennial crops
1.33
2.65ttt
Number of trees varieties
0.61 1.08t
16
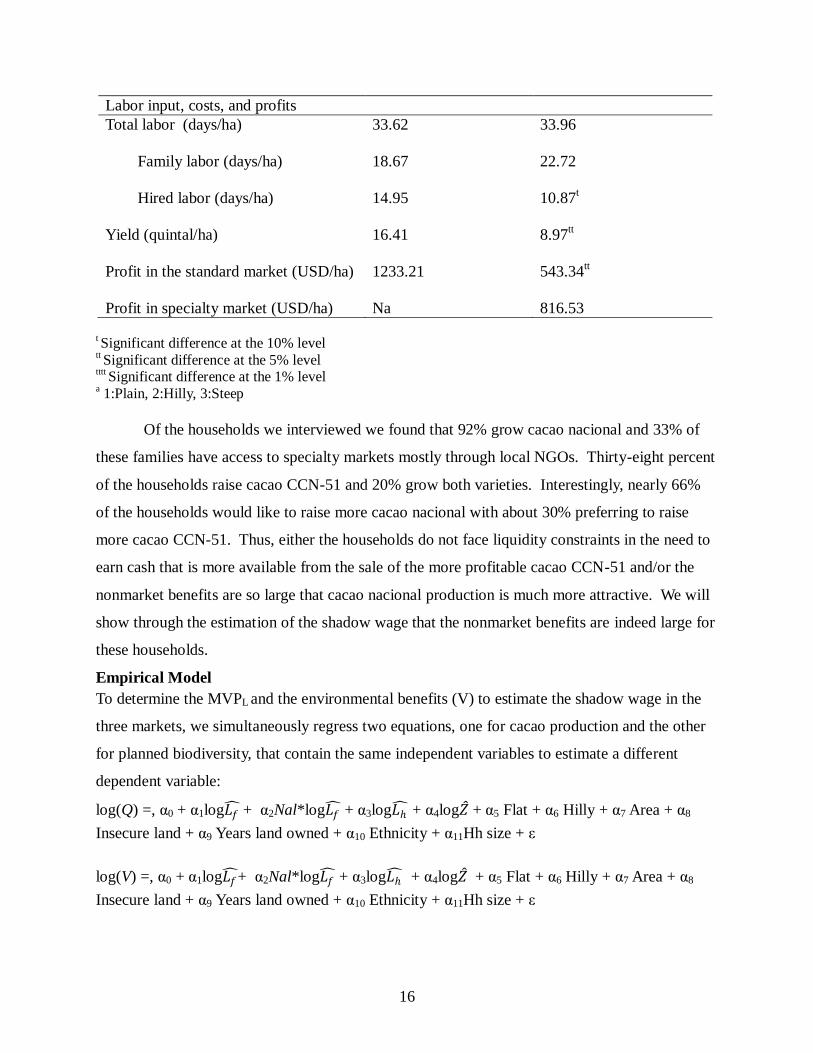
Labor input, costs, and profits
Total labor (days/ha)
33.62 33.96
Family labor (days/ha)
18.67 22.72
Hired labor (days/ha)
14.95 10.87t
Yield (quintal/ha) 16.41
8.97tt
Profit in the standard market (USD/ha)
1233.21
543.34tt
Profit in specialty market (USD/ha) Na 816.53
t Significant difference at the 10% level
tt Significant difference at the 5% level
tttt Significant difference at the 1% level
a 1:Plain, 2:Hilly, 3:Steep
Of the households we interviewed we found that 92% grow cacao nacional and 33% of
these families have access to specialty markets mostly through local NGOs. Thirty-eight percent
of the households raise cacao CCN-51 and 20% grow both varieties. Interestingly, nearly 66%
of the households would like to raise more cacao nacional with about 30% preferring to raise
more cacao CCN-51. Thus, either the households do not face liquidity constraints in the need to
earn cash that is more available from the sale of the more profitable cacao CCN-51 and/or the
nonmarket benefits are so large that cacao nacional production is much more attractive. We will
show through the estimation of the shadow wage that the nonmarket benefits are indeed large for
these households.
Empirical Model
To determine the MVPL and the environmental benefits (V) to estimate the shadow wage in the
three markets, we simultaneously regress two equations, one for cacao production and the other
for planned biodiversity, that contain the same independent variables to estimate a different
dependent variable:
log(Q) =, α0 + α1log𝐿𝑓 + α2Nal*log𝐿𝑓
+ α3log𝐿ℎ + α4log𝑍 + α5 Flat + α6 Hilly + α7 Area + α8
Insecure land + α9 Years land owned + α10 Ethnicity + α11Hh size + ε
log(V) =, α0 + α1log𝐿𝑓 + α2Nal*log𝐿𝑓
+ α3log𝐿ℎ + α4log𝑍 + α5 Flat + α6 Hilly + α7 Area + α8
Insecure land + α9 Years land owned + α10 Ethnicity + α11Hh size + ε
17
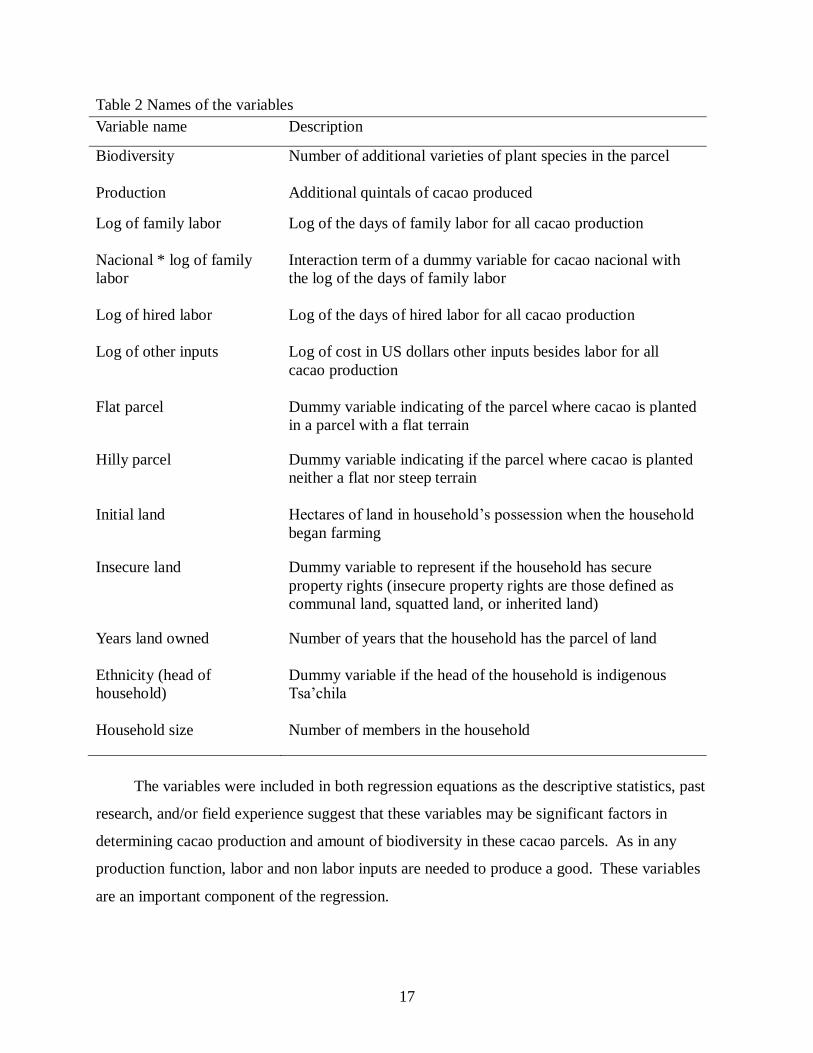
Table 2 Names of the variables
Variable name Description
Biodiversity Number of additional varieties of plant species in the parcel
Production Additional quintals of cacao produced
Log of family labor
Log of the days of family labor for all cacao production
Nacional * log of family
labor
Interaction term of a dummy variable for cacao nacional with
the log of the days of family labor
Log of hired labor
Log of the days of hired labor for all cacao production
Log of other inputs
Log of cost in US dollars other inputs besides labor for all
cacao production
Flat parcel
Dummy variable indicating of the parcel where cacao is planted
in a parcel with a flat terrain
Hilly parcel
Dummy variable indicating if the parcel where cacao is planted
neither a flat nor steep terrain
Initial land
Hectares of land in household’s possession when the household
began farming
Insecure land
Dummy variable to represent if the household has secure
property rights (insecure property rights are those defined as
communal land, squatted land, or inherited land)
Years land owned
Number of years that the household has the parcel of land
Ethnicity (head of
household)
Dummy variable if the head of the household is indigenous
Tsa’chila
Household size Number of members in the household
The variables were included in both regression equations as the descriptive statistics, past
research, and/or field experience suggest that these variables may be significant factors in
determining cacao production and amount of biodiversity in these cacao parcels. As in any
production function, labor and non labor inputs are needed to produce a good. These variables
are an important component of the regression.
18
Labor is divided into family and hired labor in order to examine the effect of the shadow
wage and to determine the substitutability of family labor and hired labor. If hired labor and
family labor have the same MPL which the coefficients represent, then they would be perfect
substitutes and in a perfect market the MPL for both family and hired labor would equal the
wage. All the labor coefficients are expected to be positive values for both equations as more
labor would lead to higher production. They would not be positive if the household was at the
point of maximum output with diminishing marginal production, which would be very unlikely.
A similar conclusion can be made about the variable for the other inputs. This coefficient would
be expected to be positive for production although it might not be for the biodiversity equation.
The production of cacao CCN-51 is more input intensive than cacao nacional as shown by the
survey results. Since cacao nacional is produced on more biodiverse parcels than cacao CCN-51,
a negative correlation would be expected to between input use and biodiversity.
The labor value for cacao nacional is included in order to determine if a difference exists in
the effect of the labor applied to cacao nacional on biodiversity and on production as compared
to that of the other labor variables. Since cacao nacional production systems are more biodiverse
than CCN-51 cropping systems, the coefficient of family labor in cacao nacional production in
the biodiversity regression would be expected to be larger than the coefficient for family labor
for all cacao production. As cacao CCN-51 has higher yields than cacao nacional, the family
labor and hired labor coefficients would be expected to be larger than the coefficient for family
labor for cacao nacional alone in the production regression.
The variables flat and hilly are included in the regressions. The steep slopes would be
expected to be the most biodiverse parcels. Farmers tend to plant the flat areas first as they are
easier to maintain and harvest. To prevent erosion the farmers in this area often leave the
steepest slopes forested as the steep areas are often on stream and river banks. Thus, the steeper
areas would be more likely to be forested and thus more biodiverse than other areas. The
coefficient for flat would be expected to be a large negative number while the coefficient for
hilly will be a smaller negative number.
The variable for insecure land rights definitely would be expected to have an impact on the
biodiversity regression. Households who fear that their property rights may be removed would
only invest in crops with short harvests such as annual crops instead of trees, which do not
provide revenue for several years. Thus, the insecure land rights variable is expected to have a
19
negative coefficient in the biodiversity equation. The variable for the initial land size is a
measure of the wealth of the household. A household’s wealth would determine its ability to
invest in its farm in order to increase production. A positive coefficient would be expected for
this variable in the production equation. The length of time that someone owned property would
influence the biodiversity equation. The longer a household has owned land the more it would
be expected to invest in trees and other crops with long term return. So, they would be expected
to have larger biodiversity coefficients. Since cacao becomes more productive over time, the
coefficient for the length of ownership of the parcel would be expected to be positive for the
production regression.
Ethnicity is an important variable in the equation. This variable is included as a dummy
variable distinguishing between those households that do and do not have a member of the
indigenous Tsa’chila nation as its head. There is a significant population of Tsa’chila who farm
large areas of the region. The Tsa’chila have a distinct culture from the rest of the population.
They believe that all plants and animals have spirits and need to be protected. This belief would
suggest that they would be more likely to protect the various varieties of plants and animals on
their land. In addition, they use many medicinal plants that they grow in their fields which
would add the diversity of plants in their fields. So, the ethnicity coefficient in the biodiversity
regression would be expected to be a positive but may be negative in the production regression
as Tsa’chila farmers do not have as much training in modern agricultural practices. Finally, the
household size variable would be expected to be an important variable in the equations. The
coefficient for these variables would be expected to be positive for both the biodiversity
regression and the production regression as the household would need to produce more to
provide for the needs of additional household members and would be more likely to plant
additional crops in its plots to provide for its consumption needs.
As is standard in the estimation of production functions, we include several instrumental
variables (IVs) to correct for the endogeneity of the labor and other input variables. These IVs
include the education level and age of the head of the household, the number of males and
females with more than 12 years of age, and the price of inputs including chemical and organic
fertilizer, insecticide and herbicide.
20
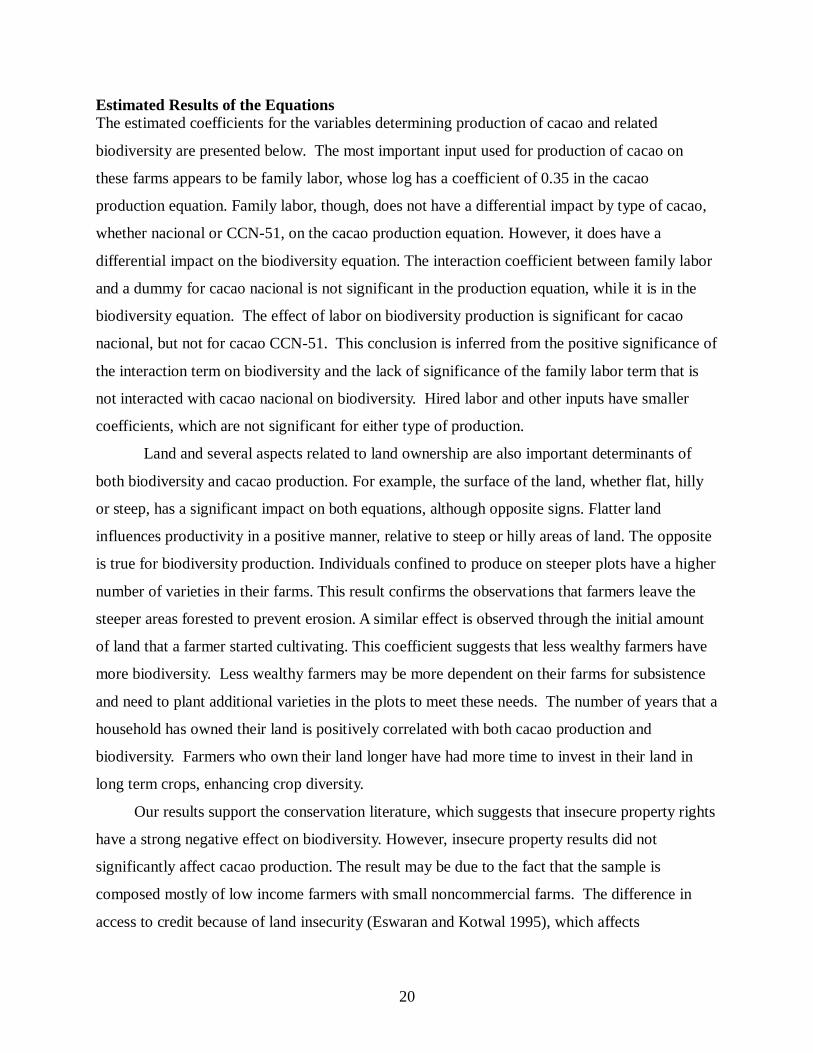
Estimated Results of the Equations
The estimated coefficients for the variables determining production of cacao and related
biodiversity are presented below. The most important input used for production of cacao on
these farms appears to be family labor, whose log has a coefficient of 0.35 in the cacao
production equation. Family labor, though, does not have a differential impact by type of cacao,
whether nacional or CCN-51, on the cacao production equation. However, it does have a
differential impact on the biodiversity equation. The interaction coefficient between family labor
and a dummy for cacao nacional is not significant in the production equation, while it is in the
biodiversity equation. The effect of labor on biodiversity production is significant for cacao
nacional, but not for cacao CCN-51. This conclusion is inferred from the positive significance of
the interaction term on biodiversity and the lack of significance of the family labor term that is
not interacted with cacao nacional on biodiversity. Hired labor and other inputs have smaller
coefficients, which are not significant for either type of production.
Land and several aspects related to land ownership are also important determinants of
both biodiversity and cacao production. For example, the surface of the land, whether flat, hilly
or steep, has a significant impact on both equations, although opposite signs. Flatter land
influences productivity in a positive manner, relative to steep or hilly areas of land. The opposite
is true for biodiversity production. Individuals confined to produce on steeper plots have a higher
number of varieties in their farms. This result confirms the observations that farmers leave the
steeper areas forested to prevent erosion. A similar effect is observed through the initial amount
of land that a farmer started cultivating. This coefficient suggests that less wealthy farmers have
more biodiversity. Less wealthy farmers may be more dependent on their farms for subsistence
and need to plant additional varieties in the plots to meet these needs. The number of years that a
household has owned their land is positively correlated with both cacao production and
biodiversity. Farmers who own their land longer have had more time to invest in their land in
long term crops, enhancing crop diversity.
Our results support the conservation literature, which suggests that insecure property rights
have a strong negative effect on biodiversity. However, insecure property results did not
significantly affect cacao production. The result may be due to the fact that the sample is
composed mostly of low income farmers with small noncommercial farms. The difference in
access to credit because of land insecurity (Eswaran and Kotwal 1995), which affects
21
productivity, is minimal relative to other farmers with land title. Those households with land title
have very little extensions of land. The lack of land for collateral would also limit these farmers
access to credit.
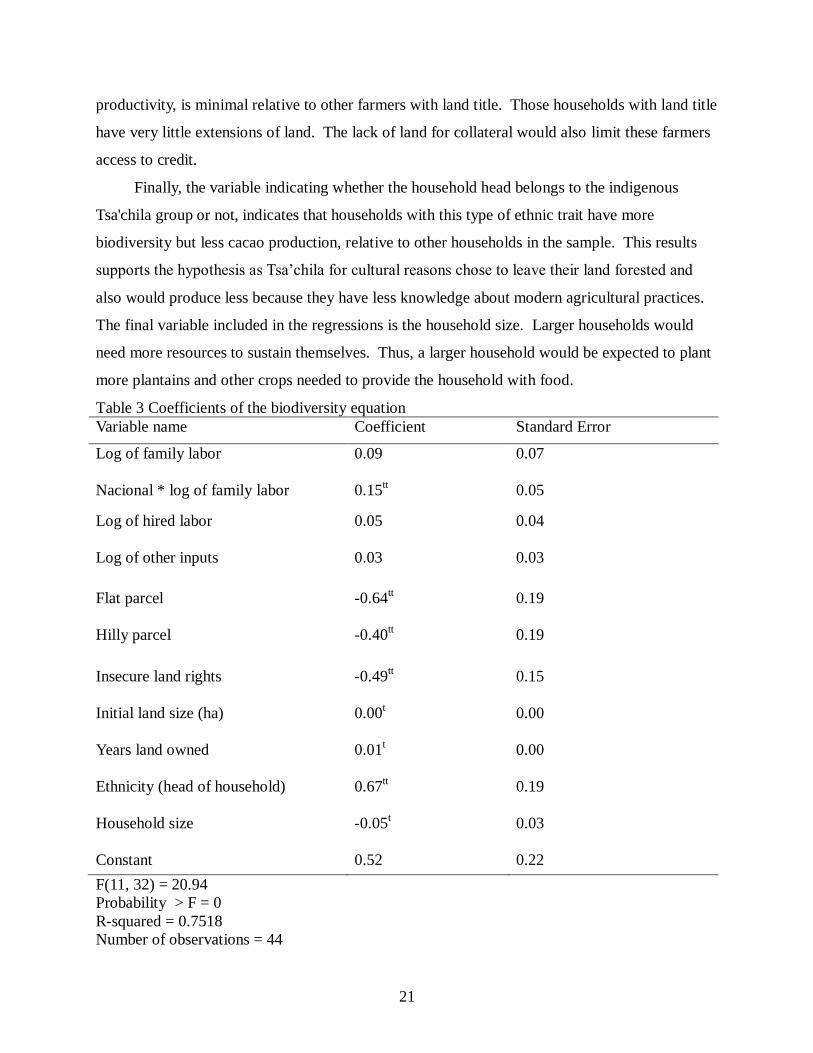
Finally, the variable indicating whether the household head belongs to the indigenous
Tsa'chila group or not, indicates that households with this type of ethnic trait have more
biodiversity but less cacao production, relative to other households in the sample. This results
supports the hypothesis as Tsa’chila for cultural reasons chose to leave their land forested and
also would produce less because they have less knowledge about modern agricultural practices.
The final variable included in the regressions is the household size. Larger households would
need more resources to sustain themselves. Thus, a larger household would be expected to plant
more plantains and other crops needed to provide the household with food.
Table 3 Coefficients of the biodiversity equation
Variable name Coefficient Standard Error
Log of family labor
0.09 0.07
Nacional * log of family labor 0.15tt 0.05
Log of hired labor
0.05 0.04
Log of other inputs
0.03 0.03
Flat parcel
-0.64tt 0.19
Hilly parcel
-0.40tt 0.19
Insecure land rights
-0.49tt 0.15
Initial land size (ha)
0.00t 0.00
Years land owned
0.01t 0.00
Ethnicity (head of household)
0.67tt 0.19
Household size
-0.05t 0.03
Constant 0.52 0.22
F(11, 32) = 20.94
Probability > F = 0
R-squared = 0.7518
Number of observations = 44
22
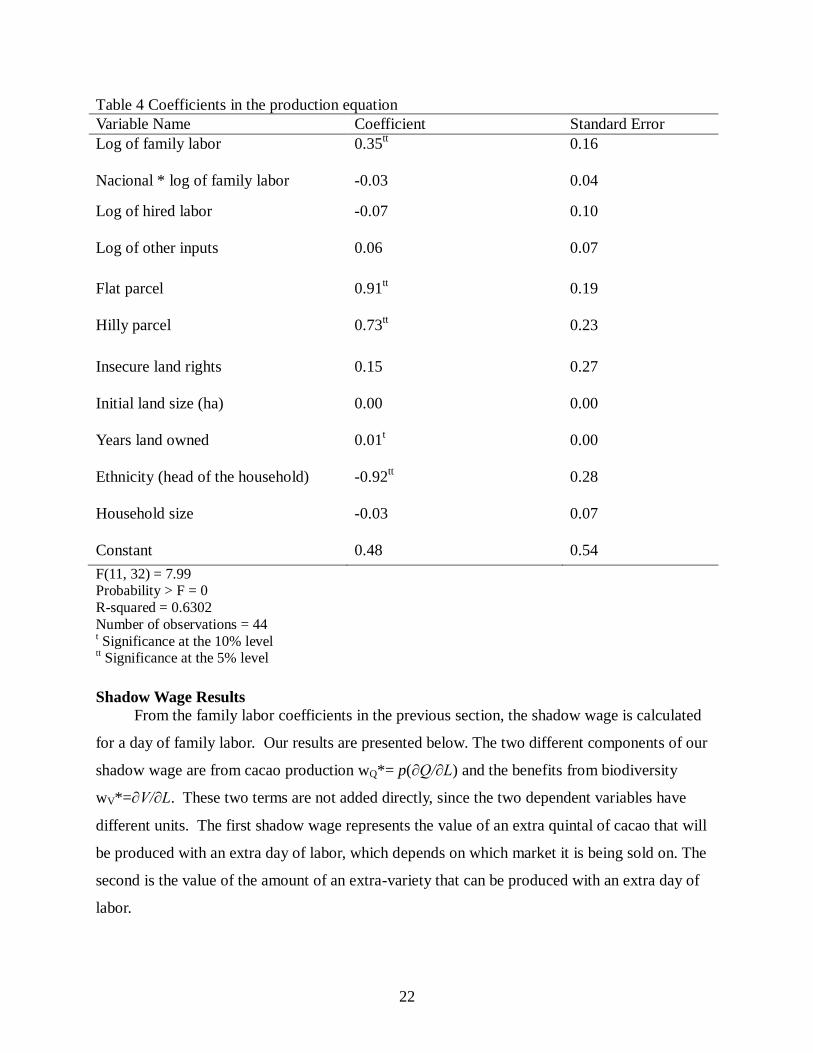
Table 4 Coefficients in the production equation
Variable Name Coefficient Standard Error
Log of family labor
0.35tt 0.16
Nacional * log of family labor -0.03 0.04
Log of hired labor
-0.07 0.10
Log of other inputs
0.06 0.07
Flat parcel
0.91tt 0.19
Hilly parcel
0.73tt 0.23
Insecure land rights
0.15 0.27
Initial land size (ha)
0.00 0.00
Years land owned
0.01t 0.00
Ethnicity (head of the household)
-0.92tt 0.28
Household size
-0.03 0.07
Constant 0.48 0.54
F(11, 32) = 7.99 Probability > F = 0
R-squared = 0.6302
Number of observations = 44 t Significance at the 10% level
tt Significance at the 5% level
Shadow Wage Results
From the family labor coefficients in the previous section, the shadow wage is calculated
for a day of family labor. Our results are presented below. The two different components of our
shadow wage are from cacao production wQ*= p(∂Q/∂L) and the benefits from biodiversity
wV*=∂V/∂L. These two terms are not added directly, since the two dependent variables have
different units. The first shadow wage represents the value of an extra quintal of cacao that will
be produced with an extra day of labor, which depends on which market it is being sold on. The
second is the value of the amount of an extra-variety that can be produced with an extra day of
labor.
23
The value of biodiversity or of adding an extra variety consists of multiple market and
nonmarket components. Some of these, such as self-consumption or production of substitutes for
medicinal plants may be easier to estimate; but others, such as ornamental or ritual use, are at
best difficult to estimate. In this sense, the value of biodiversity is ―hypothetical‖. However, a
lower bound can only be created for this value based on the market price of goods for self-
consumption, which will apply for specific cases. For example, if cacao nacional is intercropped
with cassava, producing 50 quintals per intercropped hectare, at 7 U.S. dollars per quintal, the
marketable MPL for this variety would be .49. The total shadow wage of intercropped cacao
would be about 3 U.S. dollars higher. If cacao nacional is intercropped with oranges, the shadow
wage would be at least 1.10 U.S. dollars higher (for 4000 Units/ha at 0.04 U.S. dollars per unit).
Added to this shadow wage would be benefits like shade, soil enhancement, ornamental and
cultural value, medicinal and ritual uses, etc.
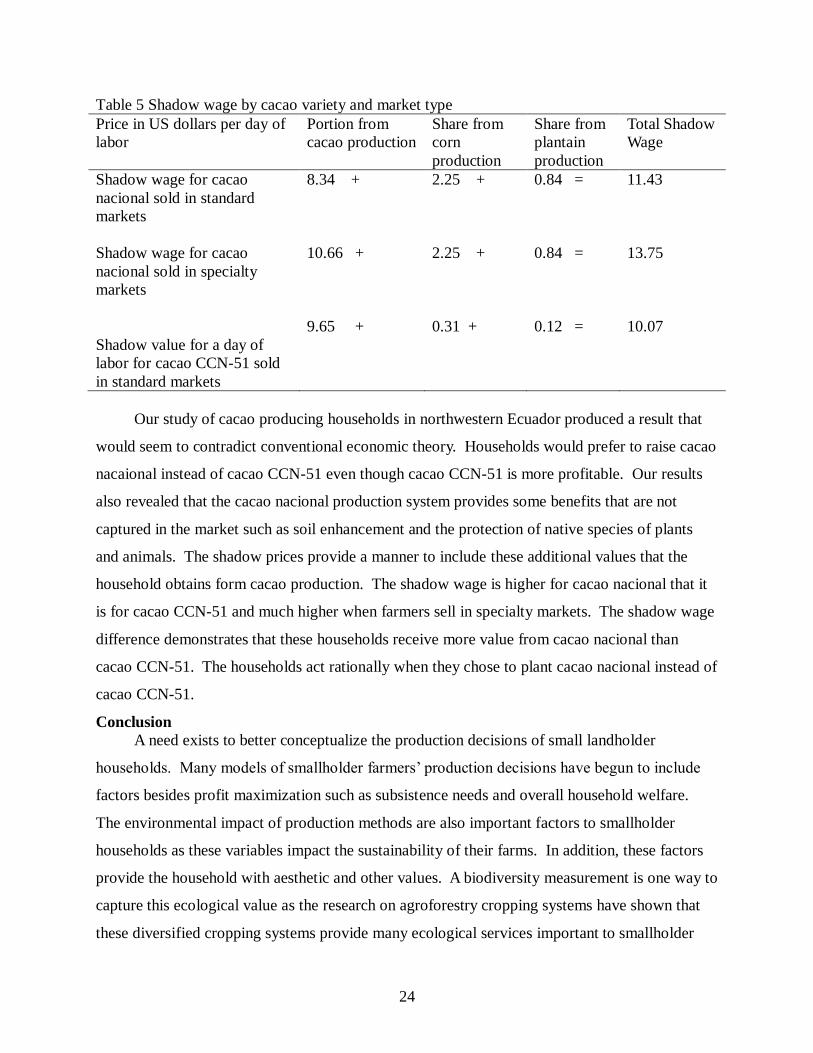
In order to capture some of the market benefits of the planned biodiversity from cacao
production, we used estimates for the MPL for maize and plantain production, two common
crops, in the shadow wage for cacao nacional and cacao CCN-51 which are included in Table 5
in the third and fourth columns. Column two contains the estimates for the shadow wage
component for cacao production. This value is larger than the mean of the wage obtained in the
market (8.33 U.S. dollars). This shadow wage can be higher than the market wage when hired
labor and family labor are not substitutes and family size limits the available family labor.
However, it is still in the range of high market wages (the range of all daily wages is between 7
U.S. dollars and 12 U.S. dollars). A family selling their cacao in the specialty market will obtain
about 2.25 U.S. dollars more per day of labor than a family who does not have access to this
market (13.75 U.S. dollars compared to 11.43 U.S. dollars). Interesting, the shadow wage for
cacao nacional in both the conventional and specialty markets is larger than the shadow wage for
cacao CCN-51 when some of the additional value of maize and plantains is included in the
analysis.
24
Table 5 Shadow wage by cacao variety and market type
Price in US dollars per day of
labor
Portion from
cacao production
Share from
corn
production
Share from
plantain
production
Total Shadow
Wage
Shadow wage for cacao
nacional sold in standard
markets
8.34 + 2.25 + 0.84 = 11.43
Shadow wage for cacao
nacional sold in specialty
markets
10.66 + 2.25 + 0.84 = 13.75
Shadow value for a day of
labor for cacao CCN-51 sold
in standard markets
9.65 + 0.31 + 0.12 = 10.07
Our study of cacao producing households in northwestern Ecuador produced a result that
would seem to contradict conventional economic theory. Households would prefer to raise cacao
nacaional instead of cacao CCN-51 even though cacao CCN-51 is more profitable. Our results
also revealed that the cacao nacional production system provides some benefits that are not
captured in the market such as soil enhancement and the protection of native species of plants
and animals. The shadow prices provide a manner to include these additional values that the
household obtains form cacao production. The shadow wage is higher for cacao nacional that it
is for cacao CCN-51 and much higher when farmers sell in specialty markets. The shadow wage
difference demonstrates that these households receive more value from cacao nacional than
cacao CCN-51. The households act rationally when they chose to plant cacao nacional instead of
cacao CCN-51.
Conclusion
A need exists to better conceptualize the production decisions of small landholder
households. Many models of smallholder farmers’ production decisions have begun to include
factors besides profit maximization such as subsistence needs and overall household welfare.
The environmental impact of production methods are also important factors to smallholder
households as these variables impact the sustainability of their farms. In addition, these factors
provide the household with aesthetic and other values. A biodiversity measurement is one way to
capture this ecological value as the research on agroforestry cropping systems have shown that
these diversified cropping systems provide many ecological services important to smallholder
25
households. These biodiverse systems also provide many monetary benefits such as additional
incomes sources and meeting consumption needs. The biodiversity factors have proven to be an
important consideration in the production decisions of smallholder cacao producers in Ecuador
as these farmers would prefer to raise cacao nacional which provides many ecological and other
benefits that are not obtained in cacao CCN-51 parcels.
In order to analyze the importance of biodiversity in the production of cacao, we created a
model that disentangles the effects of family labor for biodiversity and for the production of
cacao by analyzing shadow prices. Shadow wage and shadow income value biodiversity which
has not been included in past models of shadow wages and labor. Our model also takes into
account of the effect of segmented markets. Segmented markets exist in the Ecuadorian case by
certification requirements and limited demand in specialty cacao nacional markets. Our
modeling technique is useful for the study of other crops that participate in segmented markets
such as in the fair trade markets, not just the cacao nacional specialty market.
The shadow wage in this model is the sum of the traditional measure of the shadow wage,
household’s MPL for cacao production, and the new variable, the MPL of biodiversity. Our
analysis of the shadow prices for cacao in northwestern Ecuador reveals the households receive a
higher shadow income for planting cacao nacional than for planting cacao CCN-51. Only a
lower bound for the shadow wage could be developed as only some of the market values could
be estimated and the aesthetic and other nonmarket values of biodiversity were not captured in
the survey. The magnitude of the difference between the market and shadow wages depends on
the crops planted in the cacao parcels. The shadow prices also show that family and market
labor are not perfect substitutes. Family labor receives a very high value that would induce
family members to work on the farm instead of participating in the labor markets. The shadow
wage for cacao production is at the upper bounds of the labor market and the shadow wage for
cacao nacional sold in specialty markets is even higher. Thus, smallholder households in
Ecuador would be able to maximize the value of their labor by devoting to production of cacao
nacional.
Our analysis of shadow wage extends the theoretical work of Jacoby (1993) and Skoufias
(1994). Our model adds to this work by showing the importance of including externalities, such
as the benefits from biodiversity, in computing shadow wage in segmented markets. By
examining segmented markets, our analysis of shadow income enhances the work on fair trade of
26
LeClair (2002) and Hayes (2008) by examining the impact of these markets at the household
level. The determinants of market access in these specialty and fair trade markets were also
examined. Our surveys revealed that many farmers were excluded from these markets. Our
model could help create a better understanding of the failings of these methods in reaching
smallholder households. Our model of shadow prices has shown to be effective in trying to
capture the non market benefits that farmers realize in their production and take into account in
making copping decisions.
Our study leaves several areas to be examined to better understand smallholder
household’s production decisions. First, this research was not able to fully explore the impact of
risk on these decisions. Research on agroforestry has shown that these diversified cropping
systems are less risky than monoculture production methods as a household has additional
income sources to meet its needs (Reitsma 2001). The household welfare impacts of growing
diversified, organic production systems compared to monoculture commercial production
systems such as between cacao nacional and cacao CCN-51 need to be examined. The former
production system is argued to be more ecologically sustainable but the human welfare impact
also needs to be examined to truly understand the impact to total welfare of each production
system. Finally, methods need to be utilized to give a value to the non market benefits for
biodiversity. Only by placing a value on these factors can shadow wage be crated that includes
all the externalities rather than creating a lower bound for this wage as was included in our study.
These additional nonmarket values are especially important in developing countries where
many households are dependent on their farms not only for cash income but also for meeting
subsistence needs. The Ecuadorian cacao case provides a good example of the need for the
inclusion of additional values in the household decision model. When comparing the shadow
wages, the traditional production methods for cacao nacional proved to best production decision
when the value for biodiversity was included in analyzing the smallholder household’s
production decision. The shadow wage and income that includes biodiversity as a value in the
price provides an additional method for determining the true value of a production method to
smallholder households.
27
References
Arslan, A., and J.E. Taylor. 2009. Farmers’ Subjective Valuation of Subsistence Crops:
The Case of Traditional Maize in Mexico. American Journal of Agricultural
Economics 91:956-972.
Bacon, C. 2005. Confronting the Coffee Crisis: Can Fair Trade, Organic, and Specialty
Coffees Reduce Small-Scale Farmer Vulnerability in Northern Nicaragua? World
Development 33: 497-511.
Barnum, H. N., and L. Squire 1979. An Econometric Application of the Theory of the
Farm-Household Journal of Development Economics 6: 79-102.
Becchetti, L., and M. Costantino. 2008. The Effects of Trade on Affiliated Producers: An
Impact Analysis of Kenyan Farmers. World Development 36: 823-842.
Beer, J., R. Muschler, D. Kass, and E. Somarriba. 1998. Shade Management in Coffee
and Cacao Plantations. Agroforestry Systems 38: 139-164.
Bellon, M. R. 1992. Technology Adoption and Biological Diversity in Andean Potato.
Agriculture. Journal of Development Economics 39: 365-387.
Benjamin, M., K. N. Kuttner, B. S. Bernanke, and M. Gerler. 1993. Economic Activity
and the Short-Term Credit Markets: An Analysis of Prices and Quantities.
Brookings Papers on Economic Activity 2: 193-283.
Bentley, J., E. Boa, and J. Stonehouse. 2004. Neighbor Trees: Shade, Intercropping, and
Cacao in Ecuador. Human Ecology 32: 241-258. Brush, S. B., J. E. Taylor, and
Calo, M. and T. A. Wise. 2005. Revaluing Peasant Coffee Production: Organic and Fair
Trade Markets in Mexico. Global Development and Environmental Institute.
Tufts University.
Carter, M. R., and Y. Yao. 2002. Local Versus Global Separability in Agricultural
Households Models: The Factor Price Equalization Effect of Land Transfer
Rights. American Journal of Agricultural Economics 84: 702-715
Coporación de Promoción de Exportaciones e Inversiones. 2009. Cacao. Ecuador
Calidad de Origen. Quito, Ecuador.
Dasgupta, P. 1995. An Inquiry into Well-being and Destitution. New York: Oxford
University Press.
de Janvry, A., C. McIntosh, and E. Sadoulet. 2010. The Supply- and Demand-side
Impacts of Credit Market Information. Journal of Development Economics 93:
173-188.
28
Duguma, B. J. 2001. Smallholder Cacao (Theobroma cacao Linn.) Cultivation in
Agroforestry Systems of West and Central Africa: Challenges and Opportunities.
Agroforestry Systems 51: 177-188.
El Cacao Volvió Ser la ―Pepa de Oro.‖ 5 February 2009. El Universo (Guayaquil,
Ecuador) pp. 23.
Eswaran, M. and A. Kotwal. 1984 The Moral Hazard of Budget-breaking. Rand
Journal of Economics 15: 578-581.
Eswaran M., and A. Kotwal. 1995. Why Poverty Persists in India. New York: Oxford
University Press
Giovannucci, D., E. Barham, and R. Pirog. 2010. Defining and Marketing ―Local‖
Foods: Geographical Indications for US Products. The Journal of World
Intellectual Property 13: 94-120.
Harlan, J. R. 1975. Crop and Man. Madison, WI: American Society of Agronomy.
Hayes, M. G. 2008. Fighting the Tide: Alternative Trade Organizations in the Era of
Global Free Trade‖—A comment. World Development 36: 2953-61.
Jacoby, H. G. 1993. Shadow Wage and Peasant Family Labour Supply: An Econometric
Application to the Peruvian Sierra. Review of Economic Studies 60: 903-921.
Key, N., E. Sadoulet, and A. de Janvry. 2000. Transaction Costs and Agricultural
Household Supply Response. American Journal of Agricultural Economics 82:
245-259.
Le, T. L. 2009. Shadow Wages and Shadow Income in Farmers’ Labor Supply
Functions. American Journal of Agricultural Economics 91: 685-696.
LeClair, M. S. 2002. Fighting the Tide: Alternative Trade Organizations in the Era of
Global Free Trade. World Development 30: 949 – 958.
LeClair, M. S. 2008. Fighting the Tide: Alternative Trade Organizations in the Era of
Global Free Trade—A reply. World Development 36: 2962-5.
Myers, N., Mittermeier, R. a, Mittermeier, C. G., Fonseca, G. a da, & Kent, J. (2000).
Biodiversity hotspots for conservation priorities. Nature 403: 853-858.
Nijkamp, P., G. Vindigni,, and P. A. L. D. Nunes. 2008. Economic Valuation of
Biodiversity: A Comparative Study. Ecological Economics 67: 217-231.
Nunes, P. A. L. D., and J.C. J. M. van den Bergh. 2001. Economic Valuation of
Biodiversity: Sense or Nonsense? Ecological Economics 39: 203-222.
29
Reitsma, R., J. D. Parrish, and W. McLarney. 2001. The Role of Cacao Plantations in
Maintaining Forest Avian Diversity in Southeastern Costa Rica. Agroforestry
Systems 53: 184-193.
Ronchi, L. 2006. “Fairtrade” and Market Failures in Agricultural Commodity
Markets. Washington, DC: World Bank Publications.
Rosenzweig, M. R.. and R. Evenson. 1977. Fertility, Schooling, and the Economic
Contribution of Children in Rural India: An Econometric Analysis.
Econometrica 45: 1065-1079.
Rosenzweig, M. R. and T. P. Schultz. 1982. Market Opportunities, Genetic
Endowments, and Intrafamily Resource Distribution: child Survival in Rural
India. The American Economic Review 72: 803-815.
Ruben, R., R. Ford, and G. Zùñiga-Arias. 2009. Measuring the Impact of Fair Trade on
Development. World Development 19: 777-788.
Shrestha, R. K. and J. R. R. Alavalapati with S.O. Moffat (ed.) 2003. Florida Ranchers’
Willingness to Adopt Silvopasture Practices: A Dichotomous Choice Contingent
Valuation Approach.. Bugs, Budgets, Mergers, and Fire: Disturbance
Economics. Proceedings of the 2003 Southern Forest Economics Workers Annual
Meeting. New Orleans, LA. 17-18 Mar. 2003.
Skoufias, E. 1994. Using Shadow Wages to Estimate to Labor Supply of Agricultural
Households. American Journal of Agricultural Economics 76: 215-227.
Smith, A. M. 2009. Evaluating the Criticisms of Fair Trade. Economic Affairs 29: 29-
36.
Steffan-Dewentera, I., M. Kesslerc, J. Barkmannc, M. M. Bosa, D. Buchorig, Stefan
Erasmih, H. Fausth, G. Geroldh, K. Glenke, S. R. Gradsteind, E. Guhardjai, M.
Harteveldd, D. Herteld, P. Höhna, M. Kappash, S. Köhlerh, C. Leuschnerd, M.
Maertensj, R. Marggrafe, S. Migge-Kleiank, J. Mogeai, R. Pitopangl, M.
Schaeferk, S. Schwarzem, S. G. Spornd, A. Steingrebek, S. S. Tjitrosoedirdjoi, S.
Tjitrosoemitoi, A. Tweleh, R. Weberh, L. Woltmannk, M. Zellerm, and T.
Tscharntkea. 2007. Tradeoffs between Income, Biodiversity, and Ecosystem
Functioning during Tropical Rainforest Conversion and Agroforestry
Intesification. Proceedings of the National Academy of Sciences, Vol 104.
Available at www.pnas.org/cgi/doi/10.1073/pnas.0608409104
Vandermeer, J. and I. Perfecto 1995. Breakfast and Biodiversity: The Truth about Rain
Forest Destruction. Oakland, CA: Institute for Food and Development Policy.
30
Vakis, R., E. Sadoulet, A. de Janvryand, and C. Cafiero. 2004. Testing for Separability in
Household Models with Heterogeneous Behavior: A Mixture Model Approach.
University of California Berkley. Department of Agricultural and Resource
Economics. Available at http://escholarship.org/uc/item/4hs3g5dj
Wollni, M. and M Zeller. 2007. Do Farmers Benefit from Participating in Specialty
Markets and Cooperatives? The Case of Coffee Marketing in Costa Rica.
Agricultural Economics 37: 243-248.