Embed Size (px)
Citation preview

RESEARCH ARTICLE
Seeing shapes in seemingly random spatial
patterns: Fractal analysis of Rorschach
inkblots
R. P. Taylor1*, T. P. Martin2, R. D. Montgomery1, J. H. Smith1, A. P. Micolich3,
C. Boydston1, B. C. Scannell1, M. S. Fairbanks4, B. Spehar5
1 Physics Department, University of Oregon, Eugene, OR, United States of America, 2 Code 7165, U.S.
Naval Research Laboratory, Washington, DC, United States of America, 3 School of Physics, UNSW
Australia, Sydney, Australia, 4 Department of Sciences and Mathematics, California State University
Maritime Academy, Vallejo, CA, United States of America, 5 School of Psychology, UNSW Australia, Sydney,
NSW, Australia
Abstract
Rorschach inkblots have had a striking impact on the worlds of art and science because of
the remarkable variety of associations with recognizable and namable objects they induce.
Originally adopted as a projective psychological tool to probe mental health, psychologists
and artists have more recently interpreted the variety of induced images simply as a signa-
ture of the observers’ creativity. Here we analyze the relationship between the spatial scal-
ing parameters of the inkblot patterns and the number of induced associations, and suggest
that the perceived images are induced by the fractal characteristics of the blot edges. We
discuss how this relationship explains the frequent observation of images in natural
scenery.
Introduction
In 1921, Herman Rorschach (1884–1922) published the images of ten inkblot patterns that
were believed to unlock the hidden secrets of the human unconscious [1]. Promoted as a ‘psy-
chological X-ray’, psychiatrists adopted the blots as a probe of mental health based on the phe-
nomenon of pareidolia in which familiar patterns are perceived in stimuli when none actually
exist. Rorschach patterns remain unrivaled in their application since quite possibly “no other
psychological test has been administered to more millions of people throughout the world”
[2]. Today, their role as a projective psychological tool has only historical value [3]. Instead,
the percepts induced by the blots are interpreted as a signature of observers’ creativity [4]. In
support of this view, artists ranging from the Surrealists to Andy Warhol have employed blot
patterns as a vehicle to trigger their imaginations. The remarkable propensity of these simple
shapes to induce such a rich variety of imagery, with up to 300 different percepts recorded for
each blot [5], remains intriguing. If the pattern characteristics that stimulate this prolific visual
activity can be identified and quantified, the resulting advances could potentially impact on
diverse applications ranging from camouflage design to artificial vision.
PLOS ONE | DOI:10.1371/journal.pone.0171289 February 14, 2017 1 / 17
a1111111111
a1111111111
a1111111111
a1111111111
a1111111111
OPENACCESS
Citation: Taylor RP, Martin TP, Montgomery RD,
Smith JH, Micolich AP, Boydston C, et al. (2017)
Seeing shapes in seemingly random spatial
patterns: Fractal analysis of Rorschach inkblots.
PLoS ONE 12(2): e0171289. doi:10.1371/journal.
pone.0171289
Editor: Stefan Glasauer, Ludwig-Maximilians-
Universitat Munchen, GERMANY
Received: July 29, 2016
Accepted: January 19, 2017
Published: February 14, 2017
Copyright: This is an open access article, free of all
copyright, and may be freely reproduced,
distributed, transmitted, modified, built upon, or
otherwise used by anyone for any lawful purpose.
The work is made available under the Creative
Commons CC0 public domain dedication.
Data Availability Statement: All relevant data are
within the paper.
Funding: This study was supported by the
Australian Research Council, the Research
Corporation for Science Advancement, and the W.
M. Keck Foundation.
Competing interests: The authors have declared
that no competing interests exist.

A previous empirical investigation of pareidolia [6] was motivated by the observation that
humans readily perceive and identify meaningful images in many naturally occurring but
largely unstructured configurations ranging from clouds, rocks, and cracks in the ground to
the surface of the Moon. All of these structures are fractal, featuring patterns that repeat at
increasingly fine magnifications [7]. The study explored the relationship between the scaling
characteristics of fractal patterns, as quantified by their fractal dimension D [7], and the pat-
terns’ ability to evoke the perception of namable objects. Using computer-generated stimuli,
fractals with low D values were found to elicit a higher ability to evoke the perception of nam-
able objects. This was the same regardless of whether the fractal patterns contained only con-
tours or filled-in regions. A more recent study showed that incorporating left-right symmetry
(a central feature of inkblots) into computer-generated fractal stimuli further increased parei-
dolia [8].
When observers experience pareidolia, investigations of neural responses reveal that regions
of the brain associated with object recognition are activated [8, 9]. For a diverse variety of pat-
terns, ranging from fractals and overhead satellite imagery to magazine covers, ratings of ‘con-
spicuity’ (the ease of noticing images) elicited by these patterns were remarkably consistent
within and between observers and remained so over a period of at least one year [10]. These
results strongly suggest that perceived conspicuity is driven by pattern-inherent sensory factors
common to all observers.
Consistent with this pattern-driven approach to perceived images, we present analysis
showing that the number of induced namable images perceived in Rorschach patterns is
related to fractal characteristics that occur at the edges of the blots. Our analysis, of course,
does not address the idiosyncratic inter-individual variability in the type of images perceived
in such patterns, but convincingly shows that the number of induced images can be related to
the fractal scaling parameters. The results of our analysis also provide an explanation for the
frequent appearance of recognizable imagery within natural objects such as clouds, rock faces
and coastlines.
Fractal analysis of the Rorschach inkblots
Historically, the technique used to generate the Rorschach inkblots has been shrouded in mys-
tery. In particular, Rorschach’s artistic input has rarely been recognized [3]. After dripping
black ink and water-color tints onto a sheet of white card, he then smeared the liquid using a
pen before folding the card and pressing the two surfaces together [3]. Whereas the large-scale
patterns of the resulting symmetric inkblot are therefore a consequence of the ‘painting’ style by
which Rorschach consciously distributed the liquid across the sheet surface, the finer structure
in the blot pattern emerged in the second stage of the process, as the liquid spread through the
card fiber when held under pressure. Although governed essentially by the physical rules of
fluid flow, Rorschach’s creativity in this second process materialized through his selection of the
physical conditions dictating the flow. These conditions are regarded as crucial for shaping the
intricate structure of the resulting blots. So crucial that the Rorschach Society only approved
replica blots generated using Rorschach’s original tools and on days when the air humidity pre-
cisely matched the original conditions [2]. Today’s commercially-available Rorschach blots con-
sist of scanned images of the original blots to avoid variations in blot appearance.
Despite this apparently alchemic approach to the understanding of Rorschach’s blots, the
procedure for generating the fine structure of the inkblots is analogous to that employed in
many traditional studies of fluid morphology [11]. For example, in Hele-Shaw (HS) experi-
ments, a fluid is injected under pressure though a porous medium and the pattern produced
by the fluid boundary is known to be fractal, with roughness exhibited on many size scales
Fractal analysis of Rorschach inkblots
PLOS ONE | DOI:10.1371/journal.pone.0171289 February 14, 2017 2 / 17

[11]. This arises due to a competition between the driving fluid pressure and the local resistive
forces in the porous medium. In the case of inkblots, the driving pressure gradually reduces as
the blot spreads out, and the blot boundary stops spreading when the driving force becomes bal-
anced by the local resistive pressure of the blot fibers. This resistive pressure varies locally, pro-
ducing the spatial roughness of fractal patterns [11]. In Fig 1, we compare Rorschach Blot One
with a computer-generated fractal blot (generated using a random midpoint displacement tech-
nique described elsewhere [12]) to demonstrate the visual similarity of their fractal features.
Methods
To quantify the fractal scaling properties of Rorschach’s blots, we performed an analysis on the
boundaries of the ten blots. The procedure is demonstrated in Fig 2. First, the blot was scanned
at 300dpi and the boundary between the regions of ink absorption and the unstained card was
Fig 1. (A) Rorschach Blot One (with dimension D = 1.11), (B) a computer-generated fractal blot (D = 1.15).
doi:10.1371/journal.pone.0171289.g001
Fractal analysis of Rorschach inkblots
PLOS ONE | DOI:10.1371/journal.pone.0171289 February 14, 2017 3 / 17
Fractal analysis of Rorschach inkblots
PLOS ONE | DOI:10.1371/journal.pone.0171289 February 14, 2017 4 / 17

extracted using an edge detection computer analysis [13] with an accuracy of 0.5mm (corre-
sponding to 6 pixels in the scanned image).
A traditional technique for measuring a boundary’s dimension fractal D, referred to as the
box-counting method, is shown in Figs 2 and 3. The boundary’s D value describes how the pat-
terns occurring at different magnifications combine to build the resulting fractal shape [14].
For Euclidean shapes, dimension is described by the familiar integer values − for a smooth line
(containing no fractal structure) D has a value of 1, while for a completely filled area (again con-
taining no fractal structure) its value is 2. For the repeating patterns of a fractal line, D lies between
1 and 2, and, as the repeating structure covers more space, its value moves closer to 2. To extract D,
the boundary pattern of the blot was covered with a computer-generated mesh of identical squares
(or ‘boxes’). The number of squares, N(L), that contain part of the pattern was then counted (i.e.
the shaded boxes in Fig 3(C)), and this count was repeated as the size, L, of the squares in the mesh
was reduced. N(L) gives a measure of the space coverage of the pattern, and reducing the square
size is equivalent to looking at this coverage at finer magnifications. For fractal behavior, N(L)
scales according to the power law relationship N(L) ~ L-D, where 1< D< 2 [14].
Results
The above power law generates the scale-invariant properties that are central to fractal geome-
try and manifests itself as a straight line in the scaling plot of log N(L) versus log L, as shown in
Fig 3 for Rorschach Blot Five. An automated procedure was used to determine the scaling
range that generates the best linear fit to the data [15]. This was achieved by varying the range
of data points included in the fit in order to minimize the variance of the data from the fit line.
The quality of the fit was quantified by the coefficient of determination R2, which increases
Fig 2. (A) A zoom-in on Blot Seven highlighting the extracted boundary with a black line. The scale bar
corresponds to 1.6mm (19 pixels in the scanned image). (B) Rorschach Blot Five of width 17.5cm. (C) A
schematic representation of the box-counting technique applied to Blot Five’s boundary. The box size shown
represents the largest box size analyzed.
doi:10.1371/journal.pone.0171289.g002
Fig 3. Top three traces: Box-counting analyses applied to Rorschach Blot Five (black), Rorschach
Blot Ten (red), and a computer-generated fractal boundary (blue). Bottom three traces: the derivatives of
the three scaling plots (see text for details).
doi:10.1371/journal.pone.0171289.g003
Fractal analysis of Rorschach inkblots
PLOS ONE | DOI:10.1371/journal.pone.0171289 February 14, 2017 5 / 17
with the quality of the fit and lies in the range 0 to 1 [15]. The black fit line for Blot Five is
described by D = 1.23 and R2 = 0.9995.
The vertical dashed lines represent the coarse and fine cut-offs determined by the fitting
procedure. The coarse scale cut-off corresponds to the measurement limit originating from
the reduced counting statistics that occur when the number of boxes in the grid becomes too
few [16]. For box sizes larger than 2.7cm, there are insufficient boxes to distinguish the fractal
boundary from that of a filled space: the gradient then increases toward D = 2 because all the
boxes in the mesh become occupied by the boundary pattern. This coarse scale measurement
cut-off cannot be improved upon because it is linked to the blot size. However, this does not
limit our study because patterns larger than this scale are expected to be dominated by
Rorschach’s ‘painting’ process rather than the fluid-induced fractals.
The observed fine-scale cut-off occurs at a much larger scale (19 pixels) than the fine scale
measurement cut-off (6 pixels, set by the accuracy of the edge extraction process). To empha-
size this difference, the scale bar included in Fig 2(A) represents the box size at the observed
cut-off (1.6mm). The observed fine scale cut-off therefore represents a physical limit of the
fractal generation process and is a characteristic of HS-type experiments [11]. Although
boundary structure exists below this scale, it is no longer described by a fractal power-law
behavior.
Fig 3 also includes the scaling plot achieved when the box-counting method was applied to
the computer-generated fractal boundary shown in Fig 4. This boundary was generated using
a Fourier transform technique [17] and has a D value (1.26) similar to that of Blot Five. For
comparison, the blue fit line was generated over the same scaling range as Blot Five and is
quantified by R2 = 0.9997. Whereas the R2 value of the Blot Five fit matches this down to three
decimal places, the fit line for Blot Ten over the same scaling range is quantified by a R2 value
which matches it to only two (0.9976), indicating that Blot Ten does not follow the fractal
power law behavior as closely. When the fitting procedure for Blot Ten was allowed to select
the data points which minimize R2 (resulting in the red line quantified by R2 = 0.9992), the
scaling range of L is significantly less than a factor of ten. Although the definition of fractals
does not feature a minimum size range for scaling [7], power laws typically require a minimum
of one order of magnitude to be detected with confidence.
To emphasize Blot Ten’s deviation from fractal behavior, the derivatives of the three scaling
plots are plotted below the data lines in Fig 3. In each case, the derivative was calculated using
a linear fit to the four nearest neighbors to either side of each data point (i.e. nine points were
used to determine each of the derivative values). The derivatives for Blot Five (black trace) and
the computer-generated fractal (blue trace) are horizontal within the region between the verti-
cal dashed lines (the D values of which are plotted on the left-hand axis), while the derivative
for Blot Ten (red trace) increases gradually. These behaviors don’t extend right up to the cut-
off lines because of the 9 point calculation (for example, a derivative value plotted on the cut-
off line will be influenced by 4 points within the fractal region and 4 points outside). Note also
that the ‘bumps’ in the derivative plots are an intrinsic feature of fractals (as evidenced by their
appearance in the data of the computer-generated fractal) and result from statistical variations.
Blot Five is one of five Rorschach blots formed by using only black ink. The fractal scaling
properties of all five of these black blots are confirmed by the box-counting analysis and also
by an independent technique known as the ‘coastline method’ [14]. The D values of the five
blots are: Blot One (D = 1.11), Four (1.22), Five (1.23), Six (1.17) and Seven (1.13). This Drange of 1.1 to 1.3 matches the values measured in the HS experiments [11]. In the HS experi-
ments, differences in the measured D values result from variations in applied pressure and
fluid viscosity, and we interpret the different D values of the five blots in terms of similar varia-
tions in Rorschach’s blot generation process. Within this picture, it is interesting to note that
Fractal analysis of Rorschach inkblots
PLOS ONE | DOI:10.1371/journal.pone.0171289 February 14, 2017 6 / 17

air humidity influences the fluid evaporation rate, leading to variations in the driving pressure
of the spreading ink. This is consistent with the traditional belief that weather conditions influ-
enced the formation of the fine-structure patterns in the blots [2].
Fig 4. Computer-generated fractal boundaries. The black pattern has a D value of 1.26 that closely matches that of Rorschach Blot Five, while the
grey pattern has a much higher D value of 1.77. The black and white squares indicate the smallest and largest box sizes used in the fractal analysis of
these boundaries.
doi:10.1371/journal.pone.0171289.g004
Fractal analysis of Rorschach inkblots
PLOS ONE | DOI:10.1371/journal.pone.0171289 February 14, 2017 7 / 17

The remaining five Rorschach blots are composed of several regions of different colors
formed from black ink and water-color tints. The scaling plots of these colored blots are simi-
lar to the Blot Ten data shown in Fig 3. Note that, as with the black blots, the boundary of the
multi-colored blots corresponds to the edge between stained and unstained blotting paper (i.e.
color is ignored). The physical origin for the lack of fractality of the colored blots lies in the
fact that the boundaries of the colored sub-regions are fractal but with different D values to each
other (presumably due to the variations in ink fluidity and applied pressure). For example, the
D values of the orange and blue regions of Rorschach Blot Ten are 1.1 and 1.41 respectively (see
Fig 5). The scaling properties of a pattern composed from two individual fractals depends on
factors such as the relative densities of the two patterns, the scaling behavior of boxes containing
both patterns, and the difference in their D values [18]. In particular, for patterns such as the
Rorschach blots, the large difference in D values for the sub-regions is expected to prevent frac-
tal scale invariance of the combined pattern, as observed in the scaling plot shown in Fig 3 for
Fig 5. (A) Rorschach Blot Ten, (B) the boundaries of the blot edges.
doi:10.1371/journal.pone.0171289.g005
Fractal analysis of Rorschach inkblots
PLOS ONE | DOI:10.1371/journal.pone.0171289 February 14, 2017 8 / 17

Rorschach Blot Ten. Although the scaling plots of the colored blots show that their boundaries
can’t be quantified by a simple box-counting dimension, we note that a multi-fractal analysis
[19] might reveal additional information regarding their scaling characteristics.
Images perceived in Rorschach inkblots
A key question in our analysis concerns the relationship between the fractal properties of the
blot boundaries and the number of images perceived when observing the blots. To address
this, we re-visited two original empirical investigations concerning the number of responses to
individual Rorschach blots. The first was the compilation of responses for each of the Ror-
schach blots conducted by psychologist Marguerite Hertz [20]. As the founding member of the
Rorschach Institute, Hertz pioneered standardized scoring of the inkblot tests in the 1930s and
produced the Frequency Tables for Scoring Rorschach Responses. These tables were created
by meticulous cataloguing of different percept types (e.g. an image of a bat, a person, etc.) for
each of the ten Rorschach blots generated by a cumulative sample of N = 1050 subjects aged
11–19 [5]. For the purpose of our analysis, we simply counted the number of different percept
types reported for the five black blots and plotted these empirically determined values n against
their respective D values obtained from our analysis (Fig 6, red symbols). Note that, just as Dquantifies the boundary of the whole blot, so too n quantifies the number of percepts types
induced by the whole boundary, and does not include percepts induced by component regions
of the blots. The data reveal a decreasing trend indicating the importance of D in observing the
number of induced percepts.
A strikingly similar trend can also be observed with the second independent empirical sam-
ple of percepts for each Rorschach blot, reported by Wirt and McReynolds in 1953 [21]. The
total number of responses is one of the standard variables in an administration of the Rorschach
test (the so called Rorschach variable “R”) and Wirt and McReynolds were concerned with the
extent to which this measure is reliable, reproducible and consistent from one testing occasion
to another. For that purpose, they determined the mean and standard deviation of the total
number of responses for each blot in the samples of normal (N = 76), neurotic (N = 32) and
schizophrenic (N = 50) subjects. The blots were then divided into two groups of five blots to
determine whether the responses to the two groups were similar. Correlations between the
Fig 6. Number of percepts, n, induced by the five black blots plotted as a function of the D value of
their boundaries. The inset tabulates the D values of the five blots along with the corresponding data from
Hertz [5] and Wirt and McReynolds [21] respectively. For the purpose of direct comparison, the raw n scores
have been standardized as z-scores and are shown in parentheses. The horizontal dotted line represents the
mean score for each of the two sets of data. The red and blue lines are linear fits to the respective data and the
dashed lines represent the boundaries of 95% confidence intervals. Note that three of the blue data points (for
Blots 1, 5 and 6) are obscured by the equivalent red points.
doi:10.1371/journal.pone.0171289.g006
Fractal analysis of Rorschach inkblots
PLOS ONE | DOI:10.1371/journal.pone.0171289 February 14, 2017 9 / 17

scores for the two groups of blots equaled 0.88, 0.91 and 0.77 for the normal, neurotic and
schizophrenic sample respectively, indicating high reliability (a score of 1 would represent a per-
fect correlation). While the relatively high reliability of the total number of responses is encour-
aging in itself, we took the opportunity to compare the reported number of total responses for
each of the five black blots to those estimated based on the responses compiled by Hertz [5].
We note that the values recorded by Wirt and McReynolds represent the average number
of percepts one person would report per blot in one administration of the test. More precisely,
each value refers to the average number of responses given to the question “What might this
be?” for each individual blot. On average, one person would see from one to three shapes in
each blot, totaling 20 to 30 for the entire test. Thus, the n values for the Wirt and McReynolds
test are much smaller than those from Hertz data, which are based on the cumulative number
of percept types reported by more than 1000 participants. The Hertz numbers indicate the var-
iability of responses on a group level while the Wirt and McReynolds numbers are to some
extent an indicator of variability on the level of one individual. Despite these differences in
recording n, the standardized z-scores for the average number of total responses reported by
Wirt and McReynolds, plotted as blue symbols in Fig 6, closely follow the same inverse rela-
tionship between the n and D values found in the Hertz data.
Images perceived in computer generated fractals
Naturally, the boundary’s fractal structure is not the only cause of the large number of percept
induced by the black blots–other likely factors include the blot’s (left-right) symmetry [8] and
also shading caused by variations in the ink’s opacity in the regions enclosed by the bound-
aries. One way to isolate the contribution of variations in fractal dimension is to investigate the
perceived images in computer generated fractal patterns varying solely in D. A second motiva-
tion for using computer generated stimuli is that the blots study was inevitably limited to just
ten stimuli. By extending the studies to computer stimuli, we investigated responses to 24 addi-
tional images.
Participants
For this study, 23 first year Psychology students from the University of New South Wales were
used (Nmale = 10, Nfemale = 13) with an average age of 18.9 years. The students received extra
course credit in exchange for their participation and had normal or corrected to normal vision.
Prior to the start of the experiment, all participants signed an informed consent form. All pro-
cedures and protocols were approved by the University of New South Wales Human Research
Ethics Approval Panel (HREAP C).
Materials
Three different ‘seed’ patterns were used to generate fractal images using a Fourier transform
technique reported elsewhere [22]. Each seed set featured 8 images varying in D from 1.05 to
1.95. All images were 512 by 512 pixels wide and had the same mean luminance and contrast.
One set of images is illustrated in the top section of Fig 7.
Procedure
Prior to data collection, participants received printed versions of images showing the varia-
tions in D and performed 4 practice trials. The study was conducted in a room with controlled
lighting and participants were placed 60cm away from the monitor. All stimuli subtended a
visual angle of 12 by 12 degrees and were centered against a uniform grey background.
Fractal analysis of Rorschach inkblots
PLOS ONE | DOI:10.1371/journal.pone.0171289 February 14, 2017 10 / 17

The presentation of each of the images was randomized and each image was presented once
and for a duration of 10 seconds. Before each trial, a fixation cross appeared for 500 millisec-
onds. After each image was shown, participants were asked how many shapes they could dis-
cern in the image. The response options included “none”, “1 or 2 shapes”, “3 or 4 shapes”, “5
or 6 shapes” or “7 or more.”
Results
Before analysis, the answers were converted to numerical values by taking the average of the
numbers in each choice except for “none” which was given “0” and “7 or more” which was
given “7.5”. The reported number of perceived shapes, averaged across the three different sets
of images, is shown in Fig 7. We then applied the standard statistical procedure, Analysis of
Variance (ANOVA), to the data. One-way repeated measures ANOVA revealed the significant
effect of D on the number of reported shapes (F2.925,64.34 = 3.17, p = 0.03).
The relationship between D and n observed for the Rorschach blots and our computer-gen-
erated fractal patterns is also consistent with a previous study of computer-generated fractal
patterns [6] and confirms that low D fractal boundaries provide the best stimulus for induced
associations with namable objects. Our study confirms the effect for an extended range of Dand for much finer interval steps between different D values. More crucially, the previous
study simply displayed groups of four images with different D values and recorded the percent-
age of times each image was chosen over the others based on which image induced more pre-
cepts. In contrast, our experiment recorded the number of percepts induced by each image,
allowing a direct comparison with the original blot tests.
Discussion
Fractal dimension plays a crucial role in determining a pattern’s visual appearance. Returning
to the scaling behavior of Fig 3, D corresponds to the gradient of the scaling plot. A high Dvalue is therefore a signature of a large N(L) value at small L and reflects the fact that many
small boxes are being filled by fine structure. This can be seen, for example, for the two
Fig 7. The standardized number of reported percepts, n, induced by the computer-generated fractal
patterns plotted as a function of their D value. One set of computer-generated images is illustrated above
the graph. The dotted lines represent the boundaries of 95% confidence intervals. The inset tabulates the D
values of the images along with the corresponding average number of reported perceived shapes.
doi:10.1371/journal.pone.0171289.g007
Fractal analysis of Rorschach inkblots
PLOS ONE | DOI:10.1371/journal.pone.0171289 February 14, 2017 11 / 17

computer-generated fractal boundaries shown in Fig 4. The fine features play a more domi-
nant role for the D = 1.77 pattern than for the D = 1.26 pattern. The fine feature content for
the D = 1.26 pattern is much closer to that of Blot Five (D = 1.23).
Because of this relationship between D and fine structure content, D is a well-established
tool for quantifying fractal complexity [7, 14]. Traditional measures of visual patterns quantify
complexity in terms of the ratio of fine structure to coarse structure. D goes further by quanti-
fying the relative contributions of the fractal structure at all the intermediate magnifications
between the coarse and fine scales. Previous psychophysical experiments performed on fractal
patterns confirm that raising the D value increases its perceived complexity [23–25]. Thus, the
increase in number of induced percepts between the different blots might be linked to a reduc-
tion in their fractal complexity.
In addition to the dependence of n on D, the importance of the fractal boundary for induc-
ing percepts is further highlighted by the fact that the non-fractal, multi-colored blots induce
fewer percepts (n = 140 to 170) than their fractal, black counterparts (n = 170 to 300) [5]. We
note, however, that there may be additional causes for this drop in n. In particular, for the
multi-colored blots, the component regions (each with a distinct color) might visually domi-
nate over the whole blot. The boundary shapes of these component regions would then pre-
dominantly determine the percepts rather than the whole blot’s boundary. This would result
in a lower n because n quantifies only percepts induced by the whole blot. This effect is consis-
tent with findings suggesting the powerful role of color on image segmentation [26].
Although the n values are smaller for the colored blots than their black counterparts, they
nevertheless still have significant magnitudes. In our current study, we focused on the box-
counting dimension D because of the range of previous psychophysical experiments that
linked the visual properties of fractals to D [6, 17, 22–25, 27–37]. However, as noted earlier,
future studies should explore if other scaling parameters revealed by a multi-fractal analysis
can explain the percepts induced by the colored blots.
It is interesting that the fractals play such an important role given that the structure is lim-
ited to size scales smaller than approximately 2.5cm (patterns larger than 2.5cm weren’t gener-
ated by the fractal ink diffusion process but by Rorschach’s ink smearing actions prior to
pressing). In Fig 8, we therefore demonstrate the visual importance of the fractal structure by
eliminating this structure from the boundary of Rorschach Blot Seven by Fourier transforming
the blot image and removing spatial frequencies corresponding to the fractal scaling regime
(2-25mm). This process clearly impacts on the visual perception of the blot.
The human visual system’s ability to detect fractal characteristics based on only a limited
magnification range has been highlighted in the previous psychophysical experiments [6, 17,
22–25, 27–37]. This remarkable sensitivity to fractals is perhaps not surprising given that
many of the physical fractals that define our daily visual environment exhibit fractal character-
istics over limited magnification ranges [38]. This relationship with nature highlights another
crucial factor for inducing perceived images—the statistical quality of the fractal pattern. Fig 9
shows a fractal pattern based on the Koch curve, which has a similar D value (1.26) to the Ror-
schach Blot Five of Fig 2 and the low D computer-generated fractal of Fig 4. In this figure, we
morph the ‘exact’ fractal (where the patterns repeat exactly at different magnifications) into
the more natural-looking ‘statistical’ fractal (in which the statistical qualities of the fractal
repeat at different magnifications) by introducing random variations into the fractal pattern as
follows. The probability p for a ‘spike’ on the curve to be pointing up or down changes for the
three curves in Fig 9. For the traditional Koch curve p = 0, corresponding to zero probability
of having a spike pointing down. For the second image p = 0.25, so most of the spikes are
pointing up. For the third curve, p = 0.5, corresponding to a 50% chance of pointing up or
down. In each case, the spatial distribution of the up and down spikes is random.
Fractal analysis of Rorschach inkblots
PLOS ONE | DOI:10.1371/journal.pone.0171289 February 14, 2017 12 / 17
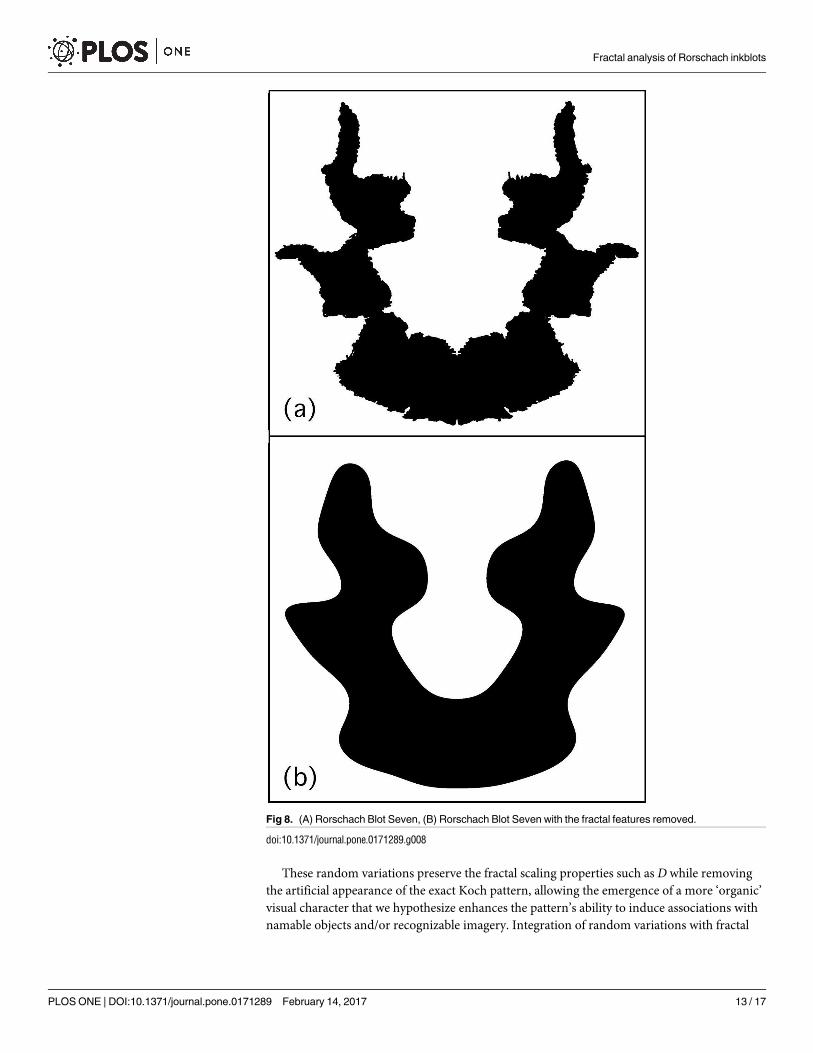
These random variations preserve the fractal scaling properties such as D while removing
the artificial appearance of the exact Koch pattern, allowing the emergence of a more ‘organic’
visual character that we hypothesize enhances the pattern’s ability to induce associations with
namable objects and/or recognizable imagery. Integration of random variations with fractal
Fig 8. (A) Rorschach Blot Seven, (B) Rorschach Blot Seven with the fractal features removed.
doi:10.1371/journal.pone.0171289.g008
Fractal analysis of Rorschach inkblots
PLOS ONE | DOI:10.1371/journal.pone.0171289 February 14, 2017 13 / 17

scaling of D = 1.1 appears to be optimal. We note that purely random white noise also has the
capacity to induce percepts [8]. However, because white noise is characterized by D = 2 [39],
the data of Figs 6 and 7 suggest that the lower D values (corresponding to pink noise [39]) will
induce more percepts than purely random patterns.
Natural objects whose fractal characteristics might be expected to induce recognizable
images include rock faces, coastline patterns, clouds and craters on the Moon. In particular,
many clouds have fractal boundaries quantified by D = 1.3 (similar to the Rorschach blots) and
are well-known for inducing percepts in our daily lives. Biological examples of fractals that
induce associations with namable objects include animal markings [40], a phenomenon that
inspired research of fractal camouflage [41]. Fractal-induced imagery is also evident in art-
works. In particular, the Surrealists developed several techniques to produce patterns that
induce imagery. A prime example is Oscar Dominguez’s technique, decalcomania [42], for
which he painted a surface, pressed a sheet of paper down on that surface and then pulled it
off. The infusion of air into the paint as the two layers were separated generated a fractal pro-
cess called viscous fingering [43]. Dominguez described his resulting patterns as “unequalled
in [their] power of suggestion”, emphasizing the propensity of these simple fractal patterns for
triggering a striking variety of imagery. The Abstract Expressionist Jackson Pollock’s poured
paintings are composed of fractals with D values that increased from 1.1 to 1.7 over the decade
1943–1952 [32, 44]. Intriguingly, Pollock seems to have been aware that his drive towards
higher complexity paintings would reduce the number of induced precepts: “I try to stay away
from any recognizable image; if it creeps in I try to do away with it. . . I don’t let the image
carry the painting. . . It’s extra cargo—and unnecessary” [45].
Conclusions
Analysis of Rorschach inkblots provides an appealing framework for understanding the rich
variety of visual associations induced by fractal patterns spanning psychology, art and nature.
Fig 9. Koch curves quantified by D = 1.26. The exact fractal (top trace) is morphed into the statistical fractal
(bottom trace). See the text for details.
doi:10.1371/journal.pone.0171289.g009
Fractal analysis of Rorschach inkblots
PLOS ONE | DOI:10.1371/journal.pone.0171289 February 14, 2017 14 / 17

In each case, the repetition of structure at increasingly fine magnifications generates the visual
complexity necessary to induce the perceived images. Within this fractal model, low D fractals
provide the optimal distribution of spatial frequencies to induce the images. In contrast, the
dominance of fine structure in high D fractals appears to reduce the perception of recognizable
images. The ability to tune the number of percepts by adjusting the D value of computer-gen-
erated fractals has huge potential for both the visual arts and visual sciences. Given the recent
emphasis on the connection between the images induced by the blots and the observer’s crea-
tivity [4], it is intriguing to note that self-reported creative people prefer to look at fractals with
higher D values [46]. It would therefore be interesting to investigate how the n vs D depen-
dence identified in Figs 6 and 7 is affected by observers’ creativity. Another potential focus for
future investigations concerns the relationship between percepts and aesthetics. We note that a
previous study of the fractal boundaries of blots focused on their aesthetics [47]. However, the
blots were analyzed after undergoing filtering for red, blue and green colors. This difference
between their images and our unfiltered ones prevents a comparison between the two studies.
Author Contributions
Conceptualization: RPT.
Formal analysis: TPM APM CB BCS MSF JHS RDM.
Methodology: RPT BS.
Project administration: RPT.
Software: TPM APM CB BCS MSF RDM JHS.
Validation: RPT.
Writing – original draft: RPT BS.
Writing – review & editing: RPT BS TPM APM CB BCS MSF JHS RDM.
References1. Rorschach H. Psychodiagnostik, methodik und ergbnisse einer wahmehmungsdiagnostischen experi-
ment. Bern Ernst Bircher; 1921.
2. The Rorschach Society website is: http://www.Rorschach.com.
3. Wood JM, Nezworski MT, Lilienfeld SC & Garb HN. What’s wrong with the Rorschach? San Francisco:
John Wiley & Sons; 2003.
4. Gregory R. Reversing Rorschach. Nature. 2000; 404: 19. doi: 10.1038/35003661 PMID: 10716422
5. Hertz MR. Frequency tables for scoring Rorschach responses, 5th Edition. Cleveland: Case Western
Reserve University Press; 1971.
6. Rogowitz BE & Voss RF. Shape perception and low dimension fractal boundary contours. S.P.I.E.
Human Vision and Electronic Imaging: Models, Methods and Applications. 1990; 1249: 387.
7. Mandelbrot BB. The fractal geometry of nature. San Francisco: W.H. Freeman and Co; 1982.
8. Liu J, Li J, Feng L, Tian J, & Lee K. Seeing Jesus in toast: neural behavioral correlates of face pareido-
lia. Cortex. 2014; 53: 60–77. doi: 10.1016/j.cortex.2014.01.013 PMID: 24583223
9. Bies AJ, Kikumoto A, Boydston C, Greenfield A, Chauvin KA, Taylor RP et al. Percepts from noise pat-
terns: The role of fractal dimension in object pareidolia. Vision Science Annual Meeting 2016.
10. Cerf M, Cleary DR, Peters RJ, Einhauser W, & Koch C. Observers are consistent when rating image
conspicuity. Vision Research. 2007; 47: 3052–3060. doi: 10.1016/j.visres.2007.06.025 PMID:
17923144
11. Barabasi A, & Stanley HE. Fractal concepts in surface growth. Cambridge: Cambridge University
Press; 1995.
Fractal analysis of Rorschach inkblots
PLOS ONE | DOI:10.1371/journal.pone.0171289 February 14, 2017 15 / 17

12. Bies AJ, Boydston CR, Taylor RP, & Sereno ME. Relationship between fractal dimension and spectral
scaling decay rate in computer-generated fractals. Symmetry. 2016; 66: 1.
13. Bies AJ, Boydston CR, Taylor RP, & Sereno ME. An edgy image statistic: Semi-automated edge extrac-
tion and fractal box-counting algorithm allows for quantification of edge dimension in natural scenes.
Journal of vision. 2015; 15: 769.
14. Gouyet JF. Physics and fractal structures. New York: Springer; 1996.
15. Montgomery RD. Fractal electrodes for interfacing neurons with retinal implants. PhD Thesis. Eugene,
University of Oregon; 2014.
16. Taylor RP, Guzman R, Martin TM, Hall G, Micoloch AP, Jonas D, et al. Authenticating Pollock paintings
using fractal geometry. Recognition Letters. 2007; 28: 695.
17. Hagerhall CM, Laike T, Taylor RP, Kuller M, Kuller R, & Martin TP. Investigation of EEG Response to
Fractal Patterns. Perception. 2008; 37: 1488–1494. PMID: 19065853
18. Taylor RP, Micolich AP, & Jonas D. Revisiting Pollock’s poured paintings. Nature, Communication Aris-
ing. 2006; 44.
19. Mureika JR, & Taylor RP. The Abstract Expressionists and Les Automatistes: A shared multi-fractal
depth. Signal Processing. 2013; 93: 573.
20. Hertz MR. The method of administration of the Rorschach ink-blot test. Child Development. 1936; 7:
237–254.
21. Wirt RD, & McReynolds P. The reliability of Rorschach number of responses. Journal of projective tech-
niques. 1953: 17:4, 493–494. doi: 10.1080/08853126.1953.10380520 PMID: 13118582
22. Spehar B, Walker N, & Taylor RP. Taxonomy of individual variations in aesthetic responses to fractal
patterns. Frontiers in Human Neuroscience. 2016; 10: 00350.
23. Cutting JE & Garvin JJ. Fractal curves and complexity. Perception and Psychophysics. 1987; 42: 365–
370. PMID: 3684493
24. Pentland AP. Fractal-based description of natural scenes. IEEE Pattern Analysis and Machine Intelli-
gence PAMI-6. 1984; 661–674.
25. Gilden DL, Schmuckler MA, & Clayton K. The perception of natural contour. Psychological Review.
1993; 100: 460–478. PMID: 8356186
26. Gegenfurtner KR & Kiper DC. Color vision. Annual Review of Neuroscience. 2003; 26: 181–206. doi:
10.1146/annurev.neuro.26.041002.131116 PMID: 12574494
27. Knill DC, Field D & Kersten D. Human discrimination of fractal images. J. Opt. Soc. Am. 1990; 7: 1113–
1123.
28. Aks DJ & Sprott JC. Quantifying aesthetic preference for chaotic patterns. Journal of the Empirical Stud-
ies of the Arts. 1996; 4: 1–16.
29. Hagerhall CM, Purcell T & Taylor RP. Fractal dimension of landscape silhouette outlines as a predictor
of landscape preference. J. Environ. Psychol. 2004; 24: 247–255.
30. Spehar B, Clifford CWG, Newell BR & Taylor RP. Universal aesthetic of fractals. Comput. Graph. 2003;
27: 813–820.
31. Taylor RP, & Sprott JC. Biophilic Fractals and the Visual Journey of Organic Screen Savers. The Jour-
nal of Nonlinear Dynamics, Psychology, and Life Sciences. 2008; 12: 117–129.
32. Taylor RP, Spehar B, van Donkelaar P & Hagerhall CM. Perceptual and physiological responses to
Jackson Pollock’s fractals. Frontiers in Human Neuroscience. 2011; 5: 1–13.
33. Spehar B, & Taylor RP. Fractals in art and nature: why do we like them? SPIE 2013; 8651: 865118.
34. Hagerhall CM, Laike T, Kuller M, Marcheschi E, Boydston C & Taylor RP. Human physiological benefits
of viewing nature: EEG response to exact and statistical fractal patterns. The Journal of Nonlinear
Dynamics, Psychology, and Life Sciences. 2015; 19: 1–12.
35. Spehar B, Wong S, van de Klundert S, Lui J, Clifford CWG, & Taylor RP. Beauty and the beholder: the
role of visual sensitivity in visual preference. Frontiers in Human Neuroscience. 20156; 9: 1.
36. Street N, Forsythe A, Reilly RG, Taylor RP, Boydston C & Helmy MS. A complex story: universal prefer-
ence vs. individual differences shaping aesthetic response to fractal patterns? Frontiers in Human Neu-
roscience. 2016; 10: 1–14.
37. Bies AJ, Blanc-Goldhammer DR, Boydston CR, Taylor RP & Sereno ME. Aesthetic responses to exact
fractals driven by physical complexity. Frontiers in Human Neuroscience. 2016; 10: 1.
38. Avnir D, Biham O, Lidar D & Malcai O. Is the geometry of nature fractal? Science. 1998; 279: 39.
Fractal analysis of Rorschach inkblots
PLOS ONE | DOI:10.1371/journal.pone.0171289 February 14, 2017 16 / 17

39. Fairbanks MS, & Taylor RP. Scaling analysis of spatial and temporal patterns: from the human eye to
the albatross. In Guastello S. Gregson R. Editors. Non-Linear dynamical analysis for the behavioral sci-
ences using real Data. Boca Raton: CRC Press, Taylor and Francis Group; 2011.
40. Castrejon Pita JR, Sarmiento Galan A, Castrejon Pita AA& Castrejon Garcia R. Fractal dimension in
butterflies’ wings: a novel approach to understanding wing patterns? Journal of Mathematical Biology.
2005; 50: 584–594. doi: 10.1007/s00285-004-0302-6 PMID: 15614549
41. Turner MJ, Blackledge JM & Andrews PR. Fractal geometry in digital imaging. Academic Press; 1998.
42. Stangos N. Concepts of modern art: from Fauvism to Postmodernism. Singapore: Thames and Hud-
son; 1994.
43. Frame M, & Mandelbrot BB. Fractals, Graphics and Mathematics Education. Washington: Mathemati-
cal Association of America; 2002.
44. Taylor RP, Micolich AP, & Jonas D. Fractal analysis of Pollock’s dripped paintings. Nature. 1999; 442:
399.
45. Hunt G. Is he the greatest living painter in the United States? Time. 8/8/1949; 45.
46. Richard R. A new aesthetic for environmental awareness: chaos theory, the beauty of nature, and our
broader humanistic identity. Journal of Humanistic Psychology. 2001; 41: 59–95.
47. Conte E, Todarello O, Mendolocchio L, Corfiati L, Maina A, Federici A, et al. A psycho-physical model of
Rorschach’s inkblots using fractal analysis with estimation of the generalized fractal dimension and frac-
tal variance function. Chaos and complexity letters. 2008; 4; 1.
Fractal analysis of Rorschach inkblots
PLOS ONE | DOI:10.1371/journal.pone.0171289 February 14, 2017 17 / 17