Embed Size (px)
Citation preview
This is an electronic reprint of the original article.This reprint may differ from the original in pagination and typographic detail.
Powered by TCPDF (www.tcpdf.org)
This material is protected by copyright and other intellectual property rights, and duplication or sale of all or part of any of the repository collections is not permitted, except that material may be duplicated by you for your research use or educational purposes in electronic or print form. You must obtain permission for any other use. Electronic or print copies may not be offered, whether for sale or otherwise to anyone who is not an authorised user.
Seekell, David A.; Carr, Joel; Dell'Angelo, Jampel; D'Odorico, Paolo; Fader, Marianela;Gephart, Jessica A.; Kummu, Matti; Magliocca, Nicholas; Porkka, Miina; Puma, Michael J.;Ratajczak, Zak; Rulli, Maria Cristina; Suweis, Samir; Tavoni, AlessandroResilience in the global food system
Published in:ENVIRONMENTAL RESEARCH LETTERS
DOI:10.1088/1748-9326/aa5730
Published: 09/02/2017
Document VersionPublisher's PDF, also known as Version of record
Please cite the original version:Seekell, D. A., Carr, J., Dell'Angelo, J., D'Odorico, P., Fader, M., Gephart, J. A., ... Tavoni, A. (2017). Resiliencein the global food system. ENVIRONMENTAL RESEARCH LETTERS, 12(2), 1-10. [025010]. DOI:10.1088/1748-9326/aa5730

Environmental Research Letters
LETTER • OPEN ACCESS
Resilience in the global food systemTo cite this article: David Seekell et al 2017 Environ. Res. Lett. 12 025010
View the article online for updates and enhancements.
Related contentWhat commodities and countries impactinequality in the global food system?Joel A Carr, Paolo D’Odorico, SamirSuweis et al.
-
Reserves and trade jointly determineexposure to food supply shocksPhilippe Marchand, Joel A Carr, JampelDell’Angelo et al.
-
The past and future of food stocksFrancesco Laio, Luca Ridolfi and PaoloD’Odorico
-
This content was downloaded from IP address 130.233.216.224 on 23/10/2017 at 10:54
OPEN ACCESS
RECEIVED
22 September 2016
REVISED
23 December 2016
ACCEPTED FOR PUBLICATION
6 January 2017
PUBLISHED
9 February 2017
Original content fromthis work may be usedunder the terms of theCreative CommonsAttribution 3.0 licence.
Any further distributionof this work mustmaintain attribution tothe author(s) and thetitle of the work, journalcitation and DOI.
Environ. Res. Lett. 12 (2017) 025010 https://doi.org/10.1088/1748-9326/aa5730
LETTER
Resilience in the global food system
David Seekell1,11, Joel Carr2, Jampel Dell’Angelo3,4, Paolo D’Odorico2, Marianela Fader5, JessicaGephart2, Matti Kummu6, Nicholas Magliocca3, Miina Porkka6, Michael Puma7, Zak Ratajczak2, MariaCristina Rulli8, Samir Suweis9 and Alessandro Tavoni10
1 Department of Ecology and Environmental Science, Umeå University, Umeå, Sweden2 Department of Environmental Sciences, University of Virginia, Charlottesville, Virginia, United States of America3 Institute for Environmental Studies (IVM), VU University Amsterdam, Amsterdam, The Netherlands4 National Center for Socio-Environmental Synthesis, University of Maryland, Annapolis, Maryland, United States of America5 International Centre for Water Resources and Global Change (UNESCO), hosted by the Federal Institute of Hydrology, Koblenz, Germany6 Water and Development Research Group, Aalto University, Aalto, Finland7 Center for Climate Systems Research and Center for Climate and Life, Columbia University, NASA Goddard Institute for Space
Studies, New York, United States of America8 Dipartimento di Ingegneria Civile e Ambientale, Politecnico di Milano, Milano, Italy9 Department of Physics and Astronomy, University of Padova, Padova, Italy10 Grantham Institute on Climate Change and the Environment, London School of Economics, London, United Kingdom11 Author to whom any correspondence should be addressed.
E-mail: [email protected]
Keywords: food security, resilience, food systems, food production, sustainability
AbstractEnsuring food security requires food production and distribution systems function throughoutdisruptions. Understanding the factors that contribute to the global food system’s ability to respondand adapt to such disruptions (i.e. resilience) is critical for understanding the long-termsustainability of human populations. Variable impacts of production shocks on food supply betweencountries indicate a need for national-scale resilience indicators that can provide globalcomparisons. However, methods for tracking changes in resilience have had limited application tofood systems. We developed an indicator-based analysis of food systems resilience for the years1992–2011. Our approach is based on three dimensions of resilience: socio-economic access to foodin terms of income of the poorest quintile relative to food prices, biophysical capacity to intensify orextensify food production, and the magnitude and diversity of current domestic food production.The socio-economic indicator has a large variability, but with low values concentrated in Africa andAsia. The biophysical capacity indicator is highest in Africa and Eastern Europe, in part because of ahigh potential for extensification of cropland and for yield gap closure in cultivated areas. However,the biophysical capacity indicator has declined globally in recent years. The production diversityindicator has increased slightly, with a relatively even geographic distribution. Few countries hadexclusively high or low values for all indicators. Collectively, these results are the basis for globalcomparisons of resilience between countries, and provide necessary context for developinggeneralizations about resilience in the global food system.
1. Introduction
Achieving food security is central to the UnitedNations (UN) Sustainable Development Goals. TheUN Food and Agriculture Organization (FAO)defines food security as ‘a situation that exists whenall people, at all times, have physical, social andeconomic access to sufficient, safe and nutritiousfood that meets their dietary needs and foodpreferences for an active and healthy life’
© 2017 IOP Publishing Ltd
(FAO 2001). As a result, ensuring food securityrequires that food production and distributionsystems function despite potential disruptions. Italso requires that all people have economic access to asufficient amount of food to satisfy their nutritionalneeds. Meeting this goal in the face of a growinghuman population, shifting diets, limited naturalresources, climate change, and environmental vari-ability is a major challenge of our time (Godfray et al2010, Foley et al 2011).
Environ. Res. Lett. 12 (2017) 025010
The ability of a food system to respond and adapt todisruptions, while maintaining its function, describesthe system’s resilience (Pingali et al 2005, Schipanskiet al 2016). Like all complex social-ecological systems,resilience within food systems cannot be evaluated ata single scale (Folke et al 2010, Béné et al 2016).Consequently, local, global, and cross-scale interactionsmust be included when evaluating resilience within theincreasingly globalized food system (Porkka et al 2013,D’Odorico et al 2014, Gephart and Pace 2015,MacDonald et al 2015). Further, food systems mustbe evaluated with respect to both the short-termresponses and the longer-term factors that contribute toresilience (Pingali et al 2005, Béné et al 2016).
At the local scale, research on food systemsresilience has mostly focused on disaster response casestudies and detailed evaluations of infrastructure,governance, and social networks (Béné et al 2016).These analyses help identify features of resilientsystems including specific mechanisms that allowthem to respond and adapt to disruptions. Forexample, in 1992–1993 food production in southernAfrica was adversely impacted by a drought related toEl Niño, but there was no regional food crisis. In2002–2003 a similar drought caused a regional famine,and this contrast has been interpreted as indicative ofdeclining resilience related to conflicts and adverseimpacts of the HIV/AIDS pandemic on social andgovernment institutions (Pingali et al 2005).
At the global level, resilience research has adifferent focus, evaluating economic patterns andrelationships rather than food security for individualsor households. Global-scale resilience has been studiedby tracking how shocks to the food system propagateinternationally (Marchand et al 2016). For instance,extreme environmental conditions in 2007 and 2010caused agricultural failures in some countries. Exportbans meant to protect populations in producingcountries came at the expense of nations reliant ontrade to balance their food needs (Fader et al 2013,Baldos and Hertel 2015). Food prices rose sharply,increasing the numbers of undernourished people andcreating social unrest including food riots (Fader et al2013, Lagi et al 2011, Berazneva and Lee 2013, Baldosand Hertel 2015). Studies combining populationdynamics, food production, and trade have found thatthe global food system has become increasingly fragile(Fraser et al 2005, D’Odorico et al 2010, Suweis et al2015, Puma et al 2015, Marchand et al 2016). Global-scale factors like trade may enhance food securitylocally but reduce the resilience of the global foodsystem, while local scale factors that include moreproximal drivers of food security—such as grainreserves or the potential to increase local foodproduction—act within the context of global scalepatterns and processes (Fraser et al 2005, D’Odoricoet al 2010, Baum et al 2015, Puma et al 2015, Faderet al 2016, Gephart et al 2016, Marchand et al 2016,Gephart et al 2017).
2
In order to track the evolution and current stateof resilience within the global food system, wecollected national level indicators at multiple timepoints to evaluate the overall state and trajectory ofthree dimensions of country-level resilience. Theindicators characterize: socio-economic access tofood in terms of income of the poorest quintilerelative to average food prices, biophysical capacity tosustainably intensify or extensify food production,and magnitude and diversity of domestic foodproduction. Here, we describe the geographic andtemporal (1992–2011) patterns of these resilienceindicators, and evaluate the indicators for potentialredundancies. Our analysis provides an opportunityfor global-scale generalizations and comparisons ofresilience at the country level, and the contextnecessary for developing cross-scale analyses of foodsystems resilience.
2. Methods
2.1. Conceptual basisThe resilience concept was popularized throughstudies of ecosystems with alternative states. In thiscontext, resilience describes an ecosystem’s ability toremain in a particular state under perturbations(Holling 1973, Folke et al 2010). Since its introduc-tion in ecology, resilience theory has been applied to awide range of complex systems and has adopted amore general definition of ‘the capacity of a system toabsorb disturbance and reorganize while undergoingchange so as to still retain essentially the samefunction, structure, identity, and feedbacks’ (Walkeret al 2004). Operationally, the concept has been usedin several ways, including as a metaphor associatedwith sustainability, a feature of dynamic models, anda quantifiable field measurement (Carpenter et al2001).
The resilience concept can be applied acrossmultiple scales (Béné et al 2016). For example,factors influencing household-level resilience in-clude the maintenance or sale of assets like livestockand dietary variation of meals (Misselhorn 2005). Atthe national scale, resilience is influenced by factorslike margins of self-sufficiency and financial abilityto balance food deficits with imports from othercountries (e.g. Suweis et al 2015). Other attributesincluding production diversity and the size ofnational grain reserves contribute to the ability toavoid or cope with disruptions and are thereforeused as general indicators of resilience (e.g. Walkerand Salt 2006). Finally, at the global level,factors including the structure of trade networksinfluence the propagation of perturbations betweencountries and overall stability or fragility of theglobalized food system (e.g. D’Odorico et al 2010,Puma et al 2015, Gephart et al 2016, Marchandet al 2016).
Environ. Res. Lett. 12 (2017) 025010
Quantitative methods for tracking changes inresilience remain best developed in ecology (e.g. vanNes and Scheffer 2007, Scheffer et al 2009, Carpenteret al 2011). Key ecosystem variables are monitored andindividually evaluated for reductions in the rate ofreturn to equilibrium after perturbations—known ascritical slowing down—measured as changes inautocorrelation and variance. These methods areeffective at evaluating resilience in a diverse array ofecosystems (Drake and Griffen 2010, Carpenter et al2011, Dakos et al 2012, Kéfi et al 2014). These metricshave subsequently been extended to track changes inthe resilience of socio-ecological networks (Suweis andD’Odorico 2014). The global food system can beconceptualized as a complex network where countriesare nodes with endogenously resilient food productionsystems and consumption, where international tradeconnects nodes and acts as another source ofresilience. The network theory framework has allowedcritical slowing down and related approaches toevaluating changes in resilience to be applied to theglobal food system (e.g. D’Odorico et al 2010, Suweiset al 2015). However, there are important limitationsto applying the resilience metrics developed byecologists to food systems. Specifically, applicationof critical slowing down based resilience metricstested by ecologists assumes there is no difference inkey functional structure between social institutionsand ecosystem processes, an assumption that iscontested by some social scientists (Adger 2000,Barrett and Constas 2014, Olsson et al 2015, Bénéet al 2016). Additionally, critical slowing down basedresilience metrics only indicate that change mayoccur; they do not discriminate between impendingshifts to conditions of decreased human well-being versus transitions to improved humanwell-being (Bauch et al 2016). Hence, existingapproaches cannot yet fully describe patterns andprocesses relative to resilience in the global foodsystem (Béné et al 2016).
A pragmatic way to complement critical slowingdown based resilience metrics is to develop an index-based analysis of the capacity of countries to handleshocks (e.g. Allison et al 2009, Fader et al 2016,Marchand et al 2016). Index based methods rely onsurrogate measures that reflect aspects of resiliencethat are difficult to measure or model (Adger 2000,Carpenter et al 2005). Additionally, directional changein indicators can have explicit interpretations, whereascritical slowing down based methods are moreambiguous about the nature of change (Bauch et al2016). Here, we focus on developing indicators fornational-scale resilience. We have selected the nationalscale for four reasons:
1.
Domestic and foreign policies are set at thenational level and thus provide the context inwhich proximal causes and consequences ofindividual food security or lack thereof occur.3
2.
A recent review found that most analyses ofresilience in food systems are at the household orcommunity scale and broader scale analyses arelacking (Béné et al 2016).3.
National scale indicators of food security areavailable with global coverage. Finer scale (e.g.household) metrics are available, but typically notwith global coverage (Naiken 2003).4.
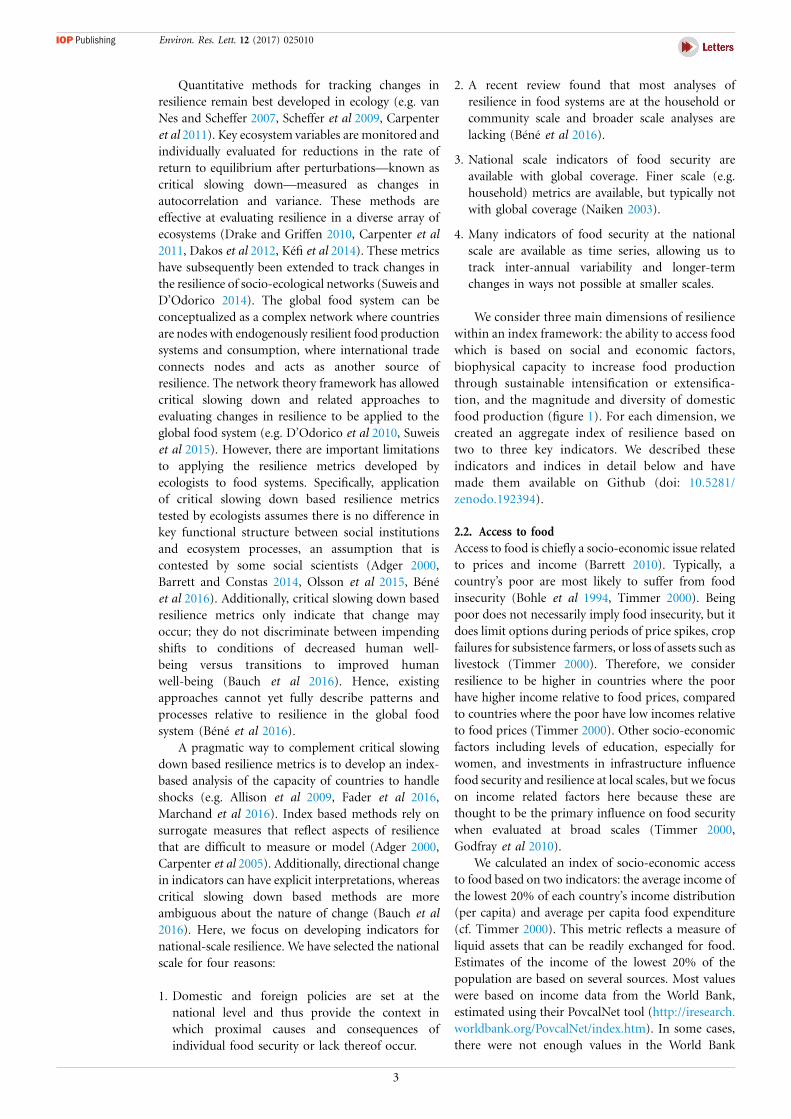
Many indicators of food security at the nationalscale are available as time series, allowing us totrack inter-annual variability and longer-termchanges in ways not possible at smaller scales.We consider three main dimensions of resiliencewithin an index framework: the ability to access foodwhich is based on social and economic factors,biophysical capacity to increase food productionthrough sustainable intensification or extensifica-tion, and the magnitude and diversity of domesticfood production (figure 1). For each dimension, wecreated an aggregate index of resilience based ontwo to three key indicators. We described theseindicators and indices in detail below and havemade them available on Github (doi: 10.5281/zenodo.192394).
2.2. Access to foodAccess to food is chiefly a socio-economic issue relatedto prices and income (Barrett 2010). Typically, acountry’s poor are most likely to suffer from foodinsecurity (Bohle et al 1994, Timmer 2000). Beingpoor does not necessarily imply food insecurity, but itdoes limit options during periods of price spikes, cropfailures for subsistence farmers, or loss of assets such aslivestock (Timmer 2000). Therefore, we considerresilience to be higher in countries where the poorhave higher income relative to food prices, comparedto countries where the poor have low incomes relativeto food prices (Timmer 2000). Other socio-economicfactors including levels of education, especially forwomen, and investments in infrastructure influencefood security and resilience at local scales, but we focuson income related factors here because these arethought to be the primary influence on food securitywhen evaluated at broad scales (Timmer 2000,Godfray et al 2010).
We calculated an index of socio-economic accessto food based on two indicators: the average income ofthe lowest 20% of each country’s income distribution(per capita) and average per capita food expenditure(cf. Timmer 2000). This metric reflects a measure ofliquid assets that can be readily exchanged for food.Estimates of the income of the lowest 20% of thepopulation are based on several sources. Most valueswere based on income data from the World Bank,estimated using their PovcalNet tool (http://iresearch.worldbank.org/PovcalNet/index.htm). In some cases,there were not enough values in the World Bank
Index
Dimesion
Socio-Economic Biophysical Capacity
Resilience
Production Diversity
IndicatorIncome of 20th Percentile
Per Capita Food Expenditure
Socio-Economic Index Biophysical Capacity Index Production Diversity Index
Production Diversity Calories Produced Per Capita
Unused freshwater resourcesUnused arable land resources
Yield gap
Figure 1. Three dimensions of resilience considered in this analysis. A national-scale index was created to track each dimension. Eachindex has global coverage. These dimensions reflect the FAO definition of food security, specifically that all people have physical(biophysical capacity), social and economic access (socio-economic index) to sufficient, safe and nutritious food that meets theirdietary needs and food preferences for an active and healthy life (production diversity index).
Environ. Res. Lett. 12 (2017) 025010
dataset, so we used data from the United NationsUniversity WIID 3.3 database (www.wider.unu.edu/download/WIID3.3). Average food expenditure percapitawas based on the FAODomestic Food Price LevelIndex. This indicator represents the price of food ineach country relative to the United States in purchasingpower parity terms. Datawere not available for all years,so we used logarithmic interpolation to complete timeseries. For 70 countries, this interpolation was based onfive observations during the period 1992–2014. For24 countries it was based on four observations, but withat least one observation before 1990. We combined theincome and food price indicators into a single index bytaking the ratio of income to food price. Lower valuessuggest increasing trade-offs with other critical expen-ditures (e.g. housing) and reduced ability to make-upcaloric deficits through food purchases.
2.3. Biophysical capacity to produce foodWe conceptualize the biophysical capacity to producefood as a function of area of suitable uncultivatedland, untapped freshwater resources, and potential forclosure in agricultural yield gaps (percentage of actualproduction divided by potential production). Increas-ing either of these factors will increase the biophysicalcapacity of countries to ramp-up food productionthrough extensification (putting unused land andwater resources into production) or intensification(decreasing yield gap through nutrient supply,irrigation, or utilizing new technology) in the caseof increased demand or decreased production capacity(Fader et al 2016). Having little unused land or waterresources, or no possibility to reduce yield gap,indicates limited ability to increase food productiondomestically. In this sense biophysical capacitycontributes to resilience as a form of redundancy(e.g. Walker and Salt 2006). Intensification or
4
extensification of agricultural production mainlyoccurs over longer time spans because of the timenecessary to obtain capital, develop these newresources, and distribute technologies to improveyield gaps (Godfray et al 2010).
Here, we use a biophysical capacity indexdeveloped and described by Fader et al (2016). Thisindex is based on three indicators: volume ofrenewable freshwater resources, availability of farm-able land for agricultural extensification, and ability tointensify agriculture as indicated by the yield gap(Fader et al 2016). Briefly, volume of freshwaterresources was estimated based on data from the FAOAQUASTAT database. Unused resources were calcu-lated as the total renewable freshwater resources minuswater withdraws, environmental flow requirements,and the amount of water that is unavailable due toseasonal variability, rainfall intensity, spatial access, orlack of infrastructure. Unused arable land resourceswere estimated based on the HYDE 3.2 land usedatabase (http://themasites.pbl.nl/tridion/en/themasites/hyde/) and the FAO Global Agro-EcologicalZones database. Unused arable land was calculated astotal land area minus land area already used foragriculture (excluding pastures), land not suitable foragriculture, and land used for urban areas and othertypes of human settlement. Finally, yield gap wasestimated as the difference of actual yields for a givenyear and the maximum yields in similar areas givenideal fertilization and irrigation minus actual produc-tion, multiplied by the spare and used areas. Thesemaximum values were estimated following theapproaches of Mueller et al (2012). For each factor,we compiled values for the years 1992–2011. Faderet al (2016) considered a variety of scenariosrepresenting different levels of availability for unusedland and water resources. For the present analysis, we

0.75
0.50
0.25
0.00
Bio
phys
ical
Inde
x
0.75
0.50
0.25
0.00B
ioph
ysic
al In
dex
0 25 50 75
0 25 50 75
3SE Index
SE Index
2
1
0
3
2
1
0
H Index
H Index
A
B
Figure 2. Relationships between the biophysical capacityindicator, the production diversity indicator (h-index), andthe socio-economic indicator (color bar). The dashed linerepresents the food security threshold for the biophysicalcapacity described in the main text. The upper panel displaysdata averaged over the period 1992–1996 and the lower paneldisplays data average over the period 2007–2011. Grey circlesare countries where data were not available for the socialeconomic indicator.
Environ. Res. Lett. 12 (2017) 025010
consider values from the middle scenario. The valuesfor each index were combined into an aggregatebiophysical capacity measure by assuming that landand water were non-substitutable, but that yield gapwas substitutable with these factors. In other words,increasing the amount of available farmland does notincrease biophysical capacity to produce food if thereis not also available water. However, extensifying orpotential for intensifying (yield gap closure) can both(or either) be used to increase biophysical capacity.This index is scaled between 0 and 1, with values lessthan 0.5 indicating limited water, land, or productivityredundancy and an inability to produce at least3000 kcal d�1 per capita, a widely used value of dietaryenergy (Fader et al 2016).
2.4. Production diversityWe consider production diversity to be related to theability of countries to reliably meet food demandthrough domestic production (Pingali et al 2005). Thismeans maintaining a high level of production despite(mostly) stochastic factors, such as weather variationsincluding heat waves and drought, biotic influencesincluding invasive species and pests, plus theconsequences of local management decisions thatinclude salinization and lost production due to over-grazing (Walker and Salt 2006, D’Odorico et al 2010).Average production (kcal per capita) reflects the abilityof countries to meet caloric needs in a typical year, butnot the resilience of countries to short-term shocksthat could decrease food availability over months oryears. For example, a country could have highproduction per capita, but if the majority of caloriesare from just a few commodities, then this supplystream could be vulnerable to crop-specific pests orweather outside the dominant crops’ optimum range.In general, more diverse systems are thought to exhibithigher aggregate stability due to species asynchrony,portfolio effects, and a number of other mechanisms(Chapin et al 2000, Schindler et al 2010, Tilman et al2014). Hence, we consider countries with highproduction for a greater variety of crops to be moreresilient than countries with low production or lowdiversity in production.
We calculated the ‘h-index’ from bibliometricanalyses as an index that balances indicators of totalproduction and breadth of production (Hirsch 2005).First, we calculated the annual domestic productionper capita of each commodity, Ci, in each country:
Ci ¼ Ki=Pi
where Ki is the total kcal produced by a commodityin a given year and country, and Pi is the population.Ki
was determined using the FAO commodities produc-tion database (given in units of weight) and usingthe FAO conversion factors to express Ki in kcal(D’Odorico et al 2014, http://faostat.fao.org). Wefocus on calories instead of other nutritionalcharacteristics (e.g. protein or micronutrient content)
5
because it is easily comparable across countries andis also the basis for the biophysical capacityindicator (Fader et al 2016). For the diversityanalysis, we only considered primary food products,which prevents double counting of caloric produc-tion through the production of secondary products,like flours or processed animal products (D’Odoricoet al 2014). We then calculated each country’sh-index for the years 1992–2011. All Ci were orderedfrom greatest to least and given a rank depending ontheir order in this sequence (i.e. the highest Ci has arank of 1, the second highest has a rank of 2, and soon). Then, we calculated the h-index as the largestrank for which the rank is equal or less than thecorresponding Ci. In other words, an h-index of20 would indicate that a country has 20 commodi-ties that produce at least 20 kcal per capita. Acountry can only score a high xh-index value if it hasa production stream that has high production percapita and is also diverse. For example, a countrythat produced 1 500 kcal per capita of corn, but thenonly 10 kcal per capita of nine other commoditieswould have an h-index of 10.
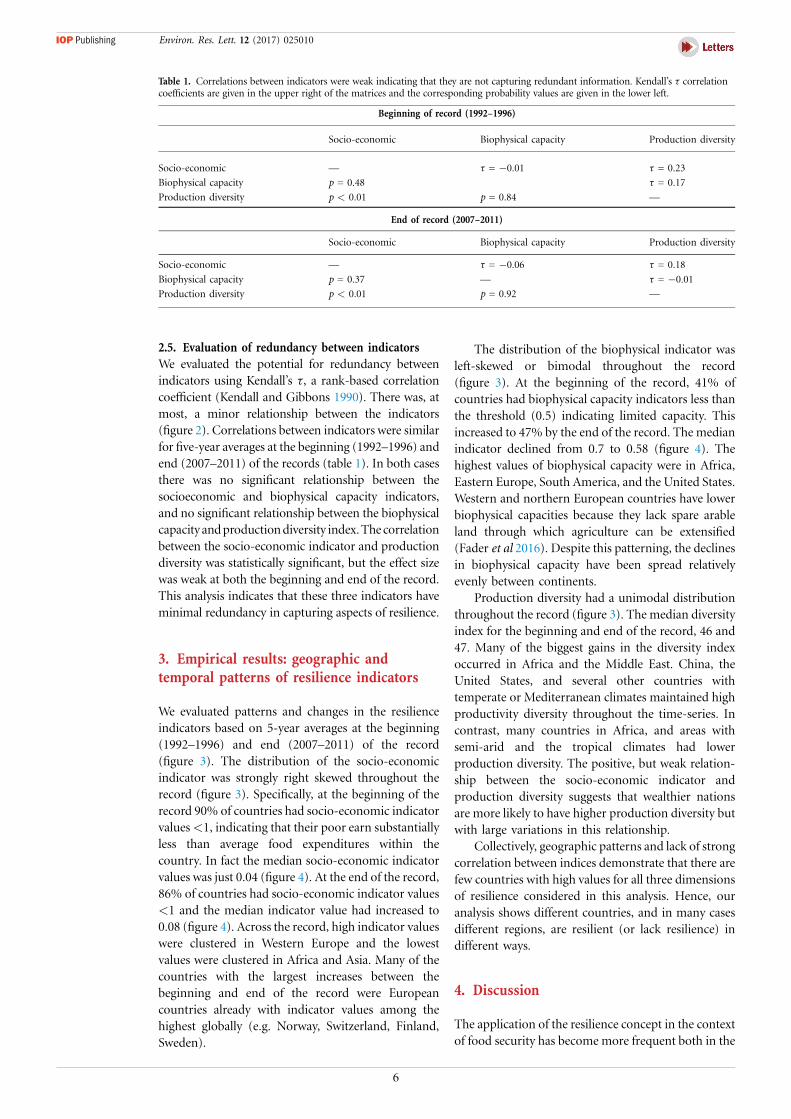
Table 1. Correlations between indicators were weak indicating that they are not capturing redundant information. Kendall’s t correlationcoefficients are given in the upper right of the matrices and the corresponding probability values are given in the lower left.
Beginning of record (1992–1996)
Socio-economic Biophysical capacity Production diversity
Socio-economic — t = �0.01 t = 0.23
Biophysical capacity p = 0.48 t = 0.17
Production diversity p < 0.01 p = 0.84 —
End of record (2007–2011)
Socio-economic Biophysical capacity Production diversity
Socio-economic — t = �0.06 t = 0.18
Biophysical capacity p = 0.37 — t = �0.01
Production diversity p < 0.01 p = 0.92 —
Environ. Res. Lett. 12 (2017) 025010
2.5. Evaluation of redundancy between indicatorsWe evaluated the potential for redundancy betweenindicators using Kendall’s t, a rank-based correlationcoefficient (Kendall and Gibbons 1990). There was, atmost, a minor relationship between the indicators(figure 2). Correlations between indicators were similarfor five-year averages at the beginning (1992–1996) andend (2007–2011) of the records (table 1). In both casesthere was no significant relationship between thesocioeconomic and biophysical capacity indicators,and no significant relationship between the biophysicalcapacity andproductiondiversity index.The correlationbetween the socio-economic indicator and productiondiversity was statistically significant, but the effect sizewas weak at both the beginning and end of the record.This analysis indicates that these three indicators haveminimal redundancy in capturing aspects of resilience.
3. Empirical results: geographic andtemporal patterns of resilience indicators
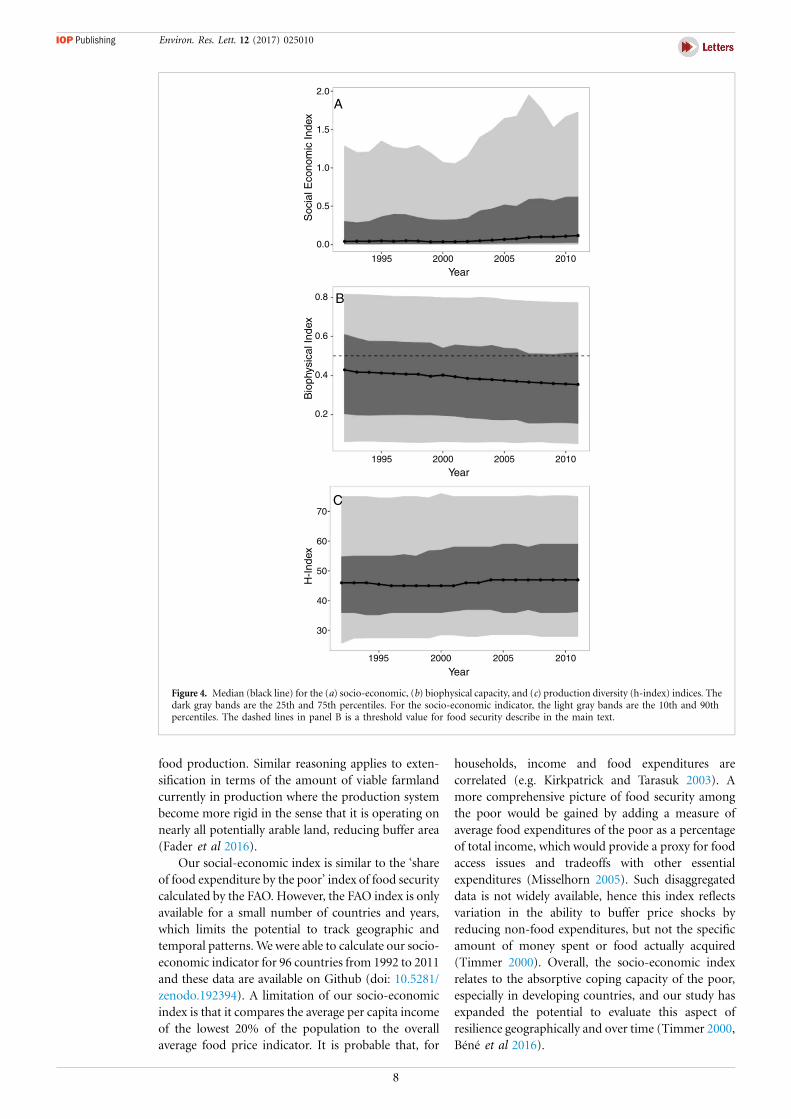
We evaluated patterns and changes in the resilienceindicators based on 5-year averages at the beginning(1992–1996) and end (2007–2011) of the record(figure 3). The distribution of the socio-economicindicator was strongly right skewed throughout therecord (figure 3). Specifically, at the beginning of therecord 90% of countries had socio-economic indicatorvalues<1, indicating that their poor earn substantiallyless than average food expenditures within thecountry. In fact the median socio-economic indicatorvalues was just 0.04 (figure 4). At the end of the record,86% of countries had socio-economic indicator values<1 and the median indicator value had increased to0.08 (figure 4). Across the record, high indicator valueswere clustered in Western Europe and the lowestvalues were clustered in Africa and Asia. Many of thecountries with the largest increases between thebeginning and end of the record were Europeancountries already with indicator values among thehighest globally (e.g. Norway, Switzerland, Finland,Sweden).
6
The distribution of the biophysical indicator wasleft-skewed or bimodal throughout the record(figure 3). At the beginning of the record, 41% ofcountries had biophysical capacity indicators less thanthe threshold (0.5) indicating limited capacity. Thisincreased to 47% by the end of the record. The medianindicator declined from 0.7 to 0.58 (figure 4). Thehighest values of biophysical capacity were in Africa,Eastern Europe, South America, and the United States.Western and northern European countries have lowerbiophysical capacities because they lack spare arableland through which agriculture can be extensified(Fader et al 2016). Despite this patterning, the declinesin biophysical capacity have been spread relativelyevenly between continents.
Production diversity had a unimodal distributionthroughout the record (figure 3). The median diversityindex for the beginning and end of the record, 46 and47. Many of the biggest gains in the diversity indexoccurred in Africa and the Middle East. China, theUnited States, and several other countries withtemperate or Mediterranean climates maintained highproductivity diversity throughout the time-series. Incontrast, many countries in Africa, and areas withsemi-arid and the tropical climates had lowerproduction diversity. The positive, but weak relation-ship between the socio-economic indicator andproduction diversity suggests that wealthier nationsare more likely to have higher production diversity butwith large variations in this relationship.
Collectively, geographic patterns and lack of strongcorrelation between indices demonstrate that there arefew countries with high values for all three dimensionsof resilience considered in this analysis. Hence, ouranalysis shows different countries, and in many casesdifferent regions, are resilient (or lack resilience) indifferent ways.
4. Discussion
The application of the resilience concept in the contextof food security has become more frequent both in the
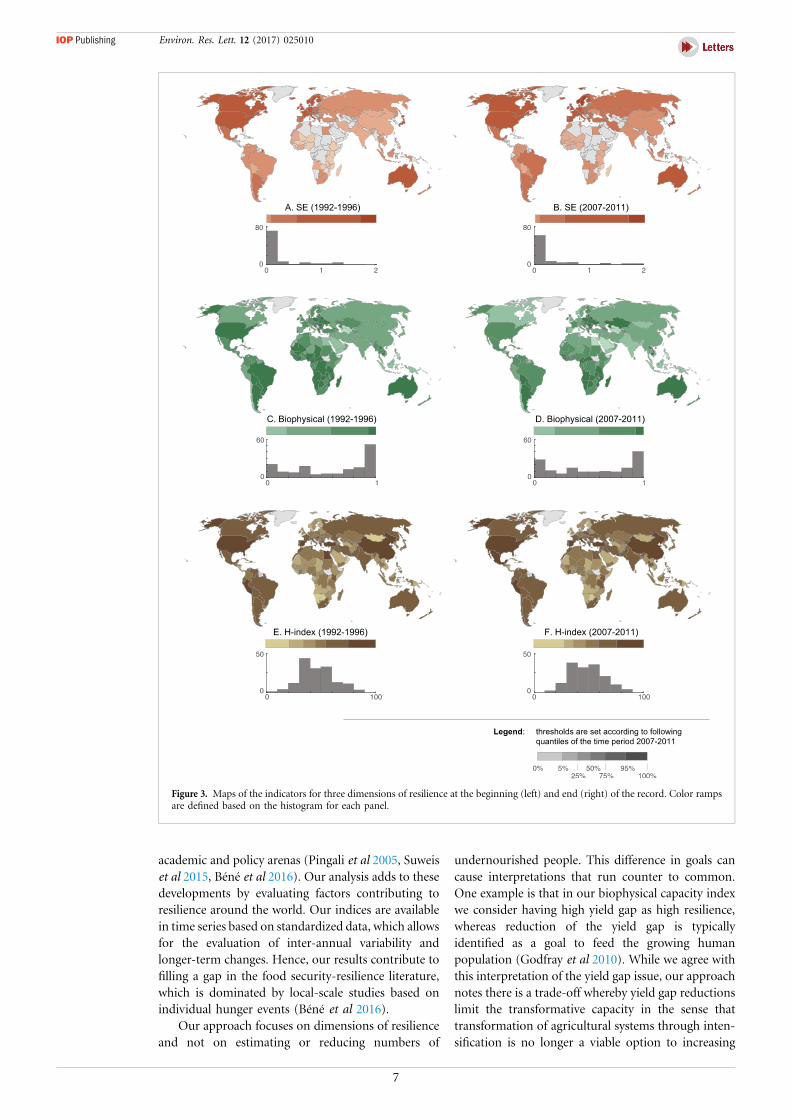
Figure 3. Maps of the indicators for three dimensions of resilience at the beginning (left) and end (right) of the record. Color rampsare defined based on the histogram for each panel.
Environ. Res. Lett. 12 (2017) 025010
academic and policy arenas (Pingali et al 2005, Suweiset al 2015, Béné et al 2016). Our analysis adds to thesedevelopments by evaluating factors contributing toresilience around the world. Our indices are availablein time series based on standardized data, which allowsfor the evaluation of inter-annual variability andlonger-term changes. Hence, our results contribute tofilling a gap in the food security-resilience literature,which is dominated by local-scale studies based onindividual hunger events (Béné et al 2016).
Our approach focuses on dimensions of resilienceand not on estimating or reducing numbers of
7
undernourished people. This difference in goals cancause interpretations that run counter to common.One example is that in our biophysical capacity indexwe consider having high yield gap as high resilience,whereas reduction of the yield gap is typicallyidentified as a goal to feed the growing humanpopulation (Godfray et al 2010). While we agree withthis interpretation of the yield gap issue, our approachnotes there is a trade-off whereby yield gap reductionslimit the transformative capacity in the sense thattransformation of agricultural systems through inten-sification is no longer a viable option to increasing
2.0
1.5
1.0
0.5
0.0
1995 2000 2005 2010
Soc
ial E
cono
mic
Inde
x
Year
0.8
0.6
0.4
0.2
1995 2000 2005 2010
Bio
phys
ical
Inde
x
70
60
50
40
30
H-I
ndex
Year
1995 2000 2005 2010
Year
C
B
A
Figure 4. Median (black line) for the (a) socio-economic, (b) biophysical capacity, and (c) production diversity (h-index) indices. Thedark gray bands are the 25th and 75th percentiles. For the socio-economic indicator, the light gray bands are the 10th and 90thpercentiles. The dashed lines in panel B is a threshold value for food security describe in the main text.
Environ. Res. Lett. 12 (2017) 025010
food production. Similar reasoning applies to exten-sification in terms of the amount of viable farmlandcurrently in production where the production systembecome more rigid in the sense that it is operating onnearly all potentially arable land, reducing buffer area(Fader et al 2016).
Our social-economic index is similar to the ‘shareof food expenditure by the poor’ index of food securitycalculated by the FAO. However, the FAO index is onlyavailable for a small number of countries and years,which limits the potential to track geographic andtemporal patterns. We were able to calculate our socio-economic indicator for 96 countries from 1992 to 2011and these data are available on Github (doi: 10.5281/zenodo.192394). A limitation of our socio-economicindex is that it compares the average per capita incomeof the lowest 20% of the population to the overallaverage food price indicator. It is probable that, for
8
households, income and food expenditures arecorrelated (e.g. Kirkpatrick and Tarasuk 2003). Amore comprehensive picture of food security amongthe poor would be gained by adding a measure ofaverage food expenditures of the poor as a percentageof total income, which would provide a proxy for foodaccess issues and tradeoffs with other essentialexpenditures (Misselhorn 2005). Such disaggregateddata is not widely available, hence this index reflectsvariation in the ability to buffer price shocks byreducing non-food expenditures, but not the specificamount of money spent or food actually acquired(Timmer 2000). Overall, the socio-economic indexrelates to the absorptive coping capacity of the poor,especially in developing countries, and our study hasexpanded the potential to evaluate this aspect ofresilience geographically and over time (Timmer 2000,Béné et al 2016).
Environ. Res. Lett. 12 (2017) 025010
The production diversity index in our analysisrelates to the absorptive and adaptive capacities ofagricultural production, which are key dimensions ofresilience, while the biophysical capacity indexaccounts for the ability of the system to transformagricultural systems through intensification or exten-sification. How these characteristics play out inpractice depends on local factors. For example, Japanhas little ability to transform its food productionsystem in the sense that it lacks arable land forextensification. Many African countries, like Angolaand Ghana have a high biophysical capacity, but theactual ability to transform agricultural systemsdepends on the strength of local institutions, theability to raise capital to convert land for agricultureand implement technologies and strategies forsustainable intensification like integrated crop watermanagement, and the cultural acceptance of change(Béné et al 2016, Jägermeyr et al 2016, MacDonaldet al 2016). On the other hand, a country like Japanmay have strong institutions and large amounts ofcapital, but the biophysical limits of the country willalways constrain the transformability of agriculturalproduction. Connecting our indices with the specificeconomics, governance, institutions, and cultures ofevery country is beyond the scope of a single paper.However, these examples demonstrateboth theutility ofthe global context contributed by our analysis, as well asthe need to integrate across scales and socio-environ-mental factors, tohave a completepicture of resilience inthe global food system.
Our analysis does not explicitly account for theinfluence of international trade. Twenty-four percentof food produced globally is traded between countriesand the specific patterns of trade connections betweencountries may amplify or muffle the transmission ofproduction shocks to consumers (D’Odorico et al2014, d’Amour et al 2016, Marchand et al 2016). Theactual impact of trade-related shocks reflects a varietyof factors, but a key one is the self-sustainability ofcrop production for a variety of crops that areconsumed domestically (d’Amour et al 2016). To alarge extent, our production diversity index reflects theability of a country to be self-sufficient and to be self-sufficient for a variety of commodities, and henceintegrates some of the key factors influencingvulnerability to shocks propagated through trade.Other factors include the numbers of people living inextreme poverty and this is, to some extent, integratedwithin our socio-economic indicator (d’Amour et al2016). Analyses of cereal trade networks and fish tradenetworks have identified certain regions, especiallyCentral and West Africa, as susceptible to trade shocks(Gephart et al 2016, Marchand et al 2016). Ouranalysis finds that many of these countries have lowsocio-economic index values (where available), lowproduction diversity, but high biophysical capacity.Hence our results reflect the influence of trade on
9
resilience and emphasize the complex nature of foodsystems’ resilience.
5. Conclusions
Achieving food security requires food production anddistribution systems that are resilient todisruption. Thisstudy provides national-scale indices of food systemsresilience with global coverage from 1992 to 2011. Ouroverallfinding is that very fewcountries have exclusivelyhigh or low values for all dimensions, emphasizingthe complexity and heterogeneity of the global foodsystem. These indices create the opportunity for globalcomparisons of resilience between nations, and providecontext for developing generalizations about theresilience in the global food system.
Acknowledgments
Thispaper is basedonresearch supportedby theNationalSocio-Environmental Synthesis Center (SESYNC) withfunding received from the National Science FoundationDBI-1052875.MFader received additional support fromthe LabexOT-Med (noANR-11-LABX-0061) funded bythe French Government «Investissements d’Avenir»program of the French National Research Agency(ANR) through the A�MIDEX project (no ANR-11-IDEX-0001-02), and the European Union’s SeventhFramework Programme for research, technologicaldevelopment and demonstration under the projectLUC4C (grant agreement number 603542). M Kummureceived support from the Academy of Finland SRCproject Winland and Academy of Finland projectSCART. Z Ratajczak received additional support fromthe National Science Foundation (DBI 1402033). M JPuma gratefully acknowledges support from the Colum-bia University Center for Climate and Life, where he is aClimate and Life Fellow, and from the InterdisciplinaryGlobal Change Research under NASA cooperativeagreement NNX14AB99A supported by the NASAClimate and Earth Observing Program. A Tavoni issupported by the Centre for Climate Change Economicsand Policy, funded by the ESRC, and the GranthamFoundation for the Protection of the Environment. Wethank Christina Prell and Roberto Patricio Korzeniewiczfor helpful conversations.
References
Adger W N 2000 Social and ecological resilience: are theyrelated? Prog. Hum. Geog. 24 347–64
Allison E H et al 2009 Vulnerability of national economies tothe impacts of climate change on fisheries Fish Fish. 10173–96
Baldos U L C and Hertel T W 2015 The role of internationaltrade in managing food security risks from climate changeFood Sec. 7 275–90
Environ. Res. Lett. 12 (2017) 025010
Barrett C B 2010 Measuring food insecurity Science 327 825–8Barrett C B and Constas M A 2014 Toward a theory of resilience
for international development applications Proc. Natl Acad.Sci. USA 111 14625–30
Bauch C T et al 2016 Early warning signals of regime shifts incoupled human-environment systems Proc. Natl Acad. Sci.USA
Baum S D et al 2015 Resilience to global food supplycatastrophes Environ. Syst. Decis. 35 301–13
Béné C et al 2016 Is resilience a useful concept in the context offood security and nutrition programmes? Some conceptualand practical considerations Food Sec. 8 123–38
Berazneva J and Lee D R 2013 Explaining the African food riotsof 2007–2008: an empirical analysis Food Policy 39 28–39
Bohle H G et al 1994 Climate change and social vulnerability:toward a sociology and geography of food insecurity Glob.Environ. Change 4 37–48
Carpenter S R et al 2001 From metaphor to measurement:resilience of what to what? Ecosystems 4 765–81
Carpenter S R et al 2005 Surrogates for resilience of social-ecological systems Ecosystems 8 941–4
Carpenter S R et al 2011 Early warnings of regime shifts: awhole-ecosystem experiment Science 332 1079–82
Chapin F S et al 2000 Consequences of changing biodiversityNature 405 234–42
Dakos V et al 2012 Methods for detecting early warnings ofcritical transitions in time series illustrated using simulatedecological data PLoS ONE 7 e41010
d’Amour C B, et al 2016 Teleconnected food supply shocksEnviron. Res. Lett. 11 035007
D’Odorico P et al 2010 Does globalization of water reducesocietal resilience to drought? Geophys. Res. Lett. 37L13403
D’Odorico P et al 2014 Feeding humanity through global foodtrade Earth’s Future 2 458–69
Drake J M and Griffen B D 2010 Early warning signals ofextinction in deteriorating environments Nature 467 456–9
Fader M et al 2013 Spatial coupling of agricultural productionand consumption: quantifying dependences of countrieson food imports due to domestic land and waterconstraints Environ. Res. Lett. 8 014046
Fader M et al 2016 Past and present biophysical redundancy ofcountries as a buffer to changes in food supply Environ.Res. Lett. 11 055008
FAO 2001 The State of Food Insecurity in the World (Rome:FAO)
Foley J A et al 2011 Solutions for a cultivated planet Nature 478337–42
Folke C et al 2010 Resilience thinking: integrating resilience,adaptability and transformability Ecol. Soc. 15 art 20
Fraser E D G et al 2005 A framework for assessing thevulnerability of food systems to future shocks Futures37 465–79
Gephart J A and Pace M L 2015 Structure and evolution of theglobal seafood trade network Environ. Res. Lett. 10 125014
Gephart J A et al 2016 Vulnerability to shocks in the globalseafood trade network Environ. Res. Lett. 11 035008
Gephart J A et al 2017 Shocks to fish production: identification,trends, and consequences Glob. Environ. Change 42 24–32
Godfray H C J et al 2010 Food security: the challenge of feeding9 billion people Science 327 812–8
Hirsch J E 2005 An index to quantify an individual’s scientificresearch output Proc. Natl Acad. Sci. USA 102 16569–72
Holling C S 1973 Resilience and stability of ecological systemsAnnu. Rev. Ecol. Syst. 4 1–23
10
Jägermeyr J et al 2016 Integrated crop water management mightsustainably halve the global food gap Environ. Res. Lett. 11025002
Kéfi S et al 2014 Early warning signals of ecological transitions:methods for spatial patterns PLoS ONE 9 e92097
Kendall M G and Gibbons J D 1990 Rank Correlation Methods5th edn (New York: Oxford University Press)
Kirkpatrick S and Tarasuk V 2003 The relationship between lowincome and household food expenditure patterns inCanada Public Health Nutr. 6 589–96
Lagi M et al 2011 The food crises and political instability inNorth Africa and the Middle East (arXiv: 1108.2455v1)
MacDonald G K et al 2015 Rethinking agricultural traderelationships in an era of globalization BioScience 65 275–89
MacDonald G K et al 2016 Pathways to sustainable intensificationthrough crop water management Environ. Res. Lett. 11091001
Marchand P et al 2016 Reserves and trade jointly determineexposure to food supply shocks Environ. Res. Lett. 11095009
Misselhorn A A 2005 What drives food insecurity in southernAfrica? A meta-analysis of household economy studiesGlob. Environ. Change 15 33–43
Mueller N D et al 2012 Closing yield gaps through nutrient andwater management Nature 490 254–7
Naiken L 2003 FAO methodology for estimating the prevalenceof undernourishment Measurement and Assessment of FoodDeprivation and Undernutrition Food and AgriculturalOrganization of the United Nations (www.fao.org/docrep/005/Y4249E/y4249e00.htm#Contents)
Olsson L et al 2015 Why resilience is unappealing to socialscience: theoretical and empirical investigations of thescientific use of resilience Sci. Adv. 1 e1400217
Pingali P et al 2005 Food security in complex emergencies:enhancing food system resilience Disasters 29 S5–S24
Porkka M et al 2013 From food insufficiency towards tradedependency: a historical analysis of global food availabilityPLoS ONE 8 e82714
Puma M J et al 2015 Assessing the evolving fragility of the globalfood system Environ. Res. Lett. 10 024007
Ridolfi L et al 2015 Indicators of collapse in systems undergoingunsustainable growth Bull. Math. Biol. 77 339–47
Scheffer M et al 2009 Early-warning signals for criticaltransitions Nature 461 53–9
Schipanski M E et al 2016 Realizing resilient food systemsBioScience 66 600–10
Schindler D E et al 2010 Population diversity and the portfolioeffect in an exploited species Nature 465 609–12
Suweis S and D’Odorico P 2014 Early warning signs in social-ecological networks PLoS ONE 9 e101851
Suweis S et al 2015 Resilience and reactivity of global foodsecurity Proc. Natl Acad. Sci. USA 112 6902–7
Tilman D et al 2014 Biodiversity and ecosystem functioningAnnu. Rev. Ecol. Evol. Syst. 45 471–93
Timmer C P 2000 The macro dimensions of food security:economic growth, equitable distribution, and food pricestability Food Policy 25 283–95
Van Nes E H and Scheffer M 2007 Slow recovery fromperturbations as a generic indicator of a nearbycatastrophic shift Am. Nat. 169 738–47
Walker B et al 2004 Resilience, adaptability and transformabilityin social-ecological systems Ecol. Soc. 9 5
Walker B and Salt D 2006 Resilience Thinking: SustainingEcosystems and People in a Changing World (Washington,DC: Island Press)


![Joel Abshier decen - Luginbuel Funeral Homeassets.luginbuel.com/genealogy/documents//Abshier, Joel Family.pdfDescendants of Joel Abshier Generation 1 1. Joel Abshier-1[1] ... She married](https://img.pdfslide.net/doc/110x75/5aae9f3d7f8b9a3a038c5dc9/joel-abshier-decen-luginbuel-funeral-joel-familypdfdescendants-of-joel-abshier.jpg)