Embed Size (px)
Citation preview
China/Hong Kong | Technology
Please read the analyst certification and other important disclosures on last page
PAX Global (327 HK) 18 October 2013
Seeking its fortune abroad
PAX Global experienced four-fold revenue growth in 2007-2012. Net income grew nearly three times during the same period as China’s economy took off and its people grew more accustomed to using non-cash transactions. In 2010, revenue grew 47% YoY, catapulting PAX to the top of China’s EFT-POS market with 30% market share. We expect the company to maintain its share of the China market while expanding global market share.
We initiate coverage on PAX Global with an Outperform rating and target price of HK$3.95 based on 16x FY14F P/E, the same P/E ratio as the top-two international players, VeriFone (PAY US, Not Rated) and Ingenico (ING FP, Not Rated).
Analysts Eric Qiu (852) 2533 2479 [email protected] Ronnie Ho (852) 2533 2486 [email protected]

PAX Global (327 HK) 18 October 2013
2
Table of Contents
Seeking its fortune abroad.......................................................................................................................... 3
PAX Global – financial summary ................................................................................................................ 4
Investment summary .................................................................................................................................. 5
Valuation..................................................................................................................................................... 6
Company overview ..................................................................................................................................... 7
Wide range of products............................................................................................................................... 8
Diversified customer base ........................................................................................................................ 10
Vast room for growth within the China market .......................................................................................... 13
Riding the global EFT-POS growth cycle ................................................................................................. 16
Strong R&D and industry certifications are advantages ........................................................................... 19
Financial projections and valuation .......................................................................................................... 22

PAX Global (327 HK) 18 October 2013
3
PAX Global (327 HK)
Seeking its fortune abroad Company Rating:
Outperform (initiation)
Initiate coverage with Outperform rating and HK$3.95target price. The global electronic funds transfer point-of-sale (EFT-POS) industry is trending up. PAX Global is riding this wave and stands a good chance ofachieving three-year revenue CAGR of 20% and net profit CAGR of 15%. We forecast PAX’s net cash at the end of 2013F to reach HK$1.40. Our target price for the company suggests 33% potential upside. It is based on c.16x 2014FP/E, the same P/E as its global peers.
China EFT-POS industry leader. PAX is the leading EFT-POS developer in China, with 30% market share. Itscustomers include China UnionPay (UMS), the large Chinese commercial banks, financial institutions andthird-party payment companies like Allinpay, ChinaPNR,
Vbill and Lakala. We like PAX for its leading position in abooming industry and its increasing orders from third-party payment companies.
Expanding overseas market share. In terms of global EFT-POS shipment volume, PAX ranked fourth in 2011, up from seventh in 2010. Global expansion is critical to PAX’s long-term growth prospects. Revenue from overseas markets including APAC, LACIS, EMEA and the USCA region has grown five-fold in the past four years. We expect overseas revenue to triple in the next four years and to account for 40% or more of total revenue.
Strong R&D and industry certifications are competitive advantages. Security, reliability and compatibility are critical to the payment industry. This is why standards and requirements imposed on EFT-POS suppliers are so strict. PAX has invested heavily in R&D for many years. Its R&D team accounts for over 55% of its 611 employees.
Financial forecast Year to 31 December 2011 2012 2013F 2014F 2015F
Revenue (HK$m) 1,103 1,313 1,577 1,913 2,299
Growth (%) 52.5 19.0 20.1 21.3 20.2
Operating profit (HK$m) 207 222 252 306 368
Net profit (HK$m) 182 183 212 257 309
Growth (%) 25.0 0.6 15.9 21.3 20.2
EPS (HK$) 0.175 0.176 0.204 0.247 0.297
P/E (x) 17.2 17.1 17.2 14.1 11.8
P/B (x) 2.0 1.7 1.8 1.6 1.4
ROE (%) 9.1 8.3 8.6 9.1 9.6
Source: Company data, CCBIS estimates
Price: HK$2.97
Target: HK$3.95 (initiation)
Trading data
52-week range HK$1.28-3.65
Market capitalization (m) HK$3,221/US$418
Shares outstanding (m) 1,039
Free float (%) 57
3M average daily T/O (m share) 3.0
3M average daily T/O (US$m) 1.0
Expected return (%) – 1 year 33.0
Price as at close on 17 October 2013
Stock price vs. HSCEI
1.0
1.5
2.0
2.5
3.0
3.5
4.0
18-Oct-12 9-Dec-12 30-Jan-13 23-Mar-13 14-May-13 5-Jul-13 26-Aug-13 17-Oct-13
HK$
PAX HSCEI (rebased)
Source: Bloomberg
Eric Qiu (852) 2533 2479 [email protected] Ronnie Ho (852) 2533 2486 [email protected]
PAX Global (327 HK) 18 October 2013
4
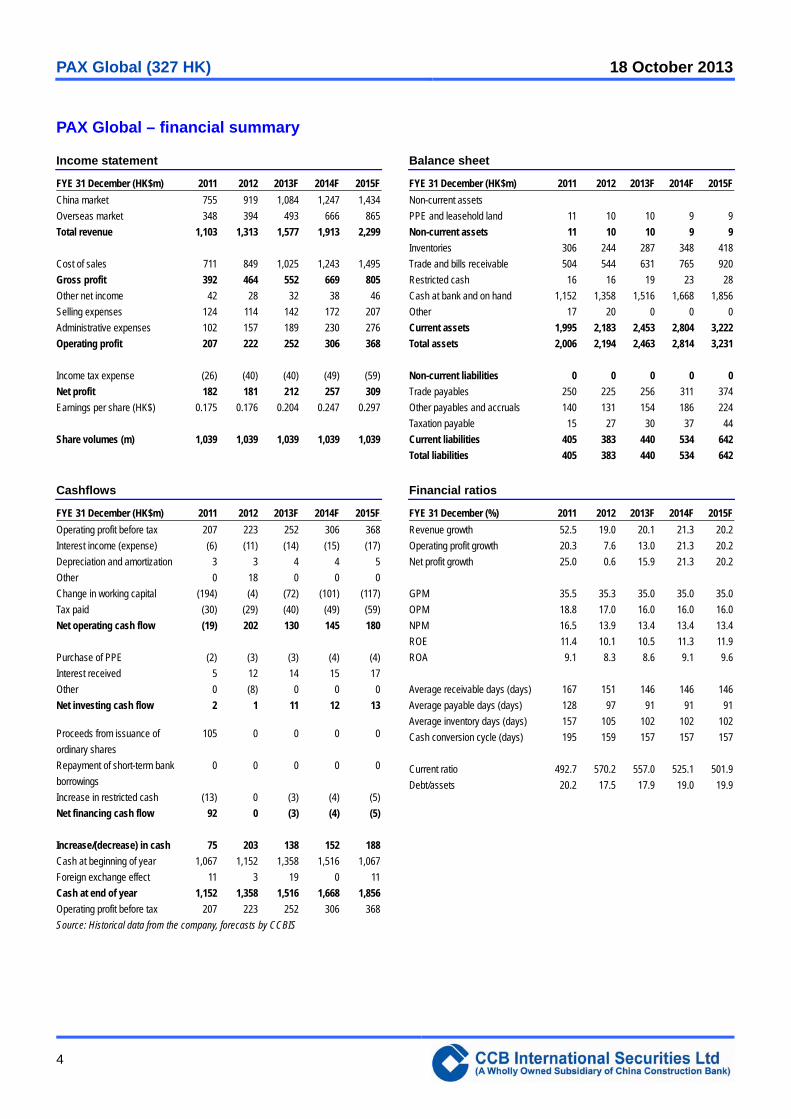
PAX Global – financial summary
Income statement Balance sheet
FYE 31 December (HK$m) 2011 2012 2013F 2014F 2015F
China market 755 919 1,084 1,247 1,434
Overseas market 348 394 493 666 865
Total revenue 1,103 1,313 1,577 1,913 2,299
Cost of sales 711 849 1,025 1,243 1,495
Gross profit 392 464 552 669 805
Other net income 42 28 32 38 46
Selling expenses 124 114 142 172 207
Administrative expenses 102 157 189 230 276
Operating profit 207 222 252 306 368
Income tax expense (26) (40) (40) (49) (59)
Net profit 182 181 212 257 309
Earnings per share (HK$) 0.175 0.176 0.204 0.247 0.297
Share volumes (m) 1,039 1,039 1,039 1,039 1,039
FYE 31 December (HK$m) 2011 2012 2013F 2014F 2015F
Non-current assets
PPE and leasehold land 11 10 10 9 9
Non-current assets 11 10 10 9 9
Inventories 306 244 287 348 418
Trade and bills receivable 504 544 631 765 920
Restricted cash 16 16 19 23 28
Cash at bank and on hand 1,152 1,358 1,516 1,668 1,856
Other 17 20 0 0 0
Current assets 1,995 2,183 2,453 2,804 3,222
Total assets 2,006 2,194 2,463 2,814 3,231
Non-current liabilities 0 0 0 0 0
Trade payables 250 225 256 311 374
Other payables and accruals 140 131 154 186 224
Taxation payable 15 27 30 37 44
Current liabilities 405 383 440 534 642
Total liabilities 405 383 440 534 642
Cashflows Financial ratios
FYE 31 December (HK$m) 2011 2012 2013F 2014F 2015F
Operating profit before tax 207 223 252 306 368
Interest income (expense) (6) (11) (14) (15) (17)
Depreciation and amortization 3 3 4 4 5
Other 0 18 0 0 0
Change in working capital (194) (4) (72) (101) (117)
Tax paid (30) (29) (40) (49) (59)
Net operating cash flow (19) 202 130 145 180
Purchase of PPE (2) (3) (3) (4) (4)
Interest received 5 12 14 15 17
Other 0 (8) 0 0 0
Net investing cash flow 2 1 11 12 13
Proceeds from issuance of
ordinary shares
105 0 0 0 0
Repayment of short-term bank
borrowings
0 0 0 0 0
Increase in restricted cash (13) 0 (3) (4) (5)
Net financing cash flow 92 0 (3) (4) (5)
Increase/(decrease) in cash 75 203 138 152 188
Cash at beginning of year 1,067 1,152 1,358 1,516 1,067
Foreign exchange effect 11 3 19 0 11
Cash at end of year 1,152 1,358 1,516 1,668 1,856
Operating profit before tax 207 223 252 306 368
FYE 31 December (%) 2011 2012 2013F 2014F 2015F
Revenue growth 52.5 19.0 20.1 21.3 20.2
Operating profit growth 20.3 7.6 13.0 21.3 20.2
Net profit growth 25.0 0.6 15.9 21.3 20.2
GPM 35.5 35.3 35.0 35.0 35.0
OPM 18.8 17.0 16.0 16.0 16.0
NPM 16.5 13.9 13.4 13.4 13.4
ROE 11.4 10.1 10.5 11.3 11.9
ROA 9.1 8.3 8.6 9.1 9.6
Average receivable days (days) 167 151 146 146 146
Average payable days (days) 128 97 91 91 91
Average inventory days (days) 157 105 102 102 102
Cash conversion cycle (days) 195 159 157 157 157
Current ratio 492.7 570.2 557.0 525.1 501.9
Debt/assets 20.2 17.5 17.9 19.0 19.9
Source: Historical data from the company, forecasts by CCBIS

PAX Global (327 HK) 18 October 2013
5
Investment summary
We initiate coverage on PAX Global with an Outperform rating and target price of HK$3.95 based on 16x FY14F P/E, the same P/E ratio as the top-two international players, VeriFone (PAY US, Not Rated) and Ingenico (ING FP, Not Rated). PAX has a smaller revenue base than these two rivals but more promising future growth. Our target P/E ratio for PAX is much lower than the average FY14F P/E ratio of 25.6x for A-share listed EFT-POS companies, mainly due to differences in sentiment surrounding the A-share and H-share markets.
PAX experienced four-fold revenue growth in the period from FY07 to FY12. Net income grew nearly three times during this time as China’s economy took off and its people grew more accustomed to using non-cash transactions in daily life. PAX accounted for 30% of China’s and 6% of global annual EFT-POS shipments in 2012. Looking forward, we expect the company to maintain its share of the China market while expanding its share of the global market. We have a positive outlook on the company’s prospects based on the following factors.
Steadily growing revenue from the China market. China has low EFT-POS penetration but stable growth in EFT-POS deployment from financial institutions and third-party payment companies. In China, there are less than 5 EFT-POS machines per 1,000 people, compared with nearly 35 for every 1,000 people in the US. With a current installment base of less than 8m EFT-POS units in China in 2013F, we expect five-fold growth for total EFT-POS installments in China from 2012 to 2020F. As the top domestic player, PAX will be the greatest beneficiary of this trend.
Increasing orders from the emerging third-party payment industry. Domestically, PAX’s major customers include China UMS, the Big-four Chinese banks and other financial institutions, and China Mobile. However, as the People's Bank of China (PBOC) has accredited 250 third-party payment companies in the last two years, orders from these companies have taken off, accounting for 30% of PAX’s shipment volume in 1H13. Given the reputable PAX brand, we believe more orders from third-party payment companies will be forthcoming.
Expanding global market share. PAX accounted for about 6% of the 20m EFT-POS units shipped globally in 2012. PAX is gradually penetrating every major EFT-POS market and has sufficient cash reserves to engage in M&A to expand market share should the opportunity arise. The company shipped to customers in over 50 overseas countries and regions in 2012 and continues to broaden its customer base. As alluded to above, with HK$1.2b net cash on hand and healthy net operating cash flow projections, we believe the company is fully capable of taking advantage of M&A opportunities to expand global market share.
Risks: (1) A slowdown in China’s economy leading to margin squeeze from the banks, which constitute 25% of PAX’s revenue, (2) intense competition causing margin erosion, (3) policy changes or disruptive technologies.

PAX Global (327 HK) 18 October 2013
6
Valuation
Our target price on PAX of HK$3.95 is based on 16x FY14F P/E, the same P/E as the top-two international players, VeriFone and Ingenico. PAX has a smaller revenue base than these two rivals but more promising future growth. PAX’s P/E ratio is significantly lower than two other EFT-POS companies listed on the A-share market that have lower market share than PAX.
EFT-POS companies valuation matrix
CCBIS Share price* Market cap P/E (x) P/B (x)
Company Stock code rating (local currency) (US$m) CY13F CY14F CY15F CY13F CY14F CY15F
China EFT-POS companies
Shenzhen Xinguodu Technology 300130 CH Not Rated 14.69 275 25.3 22.0 19.8 1.8 1.7 1.6
Fujian Newland Computer 000997 CH Not Rated 15.33 1,283 35.7 29.2 18.7 5.4 5.1 4.8
Average 30.5 25.6 19.2 3.6 3.4 3.2
International EFT-POS companies
VeriFone PAY US Not Rated 22.10 2,414 15.4 14.2 11.6 1.7 1.6 1.5
Ingenico ING FP Not Rated 53.93 3,880 20.5 17.1 14.5 3.4 3.2 2.8
Average 17.9 15.7 13.1 2.6 2.5 2.3
PAX Global 327 HK Outperform 3.10 418 14.1 11.6 9.7 1.7 1.4 1.2
* Closing price as of 16 October 2013
Source: Bloomberg, CCBIS estimates
PAX price performance vs. other EFT-POS companies PAX forward P/E bands
0.8
1.4
2.0
2.6
3.2
3.8
4.4
5.0
5.6
6.2
3-Jan-11 20-Jun-11 5-Dec-11 21-May-12 5-Nov-12 22-Apr-13 7-Oct-13
HK$
PAX Xinguodu (rebased) Newland (rebased)VeriFone (rebased) Ingenico (rebased)
Mean
-1s.d.
+1s.d.
-2s.d.
+2s.d.
2x
5x
8x
11x
14x
17x
Nov-11 Feb-12 May-12 Sep-12 Dec-12 Mar-13 Jul-13 Oct-13
Source: Bloomberg Source: Bloomberg
PAX Global (327 HK) 18 October 2013
7
Company overview
PAX is headquartered in Hong Kong but its R&D and operational center is based in Shenzhen. PAX was founded in 2001. Since then, it has evolved into one of the leading terminal solution providers in China. In terms of domestic EFT-POS sales volume, PAX has a leading position of around 30% market share in China as of 2012, ahead of domestic players like Xinguodu (300130 CH, Not Rated) and Newland (000997 CH, Not Rated). According to Nilson, an authoritative magazine on the payment industry, PAX ranked fourth globally in terms of EFT-POS terminal shipment volume in 2011. Excluding the no. 3 player, SZZT Electronics, a tele-POS machine manufacturer, PAX ranks third in terms of EFT-POS terminal shipment volume (2011), just behind Ingenico, a French company, and VeriFone a US company.
PAX belongs to the payment industry sub-sector. It offers a comprehensive range of products ranging from EFT-POS terminals, consumer-activated devices, contactless devices and services. Product assembly and processing is outsourced to a Japanese EMS factory, PKS based in Guangzhou. PAX focuses on product design and new technology innovation. Its EFT-POS products, including the S-series, D-series and P-series, together accounted for nearly 90% of the company’s annual revenue. These products are able to process a wide range of electronic payment types, including signature and PIN-based debit cards, credit cards, contactless/radio frequency identification cards, RF-enabled mobile phones, IC cards, pre-paid gifts and EFT-software. As penetration of EFT-POS in China is still low and as financial institutions and third-party payment service providers continue to build their EFT-POS networks, we believe the industry as well as annual shipment volume will continue to expand. In the long run, service and other innovative business models are likely to arise, like fraud management, statistics and data mining, financial reporting, POS app stores and ad-hoc VAS.
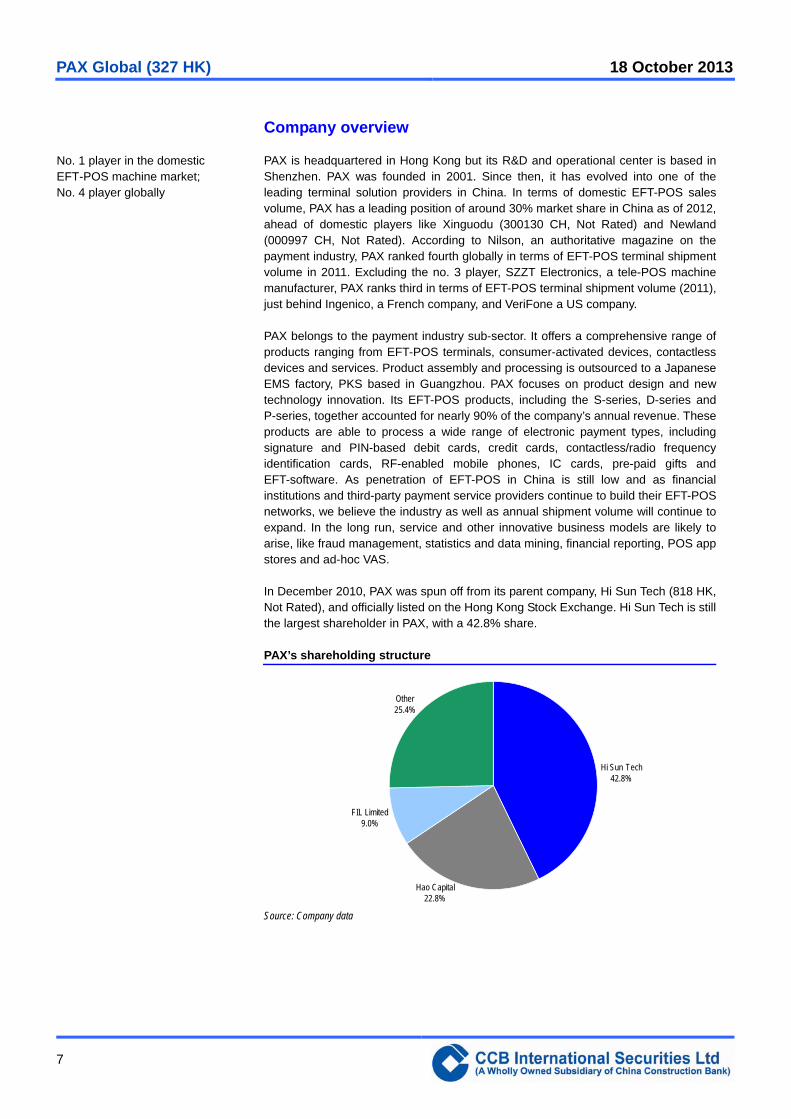
In December 2010, PAX was spun off from its parent company, Hi Sun Tech (818 HK, Not Rated), and officially listed on the Hong Kong Stock Exchange. Hi Sun Tech is still the largest shareholder in PAX, with a 42.8% share.
PAX’s shareholding structure
Hi Sun Tech42.8%
Hao Capital22.8%
FIL Limited9.0%
Other25.4%
Source: Company data
No. 1 player in the domestic EFT-POS machine market; No. 4 player globally

PAX Global (327 HK) 18 October 2013
8
Wide range of products
PAX has been designing and developing EFT-POS terminals and solutions for over a decade. In 2012 alone, it shipped over 1m EFT-POS units. Its product lines fall into five categories: EFT-POS terminals, consumer-activated devices, contactless devices, services and various other devices. From 2008 to 2012, EFT-POS terminals remained the company’s major revenue source, accounting for 96.4%, 92,8%, 86.2%, 85.7% and 89.0% of total revenue, respectively.
Revenue breakdown by product category in 2012 Revenue breakdown by products category in 2011
EFT-POS terminals
86%
Consumer-activated devices
10%
Contactless devices
2%
Services1%
Other1%
EFT-POS terminals
89%
Consumer-activated devices
8%
Contactless devices
1%
Services1%
Other1%
Source: Company data Source: Company data
EFT-POS products include countertop EFT-POS and wireless EFT-POS. The countertop EFT-POS units usually comprise of a handset, which consists of keypad, LCD display screen, magnetic strip and IC card reader as well as a base which includes a printer and a portal that supports various communication methods including Wi-Fi and TCP/IP connections. Wireless EFT-POS supports multiple wireless communication methods, such as GSM, GPRS, CDMA and Wi-Fi. Consumer activated devices mainly consist of PIN pads supporting a variety of connection options to work with EFT-POS terminals. Contactless devices are specifically designed for contactless cards. These devices comply with various industry standards including MasterCard’s PayPass and Visa’s PayWave.
PAX’s steadily growing revenue
0
400
800
1,200
1,600
2,000
2007 2008 2009 2010 2011 2012 2013F 2014F
HK$b
Overeas markets Domestic markets
Source: Company data, CCBIS estimates

PAX Global (327 HK) 18 October 2013
9
PAX’s rich product line
Source: Company
P-series EFT-POS P90 Contactless reader R50
Source: Company Source: Company
Average selling price of PAX products
Product Existing models ASP (HK$)
EFT-POS terminals S-series, P-series, D-series, New S-series 1,000-2,000
Consumer activated devices SP20, SP30, PP20, MT30, WT30 200-500
Contactless devices R50, R30, R50-M 400-800
Source: Company data
EFT-POS currently accounts for nearly 90% of PAX’s total revenue. Average selling price (ASP) for PAX’s products range from HK$1,000 to HK$1,500 while overall gross margin ratio is around 35%. Both ASP and gross margin ratio have been on a downward trend, especially within the China market as major customers like UMS and commercial banks squeeze PAX for better procurement prices. Gross margin from the overseas market is significantly higher than it is for the domestic market as overseas customers are less price sensitive, though they do tend to put more emphasis on product quality and reliability. Gross margin ratio for the China and overseas markets together was roughly 28% versus 55% in 1H13. As the company grows its overseas revenue, the current decline in overall ASP and gross margin may slow or even reverse.
PAX Global (327 HK) 18 October 2013
10
Diversified customer base
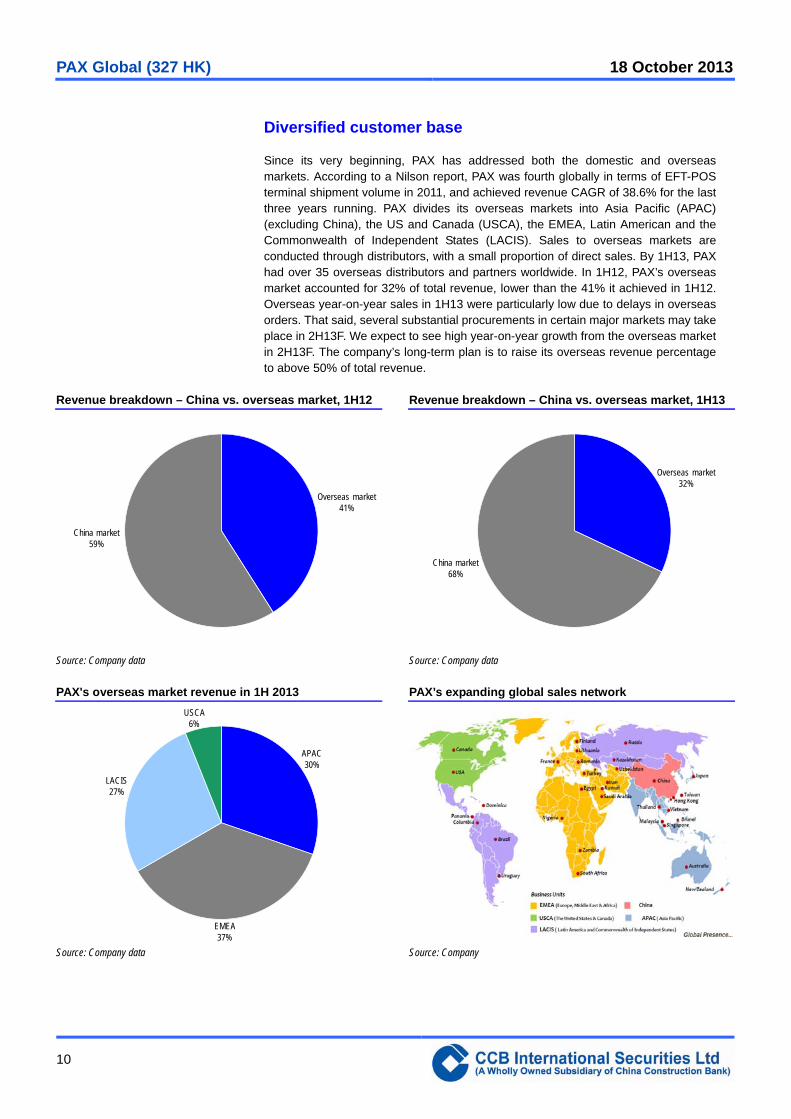
Since its very beginning, PAX has addressed both the domestic and overseas markets. According to a Nilson report, PAX was fourth globally in terms of EFT-POS terminal shipment volume in 2011, and achieved revenue CAGR of 38.6% for the last three years running. PAX divides its overseas markets into Asia Pacific (APAC) (excluding China), the US and Canada (USCA), the EMEA, Latin American and the Commonwealth of Independent States (LACIS). Sales to overseas markets are conducted through distributors, with a small proportion of direct sales. By 1H13, PAX had over 35 overseas distributors and partners worldwide. In 1H12, PAX’s overseas market accounted for 32% of total revenue, lower than the 41% it achieved in 1H12. Overseas year-on-year sales in 1H13 were particularly low due to delays in overseas orders. That said, several substantial procurements in certain major markets may take place in 2H13F. We expect to see high year-on-year growth from the overseas market in 2H13F. The company’s long-term plan is to raise its overseas revenue percentage to above 50% of total revenue.
Revenue breakdown – China vs. overseas market, 1H12 Revenue breakdown – China vs. overseas market, 1H13
Overseas market41%
China market59%
Overseas market32%
China market68%
Source: Company data Source: Company data
PAX's overseas market revenue in 1H 2013 PAX’s expanding global sales network
APAC30%
EMEA37%
LACIS27%
USCA6%
Source: Company data Source: Company

PAX Global (327 HK) 18 October 2013
11
EFT-POS industry value chain
Electroniccomponents
suppliers
Assemblyfactories like
EMS
ETF-POSterminal solution
providers likePAX
Commercialbanks
ChinaUnionPay
Third-partyoperators
Consumer andindustrial
merchants(e.g. retailers,restaurants,
hotels, hospitals,transportation companies,
telecom providers)
Industrial chain(downstream)
Industrial chain(upstream)
Source: CCBIS
The typical valuation chain for an EFT-POS supplier begins with the upstream electronic component providers who provide parts to EFT-POS solution providers like PAX, VeriFone and Ingenico. Once EFT-POS suppliers manufacture the products, often with the help of an assembly factory, the end-products are sold to the customer. In China, customers include UMS, banks and third-party payment service operators like Alipay, Lakala and ChinaPNR. The banks distribute EFT-POS terminals to their merchant customers and charge them processing fees for every transaction made by individual customers. In other markets overseas, EFT-POS terminals are typically sold directly to malls or industrial customers. EFT-POS are particularly popular with apparel retailers or companies in the hospitality sector. Other types of companies that have embraced the use of EFT-POS include automotive shops, drug stores, restaurants, grocery stores, e-commerce sites, and single-store and multi-store operations. EFT-POS terminals save time and money, and they greatly increase efficiency while improving customer service and satisfaction.
Stable procurement from China UnionPay
Within China market, traditional EFT-POS customers for PAX include China UnionPay (UMS) Merchant Services and financial institutions like Bank of China (BOC, 3988 HK, Outperform), Agricultural Bank of China (ABC, 1288 HK, Outperform), China Construction Bank (CCB, 939 HK, Not Rated), and Bank of Communications (BoCom, 3328 HK, Neutral). These institutions accounted for 43% of PAX’s domestic revenue in 1H13.

PAX Global (327 HK) 18 October 2013
12
PAX’s domestic customer categories in 1H13
Financial institutions29%
China UnionPay Merchant Services
(UMS)14%
Operators26%
Verticle applications31%
Source: Company data, CCBIS
In China, UMS and commercial banks procure large quantities of EFT-POS terminals from companies like PAX and then distribute the EFT-POS networks to their merchant customers. This makes UMS is one of the most important purchasers of EFT-POS terminals in China. It has the market clout to impose strict rules for procurement. PAX has been a qualified supplier to UMS since 2002. From January 2007 to December 2009, it sold over 333k EFT-POS terminals to UMS, with total sales topping RMB528m. A supplier to UMS can be assumed to be a quality brand given the strict assessment process UMS imposes. PAX leverages its supplier relationship with UMS to promote its products with other banks and third-party buyers. Once PAX became a supplier to UMS, other customers soon lined up for its products including BOC, BoCom, CMB, CCB and ABC. By 1H13, financial institutions accounted for 29% of PAX’s domestic revenue.
UMS’ growing list of qualified suppliers, 2009-2012
Bidding category 2009 2010 2011 2012
Countertop thermal POS PAX, Xinguodu, LANDI PAX, Xinguodu, LANDI PAX, Xinguodu, LANDI PAX, Xinguodu, LANDI, VeriFone
Countertop footprint POS PAX, Xinguodu Xinguodu, LANDI Xinguodu, LANDI PAX, Xinguodu, LANDI
Portable footprint POS PAX, Xinguodu PAX, Xinguodu PAX, Xinguodu Xinguodu, LANDI
Wireless POS LANDI, VeriFone LANDI, VeriFone LANDI, VeriFone Xinguodu, VeriFone
Simplified thermal POS – PAX, Xinguodu PAX, Xinguodu Xinguodu, LANDI, VeriFone, Newland
Pinpad and contactless readers – PAX, Xinguodu, LANDI PAX, Xinguodu, LANDI Xinguodu, LANDI, Newland
Source: UMS
Although the absolute revenue contribution PAX receives from UMS is increasing, the relative amount is diminishing. Over the past few years, PAX has been diversifying its customer base in order to reduce concentration risk. Third-party payment companies like Alipay, Lakala, ChinaPNR and other vertical industry buyers now account for over half of PAX’s domestic revenue. From 2007 to 2010, revenue from UMS accounted for 54.0%, 56.4%, 31.7% and 26.9% of total domestic revenue. This figure dropped as low as 14% in 1H13.

PAX Global (327 HK) 18 October 2013
13
Vast room for growth within the China market
Expect five-fold growth from now until 2020F. The EFT-POS penetration rate in China is only about 12% that of the US, offering ample room for growth. Out of 40m registered SMEs at the end of 2012, only 4.83m were connected to the interbank-payment network. From now till 2020F, we expect at least five-fold growth in the EFT-POS installation rate while total EFT-POS shipments are on track to reach 50m based on China’s replacement cycle (China adopted the technology after 2006 and the products have a life span of five-to-seven years). Assuming shipments in 2013F grow 30.4% YoY to reach 3m units, shipment volume CAGR for the next three years would be about 26.0%, while CAGR for the next seven years would be approximately 18.8%.
Penetration of EFT-POS in China still low. According to 2011 statistics from Euromonitor, penetration by EFT-POS in BRICS countries was extremely low, with less than 5 machines for every 1,000 people in China, compared with nearly 35 for every 1,000 people in the US. Similarly, China has only one-sixth the EFT-POS penetration rate of Australia. In 2012, there were 800k EFT-POS terminals installed in Australia but only 7,000k in China, which has a population sixty times that of Australia.
Installed EFT-POS per 1,000 people
0 4 8 12 16 20 24 28 32
India
China
Russia
Mexico
Germany
South America
France
Brazil
Canada
UK/Ireland
Italy
Turkey
Spain
Australia
US
Source: Eruomonitor
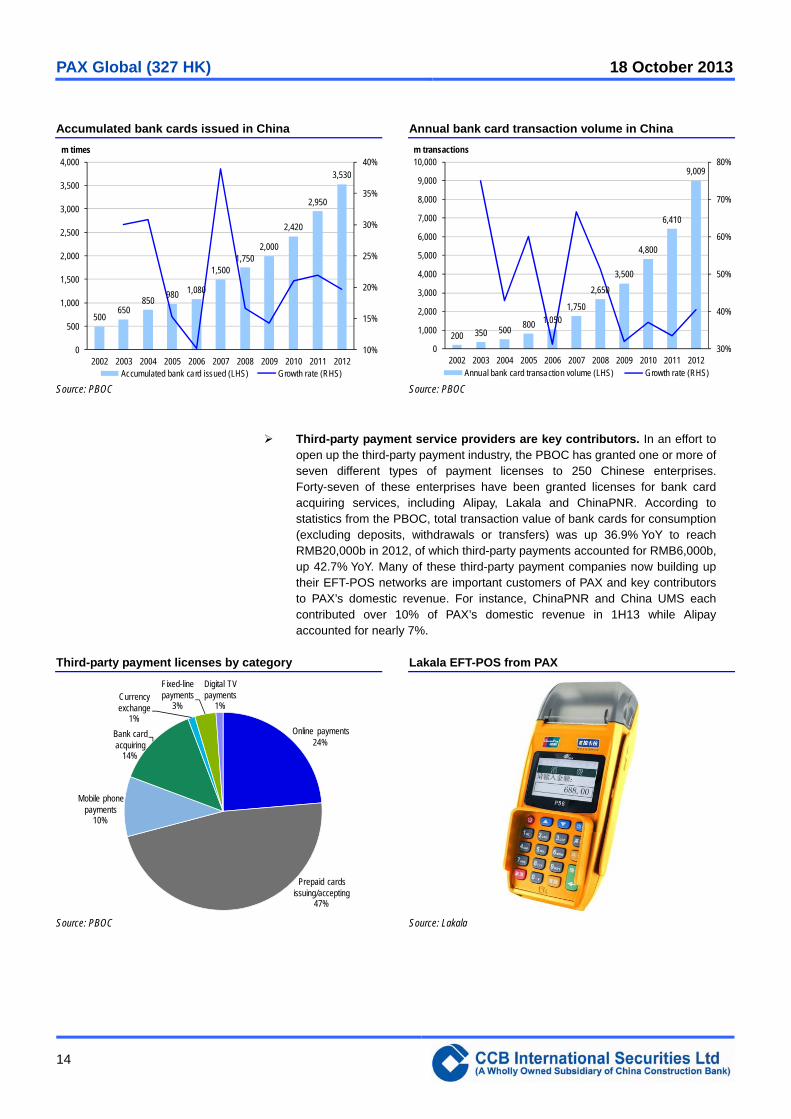
Booming economy supports future growth. The EFT-POS penetration rate has taken off in recent years due to rising consumption and greater consumer awareness in China. According to the PBOC, the number of merchants joining China’s EFT-POS network is rapidly increasing. As of the end of 2012, there were 4.83m merchants in the interbank-payment network, up 1.65m or 34.2% YoY while the total number of EFT-POS installed was up 2.3m or 47% YoY to 7.12m. PAX contributed 30% of the net increase in EFT-POS terminals across China in 2012.
Third- and fourth-tier cities the new catalysts. As China’s urbanization push ramps up, nearly 600m people in third- and fourth-tier cities and rural areas will begin to conduct non-cash transactions. Meanwhile, the penetration rate for EFT-POS in first- and second-tier cities is slowing.
Penetration of EFT-POS in China is less than one-seventh that of the US
PAX Global (327 HK) 18 October 2013
14
Accumulated bank cards issued in China Annual bank card transaction volume in China
500650
850980 1,080
1,5001,750
2,000
2,420
2,950
3,530
10%
15%
20%
25%
30%
35%
40%
0
500
1,000
1,500
2,000
2,500
3,000
3,500
4,000
2002 2003 2004 2005 2006 2007 2008 2009 2010 2011 2012
m times
Accumulated bank card issued (LHS) Growth rate (RHS)
200 350 500800 1,050
1,750
2,650
3,500
4,800
6,410
9,009
30%
40%
50%
60%
70%
80%
0
1,000
2,000
3,000
4,000
5,000
6,000
7,000
8,000
9,000
10,000
2002 2003 2004 2005 2006 2007 2008 2009 2010 2011 2012
m transactions
Annual bank card transaction volume (LHS) Growth rate (RHS)
Source: PBOC Source: PBOC
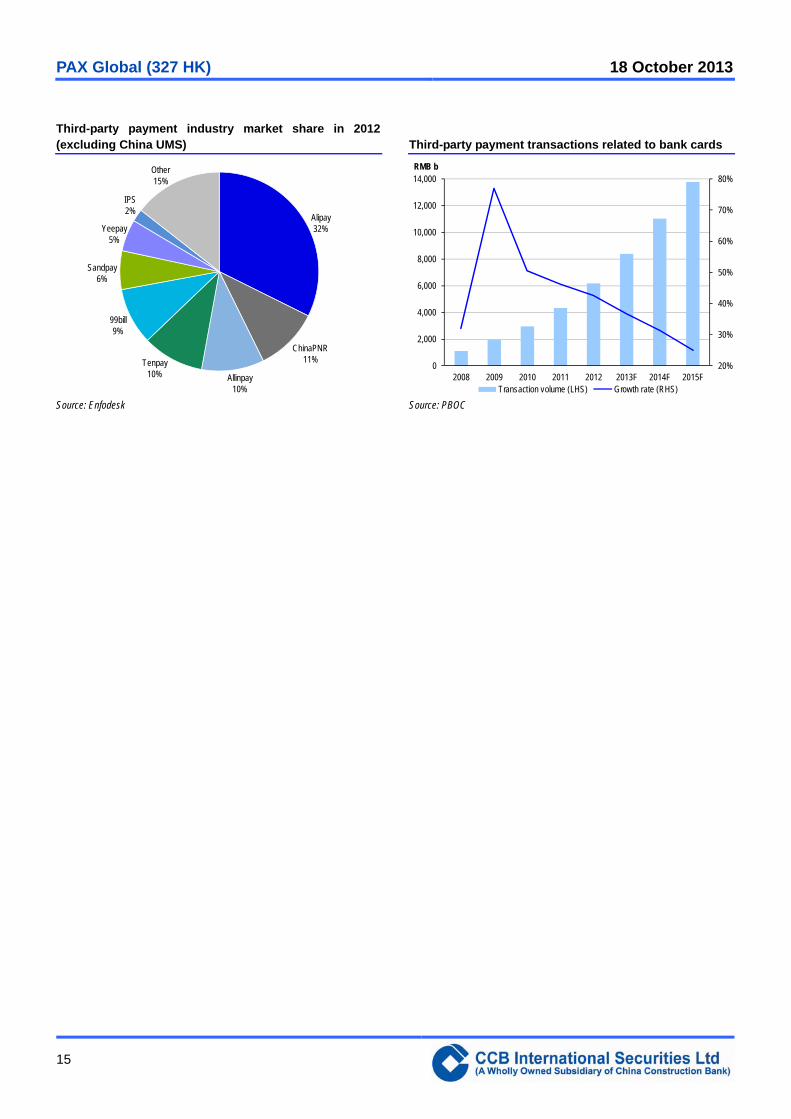
Third-party payment service providers are key contributors. In an effort to
open up the third-party payment industry, the PBOC has granted one or more of seven different types of payment licenses to 250 Chinese enterprises. Forty-seven of these enterprises have been granted licenses for bank card acquiring services, including Alipay, Lakala and ChinaPNR. According to statistics from the PBOC, total transaction value of bank cards for consumption (excluding deposits, withdrawals or transfers) was up 36.9% YoY to reach RMB20,000b in 2012, of which third-party payments accounted for RMB6,000b, up 42.7% YoY. Many of these third-party payment companies now building up their EFT-POS networks are important customers of PAX and key contributors to PAX’s domestic revenue. For instance, ChinaPNR and China UMS each contributed over 10% of PAX’s domestic revenue in 1H13 while Alipay accounted for nearly 7%.
Third-party payment licenses by category Lakala EFT-POS from PAX
Online payments24%
Prepaid cards issuing/accepting
47%
Mobile phone payments
10%
Bank card acquiring
14%
Currency exchange
1%
Fixed-line payments
3%
Digital TV payments
1%
Source: PBOC Source: Lakala
PAX Global (327 HK) 18 October 2013
15
Third-party payment industry market share in 2012 (excluding China UMS)
Third-party payment transactions related to bank cards
Alipay32%
ChinaPNR11%
Allinpay10%
Tenpay10%
99bill9%
Sandpay6%
Yeepay5%
IPS2%
Other15%
20%
30%
40%
50%
60%
70%
80%
0
2,000
4,000
6,000
8,000
10,000
12,000
14,000
2008 2009 2010 2011 2012 2013F 2014F 2015F
RMB b
Transact ion volume (LHS) Growth rate (RHS)
Source: Enfodesk Source: PBOC
PAX Global (327 HK) 18 October 2013
16
Riding the global EFT-POS growth cycle
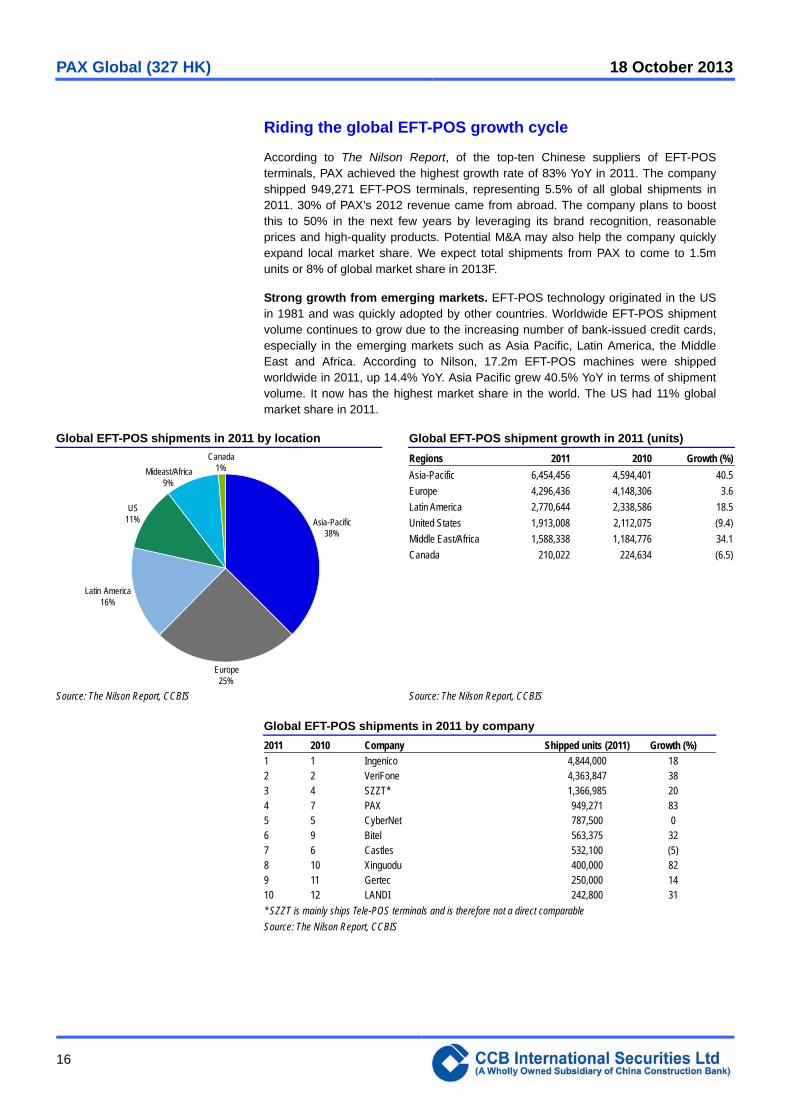
According to The Nilson Report, of the top-ten Chinese suppliers of EFT-POS terminals, PAX achieved the highest growth rate of 83% YoY in 2011. The company shipped 949,271 EFT-POS terminals, representing 5.5% of all global shipments in 2011. 30% of PAX’s 2012 revenue came from abroad. The company plans to boost this to 50% in the next few years by leveraging its brand recognition, reasonable prices and high-quality products. Potential M&A may also help the company quickly expand local market share. We expect total shipments from PAX to come to 1.5m units or 8% of global market share in 2013F.
Strong growth from emerging markets. EFT-POS technology originated in the US in 1981 and was quickly adopted by other countries. Worldwide EFT-POS shipment volume continues to grow due to the increasing number of bank-issued credit cards, especially in the emerging markets such as Asia Pacific, Latin America, the Middle East and Africa. According to Nilson, 17.2m EFT-POS machines were shipped worldwide in 2011, up 14.4% YoY. Asia Pacific grew 40.5% YoY in terms of shipment volume. It now has the highest market share in the world. The US had 11% global market share in 2011.
Global EFT-POS shipments in 2011 by location Global EFT-POS shipment growth in 2011 (units)
Asia-Pacific38%
Europe25%
Latin America16%
US11%
Mideast/Africa9%
Canada1%
Regions 2011 2010 Growth (%)
Asia-Pacific 6,454,456 4,594,401 40.5
Europe 4,296,436 4,148,306 3.6
Latin America 2,770,644 2,338,586 18.5
United States 1,913,008 2,112,075 (9.4)
Middle East/Africa 1,588,338 1,184,776 34.1
Canada 210,022 224,634 (6.5)
Source: The Nilson Report, CCBIS Source: The Nilson Report, CCBIS
Global EFT-POS shipments in 2011 by company
2011 2010 Company Shipped units (2011) Growth (%)
1 1 Ingenico 4,844,000 18 2 2 VeriFone 4,363,847 38 3 4 SZZT* 1,366,985 20 4 7 PAX 949,271 83 5 5 CyberNet 787,500 0 6 9 Bitel 563,375 32 7 6 Castles 532,100 (5) 8 10 Xinguodu 400,000 82 9 11 Gertec 250,000 14 10 12 LANDI 242,800 31
* SZZT is mainly ships Tele-POS terminals and is therefore not a direct comparable
Source: The Nilson Report, CCBIS
PAX Global (327 HK) 18 October 2013
17
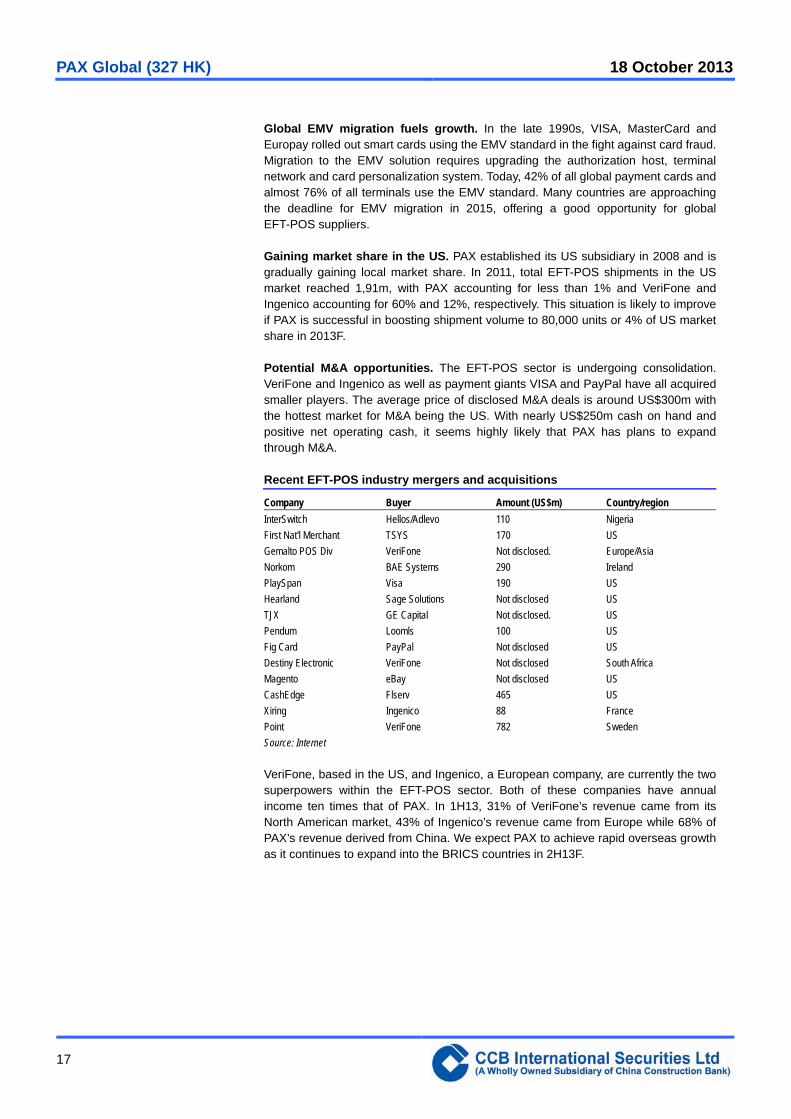
Global EMV migration fuels growth. In the late 1990s, VISA, MasterCard and Europay rolled out smart cards using the EMV standard in the fight against card fraud. Migration to the EMV solution requires upgrading the authorization host, terminal network and card personalization system. Today, 42% of all global payment cards and almost 76% of all terminals use the EMV standard. Many countries are approaching the deadline for EMV migration in 2015, offering a good opportunity for global EFT-POS suppliers.
Gaining market share in the US. PAX established its US subsidiary in 2008 and is gradually gaining local market share. In 2011, total EFT-POS shipments in the US market reached 1,91m, with PAX accounting for less than 1% and VeriFone and Ingenico accounting for 60% and 12%, respectively. This situation is likely to improve if PAX is successful in boosting shipment volume to 80,000 units or 4% of US market share in 2013F.
Potential M&A opportunities. The EFT-POS sector is undergoing consolidation. VeriFone and Ingenico as well as payment giants VISA and PayPal have all acquired smaller players. The average price of disclosed M&A deals is around US$300m with the hottest market for M&A being the US. With nearly US$250m cash on hand and positive net operating cash, it seems highly likely that PAX has plans to expand through M&A.
Recent EFT-POS industry mergers and acquisitions
Company Buyer Amount (US$m) Country/region
InterSwitch Hellos/Adlevo 110 Nigeria
First Nat'l Merchant TSYS 170 US
Gemalto POS Div VeriFone Not disclosed. Europe/Asia
Norkom BAE Systems 290 Ireland
PlaySpan Visa 190 US
Hearland Sage Solutions Not disclosed US
TJX GE Capital Not disclosed. US
Pendum Loomls 100 US
Fig Card PayPal Not disclosed US
Destiny Electronic VeriFone Not disclosed South Africa
Magento eBay Not disclosed US
CashEdge Flserv 465 US
Xiring Ingenico 88 France
Point VeriFone 782 Sweden
Source: Internet
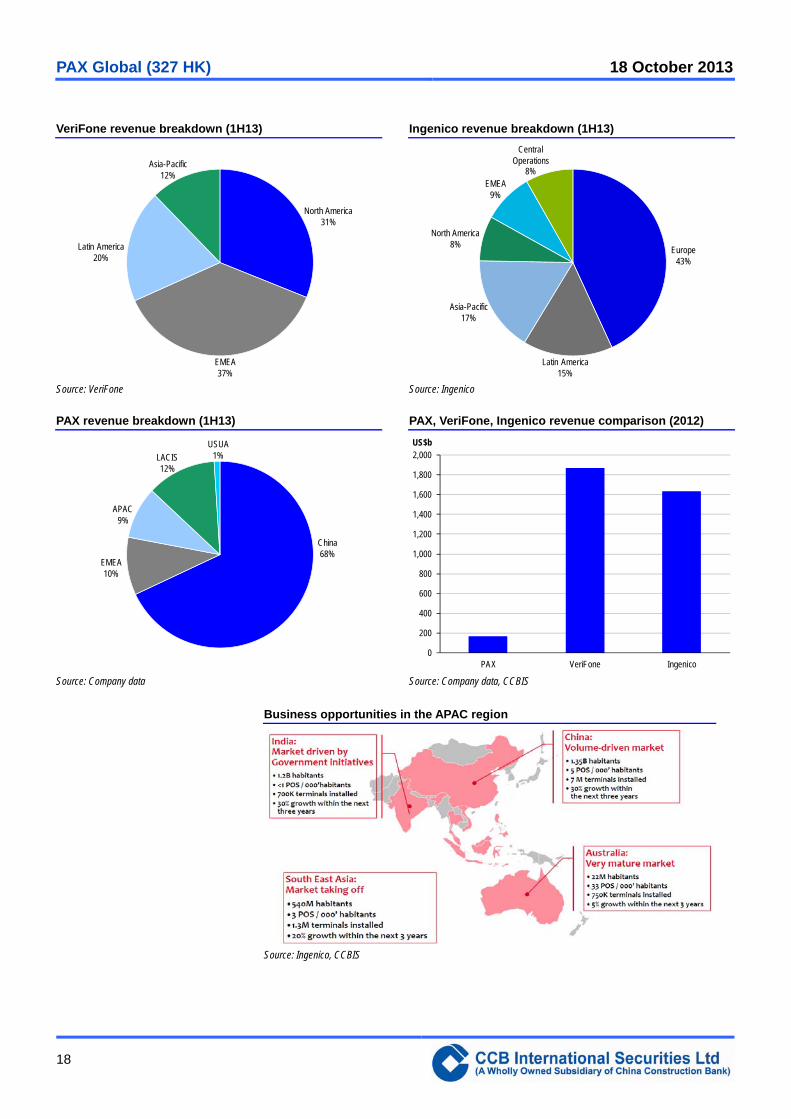
VeriFone, based in the US, and Ingenico, a European company, are currently the two superpowers within the EFT-POS sector. Both of these companies have annual income ten times that of PAX. In 1H13, 31% of VeriFone’s revenue came from its North American market, 43% of Ingenico’s revenue came from Europe while 68% of PAX’s revenue derived from China. We expect PAX to achieve rapid overseas growth as it continues to expand into the BRICS countries in 2H13F.
PAX Global (327 HK) 18 October 2013
18
VeriFone revenue breakdown (1H13) Ingenico revenue breakdown (1H13)
North America31%
EMEA37%
Latin America20%
Asia-Pacific12%
Europe
43%
Latin America15%
Asia-Pacific17%
North America8%
EMEA9%
Central Operations
8%
Source: VeriFone Source: Ingenico
PAX revenue breakdown (1H13) PAX, VeriFone, Ingenico revenue comparison (2012)
China68%
EMEA10%
APAC9%
LACIS12%
USUA1%
0
200
400
600
800
1,000
1,200
1,400
1,600
1,800
2,000
PAX VeriFone Ingenico
US$b
Source: Company data Source: Company data, CCBIS
Business opportunities in the APAC region
Source: Ingenico, CCBIS
PAX Global (327 HK) 18 October 2013
19
Strong R&D and industry certifications are advantages
ETF-POS systems are used to process electronic fund transfers using bank cards or value-stored cards. Given the financial nature of these transactions, rigorous measures for information security, system reliability and standards compliance are in force. Before products are put into service, they have to obtain certifications related to electronic payment safety, chip cards, contactless cards and customer-level application software. In other words, there is zero tolerance for errors. UMS requires its bidders in China to comply with the following requirements (among others):
Registered capital of no less than RMB50m
Over five years producing EFT-POS products
Shortlisted as a supplier to the Big-four Banks in China in the last two years
Passed PCI and EMV certifications
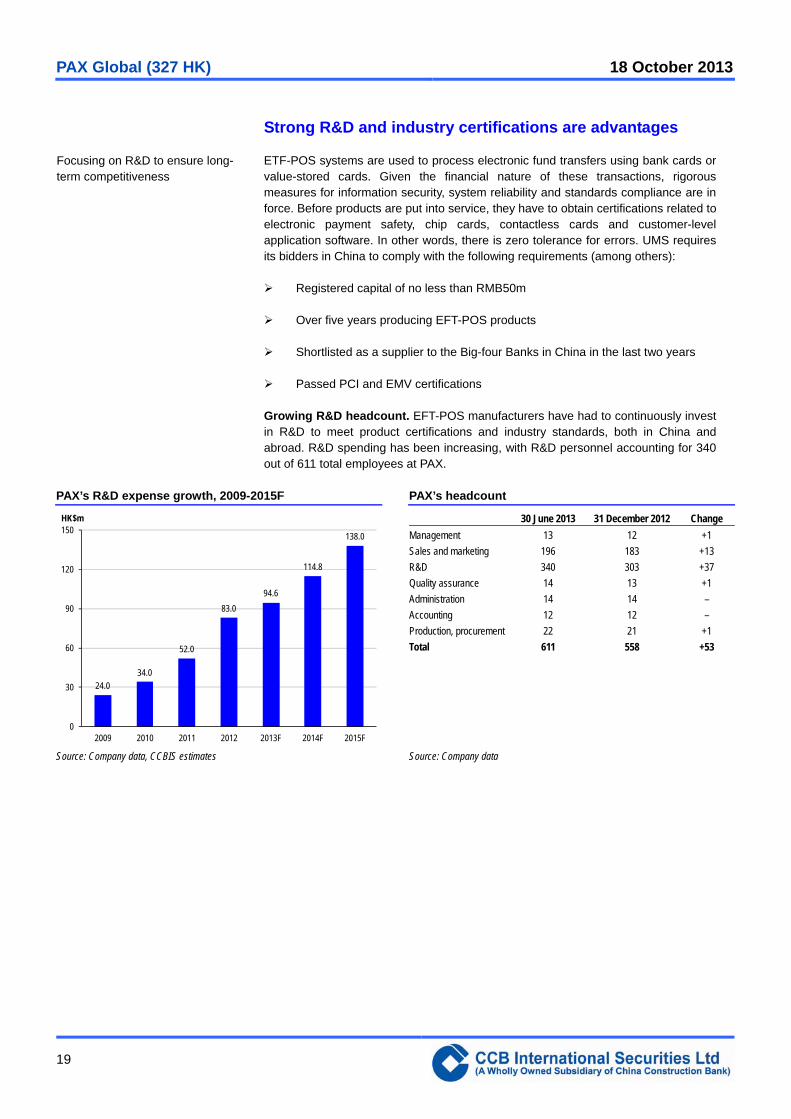
Growing R&D headcount. EFT-POS manufacturers have had to continuously invest in R&D to meet product certifications and industry standards, both in China and abroad. R&D spending has been increasing, with R&D personnel accounting for 340 out of 611 total employees at PAX.
PAX’s R&D expense growth, 2009-2015F PAX’s headcount
24.0
34.0
52.0
83.0
94.6
114.8
138.0
0
30
60
90
120
150
2009 2010 2011 2012 2013F 2014F 2015F
HK$m 30 June 2013 31 December 2012 Change
Management 13 12 +1
Sales and marketing 196 183 +13
R&D 340 303 +37
Quality assurance 14 13 +1
Administration 14 14 –
Accounting 12 12 –
Production, procurement 22 21 +1
Total 611 558 +53
Source: Company data, CCBIS estimates Source: Company data
Focusing on R&D to ensure long- term competitiveness

PAX Global (327 HK) 18 October 2013
20
Product certifications by Apple. In July 2013, PAX’s compact MPOS terminals – the D200 and D210 – were granted MFi certification by Apple. The D-series of products are PCI PTS 3.x certified and are able to accept payments via EMV smart card reader, magnetic strip or inbuilt contactless terminals. Multiple wireless communication options are also available via WiFi, cable or Bluetooth. The D200 and D210 can be used securely with the iPhone, iPad and other mobile devices running payment applications. Other major certifications PAX has obtained are listed in the table below.
Major certifications of PAX
Certifications Award date
General certifications
Certificate for China Compulsory Product Certification 2003
The Ministry of Information Industry of the PRC’s Telecommunication Equipment Network Access Permit 2004
Communate Europpene Declaration of Conformity (CE) certification 2006
Saudi Arabian Standards Organization (SASO) International Conformity Certification 2007
Supervision & Test Center of Ex-products of China Petroleum & Chemical Industry's Conformity
Certificate of Explosion-proof
2008
US Federal Communications Commission (FCC) certification 2008
CB Test Certificate of IEC System for Mutual Recognition of Test Certificates for Electrical Equipment 2008
Underwriter Laboratories Inc. (UL) certification 2009
PCS Type Certification Review Board (PTCRB) certification 2009
Safety certifications
Visa POS PIN Entry Device certification 2003
PCI PIN Entry Device certification 2006
New Zealand Bankers’ Association’s PIN Entry Device certification 2009
Quality certification
MasterCard TQM certification 2010
Smart card certifications
EMV Level-1 certification 2001
EMV Level-2 certification 2002
Proton World certification 2003
PBOC2.0 Level-2 Certification 2005
PBOC2.0 Level-1 Certification 2006
General Administration of Quality Supervision, Inspection and Quarantine of the PRC’s National
Industrial Product Production Permit for IC card reader and writer
2009
Visa Smart Debit/Credit Acquirer Device Validation Tool Kit certification 2009
Contactless card certifications
PBOC certification 2007
PayWave Certification 2009
PayPass Certification 2009
The Ministry of Construction of the PRC’s IC Card Product Test certification 2010
Application certifications
Network for Electronic Transfers Singapore Pte Ltd (NETS) Terminal Certification 2001
Electronic Payment Services Company (Hong Kong) Limited (EPS) certification 2002
American Express certification 2002
China UnionPay Network Access License for Magnetic Stripe for POS Terminal 2003
Certificate for JCB Terminal Type Approval 2003
Source: Company
PAX Global (327 HK) 18 October 2013
21
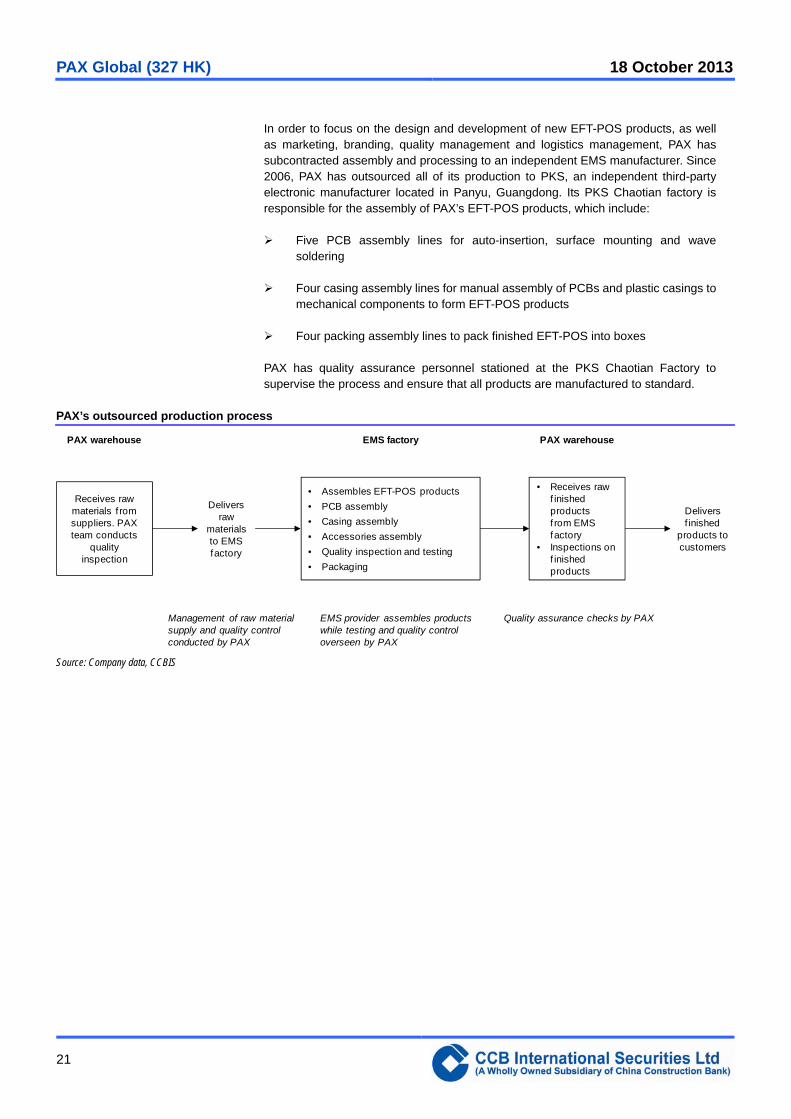
In order to focus on the design and development of new EFT-POS products, as well as marketing, branding, quality management and logistics management, PAX has subcontracted assembly and processing to an independent EMS manufacturer. Since 2006, PAX has outsourced all of its production to PKS, an independent third-party electronic manufacturer located in Panyu, Guangdong. Its PKS Chaotian factory is responsible for the assembly of PAX’s EFT-POS products, which include:
Five PCB assembly lines for auto-insertion, surface mounting and wave soldering
Four casing assembly lines for manual assembly of PCBs and plastic casings to mechanical components to form EFT-POS products
Four packing assembly lines to pack finished EFT-POS into boxes
PAX has quality assurance personnel stationed at the PKS Chaotian Factory to supervise the process and ensure that all products are manufactured to standard.
PAX’s outsourced production process
• Receives rawf inished productsf rom EMS factory
• Inspections onf inished products
Receives rawmaterials f romsuppliers. PAXteam conducts
qualityinspection
• Assembles EFT-POS products
• PCB assembly
• Casing assembly
• Accessories assembly
• Quality inspection and testing
• Packaging
Deliversraw
materialsto EMSfactory
Deliversf inished
products tocustomers
PAX warehouse EMS factory PAX warehouse
Management of raw materialsupply and quality control conducted by PAX
EMS provider assembles productswhile testing and quality control overseen by PAX
Quality assurance checks by PAX
Source: Company data, CCBIS

PAX Global (327 HK) 18 October 2013
22
Financial projections and valuation
PAX achieved revenue CAGR of 32% for 2007-2012. We consider a three-year (2013-2015) revenue and profit CAGR of 15-20% reasonable for PAX given that the EFT-POS industry as a whole is expected to grow at a 15% CAGR in 2012-2015F. We believe PAX will maintain its current share of the China market while expanding its share of the overseas market. For forecasting purposes, we estimate mid-teen growth for PAX’s domestic revenue and higher growth from its overseas market, especially the US market.
PAX’s sales projections
0
400
800
1,200
1,600
2,000
2007 2008 2009 2010 2011 2012 2013F 2014F
HK$b
Overeas markets Domestic markets
Source: Company data, CCBI estimates
Stable gross profit margin. PAX’s gross profit rate has been on the decline since 2009 as domestic customers like UMS put pressure on prices. As higher-margin overseas revenue gradually comes to account for a greater proportion of revenue, total gross margin could remain at the 35% level for several years.
Stable SG&A/sales ratio. We expect the SG&A share of sales to remain at the current level of 21% over the next few years though margins should rise over time. PAX will continue to invest in R&D towards new product development (wireless and more intelligent models) and overseas expansion. We assume a fixed 21% SG&A/sales ratio for FY13F-15F.
No major capex spending planned. As PAX has outsourced its entire production process to its PSK factory, it does not need to worry about PP&E spending. We do not expect major capex spending as long as the company sticks to the current business model.
Positive operating cash-flow generation. Taking into account PAX’s profit, net cash generating capability and longer collection periods, we expect its net operating cash flow to lag its annual net income, with estimated net operating cash flow of around HK$1.30b in FY13F and HK$1.45b in FY14F. We believe the company is currently in a net cash position as PAX was holding HK$1.24b net cash in 1H13.
No dividend expected in the short term. Although the company is in a net cash position and continues to generate positive cashflow, we do not expect any dividend in the short term, in part because the company is considering potential M&A deals but also because the company’s preference is to maintain a comfortable cash cushion.
Solid track record of growth, with 15-20% turnover CAGR targeted for 2013-2015F

PAX Global (327 HK) 18 October 2013
23
PAX – margin outlook PAX – ROE and debt/asset ratio
12%
16%
20%
24%
28%
32%
36%
2011 2012 2013F 2014F 2015FGross margin Operating margin Net margin
0%
3%
6%
9%
12%
15%
18%
21%
2011 2012 2013F 2014F 2015FROE Debt/asset
Source: Company data, CCBIS estimates Source: Company data, CCBIS estimates
PAX – revenue breakdown projections
Year to December (HK$m) 2009 2010 2011 2012 2013F 2014F 2015F
Sales by geographic region
China market 405 566 755 919 1,084 1,247 1,434
Overseas market 88 157 348 394 493 666 865
Total revenue 493 724 1,103 1,313 1,577 1,913 2,299
As a % of total revenue
China market 82 78 68 70 69 65 62
Overseas market 18 22 32 30 31 35 38
Growth (%)
China market 39.7 33.4 21.7 18.0 15.0 15.0
Overseas market 79.7 121.2 13.4 25.0 35.0 30.0
Total revenue 46.8 52.5 19.0 20.1 21.3 20.2
Sales by product category
EFT-POS terminals 457 623 945 1,169 1,420 1,721 2,069
Consumer activated devices 16 53 116 104 95 96 92
Contactless devices 4 23 20 14 16 19 23
Services 14 14 14 18 32 57 92
Other 2 11 8 8 16 19 23
Total revenue 493 724 1,103 1,313 1,577 1,913 2,299
As a % of total revenue
EFT-POS terminals 93 86 86 89 90 90 90
Consumer activated devices 3 7 11 8 6 5 4
Contactless devices 1 3 2 1 1 1 1
Services 3 2 1 1 2 3 4
Other 0 1 1 1 1 1 1
Source: Company data, CCBIS estimates

PAX Global (327 HK) 18 October 2013
24
PAX – profit and loss projections
Year to December (HK$m) 2009 2010 2011 2012 2013F 2014F 2015F 1H12 2H12 1H13 2H13F
Revenue 493 724 1,103 1,313 1,577 1,913 2,299 530 784 631 946
YoY (%) 47 52 19 20 21 20 17 20 19 21
COGS 300 432 711 849 1,025 1,243 1,495 321 528 407 615
Gross profit 193 292 392 464 552 669 805 209 255 224 331
YoY (%) 44 65 19 21 21 20 35 8 7 30
Gross margin (%) 39 40 36 35 35 35 35 39 33 36 35
Other income (net) 11 27 42 30 32 38 46 18 12 10 21
Selling expenses 59 74 124 114 142 172 207 57 57 53 89
YoY (%) 26 67 (8) 25 21 20 17 (25) (6) 56
As % of revenue 12 10 11 9 9 9 9 11 7 8 9
Administrative expenses 44 72 102 157 189 230 276 66 91 77 113
YoY (%) 65 41 54 20 21 20 76 42 16 24
As % of revenue 9 10 9 12 12 12 12 13 12 12 12
R&D expenses (included in A&M) 24 35 53 83 95 115 138 31 52 38 57
YoY (%) 45 51 57 14 21 20 68 51 22 10
As % of revenue 5 5 5 6 6 6 6 6 7 6 6
Operating profit 101 173 207 223 252 306 368 104 120 104 151
YoY (%) 71 20 8 13 21 20 35 -9 1 26
Operating profit margin (%) 20 24 19 17 16 16 16 20 15 17 16
Income tax expense 16 27 26 40 40 49 59 20 20 14 27
Effective tax rate (%) 15 16 12 18 16 16 16 19 17 13 18
Net profit 85 145 182 183 212 257 309 83 100 91 124
YoY (%) 70 25 1 16 21 20 24 (13) 9 25
Net profit margin (%) 17 20 16 14 13 13 13 16 13 14 13
EPS (HK$) 0.115 0.194 0.175 0.176 0.204 0.247 0.297 0.080 0.096 0.087 0.120
Share volumes (m) 742 750 1,039 1,039 1,039 1,039 1,039 1,039 1,039 1,039 1,039
Source: Company data, CCBIS estimates

PAX Global (327 HK) 18 October 2013
Rating definitions
Outperform (O) – expected return > 10% over the next twelve months
Neutral (N) – expected return between -10% and 10% over the next twelve months
Underperform (U) – expected return < -10% over the next twelve months
Analyst certification:
The author(s) of this document, hereby declare that: (i) all of the views expressed in this document accurately reflect his personal views about any and all of the subject
securities or issuers and were prepared in an independent manner; and (ii) no part of any of his compensation was, is, or will be directly or indirectly related to the specific
recommendations or views expressed in this document; and (iii) he receives no insider information/non-public price-sensitive information in relation to the subject securities
or issuers which may influence the recommendations made by him. The author(s) of this document further confirm that (i) neither he nor his respective associate(s) (as
defined in the Code of Conduct for Persons Licensed by or Registered with the Securities and Futures Commission issued by the Hong Kong Securities and Futures
Commission) has dealt in or traded in the securities covered in this document within 30 calendar days prior to the date of issue of this document or will so deal in or trade
such securities within 3 business days (as defined in the Securities and Futures Ordinance (Chapter 571 of the Laws of Hong Kong) after the date of issue of this
document; (ii) neither he nor his respective associate(s) serves as an officer of any of the companies covered in this document; and (iii) neither he nor his respective
associate(s) has any financial interests in the securities covered in this document.
Disclaimers:
This document is prepared by CCB International Securities Limited. CCB International Securities Limited is a wholly-owned subsidiary of CCB International (Holdings)
Limited (“CCBIH”) and China Construction Bank Corporation (“CCB”). Information herein has been obtained from sources believed to be reliable but CCB International
Securities Limited, its affiliates and/or subsidiaries (collectively “CCBIS”) do not guarantee, represent and warrant (either express or implied) its completeness or accuracy
or appropriateness for any purpose or any person whatsoever. Opinions and estimates constitute our judgment as of the date of this document and are subject to change
without notice. CCBIS seeks to update its research as appropriate, but various regulations may prevent it from doing so. Besides certain industry reports published on a
periodic basis, the large majority of reports are published at irregular intervals as appropriate according to the analyst's judgment. Forecasts, projections and valuations are
inherently speculative in nature and may be based on a number of contingencies. Readers should not regard the inclusion of any forecasts, projections and valuations in
this document as a representation or warranty by or on behalf of CCBIS that these forecasts, projections or valuations or their underlying assumptions will be achieved.
Investment involves risk and past performance is not indicative of future results. Information in this document is not intended to constitute or be construed as legal,
financial, accounting, business, investment, tax or any professional advice for any prospective investors and should not be relied upon in that regard. This document is for
informational purposes only and should not be treated as an offer or solicitation for the purchase or sale of any products, investments, securities, trading strategies or
financial instruments of any kind in any jurisdiction. CCBIS makes no representations on the availability of the securities covered in this document (or related investment) to
the recipients. The securities described herein may not be eligible for sale in all jurisdictions or to certain categories of investors. Neither CCBIS nor any other persons
accept any liability whatsoever for any loss or damages (whether direct, indirect, incidental, exemplary, compensatory, punitive, special or consequential) arising from any
use of this document or its contents or otherwise arising in connection therewith. Securities, financial instruments or strategies mentioned herein may not be suitable for all
investors. The opinions and recommendations herein do not take into account prospective investors’ financial circumstances, investment objectives, or particular needs
and are not intended as recommendations of particular securities, financial instruments or strategies to any prospective investors. The recipients of this document should
consider this document as only a single factor in marking their investment decision and shall be solely responsible for making their own independent investigation of the
business, financial condition and prospects of companies referred to in this document. Readers are cautioned that (i) the price and value of securities referred to in this
document and the income derived from them may fluctuate; (ii) past performance is not a guide to future performance; (iii) any analysis, ratings and recommendations
made in this document are intended for long-term (at least for 12 months) and is not linked to a near-term assessment of the likely performance of the securities or
companies in question. In any event, future actual results may differ materially from those set forth in any forward-looking statements herein; (iv) future returns are not
guaranteed, and a loss of original capital may occur; and (v) fluctuations in exchange rates may adversely affect the value, price or income of any security or related
instrument referred to in this document. It should be noted that this document covers only those securities or companies as specified herein and does not extend to any
derivative instruments thereof, the value of which may be affected by many factors and may not correspond with the value of the underlying securities. Trading in these
instruments is considered risky and are not suitable for all investors. While all reasonable care has been taken to ensure that the facts stated herein are accurate and that
the forward-looking statements, opinions and expectations contained herein are based on fair and reasonable assumptions, CCBIS has not been able to verify
independently such facts or assumptions and CCBIS shall not be liable for the accuracy, completeness or correctness thereof and no representation or warranty is made,
express or implied, in this regard. All pricing referred to in this document is as of the close of local market for the securities discussed, unless otherwise stated and for
information purposes only. There is no representation that any transaction can or could have been effected at those prices, and any prices do not necessarily reflect
CCBIS’ internal books and records or theoretical model-based valuations and may be based on certain assumptions. Different assumptions could result in substantially
different results. Any statements which may be contained herein attributed to a third- party represent CCBIS’ interpretation of the data, information and/or opinions provided
by that third party either publicly or through a subscription service, and such use and interpretation have not been reviewed or endorsed by the third party. Reproduction
and distribution of these third party contents in any form is prohibited except with the prior written consent of such third party. The recipients must make their own
assessments of the relevance, accuracy and adequacy of the information contained in this document and make such independent investigation as they may consider
necessary or appropriate for such purpose.

PAX Global (327 HK) 18 October 2013
Recipients should seek independent legal, financial, accounting, business, investment and/or tax advice if they have any doubt about the contents of this document and
satisfy themselves prior to making any investment decision that such investment is in line with their own investment objectives and horizons.
Use of hyperlinks to other internet sites or resources (if any) as referred to in this document is at users’ own risk. They are provided solely for the purpose of convenience
and information and the content of these internet sites or resources does not in any way form part of this document. The contents, accuracy, opinion expressed, and other
links provided at these sites are not investigated, verified, monitored, or endorsed by CCBIS. CCBIS expressly disclaims any responsibility for and does not guarantee,
represent and warrant (either express or implied) the completeness, accuracy, appropriateness, availability or security of information found on these websites. Users of
these websites are solely responsible for making all enquiries, investigation and risk assessment before proceeding with any online or offline access or transaction with
any of these third parties. All activities conducted by users via or at these websites are at their own risk. CCBIS does not guarantee the security of any information users
may forward or be requested to provide to any third parties via these websites. Users are deemed to have irrevocably waived any claims against CCBIS for any loss or
damage suffered as a result of any access to or interaction with any of these websites.
Upon request CCBIS may provide specialized research products or services to certain customers focusing on the prospects for specific securities as compared with other
covered securities over varying time horizons or under differing market conditions. While the views expressed in these situations may not always be directionally consistent
with the long-term views expressed in the analyst's published research, CCBIS has procedures in place to prevent selective disclosure and will update the relevant readers
when our views has changed. CCBIS also has procedures in place to identify and manage potential conflicts of interest that may arise in connection with its research
business and services. Chinese Wall procedures are also in place to ensure that any confidential and/or price sensitive information is properly handled. CCBIS will use its
best endeavors to comply with the relevant laws and regulations in this respect. Nevertheless, the recipients should be aware that CCB, CCBIS, their affiliates and/or their
officers, directors and employees may do business with the issuer(s) of the securities covered in this document, including investment banking business or direct investment
business or may hold interest in (and/or later add or dispose) such securities (or in any related investment) for themselves and/or on behalf of their clients from time to time.
As a result, investors should be aware that CCBIS may have a conflict of interest that could affect the objectivity of this document and CCBIS will not assume any
responsibility in respect thereof. Further, the information contained herein may differ or be contrary to opinions expressed by other associates of CCBIS or other members
of the CCB or CCBIH group of companies.
This document is for the information of the institutional and professional customers of CCBIS only and should not be distributed to retail customers. This document is not
directed at you if CCBIS is prohibited or restricted by any legislation or regulation in any jurisdiction from making it available to you. You should satisfy yourself before
reading it that CCBIS is permitted to provide research material concerning investments to you and that you are permitted and entitled to receive and read the document
under relevant legislation and regulations. In particular, this document is only distributed to certain US Persons to whom CCBIS is permitted to distribute according to US
securities laws, but cannot otherwise be distributed or transmitted, whether directly or indirectly, into the US or to any other US person. This document also cannot be
distributed or transmitted, whether directly or indirectly, into Japan and Canada and not to the general public in the People’s Republic of China (for the purpose of this
document, excluding Hong Kong, Macau and Taiwan) unless under applicable laws.
Any unauthorized reproduction or redistribution by any means to any persons, in whole or in part of this document is strictly prohibited and CCBIS accepts no liability
whatsoever for the actions of third parties in distributing this research report.
If this document has been distributed by electronic transmission, such as e-mail, then such transmission cannot be guaranteed to be secure or error-free as information
could be intercepted, corrupted, lost, destroyed, arrive late or incomplete, or contain viruses. CCBIS therefore does not accept liability for any errors or omissions in the
contents of this document, which may arise as a result of electronic transmission.
The disclosures contained in this document prepared by CCBIS shall be governed by and construed in accordance with the laws of Hong Kong.
Copyright 2013 CCBIS. The signs, logos and insignia used in this research report and the company name “CCB International Securities Limited” are the
registered and unregistered trademarks of CCB, CCBIH and/or CCBIS. All rights are hereby reserved. All material presented in this document, unless indicated
otherwise, is under copyright to CCBIS. This document or any portion hereof may not be reproduced, sold or redistributed without the written consent of
CCBIS.
CCB International Securities Limited
12/F, CCB Tower, 3 Connaught Road, Central, Hong Kong
Tel: (852) 2532 6100 / Fax: (852) 2537 0097