Embed Size (px)
Citation preview
SEEM Calibration: Phase-2 Adjustments for Failed VBDD Fits
RTF Calibration Subcommittee
July 31, 2014

Agenda
1. Problem overview and background2. Proposal A3. Proposal B4. Discussion
1. Problem Overview
4
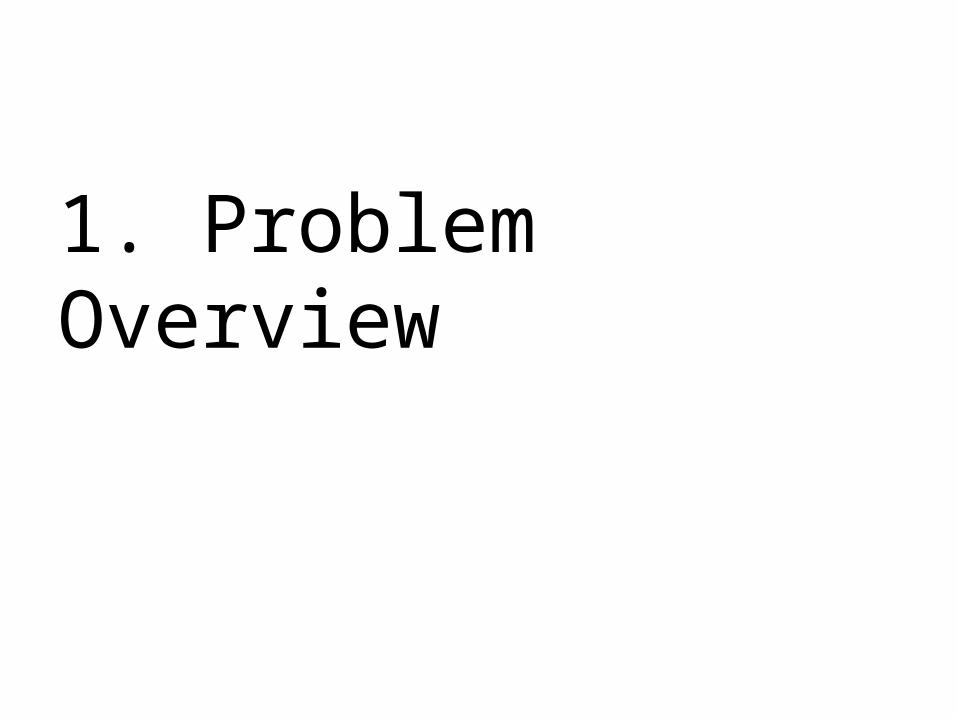
Calibration Review• Phase I: Estimating total heating energy.– Align SEEM with billing data for homes with strong
and clear heating energy signatures and no off-grid fuels.
• Phase II: Estimating electric heating energy in “typical” program homes.– How is electric heating energy affected by the
presence of natural gas and off-grid fuels?– What can we say about electric heating energy in
homes with weak or unclear heating energy signatures?
5
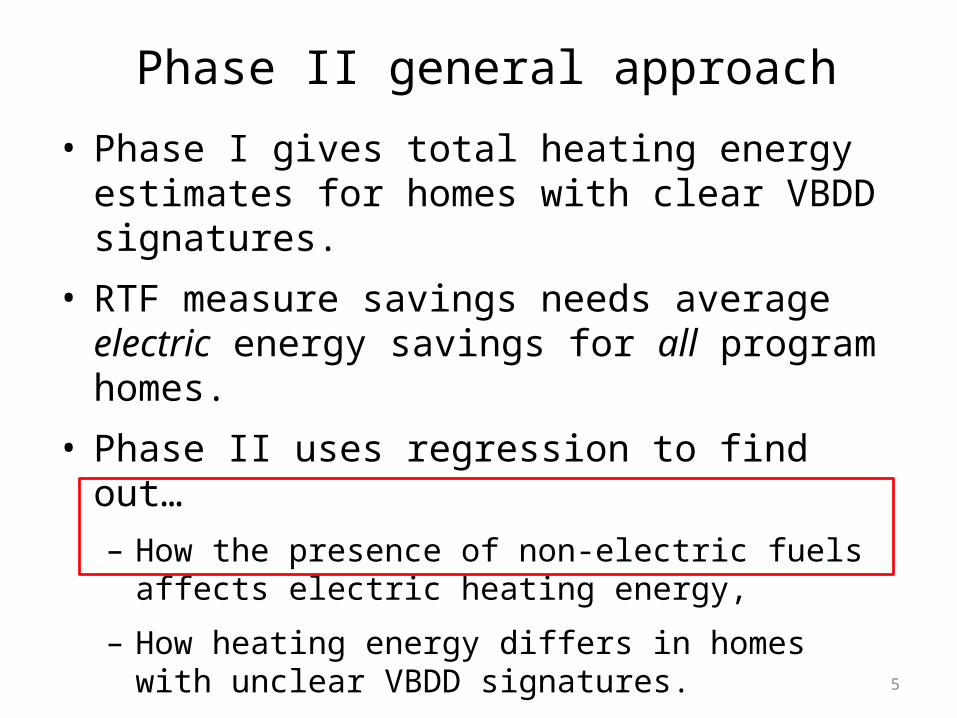
Phase II general approach• Phase I gives total heating energy estimates for
homes with clear VBDD signatures.
• RTF measure savings needs average electric energy savings for all program homes.
• Phase II uses regression to find out…– How the presence of non-electric fuels affects electric
heating energy,
– How heating energy differs in homes with unclear VBDD signatures.
• Regression focuses on TMY-normalized (VBDD) estimates derived from electric billing data.
6
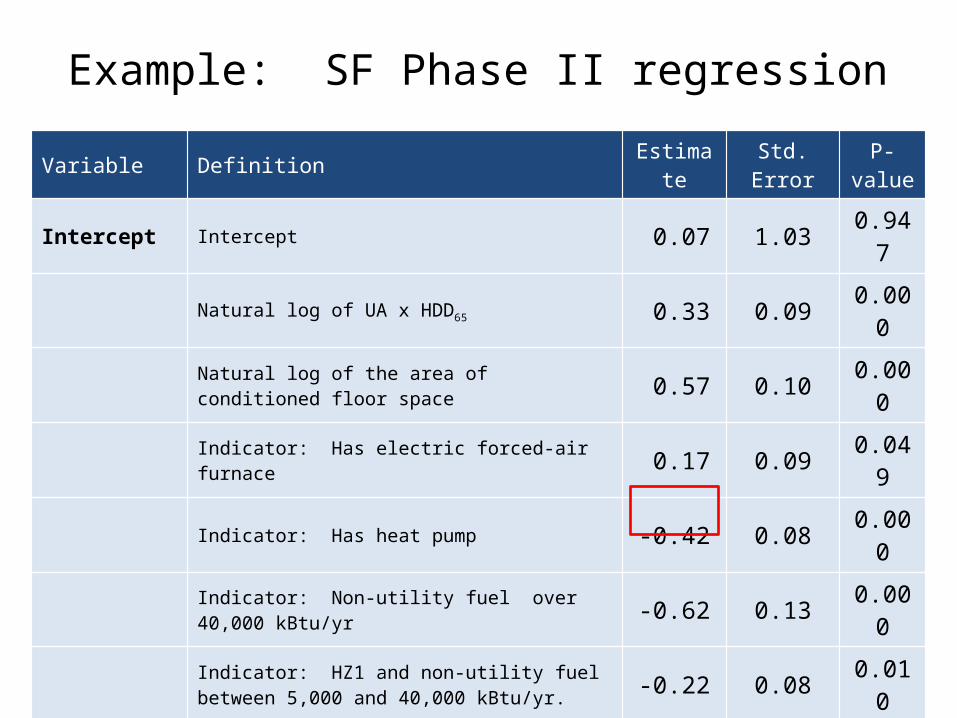
Example: SF Phase II regressionVariable Definition Estimate Std. Error P-value
Intercept Intercept 0.07 1.03 0.947Natural log of UA x HDD65 0.33 0.09 0.000Natural log of the area of conditioned floor space 0.57 0.10 0.000Indicator: Has electric forced-air furnace 0.17 0.09 0.049Indicator: Has heat pump -0.42 0.08 0.000Indicator: Non-utility fuel over 40,000 kBtu/yr -0.62 0.13 0.000Indicator: HZ1 and non-utility fuel between 5,000 and 40,000 kBtu/yr. -0.22 0.08 0.010
Indicator: Gas heating energy over 5,000 kWh/yr -1.04 0.11 0.000Indicator: Failed SEEM Calibration billing analysis filter -0.42 0.11 0.000
7
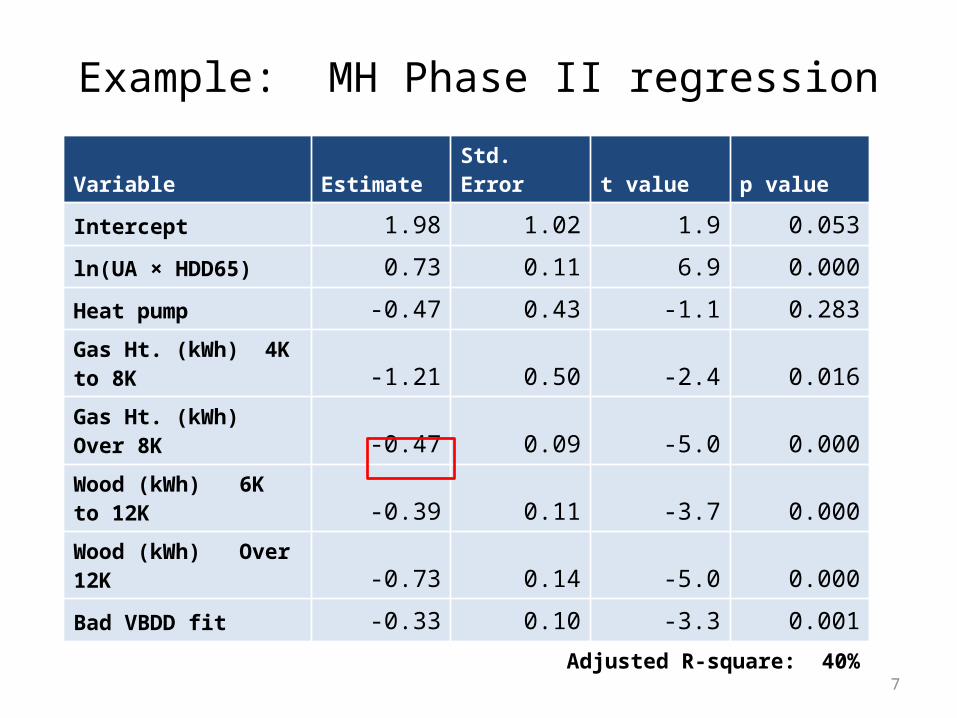
Example: MH Phase II regressionVariable Estimate Std. Error t value p value
Intercept 1.98 1.02 1.9 0.053
ln(UA × HDD65) 0.73 0.11 6.9 0.000
Heat pump -0.47 0.43 -1.1 0.283
Gas Ht. (kWh) 4K to 8K -1.21 0.50 -2.4 0.016
Gas Ht. (kWh) Over 8K -0.47 0.09 -5.0 0.000
Wood (kWh) 6K to 12K -0.39 0.11 -3.7 0.000
Wood (kWh) Over 12K -0.73 0.14 -5.0 0.000
Bad VBDD fit -0.33 0.10 -3.3 0.001
Adjusted R-square: 40%
The issue
• Regressions show that all else equal, VBDD heating energy estimates tend to be lower in homes with “poor” VBDD fits.
• But VBDD fits are “poor” for these sites!
• Should we really conclude that actual heating energy is lower?
What’s at stake?
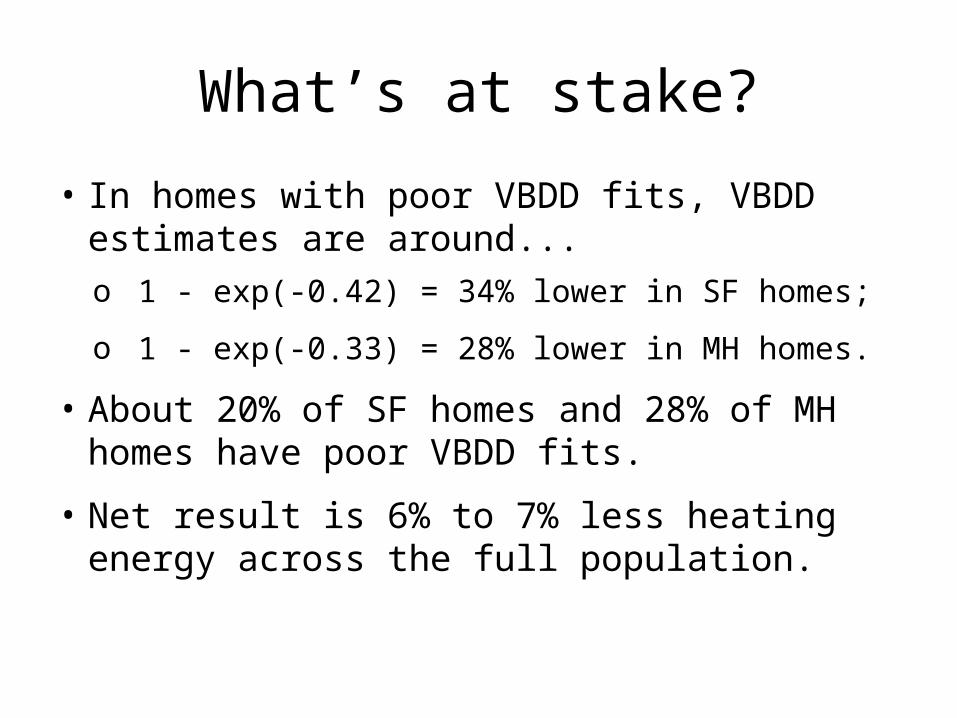
• In homes with poor VBDD fits, VBDD estimates are around...o 1 - exp(-0.42) = 34% lower in SF homes;
o 1 - exp(-0.33) = 28% lower in MH homes.
• About 20% of SF homes and 28% of MH homes have poor VBDD fits.
• Net result is 6% to 7% less heating energy across the full population.
Additional Notes
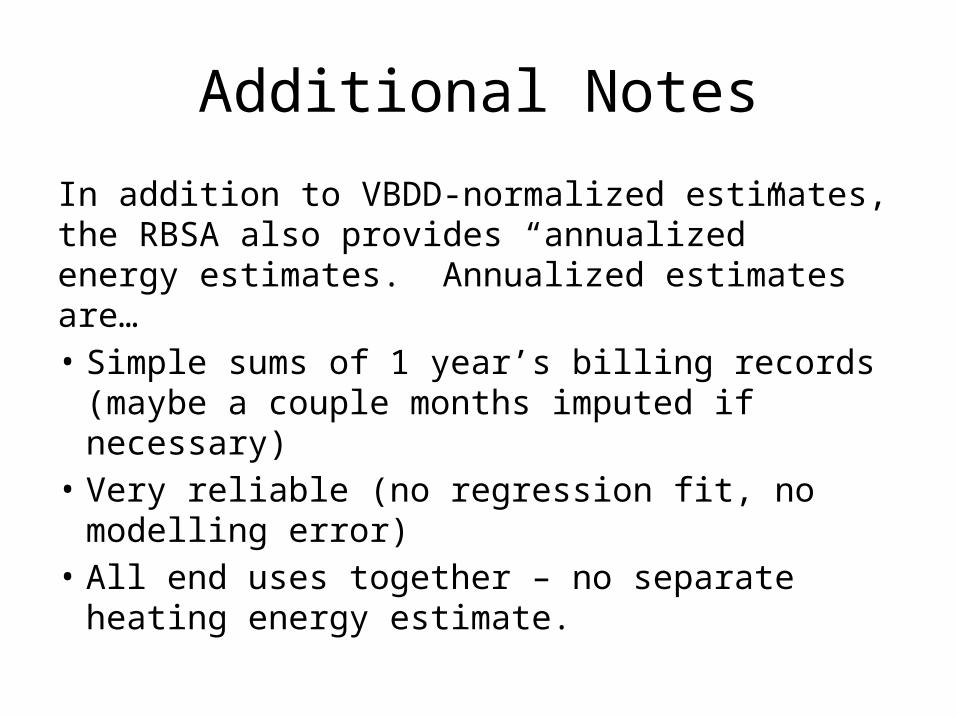
In addition to VBDD-normalized estimates, the RBSA also provides “annualized” energy estimates. Annualized estimates are…• Simple sums of 1 year’s billing records (maybe a
couple months imputed if necessary)• Very reliable (no regression fit, no modelling
error)• All end uses together – no separate heating
energy estimate.
Additional Notes
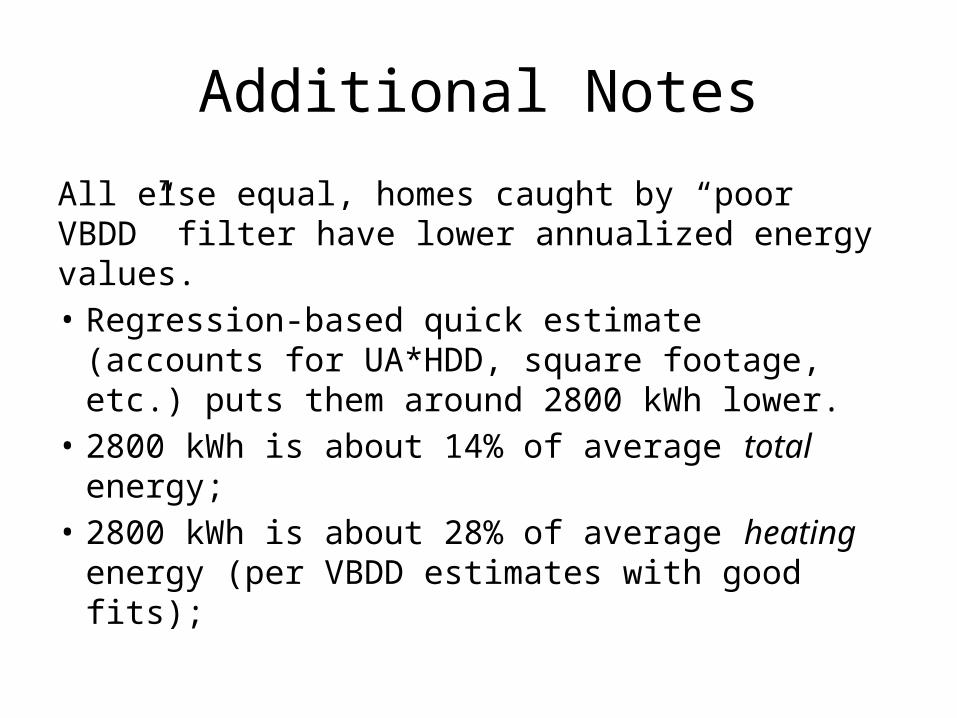
All else equal, homes caught by “poor VBDD” filter have lower annualized energy values.• Regression-based quick estimate (accounts for
UA*HDD, square footage, etc.) puts them around 2800 kWh lower.
• 2800 kWh is about 14% of average total energy;
• 2800 kWh is about 28% of average heating energy (per VBDD estimates with good fits);
The big question
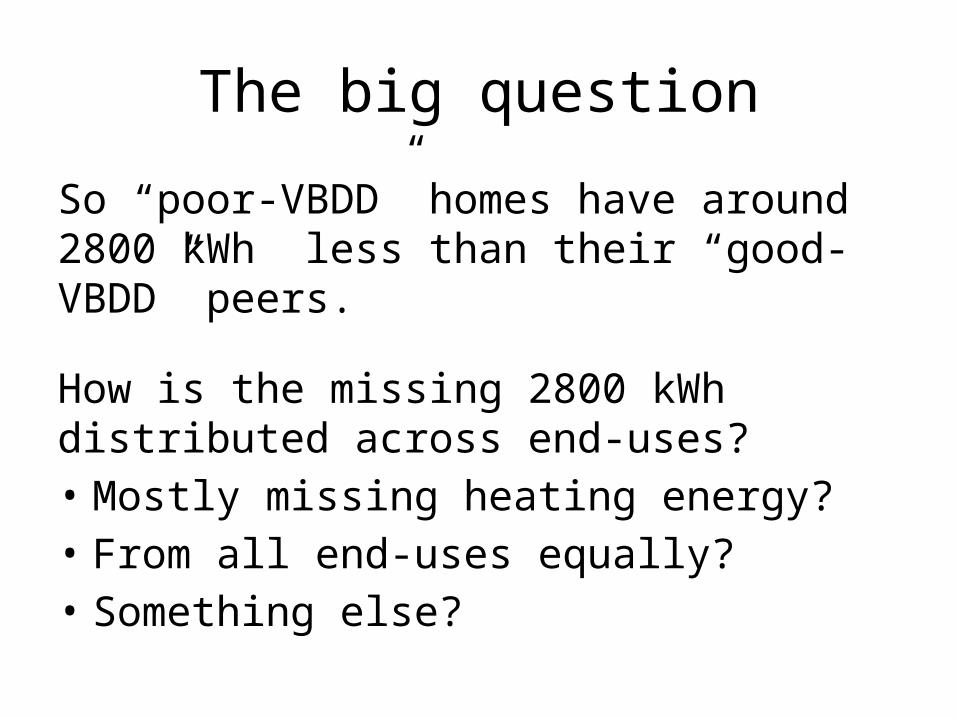
So “poor-VBDD” homes have around 2800 kWh less than their “good-VBDD” peers.
How is the missing 2800 kWh distributed across end-uses?• Mostly missing heating energy?• From all end-uses equally?• Something else?
One more bit of data
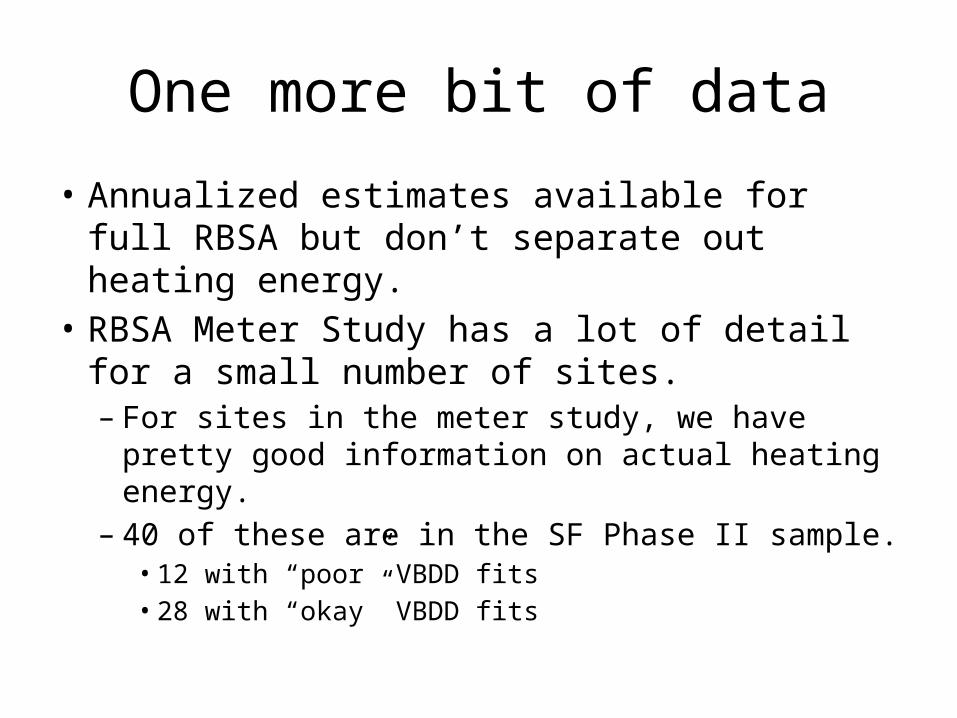
• Annualized estimates available for full RBSA but don’t separate out heating energy.
• RBSA Meter Study has a lot of detail for a small number of sites. – For sites in the meter study, we have pretty good
information on actual heating energy.– 40 of these are in the SF Phase II sample.• 12 with “poor” VBDD fits• 28 with “okay” VBDD fits
2. Proposal A
Summary
Proposal A: Take the existing Phase-II regression results at face value.
Supporting claim: Homes with poor VBDD fits really do have much lower heating energy (on average) than those with okay fits.
It’s mostly heating energy that’s missing from these homes’ annualized energy values.
Reasons…
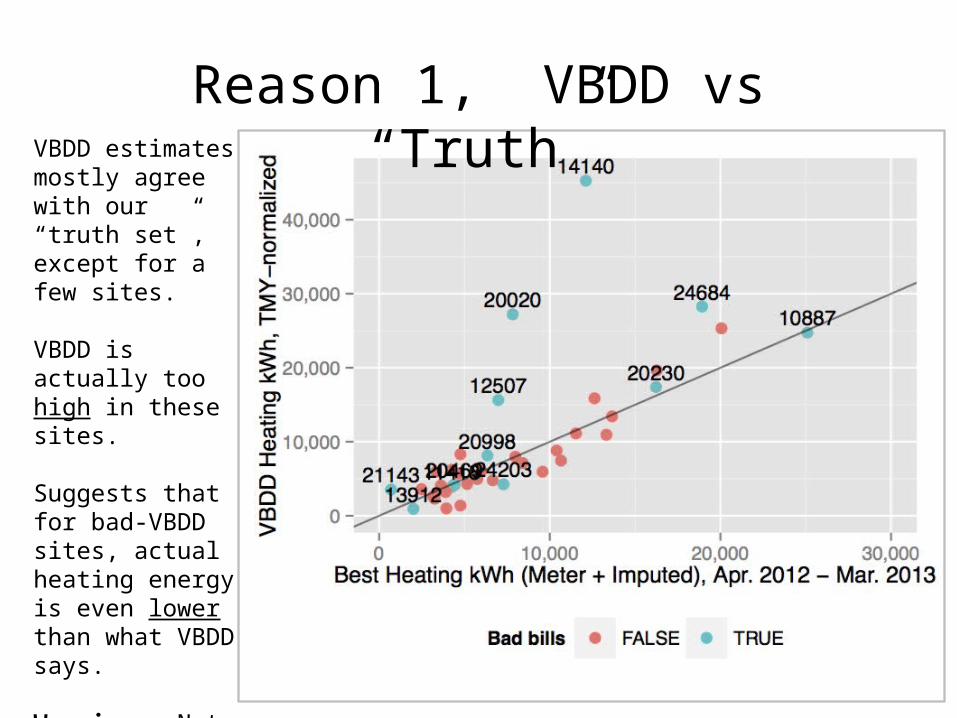
VBDD estimates mostly agree with our “truth set”, except for a few sites.
VBDD is actually too high in these sites.
Suggests that for bad-VBDD sites, actual heating energy is even lower than what VBDD says.
Warning: Note mismatched time periods.
Reason 1, VBDD vs “Truth”
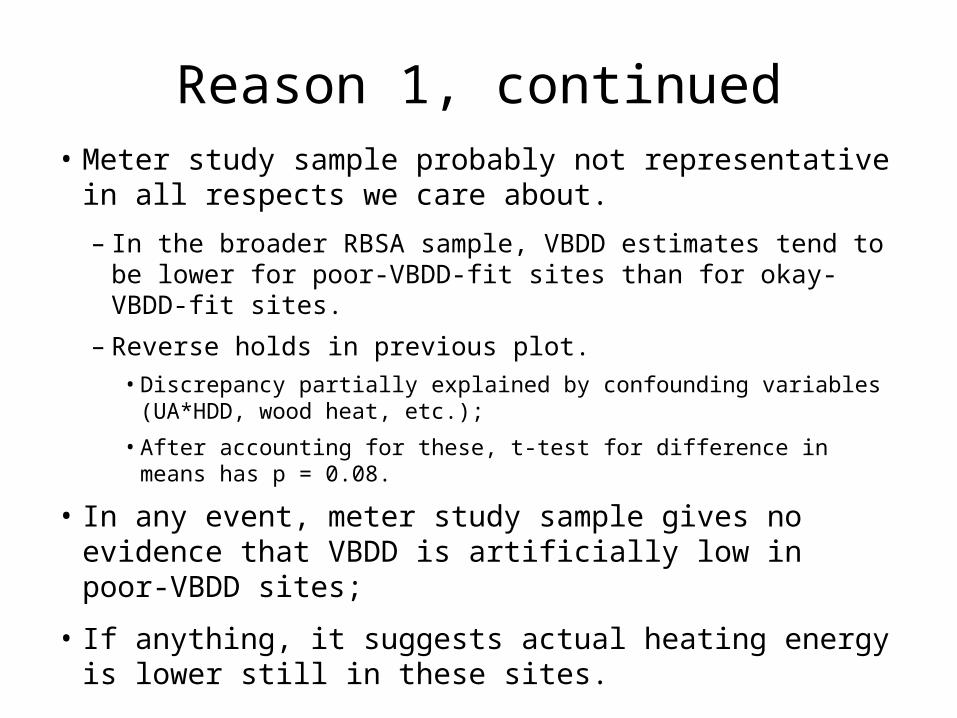
• Meter study sample probably not representative in all respects we care about.
– In the broader RBSA sample, VBDD estimates tend to be lower for poor-VBDD-fit sites than for okay-VBDD-fit sites.
– Reverse holds in previous plot.• Discrepancy partially explained by confounding variables (UA*HDD,
wood heat, etc.);
• After accounting for these, t-test for difference in means has p = 0.08.
• In any event, meter study sample gives no evidence that VBDD is artificially low in poor-VBDD sites;
• If anything, it suggests actual heating energy is lower still in these sites.
Reason 1, continued
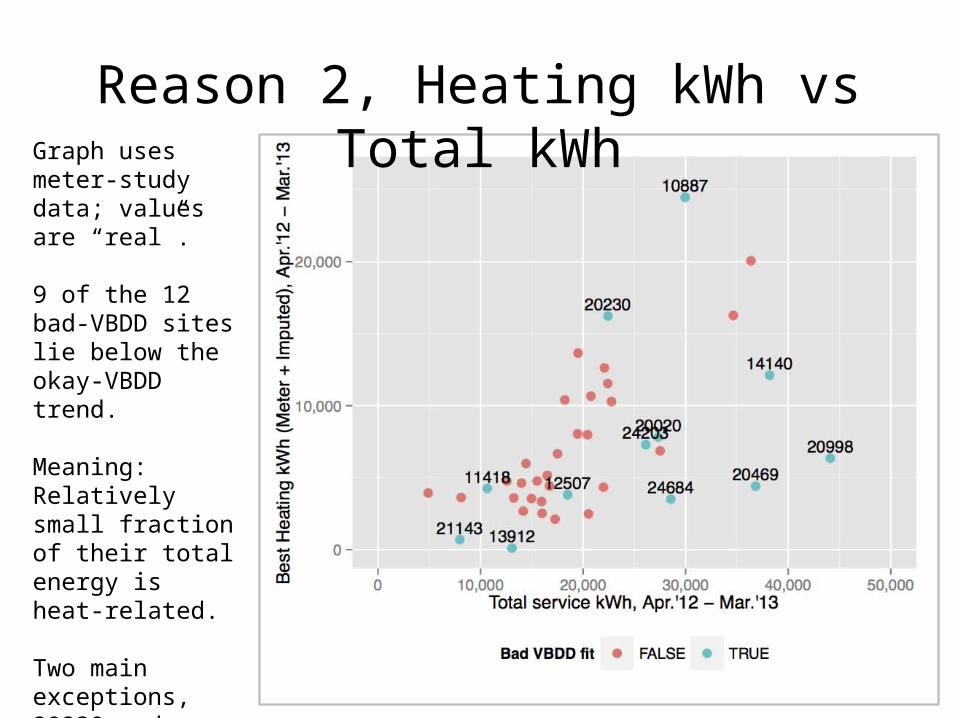
Graph uses meter-study data; values are “real”.
9 of the 12 bad-VBDD sites lie below the okay-VBDD trend.
Meaning: Relatively small fraction of their total energy is heat-related.
Two main exceptions, 20230 and 10877; VBDD- and meter-based estimates agree for these.
Reason 2, Heating kWh vs Total kWh
• Among sites in the meter study, most of those with “poor” VBDD fits use less heating energy, as a fraction of total energy, than those with okay fits.
• There are two serious exceptions, but VBDD appears to have gotten these sites “right.” (For whatever that’s worth.)
• As support for Proposal A, Reason 2 is sort of a mixed bag.
Reason 2, continued
3. Proposal B
Summary
Proposal B: Treat the “poor” VBDD fit sites’ missing 2800 kWh as coming from all end uses equally, so everything is reduced by about 14%. This leads to a net reduction of about 3% to 4% in population-average heating energy (instead of 6% to 7%).
Supporting claim: VBDD is totally detached from reality for some of these homes so we shouldn’t trust it at all. We have no clear basis for dividing the missing kWh among end uses, so the conservative move is to assume a uniform allocation.
Reasons…
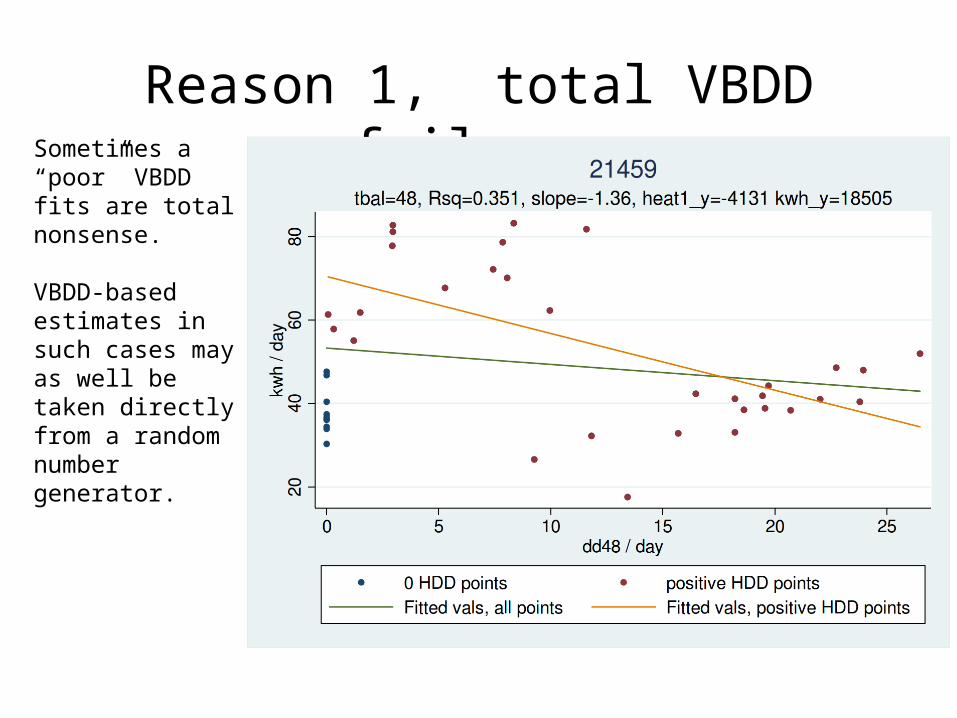
Sometimes a “poor” VBDD fits are total nonsense.
VBDD-based estimates in such cases may as well be taken directly from a random number generator.
Reason 1, total VBDD failures
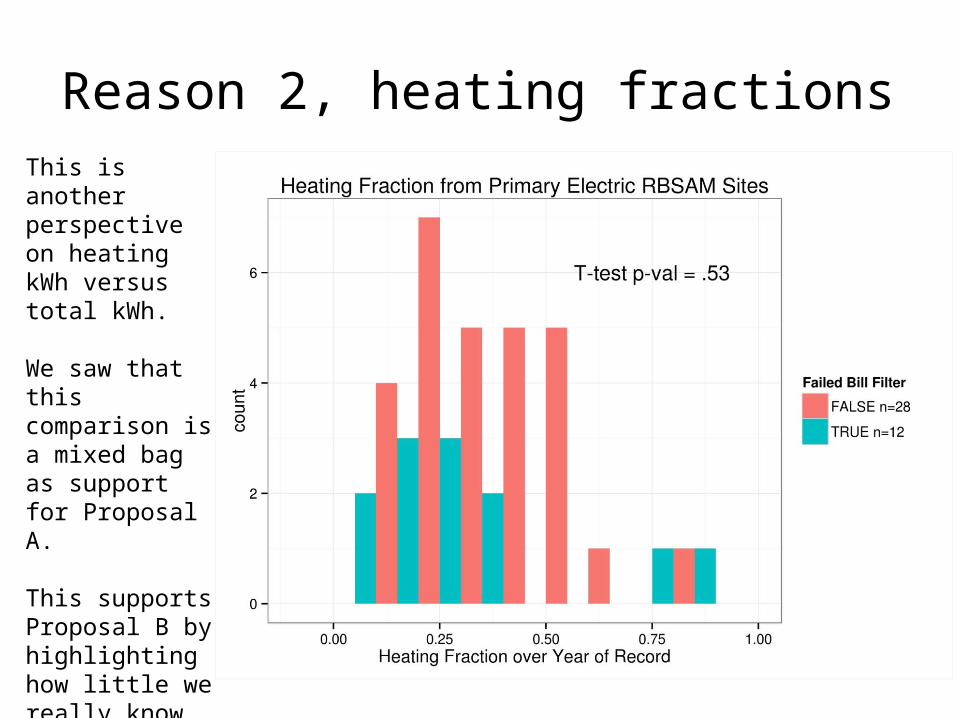
Reason 2, heating fractionsThis is another perspective on heating kWh versus total kWh.
We saw that this comparison is a mixed bag as support for Proposal A.
This supports Proposal B by highlighting how little we really know.

4. Discussion
Subcommittee notes

Subcommittee recommendation

Supplementary slides
+ +
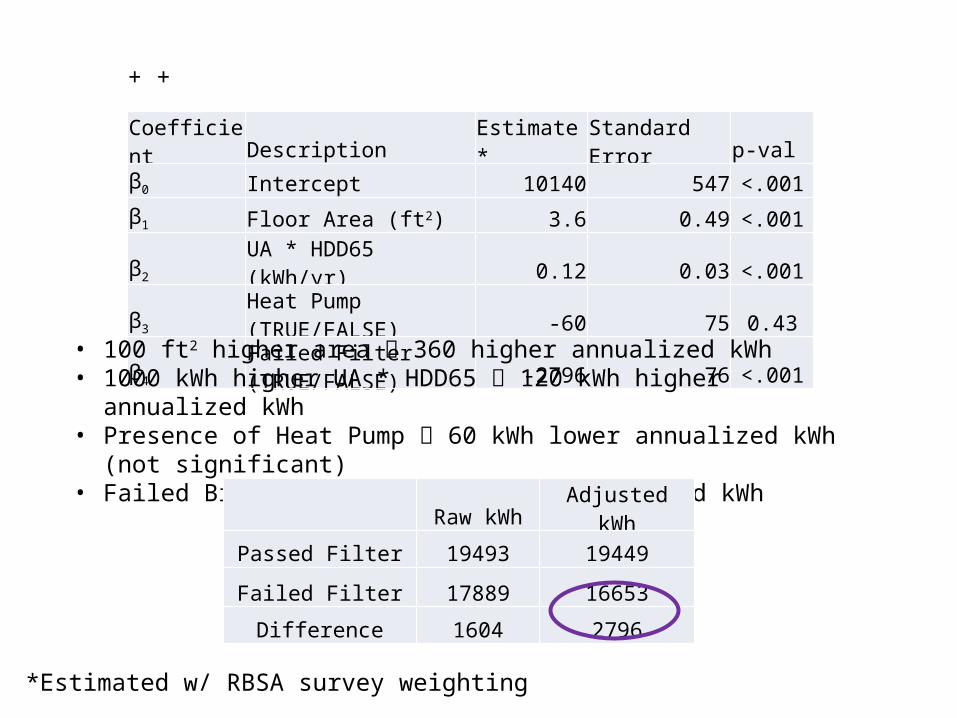
Coefficient Description Estimate* Standard Error p-valβ0 Intercept 10140 547 <.001β1 Floor Area (ft2) 3.6 0.49 <.001β2 UA * HDD65 (kWh/yr) 0.12 0.03 <.001β3 Heat Pump (TRUE/FALSE) -60 75 0.43β4 Failed Filter (TRUE/FALSE) -2796 76 <.001
• 100 ft2 higher area 360 higher annualized kWh• 1000 kWh higher UA * HDD65 120 kWh higher annualized kWh• Presence of Heat Pump 60 kWh lower annualized kWh (not significant)• Failed Bill Filter 2800 lower annualized kWh
*Estimated w/ RBSA survey weighting
Raw kWh Adjusted kWh
Passed Filter 19493 19449
Failed Filter 17889 16653
Difference 1604 2796
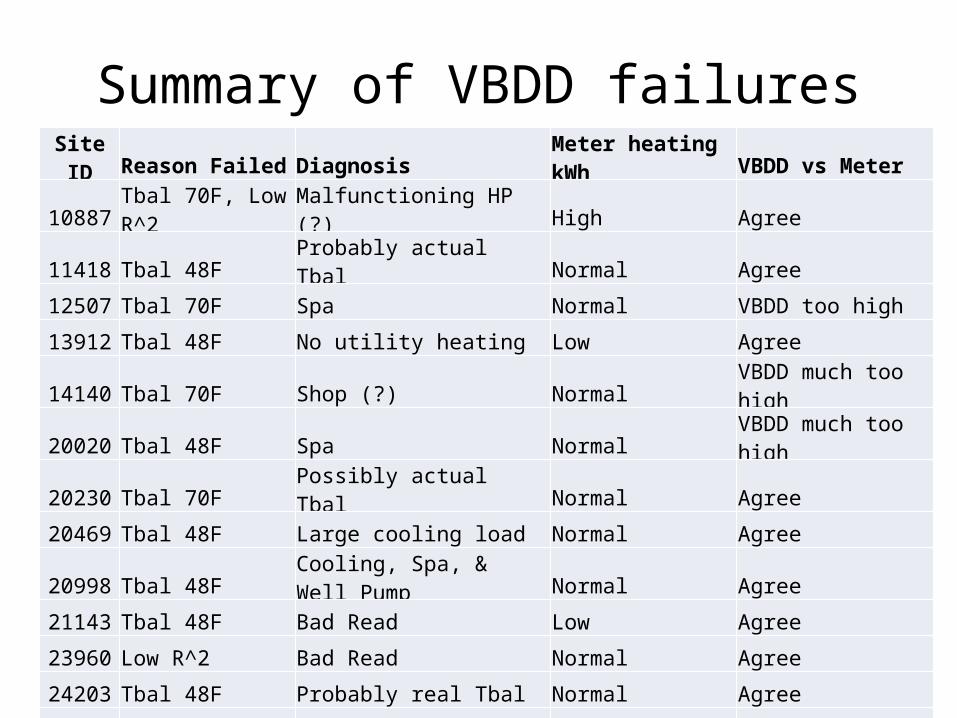
Summary of VBDD failuresSite ID Reason Failed Diagnosis Meter heating kWh VBDD vs Meter
10887 Tbal 70F, Low R^2 Malfunctioning HP (?) High Agree
11418 Tbal 48F Probably actual Tbal Normal Agree
12507 Tbal 70F Spa Normal VBDD too high
13912 Tbal 48F No utility heating Low Agree
14140 Tbal 70F Shop (?) Normal VBDD much too high
20020 Tbal 48F Spa Normal VBDD much too high
20230 Tbal 70F Possibly actual Tbal Normal Agree
20469 Tbal 48F Large cooling load Normal Agree
20998 Tbal 48F Cooling, Spa, & Well Pump Normal Agree
21143 Tbal 48F Bad Read Low Agree
23960 Low R^2 Bad Read Normal Agree
24203 Tbal 48F Probably real Tbal Normal Agree
24375 Low R^2 Vacations & Spa Low Agree
24684 Low R^2 Possible Bad Reads Normal VBDD too high
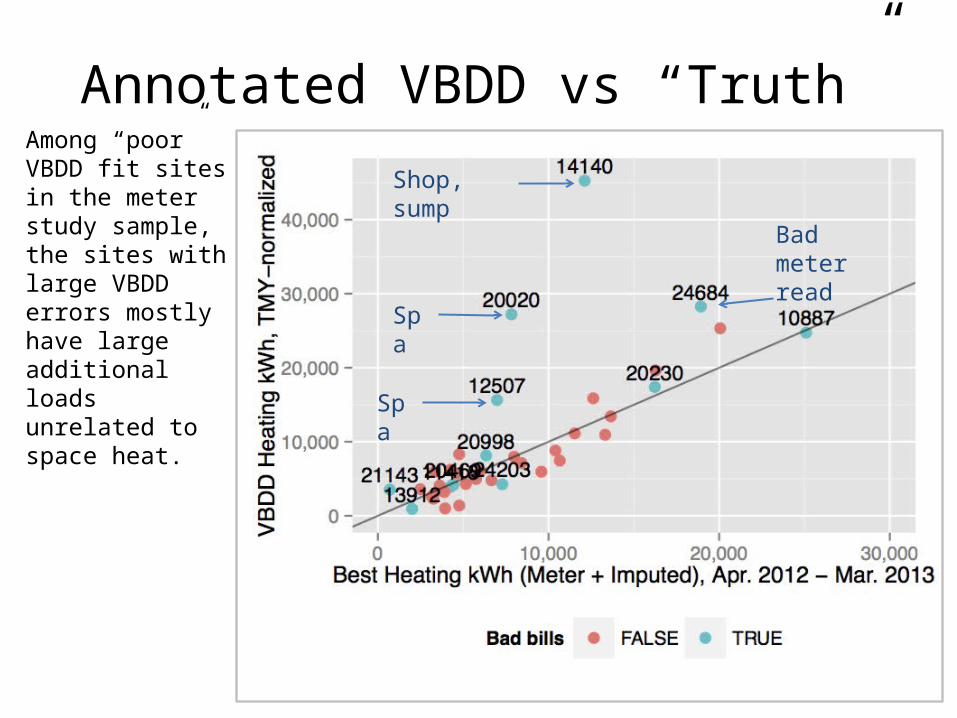
Annotated VBDD vs “Truth”
Shop, sump
Spa
Spa
Bad meter read
Among “poor” VBDD fit sites in the meter study sample, the sites with large VBDD errors mostly have large additional loads unrelated to space heat.
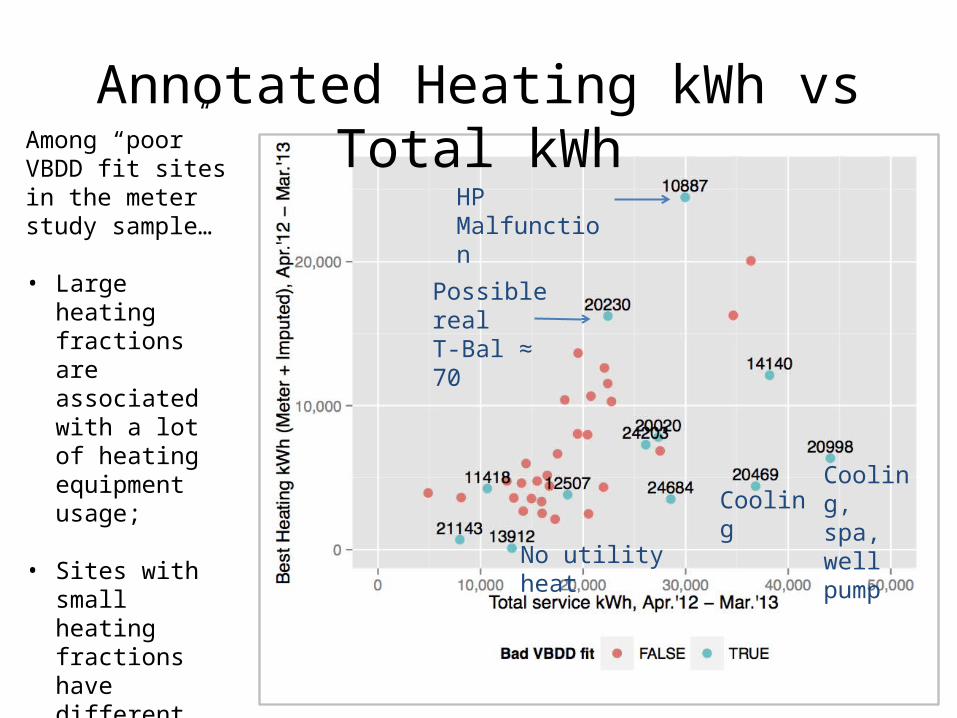
Annotated Heating kWh vs Total kWh
HP Malfunction
Possible realT-Bal ≈ 70
Cooling, spa, well pump
Cooling
Among “poor” VBDD fit sites in the meter study sample…
• Large heating fractions are associated with a lot of heating equipment usage;
• Sites with small
heating fractions have different causes (little heat or lots of other stuff).
No utility heat