Embed Size (px)
Citation preview
SEEM4630 2011-2012
Tutorial 4 – Clustering
2
What is Cluster Analysis? Finding groups of objects such that the objects in
a group will be similar (or related to one another and different from (or unrelated to) the objects in other groups.
A good clustering method will produce high
quality clusters high intra-class similarity: cohesive within clusters
low inter-class similarity: distinctive between clusters
3
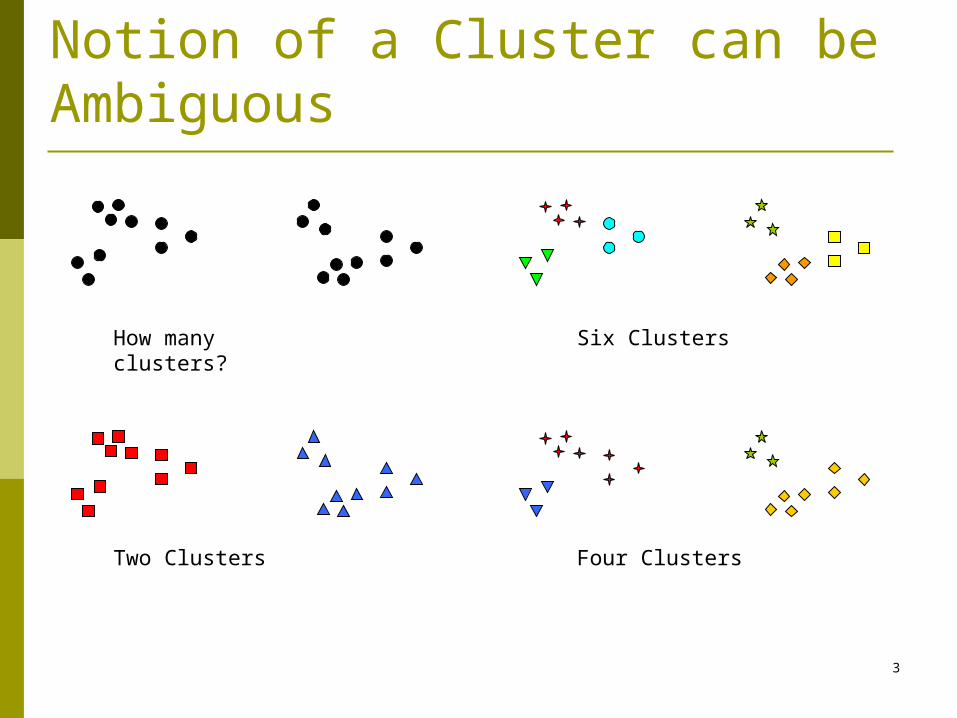
Notion of a Cluster can be Ambiguous
How many clusters?
Four Clusters Two Clusters
Six Clusters
4
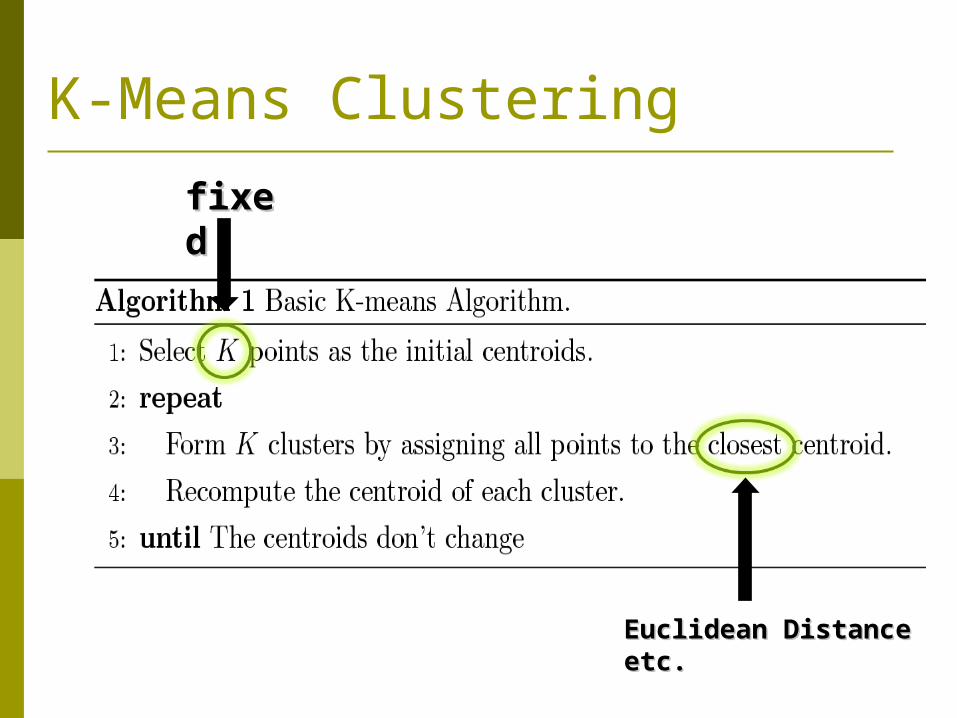
K-Means Clustering
fixefixedd
Euclidean Distance Euclidean Distance etc.etc.
5
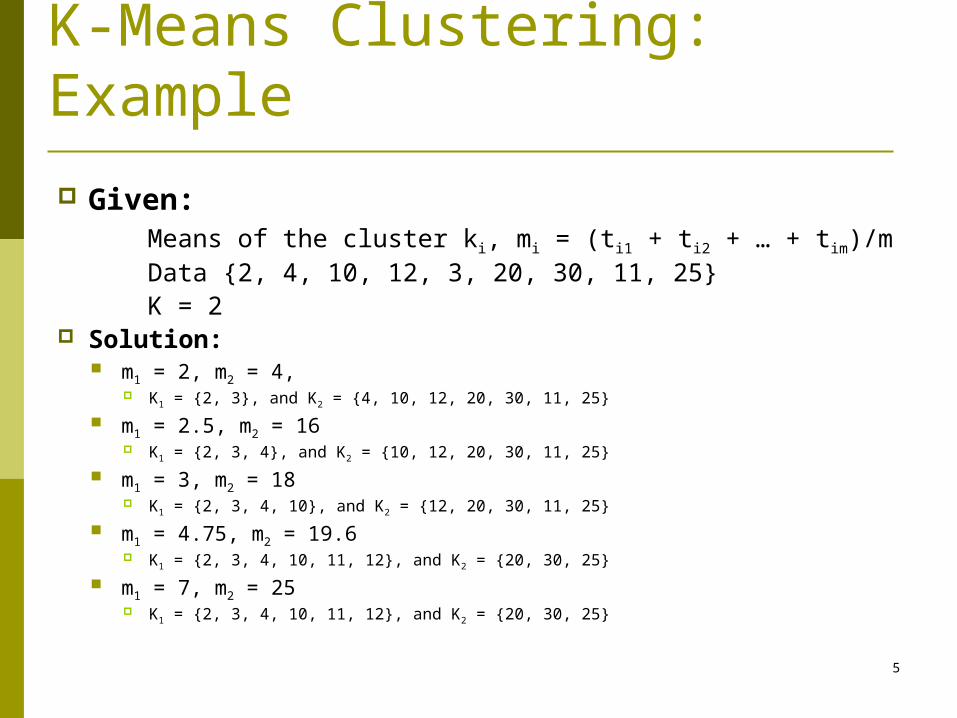
K-Means Clustering: Example
Given: Means of the cluster ki, mi = (ti1 + ti2 + … + tim)/m Data {2, 4, 10, 12, 3, 20, 30, 11, 25} K = 2 Solution:
m1 = 2, m2 = 4, K1 = {2, 3}, and K2 = {4, 10, 12, 20, 30, 11, 25}
m1 = 2.5, m2 = 16 K1 = {2, 3, 4}, and K2 = {10, 12, 20, 30, 11, 25}
m1 = 3, m2 = 18 K1 = {2, 3, 4, 10}, and K2 = {12, 20, 30, 11, 25}
m1 = 4.75, m2 = 19.6 K1 = {2, 3, 4, 10, 11, 12}, and K2 = {20, 30, 25}
m1 = 7, m2 = 25 K1 = {2, 3, 4, 10, 11, 12}, and K2 = {20, 30, 25}
6
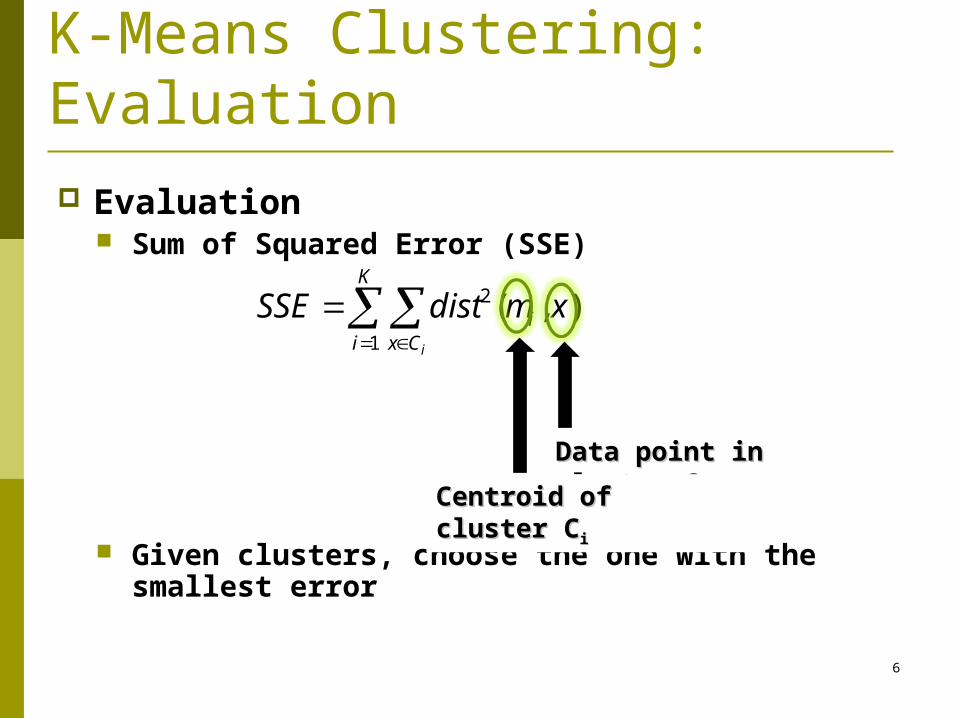
K-Means Clustering: Evaluation Evaluation
Sum of Squared Error (SSE)
Given clusters, choose the one with the smallest error
K
i Cxi
i
xmdistSSE1
2 ),(
Data point in Data point in cluster Ccluster CiiCentroid of cluster Centroid of cluster
CCii
7
Limitations of K-means It is hard to determine a good
K value The initial K centroids
K-means has problems when the data contains outliers. Outliers can be handled better by hierarchical
clustering and density-based clustering
8
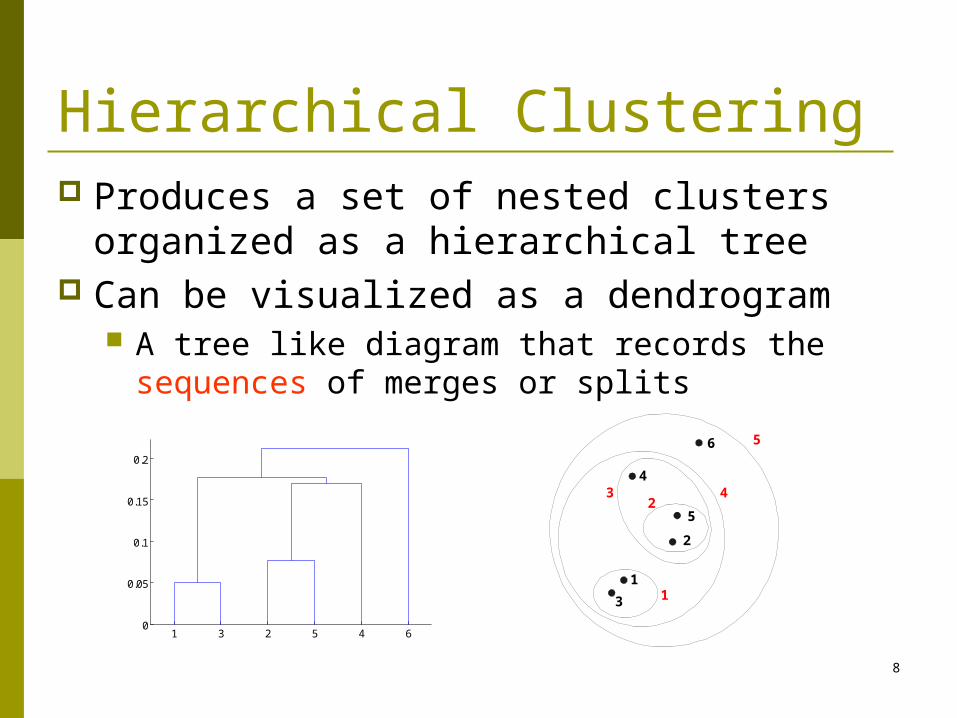
Hierarchical Clustering Produces a set of nested clusters
organized as a hierarchical tree Can be visualized as a dendrogram
A tree like diagram that records the sequences of merges or splits
1 3 2 5 4 60
0.05
0.1
0.15
0.2
1
2
3
4
5
6
1
23 4
5

9
Strengths of Hierarchical Clustering Do not have to assume any particular
number of clusters Any desired number of clusters can be
obtained by ‘cutting’ the dendrogram at the proper level
Partition direction Agglomerative: starting with single elements
and aggregating them into clusters Divisive: starting with the complete data set
and dividing it into partitions
10
Agglomerative Hierarchical Clustering
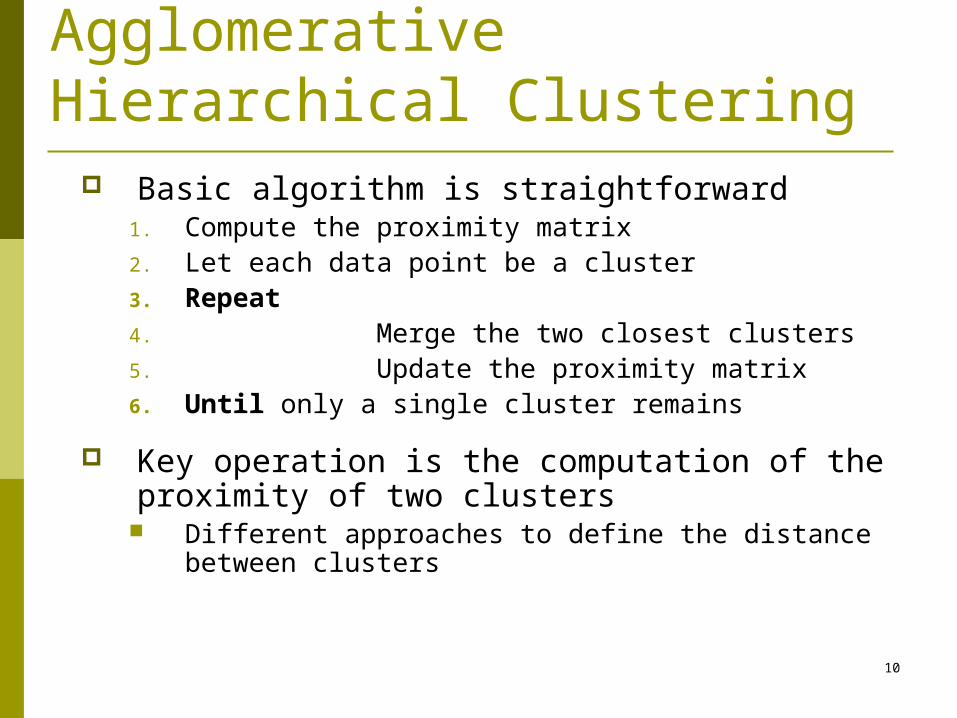
Basic algorithm is straightforward1. Compute the proximity matrix2. Let each data point be a cluster3. Repeat4. Merge the two closest clusters5. Update the proximity matrix6. Until only a single cluster remains
Key operation is the computation of the proximity of two clusters
Different approaches to define the distance between clusters
11
Hierarchical ClusteringDefine Inter-Cluster Similarity
Min Max Group Average Distance between Centroids
12
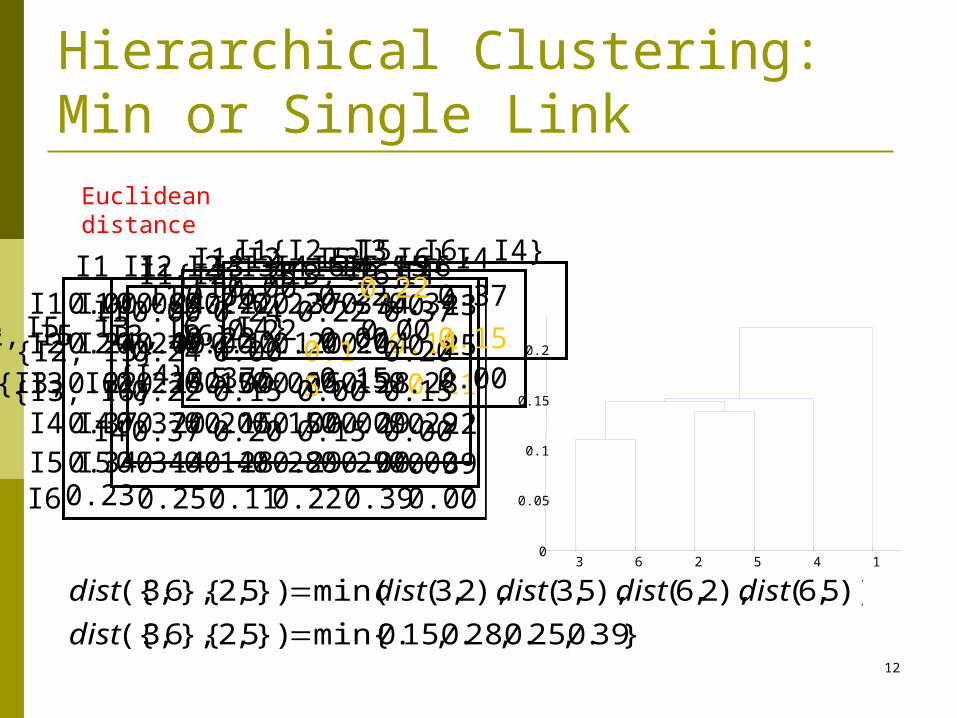
Hierarchical Clustering: Min or Single Link
I1 I2 I3 I4 I5I1 0.00 0.24 0.22 0.37 0.34I2 0.24 0.00 0.15 0.20 0.14I3 0.22 0.15 0.00 0.15 0.28I4 0.37 0.20 0.15 0.00 0.29I5 0.34 0.14 0.28 0.29 0.00I6
I6
0.23 0.25 0.11 0.22 0.39
0.230.250.110.220.390.00
3 6 2 5 4 10
0.05
0.1
0.15
0.2
I1 I2 {I3, I6} I4 I5I1 0.00 0.24 0.22 0.37 0.34I2 0.24 0.00 0.15 0.20 0.14
{I3, I6} 0.22 0.15 0.00 0.15 0.28I4 0.37 0.20 0.15 0.00 0.29I5 0.34 0.14 0.28 0.29 0.00
I1 {I2, I5} {I3, I6} I4I1 0.00 0.24 0.22 0.37
{I2, I5} 0.24 0.00 0.15 0.20{I3, I6} 0.22 0.15 0.00 0.15
I4 0.37 0.20 0.15 0.00
I1 {I2, I5, I3, I6} I4I1 0.00 0.22 0.37
{I2, I5, I3, I6}{I4}
0.22 0.00 0.150.37 0.15 0.00
I1 {I2, I5, I3, I6, I4}I1 0.00 0.22
{I2, I5, I3, I6, I4} 0.22 0.00
}39.0,25.0,28.0,15.0min{})5,2{},6,3({
))5,6(),2,6(),5,3(),2,3(min(})5,2{},6,3({
dist
distdistdistdistdist
Euclidean distance