Embed Size (px)
Citation preview
American Journal of Medical Genetics 104:23±30 (2001)
Segregation Analyses of Asthma and RespiratoryAllergy: The Humboldt Family Study
Yue Chen,1* Audrey H. Schnell,2 Donna C. Rennie,3,4 Robert C. Elston,2 Lori A. Lockinger,3
and James A. Dosman3
1Department of Epidemiology and Community Medicine, Faculty of Medicine, University of Ottawa,Ottawa, Ontario, Canada2Department of Epidemiology and Biostatistics, Case Western Reserve University, Cleveland, Ohio3Centre for Agricultural Medicine and Department of Medicine, University of Saskatchewan,Saskatoon, Saskatchewan, Canada4College of Nursing, University of Saskatchewan, Saskatoon, Saskatchewan, Canada
We performed segregation analyses ofasthma and respiratory allergy based ondata from 309 nuclear families comprising1,053 individuals living in the town ofHumboldt, Saskatchewan, in 1993, usingthe REGD program of the S.A.G.E. programpackage. For adults, information on asthmaand history of respiratory allergy was pro-vided by the subjects themselves, and forchildren by their parents. When asthma wasconsidered as the trait in segregation ana-lysis, models of no major effect, with orwithout familial effects, were rejected, butthey were not rejected after adjusting forhistory of respiratory allergy. The majorgene hypothesis was not rejected beforeadjusting for history of respiratory allergy.When respiratory allergy was analyzed asthe trait, both major gene and multifactorialmodels ®tted the data well, regardless ofwhether there was adjustment for asthma ornot. Other covariates adjusted for in thesegregation analyses were age, sex, numberof household smokers, current smoking,number of household members, generation,and house type. The data suggest that amajor gene related to respiratory allergymay explain the familial aggregation ofasthma. ß 2001 Wiley-Liss, Inc.
KEY WORDS: allergy; asthma; families;genetics; major gene; respi-ratory; segregation
INTRODUCTION
There is abundant evidence indicating that asthma isboth environmental and genetic. It is possible that anumber of genetic mechanisms are involved in thedevelopment of asthma; however, the modes of inheri-tance are largely unknown [Sandford et al., 1996].Some segregation analyses have suggested major genecontrol of asthma [Lawrence et al., 1994; EuropeanCommunity Respiratory Health Survey Group, 1997],whereas the major gene effect is less convincing inother studies [Holberg et al., 1996; Jenkins et al., 1997].
The in¯ammatory response of airways to aeroaller-gens is potentially the most important underlyingmechanism for the genetic control of asthma [Sandfordet al., 1996]. There is evidence of major gene effects ontotal serum immunoglobulin E (IgE) [Gerrard et al.,1978; Blumenthal et al., 1981; Marsh et al., 1981;Martinez et al., 1994; Meyers, 1994], which is anindicator of allergic reaction and an important char-acteristic of allergy. If allergy-mediating genetic effectson the development of asthma is a major mechanism formajor gene control of asthma, we would expect theobserved major gene effects on asthma to be explainedby respiratory allergy.
In a previous analysis of 309 nuclear families, Chenet al. [1998] performed a segregation analysis forwheeze, an important clinical characteristic of asthma.Before a history of respiratory allergy was included as acovariate, the data showed that the transmissionparameters for a major type were not signi®cantlydifferent from their Mendelian expectations and thehypothesis of a nontransmitted major factor wasrejected, suggesting that a major gene in¯uences theexpression of wheeze. However, when respiratoryallergy was included as a covariate, the Mendelian
Grant sponsor: Saskatchewan Health Services Utilization andResearch Commission; Grant sponsor: U.S. Public Health Service,National Institute of General Medical Sciences; Grant number:GM 28356; Grant sponsor: National Center for ResearchResources; Grant number: 1 P41 RR03655.
*Correspondence to: Dr. Yue Chen, Department of Epidemiol-ogy and Community Medicine, Faculty of Medicine, University ofOttawa, 451 Smyth Road, Ottawa, Ontario, Canada K1H 8M5.E-mail: [email protected]
Received 4 August 2000; Accepted 27 July 2001
DOI 10.1002/ajmg.10026
ß 2001 Wiley-Liss, Inc.

hypothesis was rejected, suggesting that allergy isthe reason for the major gene control of wheeze. Inthis report, we conduct segregation analyses for bothself-reported physician-diagnosed asthma and historyof respiratory allergy. The analyses further support the``allergic in¯ammation'' theory that genetic predisposi-tion to allergic reaction causes asthma [Sandford et al.,1996].
MATERIALS AND METHODS
Study Subjects and Data Collection
We conducted a family study in the town ofHumboldt, Saskatchewan, in 1993, and ascertainedyoung families through parents who reported having atleast one child between ages 6 and 17 years living in thetown [Chen et al., 1998, 1999b]. Canvassers contactedall households within the town and left a questionnairefor all adults aged 18±74 years [Chen et al., 1995]. Thequestionnaire was completed in the home by adultsubjects and returned during a prearranged clinic visit.The questionnaire ascertained whether or not therespondent was the parent of a child aged 6±17 yearsand, if so, requested information on the names and agesof the children. The children's portion of the studywas carried out in each of four schools in the town (onehigh school and three primary schools) on the basis oflists of enrolled students aged 6±17 years attendingeach school. Subjects less than 18 years of age who werenot attending school were identi®ed by means of a totaltown canvass that was conducted for the adult portionof a cross-sectional study [Chen et al., 1995]. Therewere a total of 1,019 eligible children and adolescentsaged 6±17 years, and 892 (87.5%) of them participatedin the cross-sectional study. Of 2,327 potential adultsubjects 18±74 years of age, 1,998 participated, result-ing in a response rate of 85.9% [Chen et al., 1995].Almost all town residents (99.6%) were of Caucasianbackground.
We excluded step-offspring and adopted offspring,and identi®ed 214 young families with both parentswho participated in the study, and 95 families in whichonly one parent participated. All the data on 1,053individuals from these 309 families were used in thisanalysis.
A self-administered questionnaire for adults coveredinformation on sociodemographic factors, smoking,alcohol consumption, exercise, home environment,history of allergy, and individual and family history ofrespiratory symptoms and diseases. A questionnaire forthe adolescents aged 12±17 years consisted of twoparts. The ®rst part of the questionnaire was designedfor completion by the parent(s). In this part, the parentsprovided information on the child's sociodemographiccharacteristics, history of allergy, respiratory symp-toms and diseases, and home environment. Theadolescents completed a second portion of the ques-tionnaire by themselves at school on lifestyle topics,including active smoking and drinking habits. Forchildren 6±11 years of age, their parents completed aquestionnaire that ascertained information concerningthe child's lifestyle, similar to the adult and adolescent
questionnaires, except that information on activesmoking was not collected.
Physician-diagnosed asthma was de®ned as a posi-tive response to the question asking if a doctor had eversaid the subject had asthma. A history of allergy wasascertained by asking the following question: ``Haveyou (Has this child) ever had an allergic reaction tothings that: 1. Are eaten or ingested (e.g., food ormedicine)? 2. Are inhaled (e.g., pollen, dust, animal fur,or smoke)? 3. Come in contact with the skin (e.g.,detergents, wool, or metal)? 4. Other? Specify: ___.''Respiratory allergy was de®ned as an af®rmativeresponse to the second choice.
A current smoker was de®ned as a person whoreported smoking every day or almost every day cur-rently and had smoked at least 20 packs during thelifetime. Household exposure to environmental tobaccosmoke (ETS) was estimated based on the number ofhousehold smokers other than the subject himself/herself. Type of house was either single-family house orother.
Statistical Analysis
We performed segregation analyses for asthma andrespiratory allergy separately. In order to determinewhich covariates should be included in the segregationanalyses, we conducted logistic regression analysesignoring the familial nature of the data with a back-ward elimination process, using the PROC LOGISTICprogram in the SAS system [SAS, 1996], with eitherasthma or respiratory allergy as the dependent vari-able. The following covariates were considered forinclusion: sex, age, smoking, number of householdsmokers, type of house, number of household members,and generation (parent or offspring). In addition, allpossible two-way interactions with sex were included,as were age2 and age3. Thus a full model with all thesemain effects and interactions was initially ®tted, andthe least signi®cant effect was eliminated from themodel. This process was repeated until only covariatessigni®cant at the 0.10 level remained. Those covaria-tes signi®cant for either asthma or respiratory allergyas the dependent variable were then included in allsegregation analyses.
Segregation analysis was performed using the REGDprogram, which is part of the Statistical Analysis forGenetic Epidemiology (S.A.G.E.) computer package[S.A.G.E., 1998]. REGD performs maximum likelihoodsegregation analysis of a dichotomous trait using amodi®ed class A regressive logistic model [Bonney,1986] that allows for residual sib correlation [Karunar-atne et al., 1998]. The models allow for up to three typesof individuals (AA, AB, and BB), where type refers tothe presence of two factors (A and/or B) that can betransmitted from generation to generation. Type isde®ned in terms of transmission: two people are of thesame type only if their offspring by a mate of given typehave the same phenotypic distribution. The probabilitythat factor A is transmitted from parent to offspring is atransmission probability that depends on the parent'stype: the probability that a person of a given type
24 Chen et al.
transmits factor A to offspring. The word ``type'' is usedgenerally, whatever the mode of transmission, Mende-lian inheritance being a speci®c mode of transmissionin which the types are genotypes and the transmissionprobabilities for the three genotypes (AA, AB, and BB)are 1, 0.5, and 0, respectively. Mendelian inheritance, ifit occurs, is assumed to be through a single autosomallocus with two alleles (A and B), where A is the alleleassociated with the disease. If the Hardy-Weinbergequilibrium is assumed, then the relative frequencies ofthe three genotypes in the population are q2, 2q(1ÿq),and (1ÿq)2 for AA, AB, and BB, respectively, where q isthe frequency of allele A.
The penetrance function for an affected individual istaken to be exp(bu� covariates� familial effects)/[1� exp(bu� covariates� familial effects)], and for anunaffected individual 1/[1� exp(bu� covariates� fami-lial effects)], where bu is the baseline parameter for aperson with (geno)type u. The familial effects includespouse and parental effects, quanti®ed by regressivecoef®cients in order to allow for additional parentalcorrelation not accounted for by major genotype[Bonney, 1986]. REGD also allows for the inclusion ofa sib covariate that measures the proportion ofother sibs in a sibship who are affected. Letting r bethe number of affected sibs and s the total numberof sibs in the sibship, the sib covariate is r/(sÿ 1 ) ifthe sib is unaffected, (rÿ1 )/(sÿ1 ) if the sib is affected,and 0 if there is only one sib in the sibship. Inother words, the covariate for a particular sib is theproportion of the other sibs in the sibship who areaffected.
Models corresponding to a no major effect, a domi-nant mode, and a recessive mode of inheritance were®tted to the data. More complex models were also testedby allowing for multifactorial effects of mothers,fathers, and sibs. When estimating the multifactorialeffects, restrictions were placed on the model such thatthe effect of an unaffected parent could not be greaterthan 0, and the effect of an affected parent could not beless than 0. A purely multifactorial model with no majorgene effect, allowing for multifactorial effects ofmothers, fathers, and sibs, was also ®tted to the data.Multifactorial effects were also added to the best-®ttingMendelian (dominant or recessive) model. The like-lihoods of two models were tested, one against theother, when one could be considered as a special case ofthe other. Under certain conditions, the difference inloge likelihoods is asymptotically distributed as a chi-
square statistic (w2df) when the more restricted model
holds, with degrees of freedom (df) equal to thedifference in the number of independent parametersbeing estimated between the two models. We use thisdistribution as an approximation in the upper tail forall cases [Atwood et al., 1995], although sometimes theasymptotic distribution is a mixture of chi-squaredistributions [Self and Liang, 1987]. The no majoreffect and major gene models (dominant and recessive)were compared to a general model where the transmis-sion probabilities are estimated, but with the restric-tion of homogeneity of the trait distribution acrossgenerations [Demenais and Elston, 1981]. The majorgene model with a multifactorial component wascompared to the model with only a major gene effectand to the model with only a multifactorial component(no major gene component).
Several sets of initial estimates were used for eachmodel ®tted in order to ®nd the global maximum,rather than a local maximum, of the likelihood. Theanalyses were done using asthma (or respiratory aller-gy) as the trait 1) incorporating only covariates otherthan respiratory allergy (or asthma), and 2) addingrespiratory allergy (or asthma) as a covariate.
RESULTS
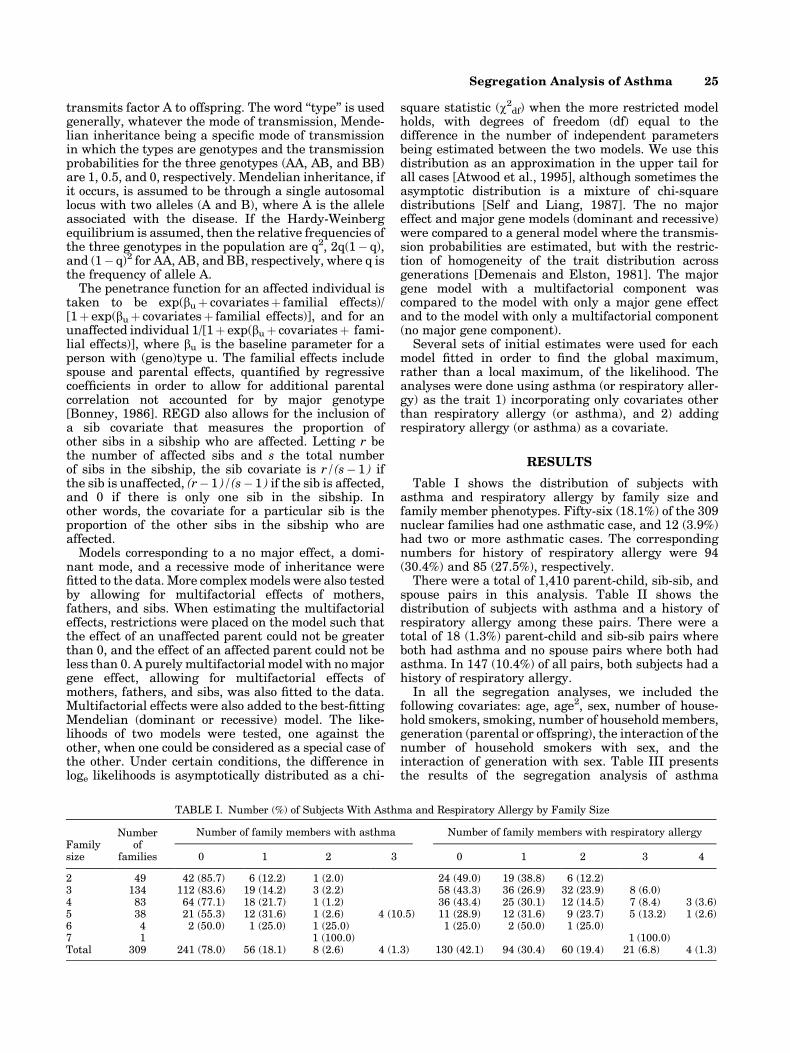
Table I shows the distribution of subjects withasthma and respiratory allergy by family size andfamily member phenotypes. Fifty-six (18.1%) of the 309nuclear families had one asthmatic case, and 12 (3.9%)had two or more asthmatic cases. The correspondingnumbers for history of respiratory allergy were 94(30.4%) and 85 (27.5%), respectively.
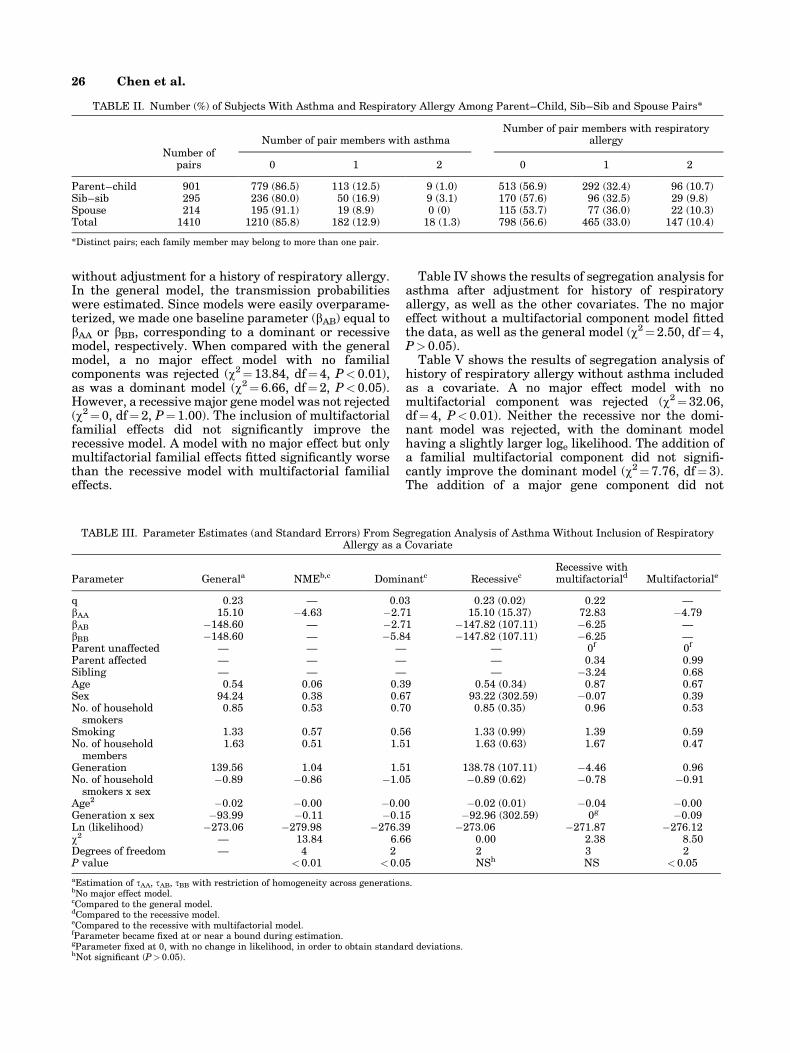
There were a total of 1,410 parent-child, sib-sib, andspouse pairs in this analysis. Table II shows thedistribution of subjects with asthma and a history ofrespiratory allergy among these pairs. There were atotal of 18 (1.3%) parent-child and sib-sib pairs whereboth had asthma and no spouse pairs where both hadasthma. In 147 (10.4%) of all pairs, both subjects had ahistory of respiratory allergy.
In all the segregation analyses, we included thefollowing covariates: age, age2, sex, number of house-hold smokers, smoking, number of household members,generation (parental or offspring), the interaction of thenumber of household smokers with sex, and theinteraction of generation with sex. Table III presentsthe results of the segregation analysis of asthma
TABLE I. Number (%) of Subjects With Asthma and Respiratory Allergy by Family Size
Familysize
Numberof
families
Number of family members with asthma Number of family members with respiratory allergy
0 1 2 3 0 1 2 3 4
2 49 42 (85.7) 6 (12.2) 1 (2.0) 24 (49.0) 19 (38.8) 6 (12.2)3 134 112 (83.6) 19 (14.2) 3 (2.2) 58 (43.3) 36 (26.9) 32 (23.9) 8 (6.0)4 83 64 (77.1) 18 (21.7) 1 (1.2) 36 (43.4) 25 (30.1) 12 (14.5) 7 (8.4) 3 (3.6)5 38 21 (55.3) 12 (31.6) 1 (2.6) 4 (10.5) 11 (28.9) 12 (31.6) 9 (23.7) 5 (13.2) 1 (2.6)6 4 2 (50.0) 1 (25.0) 1 (25.0) 1 (25.0) 2 (50.0) 1 (25.0)7 1 1 (100.0) 1 (100.0)Total 309 241 (78.0) 56 (18.1) 8 (2.6) 4 (1.3) 130 (42.1) 94 (30.4) 60 (19.4) 21 (6.8) 4 (1.3)
Segregation Analysis of Asthma 25
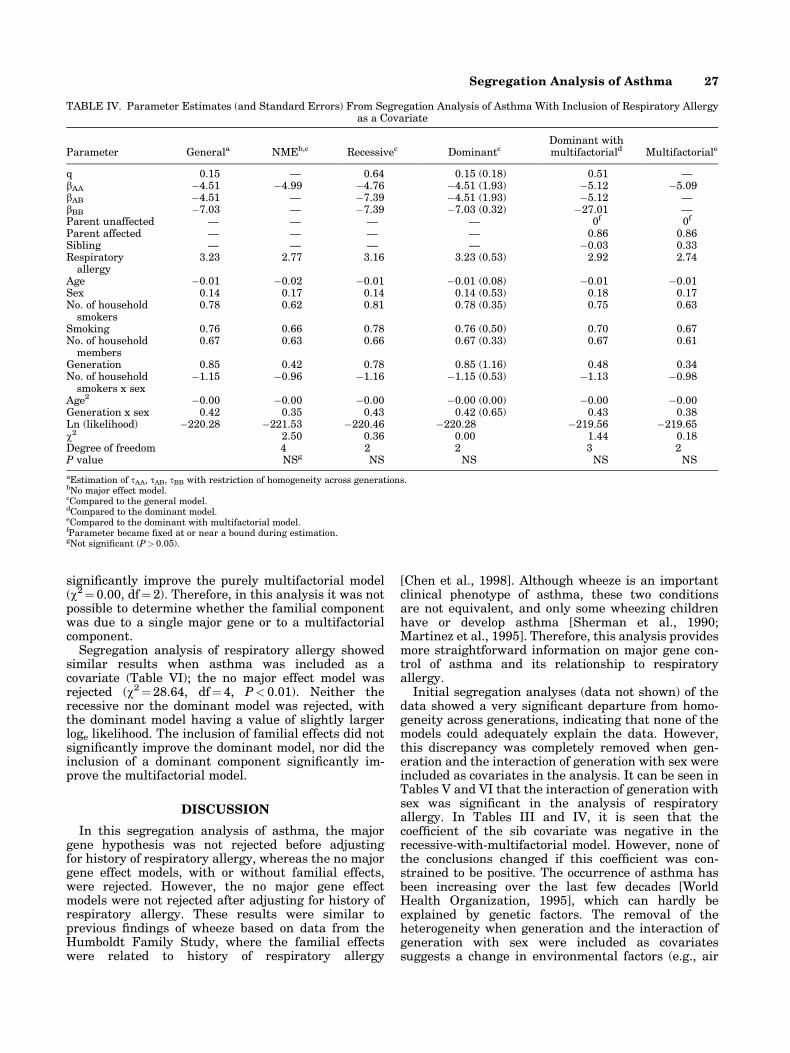
without adjustment for a history of respiratory allergy.In the general model, the transmission probabilitieswere estimated. Since models were easily overparame-terized, we made one baseline parameter (bAB) equal tobAA or bBB, corresponding to a dominant or recessivemodel, respectively. When compared with the generalmodel, a no major effect model with no familialcomponents was rejected (w2� 13.84, df�4, P< 0.01),as was a dominant model (w2�6.66, df�2, P< 0.05).However, a recessive major gene model was not rejected(w2�0, df� 2, P�1.00). The inclusion of multifactorialfamilial effects did not signi®cantly improve therecessive model. A model with no major effect but onlymultifactorial familial effects ®tted signi®cantly worsethan the recessive model with multifactorial familialeffects.
Table IV shows the results of segregation analysis forasthma after adjustment for history of respiratoryallergy, as well as the other covariates. The no majoreffect without a multifactorial component model ®ttedthe data, as well as the general model (w2�2.50, df� 4,P> 0.05).
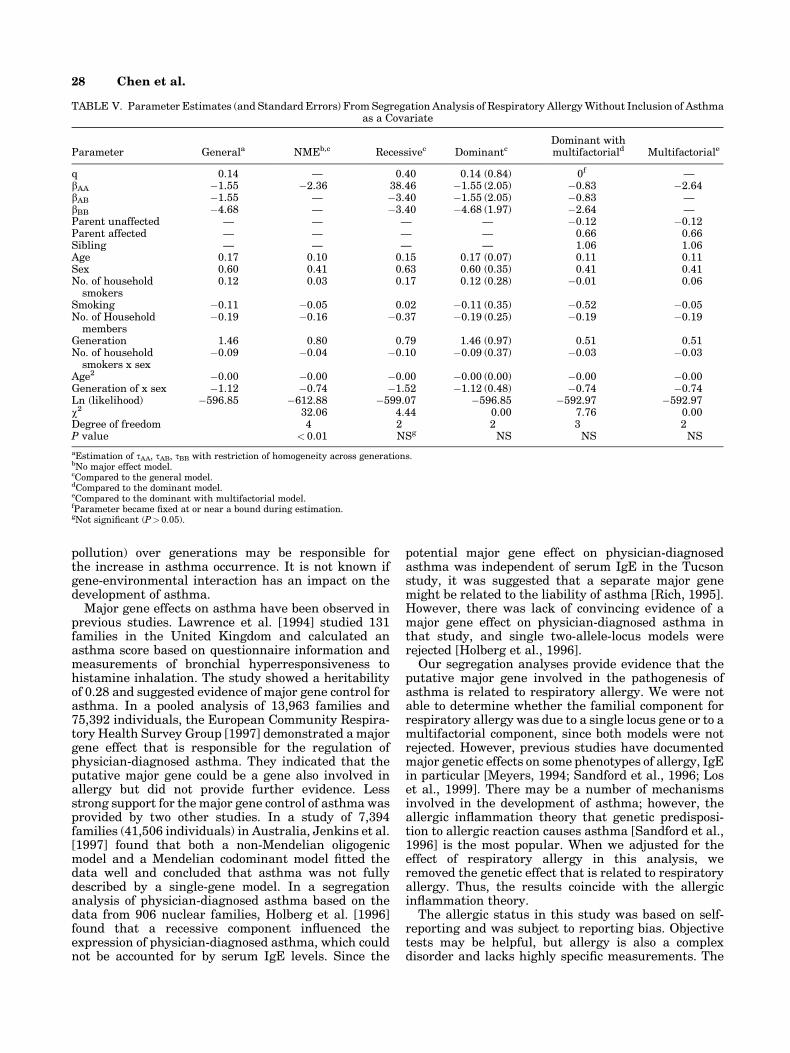
Table V shows the results of segregation analysis ofhistory of respiratory allergy without asthma includedas a covariate. A no major effect model with nomultifactorial component was rejected (w2�32.06,df� 4, P<0.01). Neither the recessive nor the domi-nant model was rejected, with the dominant modelhaving a slightly larger loge likelihood. The addition ofa familial multifactorial component did not signi®-cantly improve the dominant model (w2�7.76, df�3).The addition of a major gene component did not
TABLE II. Number (%) of Subjects With Asthma and Respiratory Allergy Among Parent±Child, Sib±Sib and Spouse Pairs*
Number ofpairs
Number of pair members with asthmaNumber of pair members with respiratory
allergy
0 1 2 0 1 2
Parent±child 901 779 (86.5) 113 (12.5) 9 (1.0) 513 (56.9) 292 (32.4) 96 (10.7)Sib±sib 295 236 (80.0) 50 (16.9) 9 (3.1) 170 (57.6) 96 (32.5) 29 (9.8)Spouse 214 195 (91.1) 19 (8.9) 0 (0) 115 (53.7) 77 (36.0) 22 (10.3)Total 1410 1210 (85.8) 182 (12.9) 18 (1.3) 798 (56.6) 465 (33.0) 147 (10.4)
*Distinct pairs; each family member may belong to more than one pair.
TABLE III. Parameter Estimates (and Standard Errors) From Segregation Analysis of Asthma Without Inclusion of RespiratoryAllergy as a Covariate
Parameter Generala NMEb,c Dominantc RecessivecRecessive withmultifactoriald Multifactoriale
q 0.23 Ð 0.03 0.23 (0.02) 0.22 ÐbAA 15.10 ÿ4.63 ÿ2.71 15.10 (15.37) 72.83 ÿ4.79bAB ÿ148.60 Ð ÿ2.71 ÿ147.82 (107.11) ÿ6.25 ÐbBB ÿ148.60 Ð ÿ5.84 ÿ147.82 (107.11) ÿ6.25 ÐParent unaffected Ð Ð Ð Ð 0f 0f
Parent affected Ð Ð Ð Ð 0.34 0.99Sibling Ð Ð Ð Ð ÿ3.24 0.68Age 0.54 0.06 0.39 0.54 (0.34) 0.87 0.67Sex 94.24 0.38 0.67 93.22 (302.59) ÿ0.07 0.39No. of household
smokers0.85 0.53 0.70 0.85 (0.35) 0.96 0.53
Smoking 1.33 0.57 0.56 1.33 (0.99) 1.39 0.59No. of household
members1.63 0.51 1.51 1.63 (0.63) 1.67 0.47
Generation 139.56 1.04 1.51 138.78 (107.11) ÿ4.46 0.96No. of household
smokers x sexÿ0.89 ÿ0.86 ÿ1.05 ÿ0.89 (0.62) ÿ0.78 ÿ0.91
Age2 ÿ0.02 ÿ0.00 ÿ0.00 ÿ0.02 (0.01) ÿ0.04 ÿ0.00Generation x sex ÿ93.99 ÿ0.11 ÿ0.15 ÿ92.96 (302.59) 0g ÿ0.09Ln (likelihood) ÿ273.06 ÿ279.98 ÿ276.39 ÿ273.06 ÿ271.87 ÿ276.12w2 Ð 13.84 6.66 0.00 2.38 8.50Degrees of freedom Ð 4 2 2 3 2P value <0.01 < 0.05 NSh NS <0.05
aEstimation of tAA, tAB, tBB with restriction of homogeneity across generations.bNo major effect model.cCompared to the general model.dCompared to the recessive model.eCompared to the recessive with multifactorial model.fParameter became ®xed at or near a bound during estimation.gParameter ®xed at 0, with no change in likelihood, in order to obtain standard deviations.hNot signi®cant (P> 0.05).
26 Chen et al.
signi®cantly improve the purely multifactorial model(w2� 0.00, df�2). Therefore, in this analysis it was notpossible to determine whether the familial componentwas due to a single major gene or to a multifactorialcomponent.
Segregation analysis of respiratory allergy showedsimilar results when asthma was included as acovariate (Table VI); the no major effect model wasrejected (w2�28.64, df�4, P< 0.01). Neither therecessive nor the dominant model was rejected, withthe dominant model having a value of slightly largerloge likelihood. The inclusion of familial effects did notsigni®cantly improve the dominant model, nor did theinclusion of a dominant component signi®cantly im-prove the multifactorial model.
DISCUSSION
In this segregation analysis of asthma, the majorgene hypothesis was not rejected before adjustingfor history of respiratory allergy, whereas the no majorgene effect models, with or without familial effects,were rejected. However, the no major gene effectmodels were not rejected after adjusting for history ofrespiratory allergy. These results were similar toprevious ®ndings of wheeze based on data from theHumboldt Family Study, where the familial effectswere related to history of respiratory allergy
[Chen et al., 1998]. Although wheeze is an importantclinical phenotype of asthma, these two conditionsare not equivalent, and only some wheezing childrenhave or develop asthma [Sherman et al., 1990;Martinez et al., 1995]. Therefore, this analysis providesmore straightforward information on major gene con-trol of asthma and its relationship to respiratoryallergy.
Initial segregation analyses (data not shown) of thedata showed a very signi®cant departure from homo-geneity across generations, indicating that none of themodels could adequately explain the data. However,this discrepancy was completely removed when gen-eration and the interaction of generation with sex wereincluded as covariates in the analysis. It can be seen inTables V and VI that the interaction of generation withsex was signi®cant in the analysis of respiratoryallergy. In Tables III and IV, it is seen that thecoef®cient of the sib covariate was negative in therecessive-with-multifactorial model. However, none ofthe conclusions changed if this coef®cient was con-strained to be positive. The occurrence of asthma hasbeen increasing over the last few decades [WorldHealth Organization, 1995], which can hardly beexplained by genetic factors. The removal of theheterogeneity when generation and the interaction ofgeneration with sex were included as covariatessuggests a change in environmental factors (e.g., air
TABLE IV. Parameter Estimates (and Standard Errors) From Segregation Analysis of Asthma With Inclusion of Respiratory Allergyas a Covariate
Parameter Generala NMEb,c Recessivec DominantcDominant withmultifactoriald Multifactoriale
q 0.15 Ð 0.64 0.15 (0.18) 0.51 ÐbAA ÿ4.51 ÿ4.99 ÿ4.76 ÿ4.51 (1.93) ÿ5.12 ÿ5.09bAB ÿ4.51 Ð ÿ7.39 ÿ4.51 (1.93) ÿ5.12 ÐbBB ÿ7.03 Ð ÿ7.39 ÿ7.03 (0.32) ÿ27.01 ÐParent unaffected Ð Ð Ð Ð 0f 0f
Parent affected Ð Ð Ð Ð 0.86 0.86Sibling Ð Ð Ð Ð ÿ0.03 0.33Respiratory
allergy3.23 2.77 3.16 3.23 (0.53) 2.92 2.74
Age ÿ0.01 ÿ0.02 ÿ0.01 ÿ0.01 (0.08) ÿ0.01 ÿ0.01Sex 0.14 0.17 0.14 0.14 (0.53) 0.18 0.17No. of household
smokers0.78 0.62 0.81 0.78 (0.35) 0.75 0.63
Smoking 0.76 0.66 0.78 0.76 (0.50) 0.70 0.67No. of household
members0.67 0.63 0.66 0.67 (0.33) 0.67 0.61
Generation 0.85 0.42 0.78 0.85 (1.16) 0.48 0.34No. of household
smokers x sexÿ1.15 ÿ0.96 ÿ1.16 ÿ1.15 (0.53) ÿ1.13 ÿ0.98
Age2 ÿ0.00 ÿ0.00 ÿ0.00 ÿ0.00 (0.00) ÿ0.00 ÿ0.00Generation x sex 0.42 0.35 0.43 0.42 (0.65) 0.43 0.38Ln (likelihood) ÿ220.28 ÿ221.53 ÿ220.46 ÿ220.28 ÿ219.56 ÿ219.65w2 2.50 0.36 0.00 1.44 0.18Degree of freedom 4 2 2 3 2P value NSg NS NS NS NS
aEstimation of tAA, tAB, tBB with restriction of homogeneity across generations.bNo major effect model.cCompared to the general model.dCompared to the dominant model.eCompared to the dominant with multifactorial model.fParameter became ®xed at or near a bound during estimation.gNot signi®cant (P> 0.05).
Segregation Analysis of Asthma 27
pollution) over generations may be responsible forthe increase in asthma occurrence. It is not known ifgene-environmental interaction has an impact on thedevelopment of asthma.
Major gene effects on asthma have been observed inprevious studies. Lawrence et al. [1994] studied 131families in the United Kingdom and calculated anasthma score based on questionnaire information andmeasurements of bronchial hyperresponsiveness tohistamine inhalation. The study showed a heritabilityof 0.28 and suggested evidence of major gene control forasthma. In a pooled analysis of 13,963 families and75,392 individuals, the European Community Respira-tory Health Survey Group [1997] demonstrated a majorgene effect that is responsible for the regulation ofphysician-diagnosed asthma. They indicated that theputative major gene could be a gene also involved inallergy but did not provide further evidence. Lessstrong support for the major gene control of asthma wasprovided by two other studies. In a study of 7,394families (41,506 individuals) in Australia, Jenkins et al.[1997] found that both a non-Mendelian oligogenicmodel and a Mendelian codominant model ®tted thedata well and concluded that asthma was not fullydescribed by a single-gene model. In a segregationanalysis of physician-diagnosed asthma based on thedata from 906 nuclear families, Holberg et al. [1996]found that a recessive component in¯uenced theexpression of physician-diagnosed asthma, which couldnot be accounted for by serum IgE levels. Since the
potential major gene effect on physician-diagnosedasthma was independent of serum IgE in the Tucsonstudy, it was suggested that a separate major genemight be related to the liability of asthma [Rich, 1995].However, there was lack of convincing evidence of amajor gene effect on physician-diagnosed asthma inthat study, and single two-allele-locus models wererejected [Holberg et al., 1996].
Our segregation analyses provide evidence that theputative major gene involved in the pathogenesis ofasthma is related to respiratory allergy. We were notable to determine whether the familial component forrespiratory allergy was due to a single locus gene or to amultifactorial component, since both models were notrejected. However, previous studies have documentedmajor genetic effects on some phenotypes of allergy, IgEin particular [Meyers, 1994; Sandford et al., 1996; Loset al., 1999]. There may be a number of mechanismsinvolved in the development of asthma; however, theallergic in¯ammation theory that genetic predisposi-tion to allergic reaction causes asthma [Sandford et al.,1996] is the most popular. When we adjusted for theeffect of respiratory allergy in this analysis, weremoved the genetic effect that is related to respiratoryallergy. Thus, the results coincide with the allergicin¯ammation theory.
The allergic status in this study was based on self-reporting and was subject to reporting bias. Objectivetests may be helpful, but allergy is also a complexdisorder and lacks highly speci®c measurements. The
TABLE V. Parameter Estimates (and Standard Errors) From Segregation Analysis of Respiratory Allergy Without Inclusion of Asthmaas a Covariate
Parameter Generala NMEb,c Recessivec DominantcDominant withmultifactoriald Multifactoriale
q 0.14 Ð 0.40 0.14 (0.84) 0f ÐbAA ÿ1.55 ÿ2.36 38.46 ÿ1.55 (2.05) ÿ0.83 ÿ2.64bAB ÿ1.55 Ð ÿ3.40 ÿ1.55 (2.05) ÿ0.83 ÐbBB ÿ4.68 Ð ÿ3.40 ÿ4.68 (1.97) ÿ2.64 ÐParent unaffected Ð Ð Ð Ð ÿ0.12 ÿ0.12Parent affected Ð Ð Ð Ð 0.66 0.66Sibling Ð Ð Ð Ð 1.06 1.06Age 0.17 0.10 0.15 0.17 (0.07) 0.11 0.11Sex 0.60 0.41 0.63 0.60 (0.35) 0.41 0.41No. of household
smokers0.12 0.03 0.17 0.12 (0.28) ÿ0.01 0.06
Smoking ÿ0.11 ÿ0.05 0.02 ÿ0.11 (0.35) ÿ0.52 ÿ0.05No. of Household
membersÿ0.19 ÿ0.16 ÿ0.37 ÿ0.19 (0.25) ÿ0.19 ÿ0.19
Generation 1.46 0.80 0.79 1.46 (0.97) 0.51 0.51No. of household
smokers x sexÿ0.09 ÿ0.04 ÿ0.10 ÿ0.09 (0.37) ÿ0.03 ÿ0.03
Age2 ÿ0.00 ÿ0.00 ÿ0.00 ÿ0.00 (0.00) ÿ0.00 ÿ0.00Generation of x sex ÿ1.12 ÿ0.74 ÿ1.52 ÿ1.12 (0.48) ÿ0.74 ÿ0.74Ln (likelihood) ÿ596.85 ÿ612.88 ÿ599.07 ÿ596.85 ÿ592.97 ÿ592.97w2 32.06 4.44 0.00 7.76 0.00Degree of freedom 4 2 2 3 2P value < 0.01 NSg NS NS NS
aEstimation of tAA, tAB, tBB with restriction of homogeneity across generations.bNo major effect model.cCompared to the general model.dCompared to the dominant model.eCompared to the dominant with multifactorial model.fParameter became ®xed at or near a bound during estimation.gNot signi®cant (P>0.05).
28 Chen et al.

expression of allergy is dependent on exposure. IgElevels may not re¯ect the history of allergy. Not allallergic individuals have elevated IgE levels. Total IgElevels vary in allergic subjects after exposure to re-levant allergens [Martinez et al., 1994]. These differ-ences may explain, at least in part, the discrepancybetween our results adjusted for respiratory allergyand those adjusted for IgE reported by Holberg et al.[1996].
There are some concerns and limitations for thisstudy. First, the information on both asthma andallergy was either self- or parent-reported, which couldbe subject to reporting biases. However, the de®nitionof asthma in this study was similar to the de®nitionused in the original American Thoracic Society Stan-dardization Project questionnaire, which has been usedin various epidemiological studies and has beenvalidated. In addition, there is evidence that variousde®nitions of asthma have little in¯uence on estimatesof incidence (Larsson, 1995). Even if children ofasthmatics were more likely to be labeled as asthmaticor parents with asthma were more likely to report theirchildren being asthmatic to a certain degree, such areporting bias would not explain what we haveobserved, namely that any major gene effect is morelikely related to respiratory allergy. In addition,the prevalence of asthma and allergy are comparableto those from other Canadian studies [Chen et al.,1999a; Habbick et al., 1999]. Second, self-reportedasthma did not distinguish between extrinsic and in-
trinsic asthma, which may share different mechanisms.If we could have shown differences in major geneticeffects on extrinsic and intrinsic asthma in relation torespiratory allergy, the results might be more interest-ing. Third, the sample size is relatively small, whichlimits the ability to test various genetic models.
In conclusion, a major gene that is related torespiratory allergy may be involved in the pathogenesisof asthma. The in¯ammatory response of airways toaeroallergens is believed to be the most frequentunderlying mechanism of asthma, and our ®ndingssupport this theory.
ACKNOWLEDGMENTS
We thank D. Still (mayor), W. Herman (townadministrator), W. German, N. Trach, J. Hergott (co-chairs of the local organizing committee), M. Gillis-Cipywnyk, and all of the volunteers who providedcanvassing and other ®eld work in the study. Yue Chenis a Canadian Institutes of Health Research Investi-gator Award recipient.
REFERENCES
Atwood LD, Wilson AF, Bailey-Wilson JE, Carruth JN, Elston RC. 1995. Onthe distribution of the likelihood ratio test statistic for a mixture of twonormal distributions. Com Stats 25:733±740.
Blumenthal MN, Namboodiri K, Mendall N, Bleich P, Elston RC, Yunis E.1981. Genetic transmission of IgE levels. Am J Med Genet 10:219±228.
TABLE VI. Parameter Estimates (and Standard Errors) From Segregation Analysis of Respiratory Allergy With Inclusion of Asthmaas a Covariate
Parameter Generala NMEb,c Recessivec DominantcDominant withmultifactoriald Multifactoriale
q 0.05 Ð 0.38 0.05 (0.12) 0.01 ÐbAA 45.30 ÿ2.30 1.74 23.02 (ÿ0.28) 32.41 ÿ2.63bAB 45.30 Ð ÿ3.35 23.02 (ÿ0.28) 32.41 ÐbBB ÿ2.75 Ð ÿ3.35 ÿ2.75 (1.32) ÿ2.73 ÐParent unaffected Ð Ð Ð Ð ÿ0.13 ÿ0.23Parent affected Ð Ð Ð Ð 0.59 0.61Sibling Ð Ð Ð Ð 0.91 1.01Asthma 3.27 2.79 3.73 3.27 (0.33) 2.92 2.83Age 0.12 0.10 0.15 0.12 (0.06) 0.12 0.12Sex 0.36 0.37 0.52 0.36 (0.25) 0.37 0.36No. of household
smokersÿ0.17 ÿ0.15 ÿ0.33 ÿ0.17 (0.21) ÿ0.15 ÿ0.16
Smoking ÿ0.15 ÿ0.17 ÿ0.22 ÿ0.15 (0.32) ÿ0.16 ÿ0.16No. of household
membersÿ0.34 ÿ0.30 ÿ0.39 ÿ0.34 (0.21) ÿ0.36 ÿ0.32
Generation 0.46 0.64 0.52 0.46 (0.76) 0.46 0.54No. of household
smokers x sex0.34 0.23 0.50 0.33 (0.18) 0.26 0.27
Age2 ÿ0.00 ÿ0.00 ÿ0.00 ÿ0.00 (0.00) ÿ0.00 ÿ0.00Generation x sex ÿ1.17 ÿ0.83 ÿ1.50 ÿ1.17 (0.43) ÿ0.91 ÿ0.85Ln (likelihood) ÿ539.30 ÿ553.62 ÿ541.56 ÿ539.30 ÿ536.03 ÿ536.17w2 28.64 4.52 0.00 6.54 0.28Degree of freedom 4 2 2 3 2P value <0.01 NSf NS NS NS
aEstimation of tAA, tAB, tBB with restriction of homogeneity across generations.bNo major effect model.cCompared to the general model.dCompared to the dominant model.eCompared to the dominant with multifactorial model.fNot signi®cant (P> 0.05).
Segregation Analysis of Asthma 29
Bonney GE. 1986. Regressive models for familial disease and other binarytraits. Biometrics 42:611±625.
Chen Y, Rennie DC, Reeder BA. 1995. Age-related association betweenbody mass index and blood pressure: the Humboldt Study. Int J Obes19:825±831.
Chen Y, Rennie DC, Lockinger LA, Dosman JA. 1998. Evidence for majorgenetic control of wheeze in relation to history of respiratory allergy.Am J Med Genet 75:485±491.
Chen Y, Dales R, Krewski D, Breithaupt K. 1999a. Increased effectsof smoking and obesity on asthma among female Canadians: theNational Population Health Survey 1994±95. Am J Epidemiol 150:255±262.
Chen Y, Dosman JA, Rennie DC, Lockinger LA. 1999b. Major geneticmechanism of airway-parenchymal dysanapsis of the lung: theHumboldt Family Study. Genet Epidemiol 16:95±110.
Demenais FM, Elston RC. 1981. A general transmission probability modelfor pedigree data. Hum Hered 31:93±99.
European Community Respiratory Health Survey Group. 1997. Genes forasthma? An analysis of the European Community Respiratory HealthSurvey. Am J Respir Crit Care Med 156:1773±1780.
Gerrard JW, Rao DC, Morton NE. 1978. A genetic study of immunoglobulinE. Am J Hum Genet 30:46±58.
Habbick BF, Pizzichini MM, Taylor B, Rennie D, Senthilselvan A, SearsMR. 1999. Prevalence of asthma, rhinitis and eczema among children in2 Canadian cities: the International Study of Asthma and Allergies inChildhood. CMAJ 160:1824±1828.
Holberg CJ, Elston RC, Halonen M, Wright AL, Taussig LM, Morgan WJ,Martinez FD. 1996. Segregation analysis of physician-diagnosedasthma in Hispanic and non-Hispanic white families. Am J RespirCrit Med 154:144±150.
Jenkins MA, Hopper JL, Giles GG. 1997. Regressive logistic modeling offamilial aggregation for asthma in 7,394 population-based nuclearfamilies. Genet Epidemiol 14:317±332.
Karunaratne PM, Elston RC, Loman N, Olsson H, Ranstam J. 1998.Analysis of Swedish male breast cancer family data: a simple wayto incorporate a common sibling effect. Genet Epidemiol 15:201±212.
Larsson L. 1995. Incidence of asthma in Swedish teenagers: relation to sexand smoking habits. Thorax 50:260±264.
Lawrence S, Beasly R, Doull I, Begishvili B, Lampe F, Holgate ST, MortonNE. 1994. Genetic analysis of atopy and asthma as quantitative traitsand ordered polychotomies. Ann Hum Genet 58:359±368.
Los H, Koppelman GH, Postma DS. 1999. The importance of geneticin¯uences in asthma. Eur Respir J 14:1210±1227.
Marsh DG, Myers DA, Bias WB. 1981. The epidemiology and genetics ofatopic allergy. N Engl J Med 305:1551±1559.
Martinez FD, Holberg CJ, Halonen M, Morgan WJ, Weight AL, TaussigLM. 1994. Evidence for Mendelian inheritance of serum IgE levels inHispanic and non-Hispanic white families. Am J Hum Genet 55:555±565.
Martinez FD, Wright AL, Taussig LM, Holberg CJ, Halonen M,Morgan WJ, the Group Health Medical Associates. 1995. Asthmaand wheezing in the ®rst six years of life. N Engl J Med 332:133±138.
Meyers DA. 1994. Approaches to genetic studies of asthma. Am J RespirCrit Care Med 150:S91±S93.
Rich SS. 1995. Results of genetic studies in man. Clin Exp Allergy25(Suppl.):95±96.
S.A.G.E. 1998. Statistical Analysis for Genetic Epidemiology, release 3.1.Computer program package available from the Department of Epide-miology and Biostatistics. Case Western Reserve University School ofMedicine, Cleveland, Ohio.
Sandford A, Weir T, Pare P. 1996. The genetics of asthma. Am J Respir CritCare Med 153:1749±1765.
SAS Institute, Inc. 1996. SAS/STAT1 user's guide, release 6.12. Cary, NC:SAS Institute, Inc.
Self SG, Liang KY. 1987. Asymptotic properties of maximum likelihoodestimators and likelihood ratio test under non-standard conditions. JAm Stat Assoc 82:605±610.
Sherman CB, Tosteson TD, Tager IB, Speizer FE, Weiss ST. 1990. Earlychildhood, predictors of asthma. Am J Epidemiol 132:83±95.
World Health Organization. 1995. Global initiative for asthma: globalstrategy for asthma management and prevention NHLBI/WHO work-shop report. U.S. National Institutes of Health.
30 Chen et al.