Embed Size (px)
Citation preview
Segregation and Neighborhood Segregation and Neighborhood InteractionInteraction
Work in progressWork in progress
Jason Barr, Rutgers NewarkJason Barr, Rutgers Newark
Troy Tassier, FordhamTroy Tassier, Fordham
October 31, 2006October 31, 2006

MotivationMotivation
Schelling tipping model quite “pessimistic.”Schelling tipping model quite “pessimistic.” But says nothing about neighborhood But says nothing about neighborhood
interaction.interaction. Only says: given preferences, you move if # Only says: given preferences, you move if #
different than you hits a certain threshold.different than you hits a certain threshold. What role does neighborhood interaction What role does neighborhood interaction
play in “counteracting” the tipping play in “counteracting” the tipping phenomena?phenomena?

Schelling Model w. UtilitySchelling Model w. Utility NxNNxN lattice (we fix at lattice (we fix at 12x1212x12).). 130 agents; 10 % free slots; randomly placed at 130 agents; 10 % free slots; randomly placed at t=0t=0.. Moore neighborhood – 8 surrounding neighbors (except on edges).Moore neighborhood – 8 surrounding neighbors (except on edges). Calculate % of neighbors who are alike.Calculate % of neighbors who are alike. Calculate utility.Calculate utility. Choose randomly open location and calculate new utility.Choose randomly open location and calculate new utility. If If new utility>old utilitynew utility>old utility move, otherwise stay. move, otherwise stay. Asynchronous movement: begin with agent 1 and go through each Asynchronous movement: begin with agent 1 and go through each
agent.agent. Run the system 10,000 periods (each agent has option to move about Run the system 10,000 periods (each agent has option to move about
79 times).79 times). Segregation Measure: Avg. of % of agents with like neighbors.Segregation Measure: Avg. of % of agents with like neighbors.
1,0,
11
1 1
ji
N
i
n
jji
i
xx
xxnN
Segi

Utility FunctionsUtility Functions
5.,2
5.,2
xx
xxU(x)
is our measure of preference for integration
% Same
α
β
γ=1
γ=0
γ=.5
0 1
Utility Functions
1,0
.5

Some ExamplesSome Examples
0 2 4 6 8 10 12
0
2
4
6
8
10
12
0 2 4 6 8 10 12
0
2
4
6
8
10
12
t=0
Seg.=.5
t=10,000
Seg.=.88
0

0 2 4 6 8 10 12
0
2
4
6
8
10
12
5.0
0 2 4 6 8 10 12
0
2
4
6
8
10
12
t=0
Seg.=.5t=10,000
Seg.=. 7

Experiment 1: Segregation and UtilityExperiment 1: Segregation and Utility
88% 85%80%
75%68%
62% 63%56%
49%
74%
53%
0%
20%
40%
60%
80%
100%
0 0.1 0.2 0.3 0.4 0.5 0.6 0.7 0.8 0.9 1
Steepness of Utility Function
Segregation vs. Utility Function Type
Avg. % Sam
e in each nd.
Full Integration
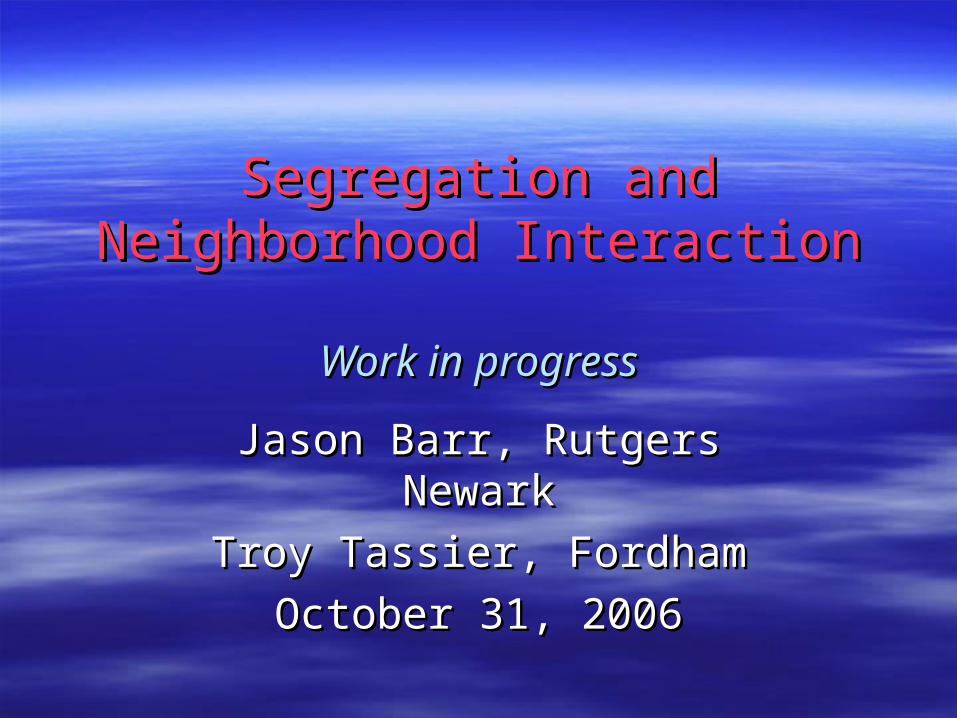
Prisoner’s DilemmaPrisoner’s Dilemma
RivalRival
Coop.Coop. DefectDefect
AgentAgent
Coop.Coop. AA (agree) (agree) BB (bested) (bested)
DefectDefect CC (cheat) (cheat) DD (defect) (defect)
where C>A>D>B
Fix A and B: C=A+ε, D=B+μ

The Prisoner’s Dilemma on the LatticeThe Prisoner’s Dilemma on the Lattice
Agents play the PD against all their Agents play the PD against all their neighbors (in the Moore neighborhood).neighbors (in the Moore neighborhood).
Payoff to agent is average payoff from the Payoff to agent is average payoff from the play with neighbors.play with neighbors.
Each agent has a probability of playing Each agent has a probability of playing Coop. (Coop. (ppii), and Defect (), and Defect (1-p1-pii). ).
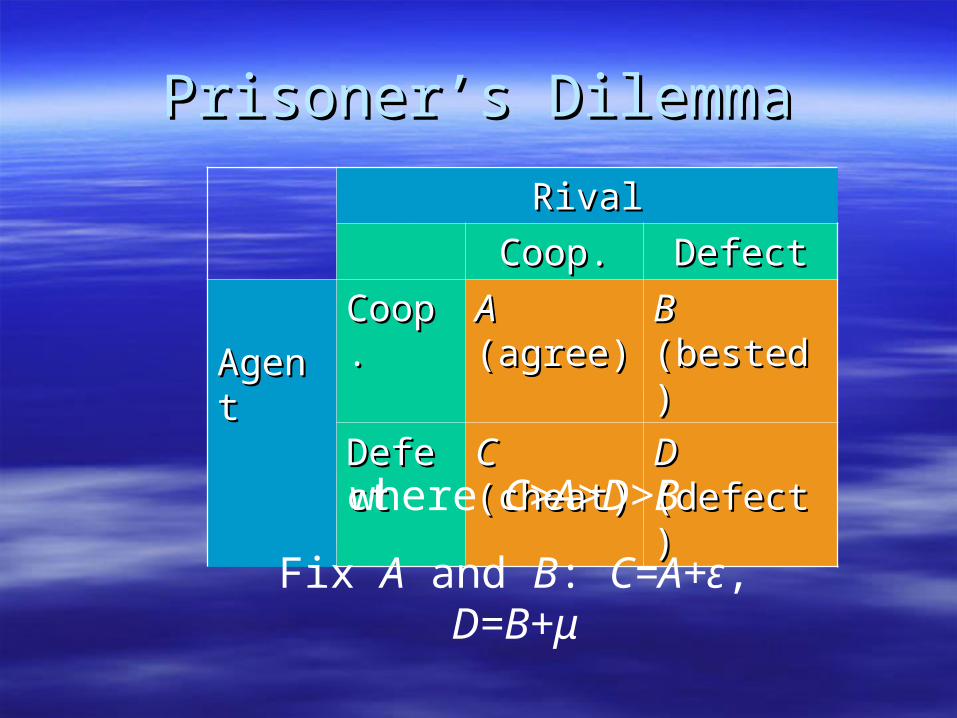
PD cont.PD cont.
Notice every agent is also a neighbor to one or Notice every agent is also a neighbor to one or more other agents.more other agents.
Strategy Approach I:Strategy Approach I:– When agent plays with neighbors, randomly choose When agent plays with neighbors, randomly choose
action (according to action (according to ppii) for each neighbor interaction.) for each neighbor interaction.– Neighbors also choose action according to Neighbors also choose action according to ppjj’s.’s.
Strategy Approach II:Strategy Approach II:– Each round, every agent chooses an action (according Each round, every agent chooses an action (according
to their probability).to their probability).– Plays same action for entire round (both as agent and Plays same action for entire round (both as agent and
rival).rival).

Probability Updating RuleProbability Updating Rule
p t
a a x
a a
a a Coop Def x
i
t j i jj
n
t j ij
n
i j j
1
1
1
1
,
,,
/ , ,where if Coop., 0 otherwise.
Agent’s probability is based on how well the neighbors do.
Notice that only the neighbors’ performance matters.

Performance and ProbabilityPerformance and Probability
j j j j j j
i
x y Ax y Bx y C x y D x y
pA y B y
Ay B y y y
,
;
1 1 1 1
1
1 1 1
where =1
nx
ij
j=1
ni
Denote:
xj=1 if rival Cooperates, 0 otherwise.
y=1 if agent Cooperates, 0 otherwise.

ExampleExample
p
E p tA B
A B
i t
i
, .
|..
5
1 51
2 5
0.4970
0.4975
0.4980
0.4985
0.4990
0.4995
0.5000
0 10 20 30 40 50
ε+μ=0.1
ε+μ=0.01
ε+μ=0.001
A+B

EquilibriaEquilibria
pA y B y
Ay B y y y
p yA
A
p yB
B
A
A
B
B
A B
i
i
i
1
1 1 1
11
01
1 1
1 1 0
|
|
Assuming A/B ≠ ε/μ then all play cooperate or all play defect are the only Nash Equilibria.

Experiment 2Experiment 2 PD on the Lattice: No Movement PD on the Lattice: No Movement
Coop.Coop. Def.Def.
Coop.Coop. A=2A=2 B=1.99B=1.99
Def.Def. C=2+C=2+εε D=1.991D=1.991
--Run the system for 100,000 iterations or hit absorbing state, which ever comes first.
--Take averages of 250 runs.

Experiment 2 ResultsExperiment 2 Results
0.00
0.25
0.50
0.75
1.00
2.0000 2.0025 2.0050 2.0075 2.0100 2.0125 2.0150 2.0175 2.0200 2.0225 2.0250 2.0275 2.0300 2.0325 2.0350
Random Action
Fixed Action
% D
efection
% Defection versus Cheating Payoff

Experiment 3:Experiment 3:“Conscious Movement”“Conscious Movement”
Play game with neighbors.Play game with neighbors. Receive average payoff.Receive average payoff. Pick random open location.Pick random open location. ““Play” game with neighbors there.Play” game with neighbors there. If agent's payoff is higher, move to new If agent's payoff is higher, move to new
neighborhood.neighborhood. Update probabilities based on chosen Update probabilities based on chosen
location (i.e., new or old).location (i.e., new or old).

Experiment 3:Experiment 3:“Conscious Movement”“Conscious Movement”
0.00
0.25
0.50
0.75
1.00
2 4 6 8 10 12 14
Fixed Action
Random Action
Cheating Payoff
% Defection vs. Cheating Payoff

Movement Increases Probability of Movement Increases Probability of CooperationCooperation
Agent’s probability adjustment is determined Agent’s probability adjustment is determined by neighbors’ actions.by neighbors’ actions.
If new location gives higher payoff it means If new location gives higher payoff it means that there is more cooperation by the new that there is more cooperation by the new neighbors.neighbors.
This, therefore, will increase agent’s This, therefore, will increase agent’s probability of cooperating in the future probability of cooperating in the future rounds.rounds.

Movement vs. No MovementMovement vs. No Movement
MovementMovement No MovementNo Movement
Fixed ActionFixed Action 2.5252.525 2.0252.025
Random ActionRandom Action 5.05.0 2.012.01
C payoffs that gives 50% prob. of all cooperate

Combined Schelling Plus GameCombined Schelling Plus Game
What does the interaction of the PD and Schelling What does the interaction of the PD and Schelling games do to cooperation and segregation?games do to cooperation and segregation?
Two experiments:Two experiments:– Move if , stay otherwiseMove if , stay otherwise– Find randomly chosen open spot, compare utilities and Find randomly chosen open spot, compare utilities and
move if new utility > old utilitymove if new utility > old utility
in
jji
i
i
i
aan
likeUUtility
1
,1
,%
where
0 iU

Utility Functions: Move if Utility<0Utility Functions: Move if Utility<0
“Low” Cheat payoff“Low” Cheat payoff
-0.015
-0.010
-0.005
0.000
0.005
0.010
0.015
0% 13% 25% 38% 50% 63% 75% 88% 100%
Combined Utility vs. % like for different PD outcomes , C=2.0025
D vs. all C
C vs. all D D vs. all D
D vs. 4 D C vs. 4 D
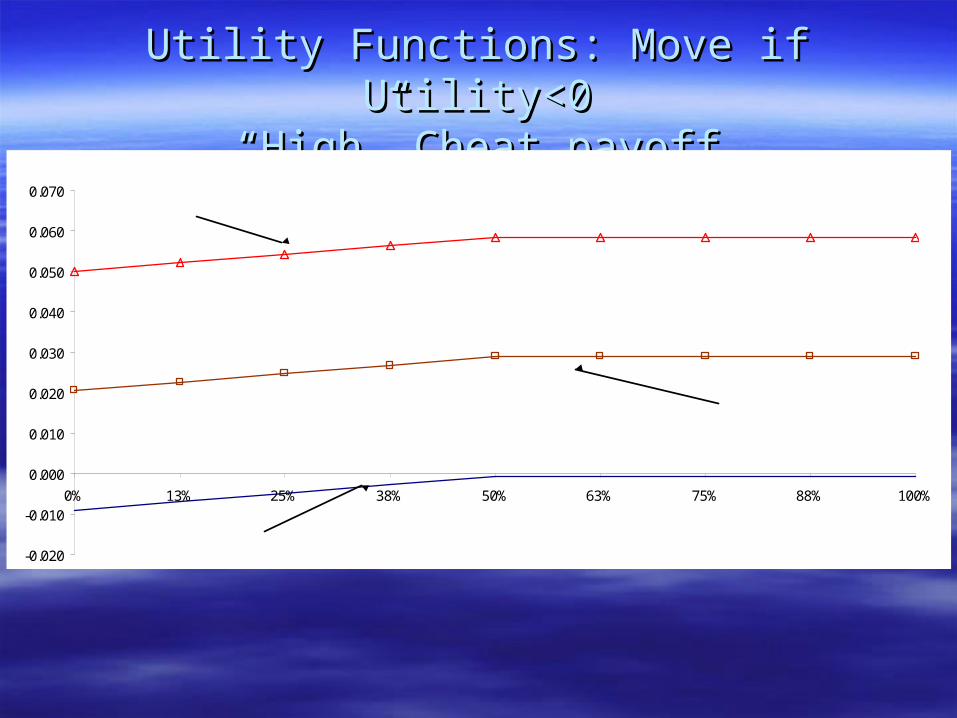
Utility Functions: Move if Utility<0Utility Functions: Move if Utility<0“High” Cheat payoff“High” Cheat payoff
-0.020
-0.010
0.000
0.010
0.020
0.030
0.040
0.050
0.060
0.070
0% 13% 25% 38% 50% 63% 75% 88% 100%
Combined Utility vs. % like for different PD outcomes, C=2.05
D vs. all D
D vs. 4 D
D vs. all C

Move if Utility<0Move if Utility<0 Interaction between nd. composition and game Interaction between nd. composition and game
outcome.outcome. If neighbors all defect, you move, regardless of types.If neighbors all defect, you move, regardless of types. If neighbors all cooperate, agent stays regardless of If neighbors all cooperate, agent stays regardless of
types.types. Movement depends on intermediate game results & Movement depends on intermediate game results &
% like you.% like you. Increasing cheating payoff:Increasing cheating payoff:
– increases likelihood that an agent will stay, since agent increases likelihood that an agent will stay, since agent “earns” more against rivals who cooperate.“earns” more against rivals who cooperate.
– But as “city” moves toward everybody defect then But as “city” moves toward everybody defect then movement will increase.movement will increase.

Experiment Results: Move if Utility<0Experiment Results: Move if Utility<0Coop. vs. Cheat payoffCoop. vs. Cheat payoff
0%
25%
50%
75%
100%
2 2.01 2.02 2.03
Move if Utility<0, Random Action, Flat Utility
Segregation
% Defection
C

Cooperation in RPD vs. Combined GameCooperation in RPD vs. Combined Game
0%
25%
50%
75%
100%
2.00 2.01 2.02 2.03
Game Only
Combined
Degree of Cooperation in RPD (no movement or random movement) and Combined Game
C
Random Action

Compare Utilities and Move if New Compare Utilities and Move if New Payoff is LargerPayoff is Larger
0%
10%
20%
30%
40%
50%
60%
70%
80%
90%
100%
2 2.5 3 3.5 4 4.5 5C
Random Action, "Flat" Utility
Segregation
Defection

Remaining IssuesRemaining Issues
Random vs. Fixed actionRandom vs. Fixed action Initial Conditions and probabilities dynamics.Initial Conditions and probabilities dynamics. Conditions where increase coop. decreases Conditions where increase coop. decreases
segregation?segregation?