Embed Size (px)
Citation preview

SEGRO PLC
ANNUAL REPORT & ACCOUNTS 2017

SEGRO PLC | ANNUAL REPORT & ACCOUNTS 2017
FOR MORE INFORMATION WITHIN THIS REPORT
FOR MORE INFORMATION ON SEGRO’S ACTIVITIES AND PERFORMANCE, PLEASE VISIT OUR WEBSITE:WWW.SEGRO.COM/INVESTORS
OPERATIONAL REVIEW We have focused on ensuring that our portfolio and our developments provide high quality warehouse space for our customers in Europe’s major cities and logistics hubs.
27-32
RESPONSIBLE SEGRO We are committed to operating our business and delivering our strategy in the most sustainable way possible.
42-53
OVERVIEW
IN THE RIGHT PLACE FOR THE FUTURE 01
AT A GLANCE 02
STRATEGIC REPORT
BUSINESS REVIEW 04
CHIEF EXECUTIVE’S STATEMENT 10
MARKET OVERVIEW 13
OUR BUSINESS MODEL 16
OUR STRATEGY 20
OPERATIONAL REVIEW 27
FINANCE REVIEW 33
KEY PERFORMANCE INDICATORS 40
RESPONSIBLE SEGRO 42
PRINCIPAL RISKS 54
GOVERNANCE
CHAIRMAN’S THOUGHTS 62
BOARD OF DIRECTORS 64
LEADERSHIP 70
EFFECTIVENESS 75
ACCOUNTABILITY 77
RELATIONS WITH SHAREHOLDERS 82
REMUNERATION 84
REMUNERATION POLICY 99
DIRECTORS’ REPORT 104
STATEMENT OF DIRECTORS’ RESPONSIBILITIES 106
FINANCIAL STATEMENTS
INDEPENDENT AUDITOR’S REPORT 108 TO THE MEMBERS OF SEGRO PLC
GROUP INCOME STATEMENT 114
GROUP STATEMENT OF 114 COMPREHENSIVE INCOME
BALANCE SHEETS 115
STATEMENTS OF CHANGES IN EQUITY 116
CASH FLOW STATEMENTS 118
NOTES TO THE FINANCIAL STATEMENTS 119
FIVE-YEAR FINANCIAL RESULTS 177
FURTHER INFORMATION
FINANCIAL INFORMATION 178
SHAREHOLDER INFORMATION 179
GLOSSARY OF TERMS 180
The Directors present the Annual Report for the year ended 31 December 2017 which includes the Strategic Report, Governance report and audited Financial Statements for the year. References to ‘SEGRO’, the ‘Group’, the ‘Company’, ‘we’ or ‘our’ are to SEGRO plc and/or its subsidiaries, or any of them as the context may require. Pages 04 to 60 inclusive, comprise the Strategic Report, pages 104 to 105 inclusive comprise the Directors’ Report and pages 84 to 98 inclusive comprise the Directors’ Remuneration Report, each of which have been drawn up and presented in accordance with English company law and the liabilities of the Directors in connection with these sections shall be subject to the limitations and restrictions provided by such law.
The Annual Report contains forward-looking statements. For further information see inside back cover.
CHIEF EXECUTIVE’S STATEMENT 2017 has been another year of delivery for SEGRO and we are reporting strong financial, operating and portfolio performance metrics.
10-12
MARKET OVERVIEW The economic environment and structural trends are supportive across our major markets.
13-15
CHAIRMAN’S THOUGHTS 2017 has seen the Company successfully continue to build on the strategy set out in 2011.
62-63

01
OVERVIEW STRATEGIC REPORT GOVERNANCE FINANCIAL STATEMENTS
OUR RESPONSIBILITY FOR THE FUTURE
FIND OUT MORE ON PAGESPAGES 08-09
A CULTURE LOOKING TO THE FUTURE
FIND OUT MORE ON PAGESPAGES 06-07
A PORTFOLIO POSITIONED FOR THE FUTURE
FIND OUT MORE ON PAGESPAGES 04-05
Our warehouses, located in Europe’s major cities and transport corridors, play an integral role in ensuring that our customers can service their
customers effectively and efficiently.
Changes in technology and consumer habits are significantly influencing demand for high quality
warehouse space, particularly in urban areas.
We have positioned our portfolio to benefit from this demand, but we are mindful that change is
constant and we are continually looking ahead to make sure our business is well placed for the future.
IN THE RIGHT PLACE FOR THE FUTURE

THE RIGHT ASSETS IN THE RIGHT PLACES
SEGRO PLC | ANNUAL REPORT & ACCOUNTS 2017
02
AT A GLANCE
OUR PORTFOLIO:
OUR TOP 20 CUSTOMERS:
OUR PRODUCTS:
1. Urban warehousing 55%
2. Big box warehousing 41%
3. Higher value uses of industrial land
4%
Total 100%
ASSET TYPE BY VALUE(SEGRO SHARE)
1
2
3
1. Transport and logistics 23%
2. Food and general manufacturing
18%
3. Retail (physical and online)
18%
4. Post and parcel delivery 11%
5. Technology, media and telecoms
8%
6. Wholesale and retail distribution
8%
7. Services and utilities 7%
8. Other 7%
Total 100%
CUSTOMER TYPE BY HEADLINE RENT (SEGRO SHARE)
1
2
34
5
6
7
8Our top 20 customers represent headline rent of £115 million in aggregate, 32% of the Group’s total headline rent at 31 December 2017
1. Deutsche Post DHL
2. Amazon
3. FedEx
4. Worldwide Flight Services
5. Royal Mail
6. British Airways
7. Sainsbury’s
8. Equinix
9. DSV
10. Booker Belmont
11. La Poste (DPD)
12. Mars
13. Leroy Merlin
14. ID Logistics
15. Virtus
16. Geodis
17. Wincanton
18. Yoox Net-a-Porter
19. Hermes
20. Marks & Spencer
BIG BOX WAREHOUSES (GENERALLY MORE THAN 10,000 SQ M)
Demand for large warehouses for inventory storage and regional, national and international distribution is growing, particularly amongst retailers. The cost of efficiently servicing both a store network and delivery of items direct to homes and offices, along with competitive pressures from discount and online-only retailers, has forced companies to restructure their supply chains.
URBAN WAREHOUSES (GENERALLY LESS THAN 10,000 SQ M)
Proximity to major urban areas is of critical importance to many occupiers: retailers and parcel delivery companies must distribute goods efficiently to both store networks and homes and offices (the ‘last mile delivery’); businesses need premises which are easily accessible for both their customers and their employees; data centre operators need to be located close to users of the data (particularly financial services) to ensure the fastest possible data transfer speeds; and air cargo companies must be located close to major airports.
ALTERNATIVE “HIGHER VALUE” USES OF INDUSTRIAL LANDThe location of our urban warehouse estates and land holdings, close to major population centres, makes them ideal for other, higher value uses, such as car showrooms, self storage facilities and trade counters which need to be easily accessible by employees and customers. These will usually form a small element of a larger urban warehouse estate.
03
OVERVIEW STRATEGIC REPORT GOVERNANCE FINANCIAL STATEMENTS
OUR PORTFOLIO:
OUR MAIN LOCATIONS:
MAP KEY: Big box warehouses
Urban and big box warehouses
PARIS
LYON
MADRID
MILAN
MUNICH
ROME
BOLOGNA
AMSTERDAM
HAMBURG
FRANKFURT
LEIPZIG
BERLIN
PRAGUEKATOWICE
WARSAW
DÜSSELDORF
MARSEILLE
LONDON & SOUTH EAST ENGLAND
BARCELONA
MIDLANDS
1. Greater London 40%
2. Thames Valley 18%
3. Midlands Big Box 10%
4. Southern Europe 14%
– France 8%
– Italy/Spain 6%
5. Northern Europe 12%
– Germany/Austria 10%
– Belgium/Netherlands 2%
6. Central Europe 6%
– Poland 5%
– Czech Republic/ Hungary
1%
Total 100%
GEOGRAPHICAL SPLIT BY VALUE (SEGRO SHARE)
1
23
4
5
6
GREATER LONDONProviding modern space in a supply-constrained market.PAGE 27
THAMES VALLEYProviding modern space for growing businesses.PAGE 28
UK BIG BOX LOGISTICS WAREHOUSESFacilitating efficient retailer and manufacturer supply chains and parcel delivery. PAGE 29
NORTHERN EUROPEDelivering quality big box and urban warehouses in major cities. PAGE 30
SOUTHERN EUROPEIncreasing development in France; building scale in Italy and Spain.PAGE 31
CENTRAL EUROPEMaking progress in a competitive market. PAGE 32
FOR MORE INFORMATION SEE OUR OPERATIONAL REVIEW PAGES 27-32
POZNAN
ŁODZ
SEGRO PLC | ANNUAL REPORT & ACCOUNTS 2017
04
The success of our portfolio strategy is dependent on our ability to respond to the new trends, challenges and opportunities facing our customers. This involves identifying and owning warehousing in markets where supply of space is limited and demand is likely to remain strong over the long term.
For example, our largest acquisition during the year was the 50 per cent of the APP portfolio owned by our joint venture partner, Aviva. The APP portfolio is mainly concentrated around Heathrow Airport, situated in Greater London’s protected green belt, restricting the availability of land for new development. The airport accounts for approximately two-thirds of UK air freight which is a key source of occupier demand for warehouses in the immediate vicinity. In 2017, air freight volumes through Heathrow grew by around 10 per cent, adding further demand pressure to this supply-constrained market.
The strategy we set out in 2011 was designed to ensure that all of our assets were in markets with similar long-term structural demand and supply dynamics. This meant disposing of assets which were either industrial in nature but of poorer quality or
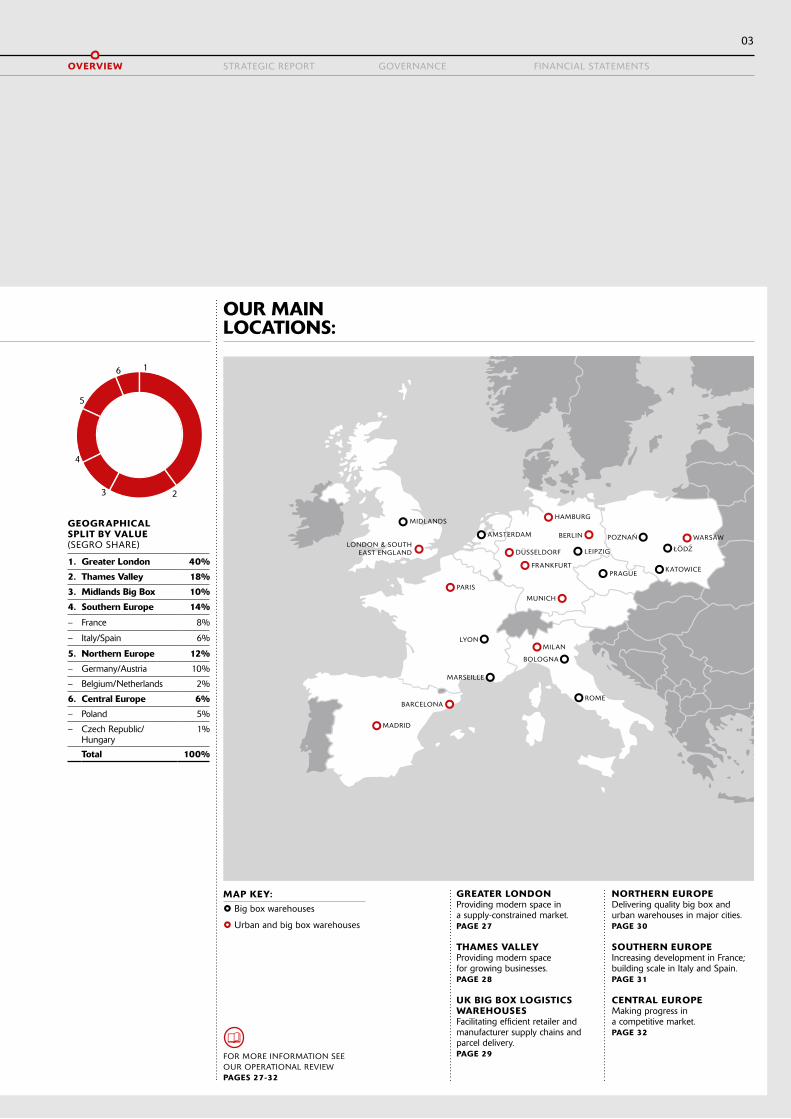
The shape of our portfolio is driven by our strategy to own high quality warehouse assets capable of generating attractive, long term returns for our shareholders. Over the years, we have transformed the portfolio as we have repositioned it to cater for the changing needs of our customers, both now and in the future.
A PORTFOLIO POSITIONED FOR THE FUTURE
in the wrong location or non-industrial assets, including offices and retail. Our portfolio today reflects the quality, the focus and the locations we were targeting six years ago.
Although acquisitions have played a major part in creating the portfolio today, over the past five years, we have invested £1.1 billion into development, creating new assets, which service the needs of our customers who want modern, sustainable buildings in markets convenient for serving their customers and with easy access to their workforce.
We apply our knowledge and expertise in real estate sector and in our markets to assess the risks and the returns for each development we approve. In 2017, the development projects we completed represent capital investment of approximately £330 million. During the year, they generated a valuation gain of £176 million and have the potential to generate £27 million of headline rent, of which £25 million has been secured.
These developments, with their high sustainability credentials, are designed to generate attractive returns not only today but also long into the future.
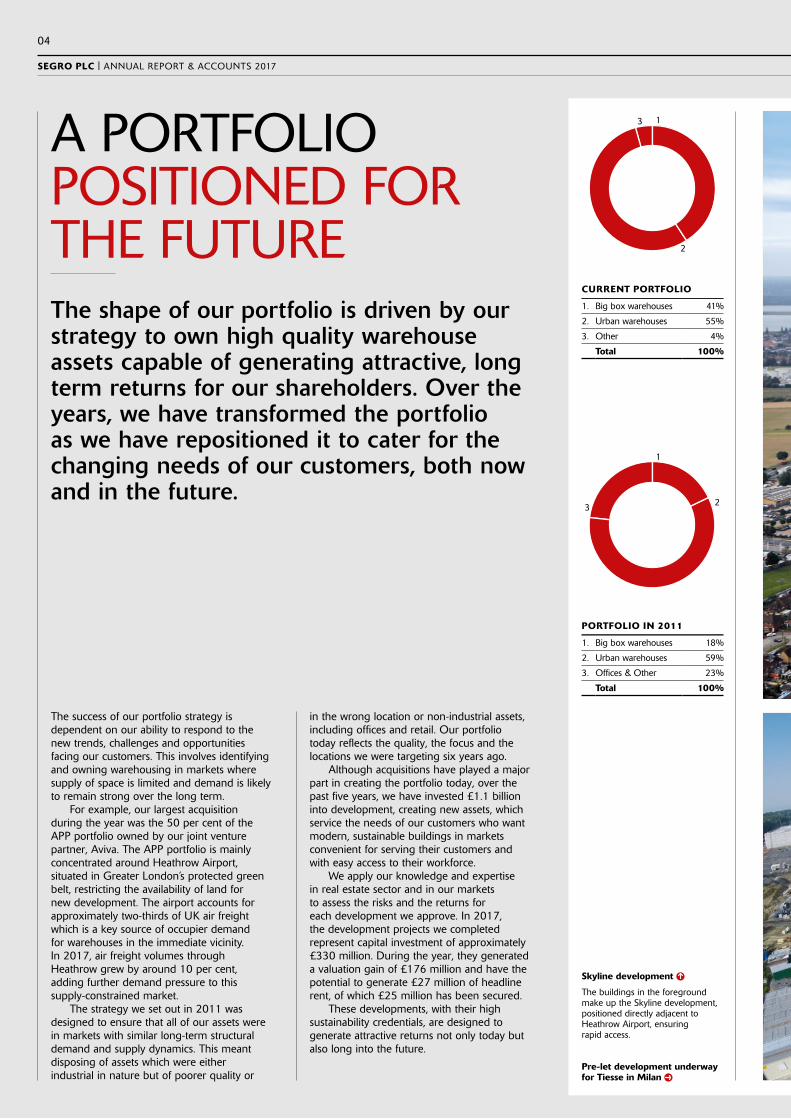
Skyline development
The buildings in the foreground make up the Skyline development, positioned directly adjacent to Heathrow Airport, ensuring rapid access.
Pre-let development underway for Tiesse in Milan
1. Big box warehouses 41%
2. Urban warehouses 55%
3. Other 4%
Total 100%
CURRENT PORTFOLIO
1
2
3
1. Big box warehouses 18%
2. Urban warehouses 59%
3. Offices & Other 23%
Total 100%
PORTFOLIO IN 2011
1
23

05
OVERVIEW STRATEGIC REPORT GOVERNANCE FINANCIAL STATEMENTS
MORE DETAIL ON OUR STRATEGY AND OUR PERFORMANCE CAN BE FOUND ONPAGES 20-26
WE HAVE TRANSFORMED OUR PORTFOLIO SINCE 2011.”
PHIL REDDINGCHIEF INVESTMENT OFFICER
SEGRO PLC | ANNUAL REPORT & ACCOUNTS 2017
06
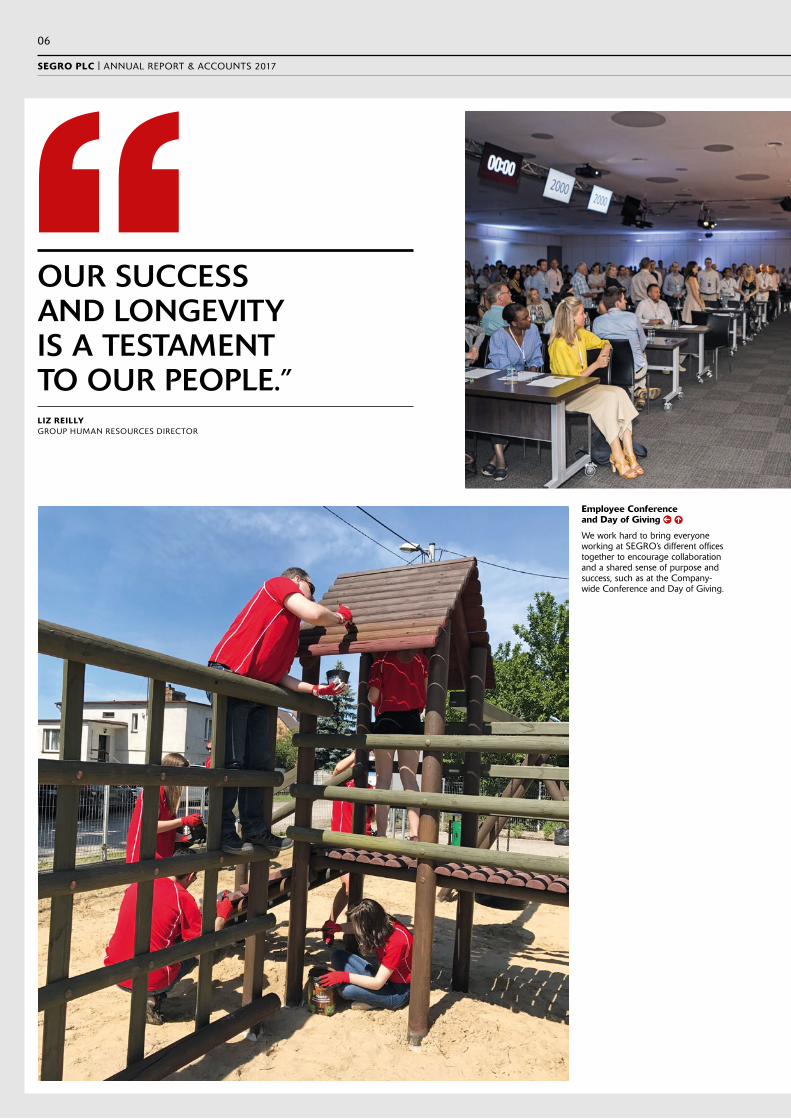
OUR SUCCESS AND LONGEVITY IS A TESTAMENT TO OUR PEOPLE.”LIZ REILLYGROUP HUMAN RESOURCES DIRECTOR
Employee Conference and Day of Giving
We work hard to bring everyone working at SEGRO’s different offices together to encourage collaboration and a shared sense of purpose and success, such as at the Company-wide Conference and Day of Giving.

07
OVERVIEW STRATEGIC REPORT GOVERNANCE FINANCIAL STATEMENTS
Our success and longevity is a testament to our people. Our unique corporate culture is a hugely important part of attracting and retaining talent both now and in the future. At the heart of this culture are our Purpose and Values (examined in more detail on page 44). These were created in 2015 after a year-long programme of engagement with all our employees. These provide the framework for how we work and behave and are an important component of creating a place of work where people feel motivated and valued.
SEGRO is dedicated to increasing diversity in the business through a combination of actions aimed at raising conscious awareness of diversity issues amongst our employees, through our recruitment and training interventions and our talent review process.
With 11 offices across Europe, we encourage and facilitate collaboration between different countries and operating teams. For example, over the past year, two cross-border and cross-function teams have conducted research into the viability of multi-storey warehousing and into the opportunities and threats presented to SEGRO and our customers by technological change. It is by sharing knowledge, opinion and best practice like this that will help us constantly challenge the status quo and future proof our business.
We also encourage employees to participate in training, from courses designed to develop role-specific skills to more generic learning, such as studying new languages. We also support employees who use their business and personal skills in a voluntary capacity, and we organise an annual, SEGRO-
SEGRO was founded in 1920 when Sir Noel Mobbs led the consortium that purchased what is now the Slough Trading Estate. It is our responsibility today to create the conditions to secure SEGRO’s future for the next 100 years and beyond. A high quality portfolio is important, but we also need talented people who share the same culture and values to continue our success.
A CULTURE LOOKING TO THE FUTURE
wide ‘Day of Giving’ where all colleagues are encouraged to give up a day for relevant charitable causes. In the 2017 Day of Giving, 190 people from across the business took part in 16 projects.
Every SEGRO employee is eligible to be rewarded with a bonus that reflects both their own achievements and their contribution to the performance of their team and the Company: 75 per cent of every employee’s bonus (below Board level) is based on team or SEGRO-wide performance, with 25 per cent based on achievement of personal objectives. Additionally, every employee is given the opportunity to own a stake in SEGRO’s future, through SEGRO share incentive schemes where all colleagues are eligible to receive shares that vest after three years.
Every two years we commission an independent company to conduct an employee engagement survey This allows all colleagues the opportunity to provide anonymous feedback across all facets of their working life at SEGRO, identifying what we do well and areas for improvement. The results of the 2016 survey, published in early 2017, showed a very high engagement score of 90 per cent across the whole Company. The Leadership team are given the results for their teams and the Company and tasked with ensuring that areas for improvement are addressed.
MORE DETAIL ON OUR CORPORATE CULTURE CAN BE FOUND ON PAGES 44-45
SAY IT LIKE IT IS.
IF THE DOOR IS CLOSED...
STAND SIDE BY SIDE.
DOES IT MAKE THE BOAT GO FASTER?
KEEP ONE EYE ON THE HORIZON.
OUR VALUES

SEGRO PLC | ANNUAL REPORT & ACCOUNTS 2017
08
OUR CUSTOMERS
Businesses must respond to change, and technological innovation in the form of e-commerce has driven the change in demand for our warehouses. Technology also presents other opportunities for our business as it continues to advance in many different areas.
Access to power is increasingly important for our customers, particularly for our data-centre occupiers and companies investing in greater automation in their warehouses. For example, we have made significant investment in the SEGRO Logistics Park East Midlands Gateway infrastructure, to ensure that customers can be confident of a sufficient power supply to grow their businesses in future.
Another area is the growing demand for, and supply of, electric vehicles, particularly in relation to urban distribution where local governments are focusing increasingly on congestion and air quality. In response, all our new developments include parking spaces with charging points for electric and hybrid cars.
Our customers also include companies which are at the forefront of technological innovation:
££ Tesla uses its facility in the Netherlands to test-drive its latest vehicles, drawing its power from solar panels on the warehouse roof.
££ Dräxlmaier is carrying out research and development in its facility in Germany to create the battery for the new electric Porsche.
The investment decisions we make today are long term and must be fit for the future and we devote considerable time to investigating these developments to ensure that we respond to them appropriately.
As a listed owner and developer of buildings, our long-term future depends on making sure we have the right assets in the right place but also on being a responsible business. This is about making sure we operate with all our stakeholders in mind, providing customers with premises within which they can adapt and grow their business, working in partnership with our local communities and ensuring that our buildings use natural resources efficiently.
OUR RESPONSIBILITY FOR THE FUTURE
09
OVERVIEW STRATEGIC REPORT GOVERNANCE FINANCIAL STATEMENTS
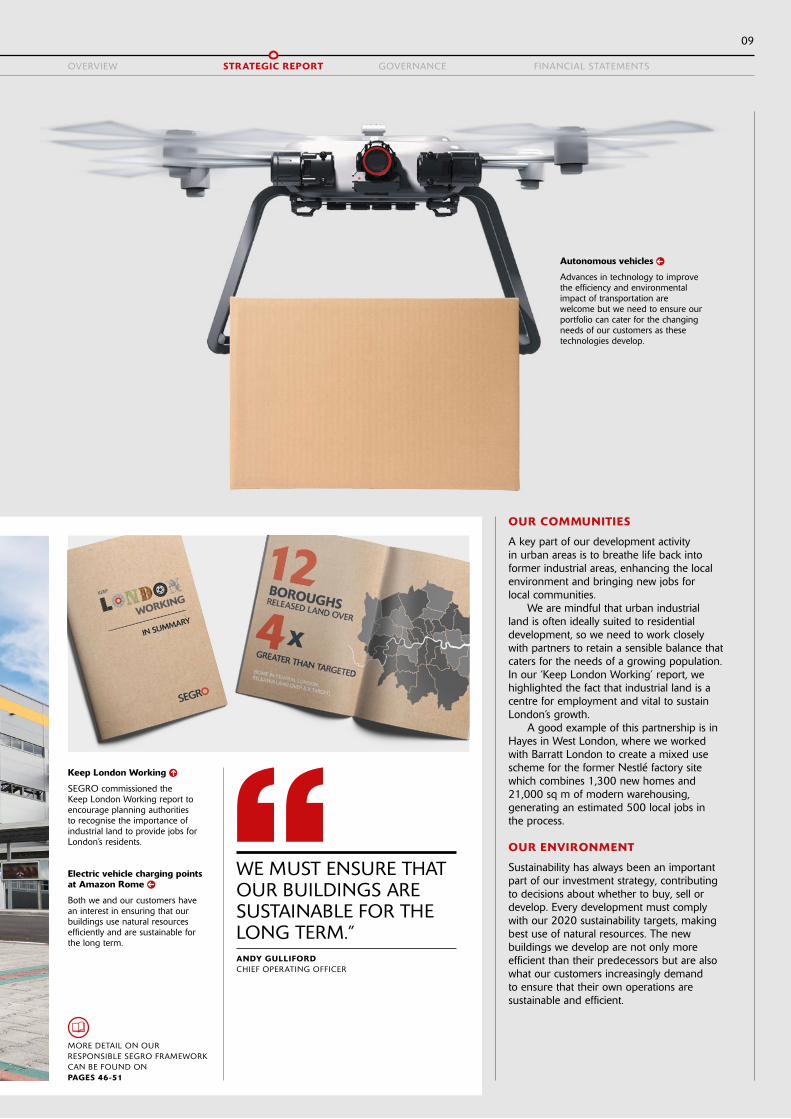
OUR COMMUNITIES
A key part of our development activity in urban areas is to breathe life back into former industrial areas, enhancing the local environment and bringing new jobs for local communities.
We are mindful that urban industrial land is often ideally suited to residential development, so we need to work closely with partners to retain a sensible balance that caters for the needs of a growing population. In our ‘Keep London Working’ report, we highlighted the fact that industrial land is a centre for employment and vital to sustain London’s growth.
A good example of this partnership is in Hayes in West London, where we worked with Barratt London to create a mixed use scheme for the former Nestlé factory site which combines 1,300 new homes and 21,000 sq m of modern warehousing, generating an estimated 500 local jobs in the process.
OUR ENVIRONMENT
Sustainability has always been an important part of our investment strategy, contributing to decisions about whether to buy, sell or develop. Every development must comply with our 2020 sustainability targets, making best use of natural resources. The new buildings we develop are not only more efficient than their predecessors but are also what our customers increasingly demand to ensure that their own operations are sustainable and efficient.
Autonomous vehicles
Advances in technology to improve the efficiency and environmental impact of transportation are welcome but we need to ensure our portfolio can cater for the changing needs of our customers as these technologies develop.
Keep London Working
SEGRO commissioned the Keep London Working report to encourage planning authorities to recognise the importance of industrial land to provide jobs for London’s residents.
Electric vehicle charging points at Amazon Rome
Both we and our customers have an interest in ensuring that our buildings use natural resources efficiently and are sustainable for the long term.
MORE DETAIL ON OUR RESPONSIBLE SEGRO FRAMEWORK CAN BE FOUND ONPAGES 46-51
WE MUST ENSURE THAT OUR BUILDINGS ARE SUSTAINABLE FOR THE LONG TERM.”ANDY GULLIFORDCHIEF OPERATING OFFICER
SEGRO PLC | ANNUAL REPORT & ACCOUNTS 2017
10
ANOTHER YEAR OF DELIVERY
CHIEF EXECUTIVE’S STATEMENT
IN 2017, SEGRO HAS DELIVERED STRONG OPERATING METRICS, AND IT HAS BEEN A RECORD YEAR FOR DEVELOPMENT.”DAVID SLEATHCHIEF EXECUTIVE
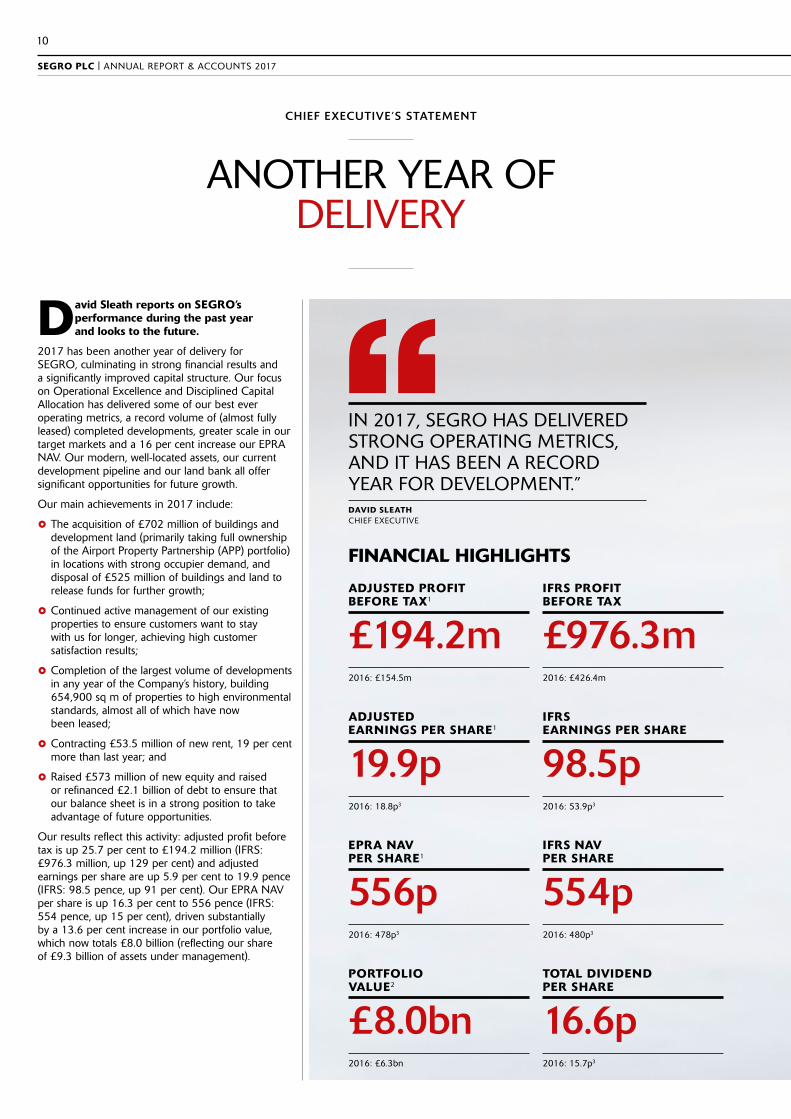
David Sleath reports on SEGRO’s performance during the past year and looks to the future.
2017 has been another year of delivery for SEGRO, culminating in strong financial results and a significantly improved capital structure. Our focus on Operational Excellence and Disciplined Capital Allocation has delivered some of our best ever operating metrics, a record volume of (almost fully leased) completed developments, greater scale in our target markets and a 16 per cent increase our EPRA NAV. Our modern, well-located assets, our current development pipeline and our land bank all offer significant opportunities for future growth.
Our main achievements in 2017 include:
££ The acquisition of £702 million of buildings and development land (primarily taking full ownership of the Airport Property Partnership (APP) portfolio) in locations with strong occupier demand, and disposal of £525 million of buildings and land to release funds for further growth;
££ Continued active management of our existing properties to ensure customers want to stay with us for longer, achieving high customer satisfaction results;
££ Completion of the largest volume of developments in any year of the Company’s history, building 654,900 sq m of properties to high environmental standards, almost all of which have now been leased;
££ Contracting £53.5 million of new rent, 19 per cent more than last year; and
££ Raised £573 million of new equity and raised or refinanced £2.1 billion of debt to ensure that our balance sheet is in a strong position to take advantage of future opportunities.
Our results reflect this activity: adjusted profit before tax is up 25.7 per cent to £194.2 million (IFRS: £976.3 million, up 129 per cent) and adjusted earnings per share are up 5.9 per cent to 19.9 pence (IFRS: 98.5 pence, up 91 per cent). Our EPRA NAV per share is up 16.3 per cent to 556 pence (IFRS: 554 pence, up 15 per cent), driven substantially by a 13.6 per cent increase in our portfolio value, which now totals £8.0 billion (reflecting our share of £9.3 billion of assets under management).
ADJUSTED PROFIT BEFORE TAX1
2016: £154.5m
£194.2m
ADJUSTED EARNINGS PER SHARE1
2016: 18.8p3
19.9p
EPRA NAV PER SHARE1
2016: 478p3
556p
PORTFOLIO VALUE2
2016: £6.3bn
£8.0bn
IFRS PROFIT BEFORE TAX
2016: £426.4m
£976.3m
IFRS EARNINGS PER SHARE
2016: 53.9p3
98.5p
IFRS NAV PER SHARE
2016: 480p3
554p
TOTAL DIVIDEND PER SHARE
2016: 15.7p3
16.6p
FINANCIAL HIGHLIGHTS
11
OVERVIEW STRATEGIC REPORT GOVERNANCE FINANCIAL STATEMENTS
Important Explanatory Notes about Alternative Performance Metrics used in this Report
1 EPRA and Adjusted metrics: The Financial Statements are prepared under IFRS. SEGRO management monitors a number of adjusted performance indicators in assessing and managing the performance of the business which they believe reflect the underlying recurring performance of the property rental business which is the Group’s core operating activity. These include those defined by EPRA as part of their mission to establish consistency of calculation across the European listed real estate sector. Pages 125-126 contain more information about the adjustments and the reconciliation of these to IFRS equivalents.
2 Proportionally consolidated figures and metrics: SEGRO owns assets both wholly itself and through stakes in 50-50 joint ventures. In the Financial Statements, the profit from joint ventures is stated as a single figure in the Income Statement and the net asset value of joint ventures is stated as a single equity figure on the Balance Sheet; Note 7 to the Financial Statements provides the component parts of these figures. In operational terms, SEGRO does not distinguish between assets held in joint ventures from those assets which are wholly-owned. Therefore, unless specifically stated, in the Strategic Report, performance metrics and financial figures are stated reflecting SEGRO’s wholly-owned assets and its share of joint venture assets (known commonly as a “proportionally consolidated” basis). Where the Strategic Report refers to the area of a property, it is stated at 100 per cent of the space, irrespective of whether the property is wholly-owned or held in a joint venture.
3 During the year, SEGRO undertook a Rights Issue. The 2016 adjusted earnings, total dividend and EPRA NAV per share metrics have been restated in the accounts following the Rights Issue in order to provide a comparable basis for the current year. The adjustment factor for the Rights Issue is 1.046, which adjusts for the discount element of the Rights Issue. Further information on this is included in Note 14 to the Accounts.
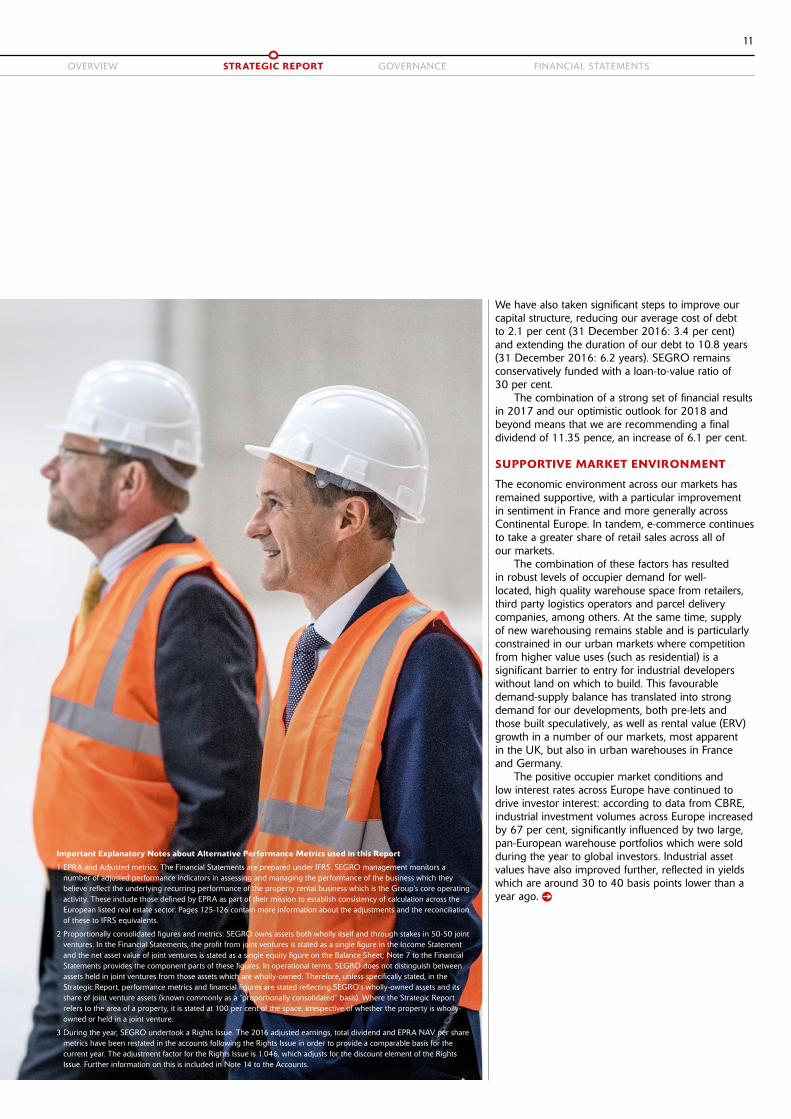
We have also taken significant steps to improve our capital structure, reducing our average cost of debt to 2.1 per cent (31 December 2016: 3.4 per cent) and extending the duration of our debt to 10.8 years (31 December 2016: 6.2 years). SEGRO remains conservatively funded with a loan-to-value ratio of 30 per cent.
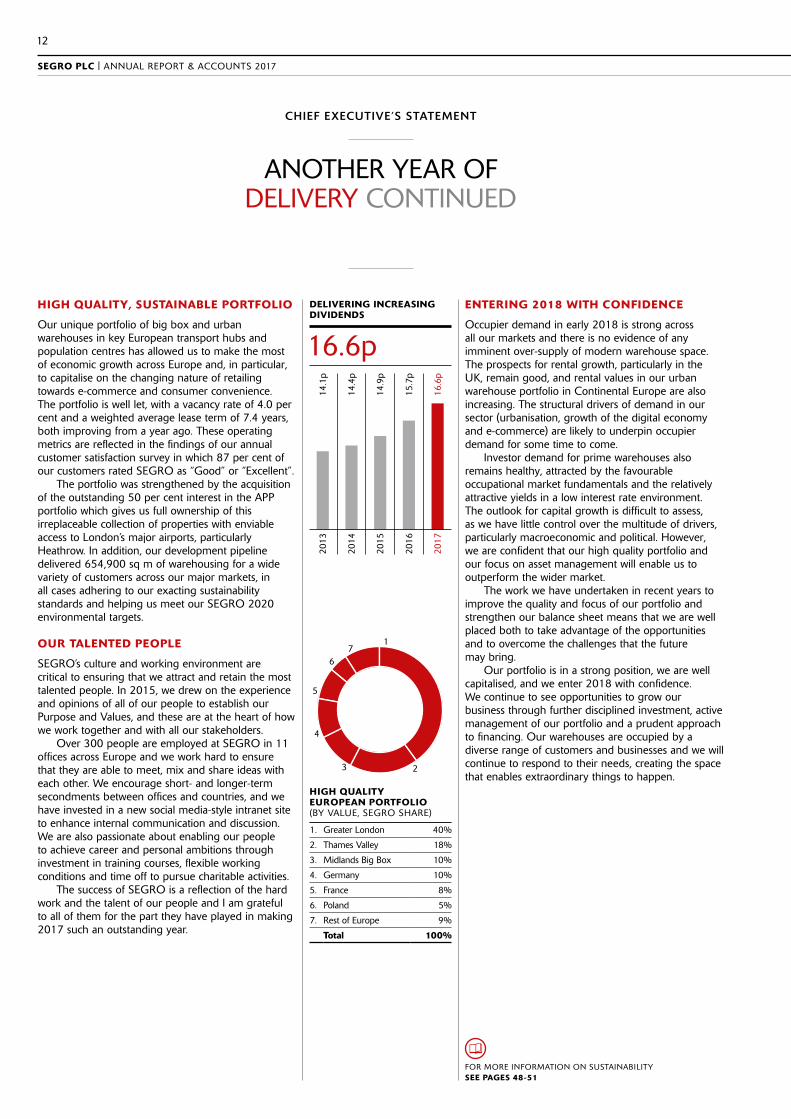
The combination of a strong set of financial results in 2017 and our optimistic outlook for 2018 and beyond means that we are recommending a final dividend of 11.35 pence, an increase of 6.1 per cent.
SUPPORTIVE MARKET ENVIRONMENT
The economic environment across our markets has remained supportive, with a particular improvement in sentiment in France and more generally across Continental Europe. In tandem, e-commerce continues to take a greater share of retail sales across all of our markets.
The combination of these factors has resulted in robust levels of occupier demand for well-located, high quality warehouse space from retailers, third party logistics operators and parcel delivery companies, among others. At the same time, supply of new warehousing remains stable and is particularly constrained in our urban markets where competition from higher value uses (such as residential) is a significant barrier to entry for industrial developers without land on which to build. This favourable demand-supply balance has translated into strong demand for our developments, both pre-lets and those built speculatively, as well as rental value (ERV) growth in a number of our markets, most apparent in the UK, but also in urban warehouses in France and Germany.
The positive occupier market conditions and low interest rates across Europe have continued to drive investor interest: according to data from CBRE, industrial investment volumes across Europe increased by 67 per cent, significantly influenced by two large, pan-European warehouse portfolios which were sold during the year to global investors. Industrial asset values have also improved further, reflected in yields which are around 30 to 40 basis points lower than a year ago.
SEGRO PLC | ANNUAL REPORT & ACCOUNTS 2017
12
CHIEF EXECUTIVE’S STATEMENT
HIGH QUALITY, SUSTAINABLE PORTFOLIO
Our unique portfolio of big box and urban warehouses in key European transport hubs and population centres has allowed us to make the most of economic growth across Europe and, in particular, to capitalise on the changing nature of retailing towards e-commerce and consumer convenience. The portfolio is well let, with a vacancy rate of 4.0 per cent and a weighted average lease term of 7.4 years, both improving from a year ago. These operating metrics are reflected in the findings of our annual customer satisfaction survey in which 87 per cent of our customers rated SEGRO as “Good” or “Excellent”.
The portfolio was strengthened by the acquisition of the outstanding 50 per cent interest in the APP portfolio which gives us full ownership of this irreplaceable collection of properties with enviable access to London’s major airports, particularly Heathrow. In addition, our development pipeline delivered 654,900 sq m of warehousing for a wide variety of customers across our major markets, in all cases adhering to our exacting sustainability standards and helping us meet our SEGRO 2020 environmental targets.
OUR TALENTED PEOPLE
SEGRO’s culture and working environment are critical to ensuring that we attract and retain the most talented people. In 2015, we drew on the experience and opinions of all of our people to establish our Purpose and Values, and these are at the heart of how we work together and with all our stakeholders.
Over 300 people are employed at SEGRO in 11 offices across Europe and we work hard to ensure that they are able to meet, mix and share ideas with each other. We encourage short- and longer-term secondments between offices and countries, and we have invested in a new social media-style intranet site to enhance internal communication and discussion. We are also passionate about enabling our people to achieve career and personal ambitions through investment in training courses, flexible working conditions and time off to pursue charitable activities.
The success of SEGRO is a reflection of the hard work and the talent of our people and I am grateful to all of them for the part they have played in making 2017 such an outstanding year.
FOR MORE INFORMATION ON SUSTAINABILITY SEE PAGES 48-51
ENTERING 2018 WITH CONFIDENCE
Occupier demand in early 2018 is strong across all our markets and there is no evidence of any imminent over-supply of modern warehouse space. The prospects for rental growth, particularly in the UK, remain good, and rental values in our urban warehouse portfolio in Continental Europe are also increasing. The structural drivers of demand in our sector (urbanisation, growth of the digital economy and e-commerce) are likely to underpin occupier demand for some time to come.
Investor demand for prime warehouses also remains healthy, attracted by the favourable occupational market fundamentals and the relatively attractive yields in a low interest rate environment. The outlook for capital growth is difficult to assess, as we have little control over the multitude of drivers, particularly macroeconomic and political. However, we are confident that our high quality portfolio and our focus on asset management will enable us to outperform the wider market.
The work we have undertaken in recent years to improve the quality and focus of our portfolio and strengthen our balance sheet means that we are well placed both to take advantage of the opportunities and to overcome the challenges that the future may bring.
Our portfolio is in a strong position, we are well capitalised, and we enter 2018 with confidence. We continue to see opportunities to grow our business through further disciplined investment, active management of our portfolio and a prudent approach to financing. Our warehouses are occupied by a diverse range of customers and businesses and we will continue to respond to their needs, creating the space that enables extraordinary things to happen.
1. Greater London 40%
2. Thames Valley 18%
3. Midlands Big Box 10%
4. Germany 10%
5. France 8%
6. Poland 5%
7. Rest of Europe 9%
Total 100%
HIGH QUALITY EUROPEAN PORTFOLIO (BY VALUE, SEGRO SHARE)
1
23
4
5
67
ANOTHER YEAR OF DELIVERY CONTINUED
DELIVERING INCREASINGDIVIDENDS
14.1
p
14.4
p
14.9
p
15.7
p
16.6
p
2013
2014
2015
2016
2017
16.6p

13
OVERVIEW STRATEGIC REPORT GOVERNANCE FINANCIAL STATEMENTS
A LOOK AT OUR MARKET DRIVERS
MARKET OVERVIEW
Source: OECD 15 February 2018Source: Colliers International: “Online retailers and the growth of ‘showrooming’”, 2017 Q4
Commentary:Economic growth is an important driver of demand for space by occupiers, and our customer base spans most business sectors. A supportive economic environment encourages businesses to grow and require additional space in which to operate.
We expect the economies of all our markets to grow steadily, with a clear improvement in momentum in our Continental European markets.
The UK’s future relationship with the European Union continues to be a source of uncertainty and appears to be weighing on forecasts for UK GDP growth.
What it means for SEGRO: ££ A supportive economic environment is crucial for our customers and likely to increase demand for additional warehouse space.
££ Healthy occupier demand for newly developed pre-let and speculative space.
££ Lack of clarity around the UK’s future relationship with the EU could impact occupier demand both for existing space and for our risk appetite for speculative development (see page 59 for more details about Brexit-related risks).
Commentary: Structural changes in the nature of retailing towards e-commerce and convenience shopping, combined with increasing urbanisation of European populations, are forcing retailers to reassess how they sell and distribute their goods.
Supply chains must be able to handle both bulk delivery of goods to larger stores and individual deliveries to homes, offices, click-and-collect locations and high street convenience stores. Margin pressure means that retailers, third party logistics providers and parcel delivery companies are increasingly focused on extracting efficiencies from their supply chain, using modern premises in key transport corridors, logistics hubs or locations close to major conurbations.
What it means for SEGRO: ££ Strong occupier demand for our urban warehouses located on the edge of major European cities to cater for ‘last mile delivery’ to multiple destinations, often houses and offices.
££ 70 per cent of lettings in 2017 were from retailers, parcel delivery and third party logistics companies.
££ See also factors under ‘Improving economic outlook’.
The performance of real estate, like all asset classes, is driven by the interplay of demand and supply: investor demand for property assets and occupier demand for space, with performance dependent on the supply of properties to buy or lease to satisfy that demand.
REAL ESTATE AS AN INVESTMENT ASSET
If investor demand increases, in the absence of additional supply, the value of real estate will rise; if demand wanes or supply increases, the value will fall. Real estate pricing is commonly expressed as a yield which is the rent payable for a building as a percentage of its value. Assuming rents remain static, as the value of real estate rises, its yield falls (often referred to as ‘yield compression’) and vice versa.
REAL ESTATE AS AN OPERATING NECESSITY
As occupier demand increases, in the absence of additional supply, overall lease terms will become more expensive for the occupier, including (but not exclusively) an increase in rents. If demand for space falls, or supply increases ahead of occupier demand, overall lease terms, including rent, will become cheaper.
It is for this reason that the property market is considered cyclical: as investor or occupier demand increases, the returns from real estate improve and the supply of assets or space tends to increase to meet that demand. If supply increases too much, or demand starts to fall, supply can exceed demand and asset values and rents will fall until such time as demand matches or exceeds supply, at which point the cycle turns.
We are acutely aware of the cyclical nature of real estate and believe there are six main market factors which influence the performance of our portfolio.
IMPROVING ECONOMIC OUTLOOK
STRUCTURAL CHANGES IN CONSUMER BEHAVIOUR
GDP GROWTH FORECAST FOR OURMAJOR MARKETS (% P.A., 2017–19)
3.4%
2.1%
1.7%
1.4%
1.2%
Pola
nd
Ger
man
y
Fran
ce
Italy
UK
FORECAST GROWTH IN EUROPEAN RETAIL SALES BY PHYSICAL STORESAND E-COMMERCE (2015=100)
2015
100
112
124
105 107
137
150
164
175
115112110
102
125
150
175
2016
2017
2018
F
2019
F
2020
F
2021
F E-commercePhysical
Averagegrowthrate: 9.8%
Averagegrowthrate: 2.4%

SEGRO PLC | ANNUAL REPORT & ACCOUNTS 2017
14
MARKET OVERVIEW
A LOOK AT OUR MARKET DRIVERS CONTINUED
Source: JLL
Commentary: The relatively short construction time for warehousing means that rising demand can sometimes be quickly met by an increase in supply. However, developers are currently taking a disciplined approach and, particularly in urban areas, tight planning laws and competing uses are restricting the supply of land. Therefore, although warehouse development is increasing, it is not exceeding (or still falling short of) occupier demand and many buildings under construction are already committed (pre-let) to occupiers. Consequently there are no signs of over-supply in any of our major markets.
What it means for SEGRO: ££ The shortage of quality warehouses and healthy occupier demand, particularly for urban warehouses across our markets, has caused rental values to rise.
££ It has also been reflected in the acceleration of our development activity (and in the level of pre-lets) in recent years, utilising our well located land bank to satisfy our customers’ need for modern warehouse space in key European cities and transport corridors.
Commentary: Land zoned for industrial use in and around major conurbations is important to cater for occupiers who need to be close to population centres either for efficient last mile delivery or for an accessible labour source. However, the stock of industrial land is being eroded in our major urban markets by other, higher value uses, most commonly residential. As a result, the potential supply response is restricted and, since demand remains strong, overall leasing terms are improving.
What this means for SEGRO: ££ In the UK, rental values for our London assets increased by 4.6 per cent reflecting the shortage of new supply relative to levels of demand and we expect continued rental growth in 2018.
££ In a few cases, we are able to release industrial land unsuitable for development of modern warehousing for higher value uses (mainly residential) and we benefit from the uplift in value from industrial to residential land zoning.
Commentary: With greater awareness of the impact of buildings on the environment and finite natural resources, occupiers demand high levels of environmental sustainability to minimise their environmental footprint and to reduce overall occupancy costs, particularly from heating and other utilities. It is important that landlords and developers own and create buildings which are sustainable in the long term and use those natural resources efficiently.
What this means for SEGRO: ££ All of our developments are designed to meet the environmental targets set out in our SEGRO 2020 strategy (see page 48 for more details).
££ A building’s sustainability is an important factor in our investment decisions, not only for potential acquisitions but also in deciding whether to refurbish or dispose of the very few existing properties which fall short of environmental standards.
££ We estimate that 96 per cent of our UK properties by ERV are E-rated or above for the purposes of the Minimum Energy Efficiency Standards.
LIMITED SUPPLY OF MODERN WAREHOUSING
REDUCTION IN INDUSTRIAL LAND AROUND MAJOR TOWNS AND CITIES
NEED FOR EFFICIENT, SUSTAINABLE BUILDINGS
UK GRADE A WAREHOUSING IN SHORT SUPPLY – AVAILABILITY AT YEAR END (SQ M IN MILLIONS)
2.1
1.5
1.1
1.4
1.2
1.4
2012
2013
2014
2015
2016
2017
15
OVERVIEW STRATEGIC REPORT GOVERNANCE FINANCIAL STATEMENTS
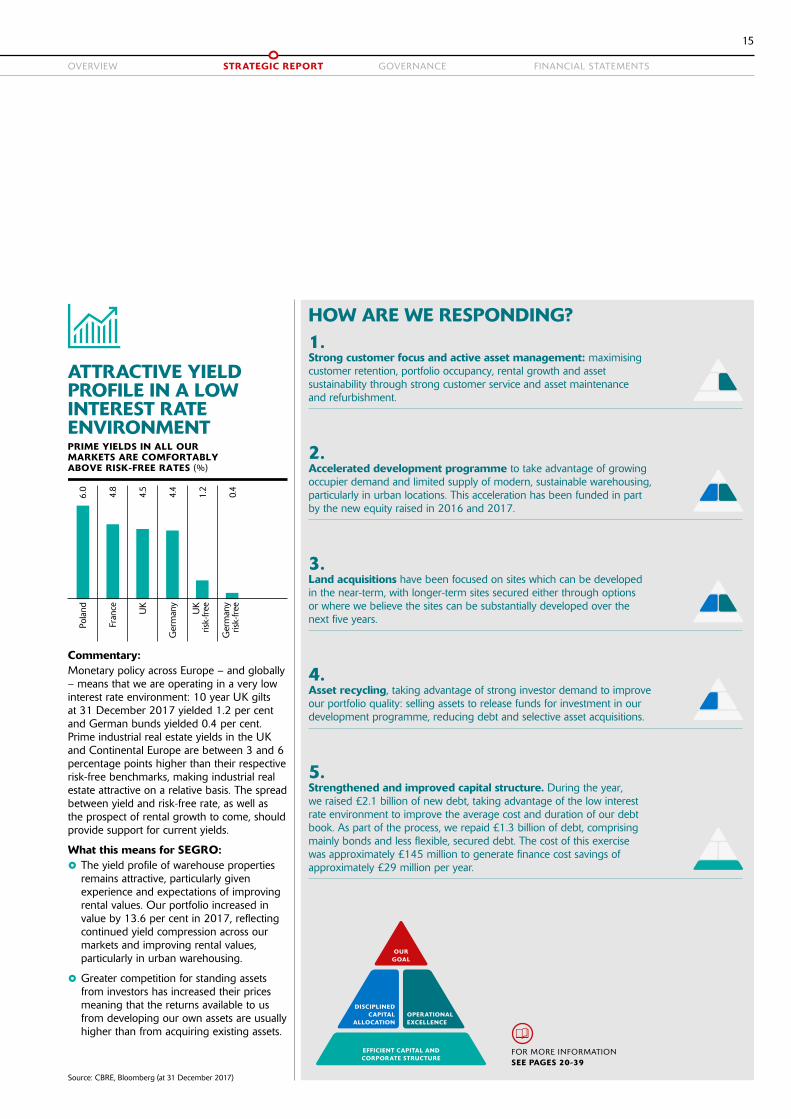
Commentary: Monetary policy across Europe – and globally – means that we are operating in a very low interest rate environment: 10 year UK gilts at 31 December 2017 yielded 1.2 per cent and German bunds yielded 0.4 per cent. Prime industrial real estate yields in the UK and Continental Europe are between 3 and 6 percentage points higher than their respective risk-free benchmarks, making industrial real estate attractive on a relative basis. The spread between yield and risk-free rate, as well as the prospect of rental growth to come, should provide support for current yields.
What this means for SEGRO: ££ The yield profile of warehouse properties remains attractive, particularly given experience and expectations of improving rental values. Our portfolio increased in value by 13.6 per cent in 2017, reflecting continued yield compression across our markets and improving rental values, particularly in urban warehousing.
££ Greater competition for standing assets from investors has increased their prices meaning that the returns available to us from developing our own assets are usually higher than from acquiring existing assets.
HOW ARE WE RESPONDING?1. Strong customer focus and active asset management: maximising customer retention, portfolio occupancy, rental growth and asset sustainability through strong customer service and asset maintenance and refurbishment.
2. Accelerated development programme to take advantage of growing occupier demand and limited supply of modern, sustainable warehousing, particularly in urban locations. This acceleration has been funded in part by the new equity raised in 2016 and 2017.
3. Land acquisitions have been focused on sites which can be developed in the near-term, with longer-term sites secured either through options or where we believe the sites can be substantially developed over the next five years.
4. Asset recycling, taking advantage of strong investor demand to improve our portfolio quality: selling assets to release funds for investment in our development programme, reducing debt and selective asset acquisitions.
5. Strengthened and improved capital structure. During the year, we raised £2.1 billion of new debt, taking advantage of the low interest rate environment to improve the average cost and duration of our debt book. As part of the process, we repaid £1.3 billion of debt, comprising mainly bonds and less flexible, secured debt. The cost of this exercise was approximately £145 million to generate finance cost savings of approximately £29 million per year.
ATTRACTIVE YIELD PROFILE IN A LOW INTEREST RATE ENVIRONMENT
Source: CBRE, Bloomberg (at 31 December 2017)
FOR MORE INFORMATION SEE PAGES 20-39
EFFICIENT CAPITAL AND CORPORATE STRUCTURE
OUR GOAL
DISCIPLINED CAPITAL
ALLOCATIONOPERATIONAL EXCELLENCE
PRIME YIELDS IN ALL OURMARKETS ARE COMFORTABLYABOVE RISK-FREE RATES (%)
6.0
4.8
4.5
4.4
1.2
0.4
Pola
nd
Fran
ce UK
Ger
man
y
UK
risk-
free
Ger
man
yris
k-fr
ee

SEGRO PLC | ANNUAL REPORT & ACCOUNTS 2017
16
FOR MORE INFORMATION SEE PAGE 20
EFFICIENT CAPITAL AND CORPORATE STRUCTURE
OUR GOAL
DISCIPLINED CAPITAL
ALLOCATIONOPERATIONAL EXCELLENCE
A SIMPLE INCOME-FOCUSED BUSINESS MODEL
OUR BUSINESS MODEL
We own, develop and manage warehouse properties in selected markets in the UK and Continental Europe. We aim to generate attractive financial and social returns for our shareholders and wider stakeholders by investing in high quality, sustainable buildings in prime locations.
WE APPLY OUR STRATEGY TO MAXIMISE PERFORMANCE:
WHAT WE NEED (inputs)
WHAT WE DO (our sustainable business model)
LAND
We aim to have sufficient land in the right locations to fuel our development pipeline without having so much that it undermines our near-term income returns.
FOR MORE INFORMATION SEE PAGE 26
ASSETS
We specialise in buying and building warehouse properties located on the edge of major cities and in key transport corridors and hubs.
FOR MORE INFORMATION SEE PAGE 21-22
PEOPLE
We employ 300 people with expert skills reflecting all aspects of real estate ownership including asset management, development, investment, marketing and financing.
FOR MORE INFORMATION SEE PAGE 44-45
PARTNERS
We join forces with other organisations where their attributes complement our own, such as through joint ventures with other landlords or capital providers. CAPITAL
Real estate is a capital-intensive business and we rely on strong relationships with our shareholders (providing equity funding) and our banks and bondholders (providing debt).
FOR MORE INFORMATION SEE PAGE 33-39
HEADLINE KPIs
4.0%VACANCY RATE
+5.9%ADJUSTED EPS GROWTH
17
OVERVIEW STRATEGIC REPORT GOVERNANCE FINANCIAL STATEMENTS
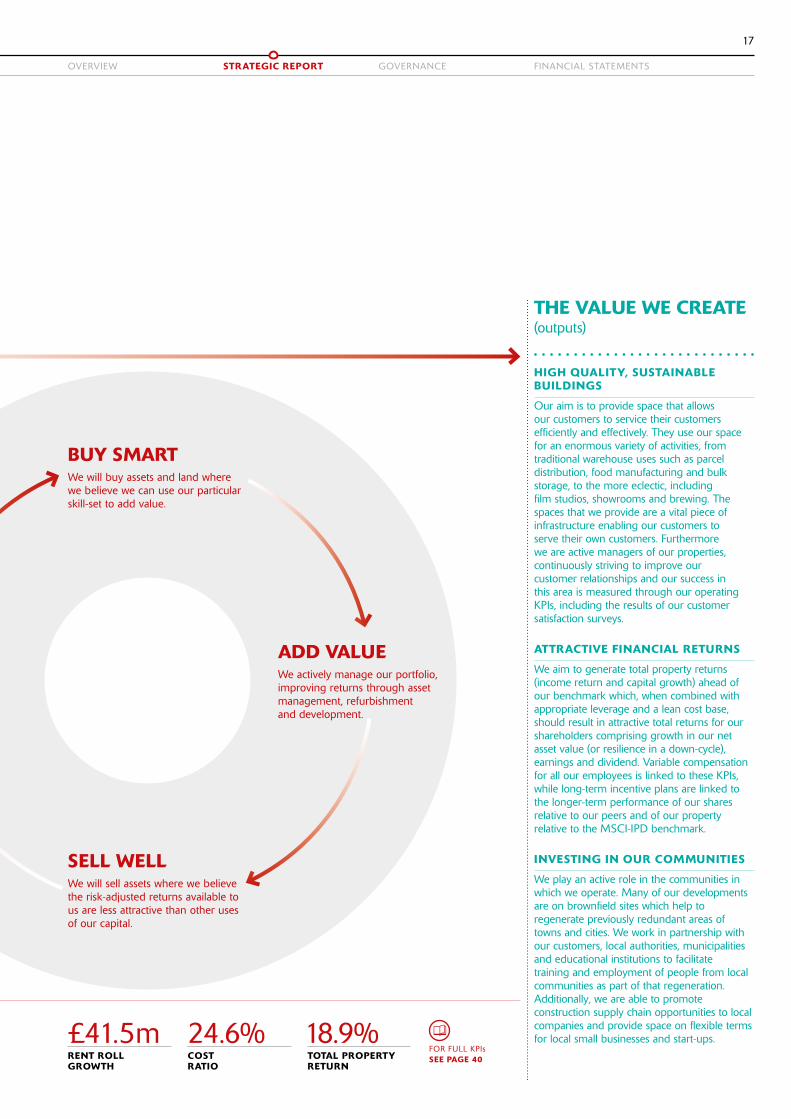
THE VALUE WE CREATE (outputs)
HIGH QUALITY, SUSTAINABLE BUILDINGS
Our aim is to provide space that allows our customers to service their customers efficiently and effectively. They use our space for an enormous variety of activities, from traditional warehouse uses such as parcel distribution, food manufacturing and bulk storage, to the more eclectic, including film studios, showrooms and brewing. The spaces that we provide are a vital piece of infrastructure enabling our customers to serve their own customers. Furthermore we are active managers of our properties, continuously striving to improve our customer relationships and our success in this area is measured through our operating KPIs, including the results of our customer satisfaction surveys.
ATTRACTIVE FINANCIAL RETURNS
We aim to generate total property returns (income return and capital growth) ahead of our benchmark which, when combined with appropriate leverage and a lean cost base, should result in attractive total returns for our shareholders comprising growth in our net asset value (or resilience in a down-cycle), earnings and dividend. Variable compensation for all our employees is linked to these KPIs, while long-term incentive plans are linked to the longer-term performance of our shares relative to our peers and of our property relative to the MSCI-IPD benchmark.
�INVESTING IN OUR COMMUNITIES
We play an active role in the communities in which we operate. Many of our developments are on brownfield sites which help to regenerate previously redundant areas of towns and cities. We work in partnership with our customers, local authorities, municipalities and educational institutions to facilitate training and employment of people from local communities as part of that regeneration. Additionally, we are able to promote construction supply chain opportunities to local companies and provide space on flexible terms for local small businesses and start-ups.
WHAT WE DO (our sustainable business model)
BUY SMARTWe will buy assets and land where we believe we can use our particular skill-set to add value.
SELL WELLWe will sell assets where we believe the risk-adjusted returns available to us are less attractive than other uses of our capital.
ADD VALUEWe actively manage our portfolio, improving returns through asset management, refurbishment and development.
FOR FULL KPIs SEE PAGE 40
HEADLINE KPIs
£41.5mRENT ROLL GROWTH
24.6%COST RATIO
18.9%TOTAL PROPERTY RETURN
SEGRO PLC | ANNUAL REPORT & ACCOUNTS 2017
18
CREATING VALUE ACROSS THE LIFE CYCLE
OUR BUSINESS MODEL
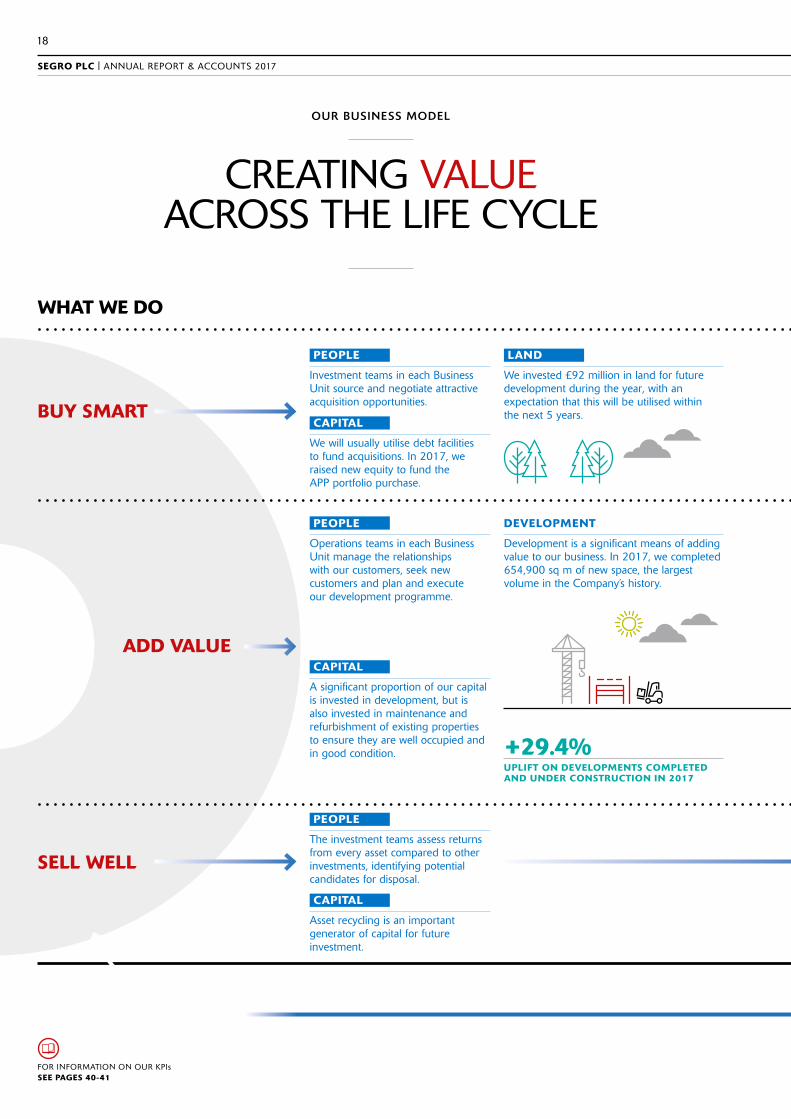
BUY SMART
SELL WELL
ADD VALUE
WHAT WE DO
DEVELOPMENT
Development is a significant means of adding value to our business. In 2017, we completed 654,900 sq m of new space, the largest volume in the Company’s history.
PEOPLE
Investment teams in each Business Unit source and negotiate attractive acquisition opportunities.
PEOPLE
The investment teams assess returns from every asset compared to other investments, identifying potential candidates for disposal.
CAPITAL
We will usually utilise debt facilities to fund acquisitions. In 2017, we raised new equity to fund the APP portfolio purchase.
CAPITAL
Asset recycling is an important generator of capital for future investment.
PEOPLE
Operations teams in each Business Unit manage the relationships with our customers, seek new customers and plan and execute our development programme.
CAPITAL
A significant proportion of our capital is invested in development, but is also invested in maintenance and refurbishment of existing properties to ensure they are well occupied and in good condition.
LAND
We invested £92 million in land for future development during the year, with an expectation that this will be utilised within the next 5 years.
FOR INFORMATION ON OUR KPIs SEE PAGES 40-41
+29.4%UPLIFT ON DEVELOPMENTS COMPLETED AND UNDER CONSTRUCTION IN 2017
19
OVERVIEW STRATEGIC REPORT GOVERNANCE FINANCIAL STATEMENTS
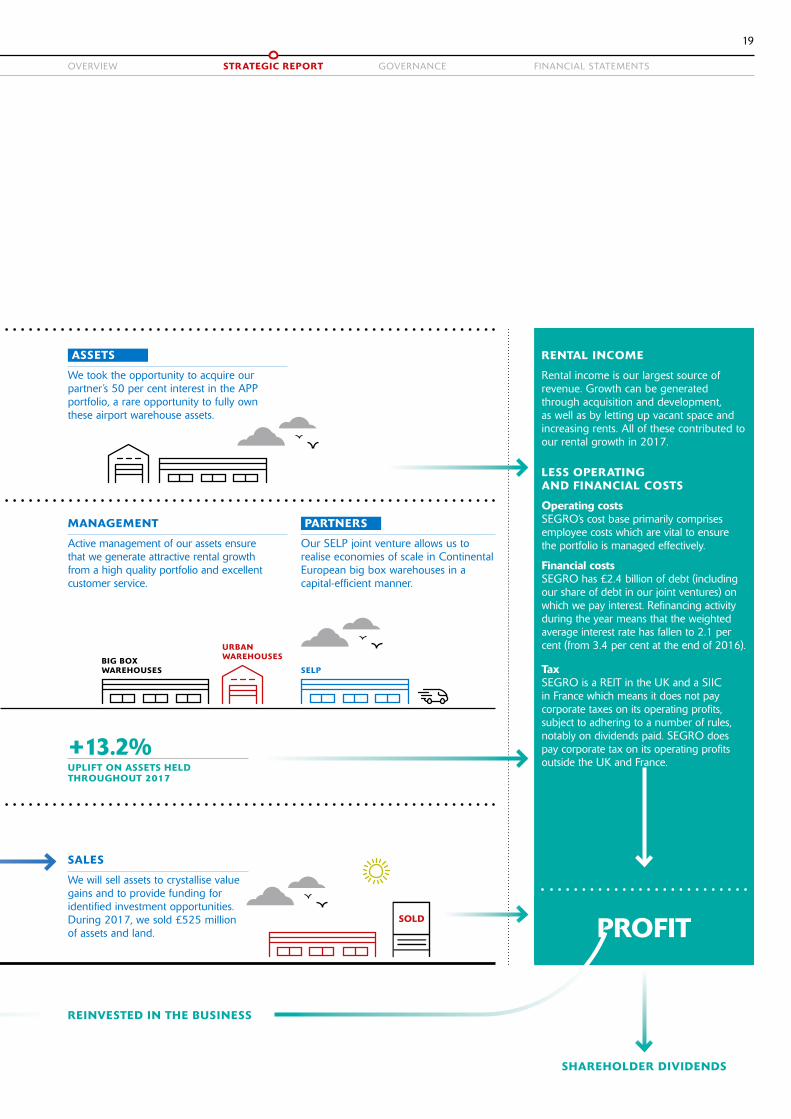
RENTAL INCOME
Rental income is our largest source of revenue. Growth can be generated through acquisition and development, as well as by letting up vacant space and increasing rents. All of these contributed to our rental growth in 2017.
LESS OPERATING AND FINANCIAL COSTS
Operating costs SEGRO’s cost base primarily comprises employee costs which are vital to ensure the portfolio is managed effectively.
Financial costs SEGRO has £2.4 billion of debt (including our share of debt in our joint ventures) on which we pay interest. Refinancing activity during the year means that the weighted average interest rate has fallen to 2.1 per cent (from 3.4 per cent at the end of 2016).
Tax SEGRO is a REIT in the UK and a SIIC in France which means it does not pay corporate taxes on its operating profits, subject to adhering to a number of rules, notably on dividends paid. SEGRO does pay corporate tax on its operating profits outside the UK and France.
PROFIT
REINVESTED IN THE BUSINESS
ASSETS
We took the opportunity to acquire our partner’s 50 per cent interest in the APP portfolio, a rare opportunity to fully own these airport warehouse assets.
MANAGEMENT
Active management of our assets ensure that we generate attractive rental growth from a high quality portfolio and excellent customer service.
PARTNERS
Our SELP joint venture allows us to realise economies of scale in Continental European big box warehouses in a capital-efficient manner.
SALES
We will sell assets to crystallise value gains and to provide funding for identified investment opportunities. During 2017, we sold £525 million of assets and land.
BIG BOX WAREHOUSES
URBAN WAREHOUSES
SELP
+13.2%UPLIFT ON ASSETS HELD THROUGHOUT 2017
SOLD
SHAREHOLDER DIVIDENDS

SEGRO PLC | ANNUAL REPORT & ACCOUNTS 2017
20
A STRATEGY TO GENERATE ATTRACTIVE, SUSTAINABLE RETURNS
OUR STRATEGY
Our goal is to be the best owner-manager and developer of warehouse properties in Europe and a leading income-focused REIT.
Our strategy for achieving this goal is to create a portfolio of high quality big box and urban warehouses in the strongest markets which generate attractive, low risk, income-led returns with above average rental and capital growth when market conditions are positive, and are resilient in a downturn. We seek to enhance returns through development, while ensuring that the short-term income ‘drag’ associated with holding land does not outweigh the long-term potential benefits.
Fundamental to our strategy are three key pillars of activity which should combine to deliver an attractive, income-led total property return:
�£ Disciplined Capital Allocation
�£ Operational Excellence
�£ Efficient Capital and Corporate Structure.
The combination of these elements should translate into sustainable, attractive returns for our shareholders in the form of progressive dividends and net asset value growth over time.
Our portfolio comprises modern big box and urban warehouses which are well specified and located, with good sustainability credentials, and which should benefit from a low structural void rate and relatively low-intensity asset management requirements. Our assets are concentrated in the strongest European submarkets which display attractive property market characteristics, including good growth prospects, limited supply availability and where we already have, or can achieve, critical mass.
EFFICIENT CAPITAL AND CORPORATE STRUCTURE
OUR GOAL
DISCIPLINED CAPITAL
ALLOCATIONOPERATIONAL EXCELLENCE
1.
3.
2.
FOR INFORMATION ON OUR KPIs SEE PAGE 40-41
1. DISCIPLINED CAPITAL ALLOCATION:
Picking the right markets and assets to create the right portfolio shape by actively managing the portfolio composition and adapting our capital deployment according to our assessment of the property cycle.
2. OPERATIONAL EXCELLENCE:
Optimising performance from the portfolio through dedicated customer service, expert asset management, development and operational efficiency.
3. EFFICIENT CAPITAL AND CORPORATE STRUCTURE:
We aim to underpin the property level returns from our portfolio with a lean overhead structure and appropriate financial leverage through the cycle.
21
OVERVIEW STRATEGIC REPORT GOVERNANCE FINANCIAL STATEMENTS
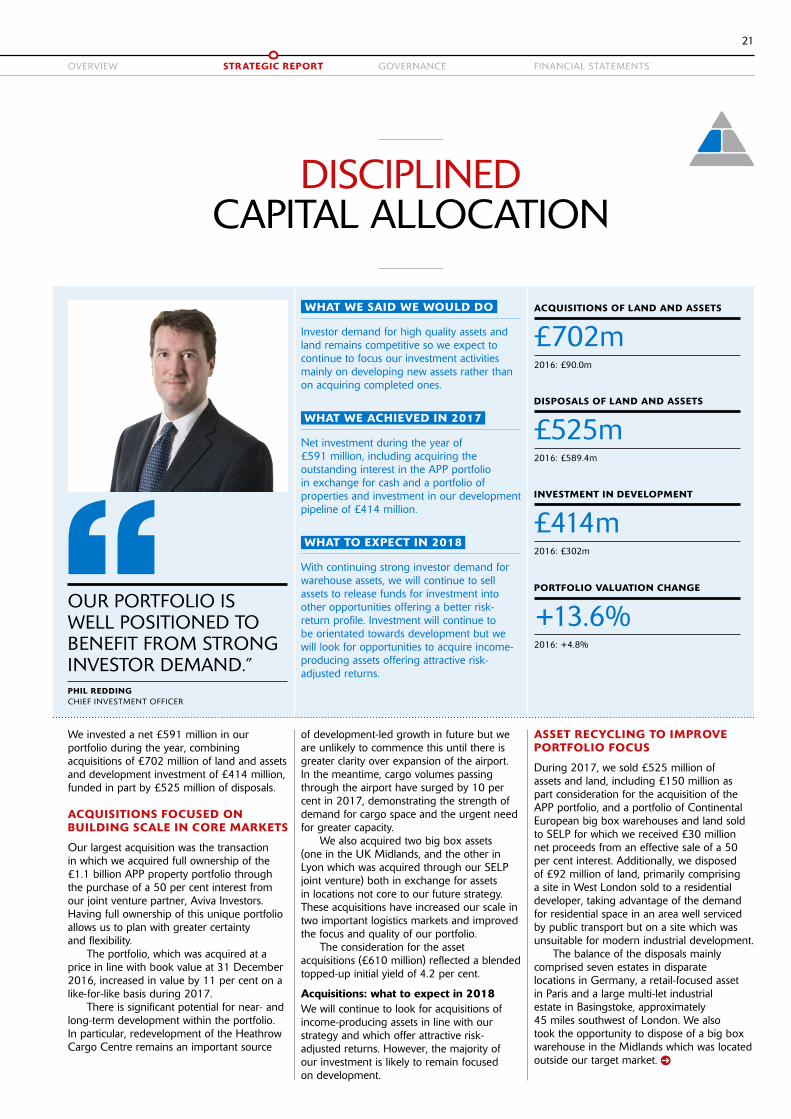
DISCIPLINED CAPITAL ALLOCATION
OUR PORTFOLIO IS WELL POSITIONED TO BENEFIT FROM STRONG INVESTOR DEMAND.”PHIL REDDINGCHIEF INVESTMENT OFFICER
We invested a net £591 million in our portfolio during the year, combining acquisitions of £702 million of land and assets and development investment of £414 million, funded in part by £525 million of disposals.
ACQUISITIONS FOCUSED ON BUILDING SCALE IN CORE MARKETS
Our largest acquisition was the transaction in which we acquired full ownership of the £1.1 billion APP property portfolio through the purchase of a 50 per cent interest from our joint venture partner, Aviva Investors. Having full ownership of this unique portfolio allows us to plan with greater certainty and flexibility.
The portfolio, which was acquired at a price in line with book value at 31 December 2016, increased in value by 11 per cent on a like-for-like basis during 2017.
There is significant potential for near- and long-term development within the portfolio. In particular, redevelopment of the Heathrow Cargo Centre remains an important source
of development-led growth in future but we are unlikely to commence this until there is greater clarity over expansion of the airport. In the meantime, cargo volumes passing through the airport have surged by 10 per cent in 2017, demonstrating the strength of demand for cargo space and the urgent need for greater capacity.
We also acquired two big box assets (one in the UK Midlands, and the other in Lyon which was acquired through our SELP joint venture) both in exchange for assets in locations not core to our future strategy. These acquisitions have increased our scale in two important logistics markets and improved the focus and quality of our portfolio.
The consideration for the asset acquisitions (£610 million) reflected a blended topped-up initial yield of 4.2 per cent.
Acquisitions: what to expect in 2018We will continue to look for acquisitions of income-producing assets in line with our strategy and which offer attractive risk-adjusted returns. However, the majority of our investment is likely to remain focused on development.
WHAT WE SAID WE WOULD DO
Investor demand for high quality assets and land remains competitive so we expect to continue to focus our investment activities mainly on developing new assets rather than on acquiring completed ones.
WHAT WE ACHIEVED IN 2017
Net investment during the year of £591 million, including acquiring the outstanding interest in the APP portfolio in exchange for cash and a portfolio of properties and investment in our development pipeline of £414 million.
WHAT TO EXPECT IN 2018
With continuing strong investor demand for warehouse assets, we will continue to sell assets to release funds for investment into other opportunities offering a better risk-return profile. Investment will continue to be orientated towards development but we will look for opportunities to acquire income-producing assets offering attractive risk-adjusted returns.
ASSET RECYCLING TO IMPROVE PORTFOLIO FOCUS
During 2017, we sold £525 million of assets and land, including £150 million as part consideration for the acquisition of the APP portfolio, and a portfolio of Continental European big box warehouses and land sold to SELP for which we received £30 million net proceeds from an effective sale of a 50 per cent interest. Additionally, we disposed of £92 million of land, primarily comprising a site in West London sold to a residential developer, taking advantage of the demand for residential space in an area well serviced by public transport but on a site which was unsuitable for modern industrial development.
The balance of the disposals mainly comprised seven estates in disparate locations in Germany, a retail-focused asset in Paris and a large multi-let industrial estate in Basingstoke, approximately 45 miles southwest of London. We also took the opportunity to dispose of a big box warehouse in the Midlands which was located outside our target market.
ACQUISITIONS OF LAND AND ASSETS
2016: £90.0m
£702m
PORTFOLIO VALUATION CHANGE
2016: +4.8%
+13.6%
DISPOSALS OF LAND AND ASSETS
2016: £589.4m
£525m
INVESTMENT IN DEVELOPMENT
2016: £302m
£414m

SEGRO PLC | ANNUAL REPORT & ACCOUNTS 2017
22
DISCIPLINED CAPITAL ALLOCATION CONTINUED
OUR STRATEGY
VALUATION GAINS FROM ASSET MANAGEMENT, DEVELOPMENT, AND MARKET-DRIVEN YIELD IMPROVEMENT
Warehouse property values across Europe increased throughout the year, accelerating in the second half, in part reflecting the sale of two large, pan-European portfolios. As a result, investment volumes across Europe, but particularly in the UK, increased sharply from the record high achieved in 2016. Investor appetite for assets in Continental Europe has been helped by the improvement in economic sentiment, the emergence of rental growth and attractive yields compared to low interest rates.
The Group’s property portfolio was valued at £8.0 billion at 31 December 2017 (£9.3 billion of assets under management). The portfolio valuation, including completed assets, land and buildings under construction, increased by 13.6 per cent on a like-for-like basis (adjusting for capital expenditure and asset recycling during the year) compared to 4.8 per cent in 2016.
We also undertook the first disposals from the SELP joint venture, selling four big box warehouse estates for €59 million, releasing funds for future investment.
These disposals, in partnership with the acquisitions, further improve the management intensity and risk profile of our portfolio, while crystallising a cumulative gain on sale of 3 per cent compared to book values at 31 December 2016.
Disposals: what to expect in 2018While investor demand for industrial properties remains strong, we will continue to recycle assets where we believe we can generate better returns from deploying our capital in other opportunities.
ACQUISITIONS COMPLETED IN 2017
Asset Type
Purchase price
(£m, SEGROshare)¹
Net initial yield (%)
Topped-up net initial yield (%)
Big box logistics 59.2 5.3 5.3
Urban warehousing 550.9 3.6 4.1
Land3 92.3 – –
Acquisitions completed in 2017 702.4 3.72 4.22
1 Excluding acquisition costs.
2 Yield excludes land transactions.
3 Land acquisitions are discussed in Future Development Pipeline.
DISPOSALS COMPLETED IN 2017
Asset Type
Disposal proceeds
(£m, SEGRO share)
Net initial yield (%)
Topped-up net initial yield (%)
Big box logistics 87.3 7.0 7.1
Light industrial 296.5 5.5 6.0
Higher value use buildings 49.3 5.3 5.3
Land 91.8 – –
Disposals completed in 2017 524.9 5.81 6.11
1 Yield excludes land transactions.
This primarily comprises a 13.2 per cent increase in the assets held throughout the year (2016: 3.4 per cent), driven by around 40 basis points of yield compression (after adjusting for the APP portfolio acquisition) and a 3.1 per cent increase in our valuer’s estimate of the market rental value of our portfolio (ERV). In total, our portfolio generated a total property return of 18.9 per cent (2016: 9.3 per cent).
Assets held throughout the year in the UK increased in value by 15.8 per cent (2016: 4.6 per cent), outperforming the MSCI-IPD UK Industrial quarterly index which increased by 13.9 per cent. The performance reflects a combination of yield compression across the portfolio and the capture of reversionary potential in lease reviews and renewals, particularly in London. The true equivalent yield applied to our UK portfolio was 5.0 per cent (31 December 2016: 5.6 per cent), while rental values improved by 3.9 per cent (2016: 4.7 per cent).
Assets held throughout the year in Continental Europe increased in value by 6.2 per cent (2016: 0.6 per cent) on a constant currency basis, reflecting a combination of yield compression to 6.0 per cent (31 December 2016: 6.6 per cent) and rental value growth of 1.2 per cent (2016: 0.3 per cent). We continue to experience little market rental value growth in our big box portfolio in Continental Europe (0.6 per cent) but rents are responding to improving demand and a lack of quality supply for our wholly-owned, urban warehouse assets where ERVs increased by 2.1 per cent.
More details of our property portfolio can be found in Note 27 to the Financial Statements and in the 2017 Property Analysis Report available at www.segro.com/investors.
Valuations: what to expect in 2018Capital growth forecasts are notoriously difficult given the multitude of drivers (particularly interest rates and credit spreads) most of which are outside our direct control.
Nevertheless, the prospects for our portfolio of big box and urban warehouses remain good, supported by structural drivers of demand and disciplined supply, and prime yields continue to appear attractive compared to government (risk-free) bond yields, enhanced by ongoing rental growth. We believe that our high quality portfolio and our focus on asset management will enable us to outperform the wider market.
UNREALISED GAINS AND LOSSESON PORTFOLIO (£ millions) AND LIKE-FOR-LIKE CHANGE (%)1
+18
.1%
£1,000m
£750m
£500m
£250m
+12
.9%
+7.
4%
+13
.6%
+2.
8%
+13
.6%
Gre
ater
Lon
don
Tham
es V
alle
y &
Nat
iona
l Log
istic
s
Nor
ther
n Eu
rope
Sout
hern
Eur
ope
Cen
tral
Eur
ope
Tota
l
1 Percentage change relates to the portfolio including completed properties, development and land.

23
OVERVIEW STRATEGIC REPORT GOVERNANCE FINANCIAL STATEMENTS
OPERATIONAL EXCELLENCE: ACTIVE ASSET MANAGEMENT
ACTIVE MANAGEMENT OF OUR PORTFOLIO HAS GENERATED STRONG OPERATING METRICS.”ANDY GULLIFORDCHIEF OPERATING OFFICER
Our portfolio comprises two main asset types: urban warehouses and big box warehouses. The demand-supply dynamics are positive, and vary by both type and geography.
Urban warehouses account for 55 per cent of our portfolio value. They are located mainly on the edges of London, Paris, Düsseldorf, Berlin and Warsaw, where land supply is restricted and there is strong demand for warehouse space, particularly catering for the needs of last mile delivery and, in Slough, from data centre users.
Big box warehouses, classed as those over 10,000 sq m in size, account for 41 per cent of our portfolio value. These are focused on the major logistics hubs and corridors in the UK (South-East and Midlands regions), France (the logistics ‘spine’ linking Lille, Paris, Lyon and Marseille), Germany (Düsseldorf, Berlin, Leipzig and Hamburg) and Poland (Warsaw, Łódz and Poznan, and the industrial region of Silesia).
We have continued to see strong occupier demand for warehouses across our markets, reflected in the 19 per cent increase in contracted rent compared to 2016. Our vacancy rate remains low, and significant lettings in our London portfolio mean that overall lettings of existing space have increased compared to last year. In addition, we have captured reversionary potential from our UK portfolio and from indexation provisions in our Continental European leases.
Data on the logistics markets in the UK (from JLL) and France (from CBRE) implies that available space continues to equate to less than one year of take-up. This supply-demand tension has manifested itself in our own experience through increased rent from pre-let agreements signed during the year as occupiers seek to secure new space in supply-constrained markets. Take-up levels across our markets were broadly in line with, or ahead of, the long-term average. Speculative development of big box warehouses remains disciplined and, indeed, lower in the UK than in 2016 reflecting perhaps heightened levels of economic and
WHAT WE SAID WE WOULD DO
We expected positive rent roll growth to be driven more by development completions than by standing assets due to the limited amount of vacancy in the portfolio.
WHAT WE ACHIEVED IN 2017
Our rent roll growth was £41.5 million reflecting a high level of customer retention and contributing to an improved vacancy rate. Development completions contributed £31 million of new headline rent.
WHAT TO EXPECT IN 2018
Occupier demand remains strong so we expect to retain a low vacancy rate and that rent roll growth will be positive. £38 million of headline rent is at risk of break or expiry in 2018 and we expect customer retention to remain high, albeit possibly not at the unusually high level of 2017.
political uncertainty. We continue to see no evidence of over-supply of space in any of our markets.
Growing rental income from letting existing space and new developmentsAt 31 December 2017, our portfolio generated passing rent of £324 million, rising to £358 million once rent free periods expire (“headline rent”). During the year, we contracted £53.5 million of new headline rent, 19 per cent higher than in 2016 (£44.9 million) and a record level for SEGRO, with particularly significant contributions from rent reviews and renewals in the UK and new pre-let agreements.
Our customer base remains well diversified, reflecting the multitude of uses of warehouse space. Our top 20 customers account for 32 per cent of total headline rent, and our largest customer, Deutsche Post DHL, accounts for 4.7 per cent.
PORTFOLIO PASSING RENT
2016: £288m
£324m
VACANCY RATE
2016: 5.7%
4.0%
RENT CONTRACTED DURING THE YEAR
2016: £44.9m
£53.5m
CUSTOMER RETENTION
2016: 75%
81%
SEGRO PLC | ANNUAL REPORT & ACCOUNTS 2017
24
OPERATIONAL EXCELLENCE: ACTIVE ASSET MANAGEMENT CONTINUED
OUR STRATEGY
Approximately half of our customers are involved in businesses affected by e-commerce, including third party logistics and parcel delivery businesses, and retailers. These businesses accounted for around 60 per cent of our take-up during the year, including Amazon which occupied almost 250,000 sq m of the Company’s space in the UK, Germany, Spain and Italy in both big box and urban warehouses.
Manufacturing companies are also increasingly important occupiers of our warehouse space, accounting for 18 per cent of our headline rent. They comprised 10 per cent of take-up during the year and included a number of companies associated with the automotive sector such as Jaguar Land Rover, Dräxlmaier and Plastic Omnium, which manufactures auto exteriors.
We monitor a number of asset management performance indicators to assess our performance:
�£ Rental growth from lease reviews and renewals. These generated an uplift of 9.5 per cent (2016: 5.4 per cent) for the portfolio as a whole compared to previous headline rent. During the year, new rents agreed at review and renewal were 12.9 per cent higher in the UK (2016: 6.4 per cent) as reversion accumulated over the past five years was reflected in new rents agreed, adding £3.5 million of headline rent. In Continental Europe, rents agreed on renewal were 0.9 per cent lower than previous headline rents (2016: 0.1 per cent lower), equating to a less than £0.1 million reduction in the rent roll, reflecting indexation provisions which have increased rents paid over recent years to above market rental levels.
�£ High levels of customer satisfaction. Although the quality and location of our portfolio is important to our customers, we believe that the service we provide is crucial to maintaining high customer retention and low vacancy. We carry out a rolling survey of our customer base throughout the year to identify and rectify issues promptly. In 2017, 87 per cent of the 293 customers participating in the surveys rated their experience as a SEGRO customer as “good” or “excellent”, up from 79 per cent in 2016.
�£ Vacancy remains low at 4.0 per cent. The vacancy at 31 December 2017 was 4.0 per cent, an improvement from 5.7 per cent at the end of 2016. Approximately 0.6 percentage points relates to recently completed speculative developments. The vacancy rate is at the lower end of our expected range of between 4 and 6 per cent. Treating short term lettings as vacancy would only increase the vacancy rate to 4.5 per cent (31 December 2016: 6.3 per cent). The average vacancy rate during the period was 5.0 per cent, broadly in line with 2016 (5.2 per cent).
�£ High retention rate of 81 per cent. During the period, space equating to £8.7 million (2016: £14.1 million) of rent was returned to us, including £1.3 million of rent lost due to insolvency (2016: £1.4 million). We took back space equating to an additional £3.3 million for redevelopment, and this is almost exclusively related to a well-located site near Heathrow Airport following DHL’s relocation to its new SEGRO facility at Poyle. Approximately £26 million of headline rent was at risk from a break or lease expiry during the period of which we retained 75 per cent in existing space, with a further 6 per cent retained but in new premises.
�£ Lease terms continue to offer attractive income security. The level of incentives agreed for new leases (excluding those on developments completed in the period) represented 6.8 per cent of the headline rent (2016: 7.3 per cent). The portfolio’s weighted average lease length increased to 7.4 years to first break and 8.9 years to expiry (31 December 2016: 7.1 years to first break, 8.7 years to expiry). Lease terms are longer in the UK (8.4 years to break) than in Continental Europe (5.7 years to break).
�£ £10 million of net new rent from existing assets. The combination of these strong metrics has enabled us to generate £13.9 million of headline rent from new leases on existing assets (2016: £14.2 million) and £4.9 million from rent reviews, lease renewals and indexation (2016: £1.9 million). This is a function of the strong demand we are experiencing for our assets and is reflected in take back of space from lease expiries and breaks which totalled £8.7 million of headline rent, £5.4 million lower than in 2016 (£14.1 million).
�£ £29 million of rent contracted from pre-let agreements (2016: £23 million). In addition to increased rents from existing assets, we contracted £28.6 million of headline rent from pre-let agreements and lettings of speculative developments prior to completion (2016: £23.4 million), of which £6 million was from supermarkets including Carrefour in France and £9 million from retailers, including Italian fashion retailer Yoox Net-a-Porter and Amazon.
�£ Rent roll growth increased to £41.5 million. An important element of achieving our goal of being a leading income-focused REIT is to grow our rent roll, primarily through increasing rent from our existing assets and then from generating new rent through development. Rent roll growth, which reflects net new headline rent from existing space (adjusted for take-backs of space for development), take-up of developments and pre-lets agreed during the period, increased to £41.5 million in 2017, from £29.7 million in 2016.
Asset Management: what to expect in 2018Occupier demand remains strong so we expect to retain a low vacancy rate and that rent roll growth will remain positive. £38 million of headline rent is at risk of break or expiry in 2018 and we expect customer retention to remain high, albeit possibly not at the unusually high level of 2017.

25
OVERVIEW STRATEGIC REPORT GOVERNANCE FINANCIAL STATEMENTS
The new equity provided through the 2016 Equity Placing and the 2017 Rights Issue has enabled us to accelerate the investment in our development pipeline. During 2017, we invested £414 million (2016: £302 million) in new developments, of which £45 million was for infrastructure, and a further £92 million in our land bank to expand our development capacity in a record year for development completions.
Many of the projects completed and in our current development pipeline are those identified at the time of the equity raises:
�£ At the time of the equity placing in September 2016, we identified projects under development or awaiting approval associated with £456 million of capital expenditure, 95 per cent of which have either completed or are in the current development pipeline.
�£ At the time of the Rights Issue in March 2017, we identified projects under development or awaiting approval requiring £165 million of capital expenditure, 70 per cent of which have either completed or are in the current development pipeline.
�£ A further £175 million of proceeds of the Rights Issue were allocated to future development on our land bank. In particular, we have committed to a phased development of SEGRO Logistics Park East Midlands Gateway, a 600,000 sq m logistics park adjacent to East Midlands Airport where, early in 2018, we secured our first pre-let for a 120,000 sq m warehouse.
See page 33 for further details of the Rights Issue.
DEVELOPMENT PROJECTS COMPLETED
We completed 654,900 sq m of new space during the period, a record level for SEGRO. These projects were 83 per cent pre-let prior to the start of construction and were 93 per cent let as at 31 December 2017, generating £24.9 million of headline rent, with a potential further £1.9 million to come when the remainder of the space is let. This translates into a yield on total development cost (including land, construction and finance costs) of 8.3 per cent when fully let.
Amongst the projects completed in the year were 576,300 sq m of big box warehouse space, which has been entirely let and 74,600 sq m of speculative urban warehouses, primarily in Continental Europe, two-thirds of which have been let.
OPERATIONAL EXCELLENCE: DEVELOPMENT ACTIVITY
WE CREATE MUCH NEEDED MODERN WAREHOUSES IN OUR MARKETS.”ANDY GULLIFORDCHIEF OPERATING OFFICER
WHAT WE SAID WE WOULD DO
We expected to invest in excess of £300 million in development during 2017, which includes both our committed pipeline and further development opportunities under discussion.
WHAT WE ACHIEVED IN 2017
We invested £414 million during the year (including £45 million on infrastructure), completing 654,900 sq m of new space, 93 per cent of which has been let.
WHAT TO EXPECT IN 2018
Occupier demand remains strong so we expect to continue the pace of development, investing in excess of £350 million during the year, with a further £50 million associated with infrastructure expenditure.
DEVELOPMENT COMPLETIONS
2016: 421,600 sq m
654,900 sq m
POTENTIAL RENT FROM FUTURE PIPELINE
2016: £128.3m
£125.4m
CURRENT PIPELINE POTENTIAL RENT
2016: £26.6m
£43.3m
CURRENT PIPELINE YIELD ON COST
2016: 7.7%
7.6%

SEGRO PLC | ANNUAL REPORT & ACCOUNTS 2017
26
OPERATIONAL EXCELLENCE: DEVELOPMENT ACTIVITY CONTINUED
OUR STRATEGY
CURRENT DEVELOPMENT PIPELINE
At 31 December 2017, we had development projects approved, contracted or under construction totalling 693,850 sq m, representing £266 million of future capital expenditure and £43.3 million of annualised gross rental income when fully let. These projects are 50 per cent pre-let (rising to 58 per cent, adjusted for lettings secured in early 2018) and should yield 7.6 per cent on total development cost when fully occupied:
�£ In the UK, we have 79,200 sq m of space approved or under construction, including two sites in East London, one of which has been pre-let to DPD. We are also continuing our rejuvenation of the Slough Trading Estate with 26,100 sq m of new space, including two new data centres, a Premier Inn hotel and a car showroom.
�£ In Continental Europe, we have 614,600 sq m of space approved or under construction. This includes a 62,700 sq m two-storey urban warehouse in Paris: we secured a pre-let for 20 per cent of the space prior to construction and, early in 2018, we secured a letting for the whole of the remaining building.
We continue to focus our speculative developments primarily on urban warehouse projects, particularly in the UK and Germany, where modern space is in short supply and occupier demand is strong. In the UK, our speculative projects are focused in East London, Enfield in North London and on the Slough Trading Estate. In Continental Europe, we continue to build scale in Germany, where projects are underway in Berlin, Frankfurt and Cologne.
Within our Continental European development programme, approximately £9.5 million of potential gross rental income is associated with big box warehouses developed outside our SELP joint venture. Under the terms of the joint venture, SELP has the option, but not the obligation, to acquire these assets shortly after completion. Assuming SELP exercises its option, we would retain a 50 per cent share of the rent after disposal. In 2017, SEGRO sold £39 million of completed assets to SELP, representing a net disposal of £19.5 million.
Further details of our completed projects and current development pipeline are available in the 2017 Property Analysis Report, which is available to download at www.segro.com/investors.
FUTURE DEVELOPMENT PIPELINE
Near-term development pipeline Within the future development pipeline are a number of pre-let projects which are close to being approved, awaiting either final conditions to be met or planning approval to be granted. We expect to commence these projects within the next six to twelve months.
These projects total just over 500,000 sq m of space, equating to approximately £236 million of additional capital expenditure and £22 million of additional rent.
Land bank Our land bank identified for future development totalled 587 hectares at 31 December 2017, equating to £401 million, or around 5 per cent of our total portfolio. We invested £92 million in acquiring new land during the year, including land sourced from the Roxhill and East Plus agreements and land associated with developments expected to start in the short term.
We estimate that our land bank, including the near-term projects above, can support 2.7 million sq m of development over the next five years. The prospective capital expenditure associated with the future pipeline is £1.2 billion. It could generate £125 million of gross rental income, representing a yield on total development cost (including land and notional finance costs) of 7.8 per cent. These figures are indicative based on our current expectations and are dependent on our ability to secure pre-let agreements, planning permissions, construction contracts and on our outlook for occupier conditions in local markets.
Land with a total value of £95 million has been identified as suited to alternative use or surplus to our short-term requirements, a reduction from £125 million at 31 December 2016, following the sale of the former Northfields industrial estate in Park Royal to a residential developer. The largest single component is a brownfield site in Hayes, West London, which was formerly a Nestlé factory. We have received conditional planning consent for the site and, on receipt of final permission, we will sell the land zoned for residential use to our partner, Barratt London, and will develop the warehouse element ourselves.
Land held under option agreements Land sites held under option agreements are not included in the figures above but together represent significant further development opportunities, primarily in the UK, including sites for urban warehousing in east London and for big box warehouses in the Midlands and South East regions.
The options are held on the balance sheet at a value of £21 million (including joint ventures at share). Those we expect to exercise over the next two to three years are for land capable of supporting just over 1.1 million sq m of space and generating £60 million of headline rent for a blended yield of approximately 7 per cent.
Development: What to expect in 2018Occupier demand remains strong so we expect to continue the pace of development, investing in excess of £350 million during the year, with a further £50 million associated with infrastructure expenditure.

27
OVERVIEW STRATEGIC REPORT GOVERNANCE FINANCIAL STATEMENTS
GREATER LONDON
OPERATIONAL REVIEW
PROVIDING MODERN SPACE IN A SUPPLY-CONSTRAINED MARKET
During the year, we took full ownership of the APP portfolio and completed 7,600 sq m of development, increasing our exposure to prime warehouse assets in and around London’s major airports, particularly Heathrow. We are still awaiting results of the consultation over the expansion of the airport but our long term plans cater for a two or a three runway scenario.
Our intensive asset management activity has resulted in an improvement in our vacancy rate to just 4.2 per cent and an increase in capital values of 17.6 per cent.
WE HAVE INCREASED OUR PRESENCE IN LONDON, PARTICULARLY NEAR HEATHROW AND IN THE EAST.”ALAN HOLLANDBUSINESS UNIT DIRECTOR – GREATER LONDON
1. London Airports 20%
2. Park Royal 15%
3. Rest of London 5%
4. Rest of SEGRO 60%
Total 100%
PORTFOLIO BY VALUE
1. Transport & Logistics 24%
2. Post & Parcel Delivery 17%
3. Manufacturing 16%
4. Retail 13%
5. Services & Utilities 9%
6. Wholesale & Retail Distribution
7%
7. Tech, Media, Telecoms 5%
8. Other 9%
Total 100%
CUSTOMER SPLIT BY TYPE
Operating summary of the year
££ Low vacancy rate, with rental levels increasing reflecting strong demand and limited supply.
££ We have secured increased rental income through lease reviews and renewals, generating a 19.6 per cent uplift (equating to over £3 million of headline rent) compared to previous rents.
££ Completed 7,600 sq m of developments, close to Heathrow Airport, with 22,000 sq m of new development in East London due for completion early in 2018.
Opportunities for the year ahead
££ 46,600 sq m of new urban warehouses under construction primarily in East and North London.
Risks for the year ahead
££ Land prices may rise above levels at which industrial development becomes viable, limiting our ability to extend the development pipeline.
££ The uncertainty associated with the UK’s decision to exit the EU may impact the strength of occupier demand for warehouse space in London and our appetite for speculative development. See page 59 for more detail on Brexit risk.
CAPITAL VALUE AND RENTAL VALUE GROWTH1
6.4%
17.6
%
6.3%
4.6%
2017 2016 20172016Capital value Rental value
VACANCY RATE2
5.4%
5.8%
4.2%
2017
2015
2016
1
2
34
1
2
34
5
6
78
1 Based on properties held throughout the year.
2 Based on completed properties.
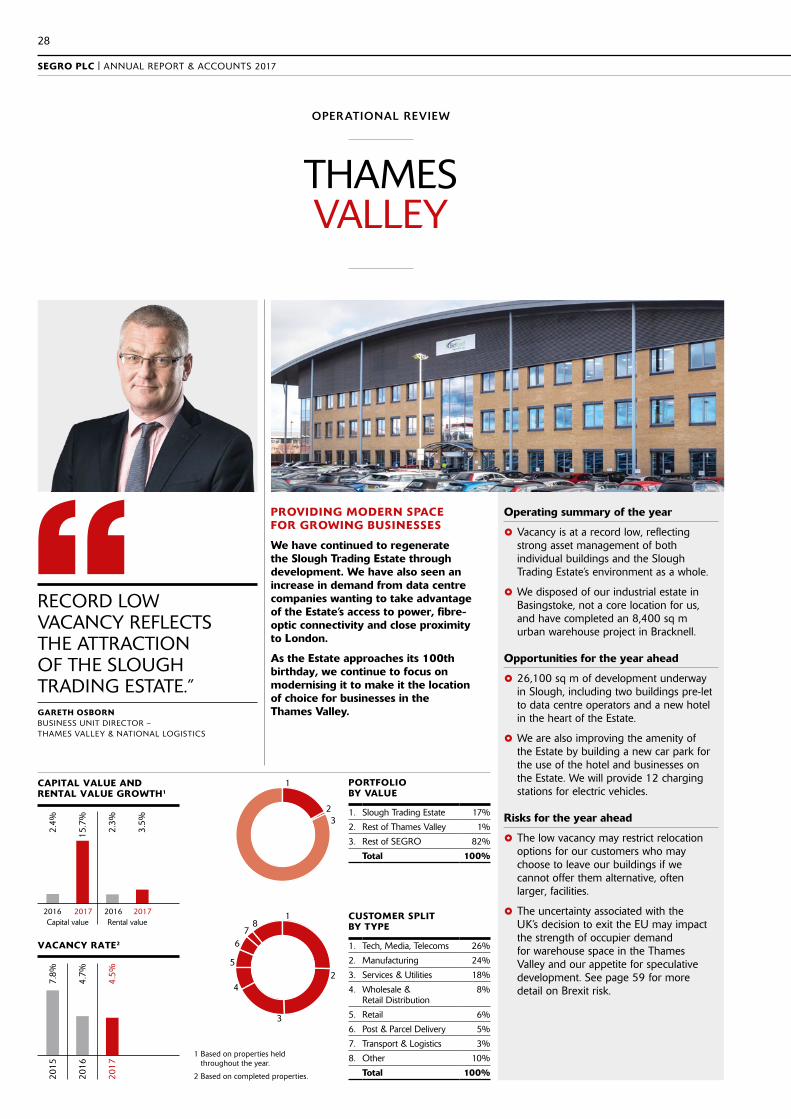
SEGRO PLC | ANNUAL REPORT & ACCOUNTS 2017
28
THAMES VALLEY
OPERATIONAL REVIEW
PROVIDING MODERN SPACE FOR GROWING BUSINESSES
We have continued to regenerate the Slough Trading Estate through development. We have also seen an increase in demand from data centre companies wanting to take advantage of the Estate’s access to power, fibre-optic connectivity and close proximity to London.
As the Estate approaches its 100th birthday, we continue to focus on modernising it to make it the location of choice for businesses in the Thames Valley.
RECORD LOW VACANCY REFLECTS THE ATTRACTION OF THE SLOUGH TRADING ESTATE.”GARETH OSBORNBUSINESS UNIT DIRECTOR – THAMES VALLEY & NATIONAL LOGISTICS
1. Slough Trading Estate 17%
2. Rest of Thames Valley 1%
3. Rest of SEGRO 82%
Total 100%
PORTFOLIO BY VALUE
1. Tech, Media, Telecoms 26%
2. Manufacturing 24%
3. Services & Utilities 18%
4. Wholesale & Retail Distribution
8%
5. Retail 6%
6. Post & Parcel Delivery 5%
7. Transport & Logistics 3%
8. Other 10%
Total 100%
CUSTOMER SPLIT BY TYPE
Operating summary of the year
££ Vacancy is at a record low, reflecting strong asset management of both individual buildings and the Slough Trading Estate’s environment as a whole.
££ We disposed of our industrial estate in Basingstoke, not a core location for us, and have completed an 8,400 sq m urban warehouse project in Bracknell.
Opportunities for the year ahead
££ 26,100 sq m of development underway in Slough, including two buildings pre-let to data centre operators and a new hotel in the heart of the Estate.
££ We are also improving the amenity of the Estate by building a new car park for the use of the hotel and businesses on the Estate. We will provide 12 charging stations for electric vehicles.
Risks for the year ahead
££ The low vacancy may restrict relocation options for our customers who may choose to leave our buildings if we cannot offer them alternative, often larger, facilities.
££ The uncertainty associated with the UK’s decision to exit the EU may impact the strength of occupier demand for warehouse space in the Thames Valley and our appetite for speculative development. See page 59 for more detail on Brexit risk.
CAPITAL VALUE AND RENTAL VALUE GROWTH1
2.4%
15.7
%
2.3%
3.5%
2017 2016 20172016Capital value Rental value
VACANCY RATE2
7.8%
4.7%
4.5%
2017
2015
2016
1
23
1
2
3
4
5
67
8
1 Based on properties held throughout the year.
2 Based on completed properties.

29
OVERVIEW STRATEGIC REPORT GOVERNANCE FINANCIAL STATEMENTS
UK BIG BOX LOGISTICS WAREHOUSES
FACILITATING EFFICIENT RETAILER AND MANUFACTURER SUPPLY CHAINS AND PARCEL DELIVERY
We leased the final two units at SEGRO Logistics Park Rugby Gateway meaning that our first SEGRO-developed big box park in the UK is now fully let.
At SEGRO Logistics Park East Midlands Gateway (SLPEMG), we spent 2017 preparing the site for development. Early in 2018, we secured our first pre-let which means we will commence development later in the year.
MODERN BIG BOX WAREHOUSES ARE INCREASINGLY IMPORTANT TO EFFICIENT SUPPLY CHAINS.”GARETH OSBORNBUSINESS UNIT DIRECTOR – THAMES VALLEY & NATIONAL LOGISTICS
1. Midlands 8%
2. South East 5%
3. Rest of SEGRO 87%
Total 100%
PORTFOLIO BY VALUE3
1. Transport & Logistics 34%
2. Retail 27%
3. Post & Parcel Delivery 14%
4. Manufacturing 10%
5. Wholesale & Retail Distribution
15%
Total 100%
CUSTOMER SPLIT BY TYPE
Operating summary of the year
££ Lettings of 44,000 sq m across two units in Rugby to Amazon and DHL added almost £3 million to SEGRO’s rent roll and reduced our UK big box warehouse vacancy rate to less than 5 per cent.
££ We invested £44 million in infrastructure works at SLPEMG, and the site is now ready for the first phase of development.
Opportunities for the year ahead
££ We have one remaining empty warehouse, in Magna Park, and letting this is a priority for 2018.
££ Having secured our first customer at SLPEMG, we will be working hard to secure further pre-lets.
££ We are also working on a number of other big box warehouse sites as part of our partnership with Roxhill.
Risks for the year ahead
££ Speculative development of big box warehouses in the UK may increase: if levels of supply are greater than demand, rents can fall. However, access to suitable development land is limited and availability of built space in our markets is still well below historic levels and current take-up.
££ The uncertainty associated with the UK’s decision to exit the EU may impact the strength of occupier demand for big box warehouse space. See page 59 for more detail on Brexit risk.
CAPITAL VALUE AND RENTAL VALUE GROWTH1
2.1%
8.0%
3.4%
1.8%
2017 2016 20172016Capital value Rental value
VACANCY RATE2
0%
9.1%
4.9%
2017
2015
2016
12
3
1
23
4
5
1 Based on properties held throughout the year.
2 Based on completed properties.
3 c2% of portfolio in Greater London Business Unit.

SEGRO PLC | ANNUAL REPORT & ACCOUNTS 2017
30
NORTHERN EUROPE (GERMANY, NETHERLANDS, BELGIUM AND AUSTRIA)
OPERATIONAL REVIEW
DELIVERING QUALITY BIG BOX AND URBAN WAREHOUSES IN MAJOR CITIES
SEGRO’s urban warehouse assets and developments are increasingly in demand as Germany’s economy continues its growth trajectory.
We have increased our scale and geographical footprint in both urban and big box warehouses to take advantage of the demand created by economic growth but also by the increasing importance of e-commerce.
WE HAVE INCREASED OUR EXPOSURE TO URBAN WAREHOUSES IN GERMANY’S MAJOR CITIES.”ANDREAS FLEISCHERBUSINESS UNIT DIRECTOR – NORTHERN EUROPE
1. Germany 10%
2. Netherlands 1%
3. Belgium & Austria 1%
4. Rest of SEGRO 88%
Total 100%
PORTFOLIO BY VALUE
1. Transport & Logistics 41%
2. Manufacturing 22%
3. Retail 9%
4. Post & Parcel Delivery 9%
5. Wholesale & Retail Distribution
6%
6. Services & Utilities 4%
7. Tech, Media & Telecoms 4%
8. Other 5%
Total 100%
CUSTOMER SPLIT BY TYPE
Operating summary of the year
££ Our vacancy rate, at under 3 per cent, reflects the level of demand for our buildings and the active asset management of our portfolio.
££ We completed 122,500 sq m of development, one of our busiest ever years. These buildings are fully let and include new urban warehouses in Düsseldorf, Munich, Frankfurt, Berlin and Stuttgart.
Opportunities for the year ahead
££ We are taking advantage of rising rental values for modern urban warehousing in Germany by devoting a significant proportion of new development investment into this area.
££ We are building new big box warehouse space in areas of particularly short supply in Munich and in the Rhine-Rühr region of Germany.
Risks for the year ahead
££ Uncertainty from the inconclusive general election in 2017 may affect occupier demand as potential customers delay decisions on taking new space.
CAPITAL VALUE AND RENTAL VALUE GROWTH1
0.5%
6.5%
0.7%
1.5%
2017 2016 20172016Capital value Rental value
VACANCY RATE2
4.3%
4.1%
2.8%
2017
2015
2016
123
4
1
2
3
4
5
67 8
1 Based on properties held throughout the year.
2 Based on completed properties.
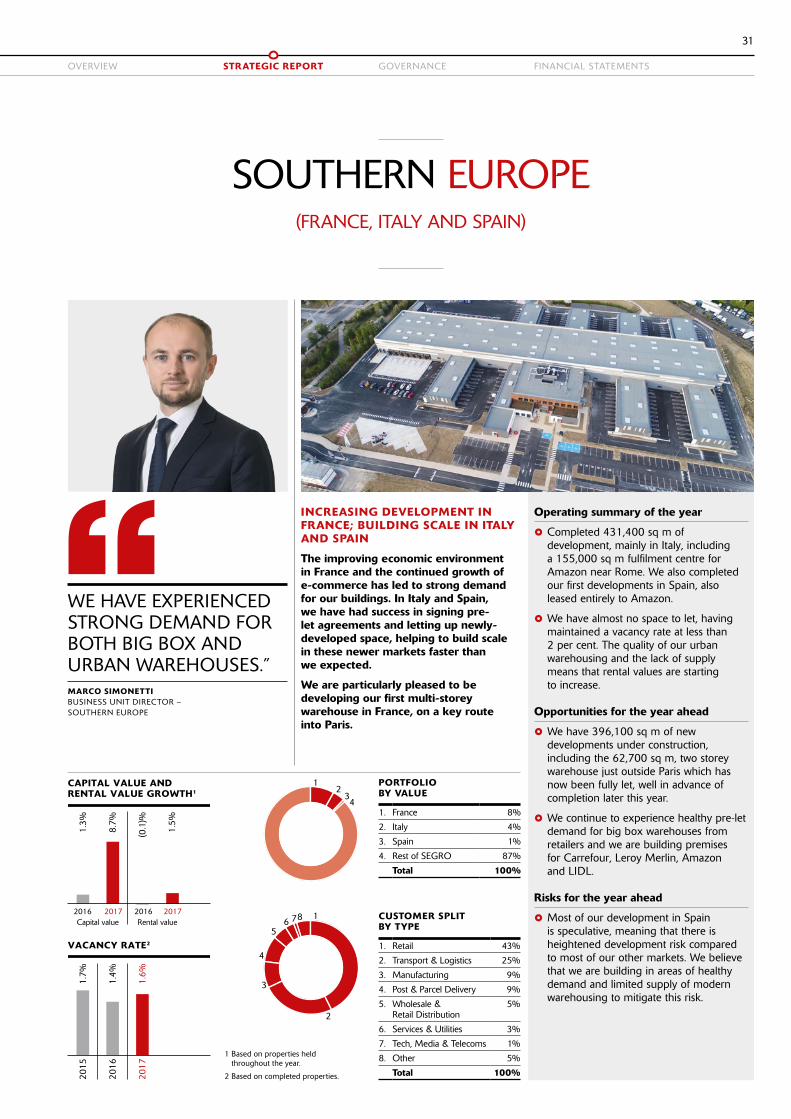
31
OVERVIEW STRATEGIC REPORT GOVERNANCE FINANCIAL STATEMENTS
SOUTHERN EUROPE (FRANCE, ITALY AND SPAIN)
INCREASING DEVELOPMENT IN FRANCE; BUILDING SCALE IN ITALY AND SPAIN
The improving economic environment in France and the continued growth of e-commerce has led to strong demand for our buildings. In Italy and Spain, we have had success in signing pre-let agreements and letting up newly-developed space, helping to build scale in these newer markets faster than we expected.
We are particularly pleased to be developing our first multi-storey warehouse in France, on a key route into Paris.
WE HAVE EXPERIENCED STRONG DEMAND FOR BOTH BIG BOX AND URBAN WAREHOUSES.”MARCO SIMONETTIBUSINESS UNIT DIRECTOR – SOUTHERN EUROPE
1. France 8%
2. Italy 4%
3. Spain 1%
4. Rest of SEGRO 87%
Total 100%
PORTFOLIO BY VALUE
1. Retail 43%
2. Transport & Logistics 25%
3. Manufacturing 9%
4. Post & Parcel Delivery 9%
5. Wholesale & Retail Distribution
5%
6. Services & Utilities 3%
7. Tech, Media & Telecoms 1%
8. Other 5%
Total 100%
CUSTOMER SPLIT BY TYPE
Operating summary of the year
££ Completed 431,400 sq m of development, mainly in Italy, including a 155,000 sq m fulfilment centre for Amazon near Rome. We also completed our first developments in Spain, also leased entirely to Amazon.
££ We have almost no space to let, having maintained a vacancy rate at less than 2 per cent. The quality of our urban warehousing and the lack of supply means that rental values are starting to increase.
Opportunities for the year ahead
££ We have 396,100 sq m of new developments under construction, including the 62,700 sq m, two storey warehouse just outside Paris which has now been fully let, well in advance of completion later this year.
££ We continue to experience healthy pre-let demand for big box warehouses from retailers and we are building premises for Carrefour, Leroy Merlin, Amazon and LIDL.
Risks for the year ahead
££ Most of our development in Spain is speculative, meaning that there is heightened development risk compared to most of our other markets. We believe that we are building in areas of healthy demand and limited supply of modern warehousing to mitigate this risk.
CAPITAL VALUE AND RENTAL VALUE GROWTH1
1.3%
8.7%
(0.1
)%
1.5%
2017 2016 20172016Capital value Rental value
VACANCY RATE2
1.7%
1.4%
1.6%
2017
2015
2016
12
34
1
2
3
4
56 78
1 Based on properties held throughout the year.
2 Based on completed properties.

SEGRO PLC | ANNUAL REPORT & ACCOUNTS 2017
32
MAKING PROGRESS IN A COMPETITIVE MARKET
Poland is an important logistics market for Europe as a whole. While this means that occupier demand has been strong, competition amongst big box warehouse owners and developers is keen.
Our portfolio is of a very high quality and is well occupied with a diverse range of customers but we have reduced our big box development activity, preferring to focus on growing our exposure to urban warehousing in Warsaw where there is less competition and higher barriers to entry.
POLAND’S MARKET IS COMPETITIVE BUT DEMAND FOR HIGH QUALITY WAREHOUSES REMAINS HEALTHY.”MAGDALENA SZULCBUSINESS UNIT DIRECTOR – CENTRAL EUROPE
1. Poland 5%
2. Czech Republic 1%
3. Rest of SEGRO 94%
Total 100%
PORTFOLIO BY VALUE
1. Manufacturing 31%
2. Retail 22%
3. Wholesale & Retail Distribution
17%
4. Transport & Logistics 15%
5. Tech, Media & Telecoms 5%
6. Post & Parcel Delivery 3%
7. Services & Utilities 3%
8. Other 4%
Total 100%
CUSTOMER SPLIT BY TYPE
Operating summary of the year
££ Our vacancy rate improved in 2017 reflecting active management of our portfolio. We have had particular success in letting up our warehousing in and around Warsaw and Prague where demand for space close to the cities has been strong.
££ Completed 81,000 sq m of new warehouses, 91 per cent of which were pre-let, including over 10,000 sq m at our logistics park next to Prague’s international airport.
Opportunities for the year ahead
££ 11,700 sq m of pre-let space under development, including an urban distribution facility for third party logistics firm DSV just outside Warsaw.
££ Occupier demand remains healthy in Poland and the Czech Republic and we have almost 100,000 sq m of pre-let discussions underway for big box and urban warehouse space.
Risks for the year ahead
££ Competition for customers in Poland remains strong, particularly from trader-developers, which may impact the potential for rental growth.
CENTRAL EUROPE (POLAND AND CZECH REPUBLIC)
OPERATIONAL REVIEW
CAPITAL VALUE AND RENTAL VALUE GROWTH1
0.0%
2.1%
0.2%
0.3%
2017 2016 20172016Capital value Rental value
VACANCY RATE2
4.3%
6.4%
4.8%
2017
2015
2016
1 23
1
2
3
4
56 7 8
1 Based on properties held throughout the year.
2 Based on completed properties.

33
OVERVIEW STRATEGIC REPORT GOVERNANCE FINANCIAL STATEMENTS
EFFICIENT CAPITAL STRUCTURE, STRONG OPERATING RESULT
FINANCE REVIEW
WE HAVE TAKEN ACTION TO FURTHER STRENGTHEN OUR CAPITAL STRUCTURE.”SOUMEN DASCHIEF FINANCIAL OFFICER
During the year, we have significantly restructured SEGRO’s capital position. The cost and efficiency of our borrowings have both been improved through refinancing secured and expensive legacy debt, and our capital structure has been strengthened through raising £573 million of new equity in the March Rights Issue. Both have also given us extensive capacity to invest in development and acquisition opportunities without over-stretching the balance sheet.
ADJUSTED PROFIT BEFORE TAX
2016: £154.5m
£194.2m
LOOK-THROUGH LOAN TO VALUE RATIO
2016: 33%
30%
IFRS PROFIT BEFORE TAX
2016: £426.4m
£976.3m
NEW FINANCING DURING THE YEAR
DEBT: £2.1bn EQUITY: £0.6bn
£2.7bn
WHAT WE SAID WE WOULD DO
We intend to keep our LTV below our mid-cycle target of 40 per cent.
WHAT WE ACHIEVED IN 2017
Through a combination of asset disposals and the Rights Issue in March 2017, as well as the increase in value of our portfolio, the LTV at 31 December 2017 is 30 per cent. Through extensive restructuring of our borrowings, we have cut the average cost of debt to 2.1 per cent.
WHAT TO EXPECT IN 2018
We intend to maintain our LTV at between 30 and 35 per cent, comfortably below our mid-cycle target of 40 per cent. We believe this ensures significant headroom to our tightest gearing covenant should property values decline, as well as providing the flexibility to take advantage of investment opportunities which may arise. We have cash and available facilities of £1.3 billion (including our share of joint ventures) on which we can draw to fund our investment plans.
FINANCIAL POSITION AND FUNDING
31 December 2017 31 December 2016
SEGRO Group
SEGRO Group
and JV’sat share
SEGRO Group
SEGRO Group
and JV’s at share
Net borrowings (£m) 1,954.2 2,397.7 1,598.4 2,091.0
Available cash and undrawn facilities (£m) 1,192.2 1,303.6 566.9 683.1
Balance sheet gearing (%) 35 N/A 38 N/A
Loan to value ratio (%) 29 30 34 33
Weighted average cost of debt1 (%) 2.3 2.1 3.9 3.4
Interest cover2 (times) 3.4 3.9 2.4 2.9
Average duration of debt (years) 11.7 10.8 6.5 6.2
1 Based on gross debt, excluding commitment fees and amortised costs.
2 Net rental income/Adjusted net finance costs (before capitalisation).
At 31 December 2017, the Group’s net borrowings (including the Group’s share of borrowings in joint ventures) were £2,397.7 million (31 December 2016: £2,091.0 million), at a weighted average cost of 2.1 per cent and an average duration of 10.8 years. The Company’s loan to value ratio (including joint ventures at share) was 30 per cent (31 December 2016: 33 per cent) and it had £1,192.2 million of cash and undrawn facilities available for investment.

SEGRO PLC | ANNUAL REPORT & ACCOUNTS 2017
34
EFFICIENT CAPITAL STRUCTURE, STRONG OPERATING RESULT CONTINUED
FINANCE REVIEW
Rights Issue and APP acquisitionIn March 2017, after assessing the impact on our balance sheet of funding the acquisition of the APP portfolio and our future development plans, the Board resolved to issue new equity through a fully underwritten Rights Issue. The Rights Issue raised gross proceeds of £573 million (net proceeds of £557 million) through the issue of 166.0 million new shares, reflecting one new share for every five shares in issue at a price of 345 pence per share. The net proceeds of the Rights Issue were allocated to funding the APP portfolio acquisition (£216 million), with the balance to be used to fund future development capital expenditure (see page 25 for details of development capital expenditure).
Rights Issues are structured as the issue of shares at a discount to the prevailing market price, with all shareholders having a right to participate. As a result of these two key elements, per share metrics in prior periods are required by IFRS accounting standards to be divided by a “bonus adjustment factor” (in our case 1.046) to ensure that the history is comparable. For example, the reported 2016 adjusted earnings per share were 19.7 pence, the dividend per share was 16.4 pence and the EPRA NAV per share was 500 pence. By applying the bonus adjustment factor, these become 18.8 pence, 15.7 pence and 478 pence respectively.
The consideration paid to Aviva for its 50 per cent share of the APP portfolio was calculated with reference to its valuation of £1.1 billion at 31 December 2016. This was adjusted for debt secured against the assets of £390 million and other small movements post year-end, valuing its 50 per cent interest at £365 million, which was satisfied by the
disposal to Aviva of £149 million of property assets and £216 million of cash funded by the Rights Issue.
The impact of the acquisition of the APP portfolio on our LTV ratio, if we had financed it with debt, would have been to increase it from 33 per cent as at 31 December 2016 to 37 per cent. Based on our expected development capital expenditure of in excess of £300 million at the time, the LTV would have increased further to a level we judged to be too high. By applying the proceeds of the Rights Issue, the LTV fell to a pro forma 28.5 per cent, providing us with sufficient capacity to fund our foreseeable development plans.
Debt refinancingDuring 2017, we have taken advantage of favourable financing conditions to improve the efficiency and duration of the borrowings in both the Group and SELP. In three transactions, we issued a total of £1.77 billion of new debt with an average maturity of 12.6 years and average coupon of 2.1 per cent, and also increased our bank facilities by £388 million. This, combined with associated derivative transactions, has increased SEGRO’s debt maturity to 10.8 years (31 December 2016: 6.2 years) and reduced the average cost of debt to 2.1 per cent (31 December 2016: 3.4 per cent). The refinancing activity has enabled the Group to repay approximately £1.3 billion more expensive, less flexible, shorter term debt for a cost of approximately £145 million.
££ In May 2017, SEGRO undertook a debut euro denominated transaction, issuing €650 million of US Private Placement notes across three tranches with an average maturity of 11.2 years and an average coupon of 1.9 per cent. The proceeds were
used to repay a £200 million 5.5 per cent June 2018 maturity sterling bond and £390 million of secured debt that was acquired as part of the APP transaction.
££ In October 2017, the Group entered the sterling bond markets for the first time since 2009. We undertook a sterling liability management exercise to repurchase £550 million of high coupon (6.7 per cent average) sterling bonds for a total cost of £677 million, and issued two new long sterling dated bonds: £350 million 12 year at a coupon of 2.375 per cent and £400 million 20 year at a coupon of 2.875 per cent.
££ In November 2017, SELP issued a second €500 million, eight year unsecured bond at a coupon of 1.5 per cent. The proceeds were used to repay the majority of SELP’s remaining secured financing and provide additional liquidity to the venture.
££ In December 2017, the Group increased its revolving credit facility commitments by €438 million to €1,218 million.
Following these transactions, gross borrowings of SEGRO Group were £2,063.5 million at 31 December, all but £3.6 million of which were unsecured, and cash and cash equivalent balances were £109.3 million. SEGRO’s share of gross borrowings in its joint venture was £463.5 million (all of which were advanced on a non-recourse basis to SEGRO) and cash and cash equivalent balances of £20.0 million.
Funds available to SEGRO (excluding cash and undrawn facilities held in joint ventures) at 31 December 2017 totalled £1,192.2 million, comprising £109.3 million of cash and short-term investments and £1,082.9 million of undrawn bank facilities provided by the Group’s relationship banks, of which only £5 million was uncommitted. Cash and cash equivalent balances, together with the Group’s interest rate and foreign exchange derivatives portfolio, are spread amongst a strong group of banks, all of which have a credit rating of A– or better.
MONITORING AND MITIGATING FINANCIAL RISK
As explained in the Risks section on page 54 of this Annual Report, the Group monitors a number of financial metrics to assess the level of financial risk being taken and to mitigate that risk.
DEBT PROFILE (£m)
2018
2019
2020
2021
2022
2023
2024
1,015.939.1
394.6
101.1
26.061.9249.1
79.3
218.9
81.6
218.5
353.2
132.4346.0
88.3
198.4
2025
2026
2027
2028
2029
2030
2031
2032
2033
2034
2035
2036
2037
SEGRO bonds SEGRO PP notes SEGRO undrawn JV debt at share

35
OVERVIEW STRATEGIC REPORT GOVERNANCE FINANCIAL STATEMENTS
Treasury policies and governanceThe Group Treasury function operates within a formal policy covering all aspects of treasury activity, including funding, counterparty exposure and management of interest rate, currency and liquidity risks. Group Treasury reports on compliance with these policies on a quarterly basis and policies are reviewed regularly by the Board.
Gearing and financial covenantsThe key leverage metric for SEGRO is its loan to value ratio (LTV) which incorporates assets and net debt on SEGRO’s balance sheet and SEGRO’s share of assets and net debt on the balance sheets of its joint ventures. The LTV at 31 December 2017 on this ‘look-through’ basis was 30 per cent.
Our borrowings contain gearing covenants based on Group net debt and net asset value, excluding debt in joint ventures. The gearing ratio of the Group at 31 December 2017, as defined within the principal debt funding arrangements of the Group, was 35 per cent (31 December 2016: 38 per cent). This is significantly lower than the Group’s tightest financial gearing covenant within these debt facilities of 160 per cent.
Property valuations would need to fall by around 55 per cent from their 31 December 2017 values to reach the gearing covenant threshold of 160 per cent. A 55 per cent fall in property values would equate to an LTV ratio of approximately 66 per cent.
The Group’s other key financial covenant within its principal debt funding arrangements is interest cover, requiring that net interest before capitalisation be covered at least 1.25 times by net property rental income. At 31 December 2017, the Group comfortably met this ratio at 3.4 times. On a look-through basis, including joint ventures, this ratio was 3.9 times.
We mitigate the risk of over-gearing the Company and breaching debt covenants by carefully monitoring the impact of investment decisions on our LTV and by stress-testing our balance sheet to potential changes in property values. As explained above, we took the decision to raise equity in March after assessing the impact on our leverage of the acquisition of the remainder of the APP portfolio and our future development plans. We also expect to continue to recycle assets to part fund future investment.
Our intention for the foreseeable future is to maintain our LTV at between 30 and 35 per cent, lower than our mid-cycle target
of 40 per cent. This provides the flexibility to take advantage of investment opportunities arising and ensures significant headroom compared to our tightest gearing covenants should property values decline.
At 31 December 2017, there were no debt maturities falling due within 12 months and the weighted average maturity of the gross borrowings of the Group (including joint ventures at share) was 10.8 years. With a majority of the Group’s bank debt facilities not due to mature until 2022, and no debt maturities in 2018, this long average debt maturity translates into a favourable, well spread debt funding maturity profile which reduces future refinancing risk.
Interest rate riskThe Group’s interest rate risk policy is designed to ensure that we limit our exposure to volatility in interest rates. The policy states that between 50 and 100 per cent of net borrowings (including the Group’s share of borrowings in joint ventures) should be at fixed or capped rates, including the impact of derivative financial instruments.
At 31 December 2017, including the impact of derivative instruments, 79 per cent (2016: 80 per cent) of the net borrowings of the Group (including the Group’s share of borrowings within joint ventures) were at fixed or capped rates.
As a result of the fixed rate cover in place, if short-term interest rates had been 1 per cent higher throughout the year to 31 December 2017, the adjusted net finance cost of the Group would have increased by approximately £5.8 million representing around 3 per cent of Adjusted profit after tax.
The Group elects not to hedge account its interest rate derivatives portfolio. Therefore, movements in its fair value are taken to the income statement but, in accordance with EPRA Best Practices Recommendations Guidelines, these gains and losses are eliminated from Adjusted profit after tax.
Foreign currency translation riskThe Group has negligible transactional foreign currency exposure, but does have a potentially significant currency translation exposure arising on the conversion of its substantial foreign currency denominated assets (mainly euro) and euro denominated earnings into sterling in the Group consolidated accounts.
The Group seeks to limit its exposure to volatility in foreign exchange rates by hedging between 50 and 100 per cent of
its foreign currency gross assets through either borrowings or derivative instruments. At 31 December 2017, the Group had gross foreign currency assets which were 69 per cent hedged by gross foreign currency denominated liabilities (including the impact of derivative financial instruments).
Including the impact of forward foreign exchange and currency swap contracts used to hedge foreign currency denominated net assets, if the value of the other currencies in which the Group operates at 31 December 2017 weakened by 10 per cent against sterling (€1.24, in the case of euros), net assets would have decreased by approximately £65 million and there would have been a reduction in gearing of approximately 1.7 per cent and in the LTV of 1.3 per cent.
The average exchange rate used to translate euro denominated earnings generated during 2017 into sterling within the consolidated income statement of the Group was €1.14:£1. Based on the hedging position at 31 December 2017, and assuming that this position had applied throughout 2017, if the euro had been 10 per cent weaker than the average exchange rate (€1.25:£1), Adjusted profit after tax for the year would have been approximately £6.7 million (3.4 per cent) lower than reported. If it had been 10 per cent stronger, Adjusted profit after tax for the year would have been approximately £8.2 million (4.2 per cent) higher than reported.
GOING CONCERN
As noted in the Financial Position and Funding section, the Group has a strong liquidity position, a favourable debt maturity profile and substantial headroom against financial covenants. Accordingly, it can reasonably expect to continue to have good access to capital markets and other sources of funding.
Having made enquiries and having considered the principal risks facing the Group, including liquidity and solvency risks, and material uncertainties, the Directors have a reasonable expectation that the Company and the Group have adequate resources to continue in operational existence for the foreseeable future (a period of at least 12 months from the date of approval of the Financial Statements). Accordingly, they continue to adopt the going concern basis in preparing the Annual Report.
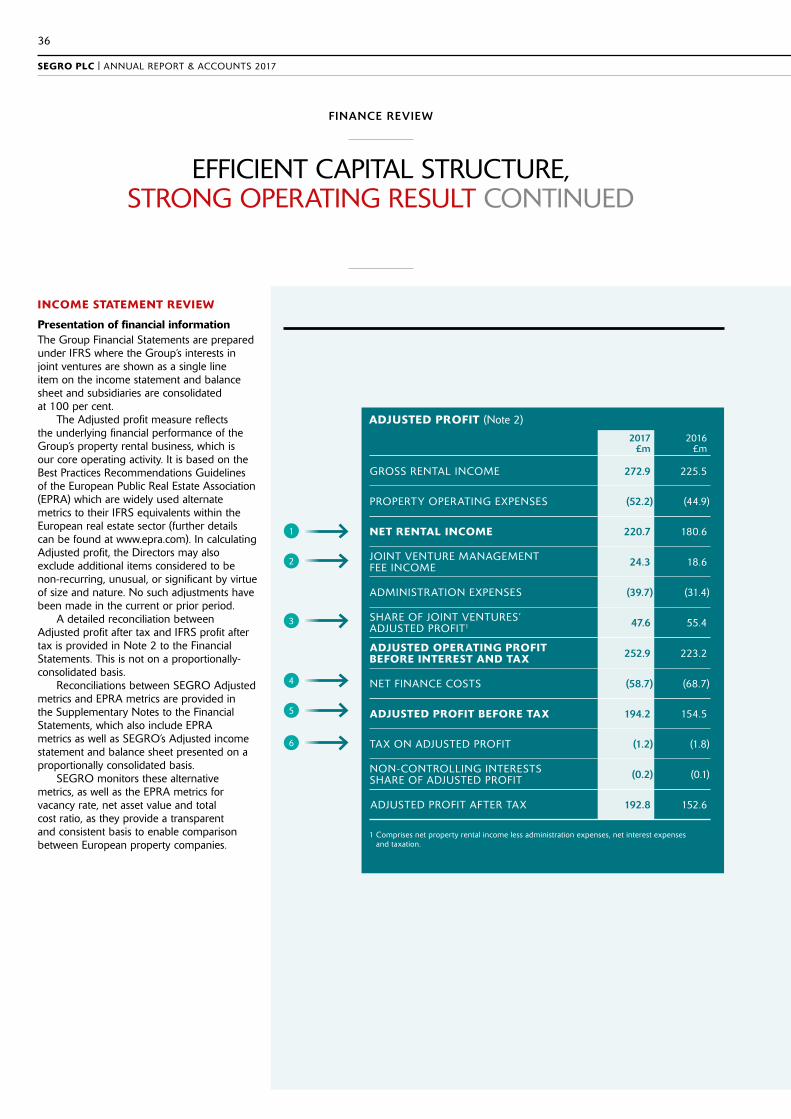
SEGRO PLC | ANNUAL REPORT & ACCOUNTS 2017
36
ADJUSTED PROFIT (Note 2)
2017 £m
2016 £m
GROSS RENTAL INCOME 272.9 225.5
PROPERTY OPERATING EXPENSES (52.2) (44.9)
NET RENTAL INCOME 220.7 180.6
JOINT VENTURE MANAGEMENT FEE INCOME 24.3 18.6
ADMINISTRATION EXPENSES (39.7) (31.4)
SHARE OF JOINT VENTURES’ ADJUSTED PROFIT1 47.6 55.4
ADJUSTED OPERATING PROFIT BEFORE INTEREST AND TAX 252.9 223.2
NET FINANCE COSTS (58.7) (68.7)
ADJUSTED PROFIT BEFORE TAX 194.2 154.5
TAX ON ADJUSTED PROFIT (1.2) (1.8)
NON-CONTROLLING INTERESTS SHARE OF ADJUSTED PROFIT (0.2) (0.1)
ADJUSTED PROFIT AFTER TAX 192.8 152.6
1 Comprises net property rental income less administration expenses, net interest expenses and taxation.
1
2
3
4
5
6
EFFICIENT CAPITAL STRUCTURE, STRONG OPERATING RESULT CONTINUED
FINANCE REVIEW
INCOME STATEMENT REVIEW
Presentation of financial information The Group Financial Statements are prepared under IFRS where the Group’s interests in joint ventures are shown as a single line item on the income statement and balance sheet and subsidiaries are consolidated at 100 per cent.
The Adjusted profit measure reflects the underlying financial performance of the Group’s property rental business, which is our core operating activity. It is based on the Best Practices Recommendations Guidelines of the European Public Real Estate Association (EPRA) which are widely used alternate metrics to their IFRS equivalents within the European real estate sector (further details can be found at www.epra.com). In calculating Adjusted profit, the Directors may also exclude additional items considered to be non-recurring, unusual, or significant by virtue of size and nature. No such adjustments have been made in the current or prior period.
A detailed reconciliation between Adjusted profit after tax and IFRS profit after tax is provided in Note 2 to the Financial Statements. This is not on a proportionally-consolidated basis.
Reconciliations between SEGRO Adjusted metrics and EPRA metrics are provided in the Supplementary Notes to the Financial Statements, which also include EPRA metrics as well as SEGRO’s Adjusted income statement and balance sheet presented on a proportionally consolidated basis.
SEGRO monitors these alternative metrics, as well as the EPRA metrics for vacancy rate, net asset value and total cost ratio, as they provide a transparent and consistent basis to enable comparison between European property companies.

37
OVERVIEW STRATEGIC REPORT GOVERNANCE FINANCIAL STATEMENTS
1 The like-for-like rental growth metric is based on properties held throughout both 2017 and 2016 on a proportionally consolidated basis. This provides details of underlying rental income growth excluding the distortive impact of acquisitions, disposals and development completions. Where an asset has been sold into a joint venture (transfers into SELP, for example) the 50 per cent share owned throughout the period is included in like-for-like calculation, with the balance shown as disposals. Similarly the APP assets have been treated as 50 per cent owned throughout the period with the additional 50 per cent owned since March 2017 shown in acquisitions.
11
2
3
3
4
5
6TAXATION
The tax charge on Adjusted profit of £1.2 million (2016: £1.8 million) reflects an effective tax rate of 0.6 per cent (2016: 1.2 per cent), consistent with a Group target tax rate of less than 3 per cent.
The Group’s target tax rate reflects the fact that over three-quarters of its assets are located in the UK and France and qualify for REIT and SIIC status respectively in those countries. This status means that income from rental profits and gains on disposals of assets in the UK and France are exempt from corporation tax, provided SEGRO meets a number of conditions including, but not limited to, distributing 90 per cent of UK taxable profits.
£0.6m lower
ADMINISTRATIVE AND OPERATING COSTS
The Group is focused on managing its cost base and uses a Total Cost Ratio (TCR) as a key measure of cost management. The TCR for 2017 has increased to 24.6 per cent from 23 per cent for 2016, above our 20 per cent target. The calculation is set out in Table 6 of the Supplementary Notes to the Financial Statements.
While gross rental income (the denominator) has increased by £37.3 million, total costs have increased by £14.1 million. This is due mainly to increased staff costs, particularly share based payments which have increased due to the outperformance of our property portfolio compared to the market.
Excluding share based payments, the cost ratio would be 21.7 per cent, a moderate increase from 21.0 per cent in 2016.
Cost ratio: 24.6%
NET FINANCE COSTS
Net finance costs (including adjustments) decreased by £10.0 million in 2017 to £58.7 million primarily as a result of the debt refinancing undertaken in the year and reduction in drawn debt as a result of proceeds from the Rights Issue, as detailed further on page 33.
£10.0m lower
INCOME FROM JOINT VENTURES
Joint venture management fee income increased by £5.7 million to £24.3 million.
The increase was mainly due to the higher performance fees from the APP joint venture which crystallised on acquisition.
SEGRO’s share of joint ventures’ Adjusted profit after tax decreased by £7.8 million from £55.4 million in 2016 to £47.6 million in 2017, reflecting the acquisition of the remaining 50 per cent of the APP property portfolio in March 2017. After this date all the rental income from APP was recognised within gross rental income, rather than within Share of Joint Ventures’ Adjusted profit.
The Group’s largest remaining joint venture, SELP, contributed £49.5 million (at share), an increase of £8.4 million compared to last year following growth through acquisitions and development completions.
£2.1m lower
ADJUSTED PROFIT
Adjusted profit before tax increased by 25.7 per cent to £194.2 million (2016: £154.5 million) during 2017 as a result of the above movements (see Note 2).
£39.7m higher
NET RENTAL INCOME
Net rental income increased by £40.1 million to £220.7 million, reflecting the positive net impact of investment activity in particular the acquisition of the APP portfolio in March 2017 and development completions during the period, offset by the impact of disposals.
On a like-for-like basis1, before other items (primarily corporate centre and other costs not specifically allocated to a geographic business unit), net rental income increased by £5.7 million, or 2.6 per cent, compared to 2016. This is mainly due to strong rental performance in our UK portfolio particularly in Greater London more than offsetting a modest fall in Continental Europe.
£40.1m higher
ADJUSTED EARNINGS PER SHARE
Adjusted earnings per share are 19.9 pence compared to 18.8 pence in 2016 which has been restated from 19.7 pence following adjustment due to the Rights Issue during the year as detailed further in Note 12. This reflects a £40.2 million improvement in Adjusted profit after tax and non-controlling interests, and an increased average number of shares as a result of the Rights Issue in March 2017, the equity placing in September 2016 and the take-up of the scrip dividend option offered with the 2016 final and 2017 interim dividends.
19.9p, +5.9%
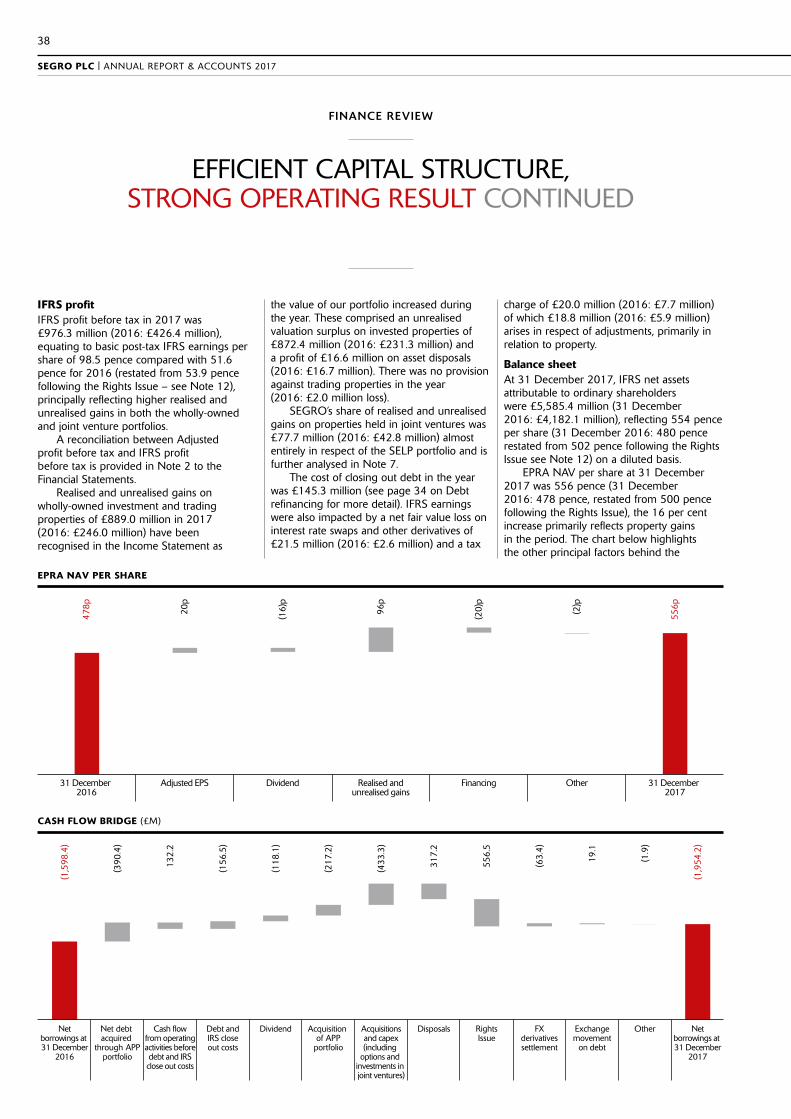
SEGRO PLC | ANNUAL REPORT & ACCOUNTS 2017
38
EFFICIENT CAPITAL STRUCTURE, STRONG OPERATING RESULT CONTINUED
FINANCE REVIEW
IFRS profitIFRS profit before tax in 2017 was £976.3 million (2016: £426.4 million), equating to basic post-tax IFRS earnings per share of 98.5 pence compared with 51.6 pence for 2016 (restated from 53.9 pence following the Rights Issue – see Note 12), principally reflecting higher realised and unrealised gains in both the wholly-owned and joint venture portfolios.
A reconciliation between Adjusted profit before tax and IFRS profit before tax is provided in Note 2 to the Financial Statements.
Realised and unrealised gains on wholly-owned investment and trading properties of £889.0 million in 2017 (2016: £246.0 million) have been recognised in the Income Statement as
the value of our portfolio increased during the year. These comprised an unrealised valuation surplus on invested properties of £872.4 million (2016: £231.3 million) and a profit of £16.6 million on asset disposals (2016: £16.7 million). There was no provision against trading properties in the year (2016: £2.0 million loss).
SEGRO’s share of realised and unrealised gains on properties held in joint ventures was £77.7 million (2016: £42.8 million) almost entirely in respect of the SELP portfolio and is further analysed in Note 7.
The cost of closing out debt in the year was £145.3 million (see page 34 on Debt refinancing for more detail). IFRS earnings were also impacted by a net fair value loss on interest rate swaps and other derivatives of £21.5 million (2016: £2.6 million) and a tax
charge of £20.0 million (2016: £7.7 million) of which £18.8 million (2016: £5.9 million) arises in respect of adjustments, primarily in relation to property.
Balance sheetAt 31 December 2017, IFRS net assets attributable to ordinary shareholders were £5,585.4 million (31 December 2016: £4,182.1 million), reflecting 554 pence per share (31 December 2016: 480 pence restated from 502 pence following the Rights Issue see Note 12) on a diluted basis.
EPRA NAV per share at 31 December 2017 was 556 pence (31 December 2016: 478 pence, restated from 500 pence following the Rights Issue), the 16 per cent increase primarily reflects property gains in the period. The chart below highlights the other principal factors behind the
EPRA NAV PER SHARE
478p
556p(2)p
(20)
p
96p
(16)
p
20p
31 December 2016
Adjusted EPS Dividend Realised andunrealised gains
Financing Other 31 December 2017
CASH FLOW BRIDGE (£M)
(1,5
98.4
)
(390
.4)
132.
2
(156
.5)
(1,9
54.2
)
(1.9
)
(63.
4)
19.1
317.
2
556.
5
(217
.2)
(433
.3)
(118
.1)
Netborrowings at 31 December
2016
Cash flowfrom operatingactivities beforedebt and IRSclose out costs
Debt andIRS closeout costs
Acquisition of APP
portfolio
Acquisitionsand capex(including
options and investments in joint ventures)
OtherExchangemovement
on debt
RightsIssue
FXderivativessettlement
Disposals Netborrowings at 31 December
2017
Net debt acquired
through APPportfolio
Dividend
39
OVERVIEW STRATEGIC REPORT GOVERNANCE FINANCIAL STATEMENTS
increase. A reconciliation between IFRS and EPRA NAV is available in Note 12 to the Financial Statements.
Cash flow and net debt reconciliationCash flow generated from operations, before financing activity (in respect of closing out debt and interest rate swaps), was £132.2 million in 2017, an increase of £31.0 million from 2016. This was mainly due to the impact from increased Adjusted profit in the year. In addition financing activity, being the cost of early close out of debt (£140.4 million outflow), as detailed further in the debt refinancing section above, and associated derivative transactions (£50.9 million outflow and £34.8 million inflow) totalling £156.5 million, gives a total operating outflow for the year of £24.3 million.
The Group made net divestments of £333.3 million of investment and development properties (including options and loans to joint ventures) during the year on a cash flow basis (2016: £84.2 million investment). This includes cash from disposals of £317.2 million (2016: £614.0 million), the decrease primarily due to the disposal of the Bath Road office portfolio in 2016. The Group spent £457.9 million (2016: £429.7 million) to purchase and develop investment properties, and it divested £28.4 million in joint ventures (2016: £63.4 million investment).
Other significant cash flows include an inflow of £557.2 million net proceeds from the issue of ordinary shares, of which £556.5 million relates to net proceeds from the Rights Issue, further detailed in Note 19 to the Financial Statements. The 2016 comparative of £318.4 million includes the inflow from the equity placing in September 2016. Furthermore the Group paid dividends of £118.1 million (2016: £89.0 million) where cash flows are lower than the total dividend due to the level of scrip uptake. The settlement of foreign exchange derivatives has led to a net outflow of £63.4 million (2016: £168.4 million) as the euro has strengthened in the year, but to a lesser extent than in the prior year.
Overall, net debt has increased in the year from £1,598.4 million to £1,954.2 million.
Capital expenditureTable 7 in the Supplementary Notes sets out analysis of the capital expenditure during the year. This includes acquisition and development spend, on an accruals basis, in respect of the Group’s wholly-owned investment and trading property portfolios, as well as the equivalent amounts for joint ventures at share.
Total spend for the year was £1,754.2 million, an increase of £1,044.7 million compared to 2016, which includes higher development expenditure and the acquisition of the APP portfolio as detailed in Note 7 and on page 21. More detail on acquisitions can be found in the Disciplined Capital Allocation section of Our Strategy.
Development capital expenditure increased by £112.5 million to £414.1 million, reflecting our stated intention to increase the level of investment in developments, both speculative and pre-let, to take advantage of strong occupier demand for modern space in our markets. Development spend incorporates interest capitalised of £7.4 million (2016: £5.8 million) including joint ventures at share.
Spend on existing completed properties totalled £24.3 million (2016: £22.0 million), of which £15.0 million (2016: £13.0 million) was for major refurbishment, infrastructure and fit-out costs prior to re-letting. The balance mainly comprises more minor refurbishment and fit-out costs, which equates to less than 5 per cent of Adjusted profit before tax and 1 per cent of total spend.
DIVIDEND INCREASE REFLECTS A STRONG YEAR AND CONFIDENCE FOR THE FUTURE
Under the UK REIT rules, we are required to pay out 90 per cent of UK-sourced, tax-exempt rental profits as a ‘Property Income Distribution’ (PID). Since we also receive income from our properties in Continental Europe, our total dividend should normally exceed this minimum level and we target a payout ratio of 85 to 95 per cent of Adjusted profit after tax. We aim to deliver a progressive and sustainable dividend which grows in line with our profitability in order to achieve our goal of being a leading income-focused REIT.
The Board has concluded that it is appropriate to recommend an increase in the final dividend per share of 0.65 pence to 11.35 pence (2016: 10.7 pence, adjusted for the Rights Issue bonus adjustment factor) which will be paid as a PID. The Board’s recommendation is subject to approval by shareholders at the Annual General Meeting, in which event the final dividend will be paid on 3 May 2018 to shareholders on the register at the close of business on 23 March 2018.
In considering the final dividend, the Board took into account:
££ the policy of targeting a payout ratio of between 85 and 95 per cent of Adjusted profit after tax;
££ the desire to ensure that the dividend is sustainable and progressive throughout the cycle; and
££ the results for 2017 and the outlook for earnings.
The total dividend for the year will, therefore, be 16.6 pence, a rise of 5.7 per cent on 2016 (15.7 pence, adjusted) and represents payment of 86 per cent of Adjusted profit after tax and 83 per cent of Adjusted EPS.
As at 31 December 2017 the Company had distributable reserves that provide cover for the total of the interim dividend paid and the final dividend proposed in respect of the year ended 31 December 2017 of over 4 times (2016: 3 times). When required the Company can receive dividends from its subsidiaries to further increase the distributable reserves.
The Board has decided to retain a scrip dividend option for the 2017 final dividend, allowing shareholders to choose whether to receive the dividend in cash or new shares. In 2017, 13 per cent of the 2016 final dividend and 34 per cent of the 2017 interim dividend was paid in new shares, equating to £27.6 million of cash retained on the balance sheet.
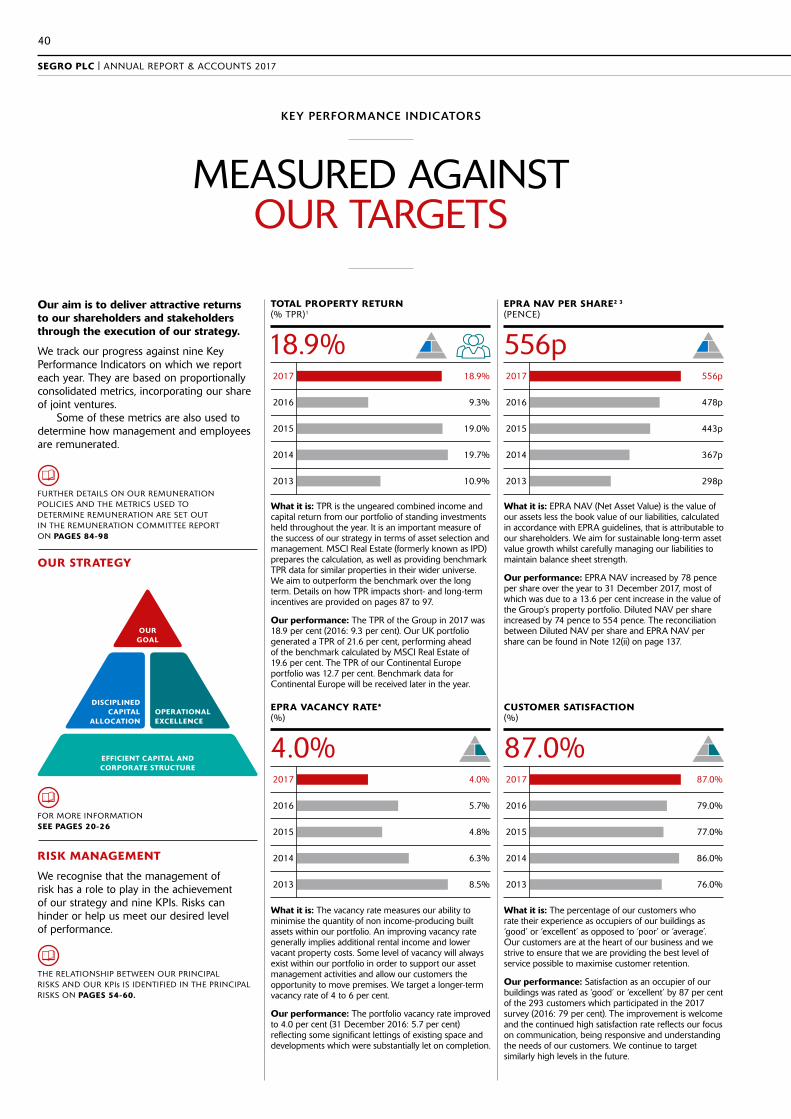
SEGRO PLC | ANNUAL REPORT & ACCOUNTS 2017
40
What it is: TPR is the ungeared combined income and capital return from our portfolio of standing investments held throughout the year. It is an important measure of the success of our strategy in terms of asset selection and management. MSCI Real Estate (formerly known as IPD) prepares the calculation, as well as providing benchmark TPR data for similar properties in their wider universe. We aim to outperform the benchmark over the long term. Details on how TPR impacts short- and long-term incentives are provided on pages 87 to 97.
Our performance: The TPR of the Group in 2017 was 18.9 per cent (2016: 9.3 per cent). Our UK portfolio generated a TPR of 21.6 per cent, performing ahead of the benchmark calculated by MSCI Real Estate of 19.6 per cent. The TPR of our Continental Europe portfolio was 12.7 per cent. Benchmark data for Continental Europe will be received later in the year.
What it is: The vacancy rate measures our ability to minimise the quantity of non income-producing built assets within our portfolio. An improving vacancy rate generally implies additional rental income and lower vacant property costs. Some level of vacancy will always exist within our portfolio in order to support our asset management activities and allow our customers the opportunity to move premises. We target a longer-term vacancy rate of 4 to 6 per cent.
Our performance: The portfolio vacancy rate improved to 4.0 per cent (31 December 2016: 5.7 per cent) reflecting some significant lettings of existing space and developments which were substantially let on completion.
What it is: EPRA NAV (Net Asset Value) is the value of our assets less the book value of our liabilities, calculated in accordance with EPRA guidelines, that is attributable to our shareholders. We aim for sustainable long-term asset value growth whilst carefully managing our liabilities to maintain balance sheet strength.
Our performance: EPRA NAV increased by 78 pence per share over the year to 31 December 2017, most of which was due to a 13.6 per cent increase in the value of the Group’s property portfolio. Diluted NAV per share increased by 74 pence to 554 pence. The reconciliation between Diluted NAV per share and EPRA NAV per share can be found in Note 12(ii) on page 137.
What it is: The percentage of our customers who rate their experience as occupiers of our buildings as ‘good’ or ‘excellent’ as opposed to ‘poor’ or ‘average’. Our customers are at the heart of our business and we strive to ensure that we are providing the best level of service possible to maximise customer retention.
Our performance: Satisfaction as an occupier of our buildings was rated as ‘good’ or ‘excellent’ by 87 per cent of the 293 customers which participated in the 2017 survey (2016: 79 per cent). The improvement is welcome and the continued high satisfaction rate reflects our focus on communication, being responsive and understanding the needs of our customers. We continue to target similarly high levels in the future.
MEASURED AGAINST OUR TARGETS
KEY PERFORMANCE INDICATORS
Our aim is to deliver attractive returns to our shareholders and stakeholders through the execution of our strategy.
We track our progress against nine Key Performance Indicators on which we report each year. They are based on proportionally consolidated metrics, incorporating our share of joint ventures.
Some of these metrics are also used to determine how management and employees are remunerated.
TOTAL PROPERTY RETURN (% TPR)1
EPRA VACANCY RATE* (%)
EPRA NAV PER SHARE2 3 (PENCE)
CUSTOMER SATISFACTION (%)
18.9%
4.0%
556p
87.0%
THE RELATIONSHIP BETWEEN OUR PRINCIPAL RISKS AND OUR KPIs IS IDENTIFIED IN THE PRINCIPAL RISKS ON PAGES 54-60.
RISK MANAGEMENT
We recognise that the management of risk has a role to play in the achievement of our strategy and nine KPIs. Risks can hinder or help us meet our desired level of performance.
FOR MORE INFORMATION SEE PAGES 20-26
EFFICIENT CAPITAL AND CORPORATE STRUCTURE
OUR GOAL
DISCIPLINED CAPITAL
ALLOCATIONOPERATIONAL EXCELLENCE
OUR STRATEGY
FURTHER DETAILS ON OUR REMUNERATION POLICIES AND THE METRICS USED TO DETERMINE REMUNERATION ARE SET OUT IN THE REMUNERATION COMMITTEE REPORT ON PAGES 84-98
2017 18.9%
9.3%
19.0%
19.7%
10.9%
2016
2015
2014
2013
2017 4.0%
5.7%
4.8%
6.3%
8.5%
2016
2015
2014
2013
2017 556p
478p
443p
367p
298p
2016
2015
2014
2013
2017 87.0%
79.0%
77.0%
86.0%
76.0%
2016
2015
2014
2013

41
OVERVIEW STRATEGIC REPORT GOVERNANCE FINANCIAL STATEMENTS
EFFICIENT CAPITAL AND CORPORATE STRUCTURE
OPERATIONAL EXCELLENCE
DISCIPLINED CAPITAL ALLOCATION
ITEMS ARE DIRECTLY CAPTURED IN SEGRO’S INCENTIVE SCHEMES
What it is: TSR measures the change in our share price over the year assuming that dividends paid are reinvested. This KPI reflects our commitment to delivering enhanced returns for our shareholders through the execution of our strategy over the medium term. TSR is a key metric used in setting the long term incentive plan remuneration for both the Executive Directors and senior management.
Our performance: The TSR of the Group was 38.7 per cent, compared with 12.9 per cent for the FTSE 350 Real Estate index. This performance reflects a combination of the 15.95 pence dividend (10.7 pence adjusted3 2016 final dividend and 5.25 pence 2017 interim dividend) paid during the year and an increase in the share price from 438 pence (adjusted3) at 31 December 2016 to 587 pence at 31 December 2017.
What it is: The proportion of our property assets (including investment, owner-occupier and trading properties at carrying value and our share of properties in joint ventures) that are funded by borrowings. Our ‘mid-cycle’ LTV ratio target remains at 40 per cent but, at this stage in the cycle, and based on our investment plans, we aim to maintain it at between 30 and 35 per cent. We believe that REITs with lower leverage offer a lower risk and less volatile investment proposition for shareholders.
Our performance: The Group’s LTV ratio improved to 30 per cent from 33 per cent year on year, principally as a result of the equity raised in the Rights Issue and the total portfolio valuation increase. The timing of investment decisions and disposals, as well as movement in the value of our assets may cause the LTV to fluctuate.
What it is: The headline annualised gross rental income contracted during the year less income lost from takebacks. There are two elements: to grow income from our standing assets by reducing vacancy and increasing rents from lease renewals and rent reviews; and to generate new rent by developing buildings either on a pre-let or speculative basis. Rent from new acquisitions is not included.
Our performance: In total, we generated £41.5 million of net new annualised rent during the year (2016: £29.7 million). The increase was driven substantially by higher rents on review and renewal in the UK and by the increased volume of rent from development completions and pre-let agreements secured during the year.
What it is: The ratio of our total administration and property operating costs expressed as a percentage of gross rental income. This is an indicator of how cost-effectively we manage both our property assets and our administrative costs in order to improve profitability. Over the medium term we are targeting a total cost ratio of 20 per cent.
Our performance: The total cost ratio increased to 24.6 per cent (2016: 23.0 per cent) due mainly to increased performance-related share based payments and staff costs. Excluding share based payments, the total cost ratio would have been 21.7 per cent, an increase of 0.7 per cent from 2016 (21.0 per cent).
What it is: Our headline Adjusted earnings per share (EPS) reflects earnings from our operating business: rental income less operating, administrative and financing costs and tax. It is the primary determinant of the level of the annual dividend. IFRS EPS includes the impact of realised and unrealised changes in the valuation of our assets which can often mask the underlying operating performance. The reconciliation between Basic EPS and Adjusted EPS can be found in Note 12(i) on page 136.
Our performance: Adjusted EPS increased by 5.9 per cent during the year, reflecting higher rental income from our standing assets, new income from acquisitions and developments, an increase in joint venture management fees and lower financing costs, partly offset by higher administrative and operating costs.
TOTAL SHAREHOLDER RETURN (% TSR)
LOAN TO VALUE RATIO (LTV) (% INCLUDING JOINT VENTURES AT SHARE)4
RENT ROLL GROWTH (£)
TOTAL COST RATIO (%)
ADJUSTED EPS3 (PENCE)
38.7% 30%
£41.5m 24.6%
19.9p2017 30%
33%
38%
40%
42%
2016
2015
2014
2013
2017 24.6%
23.0%
22.2%
23.3%
24.3%
2016
2015
2014
2013
2017 38.7%
10.8%
20.1%
15.7%
43.2%
2016
2015
2014
2013
2017 £41.5m
£29.7m
£23.6m
£15.0m
£6.5m
2016
2015
2014
2013
2017 19.9p
18.8p
17.6p
16.4p
16.9p
2016
2015
2014
2013
1 The TPR has been calculated independently by MSCI Real Estate (formerly known as IPD) in order to provide a consistent comparison with an appropriate MSCI-IPD benchmark. It is calculated as the change in capital value, less any capital expenditure incurred, plus net income, expressed as a percentage of capital employed over the period concerned for standing investments held throughout the year, excluding land.
2 EPRA NAV is an alternate metric that is calculated in accordance with the Best Practices Recommendations of the European Public Real Estate Association (EPRA). SEGRO discloses EPRA alternative metrics on pages 172 to 175 (NAV, EPS, vacancy rate, cost ratio, initial yield) to provide a transparent and consistent basis to enable comparison between European property companies. See www.epra.com for further details.
3 As a result of the Rights Issue in March 2017, a bonus adjustment factor of 1.046 has been applied to all historic per share metrics, including the share price, Earnings per share, EPRA NAV per share and Dividend per share. For more information on the Rights Issue, please see pages 135 to 137 and pages 33 to 34 for the historic unadjusted and adjusted metrics.
4 In 2013 and 2014, we treated deferred consideration from our partner in the SELP joint venture as cash within the LTV ratio as it was callable at three months notice. The balance was paid to us in October 2015 meaning that the LTV ratios from 2015 onwards are unadjusted.

SEGRO PLC | ANNUAL REPORT & ACCOUNTS 2017
42
WE ARE COMMITTED TO ACHIEVING OUR PURPOSE IN THE MOST SUSTAINABLE WAY POSSIBLE.”
DAVID SLEATHCHIEF EXECUTIVE
OUR PEOPLE
Our people are integral to our business and we are committed to making working at SEGRO an enjoyable and rewarding experience.
In 2017, we continued to enhance the culture of the organisation to ensure that we remain an employer of choice.
OUR COMMUNITY
SEGRO continues to make substantial investments into the communities in which we operate, through an approach based on collaboration and partnership.
Our successful London Community Fund is an excellent example of our commitment to our communities and can be seen in further detail on page 47.
OUR ENVIRONMENT
We continued to make good progress against our 2020 targets in 2017 and our second zero carbon development, at SEGRO Park Amsterdam Airport, reflects our commitment to environmental sustainability. The project which is explored further on page 49 showcases our vision to develop with the future in mind.
We are in the process of reviewing our sustainability targets and strategy to make sure we continue to challenge the business. This review is summarised on page 51 and www.SEGRO.com/csr.
OUR STAKEHOLDERS
We work hard to build and maintain strong relationships with our customers, suppliers and investors, always keeping in mind the impact of our strategic decisions on these important stakeholder groups.
RESPONSIBLE SEGRO
SEGRO’s purpose is to ‘create the space to enable extraordinary things to happen’ and we are committed to achieving this in the most sustainable way possible.
Whilst our business focuses on returns from real estate, we fully understand our wider responsibilities and prioritise a commitment to sustainable practices.
Our Responsible SEGRO model helps guide our business decisions as well as providing a framework for how we report on sustainability.
The model helps reflect our committed approach to our people, communities, environment and stakeholders. We take time to fully understand the implications of our decisions and always aim to exceed expectations of those with whom we work.
We take a long-term view of our business and place great importance on trying to understand and foresee opportunities and challenges which might affect our business and that of our customers.
By anticipating future trends, we are able to adjust our business accordingly and make quick and informed decisions for the benefit of our people, communities, environment and stakeholders.
This holistic approach not only ensures that our buildings are sustainable, but also that they fit well with their local surroundings and communities.
Our application of Responsible SEGRO should ensure that both our portfolio and our business is well positioned for the future.
98 per cent of our shareholders participated in the Rights Issue in March, and we thank them for their support.
WHAT TO EXPECT IN 2018
We have the following objectives for 2018:
££ In 2018, we will repeat our ‘Your Say’ all employee survey and will report our findings and actions next year.
££ We will launch new supply chain initiatives in Hounslow, Enfield and Slough.
££ We will target zero waste to landfill and promote the re-use of materials.
££ We will expand our investor relations offering to incorporate greater information for our, and SELP’s, bond holders.
OVERVIEW
RESPONSIBLE SEGRO

43
OVERVIEW STRATEGIC REPORT GOVERNANCE FINANCIAL STATEMENTS
CODE OF ETHICS
SEGRO operates to the highest ethical standards throughout our business activities. Our Code of Ethics is aligned with applicable laws and regulations, as well as our Purpose and Values.
The Code incorporates policies on bribery, corruption and fraud, gifts and hospitality, insider trading, confidentiality, conflicts of interest, relationships with stakeholders, political and charitable donations, raising serious concerns and modern slavery and human trafficking.
It is a condition of each employee’s terms of employment and reflects the framework of acceptable behaviour to ensure that our employees always act in the Company’s best interests.
All employees receive information on our Code of Ethics and are required to complete an online training course within a month of joining the Company. All employees must certify annually that they continue to understand and adhere to the Code. Any breaches of the Code are fully investigated and managed accordingly by the General Counsel or Group Human Resource Director as necessary.
Our Code of Ethics was updated in 2017 to reflect the Company’s new policies aimed at ensuring that modern slavery is not taking place anywhere within our organisation or in any of our supply chains. Our Slavery and Human Trafficking statement is available on our website at www.SEGRO.com/csr/slavery-and-human-trafficking-statement.
Jobs and SkillsCulture
ResourcesInvestors
Community Investment
Talent and Diversity
EnergySuppliers
GivingHealth and Safety
MaterialsCustomers
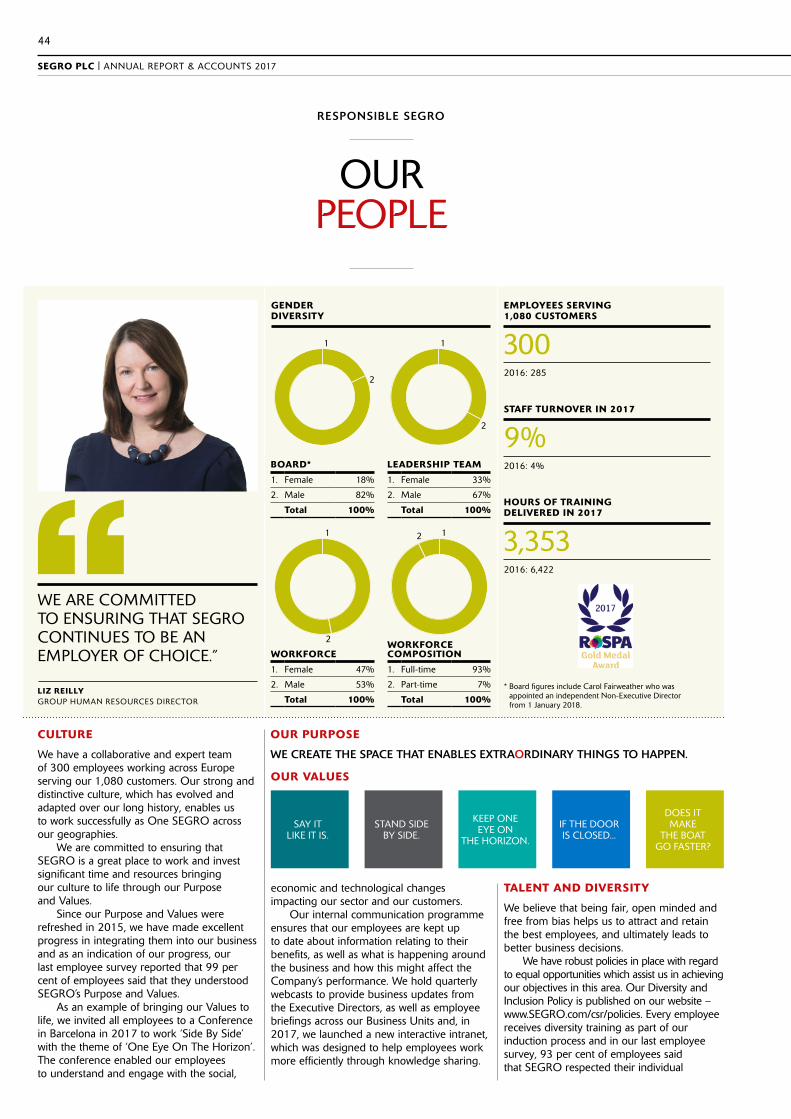
SEGRO PLC | ANNUAL REPORT & ACCOUNTS 2017
44
OUR PEOPLE
RESPONSIBLE SEGRO
WE ARE COMMITTED TO ENSURING THAT SEGRO CONTINUES TO BE AN EMPLOYER OF CHOICE.”
LIZ REILLYGROUP HUMAN RESOURCES DIRECTOR
CULTURE
We have a collaborative and expert team of 300 employees working across Europe serving our 1,080 customers. Our strong and distinctive culture, which has evolved and adapted over our long history, enables us to work successfully as One SEGRO across our geographies.
We are committed to ensuring that SEGRO is a great place to work and invest significant time and resources bringing our culture to life through our Purpose and Values.
Since our Purpose and Values were refreshed in 2015, we have made excellent progress in integrating them into our business and as an indication of our progress, our last employee survey reported that 99 per cent of employees said that they understood SEGRO’s Purpose and Values.
As an example of bringing our Values to life, we invited all employees to a Conference in Barcelona in 2017 to work ‘Side By Side’ with the theme of ‘One Eye On The Horizon’. The conference enabled our employees to understand and engage with the social,
economic and technological changes impacting our sector and our customers.
Our internal communication programme ensures that our employees are kept up to date about information relating to their benefits, as well as what is happening around the business and how this might affect the Company’s performance. We hold quarterly webcasts to provide business updates from the Executive Directors, as well as employee briefings across our Business Units and, in 2017, we launched a new interactive intranet, which was designed to help employees work more efficiently through knowledge sharing.
TALENT AND DIVERSITY
We believe that being fair, open minded and free from bias helps us to attract and retain the best employees, and ultimately leads to better business decisions.
We have robust policies in place with regard to equal opportunities which assist us in achieving our objectives in this area. Our Diversity and Inclusion Policy is published on our website – www.SEGRO.com/csr/policies. Every employee receives diversity training as part of our induction process and in our last employee survey, 93 per cent of employees said that SEGRO respected their individual
EMPLOYEES SERVING 1,080 CUSTOMERS
GENDER DIVERSITY
2016: 285
300
STAFF TURNOVER IN 2017
2016: 4%
9%
HOURS OF TRAINING DELIVERED IN 2017
2016: 6,422
3,353
1. Female 18%
2. Male 82%
Total 100%
BOARD*
1. Female 47%
2. Male 53%
Total 100%
1. Full-time 93%
2. Part-time 7%
Total 100%
WORKFORCEWORKFORCE COMPOSITION
1. Female 33%
2. Male 67%
Total 100%
LEADERSHIP TEAM
1
1 1
1
2
2
2
2
SAY IT LIKE IT IS.
IF THE DOOR IS CLOSED...
STAND SIDE BY SIDE.
DOES IT MAKE
THE BOAT GO FASTER?
KEEP ONE EYE ON
THE HORIZON.
OUR VALUES
OUR PURPOSE
WE CREATE THE SPACE THAT ENABLES EXTRAORDINARY THINGS TO HAPPEN.
* Board figures include Carol Fairweather who was appointed an independent Non-Executive Director from 1 January 2018.

45
OVERVIEW STRATEGIC REPORT GOVERNANCE FINANCIAL STATEMENTS
difference (of race, disability, sexual orientation, gender, etc.).
We are committed to ensuring that we offer equal opportunities to people with disabilities. If an employee becomes disabled while in our employment, we will offer appropriate support, retraining and facilities to enable them to continue in their role.
SEGRO believes in treating all employees equally, including in respect of pay. During 2017 we commissioned an independent audit by our remuneration consultants, Mercer, who confirmed that there are no differences in the pay of men and women at SEGRO who are doing the same or similar roles.
Differences in levels of pay between men and women in our UK organisation are driven by the make-up of our workforce where we currently employ more men in senior roles than women.
SEGRO’s median pay gap is 54 per cent. This calculation represents the average pay of all men compared to the average pay of all women we employ in the UK. We have disclosed this number as we believe it is important to be transparent, despite not being obliged to do so because we employ significantly fewer than 250 people in the UK, which can create distortion in the analysis. The relatively high figure reflects this distortion and the current make-up of our workforce as described above.
SEGRO is dedicated to increasing the gender diversity in the business through a combination of actions aimed at raising conscious awareness of diversity issues amongst our employees, through our recruitment and training interventions and our talent review process.
We have publicly committed to increasing diversity both within the sector and in our own business through our support of Pathways to Property, Real Estate Balance and more recently, the 30% Club. We are Gold Level sponsors of Pathways to Property and offer work experience to individuals who would not otherwise have access to property as a career. Our Chief Executive has signed up to the Real Estate Balance ‘CEO Commitments for Diversity’ (http://www.realestatebalance.org/ceo-commitments-for-diversity.html) and has recently pledged our support to the 30% Club which aims to increase the number of women on boards and leadership teams to a minimum of 30 per cent by 2020 (https://www.30percentclub.org/).
Our approach to developing talent is pragmatic and straightforward – we want everyone to be able to maximise their potential during their time with SEGRO – supported by meaningful and stretching work experiences and through formal training and coaching where appropriate.
Our employee turnover, at a Group wide level, increased during 2017 but continues to remain in line with the sector average, meaning that we are able to successfully retain valuable knowledge and expertise within SEGRO.
HEALTH AND SAFETY
Health and safety remains central to the execution of SEGRO’s business strategy. We take our responsibilities in this area very seriously and are committed to continuing to improve on our strong health and safety record in the future.
We seek to embed health and safety within our culture, as well as influencing our supply chain. This is achieved through managing risks by prevention, tighter controls, training and raising awareness.
In 2017, we were awarded a RoSPA Gold Medal for achieving five consecutive Gold Awards. The award recognised our Group commitment and practical application of health and safety procedures across all our business operations.
In association with our Construction Standard, SEGRO worked increasingly closely with contractors and health and safety consultants in 2017 to enhance understanding of our expectations. As a result, more than twice the number of inspections were undertaken across projects in Europe to educate and, when required, enforce the Standard’s requirements to great effect.
In 2017, whilst our Accident Frequency Rate for employees was zero and there were no fatalities, there were a small number of health and safety incidents which we thoroughly investigated and implemented improvement plans where required. We also conducted many specific health and safety projects, one being featured below.
Our Group Health and Safety policy and more details on our initiatives in this area are featured on our website www.SEGRO.com/csr/health-and-safety.
SAFETY IN DEVELOPMENT
During 2017, we undertook a complex development project which, on initial inspection, highlighted some concerns relating to contractor engagement, training and the control of high risk works.
SEGRO made the decision to expand the safety team and implement more robust safety procedures that included the following:
££ Each contractor had to be fully approved and inducted in health and safety before being issued with a unique coded ID badge and permitted entry to the construction site.
££ Daily inspections on safety performance took place across the site, with findings reported in weekly and monthly reports.
££ If there were any non-conformities noted during inspections, the contractor involved would be required to stop working and could be issued with a fine. They would also be required to meet with their supervisor and re-take the health and safety test to ensure their full understanding of the safe method of working.
££ A register was kept and tracked concerning any individual/company that was continually breaching the site safety rules and action taken accordingly.
The safety culture changed dramatically on site during the early stages of the project with an increase in the dedicated health and safety presence and the proactive monitoring and engagement with the on-site workforce.
From the initial findings of 18 priority issues that required addressing at the very start of the project, this fell to one by the last visit. Equally, the number of good practices noted began at two and finished at nine, showing a shift in the understanding and need for good health and safety for all.
The lessons learned from this project have already been used on other projects across the Group.

SEGRO PLC | ANNUAL REPORT & ACCOUNTS 2017
46
OUR COMMUNITY
RESPONSIBLE SEGRO
WE ARE COMMITTED TO ENHANCING AND IMPROVING THE AREAS IN WHICH WE OPERATE.”
NEIL IMPIAZZIPARTNERSHIPS DEVELOPMENT DIRECTOR
JOBS AND SKILLS
In partnership with our contractors and customers, SEGRO aims to invest in areas in which we operate through the provision of education, training and employment.
We aim to create jobs in the construction stage of our developments as well as in the occupation of our buildings, creating a range of diverse employment opportunities.
SEGRO Park RainhamOnce complete, we estimate that the SEGRO Park Rainham development, part of our East Plus scheme, could deliver 1,000 direct and indirect jobs. SEGRO is working with Havering Council, Havering College and Havering Job Centre Plus to deliver a dedicated skills, training and employment service for local people to support both construction and occupation of the development. The service will be available to all industrial occupiers in the surrounding area to help people in the local community access a wider range of job opportunities.
SEGRO Supply Chain Initiative As a demonstration of our commitment to supporting local businesses and generating local growth, SEGRO launched a new Supply Chain Initiative as part of the construction of SEGRO Park Rainham. Readie Construction, the main contractor on the development, committed to the Initiative which is designed to help local SMEs to compete for a range of tender opportunities as part of the construction process. As a result, more than 15 businesses located in the borough successfully provided a range of high quality services and construction work packages on the site.
SEGRO Park Newham and Workplace Through our East Plus partnership with the Greater London Authority, SEGRO is working diligently to attract new investment and create jobs in East London.
At our SEGRO Park Newham site, we are constructing a new facility for DPD and hotel for Travelodge, which will generate up to 150 jobs. SEGRO has teamed up with
Newham Workplace to help local people benefit from our regeneration plans through a dedicated training and employment job brokerage service, whilst ensuring our contractors and customers are able to secure a local workforce. Once fully let SEGRO Park Newham is expected to create 350 jobs.
Gateway to SkillsInspiring young people to prepare them for the world of work is important to SEGRO as well as its customers. Through our partnership with the Centre of Excellence for Manufacturing and Engineering (CEME) and Havering College, SEGRO is funding the Gateway to Skills initiative, a £70,000 investment package aiming to promote careers in science, technology, engineering and manufacturing (STEM). Since its launch in 2015, 467 students from 11 schools in Newham, Barking & Dagenham and Havering have participated, with 530 pupils expected to take part in 2018.
NUMBER OF EMPLOYMENT OPPORTUNITIES CREATED THROUGH NEW COMPLETED DEVELOPMENTS IN 2017
400
DONATED TO CHARITY IN 2017
2016: £880,420
£1,117,760
EMPLOYEE DAYS DONATED TO CHARITY IN 2017
2016: 315
283
SEGRO is committed to supporting the communities in which we operate through a range of funding interventions, volunteering, training and employment programmes.
By working with local partners we are able to provide a multitude of benefits to members of the community and ensure our impact goes beyond the development and ownership of modern industrial space.
We believe that active engagement and an understanding of the needs of each community we work with will help us deliver better long‑term physical and social benefits.
NUMBER OF PEOPLE BENEFITTING FROM THE LONDON COMMUNITY FUND
1,797
47
OVERVIEW STRATEGIC REPORT GOVERNANCE FINANCIAL STATEMENTS
COMMUNITY INVESTMENT
Our commitment to regeneration shapes our business decisions. We aim to enhance the communities in which we operate by collaborating with local charities and social enterprises. These grass-root community groups have the knowledge and expertise to help local vulnerable people and by offering financial support to these organisations, we help people return to employment.
SEGRO Community AwardA new SEGRO Community Award was created in 2017 to fund innovative projects that benefit the community in Slough. The £2,000 award this year was given to Learning to Work, a charity that facilitates the links between education and businesses. They will use the award to create ‘The SEGRO Volunteer Passport Programme’ in which 12 young, vulnerable people from Slough will gain a recognised volunteering qualification through a 12 week programme.
London Community Fund Since its launch in 2015, SEGRO has contributed over £150,000 to grass-roots community groups and charities in the London boroughs in which we operate. The fund helps to provide training and volunteering opportunities to the local community to help people into employment or education.
In 2017 alone, 253 volunteers gave over 8,400 hours of their time. To date, the London Community Fund has celebrated a number of achievements as detailed below.
The successes of the fund prompted the launch of our Thames Valley Community Fund this year (see case study).
GIVING
SEGRO takes a proactive approach towards giving and encourages all employees to participate in charitable events, providing their time and skills. In 2017, SEGRO donated the equivalent of £240,400 in the form of direct donations, £107,540 through employee volunteering and £769,820 through assistance in kind. SEGRO employees also donated 283 days of their time to charity.
In June 2017, 190 SEGRO colleagues from seven different countries participated in our second ‘Day of Giving’ to help a number of local charities. Alongside the theme of “In the community”, colleagues built, mended, painted, advised, helped, befriended, cooked, weeded and planted during the course of the day.
Numerous other activities were undertaken across the Group in 2017, including:
££ In the UK, SEGRO donated £40,000 to LandAid’s Habitat for Humanity GB Homes, which will help bring an empty property in East London back into use as a shared
house for young people leaving care, who may otherwise face homelessness.
££ In Northern Europe, SEGRO employees helped homeless and vulnerable children in Hamburg through the Streetwork Kids charity.
££ In Central Europe, SEGRO worked throughout the year with the Iskierka Foundation, supporting Polish children with cancer and their families.
££ In Southern Europe, nine SEGRO employees took part in Paris’s Mud Day obstacle course challenge, raising funds for Positive Planet, a charity that helps fight poverty across the world, through the development of microfinance.
THAMES VALLEY COMMUNITY FUND
In November 2017, SEGRO launched the Thames Valley Community Fund to help local charities in the Slough, Reading and Bracknell area. Partnering with The Berkshire Community Foundation, £25,000 will be available for community groups to continue their efforts to help vulnerable people back into education, training and employment. Up to £5,000 will be available to groups supporting residents to develop the skills needed to access the job market.
° Enabled 11,416 people to engage with business professionals to improve their awareness of potential career paths
° Facilitated 3,705 skills and employment interventions for residents to access training, qualifications and jobs
° Supported the career progression of 1,338 business professionals via networking, and training opportunities
° Supported the creation of 40 new businesses
° 1,797 people have directly benefited
° 30 organisations have benefited
° 209 project participants have secured employment
° 162 beneficiaries have undertaken work experience
° £240,400 in the form of direct donations
° £107,540 through employee volunteering
° £769,820 from assistance in kind
Giving
Community regeneration
Jobs and Skills
Slough Aspire is a skills and training facility dedicated to enabling the Slough community to develop employment skills relevant to local businesses. Since its launch, the centre has:
SEGRO proactively encourages all employees to participate in charitable causes through time and skills. In 2017, SEGRO donated the equivalent of:
Community Investment
SEGRO’s contribution of £150,000 to its London Community Fund in 2017 has been used to provide education, training and employment opportunities to enhance employability of vulnerable, young, and homeless people. Outcomes from the London Community Fund so far are as follows:

SEGRO PLC | ANNUAL REPORT & ACCOUNTS 2017
48
OUR ENVIRONMENT
RESPONSIBLE SEGRO
WE ARE COMMITTED TO ENSURING ENVIRONMENTAL SUSTAINABILITY IS FULLY EMBEDDED THROUGHOUT OUR BUSINESS.”BEN BRAKESGROUP SUSTAINABILITY MANAGER
SEGRO 2020 PERFORMANCE (VS 2012 BASELINE)
Reduce energy intensity for SEGRO responsible space by 40 per cent 64%
Reduce water intensity for SEGRO responsible space by 20 per cent 16%
Reuse or recycle 80 per cent of construction/demolition waste 80%
Reuse or recycle 60 per cent of excavation waste 100%
Install water efficient technology in all new buildings and qualifying major refurbishments 90%
100 per cent of qualifying buildings to be at least 40 per cent more efficient than our 2009 baseline
78%
100 per cent of qualifying new developments by SEGRO over 10,000 sq m to be BREEAM certified ‘Very Good’ or equivalent
93%
100 per cent of new buildings to be EPC ‘B’ rated or better 100%
100 per cent of qualifying refurbishments to be EPC ‘C’ rated or better 89%
Increase renewable energy generating capacity across the Group 51%
Target met On target to meet SEGRO 2020 objectives
In 2017 we continued to improve our performance against our SEGRO 2020 targets (see table).
We also continued to perform strongly across Environmental Social and Governance indices:
££ In Carbon Disclosure Project (CDP) we maintained an A– score which puts SEGRO in the ‘leadership’ category.
££ In Global Real Estate Sustainability Benchmark (GRESB) we achieved a ‘three green star’ rating and an ‘A’ for our public disclosure.
££ We were a participant of FTSE4Good.
££ We were awarded European Public Real Estate Association (EPRA) Silver for our 2016 reporting. We did not receive a Gold award because we do not report on aspects that are not material to our business, such as operational waste.
SPACE ENVIRONMENTALLY CERTIFIED IN 2017
2016: 250,000 sq m
466,447 sq m
REDUCTION IN ENERGY INTENSITY IN 2017 (FROM BASELINE)
2016: 61%
64% ON‑SITE RENEWABLE ENERGY CAPACITY
CARBON DISCLOSURE PROJECT
2016: 9.2 mw
ACHIEVED FOR THE 2ND CONSECUTIVE YEAR
13.9 mw
A-
SEGRO is committed to owning a high quality portfolio of modern warehouses which deliver sustainable performance. In order to achieve this goal, we have to ensure that our projects deliver a positive impact for our local communities, our customers, our stakeholders and the environment around us.
In 2017 we reported the results of our ‘SEGRO 2020’ targets for the seventh year, which focus on building design, refurbishments, energy and water efficiency and obtaining building certifications that support our sustainable approach.
In 2017 we continued to apply the targets to our asset management activity and have delivered strong results across the Group.
We remain committed to communicating our performance transparently and we adhere to the principles of the Global Reporting Initiative (GRI) Standards.

49
OVERVIEW STRATEGIC REPORT GOVERNANCE FINANCIAL STATEMENTS
SEGRO PARK AMSTERDAM AIRPORT LC1
Following the success of Navigation Park, London, our LC1 development at SEGRO Park Amsterdam Airport is our second zero carbon development, meaning it generates more energy than it is designed to use. Completed in November 2017, the most impressive feature of the development is the renewable heating and cooling
system which utilises the temperature of an underlying aquifer to provide heating in the winter and cooling in the summer.
The building also benefits from a 520 kWp rooftop solar photovoltaic (PV) array that will yield 425,000 kWh of clean energy annually, enough energy to power 31 homes, saving 230 tonnes of CO2 annually.
As the long-term asset manager, we will maintain and monitor the panels and sell the energy to the occupier through a power purchase agreement.
The renewable energy features will help the development achieve a BREEAM ‘Excellent’ rating.
1. Concrete 43%
2. Steel and other metals 16%
3. Plastics, membranes and roofing 12%
4. Gypsum, plaster and cement 2%
5. Insulation 2%
6. Other 25%
Total 100%
1
23
56
4
MATERIALS
In order to be Europe’s leading owner and developer of industrial properties, as well as an excellent partner for our customers, we want to help our customers reach their sustainability targets by providing low carbon buildings which can also reduce operational costs and create financial savings. We aim to provide high specification, high performance buildings, and ensure they are cost effective to run and have as low an environmental impact as possible.
We recognise and encourage the specification of responsibly sourced materials. For example, our development at SEGRO Logistics Centre Mitry-Mory, which has a floor area of 57,400 sq m, utilises sustainably certified timber by using glue laminated beams for the structure.
ROME FC1
The integration of Building Information Modelling into our development assessments allows us to identify the sources of a development’s carbon footprint during construction and over its life cycle. This means we can target the main areas of embodied carbon to reduce our carbon footprint.
For example, at our Rome FC1 site in Italy (our biggest development to date) around 12 per cent of the building’s lifetime carbon footprint is associated with construction and demolition, the remainder being dependent on how the occupier uses the building.
The chart below shows the main sources of carbon within the construction phase, the dominant contributor being concrete, focusing our attention on how to change the use of these elements to improve the carbon footprint within our control.

SEGRO PLC | ANNUAL REPORT & ACCOUNTS 2017
50
OUR ENVIRONMENT CONTINUED
RESPONSIBLE SEGRO
RESOURCES
In 2016, we achieved our target for excavation waste, and reused or recycled 77 per cent of construction and demolition waste across the Group. In 2017 we decided to go further and understand what was possible to re-use or recycle from a development and see how far we could feasibly go. Our 225 Bath Road development provided an ideal opportunity.
225 BATH ROAD
The 4.9 ha site of our 225 Bath Road development was formerly a manufacturing facility that we demolished to make way for 20,000 sq m of urban warehousing. Working with our suppliers, we managed to send just 0.6 per cent of the waste to landfill (see below). We hope to repeat this level of recycling in as many projects as possible in future.
ENERGY
In 2017 we completed our biggest rooftop solar PV array yet. We retrofitted 3.4 MWp of solar PV capacity to a building in Tilburg, Netherlands, one of the greenest buildings in our portfolio. The solar array will provide 2,975 mWh of clean energy each year. The building has already been certified BREEAM ‘Outstanding’ and with the solar array becomes one of our most sustainable buildings.
In 2017, 100 per cent of our developments had an Energy Performance Certificate (EPC) rating of at least a ‘B’, or a primary energy demand less than 200 kWh per m sq per year and 89 per cent of our UK refurbishments achieved at least a ‘C’ rating.
We have further reduced the number of ‘F’ and ‘G’ rated EPC assets in the UK portfolio in response to the Minimum Energy Efficiency Standards and have developed a programme for those outstanding to either improve the energy efficiency of the building or re-develop at the earliest opportunity.Waste Description Tonnes
1. Recycled – Concrete, bricks, tiles and ceramics 10,508.6 70.7%
2. Recycled – Wood 108.1 0.7%
3. Recycled – Metallic waste, including cable 3,142.4 21.1%
4. Recycled – Gypsum (Plasterboard) 31.5 0.2%
5. Recovered – General Building Waste 989.5 6.7%
6. Landfill – General Building Waste 20.2 0.1%
7. Landfill – Hazardous Waste 70.0 0.5%
Total 14,870.3 100%
1
23
5 64
7
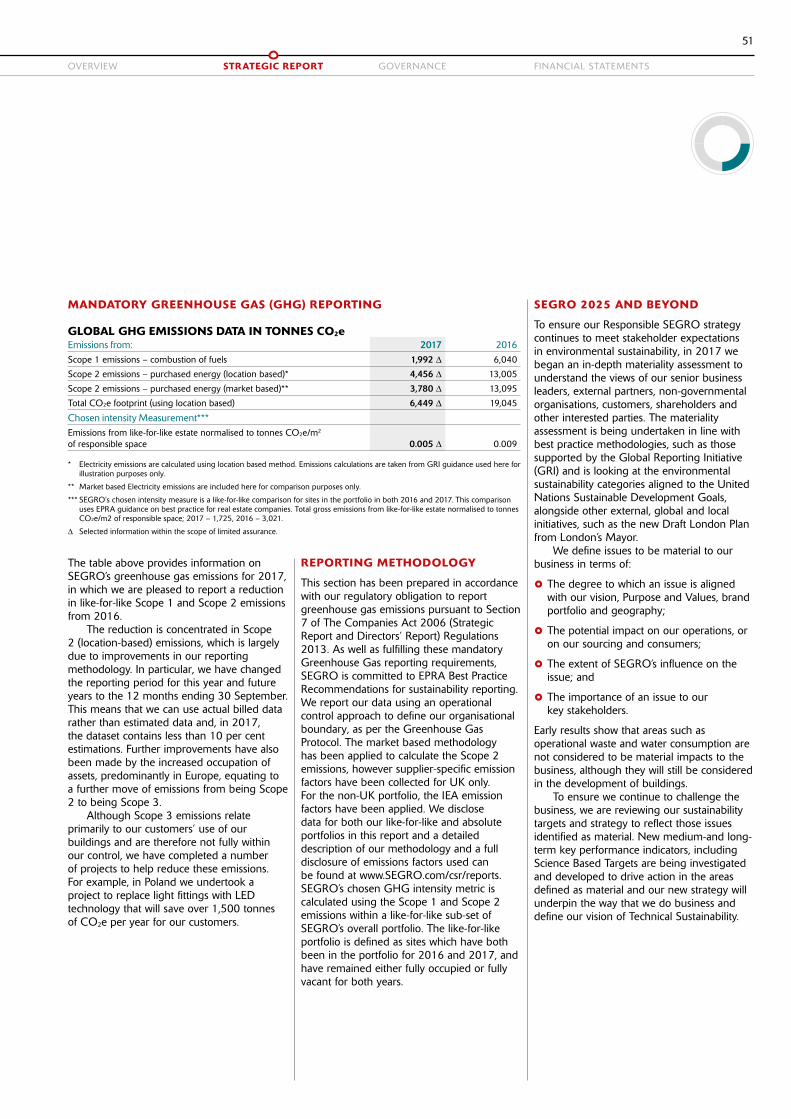
51
OVERVIEW STRATEGIC REPORT GOVERNANCE FINANCIAL STATEMENTS
The table above provides information on SEGRO’s greenhouse gas emissions for 2017, in which we are pleased to report a reduction in like-for-like Scope 1 and Scope 2 emissions from 2016.
The reduction is concentrated in Scope 2 (location-based) emissions, which is largely due to improvements in our reporting methodology. In particular, we have changed the reporting period for this year and future years to the 12 months ending 30 September. This means that we can use actual billed data rather than estimated data and, in 2017, the dataset contains less than 10 per cent estimations. Further improvements have also been made by the increased occupation of assets, predominantly in Europe, equating to a further move of emissions from being Scope 2 to being Scope 3.
Although Scope 3 emissions relate primarily to our customers’ use of our buildings and are therefore not fully within our control, we have completed a number of projects to help reduce these emissions. For example, in Poland we undertook a project to replace light fittings with LED technology that will save over 1,500 tonnes of CO2e per year for our customers.
MANDATORY GREENHOUSE GAS (GHG) REPORTING
GLOBAL GHG EMISSIONS DATA IN TONNES CO2eEmissions from: 2017 2016Scope 1 emissions – combustion of fuels 1,992 ∆ 6,040
Scope 2 emissions – purchased energy (location based)* 4,456 ∆ 13,005
Scope 2 emissions – purchased energy (market based)** 3,780 ∆ 13,095
Total CO2e footprint (using location based) 6,449 ∆ 19,045
Chosen intensity Measurement***
Emissions from like-for-like estate normalised to tonnes CO2e/m2 of responsible space 0.005 ∆ 0.009
* Electricity emissions are calculated using location based method. Emissions calculations are taken from GRI guidance used here for illustration purposes only.
** Market based Electricity emissions are included here for comparison purposes only.
*** SEGRO’s chosen intensity measure is a like-for-like comparison for sites in the portfolio in both 2016 and 2017. This comparison uses EPRA guidance on best practice for real estate companies. Total gross emissions from like-for-like estate normalised to tonnes CO2e/m2 of responsible space; 2017 – 1,725, 2016 – 3,021.
∆ Selected information within the scope of limited assurance.
SEGRO 2025 AND BEYOND
To ensure our Responsible SEGRO strategy continues to meet stakeholder expectations in environmental sustainability, in 2017 we began an in-depth materiality assessment to understand the views of our senior business leaders, external partners, non-governmental organisations, customers, shareholders and other interested parties. The materiality assessment is being undertaken in line with best practice methodologies, such as those supported by the Global Reporting Initiative (GRI) and is looking at the environmental sustainability categories aligned to the United Nations Sustainable Development Goals, alongside other external, global and local initiatives, such as the new Draft London Plan from London’s Mayor.
We define issues to be material to our business in terms of:
££ The degree to which an issue is aligned with our vision, Purpose and Values, brand portfolio and geography;
££ The potential impact on our operations, or on our sourcing and consumers;
££ The extent of SEGRO’s influence on the issue; and
££ The importance of an issue to our key stakeholders.
Early results show that areas such as operational waste and water consumption are not considered to be material impacts to the business, although they will still be considered in the development of buildings.
To ensure we continue to challenge the business, we are reviewing our sustainability targets and strategy to reflect those issues identified as material. New medium-and long-term key performance indicators, including Science Based Targets are being investigated and developed to drive action in the areas defined as material and our new strategy will underpin the way that we do business and define our vision of Technical Sustainability.
REPORTING METHODOLOGY
This section has been prepared in accordance with our regulatory obligation to report greenhouse gas emissions pursuant to Section 7 of The Companies Act 2006 (Strategic Report and Directors’ Report) Regulations 2013. As well as fulfilling these mandatory Greenhouse Gas reporting requirements, SEGRO is committed to EPRA Best Practice Recommendations for sustainability reporting. We report our data using an operational control approach to define our organisational boundary, as per the Greenhouse Gas Protocol. The market based methodology has been applied to calculate the Scope 2 emissions, however supplier-specific emission factors have been collected for UK only. For the non-UK portfolio, the IEA emission factors have been applied. We disclose data for both our like-for-like and absolute portfolios in this report and a detailed description of our methodology and a full disclosure of emissions factors used can be found at www.SEGRO.com/csr/reports. SEGRO’s chosen GHG intensity metric is calculated using the Scope 1 and Scope 2 emissions within a like-for-like sub-set of SEGRO’s overall portfolio. The like-for-like portfolio is defined as sites which have both been in the portfolio for 2016 and 2017, and have remained either fully occupied or fully vacant for both years.

SEGRO PLC | ANNUAL REPORT & ACCOUNTS 2017
52
OUR STAKEHOLDERS
RESPONSIBLE SEGRO
WE ARE COMMITTED TO ENSURING THAT WE ACT IN THE BEST INTEREST OF ALL OUR STAKEHOLDERS.”
ANDY GULLIFORDCHIEF OPERATING OFFICER
CUSTOMERS
Our customer relationships are critical to the success of our business and we aim to deliver excellent customer service at all times. Through strong and enduring relationships with our customers and an informed understanding of their businesses and markets, we strive to be seen as a partner in their business rather than simply a landlord: our success is dependent on their success. We have continued to invest in our Key Account Management programme throughout 2017, with our strategy to broaden our services to customers as well as deepen our customer knowledge. We have established a number of strategic cross-border key accounts which have assisted us in working in partnership with customers and have resulted in mutually beneficial opportunities arising over the course of the year.
Our Key Account Management teams incorporate employees from across the Group who proactively share information and material through a number of channels. This allows them to draw up customer specific
strategies to ensure we meet and exceed customer expectations and make certain that our strategies are closely aligned.
In 2017, we initiated and completed several strategy workshops which involved representatives from SEGRO and individual customers. These workshops facilitated mutual sharing of opportunities and challenges enabling us to grow our customer relationships through trust, collaboration and partnership.
This work has been reflected in the results of our Customer Satisfaction Survey which we now conduct three times per year on a rolling basis, rather than once annually. This has allowed us to achieve a more accurate year on year comparison and to respond more quickly to any issues which arise.
Some of the key highlights from our 2017 results are as follows:
££ A total of 293 surveys were completed (including 13 of our Key Accounts).
££ Overall Occupier Satisfaction was 87 per cent (8 per cent up on 2016).
££ Overall all categories and Business Units improved in 2017 from 2016.
££ Customer willingness to recommend SEGRO was 94 per cent.
We also launched a Strategic Customer Survey in 2017 which aims to engage with senior decision makers within our customer base. The survey aims to provide unique insights and understanding of the strategic issues that our customers face, particularly the major (disruptive) market drivers that might impact businesses, and has helped us better appreciate the future requirements and needs of our customers. We intend to discuss the results at our 2018 Customer Futures Forum and use them to stimulate discussion on how we can better serve our customers.
In practical terms, during the year we introduced Customer Co-ordinators in each Business Unit to share best practices across the Company, while also providing consistency in our approach. This collaborative approach has improved our customer intelligence and streamlined our operations, delivering benefits for both our business and our customers.
NUMBER OF CUSTOMERS
2016: 1,200
1,080
OCCUPIER SATISFACTION IN OUR 2017 SURVEY
2016: 79%
87% SUPPLIER SPEND PER ANNUM
REPRESENTATIVES FROM INSTITUTIONAL SHAREHOLDERS MET BY SENIOR MANAGEMENT IN 2017
2016: OVER £400m
2016: 148
OVER £600m
181
Our approach to our stakeholders is central to our business. In order to achieve our goal to be the best owner‑manager and developer of industrial property in Europe, we keep in close contact with our customers, suppliers and investors to ensure that we are aware of each others’ priorities so we can be confident that we are acting in our mutual interest.
We always seek to improve our stakeholder engagement and have done so again in 2017, reflecting in particular a significant improvement in the results of our customer satisfaction survey and awards for our marketing, communications and investor relations teams.
Only through regular communication and the pursuit of continuous improvement in our engagement and service can we ensure that we have supportive stakeholders and partners for the long term.

53
OVERVIEW STRATEGIC REPORT GOVERNANCE FINANCIAL STATEMENTS
LEROY MERLIN
SEGRO works in close partnership with Leroy Merlin to enhance our understanding of their strategic goals and enable us to offer appropriate solutions for the company within our markets.
In line with our expansion plans in Italy, SEGRO extended the company’s building in Milan from 93,000 sq m to 140,000 sq m.
SEGRO is now working with the company to provide an urban logistics facility close to Paris. The company’s decision to work with SEGRO in France and in a new area of its supply chain reflects the strength of the relationship and the benefits SEGRO has gained from building a strategic partnership.
“ Leroy Merlin is delighted to be continuing our long‑standing relationship with SEGRO, through its subsidiary VAILOG. The SEGRO team’s understanding of our business has enabled us to make investments into new parts of our supply chain to help future proof our business.”
ERIC DEWITTE DIRECTOR SUPPLY CHAIN & CSR AT LEROY MERLIN
SUPPLIERS
SEGRO is committed to ensuring a secure and safe supply chain in all parts of the business.
We spend over £600 million per annum working with approximately 2,500 suppliers across the Group, ranging from small local businesses to large multinational companies.We remain dedicated to only doing business with suppliers that have been thoroughly checked and approved as legitimate, competent, safe and appropriately insured and require all suppliers to adhere to our Code of Ethics, which is summarised on page 43 of this report.
Compliance rates for new suppliers is 100 per cent, and for the entire supply chain it was 86 per cent at 31 December 2017. During the year we added compliance with UK modern slavery legislation to certain of our suppliers following a due diligence risk review.
We continue to be a signatory to the UK Prompt Payment Code and 82 per cent of invoices received in 2017 were paid within the allocated timeframe.
During 2017 we implemented a system change that reduced the time to register new suppliers by two days.
INVESTORS
Our shareholders’ confidence in our business is critical to our success. We therefore ensure that all shareholders from large institutions to individual shareholders are regularly updated about our performance and are given opportunities to interact with us.
Our dedicated Investor Relations team has an extensive engagement programme which enables shareholders to meet management throughout the year and gain a better understanding of our business strategy and performance. The programme includes an Annual General Meeting, management meetings with institutional investors, attendance at investor conferences, presentations to investment banks and site visits, as well as more informal events.
The Investor Relations team works closely with the Marketing and Communications team to ensure that existing and potential investors are kept informed about our business. This was reflected in the teams’ success in winning Best Investor Relations awards from the Investor Relations Society and Institutional Investor magazine and Property Marketing Team of the Year and Best Marketing Campaign: Retail, Industrial and Logistics at the Property Marketing Awards.
During 2017, the Executive Directors and the Investor Relations team met with representatives from 181 institutions.
Further information regarding our investors can be found on page 82 of the Governance section.
INDUSTRY BODIES
SEGRO continues to be represented on key industry bodies to support the improvements of sector standards and to ensure the importance of the industrial sector is fully understood. In 2017, David Sleath was President of the British Property Federation (BPF) and a number of SEGRO employees participate in a range of industry bodies locally and nationally in the markets in which we operate, and internationally in our membership of EPRA, the European industry body representing listed property companies.
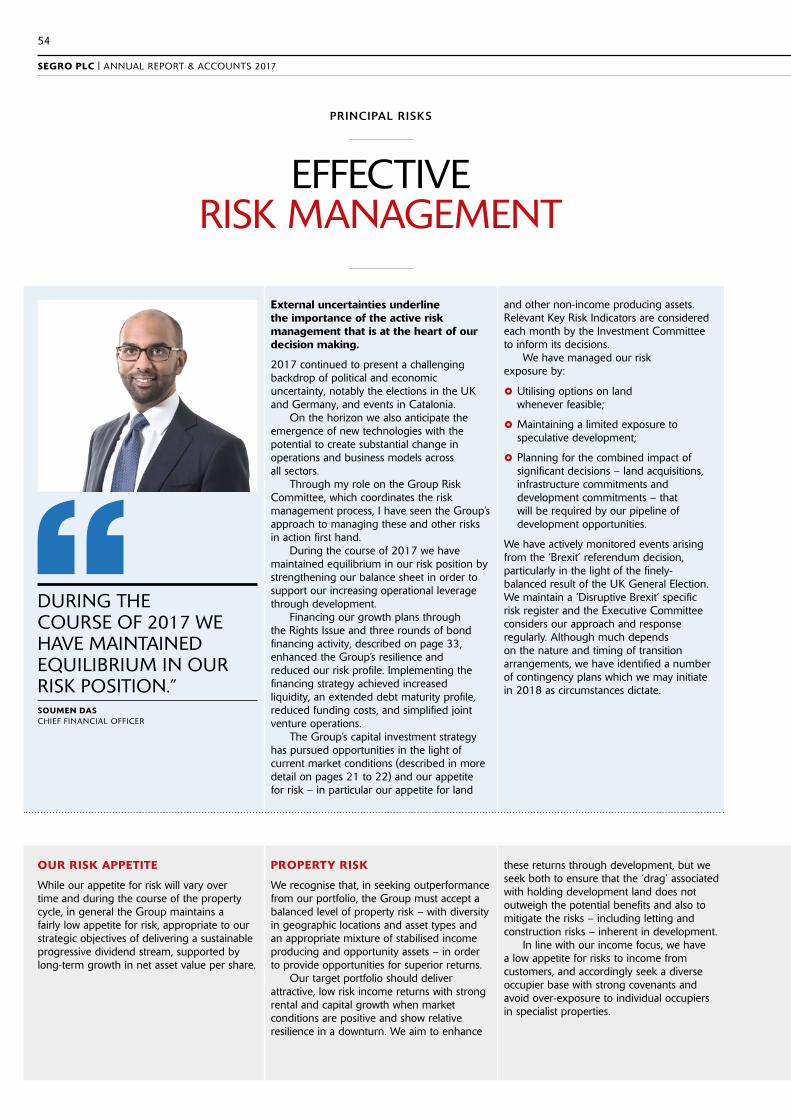
SEGRO PLC | ANNUAL REPORT & ACCOUNTS 2017
54
PRINCIPAL RISKS
EFFECTIVE RISK MANAGEMENT
OUR RISK APPETITE
While our appetite for risk will vary over time and during the course of the property cycle, in general the Group maintains a fairly low appetite for risk, appropriate to our strategic objectives of delivering a sustainable progressive dividend stream, supported by long-term growth in net asset value per share.
PROPERTY RISK
We recognise that, in seeking outperformance from our portfolio, the Group must accept a balanced level of property risk – with diversity in geographic locations and asset types and an appropriate mixture of stabilised income producing and opportunity assets – in order to provide opportunities for superior returns.
Our target portfolio should deliver attractive, low risk income returns with strong rental and capital growth when market conditions are positive and show relative resilience in a downturn. We aim to enhance
these returns through development, but we seek both to ensure that the ‘drag’ associated with holding development land does not outweigh the potential benefits and also to mitigate the risks – including letting and construction risks – inherent in development.
In line with our income focus, we have a low appetite for risks to income from customers, and accordingly seek a diverse occupier base with strong covenants and avoid over-exposure to individual occupiers in specialist properties.
External uncertainties underline the importance of the active risk management that is at the heart of our decision making.
2017 continued to present a challenging backdrop of political and economic uncertainty, notably the elections in the UK and Germany, and events in Catalonia.
On the horizon we also anticipate the emergence of new technologies with the potential to create substantial change in operations and business models across all sectors.
Through my role on the Group Risk Committee, which coordinates the risk management process, I have seen the Group’s approach to managing these and other risks in action first hand.
During the course of 2017 we have maintained equilibrium in our risk position by strengthening our balance sheet in order to support our increasing operational leverage through development.
Financing our growth plans through the Rights Issue and three rounds of bond financing activity, described on page 33, enhanced the Group’s resilience and reduced our risk profile. Implementing the financing strategy achieved increased liquidity, an extended debt maturity profile, reduced funding costs, and simplified joint venture operations.
The Group’s capital investment strategy has pursued opportunities in the light of current market conditions (described in more detail on pages 21 to 22) and our appetite for risk – in particular our appetite for land
and other non-income producing assets. Relevant Key Risk Indicators are considered each month by the Investment Committee to inform its decisions.
We have managed our risk exposure by:
££ Utilising options on land whenever feasible;
££ Maintaining a limited exposure to speculative development;
££ Planning for the combined impact of significant decisions – land acquisitions, infrastructure commitments and development commitments – that will be required by our pipeline of development opportunities.
We have actively monitored events arising from the ‘Brexit’ referendum decision, particularly in the light of the finely-balanced result of the UK General Election. We maintain a ‘Disruptive Brexit’ specific risk register and the Executive Committee considers our approach and response regularly. Although much depends on the nature and timing of transition arrangements, we have identified a number of contingency plans which we may initiate in 2018 as circumstances dictate.
DURING THE COURSE OF 2017 WE HAVE MAINTAINED EQUILIBRIUM IN OUR RISK POSITION.”SOUMEN DASCHIEF FINANCIAL OFFICER
55
OVERVIEW STRATEGIC REPORT GOVERNANCE FINANCIAL STATEMENTS
The Group recognises that its ability to manage risk effectively throughout the organisation continues to be central to its success. Our approach to risk management aims to bring controllable risks within our appetite, and to enable our decision making to balance uncertainty against the objective of creating value for our shareholders.
OUR INTEGRATED AND ROBUST APPROACH TO RISK MANAGEMENT
The Board has overall responsibility for ensuring that risk is effectively managed across the Group. The Audit Committee monitors the effectiveness of the Group’s risk management process on behalf of the Board. Further information on compliance with the risk management provisions of the UK Corporate Governance Code can be found in the Governance section on page 63.
The risk management process is designed to identify, evaluate and mitigate the significant risks that the Group faces. The process aims to understand and mitigate, rather than eliminate, the risk of failure to achieve business objectives, and therefore can only provide reasonable and not absolute assurance.
The Board recognises that it has limited control over many of the external risks it faces, such as the macro-economic environment, but it reviews the potential impact of such risks on the business and actively considers them in its decision making. The Board also monitors internal risks and ensures that appropriate controls are in place to manage them.
In order to robustly assess the principal risks facing the Group, the Board has taken a number of measures. The Board has formally reviewed the principal risks twice during the year. The Board has also completed its annual review and approval of the Group’s risk appetite, and has approved the Group’s risk management policy. The Audit Committee receives a report twice a year on how the Group Risk Register has been compiled. The Group adopts the ‘three lines of defence’ model of risk management: operational management, the individual risk manager and risk owner provide the first line; the Executive Committee, other monitoring committees, and the risk management function overseen by the Group Risk Committee provide the second; and Internal Audit provide the third line of defence.
Risks are considered within each area of the business to ensure that risk management is embedded within the Group’s decision-making processes and culture.
Accountabilities for the Group’s risk management are outlined in the diagram on page 56.
We have put risk appetite at the heart of our risk management processes. Risk appetite is integral both to our consideration of strategy and to our medium-term planning process. Risk appetite also defines specific tolerances and targets for key metrics and the criteria for assessing the potential impact of risks and our mitigation of them.
The most significant risks and mitigating controls are detailed in the Group Risk Register. Risks are assessed in both unmitigated (assuming that no controls are in place) and residual (with mitigating controls operating normally) states. This assessment directly relates potential impact to risk appetite so that it is clear whether each risk is comfortably within appetite, tolerable, intolerable or below appetite. We also formally assess the velocity of the most significant risks to determine how quickly they might cause an intolerable impact on us.
A Key Risk Indicator (KRI) dashboard is produced on a monthly basis to show actual and forecast performance against risk appetite metrics. KRIs are considered in the Group’s Medium Term Plan.
Mitigations for each risk are documented and monitored in the Group Risk Register. The Register is used as a key input to determine priorities for the Group’s internal audit assurance programme. Management’s annual assessment of control effectiveness is driven by the Group’s Risk Register.
FINANCIAL RISK
The Group maintains a low to moderate appetite for financial risk in general, with a very low appetite for risks to solvency and gearing covenant breaches.
As an income-focused REIT we have a low appetite for risks to maintaining stable progression in earnings and dividends over the long term. We are, however, prepared to tolerate fluctuations in dividend cover as a consequence of capital recycling activity.
We also seek long-term growth in net asset value per share. Our appetite for risks to net asset value from the factors within our
control is low, albeit acknowledging that our appetite for moderate leverage across the cycle amplifies the impact of asset valuation movements on net asset value.
CORPORATE RISK
We have a very low appetite for risks to our good reputation and risks to being well-regarded by our investors, regulators, employees, customers, business partners, suppliers, lenders and by the wider communities and environments in which we operate.
Our responsibilities to these stakeholders include compliance with all relevant laws; accurate and timely reporting of financial and other regulatory information; safeguarding the health and safety of employees, suppliers, customers and other users of our assets; safeguarding the environment; compliance with codes of conduct and ethics; ensuring business continuity; and making a positive contribution to the communities in which we operate.

56
SEGRO PLC | ANNUAL REPORT & ACCOUNTS 2017
OUR FRAMEWORK FOR RISK GOVERNANCE
First line of defence Second line Third line
BOARD AUDIT COMMITTEE
° Overall responsibility for ensuring that risk is effectively managed across the Group.
° Determines the Group’s risk appetite.
° Conducts robust assessment of Group’s risks.
RISK MANAGERS
° Responsible for ensuring the risk is within appetite.
° Drive design and implementation of controls.
° Review and assess existing risks with risk management function at least twice per year.
MONITORING COMMITTEES
° Regularly identify and monitor the significant risks and corresponding controls within their domains.
° Risk management function attends regularly.
GROUP RISK COMMITTEE
° Coordinates the risk management process on behalf of the Executive Committee.
° Develops risk policy.
° Oversees the work of the Risk Management function, which in turn:
– Manages and reports on the risk register.
– Assesses and documents risks and controls.
– Provides quality assurance and challenge to risk owners and managers.
EXECUTIVE COMMITTEE
° Oversees execution of risk management across the business.
° Formally considers risks, including emerging risks, four times per year.
° Directly oversees strategic risks.
° Delegates accountability for risk management and monitors performance of risk controls.
° Assigns Executive Risk Owners to each risk.
EXECUTIVE RISK OWNERS
° Own risks in domain.
° Assign accountability for mitigating individual risks to senior risk managers.
° Ensure that risks are identified, assessed and adequately controlled.
° Review risks with the risk management function at least twice per year.
INTERNAL AUDIT
° Agrees internal audit programme considering Group Risk Register.
° Conducts internal audit programme and reports to Audit Committee.
° Monitors effectiveness of the Group’s risk management process and internal control systems.
PRINCIPAL RISKS
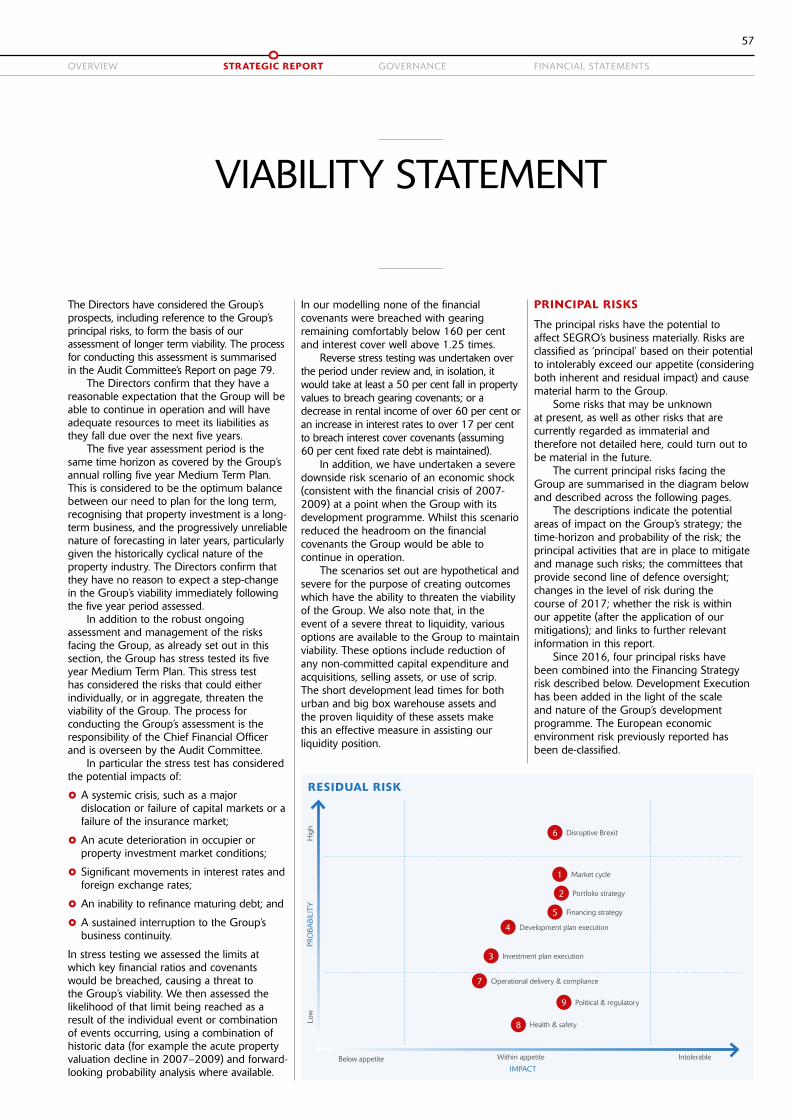
57
OVERVIEW STRATEGIC REPORT GOVERNANCE FINANCIAL STATEMENTS
The Directors have considered the Group’s prospects, including reference to the Group’s principal risks, to form the basis of our assessment of longer term viability. The process for conducting this assessment is summarised in the Audit Committee’s Report on page 79.
The Directors confirm that they have a reasonable expectation that the Group will be able to continue in operation and will have adequate resources to meet its liabilities as they fall due over the next five years.
The five year assessment period is the same time horizon as covered by the Group’s annual rolling five year Medium Term Plan. This is considered to be the optimum balance between our need to plan for the long term, recognising that property investment is a long-term business, and the progressively unreliable nature of forecasting in later years, particularly given the historically cyclical nature of the property industry. The Directors confirm that they have no reason to expect a step-change in the Group’s viability immediately following the five year period assessed.
In addition to the robust ongoing assessment and management of the risks facing the Group, as already set out in this section, the Group has stress tested its five year Medium Term Plan. This stress test has considered the risks that could either individually, or in aggregate, threaten the viability of the Group. The process for conducting the Group’s assessment is the responsibility of the Chief Financial Officer and is overseen by the Audit Committee.
In particular the stress test has considered the potential impacts of:
££ A systemic crisis, such as a major dislocation or failure of capital markets or a failure of the insurance market;
££ An acute deterioration in occupier or property investment market conditions;
££ Significant movements in interest rates and foreign exchange rates;
££ An inability to refinance maturing debt; and
££ A sustained interruption to the Group’s business continuity.
In stress testing we assessed the limits at which key financial ratios and covenants would be breached, causing a threat to the Group’s viability. We then assessed the likelihood of that limit being reached as a result of the individual event or combination of events occurring, using a combination of historic data (for example the acute property valuation decline in 2007–2009) and forward-looking probability analysis where available.
In our modelling none of the financial covenants were breached with gearing remaining comfortably below 160 per cent and interest cover well above 1.25 times.
Reverse stress testing was undertaken over the period under review and, in isolation, it would take at least a 50 per cent fall in property values to breach gearing covenants; or a decrease in rental income of over 60 per cent or an increase in interest rates to over 17 per cent to breach interest cover covenants (assuming 60 per cent fixed rate debt is maintained).
In addition, we have undertaken a severe downside risk scenario of an economic shock (consistent with the financial crisis of 2007-2009) at a point when the Group with its development programme. Whilst this scenario reduced the headroom on the financial covenants the Group would be able to continue in operation.
The scenarios set out are hypothetical and severe for the purpose of creating outcomes which have the ability to threaten the viability of the Group. We also note that, in the event of a severe threat to liquidity, various options are available to the Group to maintain viability. These options include reduction of any non-committed capital expenditure and acquisitions, selling assets, or use of scrip. The short development lead times for both urban and big box warehouse assets and the proven liquidity of these assets make this an effective measure in assisting our liquidity position.
PRINCIPAL RISKS
The principal risks have the potential to affect SEGRO’s business materially. Risks are classified as ‘principal’ based on their potential to intolerably exceed our appetite (considering both inherent and residual impact) and cause material harm to the Group.
Some risks that may be unknown at present, as well as other risks that are currently regarded as immaterial and therefore not detailed here, could turn out to be material in the future.
The current principal risks facing the Group are summarised in the diagram below and described across the following pages.
The descriptions indicate the potential areas of impact on the Group’s strategy; the time-horizon and probability of the risk; the principal activities that are in place to mitigate and manage such risks; the committees that provide second line of defence oversight; changes in the level of risk during the course of 2017; whether the risk is within our appetite (after the application of our mitigations); and links to further relevant information in this report.
Since 2016, four principal risks have been combined into the Financing Strategy risk described below. Development Execution has been added in the light of the scale and nature of the Group’s development programme. The European economic environment risk previously reported has been de-classified.
VIABILITY STATEMENT
Disruptive Brexit
Market cycle
Financing strategy
Portfolio strategy
Development plan execution
Investment plan execution
Operational delivery & compliance
Health & safety
Political & regulatory
RESIDUAL RISK
3
7
8
9
4
2
5
1
6
IMPACT
Intolerable
Hig
h
Within appetite
PRO
BABI
LITY
Below appetite
Low

58
SEGRO PLC | ANNUAL REPORT & ACCOUNTS 2017
PRINCIPAL RISKS
PRINCIPAL RISKS
1. MARKET CYCLE The property market is cyclical and there is a continuous risk that the Group could either misinterpret the market or fail to react appropriately to changing market conditions, which could result in capital being invested or disposals taking place at the wrong price or time in the cycle.
This is a continuous risk with a moderate likelihood.
MITIGATIONS
The Board, Executive Committee and Investment Committee monitor the property market cycle on a continual basis and adapt the Group’s investment/divestment strategy in anticipation of changing market conditions.
Multiple, diverse investment and occupier market intelligence is regularly received and considered – both from internal ‘on the ground’ sources and from independent external sources.
Upside and downside scenarios are incorporated into Investment Committee papers to assess the impact of differing market conditions.
2. PORTFOLIO STRATEGY The Group’s Total Property and/or Shareholder Returns could underperform in absolute or relative terms as a result of an inappropriate portfolio strategy. This could result from:
££ Holding the wrong balance of prime or secondary assets;
££ Holding the wrong amounts or types of land, leading to diluted returns and/or constraints on development opportunities;
££ Holding the wrong level of higher risk ‘opportunity’ assets or too many old or obsolete assets which dilute returns; and
££ Holding assets in the wrong geographical markets; missing opportunities in new markets or lacking critical mass in existing markets.
This is a continuous risk with a moderate likelihood.
MITIGATIONS
The Group’s portfolio strategy is subject to regular review by the Board to consider the desired shape of the portfolio in order to meet the Group’s overall objectives and to determine our response to changing opportunities and market conditions.
The Group’s Disciplined Capital Allocation is informed by comprehensive asset plans and independent external assessments of market conditions and forecasts.
Regular portfolio analysis ensures the portfolio is correctly positioned in terms of location and asset type, and retains the right balance of core and opportunity assets. The annual asset planning exercise provides a bottom-up assessment of the performance and potential for all assets to identify underperforming assets that are considered for sale.
3. INVESTMENT PLAN EXECUTIONDecisions to buy, hold, sell or develop assets could be flawed due to uncertainty in analysis, quality of assumptions, poor due diligence or unexpected changes in the economic or operating environment.
Our investment decisions could be insufficiently responsive to implement our strategy effectively.
This is a continuous risk with a moderate likelihood as changing investment and occupier market conditions require constant adaptation.
MITIGATIONS
Asset plans are prepared annually for all estates to determine where to invest capital in existing assets and to identify assets for disposal.
Locally-based property investment and operational teams provide market intelligence and networking to source attractive opportunities.
Policies are in place to govern evaluation, due diligence, approval, execution and subsequent review of investment activity.
The Investment Committee meets frequently to review investment and disposal proposals and to consider appropriate capital allocation.
Investment hurdle rates are regularly reappraised taking into account estimates of our weighted average cost of capital.
Major capital investment and disposal decisions are subject to Board approval.
OVERSEEN BY: EXECUTIVE COMMITTEE
FURTHER INFORMATION: THE MARKET OUTLOOK IS DETAILED IN THE CHIEF EXECUTIVE’S STATEMENT ON PAGES 10-12.
OVERSEEN BY: EXECUTIVE COMMITTEE
FURTHER INFORMATION: THE MARKET OUTLOOK IS DETAILED IN THE CHIEF EXECUTIVE’S STATEMENT ON PAGES 10-12.
OVERSEEN BY: EXECUTIVE COMMITTEE; INVESTMENT COMMITTEE
FURTHER INFORMATION: THE MARKET OUTLOOK IS DETAILED IN THE CHIEF EXECUTIVE’S STATEMENT ON PAGES 10-12.
IMPACT ON STRATEGY
CHANGE IN 2017
RESIDUAL RISK WITHIN APPETITE?
IMPACT ON STRATEGY
CHANGE IN 2017
RESIDUAL RISK WITHIN APPETITE?
IMPACT ON STRATEGY
CHANGE IN 2017
RESIDUAL RISK WITHIN APPETITE?

59
OVERVIEW STRATEGIC REPORT GOVERNANCE FINANCIAL STATEMENTS
EFFICIENT CAPITAL AND CORPORATE STRUCTURE
OPERATIONAL EXCELLENCE
DISCIPLINED CAPITAL ALLOCATION
SIMILAR RISK
DECREASED RISK
INCREASED RISK
4. DEVELOPMENT PLAN EXECUTIONThe Group has an extensive current programme and future pipeline of developments. The Group could suffer significant financial losses from:
££ Cost over-runs on larger, more complex projects.
££ Increased competition and/or construction costs (from labour market changes or weakened supply competition) leading to reduced or uneconomic development yields.
££ Above-appetite exposure to non-income producing land, infrastructure and speculatively developed buildings arising from a sharp deterioration in occupier demand.
This is a medium-term risk with a moderate likelihood.
MITIGATIONS
Our appetite for exposure to non-income producing assets (including land, infrastructure and speculative developments) is monitored closely.
We retain a high level of ‘optionality’ in our future development programme including at the point of land acquisition, commitment to infrastructure and commitment to building.
The development programme remains weighted towards pre-let opportunities.
The risk of cost-overruns is mitigated by our experienced development teams and the use of trusted advisors and contractors.
Our short development lead-times enable a quick response to changing market conditions.
5. FINANCING STRATEGYThe Group could suffer an acute liquidity or solvency crisis, financial loss or financial distress as a result of a failure in the design or execution of its financing strategy.
Such an event may be caused by: a failure to obtain debt funding (e.g due to market disruption or rating downgrade); having an inappropriate debt structure (including leverage level, debt maturity, interest rate or currency exposure); poor forecasting; default on loan agreements as a result of a breach of financial or other covenants; or counterparty default.
This is short and long-term risk with a very low likelihood.
MITIGATIONS
The Group’s financing strategy is aligned with our long-term business strategy, the Medium Term Plan and our risk appetite. The Treasury policy defines key policy parameters and controls to support execution of the strategy.
The Group regularly reviews its changing financing requirements in the light of opportunities and market conditions.
As well as the Rights Issue, 2017 saw extensive financing and re-financing activity with a US private placement, a bond buyback and issue, a SELP bond issue, and increased revolving debt facilities. These actions have strengthened the balance sheet, lowered the average cost of debt, increased debt maturity, and demonstrated the ability to access debt capital markets.
6. DISRUPTIVE BREXITThe uncertainty associated with the UK’s decision to exit the EU may impact investment, capital, financial (including foreign exchange) and occupier markets in the UK during the transition period as the terms of exit and future relationships are negotiated, and in the longer term. In the long term, exit from the EU could reduce levels of investor and occupier demand as a result of reduced trade and/or the relocation of corporations and financial institutions away from the UK.
The likelihood of severe adverse impact on the Group is judged to be low.
MITIGATIONS
A Brexit-specific risk register is maintained and we continue to monitor a range of indicators across occupational, investment and capital markets. We have not observed significant adverse factors to date. Structural drivers of demand appear to have continued to outweigh any Brexit-related uncertainties.
Nevertheless, in the light of increased uncertainty, the Group has continued to adopt a cautious approach to land acquisition and speculative development.
The Group’s high quality portfolio of prime industrial assets is diverse in terms of geography and 32 per cent of gross asset value at share is in Continental Europe and sector exposure.
The Group’s existing strategy for resilience through the market cycle also provides mitigations. As well as the underlying quality and diversity of the portfolio, these include substantial covenant headroom, access to diverse sources of funding, and FX and interest rate hedging. In addition, our short development lead-times enable a quick response to changing market conditions.
OVERSEEN BY: EXECUTIVE COMMITTEE, OPERATIONS COMMITTEE
OVERSEEN BY: EXECUTIVE COMMITTEE OVERSEEN BY: EXECUTIVE COMMITTEE
FURTHER INFORMATION: THE GROUP’S RESPONSE TO THIS RISK IS DESCRIBED ON PAGE 54.
IMPACT ON STRATEGY
CHANGE IN 2017THIS RISK HAS INCREASED AS A RESULT OF OUR INCREASED DEVELOPMENT PIPELINE.
RESIDUAL RISK WITHIN APPETITE?
IMPACT ON STRATEGY
CHANGE IN 2017THIS RISK HAS REDUCED AS A RESULT OF THE EQUITY AND DEBT FUNDING SECURED IN THE YEAR.
RESIDUAL RISK WITHIN APPETITE?
IMPACT ON STRATEGY
CHANGE IN 2017THE INCREASED RATING IS A REFLECTION OF CONTINUING UNCERTAINTY AS MARCH 2019 APPROACHES.
RESIDUAL RISK WITHIN APPETITE?

60
SEGRO PLC | ANNUAL REPORT & ACCOUNTS 2017
EFFICIENT CAPITAL AND CORPORATE STRUCTURE
OPERATIONAL EXCELLENCE
DISCIPLINED CAPITAL ALLOCATION
SIMILAR RISK
DECREASED RISK
INCREASED RISK
PRINCIPAL RISKS CONTINUED
7. OPERATIONAL DELIVERY AND COMPLIANCEThe Group’s ability to protect its reputation, revenues and shareholder value could be damaged by operational failures such as: environmental damage; failing to attract, retain and motivate key staff; a breach of anti-bribery and corruption or other legislation; major customer default; supply chain failure; the structural failure of one of our assets; a major high-profile incident involving one of our assets; a cyber-security breach; or failure to respond to the consequences of climate change.
Compliance failures, such as breaches of joint venture shareholders’ agreements, loan agreements or tax legislation could also damage reputation, revenue and shareholder value.
This is a continuous risk with a low likelihood of causing significant harm to the Group.
MITIGATIONS
The Group maintains a strong focus on Operational Excellence. The Executive, Operations, and Business Information Systems Committees regularly monitor the range of risks to property management, construction, compliance, business continuity, organisational effectiveness, customer management and cyber security.
The Group’s tax compliance is managed by an experienced internal tax team. REIT and SIIC tax regime compliance is demonstrated at least bi-annually. Compliance with joint venture shareholder agreements is managed by experienced property operations, finance and legal staff. The SELP JV additionally has comprehensive governance and compliance arrangements in place, including dedicated management, operating manuals, and specialist third-party compliance support.
8. HEALTH AND SAFETYHealth and safety management processes could fail, leading to a loss of life, litigation, fines and serious reputational damage to the Group.
This is a continuous risk with a low likelihood of causing significant harm to the Group. Nevertheless, we note that this risk is somewhat increased by the scale of the Group’s development activity.
MITIGATIONS
The Group manages an active health and safety management system, with a particular focus on managing the quality and compliance to good health and safety practice of construction and maintenance contractors.
A published Health and Safety policy is backed up by independent site inspections of both existing assets as well as development projects against SEGRO’s Health & Safety Construction Standard.
A new online Health and Safety system, named Safety Matters, has been launched to enhance tracking, trend analysis, and compliance monitoring against agreed safety standards.
9. POLITICAL AND REGULATORYThe Group could fail to anticipate significant political, legal, tax or regulatory changes, leading to a significant un-forecasted financial or reputational impact.
In general, regulatory matters present medium- to long-term risks with a low likelihood of causing significant harm to the Group.
Political risks could impact business confidence and conditions in the short and longer terms.
MITIGATIONS
Emerging risks in this category are reviewed regularly by the Executive Committee.
Corporate heads of function consult with external advisers, attend industry and specialist briefings, and sit on key industry bodies such as EPRA and BPF.
A number of potential risks were identified, assessed and managed during the course of the year. None were individually considered to be material enough to be classified as principal risks.
OVERSEEN BY: OPERATIONS COMMITTEE; BUSINESS INFORMATION SYSTEMS COMMITTEE; EXECUTIVE COMMITTEE
OVERSEEN BY: OPERATIONS COMMITTEE; EXECUTIVE COMMITTEE
FURTHER INFORMATION: HEALTH AND SAFETY IN OUR SUPPLY CHAIN IS DISCUSSED ON PAGE 45.
OVERSEEN BY: EXECUTIVE COMMITTEE
IMPACT ON STRATEGY
CHANGE IN 2017
RESIDUAL RISK WITHIN APPETITE?
IMPACT ON STRATEGY
CHANGE IN 2017
RESIDUAL RISK WITHIN APPETITE?
IMPACT ON STRATEGY
CHANGE IN 2017THIS RISK HAS INCREASED AS A RESULT OF THE POLITICAL EVENTS NOTED ABOVE.
RESIDUAL RISK WITHIN APPETITE?
PRINCIPAL RISKS

61
OVERVIEW STRATEGIC REPORT GOVERNANCE FINANCIAL STATEMENTS
61
GOVERNANCE
70
77
84
75
82
LEADERSHIPWhere we describe the role of the Board, its work during the year and the role of the Directors.
ACCOUNTABILITYWhere we describe the work of the Audit Committee in ensuring that the financial integrity of the Company is maintained.
REMUNERATIONWhere we detail the work of the Remuneration Committee and show how the Remuneration Policy has been applied throughout the year.
EFFECTIVENESSWhere we set out the work of the Nomination Committee to ensure that we have the appropriate balance of skills and experience.
RELATIONS WITH SHAREHOLDERS AND OTHER STAKEHOLDERSWhere we illustrate how we communicate with our shareholders and other stakeholders to ensure a good dialogue is taking place.

62
SEGRO PLC | ANNUAL REPORT & ACCOUNTS 2017
OPENING THOUGHTS FROM THE CHAIRMAN
GOVERNANCE
2017 has been another successful year for the Company where we have continued to build on the strategy put in place in 2011. The acquisition of a 50 per cent interest in the APP portfolio we did not already own, and the Rights Issue, early in the year enabled us to grow our portfolio and complete the largest volume of developments in the Company’s history, whilst also significantly strengthening our balance sheet. We were pleased that our strong performance was recognised with entry into the FTSE 100 index in May. Whilst this is not a business objective, we are mindful of the leadership responsibility of being in this index along with the increased public scrutiny this can bring at times.
It has been a time of change for the Board. 2017 was my first full year as Chairman and an opportunity for me to get to see more assets, meet some customers and to spend time with the talented people we have working for us. I continue to be impressed with the quality of teams across the whole business, especially their commitment and their enthusiasm. I joined the employee conference in Barcelona which every employee was invited to attend. We had a lively and engaging debate about the business. I am impressed with our employees’ intellectual rigour, as well as how systematically matters are thought through,
GERALD CORBETTCHAIRMAN
planned and structured. On behalf of the Board, I thank all of our employees for their hard work and dedication. We appreciate their contribution to making the Company the success that it is.
Soumen Das very much hit the ground running as CFO when he arrived in January 2017 and the case study about his induction on page 71 will tell you more about his first few months. He has been involved in a number of refinancings which has kept the Treasury and Finance teams busy throughout the year.
I believe that every board benefits from new thinking so along with Soumen, I am delighted to welcome Carol Fairweather to the Board as a Non-Executive Director. Carol joined us at the start of 2018 and her extensive retail and financial experience will be a great asset to us, particularly as we seek to help our customers to adapt to and thrive in the e-commerce revolution. Details of Carol’s appointment process and her induction are set out on pages 76 and 73 respectively. I am very much looking forward to working with her.
Margaret Ford recently informed the Board of her intention to retire as an independent Non-Executive Director at the Company’s AGM on 19 April 2018. Margaret has done an excellent job for SEGRO as a Non-Executive Director, as Chairman of our Remuneration Committee (until last year) and as our Senior Independent Director. She has made a significant contribution to the growth and success of the Company and we shall miss her wise counsel. We wish her well in the future. SEGRO remains committed to maintaining a diverse Board and we are members of the 30% Club. We shall remain mindful of the benefits of a diverse Board as we search for a suitably experienced Non-Executive Director to replace Margaret.
David Sleath continues to be an inspirational leader for the business. Not only does he drive the strategy forward but he is instrumental in setting the culture of an open and inclusive Company where employees are empowered to feel part of One SEGRO.
The Directors are keen to leave the boardroom regularly and get out to see some assets. This year we had visits to Düsseldorf and Paris where the local teams showed us some of their latest investments and some new developments. In November, as part of the Strategy Day, we had a tour of the logistics ‘Golden Triangle’ in the UK Midlands, looking at big box warehouses we already

63
OVERVIEW STRATEGIC REPORT GOVERNANCE FINANCIAL STATEMENTS
own and the land under development at SEGRO Logistics Park East Midlands Gateway. More information about the Strategy Day is on page 72.
GOVERNANCE AT A GLANCE
In this section we focus on Corporate Governance and explain how the Board and its Committees have exercised effective stewardship over the Group’s activities in the interests of shareholders and other stakeholders.
Governance is an important element of our culture and permeates all of our decisions and actions. It is central to our business and designed to create an environment where matters can be considered and decisions made at the appropriate level in the organisation. Good governance is about more than box ticking and following the letter of the UK Corporate Governance Code 2016 (the Code): it is about following the spirit and principles of the Code, communication and information flows, appropriate challenge, trust and respect, and open and honest debate in a structured environment.
SUCCESSION
As mentioned in my report last year, longer-term succession planning for the Non-Executive Directors would be a particular area of focus for the Nomination Committee in 2017. In 2019, two of our Non-Executive Directors will have been with us for nine years and letters of appointment will be due for renewal for two others. The Committee wanted an orderly transition and was
particularly keen to ensure there was plenty of time to search for the right candidates. On page 76 we set out the process to recruit Carol Fairweather.
Our work on succession planning will continue into 2018.
During the year, Martin Moore completed his first three-year term with us and the Committee considered renewing his appointment for a further three-year term. It was agreed that he continued to be an effective Non-Executive Director, made a valuable contribution to the meetings and continued to demonstrate commitment to the role. I am pleased to report that he has agreed to continue to serve as Director for a further three years.
With the changes to the Board, we decided to defer the external evaluation for just a few months and it is currently underway. I will report on the conclusions of the review next year.
LOOKING FORWARD
Looking forward, the ever changing economic and political environment will continue to occupy much of the Board’s time. From Brexit to technological advances, we seek to ensure that the business remains resilient and continues to adapt to new changes, including the new rules and regulations which will come into force with the implementation of the EU Withdrawal Bill. We will also follow closely the discussions around the proposed revised Code being introduced by the FRC to reflect the changing business environment and the growing demand for sharper governance to increase trust in business as a whole.
I trust that you will find this Governance Report helpful and informative. The intention of this Report is to show you how the Board is acting in the long-term interests of the Company’s stakeholders. Lasting success goes hand in hand with good and effective governance. The Board, as custodian of the business, seeks to secure the long-term future of the Company. We are responsible to our shareholders, customers, employees and other stakeholders for the performance of the Company and for promoting its success, and it is a responsibility all at SEGRO take very seriously.
THE UK CORPORATE GOVERNANCE CODE
Throughout the year, we complied with the Code which is the framework against which we measure our compliance with governance.This Corporate Governance report follows the five main principles of the Code:
In each of the sections we explain how we have complied with the Code, and detail how its principles have been applied to the running of the business.
LEADERSHIP
Where we describe the role of the Board, its work during the year and the role of the Directors.
ACCOUNTABILITY
Where we describe the work of the Audit Committee in ensuring that the financial integrity of the Company is maintained.
RELATIONS WITH SHAREHOLDERS AND OTHER STAKEHOLDERS
Where we illustrate how we communicate with our shareholders and other stakeholders to ensure a good dialogue is taking place.
EFFECTIVENESS
Where we set out the work of the Nomination Committee to ensure that we have the appropriate balance of skills and experience.
REMUNERATION
Where we detail the work of the Remuneration Committee and show how the Remuneration Policy has been applied throughout the year.
GERALD CORBETTCHAIRMAN
RIGHTS ISSUE
In March 2017, we carried out a Rights Issue to part fund the acquisition of a 50 per cent interest in the APP portfolio we did not already own, from our joint venture partner, Aviva, and to part fund our development pipeline. Many people throughout the business were involved in this project and the Board and its Committees also played an important role. Throughout this Governance section we set out in case studies the role of the Board and Committees in the Rights Issue. Further details of the Rights Issue itself can be found on page 33.

64
SEGRO PLC | ANNUAL REPORT & ACCOUNTS 2017
3
GOVERNANCE
EXPERIENCED LEADERSHIP
1. PHIL REDDINGCHIEF INVESTMENT OFFICERCurrent AppointmentsPhil was appointed Chief Investment Officer in November 2011, having joined the Company in 1995. He was appointed as an Executive Director on 1 May 2013.Previous AppointmentsPhil started his career in 1990, holding a number of positions in the Industrial Agency and Development team of King Sturge. Since joining SEGRO, he has undertaken a variety of roles including Head of Leasing and Marketing, Head of New Business and, prior to becoming an Executive Director, Business Unit Director for London Markets.ExperiencePhil has over 25 years’ experience in the real estate sector and extensive knowledge of the Company and its portfolio. Phil has led the implementation of the Group’s investment strategy and has been instrumental in reshaping the portfolio since 2011.Phil is a member of the Royal Institution of Chartered Surveyors (MRICS).Relevant SkillsReal Estate
2. DOUG WEBBINDEPENDENT NON-EXECUTIVE DIRECTOR CHAIRMAN OF THE AUDIT COMMITTEE MEMBER OF THE NOMINATION COMMITTEECurrent AppointmentsDoug was appointed as a Non-Executive Director on 1 May 2010. He is currently the Chief Financial Officer of Meggitt plc, a member of the Hundred Group of Finance Directors and a member of the Investment Advisory Committee of Fitzwilliam College, Cambridge.Previous AppointmentsBetween 2008 and 2012 he was Chief Financial Officer of London Stock Exchange Group plc. He was previously Chief Financial Officer of QinetiQ Group plc and Finance Director Continental Europe and Chief Financial Officer North America at Logica plc. Prior to these appointments he spent 12 years at Price Waterhouse.ExperienceDoug comes from a corporate financial management background and has over 10 years’ Board level experience as a Chief Financial Officer of listed companies. That strong listed company and finance background, coupled with his current financial experience allows him to bring substantial insight to the Board, particularly with regards to the Group’s financial management.He is a Fellow of the Institute of Chartered Accountants in England and Wales.Relevant SkillsInternational Corporate, Finance, Aerospace Engineering and Manufacturing, Technology
3. BARONESS FORDSENIOR INDEPENDENT NON-EXECUTIVE DIRECTOR MEMBER OF THE AUDIT COMMITTEE MEMBER OF THE NOMINATION COMMITTEE MEMBER OF THE REMUNERATION COMMITTEECurrent AppointmentsBaroness Ford joined the Board on 1 January 2013. She is currently Chairman of STV Group plc. She is Senior Independent Non-Executive Director of NewRiver REIT and Senior Adviser to H2 Capital Partners.Previous AppointmentsPreviously, Baroness Ford was Chairman of Grainger plc and the Olympic Park Legacy Company, Non-Executive Chairman of May Gurney Integrated Services plc, Barchester Healthcare Limited and Grove Limited, and a Director of Taylor Wimpey plc. ExperienceBaroness Ford has listed company expertise with over 20 years’ experience at Board level at listed companies. Her knowledge of the real estate market and across government is invaluable to the Company.She is an Honorary Member of the Royal Institution of Chartered Surveyors (MRICS).Relevant SkillsReal Estate, Banking
4. DAVID SLEATHCHIEF EXECUTIVE MEMBER OF THE NOMINATION COMMITTEECurrent AppointmentsDavid was appointed Chief Executive on 28 April 2011, having served as Finance Director since 1 January 2006. He is a Board member of the British Property Federation.Previous AppointmentsHe was previously Senior Independent Director and Audit Committee Chairman of Bunzl plc. He has held a number of senior finance roles, including Finance Director of Wagon plc and partner at Arthur Andersen, where he worked for 17 years. He was a board member of the European Public Real Estate Association from 2011 until 2017, and President of the British Property Federation 2016-17.ExperienceDavid has considerable knowledge of the Company and the real estate sector and has experience of financial and general management, the automotive engineering sector and of the professional services industry. This experience has helped lead to the successful implementation of the Company’s strategy during his tenure as Chief Executive. David is a Fellow of the Institute of Chartered Accountants in England and Wales.Relevant SkillsReal Estate, Finance, Automotive and Manufacturing
5. SOUMEN DASCHIEF FINANCIAL OFFICERCurrent AppointmentsSoumen was appointed as Chief Financial Officer on 16 January 2017.Previous AppointmentsSoumen was previously Managing Director and Chief Financial Officer at Capital & Counties Properties plc (Capco) which he joined from Liberty International plc, having coordinated the demerger of the companies in 2010. Prior to this, he spent two years as a partner in Mountgrange Investment Management LLP (now Clearbell Capital) and nine years at UBS, where he was an Executive Director within the investment bank, specialising in real estate.ExperienceSoumen leads the Company’s finance function and has been Chief Financial Officer at Board level of listed companies for eight years. His background as an experienced corporate financier and track record of negotiating complex corporate transactions is an asset to the Board and business.Relevant SkillsReal Estate, Banking, Finance
6. GERALD CORBETTCHAIRMAN CHAIRMAN OF THE NOMINATION COMMITTEECurrent AppointmentsGerald joined the Board on 1 March 2016, and was appointed Chairman on 22 April 2016. He is currently Chairman of the Marylebone Cricket Club.Previous AppointmentsPreviously he was Chairman of Betfair, Britvic plc, Moneysupermarket.com, Numis Corporation plc and SSL International plc. He has served as a Non-Executive Director of MEPC, Greencore Group and Burmah Castrol.ExperienceGerald has been a director of 13 public companies, seven of which he has chaired. His executive career included periods as Finance Director of Redland and Grand Metropolitan and he was Chief Executive of Railtrack. His experience as a director and a chairman across various sectors is helpful for bringing strategic insight to the boardroom and the business. Relevant SkillsInternational Corporate, Finance
4
1
2

65
OVERVIEW STRATEGIC REPORT GOVERNANCE FINANCIAL STATEMENTS
7. MARTIN MOOREINDEPENDENT NON-EXECUTIVE DIRECTOR MEMBER OF THE AUDIT COMMITTEE MEMBER OF THE REMUNERATION COMMITTEECurrent AppointmentsMartin was appointed as Non-Executive Director on 1 July 2014. He is currently Chairman of Secure Income REIT plc, Senior Independent Director of F&C Commercial Property Trust Ltd and Senior Adviser at Kohlberg Kravis Roberts & Co. LLP.Previous AppointmentsMartin was Chief Executive at M&G Real Estate from 1996 and Chairman from 2012 until his retirement in 2013. He has been an Adviser and Commissioner of The Crown Estate, a Board member and President of the British Property Federation, and a Board member and Chairman of the Investment Property Forum. He was also a Commissioner of Historic England and a Non-Executive Director of the M&G Asia Property Fund, retiring from both in 2017.ExperienceMartin has over 40 years’ of real estate experience and knowledge of the property sector. He brings both industry knowledge and breadth of practice, having spent his career at Prudential plc.Martin is a member of the Royal Institution of Chartered Surveyors (MRICS).Relevant SkillsReal Estate, International Corporate
8. CHRISTOPHER FISHERINDEPENDENT NON-EXECUTIVE DIRECTOR CHAIRMAN OF THE REMUNERATION COMMITTEE MEMBER OF THE AUDIT COMMITTEE MEMBER OF THE NOMINATION COMMITTEECurrent AppointmentsChristopher joined the Board on 1 October 2012. He is currently a Non-Executive Director of National Savings and chairs the Marshall Scholarship Programme. He is also a Senior Advisor at Penfida Limited.Previous AppointmentsChristopher spent most of his career at Lazard, latterly as a Managing Director. He subsequently worked at KPMG as Vice Chairman, Corporate Finance, and at Penfida Limited, the corporate finance adviser to pension fund trustees, as a Senior Partner. On corporate Boards, he has held appointments as Chairman of Bank of Ireland UK, as Chairman of Southern Cross Healthcare and as a Non-Executive Director of Kelda, the FTSE 100 water group. He has also chaired the governing body of the University of Reading.ExperienceChristopher has a financial background, having spent his career in corporate finance and has some 15 years’ of listed Board experience. His knowledge of large scale, international business, coupled with his financial expertise, brings a range of insights to the Board.Relevant SkillsBanking, Finance
9. MARK ROBERTSHAWINDEPENDENT NON-EXECUTIVE DIRECTOR MEMBER OF THE REMUNERATION COMMITTEECurrent AppointmentsMark was appointed as a Non-Executive Director on 1 June 2010. He is currently Chairman of Integer/InPost. Previous AppointmentsHe was previously Group Chief Executive Officer of Innovia Group and Chief Executive Officer of Morgan Advanced Materials plc, a post he held for eight years, having previously been Chief Operating Officer and Chief Financial Officer. Prior to this he was Chief Financial Officer of Gartmore Investment Management plc, and spent nine years with Marakon Associates, a leading management consultancy headquartered in the US. ExperienceMark has knowledge and experience of working across the engineering, finance and consultancy sectors. His position as Chairman of Integer/InPost brings useful e-commerce and parcel delivery experience, whilst his former role as the Chief Executive Officer of a large multi-national industrial business brings additional insight to SEGRO as an industrial landlord.Relevant SkillsInternational Corporate, Manufacturing, Engineering and Logistics, Finance
10. ANDY GULLIFORDCHIEF OPERATING OFFICERCurrent AppointmentsAndy was appointed Chief Operating Officer in November 2011, having joined the Company in 2004. He was appointed as an Executive Director on 1 May 2013.Previous AppointmentsAndy was previously Managing Director for Continental Europe. Prior to this, he was the Director of Corporate Acquisitions and Business Development Director. Before joining SEGRO, Andy spent 19 years at Jones Lang LaSalle, latterly as European Director for the company’s industrial and logistics business.ExperienceAndy has worked in a variety of real estate roles and brings extensive knowledge of the Company and the real estate sector in both the UK and Continental Europe. He has been influential in implementing the operational strategy of the Company. Andy is a member of the Royal Institution of Chartered Surveyors (MRICS).Relevant SkillsReal Estate
11. CAROL FAIRWEATHERINDEPENDENT NON-EXECUTIVE DIRECTOR MEMBER OF THE AUDIT COMMITTEECurrent AppointmentsCarol was appointed as Non-Executive Director on 1 January 2018. She is currently a Non-Executive Director of Smurfit Kappa Group plc and a trustee of Somerset House. Previous AppointmentsCarol was Chief Financial Officer of Burberry Group plc from 2013 to 2017, having worked in senior financial roles within the company since 2006. Prior to that, Carol was Director of Finance at News International Ltd and UK Regional Controller at Shandwick plc. She began her career at Ernst & Young.ExperienceCarol has finance experience and brings commercial knowledge to the Board. Her experience in her former role as Chief Financial Officer of the retailer Burberry Group will be valuable to the Company as it seeks to help customers adapt to the e-commerce revolution.Relevant SkillsInternational Corporate, Finance, Retail
ELIZABETH BLEASEGENERAL COUNSEL AND GROUP COMPANY SECRETARYElizabeth joined SEGRO as General Counsel and Group Company Secretary in May 2008. She qualified as a solicitor in 1992 with Addleshaw Goddard and was previously Group Company Secretary at Brammer plc and Marshalls plc.
5
6
8
9
10
11
7
66
SEGRO PLC | ANNUAL REPORT & ACCOUNTS 2017
RESPONSIBILITIES OF THE BOARD
GOVERNANCE
ROLE RESPONSIBILITIES
CHAIRMAN • Leads the Board and ensures its effectiveness.• Sets the agenda, style and tone of Board discussions to promote constructive
debate and effective decision making.• Ensures that the corporate governance of the Group is maintained in line with
current best practice.• Takes the necessary steps to ensure that all Directors receive the accurate, clear
and timely information which they require to enable them to make sound decisions, to monitor the business effectively and to fulfil their duty to promote the success of the Company.
• Ensures effective communication with shareholders and stakeholders and makes sure that the members of the Board develop an understanding of the views of major investors.
CHIEF EXECUTIVE • Manages the business of the Group.• Recommends the Group’s strategy to the Board and is responsible for the
implementation of that strategy and for the Group’s overall performance.
EXECUTIVE DIRECTORS • Manage the business operations within each Director’s area of responsibility in accordance with the Group’s strategy.
SENIOR INDEPENDENT NON-EXECUTIVE DIRECTOR • Acts as a sounding board to the Chairman and serves as an intermediary for other Directors when necessary.
• Available to shareholders should the occasion arise where there is a need to convey concerns to the Board other than through the Chairman or the Chief Executive.
INDEPENDENT NON-EXECUTIVE DIRECTORS • Bring independent judgement and scrutiny to the decisions taken by the Board.• Monitor the success of management in delivering the agreed strategy within the
risk appetite and control framework set by the Board.
GROUP COMPANY SECRETARY • Responsible for advising the Board on all governance matters.• Ensures timely and appropriate information flows within the Board, the Board
Committees and between the Directors and senior management.• Ensures compliance with all relevant statutory and regulatory requirements.• Gives guidance and advice within the Company on matters of business ethics
and good governance.• Is available to give detailed practical support and guidance to Directors both
individually and collectively.
GERALD CORBETT
DAVID SLEATH
SOUMEN DASANDY GULLIFORDPHIL REDDING
CAROL FAIRWEATHER CHRISTOPHER FISHERMARTIN MOOREMARK ROBERTSHAWDOUG WEBB
MARGARET FORD
ELIZABETH BLEASE

67
OVERVIEW STRATEGIC REPORT GOVERNANCE FINANCIAL STATEMENTS
GOVERNANCE FRAMEWORK
BOARD
Responsible for creating and delivering sustainable shareholder value.
NOMINATION COMMITTEE
Ensures that the Board has the appropriate skills, knowledge and experience to operate effectively and to oversee delivery of the strategy.
AUDIT COMMITTEE
Monitors the integrity of the Group’s Financial Statements, reviews the relationship with the auditor and the role and effectiveness of the internal audit function.
Oversees the risk management process and control environment.
REMUNERATION COMMITTEE
Determines the reward strategy for the Executive Directors to align their interests with those of shareholders.
EXECUTIVE COMMITTEE
Assists the Chief Executive with the development and implementation of Group strategy, the management of the business and the discharge of responsibilities delegated by the Board.
OPERATIONS COMMITTEE
Assists the Chief Operating Officer to manage the operations of the Group and to discharge the responsibilities delegated to him by the Executive Committee.
RISK COMMITTEE
Establishes, monitors and reports to the Executive Committee and ultimately the Board and Audit Committee on the Group’s approach to risk management.
INVESTMENT COMMITTEE
Manages the allocation of capital across the Group and oversees all major investment and divestment decisions on behalf of the Executive Committee.
BOARD COMMITTEES
MANAGEMENT COMMITTEES
BOARD
NOMINATION
COM
MITTEE
AUDIT COMMITTEE
REM
UN
ERAT
ION
CO
MMITTEE
INV
ESTMENT COMMITTEE
EXEC
UTIV
E COMMITTEE OPERATIONS COM
MITTEE
RISK COM
MIT
TEE

68
SEGRO PLC | ANNUAL REPORT & ACCOUNTS 2017
EXPERIENCED LEADERSHIP CONTINUED
GOVERNANCE
HARRY STOKESHEAD OF INVESTOR RELATIONS & RESEARCH
Relevant skills: Banking, Finance
JOINED: 14 OCTOBER 2013
OCTAVIA PETERSHEAD OF TREASURY & TAX
Relevant skills: Finance
JOINED: 16 OCTOBER 2006
ANDREW PILSWORTHDIRECTOR OF FINANCE
Relevant skills: Finance
JOINED: 5 OCTOBER 2009
NICK HUGHESDIRECTOR OF MARKETING & COMMUNICATIONS
Relevant skills: International Corporate, Real Estate
JOINED: 1 OCTOBER 2013
JAMES POWERHEAD OF BIS, PROCUREMENT & RISK
Relevant skills: International Corporate
JOINED: 6 AUGUST 2010
SEGRO’s Leadership team comprises the members of the Executive Committee and their senior direct reports, each of whom has responsibility for the Group’s operations or investment activities in a particular geography, or for one or more of the Group’s main functional areas.
Whilst the day to day management of the Group’s activities and the governance and oversight thereof are carried out under the structures described on page 67, the Leadership team also meets periodically to share market knowledge and to discuss areas of cross-functional and cross border interest.
The Leadership team serves as a useful discussion forum and sounding board with which the Executive Directors can share knowledge and ideas and from which to seek input. The Leadership team normally meets three times per year and reviews areas such as:
££ Market conditions and competitor activity;
££ Future trends affecting our customers’ businesses and which may impact SEGRO in the future;
££ Specific strategy related topics which have been or are due to be presented to the Board (including topics covered at the Board Strategy Day – see page 72);
££ The Group’s asset plans and medium term financial plan;
££ Development and implementation of the Group’s culture and Values; and
££ The results of the Group’s bi-annual employee engagement survey.
The Leadership team is also consulted and kept informed about Company-wide activities and performance through dedicated conference calls regarding, among other events, financial results and, in 2017, the Rights Issue.
LAURENCE GIARDHEAD OF CORPORATE ACQUISITIONS
Relevant skills: Banking, Finance
JOINED: 30 MAY 2008
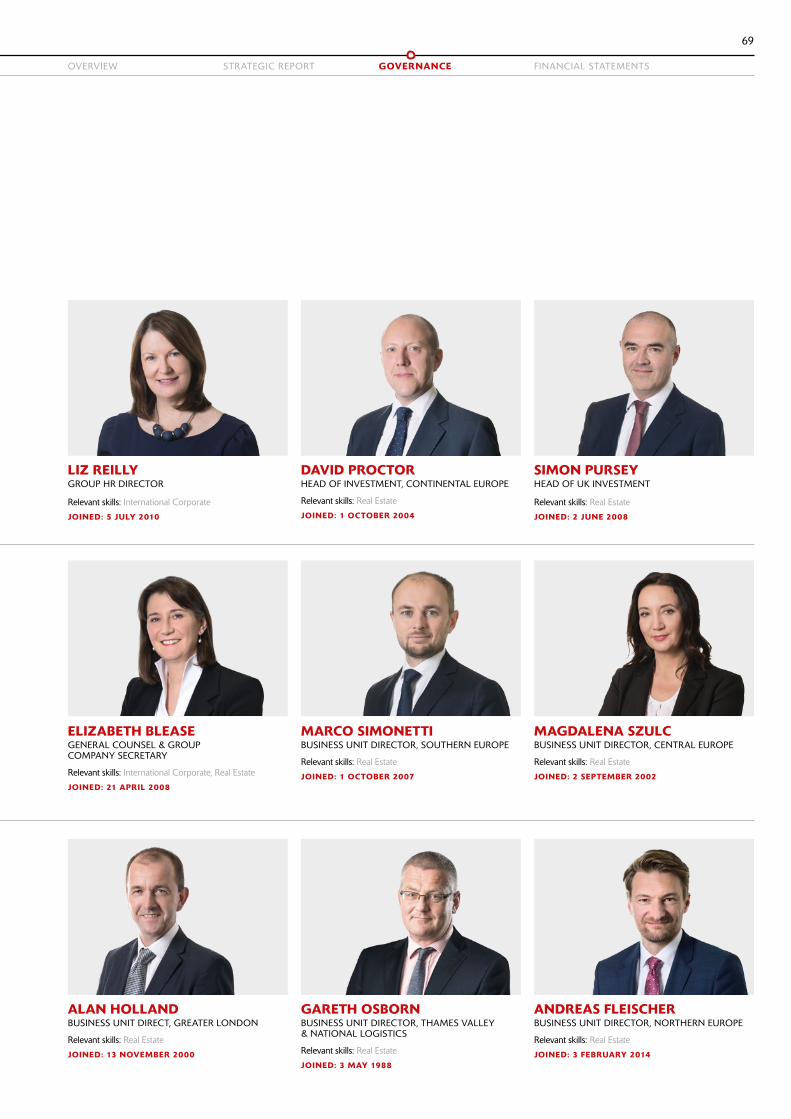
69
OVERVIEW STRATEGIC REPORT GOVERNANCE FINANCIAL STATEMENTS
ELIZABETH BLEASEGENERAL COUNSEL & GROUP COMPANY SECRETARY
Relevant skills: International Corporate, Real Estate
JOINED: 21 APRIL 2008
ALAN HOLLANDBUSINESS UNIT DIRECT, GREATER LONDON
Relevant skills: Real Estate
JOINED: 13 NOVEMBER 2000
LIZ REILLYGROUP HR DIRECTOR
Relevant skills: International Corporate
JOINED: 5 JULY 2010
DAVID PROCTORHEAD OF INVESTMENT, CONTINENTAL EUROPE
Relevant skills: Real Estate
JOINED: 1 OCTOBER 2004
SIMON PURSEYHEAD OF UK INVESTMENT
Relevant skills: Real Estate
JOINED: 2 JUNE 2008
GARETH OSBORNBUSINESS UNIT DIRECTOR, THAMES VALLEY & NATIONAL LOGISTICS
Relevant skills: Real Estate
JOINED: 3 MAY 1988
MAGDALENA SZULCBUSINESS UNIT DIRECTOR, CENTRAL EUROPE
Relevant skills: Real Estate
JOINED: 2 SEPTEMBER 2002
ANDREAS FLEISCHERBUSINESS UNIT DIRECTOR, NORTHERN EUROPE
Relevant skills: Real Estate
JOINED: 3 FEBRUARY 2014
MARCO SIMONETTIBUSINESS UNIT DIRECTOR, SOUTHERN EUROPE
Relevant skills: Real Estate
JOINED: 1 OCTOBER 2007
70
SEGRO PLC | ANNUAL REPORT & ACCOUNTS 2017
LEADERSHIP
GOVERNANCE
ROLE AND RESPONSIBILITIES OF THE BOARD
The Board is collectively responsible for the long-term success of the Group. Its aim is to create and deliver sustainable shareholder value whilst being mindful of the interests of other key stakeholders. Details of how the Company generates and preserves value are set out in the Strategic Report from page 04.
The success of the Company informs all of the decisions that the Board takes, from the strategic direction of the Company, through to its relationship with the Group’s employees; the impact of the business on the community; the environment; and the interests of other key stakeholders, including its customers and suppliers. Please see Relations With Shareholders and Other Stakeholders on page 82 for further information.
INDEPENDENCE OF THE NON-EXECUTIVE DIRECTORS
Details of the Directors, including the skills and experience that they bring to the Board, are set out on page 64-65. The Board comprises a Non-Executive Chairman, four Executive Directors, and seven independent Non-Executive Directors, all of who are equally responsible for the effective stewardship and leadership of the Group. Each of the Non-Executive Directors is considered independent in character and judgement. The Chairman was considered independent on appointment and the Board still considers him to be so.
DIVISIONS OF RESPONSIBILITY
The Chairman is responsible for the leadership of the Board and ensuring its effectiveness on all aspects of its role. The day-to-day running of the Group is delegated by the Board to the Chief Executive who is supported by the Executive Committee. The Senior Independent Director and other Non-Executive Directors challenge constructively and hold the Executive Directors accountable for the delivery of the Company’s strategy.
The division of responsibilities of the Chairman, Chief Executive and Senior Independent Director are set out in writing and approved by the Board. For further information on the responsibility of each Board member, see page 66.
ROLE OF THE BOARD IN THE RIGHTS ISSUE
When preliminary discussions took place with Aviva for the potential acquisition of its interests in the APP portfolio, not only did the Board consider whether the acquisition was in line with the Company’s strategy and aspirations and would enhance shareholder returns, but we also discussed the appropriate funding mix of additional equity or additional borrowing. We were mindful that the Company had relatively recently raised equity in September 2016 through a placing. When considering the funding options, thought was also given to whether the development pipeline, which continued to show strong momentum, should be part funded by new equity and whether shareholders would be supportive of doing so. We concluded, that raising equity through a Rights Issue was in the best interests of the Company.
Once the decision to acquire the remaining part of the APP portfolio and fund it by way of a Rights Issue had been made, the Board stayed closely involved in the project through to completion. Regular updates were provided by the Executive Directors on the progress of the acquisition, the timing of the transactions and the preparation of the Rights Issue prospectus. We received progress updates from David and Soumen, and held a number of ad hoc Board meetings.
Before the Rights Issue was launched, Slaughter and May, our corporate lawyers, attended a Board meeting to take us through our duties as Directors. An important element of this is that we took responsibility for ensuring the accuracy and verification of the information contained in the prospectus as well as the quality of the documentation. We had advice from our corporate advisers Bank of America Merrill Lynch and UBS who provided their views on the market as well as likely shareholder response to the transaction.
We were also kept regularly informed about progress from the launch of the issue until it closed, both in terms of market reaction and investor feedback.
Throughout the rest of the year, we were kept informed about how the proceeds of the Rights Issue had been invested, to provide comfort that the Directors were complying with the Use of Proceeds statement in the prospectus. In addition, our corporate advisers attended a Board meeting at which they provided feedback from shareholders about the conduct of the Rights Issue.
GERALD CORBETT
WORK OF THE BOARD
The Board retains responsibility for the approval of certain matters which include: Group strategy; the annual budget; the dividend policy; major investments and disposals; and the financial structure. There is an approved Schedule of Matters Reserved for Decision by the Board, which is reviewed periodically.
Most Board meetings take place in London but during the year meetings and asset tours took place in Düsseldorf, Paris and the UK Midlands. The Board met with management teams in these locations and had tours of the Group’s property portfolios.
The Board values meeting and hearing from different people in the business who are close to the Company’s markets and who can tell the Board what they are seeing and hearing on the ground, as well as from external sources who give a wider perspective on market trends. During the year, presentations were given by JLL on the industrial market outlook and CBRE on the Company’s valuation results. Marco Simonetti, the Business Unit Director for Southern Europe, and Andreas Fleischer, the Business Unit Director for Northern Europe, also gave presentations on their business areas and tours of the assets and developments for which they are responsible. This allows the Directors to gain further insight on market trends and provides the context for them to make strategic decisions about acquisitions, disposals and the development pipeline.
INDUCTION TRAINING
Newly appointed Directors participate in a structured and tailored induction programme and on appointment receive a comprehensive pack of information on the Group and its governance structure.
As we reported last year, Soumen Das joined the Board in January 2017 and has had a demanding first year. His induction is set out in the case study on the next page.

71
OVERVIEW STRATEGIC REPORT GOVERNANCE FINANCIAL STATEMENTS
KEY ACTIVITIES OF THE BOARD DURING 2017
STRATEGY AND LEADERSHIP • Review and discussion of strategic objectives and plans to achieve them.• Review of the Medium Term Plan.• Presentation from the Company’s independent valuers on the 2016 Full year, and 2017 Half year valuation.• Rolling reviews of the performance of investments and developments over the previous three years.• Approval of the acquisition of the remaining 50 per cent interest in the APP portfolio.• Approval of a Rights Issue.• Approval of three large debt transactions.• Reports on the outlook for the occupier and investment markets.• Reviews of the wider economic environment, political uncertainty and Brexit considerations.• Annual strategy day including a review of asset plans and portfolio planning.
GOVERNANCE • Approval of the 2017 budget.• Approval of 2016 financial results and final dividend and the 2017 Half year financial results and interim dividend.• Approval of Principal Risks and risk appetite.• Review of the conclusions of the 2016 Board evaluation.• Review of the monthly Health and Safety report.• Annual review of corporate governance and an update on corporate and regulatory changes and
reporting requirements.
STAKEHOLDER ENGAGEMENT • Presentations from the Company’s brokers on shareholders’/analysts’ attitudes to the Company.• Review of investor feedback.• Approval of the Slavery and Human Trafficking Statement.• Report on Code of Ethics including the Anti-Bribery and Corruption policies.• Annual reports on community engagement and charitable giving.
CUSTOMERS • Annual report on results of customer satisfaction survey.• Tours of customer assets in Düsseldorf, Paris, and the UK Midlands.
EMPLOYEES • Review of people strategy, succession planning and talent management.• 2016 all employee engagement survey results.• Review of Diversity Policy.
SOUMEN DAS – INDUCTION
Before joining SEGRO as CFO in January 2017, I checked in regularly with David to keep in touch with the business and to ensure that I could quickly get up to speed with the key issues facing the business on joining. I was grateful to Justin Read who found time for some helpful handover meetings before he retired. This preparatory work proved to be invaluable.
Elizabeth and her team had planned a thorough induction programme for me to meet the team and visit some of the principal assets in my first few weeks. However, my induction didn’t go quite according to plan as events quickly overtook us. When I started, as usual, I met with my fellow Directors and toured some of our assets on the Slough Trading Estate and Paris. However, the business was not only in the midst of preparing for the 2016 year end as one might have expected, but soon became involved in a Rights Issue and the acquisition of the 50 per cent share in the APP portfolio that it did not already own. These transactions quickly replaced the planned induction programme.
This was a whirlwind introduction to SEGRO and its people and accelerated considerably my knowledge and understanding of the business. Rather than meeting people in an orderly induction programme, I was thrown into the middle of fast moving events and got to know my new colleagues and the issues which affected the business in real time.
The period between the 2016 Results and the Rights Issue provided a more intensive period of investor relations than would normally have happened and proved valuable for me to hear first-hand from shareholders their thoughts about the business.
Once the Rights Issue had completed, I did finally manage to complete the rest of my induction, in particular meeting my Continental European colleagues and getting to visit plenty of assets.
SOUMEN DAS

72
SEGRO PLC | ANNUAL REPORT & ACCOUNTS 2017
LEADERSHIP CONTINUED
GOVERNANCE
STRATEGY DAY
Like most Boards, at each meeting we have a full agenda of things to discuss and decisions to make, so it is important that at least once a year the Directors have some time to take stock, consider the wider environment in which the Company operates and review our strategic direction.
This year, to set the scene for our discussions, we started with a tour of big box warehouses in the logistics ‘Golden Triangle’ in the Midlands, to view some of our own assets, including SEGRO Logistics Park East Midlands Gateway (SLPEMG), and also those owned by some of our key competitors. We met with the management team from Roxhill and heard first hand from them the prospects in the region and their vision for future developments. This tour, especially the visit to SLPEMG, brought to life the scale of the development opportunities in this region and also set the context for the investment decisions the Board will face over the next few years.
As usual, a comprehensive set of papers was circulated before the two-day meeting to provide the background and context for the discussions. Some were regular annual papers, such as the Medium Term Plan and the conclusions of the Asset Planning exercise while a number had been prepared on specific topics such as target markets for urban warehousing.
We started with a session sharing our thoughts on the market. It is particularly helpful for the Executives to hear the Non-Executive Director’s thoughts and experiences from other businesses in which they are involved. I said last year that one of the actions from the 2016 Strategy Day was to continue to remain alert to the changing environment and much of the discussion was around the macro and geopolitical uncertainty.
Andy Gulliford and Phil Redding presented their thoughts on the occupational and investment markets. We continue to carefully monitor these markets although we recognise that we do not have perfect visibility.
After two days of tours, presentations, debate and discussion, we left the meeting with agreement that the Group’s strategy remains appropriate and that we have a robust plan for delivering meaningful growth and attractive shareholder returns over the coming years.
GERALD CORBETT

73
OVERVIEW STRATEGIC REPORT GOVERNANCE FINANCIAL STATEMENTS
Induction trainingCarol Fairweather joined the Board in January 2018 and a detailed induction programme will take place in her first few months with the Company. A flavour of her likely induction is set out below:
Internal External Tours££ Individual meetings with other Directors.
££ Meetings with certain Business Unit Directors, Heads of Function and other senior managers.
Meetings with:
££ CBRE valuation partner.
££ PwC audit partner.
££ KPMG internal audit partner.
££ The key relationship directors at the Company’s corporate brokers, UBS and BAML.
Tours of the Company’s assets in:
££ Slough.
££ Greater London.
££ Warsaw.
££ Paris.
Ongoing training is provided to all Directors either during Board or Committee meetings or through one-to-one meetings with senior managers.
EVALUATION
The Board has a policy of undertaking externally facilitated evaluations every three years and internal reviews in the intervening two years. Independent Audit are currently undertaking an external evaluation, the last one having taken place in 2014. The conclusions of Independent Audit’s review were not available at the time of printing this Report, but a detailed summary of the review will be provided in the next Annual Report.
AVAILABILITY OF THE CHAIRMAN, THE CHIEF EXECUTIVE AND THE GROUP COMPANY SECRETARY
The Chairman, the Chief Executive and the Group Company Secretary are always available for the Directors to discuss any issues concerning Board meetings or other matters. All Directors have access to the advice and services of the Group Company Secretary, who is responsible for ensuring compliance with Board procedures. Directors also have the right to seek independent professional advice at the Company’s reasonable expense.
DIRECTORS’ AND OFFICERS’ LIABILITY INSURANCE
The Company maintains directors’ and officers’ liability insurance, which gives appropriate cover for legal action brought against its Directors.
CONFLICTS
The Board operates a policy to identify and, when appropriate, manage actual or potential conflicts of interest affecting Directors. Directors are required to submit any actual or potential conflicts of interest they may have with the Company to the Board for approval. Any conflicts of interest are recorded and reviewed by the Board, at each meeting. Directors have a continuing duty to keep the Board updated about any changes to these conflicts.
BOARD COMMITTEES
The Board has delegated a number of its responsibilities to the Audit, Nomination and Remuneration Committees. The Terms of Reference of these Committees can be found at www.SEGRO.com.
The Audit Committee monitors the integrity of the Financial Statements, reviews the relationship with the auditor and effectiveness of the internal control system, including internal audit, and is responsible for overseeing the risk management process and control environment. Further details of the work of the Audit Committee can be found in the Accountability section on page 77.
The Nomination Committee ensures that the Board has the appropriate skills, knowledge and experience to operate effectively and oversee delivery of the strategy. The work of the Nomination Committee is detailed in the Effectiveness section on page 75.
The Remuneration Committee determines the reward strategy for the Executive Directors to align their interests with those of shareholders. Further information on this Committee is set out in the Remuneration section on page 84.
ATTENDANCE AT BOARD AND BOARD COMMITTEE MEETINGS
During 2017, there were seven scheduled Board meetings. A number of other unscheduled Board meetings and telephone conference calls were also held during the year, as the need arose. Each Director has committed to attend all scheduled Board and Committee meetings and would not do so only in exceptional circumstances. Similarly, every effort is made by Directors to attend ad hoc meetings either in person or by using conference facilities. On the rare occasion that a Director cannot attend a meeting they are still provided with the papers in advance of the meeting and are given an opportunity to discuss them with the Chairman or the Chief Executive.

74
SEGRO PLC | ANNUAL REPORT & ACCOUNTS 2017
Attendance at Board and Board Committee meetings during 2017 is set out in the table below.
BoardAudit
CommitteeNomination Committee
Remuneration Committee
Gerald Corbett 7/7 N/A 2/2 N/ASoumen Das 7/7 N/A N/A N/AChristopher Fisher 7/7 3/3 2/2 2/2Margaret Ford 7/7 3/3 2/2 2/2Andy Gulliford 7/7 N/A N/A N/AMartin Moore 7/7 3/3 2/2 2/2Phil Redding 7/7 N/A N/A N/AMark Robertshaw 7/7 N/A N/A 2/2David Sleath 7/7 N/A 2/2 N/ADoug Webb 7/7 3/3 1/2 N/ATotal number of meetings 7 3 2 2
ROLE OF THE EXECUTIVE AND EXECUTIVE COMMITTEES
Responsibility for all operational matters, including the implementation of Group strategy, is delegated to the Chief Executive. The Executive Committee supports the Chief Executive in the delivery of strategy and reviews operational and financial performance. The Committee carries out a pre-approval review of items requiring Board approval and acts as a primary approval channel for matters below Board approval level at each of its meetings. It also considers any health and safety incidents. The Executive Committee has its own Terms of Reference. This Committee meets formally each month and during the year also met informally most weeks to consider day-to-day issues.
The Executive Committee delegates some of its responsibilities to a further three Committees:
££ The Investment Committee;
££ The Operations Committee; and
££ The Risk Committee.
These Committees have their own Terms of Reference and membership includes at least one member of the Executive Committee and some members of the Leadership team.
LEADERSHIP CONTINUED
GOVERNANCE

75
OVERVIEW STRATEGIC REPORT GOVERNANCE FINANCIAL STATEMENTS
EFFECTIVENESS
GOVERNANCE
££ Considering the diversity policy; and
££ Recommending the election/re-election by shareholders of the Directors, having due regard to their performance and ability to continue to contribute to the Board, taking into consideration the skill, experience and knowledge required along with the need for progressive refreshing of the Board.
Details of the skills and experience each Director brings to the Board, are set out on pages 64-65.
ROLE OF THE NOMINATION COMMITTEE
A key principle of the Code is to ensure that the Board and its Committees have the appropriate balance of skills, experience, independence and knowledge of the Company and its business to enable each Director to effectively discharge his or her duty to act in the best interests of shareholders and other key stakeholders, and to ensure that the business operates effectively in delivering the strategy.
The Committee therefore spent time ensuring that the Company has the ‘right people in the right places’ to operate effectively and deliver our strategy. To do this, the Nomination Committee regularly reviews the size, structure and composition of the Board and makes recommendations about new appointments and ensures that the appointment process is formal, rigorous and transparent.
The Nomination Committee’s role in considering the succession planning needs of the Board and its Committees as well as understanding the succession plans for the Leadership team, should ensure that a strong pipeline of diverse and talented individuals is available to support the Company, meet its future business objectives and achieve its strategic goals.
EFFECTIVENESS AT A GLANCE
I am the Chairman of the Nomination Committee and this section sets out our work during the financial year.
RESPONSIBILITIES OF THE NOMINATION COMMITTEE
The Nomination Committee is responsible for:
££ Regularly reviewing the skills and experience of the Board to ensure that it is the right structure, size and composition (taking into account skills, independence, knowledge and diversity) to operate effectively and to deliver on strategy;
££ Leading the process for Board appointments. To identify and nominate for Board approval, candidates to fill Board vacancies, identifying the skills required for the role, appointing a search firm, recognising the benefits of diversity, and in the case of the Non-Executive Directors, ensuring that they will have sufficient time for the role;
££ Ensuring the Company’s leadership skills are fully aligned with the Company’s long-term strategy;
££ Considering succession planning for the Executive and Non-Executive Directors and ensuring that succession planning is in place for members of the Leadership team;
GERALD CORBETTCHAIRMAN OF THE NOMINATION COMMITTEE
76
SEGRO PLC | ANNUAL REPORT & ACCOUNTS 2017
APPRAISAL PROCESS
The expertise and performance of the Directors is considered as part of the annual review of the Board and its Committees. The annual appraisal of the Chairman is led by the Senior Independent Director, who meets annually with the Non-Executive Directors to discuss the performance of the Chairman. The Chairman leads the appraisal of the Chief Executive by arranging a meeting of Non-Executive Directors to discuss his performance. The Non-Executive Directors agreed that the Chief Executive was performing well, executing his tasks with energy and leading the executive team in an effective way. The performance of the other Non-Executive Directors is appraised by the Chairman whilst the Executive Directors are appraised by the Chief Executive with feedback from other Directors where appropriate. The Board is satisfied that all Directors possess relevant experience and appropriate levels of independence, and real estate, financial and commercial experience across various industries.
APPOINTMENT OF DIRECTORS
Following the appraisal process, the Nomination Committee concluded that each of the Directors continued to make an effective contribution to the Board. It also considered the time commitments of the Non-Executive Directors and concluded that each Director is able to commit sufficient time to the Company and to fulfil their duty to promote the success of the Company.
As detailed on page 63, during the year the Nomination Committee reappointed Martin Moore for a second three-year term, since the Committee considered his performance continued to be effective, and he made a valuable contribution to meetings, demonstrating commitment to the role.
In accordance with the Code, each of the Directors will submit themselves for re-election at the 2018 AGM, save for Margaret Ford who will retire at the AGM on 19 April 2018.
APPOINTMENT OF CAROL FAIRWEATHER
As mentioned on page 63, the Committee made a decision during the year to start the process to recruit Non-Executive Directors to ensure orderly succession. The Committee agreed a role specification and in particular identified the required skills and attributes. The Zygos Partnership was appointed to lead the search as they have undertaken previous Non-Executive Director searches and have a good understanding of the Company and its culture. A long list of candidates was circulated to all of the Directors for comments before it was considered by the Committee which agreed the short list. The first round of interviews were with the Chairman and Chief Executive, while other members of the Committee and Soumen Das were involved in subsequent interviews. The Committee met to discuss their conclusions and were pleased to recommend Carol’s appointment to the Board.
SUCCESSION PLANNING
In 2019, letters of appointment for four of the Non-Executive Directors will expire or will be due for renewal. As mentioned in the Chairman’s letter on page 63, the Committee has been spending time planning for the medium-term orderly rotation of its Non-Executive Directors.
Below the Board, the Committee considers succession planning regularly as it recognises the importance of creating and supporting a suitably talented diverse pipeline of leaders ready to serve as the next generation of plc Directors. It reviews the skills and experience of the current Board, and considers whether they are appropriate to support the delivery of the Company’s strategic goals both now and in the future.
The Group HR Director regularly presents to the Board on the Company’s succession planning and talent development programme. The Company’s strategy is well established and its execution not dependent on any one individual. For Executive Directors and for roles in the Leadership team, plans are in place for sudden, unforeseen absences, for medium-term orderly succession and for longer-term succession. These plans are then used to provide development plans for our most talented people and to ensure that looking forward, we have the right people to deliver our strategy. We encourage regular contact between members of senior management and the Board. This may be by a Board presentation, a tour of assets or a one-to-one session with Non-Executive Directors to discuss a specific issue.
DIVERSITY
The Directors are committed to having a balanced Board which recognises the benefits of diversity in its broadest sense and the value that this brings to the organisation in terms of skills, knowledge and experience.
With respect to gender specifically, the Board aspires to promote greater gender diversity. It recognises that how we select and brief executive search partners and how we specify the skills and experience needed for a role are important elements in this regard. In selecting candidates for Board positions, the Committee will only use the services of executive search firms who have signed up to the Voluntary Code of Conduct for Executive Search Forms. We are members of the 30% Club which aims to achieve a minimum 30 per cent of women on FTSE 100 boards. Our Board Diversity Policy supports broadening diversity in the widest sense as well as endorsing this 30 per cent target.
In the final selection decision, all Board appointments are made on merit and relevant experience, against the criteria identified by the Committee with regard to the benefits of diversity, including gender.
The Board recognises that the pace at which we can improve will depend, to some extent, on the availability of vacancies as well as suitable candidates. It therefore supports the aspirations of the Hampton Alexander review to identify and develop the next generation of female talent. For further details of the Group’s approach to gender diversity below the Board, please see pages 44 and 45.
EFFECTIVENESS CONTINUED
GOVERNANCE

77
OVERVIEW STRATEGIC REPORT GOVERNANCE FINANCIAL STATEMENTS
ACCOUNTABILITY
GOVERNANCE
AUDIT/ACCOUNTABILITY AT A GLANCE
2017 was another successful year for the Company in which we continued to build on strategy, and welcomed Soumen as our new Chief Financial Officer. Since one of our key roles as a Committee is to ensure financial integrity is maintained, we discussed and debated a number of the financing transactions throughout the year that you will have read about already: the Rights Issue; the US private placement; and the bond redemptions and issues, to ensure that we were comfortable that the appropriate treatment had been applied.
The Committee is delighted that Soumen has settled in, despite it being so busy with refinancings – although this has allowed me and my fellow Committee members to get to know him better through our discussions on the accounting treatment being applied to the various transactions. The Committee is pleased that Soumen’s team remains stable and settled and I am reassured by their experience.
I value my contact with Soumen and his team, and enjoy a positive and constructive relationship with them, knowing that they feel able to call me to discuss matters should the need arise, as well as keeping me abreast of what is happening in the finance function when necessary.
DOUG WEBBCHAIRMAN OF THE AUDIT COMMITTEE
A warm welcome is extended to Carol Fairweather who joined us as a Committee member at the start of 2018. Carol has extensive financial expertise and we are looking forward not only to the experience that she will bring to the Committee, but also to her fresh perspective and insight.
Risk remains a focus of the Committee, since it is our job to ensure that appropriate and robust policies and procedures are in place to identify and assess risk as well as manage them. We are ever cognisant of the need to ensure that new and emerging risks are considered where appropriate to the business, including the wider economic environment, political uncertainty and impact of Brexit on the Company. We were supported in our risk role by the Head of Risk Management and remain comfortable that risk is being appropriately managed.
Having the opportunity to invite senior management to meetings is something we find valuable. Not only do we regularly hear from the Group Financial Controller on the accounting judgements and treatment of particular transactions, but we also get great benefit from hearing from other technical specialists on topics such as tax and governance. This gives us comfort that these topics are being properly addressed, but also demonstrates that there is an experienced and quality group of people supporting the Executive.
KPMG remained the internal auditor during 2017, although a new team was introduced to us, allowing the internal audit function to remain fresh and independent. We work hard to ensure that the Company’s internal controls, of which internal audit forms part, are appropriate, and further details on our work in this area can be found on page 81.
I am pleased to present this report of the Audit Committee for the 2017 financial year, which explains how we have challenged and gained assurance around the processes that support financial reporting and control, to ensure the accuracy and integrity of the financial information and results.
DOUG WEBBCHAIRMAN OF THE AUDIT COMMITTEE

78
SEGRO PLC | ANNUAL REPORT & ACCOUNTS 2017
ACCOUNTABILITY CONTINUED
GOVERNANCE
COMPOSITION
Each Committee member is independent and has considerable commercial experience. The Committee has the relevant property and financial experience to properly discharge its duties and the Committee Chairman satisfies the requirement to bring recent and relevant financial experience.
MEETINGS
In 2017 we had three scheduled meetings – one less than usual as we didn’t feel that an extra meeting was necessary this year since the Board was meeting so regularly during the Rights Issue. The frequency of the Board meetings allowed the Committee the opportunity to discuss topics outside of the scheduled timetable, when appropriate.
MAIN ACTIVITIES DURING THE YEAR
Throughout the year the Committee has acted in accordance with its Terms of Reference which can be found at www.SEGRO.com. In particular, its main activities have been:
££ Reviewing the integrity, consistency and key accounting judgements made by management, to ensure that the quality of the Company’s financial reporting is maintained, including going concern, in the Company’s Half and Full year Financial Statements.
££ Ensuring that the accounting treatment applied to the Rights Issue and the acquisition of the APP portfolio was appropriate, and that the impact of the Rights Issue on the comparative share metrics had been correctly adjusted.
££ Ensuring that the impact of the various debt financing transactions (detailed further on page 34) had been accurately reflected in the Half year and Full year results.
££ Examining the performance of the external and internal auditors, their objectivity, effectiveness and independence, as well as the terms of their engagement and scope of their audit (and agreeing the annual internal audit plan).
££ Monitoring the ratio and level of audit to non-audit fees paid to the external auditor and agreeing their remuneration for the year.
££ Ensuring compliance with applicable accounting standards, monitoring developments in accounting regulations as they affect the Group and reviewing the appropriateness of accounting policies and practices in place.
££ Assessing the independence of the valuer of the Group’s property portfolio and gaining assurance around the valuation process.
££ Advising the Board on whether the process supporting the preparation of the Annual Report taken as a whole, is fair balanced and understandable and provides the information necessary to shareholders to assess the Group’s position and performance, business model and strategy.
££ Ensuring the process followed to support the making of the viability statement remained robust and was correctly followed.
££ Monitoring the effectiveness of the Group’s risk management systems and considering the adequacy of the actions being taken to identify risks and mitigate the exposure of the Group to them.
££ Reviewing the adequacy of internal control systems.
££ Analysing and challenging the results of internal audit reviews and management’s plans to resolve any actions arising from them.
££ Overseeing matters relating to tax and any potential impact tax matters may have on the integrity of the Financial Statements. This included approving the Company’s process behind publishing a tax strategy.
££ Ensuring appropriate safeguards are in place for the detection of fraud and prevention of bribery. This extends to responsibility for overseeing and monitoring the Group’s anti-bribery and corruption policies and procedures contained in the Company’s Code of Ethics.
Chart 1 opposite sets out the significant matters considered by the Committee during the year in relation to the Financial Statements.
ROLE OF THE AUDIT COMMITTEE IN THE RIGHTS ISSUE
The Committee had responsibility for three areas of the Rights Issue:
1. The preparation of a working capital statement by PwC which was required for the prospectus. In accordance with the Policy for Approval of Non-Audit Fees, we authorised appointing PwC to prepare that statement. We also appointed Deloitte, our previous auditor, to carry out the analysis of the historic financial results.
2. In the context of such a large capital transaction the Committee was involved in discussions on the accounting treatment of the Rights Issue to ensure that it was appropriate. This involved reviewing the calculation of a bonus adjustment factor
(required under IFRS) in order to restate the comparative share metrics (earnings per share, dividend per share and net asset value per share). The final treatment was reviewed in detail by the Committee and included discussions with PwC.
3. The methodology for adjusting the share schemes awards for the Remuneration Committee, based on the bonus adjustment factor described above.
The Committee also confirmed to the Board that it was satisfied that the Rights Issue was appropriately accounted for.
DOUG WEBB

79
OVERVIEW STRATEGIC REPORT GOVERNANCE FINANCIAL STATEMENTS
CHART 1: 2017 SIGNIFICANT MATTERS Significant matter The action takenValuation of the property portfolioValuation is central to the business performance and is a significant area of judgement for the Committee as it is inherently subjective, because the valuer must make assumptions and judgements in reaching its conclusions. This is a recurring risk for the Group as it is key to its IFRS profitability, balance sheet portfolio value, net asset value, total property return, and employee incentives. It also affects investment decisions and the implementation of the Company’s Disciplined Capital Allocation policy. It is included on the Risk Register and the process risk map as a potential key business risk.
The Committee takes an active interest in any matter that involves a significant area of judgement, including the valuation. It is responsible for the assurance of the valuation process.
The Committee ensured that there was a robust process in place to satisfy itself that the valuation of the property portfolio by CBRE, a leading firm in the UK and Continental European property markets, was carried out appropriately and independently. The Board met twice with CBRE to review, challenge, debate and consider the valuation process; understand any particular issues encountered in the valuation; and discuss the processes and methodologies used. The Chairman of the Audit Committee also met separately with CBRE to discuss such matters which allowed him to scrutinise the valuation process and ensure the valuer remained independent, objective and effective.
The Committee confirmed that it was satisfied that the valuation was not subject to undue influence and had been carried out fairly and appropriately, and in accordance with the industry valuation standards, and therefore suitable for inclusion in the Financial Statements.
For details of the Group’s properties and related accounting policies see Note 13 and Note 1 of the Financial Statements. For details of the results of the valuation, see Note 13 of the Financial Statements.
Significant matter The action takenDuring the year, the Company made a number of acquisitions and disposals and carried out other transactions such as the Rights Issue, which were large and/or complex. Certain transactions were considered to be significant because of the level of materiality involved and/or any unusual terms or conditions or judgements, and because of the risks inherent in the accounting process, including when a transaction or revenue should be recognised, and what the appropriate accounting treatment should be.
The accounting treatment of acquisitions, disposals and transactions themselves, is a recurring risk for the Group and is considered to be significant, since an inappropriate approach could cause a misstatement of the Group’s financial position and/or results. The application of the accounting treatment for each particular transaction is judged on its own particular facts and circumstances.
The Committee considered the accounting treatment of key, complex transactions during 2017 including the accounting treatment applied to the Rights Issue and the acquisition of the APP portfolio, by reviewing and challenging management’s papers on accounting proposals and judgements.
Following a review of the accounting treatment for these significant transactions, in particular the point at which each transaction should be recognised, the Committee was satisfied that all relevant issues had been fully and adequately addressed and that the approach adopted by the Company was appropriate in each case, and in accordance with IFRS.
The Committee challenged the application of accounting policy and internal controls relating to revenue recognition and reviewed reports from the internal auditor, external auditor and management.
For further details of the accounting treatment applied to such significant transactions, see Note 1 of the Financial Statements.
FAIR, BALANCED AND UNDERSTANDABLE
The Directors are required to confirm that they consider, taken as a whole, that the Annual Report is fair, balanced and understandable and provides the information necessary for shareholders to assess the Company’s position and performance, business model and strategy. In order to make this statement, the due diligence exercise reported in previous years, was followed.
The Committee has satisfied itself that the controls over the accuracy and consistency of information presented in the Annual Report are robust, and has confirmed to the Board that the processes and controls around the preparation of the Annual Report are appropriate allowing the Board to make ‘the fair, balanced and understandable statement’ which is on page 106.
VIABILITY STATEMENT
The Committee ensured that the process put in place in 2015 to allow the Board to make the viability statement, on page 57, was robust, in line with market practice and had been correctly and properly followed. The Committee confirmed to the Board that it was comfortable with the process followed to make the viability statement.

80
SEGRO PLC | ANNUAL REPORT & ACCOUNTS 2017
ACCOUNTABILITY CONTINUED
GOVERNANCE
PwC highlighted the key areas of risk, which were primarily identified as areas of judgement and complexity and were consistent with those areas identified by the Committee. The level of audit materiality was also discussed and agreed.
PwC presented a detailed report of their audit findings at the year end, which were reviewed and discussed. A similar review of the external auditor’s report was undertaken by the Committee at the Half year. As part of this review the Committee questioned and challenged the work undertaken and the findings and the key assumptions made, with particular attention to the areas of audit risk identified.
EffectivenessThe Committee assesses the effectiveness of the external audit process on an annual basis, by reviewing a number of factors:
££ Performance in discharging the audit and Half year review;
££ Independence and objectivity; and
££ Reappointment and remuneration.
Taking into account the views of management involved in the audit, the Committee was satisfied with the performance of PwC and recommended to the Board that it propose to shareholders that PwC should be reappointed for the 2018 financial year. The Company complies with the Competition and Market Authority Order 2014 relating to audit tendering and the provision of non-audit services. There are no contractual obligations which restrict the Committee’s choice of external auditor or which put in place a minimum period for their tenure. The external audit was last tendered in 2015 following which the auditor changed from Deloitte LLP to PwC, and so there are no current plans to re-tender the services of the external auditor.
EXTERNAL AUDITOR
This is the second audit for PwC. The Committee has worked with PwC to ensure this key area of oversight was appropriately maintained. The Committee periodically meets privately with the lead partner, Craig Hughes, to discuss their work and their observations on the Company. No areas of concern have been raised. In addition, the Committee Chairman occasionally has meetings and telephone calls with PwC to discuss matters as they arise throughout the year when necessary, such as the accounting treatment to be applied to the Rights Issue and the various debt transactions. It is believed that this is much more effective and helpful than waiting to discuss matters at the scheduled meetings. The constructive relationship with PwC and the ability to discuss matters throughout the year is something the Committee finds extremely helpful.
During the year, the Financial Reporting Council’s Audit Quality Review Team carried out a review of PwC’s 2016 audit of the Company’s Financial Statements. Overall, the feedback was reassuring. Points were raised from the review of PwC’s audit work on investment property valuations and retirement benefit schemes. Those points were discussed by the Committee and together with PwC, actions were agreed to refine the audit approach. The Committee was comfortable that whilst the proposed changes would improve the quality of the audit, they were not matters which undermine the integrity of the 2016 Financial Statements. The recommendations have been incorporated into the audit of the 2017 Financial Statements.
OversightAt the end of 2017, PwC presented their audit plan for the year ahead which the Committee challenged and then approved.
Remuneration and IndependenceThe Committee considers the remuneration of the external auditor at least on a semi-annual basis and approves its remuneration. It also keeps under close review the ratio of audit to non-audit fees to ensure that the independence and objectivity of the external auditor are safeguarded. This is further maintained by the Policy for Approval of Non-Audit Services recognises that there are certain circumstances where (i) PwC will not be used in any circumstances; (ii) PwC may be used, subject to the approval of the Chief Financial Officer; and (iii) PwC may be used, subject to the approval of the Audit Committee.
In 2017, fees for audit and related assurance services, (excluding the SELP joint venture), amounted to £806,000 and the non-audit fees amounted to £491,000. Although this fee is higher than in previous years, this is largely due to the work that PwC carried out for the Rights Issue prospectus, discussed in the Case Study. The Committee has concluded that PwC remains independent and objective, and that the level of non-audit to audit fees is acceptable for 2017 due to the special circumstances that year. Further details of these fees, and fees in respect of the audit of the Group’s SELP joint venture for which PwC is the auditor, are provided in Note 6(ii) to the Financial Statements. The three-year average of the non-audit fees as a percentage of the audit fees to the year ended 2017 is 80 per cent. Chart 2 sets out the ratio of audit to non-audit fees for each of the past three years.
The Committee is satisfied that PwC continues to provide appropriate levels of challenge, and remained independent. PwC has provided written confirmation of its independence to the Committee.
CHART 2: AUDIT AND NON-AUDIT FEES PAID TO PRICEWATERHOUSECOOPERS LLP AND DELOITTE LLP
2017 Paid to
PwC
2016 Paid to
PwC
2015 Paid to
DeloitteAudit fees including related assurance services (£m) 0.81 0.68 0.71Non-audit fees (£m) 0.49 0.09 0.22Ratio of non-audit fees to audit fees (%) 61 13 31
The above table excludes fees paid to either PwC or Deloitte LLP in respect of joint ventures. If these were included, the 2017 ratio of audit to non-audit fees would have been 48 per cent.

81
OVERVIEW STRATEGIC REPORT GOVERNANCE FINANCIAL STATEMENTS
RISK
The Company has a strong culture of risk awareness embedded in decision making and robust processes that support the identification and management of risk. The Board recognises that effective risk management is central to the achievement of the Group’s strategic objectives and the long-term sustainable growth of the business. There is an on-going process for identifying, evaluating and managing the principal risks faced by the Group, which has been in place during the year. The Board assumes responsibility for the effective management of risk across the Group, determined by its risk appetite, as well as ensuring that each business area implements appropriate internal controls. The Committee reviews the effectiveness of the risk management process on behalf of the Board and is satisfied that it remains robust for the financial year in question and up to the date of this Report.
INTERNAL AUDIT
The Committee believes that the value of internal audit is enhanced by having a third party perform this function, as this supports the independent challenge of management and gives greater access to expertise than an internal function could provide. KPMG has performed the role since its appointment in 2007 and reappointment in 2014 following a tender. During their tenure, there have been a number of rotations of lead partners and audit managers (including during 2017) to ensure that a fresh perspective is given, and their independence and scrutiny maintained.
Topics selected for internal audit were based on a review of the Group’s key risks which had not been subject to recent audit. The proposed internal audit programme was discussed and agreed with KPMG ahead of it being considered and subsequently approved by the Committee, although it is adapted during the year to incorporate any new or increased risks which materialise.
The Committee believes that both the process for determining the internal audit programme, and the programme itself, are appropriate and effective, particularly since there is scope for the Company to react to events, new information and situations which come to light during the year and include them if necessary.
Each audit during 2017 confirmed that the relevant areas were appropriately controlled, and the identified enhancements were entered into the schedule which lists control points which require improvement actions (see Internal Control below).
Once each internal audit is complete, a questionnaire is issued by KPMG to the process owner about their internal audit as well as to the other relevant employees, to ensure that real-time feedback is collected on the quality and effectiveness of its audit. The results of this feedback are provided to the Committee along with detailed findings and recommendations of the internal audits themselves. The feedback on the internal audits was largely positive and no areas of concern were brought to the Committee’s attention. The lead KPMG partner also attends Committee meetings to present its report.
INTERNAL CONTROL
The Committee is responsible for reviewing the adequacy and effectiveness of internal control systems on behalf of the Board. This review is consistent with the Code, and covers all material areas of the Group, including risk management (see page 54 of Principal Risks) and compliance with controls in relation to the process for preparing the Financial Statements.
Internal controls are regularly reviewed by the Board and the effectiveness of the Group’s processes to manage them are frequently considered by the Committee which reviews a schedule listing all outstanding control points, noting the priority attaching to them and the progress made against agreed timeframes for resolution. The Committee confirms that it has not been advised of or identified any failings or weaknesses which it regards to be significant.
FINANCIAL REPORTING PROCESS
The Group has established internal controls and risk management systems in relation to the process for preparing the Financial Statements. Various checks on internal financial controls take place throughout the year, including internal audits. Developments in accounting regulations and best practice in financial reporting are monitored by the Company and where appropriate, reflected in the Financial Statements. Training is also provided to the finance teams and the Committee is kept appropriately informed.
The financial reporting from each business unit is subject to review by a local finance manager prior to being submitted to the Group Finance function. The results of each business unit are subject to further review by the Group Finance function. The results are then consolidated by Group Finance and are subject to various levels of review including by senior management.
The draft consolidated statements are reviewed by various individuals including those independent of the preparer. The review includes checking internal consistency, consistency with other statements, and consistency with internal accounting records. The Committee and the Board review the draft consolidated Financial Statements. The Committee received reports from management and the auditor on significant judgements, changes in accounting policies, and other relevant matters relating to the consolidated Financial Statements. The Financial Statements are also subject to external audit.
COMMITTEE EFFECTIVENESS
The formal review of the Committee’s effectiveness is being carried out as part of the Board evaluation process (detailed on page 73). However, the quality of the papers and presentations by management, coupled with the level of challenge by the Committee with management, PwC, KPMG and CBRE, and the quality of discussions held, gives the Committee comfort and assurance that it is performing its role effectively.
82
SEGRO PLC | ANNUAL REPORT & ACCOUNTS 2017
RELATIONS WITH SHAREHOLDERS AND OTHER STAKEHOLDERS AT A GLANCE
SEGRO’s principal duty is to deliver long term, sustainable returns to shareholders but, we are also mindful of the impact of our actions and the decisions that we make, on our wider stakeholders and the communities in which we operate. This section gives some examples of how we interact with our shareholders and other stakeholders.
Communication and engagement with stakeholders is important to the Board as it strengthens the business and promotes the Company’s success to benefit both stakeholders and shareholders alike. During the year, the Directors have:
££ Reviewed the Group’s monthly Health and Safety Report;
££ Received a report about Communities and Charities activities;
££ Approved the Slavery and Human Trafficking Statement and associated policies;
££ Received reports on employee engagement and talent management;
££ Considered the results of our annual customer satisfaction survey; and
££ Discussed shareholder feedback with our brokers, Bank of America Merrill Lynch and UBS.
ENGAGEMENT WITH SHAREHOLDERS
The Directors need to be aware of shareholders’ views and welcome open, meaningful discussions with shareholders, in particular with regard to strategy, governance, and remuneration.
The Chief Executive and the Chief Financial Officer are the Company’s principal spokesmen with investors, fund managers, analysts, the press and other interested stakeholders. The Board is committed to providing investors with regular announcements of significant events affecting the Group, including business strategy and financial performance.
The Company organises a dedicated investor relations programme with institutional investors, which includes formal events during
the year along with a regular series of one-to-one and group meetings. These events also provide an opportunity for shareholders to meet members of the senior management team. See the chart below for further details of what the Board did in 2017.
The Senior Independent Director, and the Chairman are available to shareholders to discuss governance and strategy or any concerns they may have which contact through the usual channels has failed to resolve or is otherwise inappropriate. Both the Chairman and Senior Independent Director continue to be available for meetings should shareholders request them.
The Chairman also attends the financial results presentations which is a good opportunity to spend time with the analysts and investors who attend. The Board is kept informed about any discussions with shareholders and the Directors are provided regularly with analysts’ reports and investor feedback.
SHAREHOLDER ENGAGEMENT 2017Investor presentations
Investor roadshows
Full year resultsHalf year resultsEquity sales presentations (x2)Trading Updates (Q1 and Q3)Annual General Meeting
Amsterdam (x2)AsiaEdinburghFrankfurtLondon (x3)MilanParis (x2)Toronto
Investor meetings
Investor conferences
Rights Issue meetings in London, Boston and New York
Cape TownLondon (x4)New York
The Company’s website, www.SEGRO.com, provides shareholders with comprehensive information on the Group’s recent business activities and financial developments, including webcasts, press releases and recordings of interviews with the Chief Executive.
There is a dedicated Investor Relations team which reports to the Chief Financial Officer. Communication with investors and analysts is an ongoing process throughout the year on a proactive and reactive basis.
This includes regular scheduled Investor Relations events, outlined in the Shareholder Engagement box, as well as one-to-one and group meetings with Executive Directors, tours of the Company’s properties and equity sales team presentations at global and local investment banks. During the year, the Chief Executive, along with the Executive Directors, senior management and Investor Relations team met with representatives from 181 institutions.
ENGAGEMENT WITH CUSTOMERS
The Company’s business model is based on owning and managing warehouse properties but its relationship with its customers is critical to its long-term success. SEGRO aims to create long-term sustainable business relations with its customers, recognising the mutual benefits that can flow through partnership. It is important to the continued success of the business that customers are consistently satisfied with the product and service levels they receive from the Company. The Board therefore takes an interest in the results of the annual customer satisfaction survey and on how the business has responded. It is pleasing to note the good results received again this year. Further details about the work the Company carries out with its customers can be found on page 52.
ENGAGEMENT WITH SUPPLIERS
The Board takes relationships with its suppliers seriously, and the Company seeks to maintain the highest standards of conduct throughout its social supply chain. In particular, where appropriate, the Company values long-term relationships with its suppliers, built on mutual values and trust. To ensure that the Company continues to use suppliers that have been thoroughly checked and approved as legitimate, competent, safe and appropriate to use, regular dialogue, and face to face meetings are held with suppliers. The Company also makes sure that it pays its suppliers promptly.
Being mindful of human rights, a Modern Slavery and Labour Standards Supplier Code was introduced during the year when the Company’s Modern Slavery statement was published, to ensure that all of its suppliers are acting responsibly and are aware of the risks of slavery and human trafficking within their own organisation and supply chain.
RELATIONS WITH SHAREHOLDERS AND OTHER STAKEHOLDERS
GOVERNANCE
GERALD CORBETTCHAIRMAN

83
OVERVIEW STRATEGIC REPORT GOVERNANCE FINANCIAL STATEMENTS
ENGAGEMENT WITH EMPLOYEES
The Company’s Purpose and Values help to unify employees and describe the core beliefs about how SEGRO should do business. Further details on ‘Purpose and Values’ can be found on page 44.
The Company believes in regular dialogue with employees and holds frequent briefings in each of its offices. The Board also encourages all employees to take a stake in the Company by becoming shareholders through the SIP and GSIP share schemes, where employees are given shares in SEGRO. More senior members of the team also participate in the Company’s LTIP scheme. The Board regularly meets with the Group HR Director to discuss employee engagement.
Further information on our employees can be found on page 44.
PENSIONS
The Company sponsors the SEGRO Pension Scheme (the Scheme) in the UK which is a defined benefit scheme now closed to future accrual. There is a close and constructive relationship between the Company and the Trustee in order to provide member benefits from the Scheme. The Scheme is well funded and for further details on this please see Note 18. Company representatives regularly attend Trustee meetings to ensure the Trustee is kept
ENGAGEMENT WITH DEBT INVESTORS
Banks and Bondholders2017 was a busy year for the Company’s debt programme with the Group taking advantage of favourable financing conditions. During the year the Group issued a total of £2.1 billion of new debt across four main transactions. Details of these transactions can be found on page 34.
The Chief Financial Officer and the Treasury team keep in regular contact with the Company’s key relationship banks, bondholders and secured lenders, as well as with the provider of SEGRO’s credit rating, Fitch Ratings, Inc. The transactions undertaken meant that the Company welcomed a number of new fixed income investors, particularly in the USA and looks forward to strengthening and deepening those relationships in the future.
CONSTRUCTIVE USE OF THE AGM
The Directors appreciate shareholders taking the time to attend the AGM which gives them the opportunity to talk to shareholders about the business, its achievements during the previous year and plans for the future. It also allows the Directors to hear what the Company’s private shareholders really care about and the Board values their questions.
During the meeting itself, the Chief Executive gave a presentation on the results of the Company for 2016 as well as details on the Rights Issue – what the Company raised, why the Company raised it and the proposed use of the proceeds. The highlights of the recently announced Q1 2017 Trading Update were noted and David Sleath shared his thoughts for
the year ahead before he and the Board answered questions from those attending.The Notice of AGM is posted to shareholders at least 20 working days before the meeting. The Company proposes separate resolutions on each substantially separate issue, with voting conducted by poll. The Board believes this voting process is fairer than a show of hands since all shares voted at the meeting, as well as proxy votes lodged before the meeting, are counted. For each resolution, shareholders will have the option to vote either for or against a resolution, or to withhold their vote. Following the meeting, the results of votes lodged for and against each resolution are announced to the London Stock Exchange and displayed on the Company’s website.
informed of the Company’s performance and how this affects the Employer covenant.
CODE OF ETHICS
The Company does not tolerate fraud, impropriety or dishonesty of any kind. The Board reviews reports on the Code of Ethics, including Anti-Bribery and Corruption policies. The Company’s policy on whistleblowing, sets out the procedure by which employees and any third parties can use a confidential external service to raise concerns by email or telephone, whether in relation to financial reporting or other matters. The Audit Committee receives an anti-bribery
and corruption report at each meeting since it is responsible for ensuring that appropriate safeguards are in place for the detection of fraud and prevention of bribery, including overseeing and monitoring the Group’s anti-bribery and corruption policies and procedures. There were no causes of concern during 2017.
HEALTH AND SAFETY
Health and safety is a crucial aspect of our business and a Health and Safety report is prepared and discussed at every Board meeting. Further information on Health and Safety can be found on page 45.
ROLE OF THE REMUNERATION COMMITTEE IN THE RIGHTS ISSUE
The Committee considered the impact of the Rights Issue on the Company’s share schemes and approved adjustments to the number of shares under award for the DSBP, LTIP, GSIP and Sharesave in order to put employees in the same position as they would have been in but for the Rights Issue. The method of adjustment used was standard across all schemes and followed a recommended formula. It was not intended to improve (or worsen) the value of employees’ awards. Participants in the SIP were able to take part in the Rights Issue, if they so wished.
84
SEGRO PLC | ANNUAL REPORT & ACCOUNTS 2017
REMUNERATION
GOVERNANCE
CHRISTOPHER FISHERCHAIRMAN OF THE REMUNERATION COMMITTEE
I am pleased to present my first Directors’ Remuneration Report, having succeeded Margaret Ford as Chairman of this Committee in May 2017. I have served as an independent Non-Executive Director and Remuneration Committee member since 2012, so have been involved first hand in the recent development of our remuneration policies, and their implementation.
I thank Margaret for her excellent stewardship of the Remuneration Committee, particularly last year when she led the consultation with shareholders and shareholder groups about revisions to the Remuneration Policy. I am pleased to report that at the AGM last year the Remuneration Policy was approved with over 94 per cent of votes in favour. Our Policy and its implementation have secured widespread shareholder support and I want to ensure that this remains so.
To remind you, our Policy is designed to:
££ Be straightforward to understand;
££ Ensure that executive reward reflects Company performance;
££ Be transparent to the executives, shareholders and other stakeholders;
££ Be aligned with the performance of the business in the short and the long term; and
££ Be motivational and reward success.
Please refer to the Remuneration at a Glance chart on page 85 for a high-level summary of Executive Director remuneration.
I would also highlight that the essential structure of our Remuneration Policy has been in place since 2011. Naturally, the Committee reviews the Policy and its implementation from time to time, proposing modifications where appropriate to ensure it continues to be fit for purpose, but believes that its broadly consistent application over time is important for both shareholders and the executives.
The Committee believes that the Policy is delivering on these objectives, particularly to motivate and reward success. The Company’s strong performance in recent years is appropriately reflected in the remuneration for the Executive Directors this year, shown on page 87, which anticipates the full vesting of shares granted in 2014 under the LTIP.

REMUNERATION AT A GLANCE
85
OVERVIEW STRATEGIC REPORT GOVERNANCE FINANCIAL STATEMENTS
SALARY AND BENEFITS(TAXABLE BENEFITS INCLUDING PRIVATE HEALTHCARE AND
CASH IN LIEU OF A COMPANY CAR, AND PENSION BENEFITS)
BONUSMAXIMUM 150% OF SALARY BASED ON PERFORMANCE
CONDITIONS ACHIEVED
LTIPMAXIMUM 200% OF SALARY
(+ ACCRUED DIVIDENDS)
PERFORMANCE CONDITIONS ARE APPLIED AT THE END OF THE PERFORMANCE PERIOD
2017 2018 2019 2020 2021 2022 2023
CASH
50% DEFERRED INTO DSBP (+ ACCRUED DIVIDENDS)
PAYOUT DURING THE YEAR ENDING
SHARES RELEASED =PAYMENT =
MANDATORY HOLDING
PERFORMANCE PERIOD
For further details on performance conditions see pages 89 and 94.
FIX
ED
RE
MU
NE
RA
TIO
NV
AR
IAB
LE R
EM
UN
ER
AT
ION
86
SEGRO PLC | ANNUAL REPORT & ACCOUNTS 2017
Company performance and impact on remuneration2017 was another year of strong operating and capital performance. The quality of the Company’s portfolio, operating metrics and gearing have all improved as explained in the Strategic Report on page 33. Over the year to 31 December 2017, our shares delivered a total return to shareholders (including dividends) of 38.7 per cent, they outperformed the FTSE All-share index and the FTSE 350 REIT index which delivered total returns to shareholders of 13.1 per cent and 12.9 per cent respectively. The Half year dividend was increased by 5 per cent and, subject to approval by shareholders, the 2017 year-end dividend will be increased by 6.1 per cent.
Given the strength of the Company’s performance and the returns enjoyed by shareholders, the Committee considered that it was wholly appropriate that both the short and long-term variable pay components of the remuneration of Executive Directors paid out in full, the first time this has happened under the current remuneration arrangements. As appropriate, this has also had a widespread impact on the variable pay of all eligible employees.
The Committee has discretion to adjust downwards Bonus payments and LTIP awards at vesting, if it is not satisfied that the outcome is a fair reflection of underlying performance, or in the event of excessive risk-tasking or misstatement. Malus and clawback provisions are included in the Bonus, DSBP and LTIP rules.
In keeping with the Policy, 2018 base salary increases for Executive Directors are in line with the average increases for employees across the Group.
Total property return (TPR) performance measureShareholders have asked us why we use TPR as one of the performance measures in both the Bonus and LTIP. The Committee has spent time discussing this and, when it last reviewed the Policy, considered whether or not alternative performance measures would be better. We concluded that TPR remains one of the best metrics for measuring performance as the Executives are being measured against the relative performance of our portfolio against industry benchmarks. So, in the current stage of the property cycle where asset values are rising in our sector,
for executives to be rewarded they cannot just rely on market uplift, but must also ensure that our portfolio is outperforming.
Having established that TPR is such an important performance measure, the Committee decided to include it in the Bonus scheme to ensure that everyday decisions about the portfolio were being taken with this in mind. The LTIP scheme, by definition, measures performance over a longer period and so using TPR here, it acts as a balance to the Bonus scheme, making sure that decisions are made for the long term and not just for short-term benefit.
Further, the TPR measures used for the Bonus and LTIP reflect the different periods of the two awards, and so the same data is not used twice.
Stakeholder engagementThe Committee remains committed to engagement with investors. On becoming Committee Chairman, I wrote to our 22 largest shareholders advising them of my appointment and, in view of the fact that remuneration is an increasingly sensitive subject, offered a meeting should they wish to discuss their views on current practice or emerging issues.
We are keen to ensure that the Group-wide remuneration structure rewards everyone fairly and, in years of strong Company performance, all employees share in its success. The reward framework for employees is based around the Remuneration Policy and this flows down from the structure which applies to the Executive Directors. Every employee is eligible for an annual bonus; the maximum award is based on role and seniority, a quarter of each employee’s bonus is calculated on a personal performance metric but the remaining three metrics are the same as those for Executive Directors. Those in the Leadership team are subject to bonus deferral and, along with Senior Managers, they are eligible for LTIP awards, which are subject to identical performance conditions as the Executive Directors.
We are also keen to encourage share ownership. All employees are eligible for an annual award of up to £3,000 worth of shares, while UK employees can also take part in our HMRC approved share schemes.
Each year, when considering pay increases, bonus awards and targets for the Executives, the Committee receives a detailed report from the Group HR Director on remuneration for each member of the Leadership team and a more general report on pay across the Group.
The year aheadRemuneration is a sensitive subject and attracts a range of views. It continues to attract much attention from both regulators and the media and is likely to remain subject to further evolution. Looking forward, we will want best practice to continue to inform our remuneration arrangements. During 2018, as well as the Committee’s more regular work, I expect us to devote time to consider how we best respond to the FRC’s proposed revisions to the UK Corporate Governance Code as they apply to the work of this Committee.
The existing LTIP rules will expire in June 2018, and we are recommending new LTIP rules for approval at the 2018 AGM. The new LTIP rules are substantially the same as the existing LTIP rules and have been updated to reflect best practice. Malus and clawback provisions have been preserved. A summary of the new LTIP rules is available in the Notice of Meeting and on the SEGRO website.
We value our engagement with shareholders and appreciate their support and I remain open to a continuing dialogue with them. If you have any comments on remuneration generally, or the contents of this Report specifically, do please contact me at [email protected]. I will be attending the AGM and will be pleased to answer any questions which you may have about the Committee’s work. The Committee believes that the implementation of the Remuneration Policy, which was approved at the 2017 AGM, continues to be in line with shareholders’ interests and recommends approval of this Remuneration Report at the forthcoming AGM.
REMUNERATION CONTINUED
GOVERNANCE
CHRISTOPHER FISHERCHAIRMAN OF THE REMUNERATION COMMITTEE
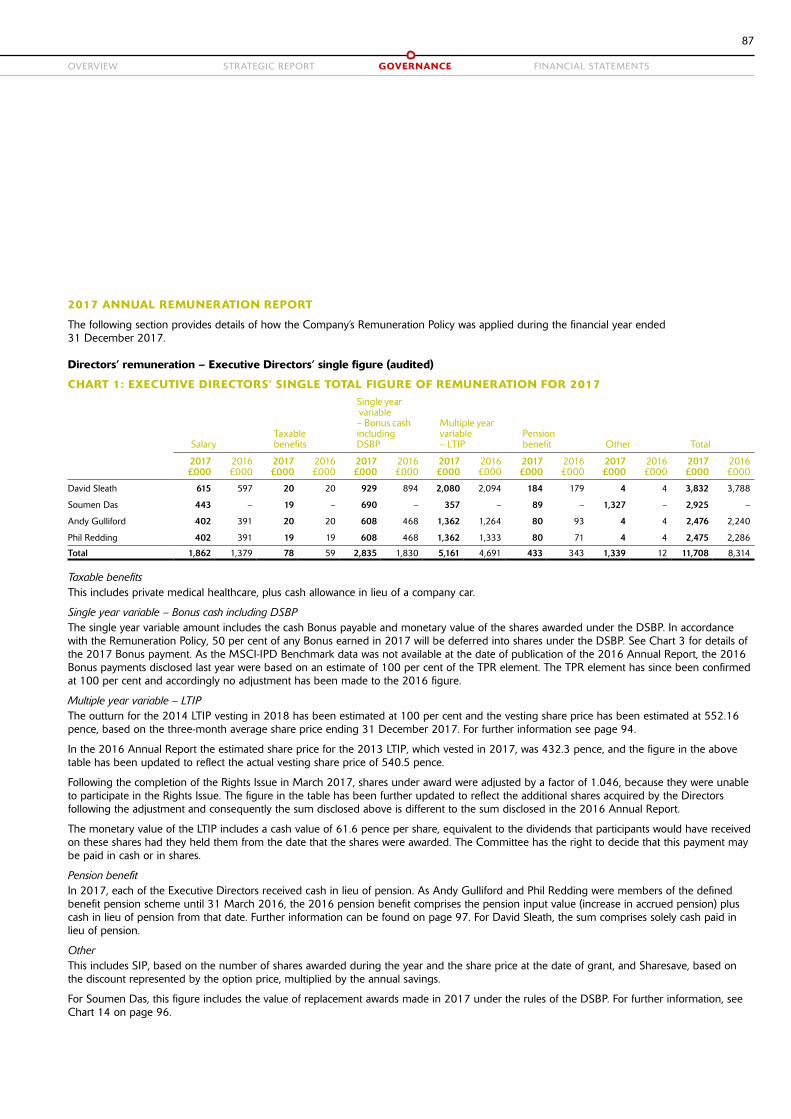
87
OVERVIEW STRATEGIC REPORT GOVERNANCE FINANCIAL STATEMENTS
2017 ANNUAL REMUNERATION REPORT
The following section provides details of how the Company’s Remuneration Policy was applied during the financial year ended 31 December 2017.
Directors’ remuneration – Executive Directors’ single figure (audited)
CHART 1: EXECUTIVE DIRECTORS’ SINGLE TOTAL FIGURE OF REMUNERATION FOR 2017
Salary Taxable benefits
Single year variable – Bonus cash including DSBP
Multiple year variable – LTIP
Pension benefit Other Total
2017 £000
2016 £000
2017 £000
2016 £000
2017 £000
2016 £000
2017 £000
2016 £000
2017 £000
2016 £000
2017 £000
2016 £000
2017 £000
2016 £000
David Sleath 615 597 20 20 929 894 2,080 2,094 184 179 4 4 3,832 3,788
Soumen Das 443 – 19 – 690 – 357 – 89 – 1,327 – 2,925 –
Andy Gulliford 402 391 20 20 608 468 1,362 1,264 80 93 4 4 2,476 2,240
Phil Redding 402 391 19 19 608 468 1,362 1,333 80 71 4 4 2,475 2,286
Total 1,862 1,379 78 59 2,835 1,830 5,161 4,691 433 343 1,339 12 11,708 8,314
Taxable benefits This includes private medical healthcare, plus cash allowance in lieu of a company car.
Single year variable – Bonus cash including DSBPThe single year variable amount includes the cash Bonus payable and monetary value of the shares awarded under the DSBP. In accordance with the Remuneration Policy, 50 per cent of any Bonus earned in 2017 will be deferred into shares under the DSBP. See Chart 3 for details of the 2017 Bonus payment. As the MSCI-IPD Benchmark data was not available at the date of publication of the 2016 Annual Report, the 2016 Bonus payments disclosed last year were based on an estimate of 100 per cent of the TPR element. The TPR element has since been confirmed at 100 per cent and accordingly no adjustment has been made to the 2016 figure.
Multiple year variable – LTIPThe outturn for the 2014 LTIP vesting in 2018 has been estimated at 100 per cent and the vesting share price has been estimated at 552.16 pence, based on the three-month average share price ending 31 December 2017. For further information see page 94.
In the 2016 Annual Report the estimated share price for the 2013 LTIP, which vested in 2017, was 432.3 pence, and the figure in the above table has been updated to reflect the actual vesting share price of 540.5 pence.
Following the completion of the Rights Issue in March 2017, shares under award were adjusted by a factor of 1.046, because they were unable to participate in the Rights Issue. The figure in the table has been further updated to reflect the additional shares acquired by the Directors following the adjustment and consequently the sum disclosed above is different to the sum disclosed in the 2016 Annual Report.
The monetary value of the LTIP includes a cash value of 61.6 pence per share, equivalent to the dividends that participants would have received on these shares had they held them from the date that the shares were awarded. The Committee has the right to decide that this payment may be paid in cash or in shares.
Pension benefitIn 2017, each of the Executive Directors received cash in lieu of pension. As Andy Gulliford and Phil Redding were members of the defined benefit pension scheme until 31 March 2016, the 2016 pension benefit comprises the pension input value (increase in accrued pension) plus cash in lieu of pension from that date. Further information can be found on page 97. For David Sleath, the sum comprises solely cash paid in lieu of pension.
OtherThis includes SIP, based on the number of shares awarded during the year and the share price at the date of grant, and Sharesave, based on the discount represented by the option price, multiplied by the annual savings.
For Soumen Das, this figure includes the value of replacement awards made in 2017 under the rules of the DSBP. For further information, see Chart 14 on page 96.

88
SEGRO PLC | ANNUAL REPORT & ACCOUNTS 2017
Base salary and benefits (audited)On 1 April 2017, the Chief Executive’s base salary was £619,030, the Chief Financial Officer’s base salary was £460,000, and the base salaries of the Chief Investment Officer and the Chief Operating Officer were each £405,305.
With effect from 1 April 2018, each of the Executive Directors will receive an increase to base salary of 3 per cent, which is in line with the average all-employee increase.
The Executive Directors are entitled to life assurance and private medical insurance, and receive cash allowance in lieu of a company car and cash in lieu of pension.
Non-Executive Directors’ single figure (audited)The Non-Executive Directors’ fees are reviewed by the Board in the absence of the Non-Executive Directors, while the fees paid to the Chairman are reviewed by the Committee.
The Non-Executive Directors’ fees were last increased in January 2016. Following a review by the Board, and consideration of data provided by the Remuneration Committee’s adviser, Kepler, these fees were increased by £5,000 with effect from 1 January 2018. Following this change the base Non-Executive Director fee is £60,000 per annum, the fee for a Director chairing a Board Committee is £75,000 per annum and the fee for the Senior Independent Director is £75,000 per annum. The Chairman continues to be paid £250,000 per annum.
The Chairman and Non-Executive Directors do not participate in any of the Company’s share-based incentive schemes nor do they receive any other benefits or rights under the pension schemes. Chart 2 shows the total remuneration received by each of the Non-Executive Directors and the Chairman during the year.
CHART 2: INDEPENDENT NON-EXECUTIVE DIRECTORS’ SINGLE TOTAL FIGURE OF REMUNERATION FOR 2017
Total fees
2017 £000
2016 £000
Gerald Corbett1 Chairman 250 180
Christopher Fisher2 Chairman of the Remuneration Committee (since 18 May 2017) 61 55
Margaret Ford2 Senior Independent Director, Chairman of the Remuneration Committee (until 18 May 2017) 71 77
Martin Moore 55 55
Mark Robertshaw 55 55
Doug Webb Chairman of the Audit Committee 65 65
1 Gerald Corbett was appointed a Director on 1 March 2016. He became Chairman on 22 April 2016.
2 Christopher Fisher succeeded Margaret Ford as Chairman of the Remuneration Committee on 18 May 2017.
REMUNERATION CONTINUED
GOVERNANCE

89
OVERVIEW STRATEGIC REPORT GOVERNANCE FINANCIAL STATEMENTS
Bonus payment 2017 (audited)For the Executive Directors, the 2017 Bonus comprised three equally weighted components: Adjusted Profit Before Tax (PBT); rent roll growth (RRG); and relative TPR.
££ Profit – Adjusted PBT against target
For this element, a Bonus is earned for Adjusted PBT performance against target. 50 per cent is earned on achieving the threshold target (£172.0 million for 2017), rising to 100 per cent for achieving the maximum target (£184.9 million for 2017). 100 per cent of this element was achieved in 2017, with Adjusted PBT performance for bonus purposes of £185.2 million achieved.
££ Rent roll growth (RRG) against target
For this element, a Bonus is earned if the rent roll growth from the existing standing stock is positive (the threshold). Once the threshold is achieved, the Bonus is determined based on total RRG (existing standing stock plus the impact of development RRG), with a sliding pay-out scale rising from 0 per cent for flat total RRG through to 100 per cent for achieving the maximum increase (£27.9 million in 2017). In 2017, RRG from standing stock was positive, thus ensuring the threshold was achieved. Total RRG including the contribution from developments was £38.9 million for Bonus purposes and, accordingly, 100 per cent of this element was achieved.
Bonus targets for Adjusted PBT and RRG are set at the start of the year. The outturns were calculated using a consistent exchange rate and also include adjustments for specific items (including acquisitions, disposals and the Rights Issue in March 2017) in accordance with the Bonus scheme rules as approved by the Committee.
££ TPR – Relative TPR against the MSCI-IPD Benchmark
For this element, 25 per cent of a Bonus is earned if the Company’s TPR is in line with the TPR of a comparable externally calculated Benchmark, rising on a straight-line basis to 100 per cent when the Company’s TPR exceeds the Benchmark by 1.5 per cent. The Company’s TPR performance excludes land. The Benchmark is calculated by MSCI-IPD based on All Industrial Country benchmarks weighted to reflect the approximate mix of the Company’s portfolio.
The actual TPR performance for the Company’s assets for bonus purposes in 2017 was 20.2 per cent, being 21.8 per cent for the UK and 16.7 per cent for Continental Europe. At the date of this report the MSCI-IPD Benchmark was only available for the UK, at 19.4 per cent.
On the basis of the performance of the Company’s assets against the MSCI-IPD TPR Benchmark as noted above, and for the purposes of this Report, the Committee has estimated that 100 per cent of the overall TPR will be achieved for 2017 Bonus payments. The TPR figures stated above are different to those stated in the KPls on page 40, which relate to standing investments only.
The Adjusted PBT and RRG element of the 2017 Bonus will be paid in April 2018, less a 50 per cent deduction for the DSBP. Payment of the TPR element will be deferred until Summer 2018, when the pan-European MSCI-IPD Benchmark becomes available. Accordingly, the actual payment made under the TPR element of the 2017 Bonus, together with the deferral under the DSBP, may differ from the amount disclosed in this Report. The DSBP award will be made once the final Bonus figures can be calculated. The vesting of the 2017 DSBP will be in April 2021, the third anniversary of the payment of the profit and RRG element of the 2017 Bonus. Any payments under the 2017 Bonus and any awards made under the DSBP will be made in accordance with the Remuneration Policy.
100%
100%
100%
CHART 3: BONUS PAYMENT 2017
TPRPBT
RRG

90
SEGRO PLC | ANNUAL REPORT & ACCOUNTS 2017
Bonus payment 2016Calculation of the TPR element of the Bonus payment is based on comparison with the MSCI-IPD Benchmark, the data for which was not available at the time of publication of the 2016 Annual Report. The Remuneration Committee estimated that 100 per cent of this element would be achieved and the actual TPR data confirmed that this was correct.
Chief Executive single figure
CHART 4: NINE-YEAR CHIEF EXECUTIVE SINGLE TOTAL FIGURE OF REMUNERATION
Year Chief Executive
Chief Executive single figure of remuneration
£000
Short-term incentive payout against
maximum opportunity
%
Long-term incentive vesting rates
against maximum opportunity
%
2017 David Sleath 3,832 100.0 100.0
2016 David Sleath 3,7882 99.2 100.0
2015 David Sleath 2,388 100.0 42.3
2014 David Sleath 2,043 66.7 42.9
2013 David Sleath 1,370 75.4 0.0
2012 David Sleath 1,194 56.7 21.6
20111 David Sleath 860 100.0 19.1
Ian Coull 411 100.0 26.0
2010 Ian Coull 1,896 97.3 26.0
2009 Ian Coull 1,557 75.3 0.0
1 On 28 April 2011, Ian Coull retired as Chief Executive and David Sleath was appointed to this role. The values shown above have been pro-rated accordingly.
2 This figure has been updated since the 2016 Annual Report as some values were estimated. For further information see Chart 1.
REMUNERATION CONTINUED
GOVERNANCE
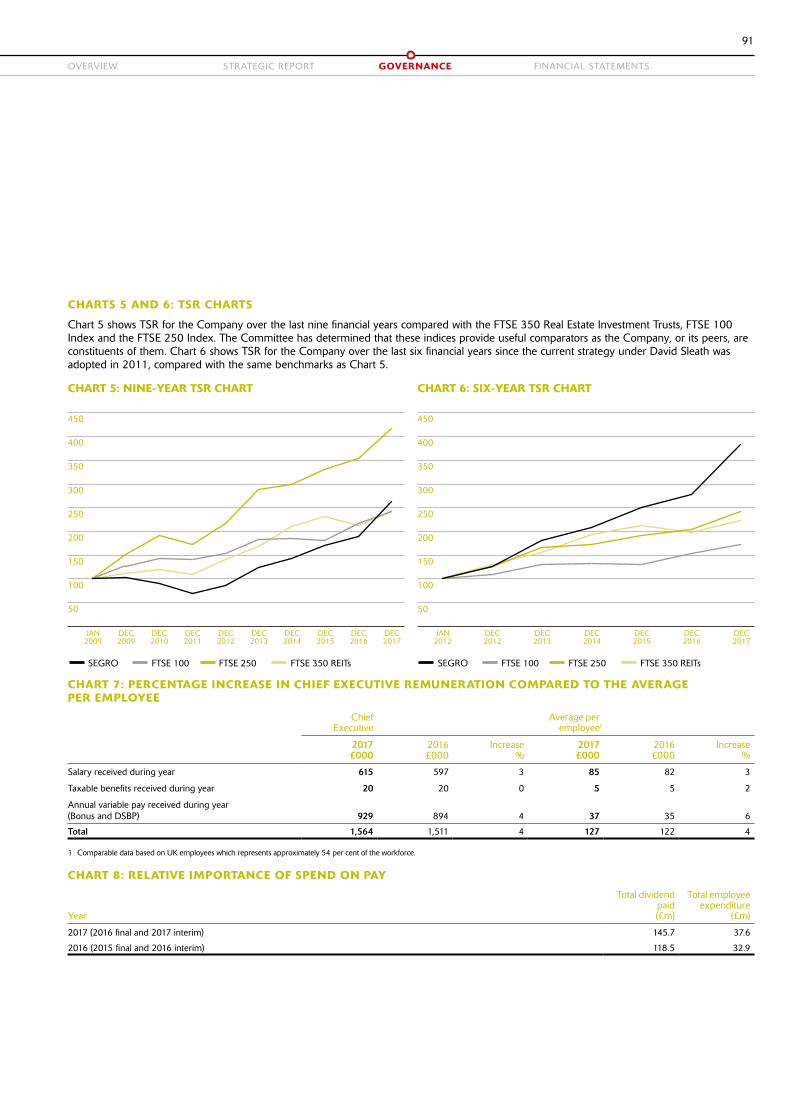
91
OVERVIEW STRATEGIC REPORT GOVERNANCE FINANCIAL STATEMENTS
CHARTS 5 AND 6: TSR CHARTS
Chart 5 shows TSR for the Company over the last nine financial years compared with the FTSE 350 Real Estate Investment Trusts, FTSE 100 Index and the FTSE 250 Index. The Committee has determined that these indices provide useful comparators as the Company, or its peers, are constituents of them. Chart 6 shows TSR for the Company over the last six financial years since the current strategy under David Sleath was adopted in 2011, compared with the same benchmarks as Chart 5.
JAN2009
DEC2010
DEC2009
200
150
100
50
250
300
450
350
SEGRO
400
DEC2011
DEC2012
DEC2013
DEC2014
DEC2017
DEC2016
DEC2015
FTSE 100 FTSE 250 FTSE 350 REITs
CHART 5: NINE-YEAR TSR CHART
JAN2012
200
150
100
50
250
300
450
350
SEGRO
400
DEC2012
DEC2013
DEC2014
DEC2017
DEC2016
DEC2015
FTSE 100 FTSE 250 FTSE 350 REITs
CHART 6: SIX-YEAR TSR CHART
CHART 7: PERCENTAGE INCREASE IN CHIEF EXECUTIVE REMUNERATION COMPARED TO THE AVERAGE PER EMPLOYEE
Chief Executive
Average peremployee1
2017 £000
2016 £000
Increase %
2017 £000
2016 £000
Increase %
Salary received during year 615 597 3 85 82 3
Taxable benefits received during year 20 20 0 5 5 2
Annual variable pay received during year (Bonus and DSBP) 929 894 4 37 35 6
Total 1,564 1,511 4 127 122 4
1 Comparable data based on UK employees which represents approximately 54 per cent of the workforce.
CHART 8: RELATIVE IMPORTANCE OF SPEND ON PAY
Year
Total dividend paid (£m)
Total employee expenditure
(£m)
2017 (2016 final and 2017 interim) 145.7 37.6
2016 (2015 final and 2016 interim) 118.5 32.9
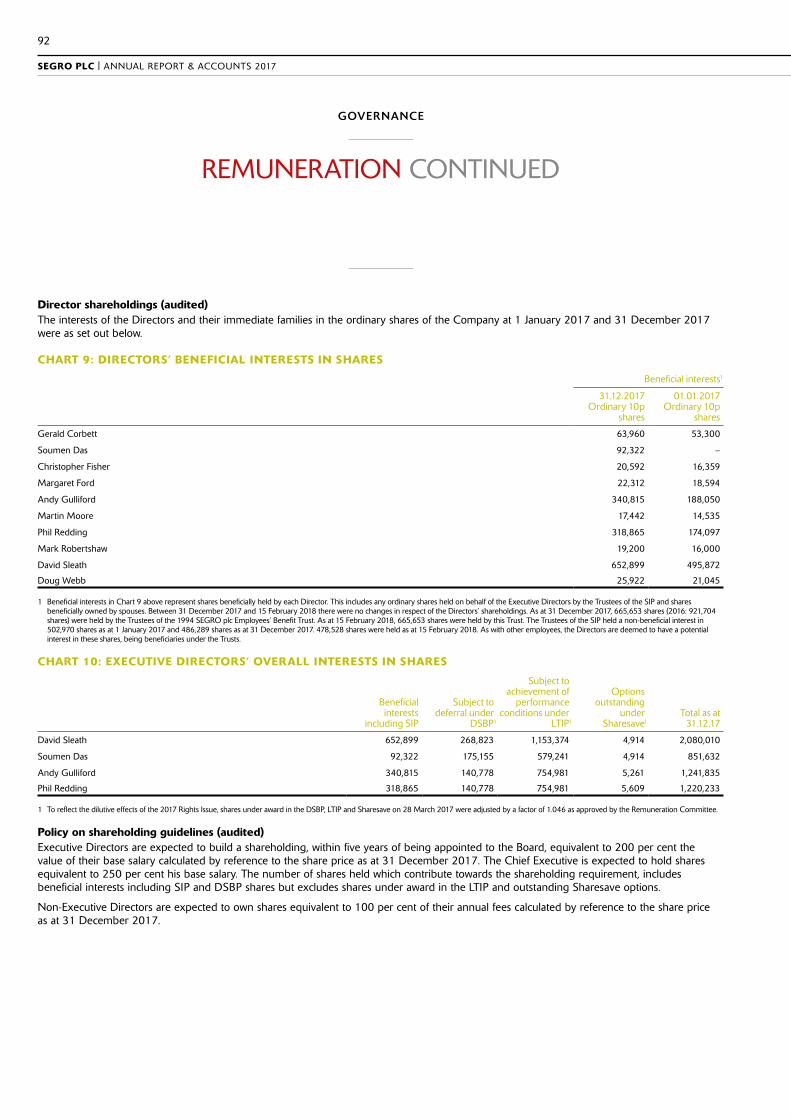
92
SEGRO PLC | ANNUAL REPORT & ACCOUNTS 2017
Director shareholdings (audited)The interests of the Directors and their immediate families in the ordinary shares of the Company at 1 January 2017 and 31 December 2017 were as set out below.
CHART 9: DIRECTORS’ BENEFICIAL INTERESTS IN SHARES
Beneficial interests1
31.12.2017 Ordinary 10p
shares
01.01.2017 Ordinary 10p
shares
Gerald Corbett 63,960 53,300
Soumen Das 92,322 –
Christopher Fisher 20,592 16,359
Margaret Ford 22,312 18,594
Andy Gulliford 340,815 188,050
Martin Moore 17,442 14,535
Phil Redding 318,865 174,097
Mark Robertshaw 19,200 16,000
David Sleath 652,899 495,872
Doug Webb 25,922 21,045
1 Beneficial interests in Chart 9 above represent shares beneficially held by each Director. This includes any ordinary shares held on behalf of the Executive Directors by the Trustees of the SIP and shares beneficially owned by spouses. Between 31 December 2017 and 15 February 2018 there were no changes in respect of the Directors’ shareholdings. As at 31 December 2017, 665,653 shares (2016: 921,704 shares) were held by the Trustees of the 1994 SEGRO plc Employees’ Benefit Trust. As at 15 February 2018, 665,653 shares were held by this Trust. The Trustees of the SIP held a non-beneficial interest in 502,970 shares as at 1 January 2017 and 486,289 shares as at 31 December 2017. 478,528 shares were held as at 15 February 2018. As with other employees, the Directors are deemed to have a potential interest in these shares, being beneficiaries under the Trusts.
CHART 10: EXECUTIVE DIRECTORS’ OVERALL INTERESTS IN SHARES
Beneficial interests
including SIP
Subject to deferral under
DSBP1
Subject to achievement of
performance conditions under
LTIP1
Options outstanding
under Sharesave1
Total as at 31.12.17
David Sleath 652,899 268,823 1,153,374 4,914 2,080,010
Soumen Das 92,322 175,155 579,241 4,914 851,632
Andy Gulliford 340,815 140,778 754,981 5,261 1,241,835
Phil Redding 318,865 140,778 754,981 5,609 1,220,233
1 To reflect the dilutive effects of the 2017 Rights Issue, shares under award in the DSBP, LTIP and Sharesave on 28 March 2017 were adjusted by a factor of 1.046 as approved by the Remuneration Committee.
Policy on shareholding guidelines (audited)Executive Directors are expected to build a shareholding, within five years of being appointed to the Board, equivalent to 200 per cent the value of their base salary calculated by reference to the share price as at 31 December 2017. The Chief Executive is expected to hold shares equivalent to 250 per cent his base salary. The number of shares held which contribute towards the shareholding requirement, includes beneficial interests including SIP and DSBP shares but excludes shares under award in the LTIP and outstanding Sharesave options.
Non-Executive Directors are expected to own shares equivalent to 100 per cent of their annual fees calculated by reference to the share price as at 31 December 2017.
REMUNERATION CONTINUED
GOVERNANCE

93
OVERVIEW STRATEGIC REPORT GOVERNANCE FINANCIAL STATEMENTS
CHART 11: EXECUTIVE DIRECTORS’ SHAREHOLDING AND SHAREHOLDING REQUIREMENTS
Number of shares held as at 31.12.171
Value of shares held as at 31.12.172
Shareholding as apercentage of
salary as at 31.12.17
(%)Shareholding
requirements met
David Sleath 921,722 5,410,508 874.0
Soumen Das 267,477 1,570,090 341.3
Andy Gulliford 481,593 2,826,951 697.5
Phil Redding 459,643 2,698,104 665.7
1 Comprised beneficial holdings and shares subject to deferral under the DSBP.
2 Value of shares calculated using share price of 587.0p as at 29 December 2017.
CHART 12: NON-EXECUTIVE DIRECTORS’ SHAREHOLDING AND SHAREHOLDING REQUIREMENTS
Number of shares held as at 31.12.17
Value of shares held as at 31.12.171
Shareholding as a percentage of
salary as at 31.12.17
(%)Shareholding
requirements met
Gerald Corbett 63,960 375,445 150.2
Christopher Fisher 20,592 120,875 198.2
Margaret Ford 22,312 130,971 184.5
Martin Moore 17,442 102,385 186.2
Mark Robertshaw 19,200 112,704 204.9
Doug Webb 25,922 152,162 234.1
1 Value of shares calculated using share price of 587.0p as at 29 December 2017.

94
SEGRO PLC | ANNUAL REPORT & ACCOUNTS 2017
Executive Director share scheme holdings (audited)
LTIPLTIP awards made after the 2017 AGM are subject to a three-year performance period and a two-year holding period. LTIP awards made before the 2017 AGM were subject to a four-year performance period. All LTIP awards are subject to TSR and TPR performance conditions, which are equally weighted and measured over the performance period:
££ TSR – this benchmark is based on the weighted mean TSR of other FTSE 350 REITs. 25 per cent of this element vests if the Company’s TSR over the performance period is in line with benchmark TSR, rising on a straight-line basis to 100 per cent vesting if the benchmark is exceeded by 5 per cent per year.
££ TPR – this benchmark is based on the MSCI-IPD All Industrial Country benchmarks weighted to reflect the approximate geographical mix of the Group’s portfolio. 25 per cent of this element vests if the Company’s TPR over the performance period is in line with the MSCI-IPD Benchmark, rising on a straight-line basis to 100 per cent if the MSCI-IPD Benchmark is exceeded by 1.5 per cent per year.
On vesting, calculations are approved by the Committee who retain the discretion to withhold vesting of awards should such payments be deemed inappropriate.
The 2013 LTIP Award vested on 7 August 2017, subject to the TSR and TPR performance conditions over the four-year performance period to 31 December 2016. The Company’s TSR over the performance period was 117.7 per cent and the benchmark was 40.3 per cent. The Company’s TSR outperformance of 11.6 per cent per annum compared with the benchmark led to 100 per cent of the TSR element vesting and, as estimated in the 2016 Remuneration Report, 100 per cent of the TPR element vested. Overall, this resulted in a total payout of 100 per cent.
The 2014 LTIP Award will vest on 9 April 2018, subject to relative TSR and TPR over the four-year performance period to 31 December 2017. The Company’s TSR over the performance period was 105.6 per cent and the benchmark TSR was 24.4 per cent. The Company’s TSR outperformance of 13.4 per cent per annum compared with the benchmark will lead to 100 per cent of the TSR element vesting. As with the Bonus, the complete TPR data will not be available until after the date of this Report. For the purposes of the Director’s single figure calculations (Chart 1), the performance for the TPR element has been estimated. The estimated calculation is based on the Company’s actual annualised TPR between 2014 and 2017 of 17.1 per cent and an estimated MSCI-IPD Benchmark over the same period of 15.1 per cent. On this basis, the Company’s four year TPR to 31 December 2017 has exceeded the estimated MSCI-IPD Benchmark by more than 1.5 per cent which would lead to 100 per cent of the TPR element vesting.
Vesting of the TPR element of the LTIP will be deferred until Summer 2018, when the European MSCI-IPD Benchmarks become available. Accordingly, the actual number of shares which will vest under the 2014 LTIP Award, may differ from the amount disclosed in this Report.
Details of the LTIP awards granted to the Executive Directors are set out in Chart 13. Any awards made under the LTIP in 2018 will be made in accordance with the Remuneration Policy.
REMUNERATION CONTINUED
GOVERNANCE

95
OVERVIEW STRATEGIC REPORT GOVERNANCE FINANCIAL STATEMENTS
CHART 13: LTIP AWARDS OUTSTANDING
Date of Grant
No. of shares under award
01.01.17
No. of shares
over which awards
granted during
the year
Share price of shares on grant (pence)1
Face value of award
made in 2017
(£)
Adjustments made
during theyear2
No. of shares
lapsed/not released
during the year
No. of shares
released during
the year
Share price on date of
release (pence)
No. of shares under award
31.12.17
End of performance
period over which
performance conditions
have to be met
DAVID SLEATH
2013 LTIP 06.08.13 333,761 – 311.6 15,353 – 349,114 540.5 – 31.12.16
2014 LTIP 09.04.14 324,005 – 339.5 14,904 – – – 338,909 31.12.17
2015 LTIP 22.05.15 268,165 – 422.5 12,335 – – – 280,500 31.12.18
2016 LTIP 07.04.16 277,392 – 420.7 12,760 – – – 290,152 31.12.19
2017 LTIP 28.04.17 – 243,813 493.0 1,201,998 – – – – 243,813 31.12.195
TOTAL 1,203,323 1,153,374
SOUMEN DAS3
2014 LTIP 02.05.17 – 55,594 434.0 241,278 2,557 – – – 58,151 31.12.17
2015 LTIP 02.05.17 – 83,651 434.0 363,045 3,847 – – – 87,498 31.12.18
2016 LTIP 02.05.17 – 146,916 434.0 637,615 6,758 – – – 153,674 31.12.19
2017 LTIP 28.04.17 – 279,9184 493.0 1,379,996 – – – – 279,918 31.12.195
TOTAL – 566,079 579,241
ANDY GULLIFORD
2013 LTIP 06.08.13 152,759 – 311.6 7,026 – 159,785 540.5 – 31.12.16
2014 LTIP 09.04.14 212,076 – 339.5 9,755 – – – 221,831 31.12.17
2015 LTIP 22.05.15 175,526 – 422.5 8,074 – – – 183,600 31.12.18
2016 LTIP 07.04.16 181,565 – 420.7 8,351 – – – 189,916 31.12.19
2017 LTIP 28.04.17 – 159,634 493.0 786,996 - – – – 159,634 31.12.195
TOTAL 721,926 754,981
PHIL REDDING
2013 LTIP 06.08.13 143,774 – 311.6 6,613 – 150,387 540.5 – 31.12.16
2014 LTIP 09.04.14 212,076 – 339.5 9,755 – – – 221,831 31.12.17
2015 LTIP 22.05.15 175,526 – 422.5 8,074 – – – 183,600 31.12.18
2016 LTIP 07.04.16 181,565 – 420.7 8,351 – – – 189,916 31.12.19
2017 LTIP 28.04.17 – 159,634 493.0 786,996 – – – – 159,634 31.12.195
TOTAL 712,941 754,981
1 The share price of shares on grant is based on the mid-market quotation price for the day before the award, with the exception of the Replacement Awards granted to Soumen Das where the share price on grant was determined by the Committee to reflect the fair value of the awards forfeited on leaving his previous employer.
The Committee has the discretion to adjust awards downwards at vesting if it is not satisfied that the outcome is a fair reflection of underlying performance, or in the event of excessive risk-taking or misstatement. No such discretion was exercised in respect of the vesting of the 2013 Award.
2 To reflect the dilutive effects of the Rights Issue, shares under award on 28 March 2017 were adjusted by a factor of 1.046 as approved by the Remuneration Committee.
3 In order to recruit Soumen Das it was necessary to buy out the share awards he forfeited upon leaving his previous employer. Further details are available on page 96 of the 2016 Annual Report. These awards are subject to the same performance conditions as the other LTIP Awards.
4 As part of his recruitment package, Soumen Das was awarded 300 per cent of salary in respect of the 2017 LTIP. His LTIP opportunity will reduce to 200 per cent of salary in 2018.
5 Following the approval of the Remuneration Policy at the 2017 AGM, LTIP awards made after the 2017 AGM are subject to a three-year performance period and a two-year holding period. Awards made before the 2017 AGM were subject to a four-year performance period.

96
SEGRO PLC | ANNUAL REPORT & ACCOUNTS 2017
DSBPThe DSBP was implemented for the 2010 Bonus payment onwards for the Executive Directors and the Leadership team. Since 2013, the deferral percentage has been 50 per cent for Executive Directors. The shares held under the DSBP are shown in Chart 14 below. On vesting, a cash sum equivalent to the value of dividends that would have been paid on shares during the three years they were under award may also be paid to participants.
CHART 14: DSBP
Date of grant
No. of shares under award
01.01.17
No. of shares granted
during the year
Share price of shares on grant (pence)1
Face value of award
made in 2017
(£)
Adjustments made during
the year2
No. of shares released
during the year
Share price on date of
release (pence)
No. of shares under award
31.12.17
End of holding period
DAVID SLEATH
2013 DSBP 30.06.14 90,768 342.7 4,175 94,943 477.7 – –
2014 DSBP 30.06.15 69,424 408.0 3,193 – – 72,617 28.04.18
2015 DSBP 26.05.16 101,277 432.1 4,658 – – 105,935 28.04.19
2016 DSBP 28.06.17 – 90,271 495.5 447,293 – – – 90,271 28.04.20
TOTAL 261,469 268,823
SOUMEN DAS3
Replacement award 02.05.17 – 52,173 434.0 236,842 2,399 54,572 485.7 – 03.05.17
Replacement award 02.05.17 – 56,976 434.0 258,647 2,620 59,596 485.7 – 03.05.17
Replacement award 02.05.17 – 13,516 434.0 61,356 621 14,137 577.5 – 06.08.17
Replacement award 02.05.17 – 53,638 434.0 234,496 2,467 – – 56,105 01.04.18
Replacement award 02.05.17 – 30,189 434.0 137,044 1,388 – – 31,577 01.03.19
Replacement award 02.05.17 – 69,789 434.0 316,816 3,210 – – 72,999 01.03.19
2016 DSBP 28.06.17 – 14,474 495.5 71,719 – – – 14,474 28.04.20
TOTAL – 290,755 175,155
ANDY GULLIFORD
2013 DSBP 30.06.14 41,226 342.7 1,896 43,122 477.7 – –
2014 DSBP 30.06.15 36,352 408.0 1,672 – – 38,024 28.04.18
2015 DSBP 26.05.16 53,032 432.1 2,439 – – 55,471 28.04.19
2016 DSBP 28.06.17 – 47,283 495.5 234,287 - – – 47,283 28.04.20
TOTAL 130,610 140,778
PHIL REDDING
2013 DSBP 30.06.14 47,529 342.7 2,186 49,715 477.7 – –
2014 DSBP 30.06.15 36,352 408.0 1,672 – – 38,024 28.04.18
2015 DSBP 26.05.16 53,032 432.1 2,439 – – 55,471 28.04.19
2016 DSBP 28.06.17 – 47,283 495.5 234,287 – – – 47,283 28.04.20
TOTAL 136,913 140,778
1 The share price of shares on grant is based on the mid-market quotation price for the day before the event, with the exception of the Replacement Awards granted to Soumen Das where the share price on grant was determined by the Committee to reflect the fair value of the awards forfeited on leaving his previous employer.
2 To reflect the dilutive effects of the Rights Issue, shares under award on 28 March 2017 were adjusted by a factor of 1.046 as approved by the Remuneration Committee.
3 In order to recruit Soumen Das, it was necessary to buy out his 2016 bonus entitlement and the share awards he forfeited upon leaving his previous employer. Further details are available on page 96 of the 2016 Annual Report.
REMUNERATION CONTINUED
GOVERNANCE
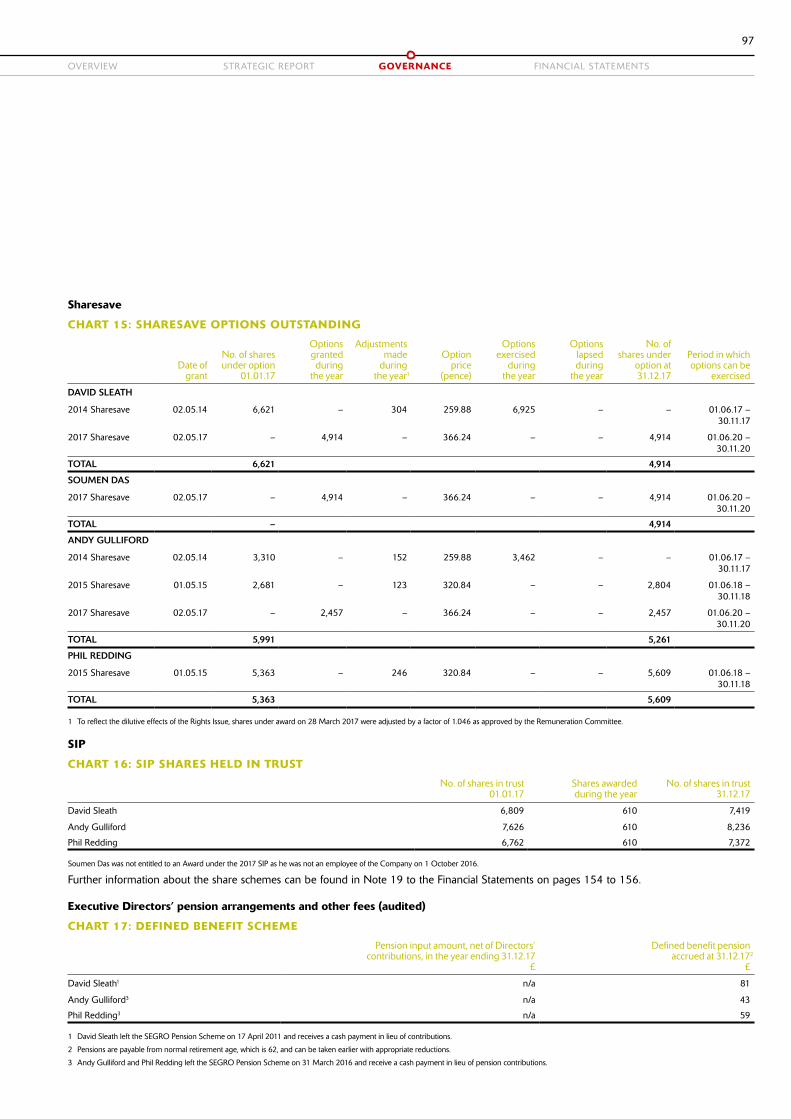
97
OVERVIEW STRATEGIC REPORT GOVERNANCE FINANCIAL STATEMENTS
Sharesave
CHART 15: SHARESAVE OPTIONS OUTSTANDING
Date of grant
No. of shares under option
01.01.17
Options granted during
the year
Adjustments made
during the year1
Option price
(pence)
Options exercised
during the year
Options lapsed during
the year
No. of shares under
option at 31.12.17
Period in which options can be
exercised
DAVID SLEATH
2014 Sharesave 02.05.14 6,621 – 304 259.88 6,925 – – 01.06.17 – 30.11.17
2017 Sharesave 02.05.17 – 4,914 – 366.24 – – 4,914 01.06.20 – 30.11.20
TOTAL 6,621 4,914
SOUMEN DAS
2017 Sharesave 02.05.17 – 4,914 – 366.24 – – 4,914 01.06.20 – 30.11.20
TOTAL – 4,914
ANDY GULLIFORD
2014 Sharesave 02.05.14 3,310 – 152 259.88 3,462 – – 01.06.17 – 30.11.17
2015 Sharesave 01.05.15 2,681 – 123 320.84 – – 2,804 01.06.18 – 30.11.18
2017 Sharesave 02.05.17 – 2,457 – 366.24 – – 2,457 01.06.20 – 30.11.20
TOTAL 5,991 5,261
PHIL REDDING
2015 Sharesave 01.05.15 5,363 – 246 320.84 – – 5,609 01.06.18 – 30.11.18
TOTAL 5,363 5,609
1 To reflect the dilutive effects of the Rights Issue, shares under award on 28 March 2017 were adjusted by a factor of 1.046 as approved by the Remuneration Committee.
SIP
CHART 16: SIP SHARES HELD IN TRUST
No. of shares in trust 01.01.17
Shares awardedduring the year
No. of shares in trust 31.12.17
David Sleath 6,809 610 7,419
Andy Gulliford 7,626 610 8,236
Phil Redding 6,762 610 7,372
Soumen Das was not entitled to an Award under the 2017 SIP as he was not an employee of the Company on 1 October 2016.
Further information about the share schemes can be found in Note 19 to the Financial Statements on pages 154 to 156.
Executive Directors’ pension arrangements and other fees (audited)
CHART 17: DEFINED BENEFIT SCHEME
Pension input amount, net of Directors’ contributions, in the year ending 31.12.17
£
Defined benefit pension accrued at 31.12.172
£
David Sleath1 n/a 81
Andy Gulliford3 n/a 43
Phil Redding3 n/a 59
1 David Sleath left the SEGRO Pension Scheme on 17 April 2011 and receives a cash payment in lieu of contributions.
2 Pensions are payable from normal retirement age, which is 62, and can be taken earlier with appropriate reductions.
3 Andy Gulliford and Phil Redding left the SEGRO Pension Scheme on 31 March 2016 and receive a cash payment in lieu of pension contributions.
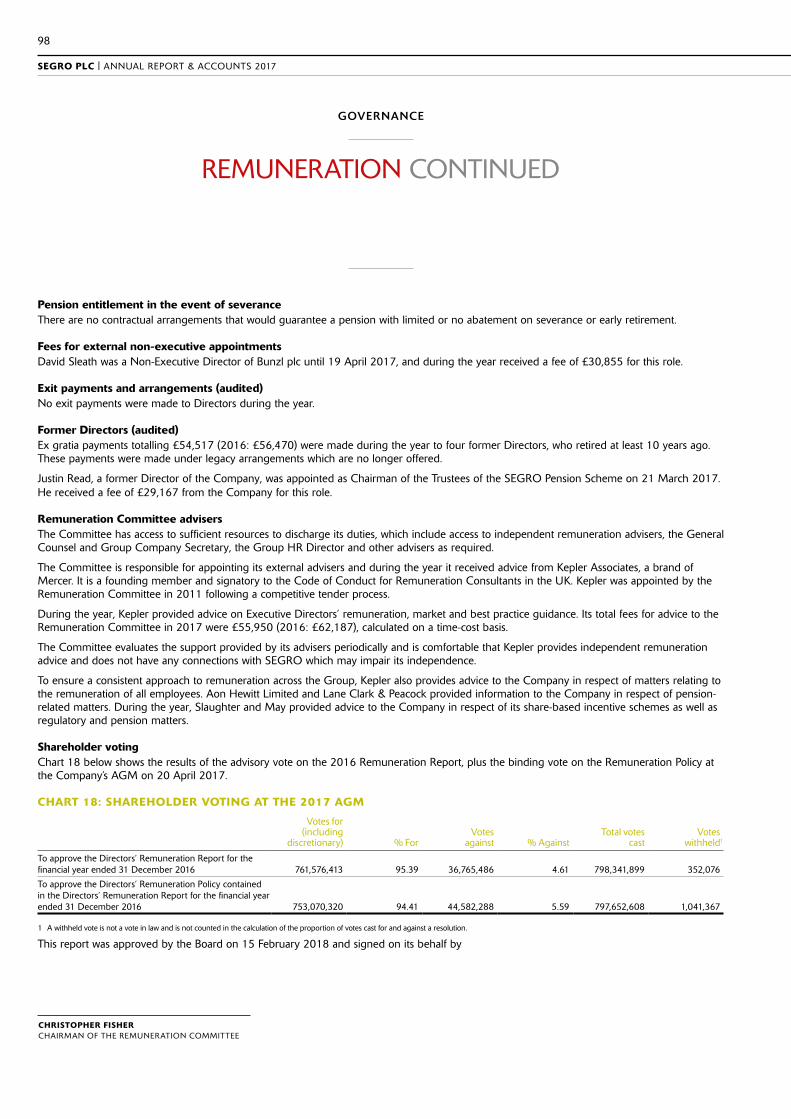
98
SEGRO PLC | ANNUAL REPORT & ACCOUNTS 2017
Pension entitlement in the event of severanceThere are no contractual arrangements that would guarantee a pension with limited or no abatement on severance or early retirement.
Fees for external non-executive appointmentsDavid Sleath was a Non-Executive Director of Bunzl plc until 19 April 2017, and during the year received a fee of £30,855 for this role.
Exit payments and arrangements (audited)No exit payments were made to Directors during the year.
Former Directors (audited)Ex gratia payments totalling £54,517 (2016: £56,470) were made during the year to four former Directors, who retired at least 10 years ago. These payments were made under legacy arrangements which are no longer offered.
Justin Read, a former Director of the Company, was appointed as Chairman of the Trustees of the SEGRO Pension Scheme on 21 March 2017. He received a fee of £29,167 from the Company for this role.
Remuneration Committee advisersThe Committee has access to sufficient resources to discharge its duties, which include access to independent remuneration advisers, the General Counsel and Group Company Secretary, the Group HR Director and other advisers as required.
The Committee is responsible for appointing its external advisers and during the year it received advice from Kepler Associates, a brand of Mercer. It is a founding member and signatory to the Code of Conduct for Remuneration Consultants in the UK. Kepler was appointed by the Remuneration Committee in 2011 following a competitive tender process.
During the year, Kepler provided advice on Executive Directors’ remuneration, market and best practice guidance. Its total fees for advice to the Remuneration Committee in 2017 were £55,950 (2016: £62,187), calculated on a time-cost basis.
The Committee evaluates the support provided by its advisers periodically and is comfortable that Kepler provides independent remuneration advice and does not have any connections with SEGRO which may impair its independence.
To ensure a consistent approach to remuneration across the Group, Kepler also provides advice to the Company in respect of matters relating to the remuneration of all employees. Aon Hewitt Limited and Lane Clark & Peacock provided information to the Company in respect of pension-related matters. During the year, Slaughter and May provided advice to the Company in respect of its share-based incentive schemes as well as regulatory and pension matters.
Shareholder votingChart 18 below shows the results of the advisory vote on the 2016 Remuneration Report, plus the binding vote on the Remuneration Policy at the Company’s AGM on 20 April 2017.
CHART 18: SHAREHOLDER VOTING AT THE 2017 AGM
Votes for (including
discretionary) % ForVotes
against % AgainstTotal votes
castVotes
withheld1
To approve the Directors’ Remuneration Report for the financial year ended 31 December 2016 761,576,413 95.39 36,765,486 4.61 798,341,899 352,076
To approve the Directors’ Remuneration Policy contained in the Directors’ Remuneration Report for the financial year ended 31 December 2016 753,070,320 94.41 44,582,288 5.59 797,652,608 1,041,367
1 A withheld vote is not a vote in law and is not counted in the calculation of the proportion of votes cast for and against a resolution.
This report was approved by the Board on 15 February 2018 and signed on its behalf by
REMUNERATION CONTINUED
GOVERNANCE
CHRISTOPHER FISHERCHAIRMAN OF THE REMUNERATION COMMITTEE

99
OVERVIEW STRATEGIC REPORT GOVERNANCE FINANCIAL STATEMENTS
REMUNERATION POLICY
GOVERNANCE
The Remuneration Policy was approved by Shareholders at the Annual General Meeting held on 20 April 2017 and became effective from this date. The following is an extract from the 2016 SEGRO Annual Report and Accounts. Chart 5, which outlined the potential remuneration in 2017, has been removed. The full Remuneration Policy as approved by shareholders is available at www.SEGRO.com.
REMUNERATION POLICY
The key aim of the Remuneration Policy is to align the interests of Executive Directors with those of the shareholders by supporting the delivery of strategy. The structure of the remuneration framework is designed to reflect the strategic direction of the business and to align it with the Company’s KPIs. In setting the Remuneration Policy, the Committee takes into consideration, amongst other matters, investor guidelines and the maximum amount of remuneration the Executive Directors could receive should all targets be met. The Executive Directors’ remuneration is set within a remuneration framework which applies to all employees across the Group. Each of the key elements of the remuneration package is designed to drive the creation of long-term shareholder value, without encouraging Executive Directors to take inappropriate risk.
Each year, with the support of external advisers, the Committee undertakes a review of the remuneration of the Executive Directors. It has oversight of the remuneration of the Leadership team, who are the senior managers immediately below Board level. It considers the responsibilities, experience and performance of the Executive Directors and pay across the Group.
CHART 1: REMUNERATION POLICY TABLE: EXECUTIVE DIRECTORS
Element Strategic purpose Operation Maximum potential value Performance metrics
Salary To attract and motivate high-calibre leaders in a competitive market and to recognise their skills, experience and contribution to Group performance.
The Committee reviews Executive Directors’ base salaries each year in the context of total remuneration, taking into account the Directors’ responsibilities, experience and performance, pay across the Group and market competitiveness.
The maximum annual salary increase will not normally exceed the average increase which applies across the wider workforce. However, larger increases may be awarded in certain circumstances including, but not limited to: an increase in scope or responsibilities of the role; salary progression for a newly appointed Director; and where the Director’s salary has fallen significantly below the market positioning.
Not applicable.
Pension benefits
To provide a market competitive remuneration package.
Retirement benefits are available to all UK employees and employees in certain Continental European jurisdictions dependent on local market practice and geographical differences.
Currently, the Chief Executive receives a cash allowance of 30 per cent of salary in lieu of pension and other Executive Directors receive 20 per cent of salary. Future Executive Directors will receive up to 20 per cent of salary.
The cash allowance for Directors is offered in lieu of membership of the defined contribution Group Personal Pension Plan.
None.

100
SEGRO PLC | ANNUAL REPORT & ACCOUNTS 2017
Element Strategic purpose Operation Maximum potential value Performance metrics
Bonus To focus on the delivery of annual goals, to strive for superior performance and to achieve specific targets which support strategy, in particular for income generation, total property returns and recurring profit.
Bonuses are awarded annually and paid for performance over the financial year.
The Bonus is reviewed each financial year to ensure performance measures and targets are appropriate and support the business strategy.
Payment is based on the achievement of performance targets.
The Committee retains discretion to reduce the amount of the Bonus award in the light of underlying performance during the year.
The rules of the Bonus contain malus and clawback provisions.
The maximum Bonus opportunity for Executive Directors is 150 per cent of salary.
The Bonus Scheme is based on three, equally weighted elements which the Committee may review from time-to-time, to ensure that they continue to reflect the Company’s strategic priorities: Adjusted PBT against budget including adjustments for acquisitions and disposals, constant foreign exchange rate and other adjustments allowed under the scheme rules, which supports the objective of delivering a sustainable, progressive dividend; relative TPR against an MSCI-IPD Benchmark which is the best and most important internal driver of TSR; and rent roll growth which focuses on driving the future rental income and Adjusted PBT of the business.
Deferred Share Bonus Plan (‘DSBP’)
To encourage retention of senior managers and provide a long-term link between the Bonus and share price growth so as to encourage long-term decision making.
50 per cent of any Bonus awarded in the year is deferred into shares in the DSBP for three years before vesting. The award does not carry any entitlement to dividends, however the Committee may, at the time of the release of the shares, pay a cash sum equivalent to the value of the dividends that would have been paid over the three-year holding period.
The rules of the DSBP contain malus and clawback provisions.
For Executive Directors, 50 per cent of the Bonus earned in respect of the previous year’s performance.
Vesting of shares is dependent on continued employment or good leaver status.
Long Term Incentive Plan (‘LTIP’)
To reward the execution of strategy and drive long-term returns for shareholders. The awards are designed to align the most senior managers’ goals with the creation of sustainable growth in shareholder value. The awards will also increase retention of these senior managers.
For LTIP awards dividends will accrue on the LTIP shares which are released on vesting and will be paid in cash or shares. The Committee has discretion to adjust awards downwards at vesting if it is not satisfied that the outcome is a fair reflection of underlying performance, or in the event of excessive risk-taking or misstatement.
The rules of the LTIP contain malus and clawback provisions.
The normal LTIP grant for Executive Directors is 200 per cent of salary in performance shares.
The Committee may, in exceptional circumstances, make LTIP grants of up to 300 per cent of salary.
LTIP awards are subject to stretching TSR and TPR performance conditions, which are equally weighted and measured over a three-year performance period. A two-year compulsory holding period applies to these LTIP shares after vesting and subject to payment of tax and statutory deductions.
Sharesave To provide a market competitive remuneration package and to encourage employee share ownership across the Group.
Sharesave is a HMRC approved scheme open to all UK employees. Savings can be made over a three-year period to purchase shares in the Company at a price which is set at the beginning of the saving period. This price is usually set at a 20 per cent discount to the market price.
Employees may save up to the HMRC limit across all Sharesave grants.
None.
Share Incentive Plan (‘SIP’) and Global Share Incentive Plan (‘GSIP’)
To provide a market competitive remuneration package and to encourage employee share ownership across the Group.
SIP is a HMRC approved scheme open to all UK employees, subject to service. Eligible employees are awarded shares annually up to the HMRC limits. GSIP is designed on a similar basis to SIP, but is not HMRC approved and is operated for non-UK employees.
The maximum award is subject to the HMRC limit.
Award is based on achievement of prior year profit before tax against budget and is subject to a three-year holding period.
Other benefits To provide a market competitive remuneration package.
Other benefits currently include: car allowance; life assurance; disability insurance; private medical insurance; and health screening. The Committee retains the discretion to offer additional benefits as appropriate, for example, assistance with relocation.
— None.
REMUNERATION POLICY CONTINUED
GOVERNANCE

101
OVERVIEW STRATEGIC REPORT GOVERNANCE FINANCIAL STATEMENTS
Additional notesRemuneration Policy: the policy for the Executive Directors is designed with regard to the pay and benefits for employees across the Group. All employees are eligible for an annual Bonus on the same performance measures which are consistent with those of the Executive Directors save that those below Board level have a fourth target based on their individual performance score. The maximum Bonus opportunity is fixed according to seniority banding across the Company. The LTIP performance conditions are the same for all participants and the size of awards are determined by seniority.
Subject to consultation with major shareholders, the Committee retains the ability to adjust and/or to set different LTIP and Bonus performance measures if events occur (such as a change in strategy, a material acquisition and/or divestment of a Group business, or change in prevailing market conditions) which cause the Committee to determine that the measures are no longer appropriate and that amendment is required so that they achieve their original purpose.
Payments from existing awards: Executive Directors are eligible to receive payment from any award made prior to the approval and implementation of the Remuneration Policy.
CHART 2: REMUNERATION POLICY TABLE: CHAIRMAN AND NON-EXECUTIVE DIRECTORS
Element Strategic purpose Operation Maximum potential value Performance metrics
Fees To attract high-calibre Non-Executive Directors and provide market appropriate fees.
Fees are reviewed every two years taking into account relevant market data. Additional fees are payable to reflect the time commitments and additional responsibilities of the Senior Independent Director and also the Chairmen of the Remuneration and Audit Committees.
The fee paid to the Chairman is set by the Committee while the fees paid to the Non-Executive Directors are set by the Board.
No Director is involved in setting their own remuneration.
Non-Executive Directors do not participate in any performance related remuneration and they do not receive any benefits.
Any increases in the fees of the Chairman or the Non-Executive Directors will be based upon changes in roles and responsibilities and market data.
—
Policy on service contracts Executive DirectorsThe contracts are on a 12-month rolling basis and do not contain liquidated damages clauses.

102
SEGRO PLC | ANNUAL REPORT & ACCOUNTS 2017
Non-Executive DirectorsThe Chairman and the Non-Executive Directors have letters of appointment which set out their duties and anticipated time commitment to the Company. They are required to disclose to the Board any changes to their other significant commitments. The Non-Executive Directors are appointed for an initial term of three years. The appointments may be extended for further three-year periods on the recommendation of the Nomination Committee and subject to the Board’s agreement. The Non-Executive Directors’ letters of appointment contain a three-month notice period and the Chairman’s contains a six-month notice period. Further details are set out in Chart 3.
CHART 3: DATES OF APPOINTMENT AND CONTRACTUAL NOTICE PERIOD
Name Date of appointment Notice period
Gerald Corbett1 1 March 2016 6 months
David Sleath2 1 January 2006 12 months by the Company, 6 months by the Director
Soumen Das 16 January 2017 12 months by the Company, 6 months by the Director
Andy Gulliford 1 May 2013 12 months by the Company, 6 months by the Director
Phil Redding 1 May 2013 12 months by the Company, 6 months by the Director
Christopher Fisher 1 October 2012 3 months
Margaret Ford 1 January 2013 3 months
Martin Moore 1 July 2014 3 months
Mark Robertshaw 1 June 2010 3 months
Doug Webb 1 May 2010 3 months
1 Appointed Chairman on 22 April 2016.
2 Appointed as Chief Executive on 28 April 2011.
Policy on recruitmentIn determining appropriate remuneration for a new Executive Director, the Committee will take into consideration all relevant factors to ensure that arrangements are in the best interests of both the Company and its shareholders. The Committee may make an award in respect of a new appointment to ‘buy out’ incentive arrangements forfeited on leaving a previous employer. In doing so, the Committee will take account of relevant factors, including any performance conditions attached to these awards, the likelihood of those conditions being met, and the proportion of the vesting period remaining, and will seek to do no more than match the fair value of awards foregone. In limited circumstances where employees are awarded benefits for which Executive Directors are not eligible, such as share retention awards, the Committee would consider honouring existing awards should these employees be appointed to the Board.
CHART 4: RECRUITMENT POLICY
Component Approach Maximum opportunity
Base salary The base salaries of new appointees will be determined taking into account the experience and skills of the individual, pay across the Group, relevant market data and their previous salary
—
Bonus The structure set out in the Remuneration Policy table will apply to new appointees with the relevant maximum being pro-rated for their first year of employment
150 per cent of salary
DSBP The structure set out in the Remuneration Policy table will apply to new appointees 50 per cent of the bonus awarded will be deferred
LTIP New appointees will be eligible for awards under the LTIP on the same terms as the other Executive Directors
200 per cent of salary (300 per cent in exceptional circumstances)
Pension New appointees will be offered membership of the SEGRO plc Group Personal Pension Plan or a cash alternative
20 per cent of salary
REMUNERATION POLICY CONTINUED
GOVERNANCE
103
OVERVIEW STRATEGIC REPORT GOVERNANCE FINANCIAL STATEMENTS
Policy on termination paymentsThe Company retains the right to terminate the service contract of any Executive Director subject to contractually agreed payments in lieu of notice which are limited to annual salary plus any specified benefits. Payments are normally phased over the 12-month notice period, based on the principle of a Director’s duty to seek alternative employment and thereby mitigate their loss.
The Committee reserves the right to make additional exit payments where such payments are made in good faith, for example: in discharge of an existing legal obligation (or by way of damages for breach of such an obligation); or by way of settlement or compromise of any claim arising in connection with the termination of a Director’s office or employment. In determining compensation, the Committee will take into account the circumstances of the departure, best practice and the provisions of the Code, and will take legal advice on the Company’s liability to pay compensation.
Under the rules of the LTIP and the DSBP, the Committee has discretion to declare a Director leaving the Company to be a ‘good leaver’ as defined under the respective rules of the schemes. In respect of LTIP, this would normally allow the Directors, who the Committee determines to be good leavers, to receive their shares at the end of the holding period, subject to the achievement of performance conditions, with any vesting pro-rated in accordance with the proportion of the vesting period served. In respect of DSBP, this would normally allow the Directors, who the Committee determines to be good leavers, to receive their shares, in full, at the end of the holding period.
Where a Director may be entitled to pursue a claim against the Company in respect of their statutory employment rights or any other claim arising from the employment or its termination, the Company will be entitled to negotiate settlement terms (financial or otherwise) with the Director that the Committee considers to be reasonable in all the circumstances and in the best interests of the Company and to enter into a Settlement Agreement with the Director to effect both the terms agreed under the Service Agreement and any additional statutory or other claims, including bonus and/or share awards, in line with the policies described above.
In the event of a change of control of the Company, the Employee Benefit Trust, in consultation with the Company, has the discretion to determine whether, and the extent to which, awards vest. Financial performance and institutional guidelines would be taken into account in exercising this discretion.
Non-Executive Directors are not entitled to any compensation on termination of their appointment.
Policy on Executive Directors’ external appointmentsWith the support of the Chairman and Chief Executive, the Executive Directors may normally be permitted to take one non-executive directorship outside the Group, as these roles can broaden the experience brought to the Board. Such appointments require Board approval and the time commitment the appointment will require is taken into consideration. Executive Directors may retain fees for external appointments.
Consideration of conditions elsewhere in the GroupThe Remuneration Policy for the Executive Directors is designed with regard to the policy for employees across the Group as a whole. The Committee has oversight of the remuneration of the Leadership team. The Committee is kept updated through the year on general employment conditions and it approves the budget for annual salary increases. The Company did not consult with employees in formulating the Executive Remuneration Policy.
Consideration of shareholder viewsThe Committee remains committed to open dialogue with shareholders on remuneration. When determining remuneration, the Committee takes into account the guidance of investor bodies and shareholder views. In 2016, it consulted with shareholders on changes to the Policy covered in the Chairman’s letter.
The Chairman of the Remuneration Committee is available for meetings with shareholders should they have any concerns about remuneration matters which they wish to discuss.
104
SEGRO PLC | ANNUAL REPORT & ACCOUNTS 2017
SHARE CAPITAL
The issued share capital for the year is set out on page 154.
There is one class of share in issue and there are no restrictions on the voting rights attached to these shares or the transfer of securities in the Company, and all shares are fully paid.
The Company made no purchases of its own shares during the year.
DIVIDENDS
Subject to approval by shareholders at the 2018 AGM, a final dividend of 11.35 pence per share will be paid (2016: 11.2 pence) bringing the total dividend for 2017 to 16.6 pence (2016: 16.4 pence). The final dividend will be paid as a Property Income Distribution. The Board proposes to offer a scrip dividend option for the 2017 final dividend.
The ex-dividend date for the final dividend will be 22 March 2018, the record date will be 23 March 2018 and the payment date will be 3 May 2018.
CHANGE OF CONTROL
££ Contracts and joint venture agreements
There are a number of contracts and joint venture agreements that could allow the counterparties to terminate or alter those arrangements in the event of a change of control of the Company. These arrangements are commercially confidential and their disclosure could be seriously prejudicial to the Company.
££ Borrowings and other financial instruments
The Group has a number of borrowing facilities provided by various lenders. These facilities generally include provisions that may require any outstanding borrowings to be repaid or the amendment or termination of the facilities upon the occurrence of a change of control of the Company.
££ Employee share plans
The Company’s share plans contain provisions as a result of which options and awards may vest or become exercisable on change of control of the Company, in accordance with the rules of the plans.
EMPLOYEES AND DIRECTORS
There are no agreements between the Company and its Directors or employees providing for compensation for loss of office or employment that occurs specifically because of a takeover bid, with the exception of provisions of the Company’s share schemes as detailed above.
££ Directors’ authorities in relation to shares
The Directors’ authorities in relation to issuing, allotting or buying back shares are governed by the Company’s Articles of Association and the resolutions passed by shareholders at a general meeting. These documents do not form part of this Report.
££ Process for appointment/removal of Directors
The Company is governed by its Articles of Association, the UK Corporate Governance Code, the Companies Act 2006 and related legislation with regards to the appointment and removal of Directors. Directors are appointed by the Board and elected by shareholders. Directors may be removed by the Board or shareholders as applicable.
DIRECTORS’ REPORT

105
OVERVIEW STRATEGIC REPORT GOVERNANCE FINANCIAL STATEMENTS
SUBSTANTIAL INTERESTS IN THE SHARE CAPITAL OF THE COMPANY
The following major interests, amounting to 3 per cent or more of the ordinary issued share capital have been notified to the Company. No further announcements were made to the Company between 31 December 2017 and 15 February 2018.
As at 31 December 2017
ShareholderNumber of
sharesPercentage of Issued
Share Capital
BlackRock Inc 94,960,016 9.47
APG Asset Mgt 54,848,519 5.47
Artemis Investments Mgt 54,319,087 5.42
State Street Corporation 45,514,545 4.54
The Vanguard Group, Inc 37,760,779 3.77
Legal and General Group 33,421,235 3.33
Standard Life Aberdeen 33,219,834 3.31
CB Richard Ellis Group Inc 31,806,033 3.17
ARTICLES OF ASSOCIATION
Shareholders may amend the Company’s Articles of Association by special resolution.
POLITICAL DONATIONS
No political donations were made by the Company or its subsidiaries during the year.
DIRECTORS’ INDEMNITIES
No Company or subsidiary company Directors were indemnified during the year.
OVERSEAS BRANCHES
The Company has a branch in Paris, France.
DIRECTORS’ REPORT DISCLOSURES
Certain Directors’ Report disclosures have been made in the Strategic Report so as to increase their prominence. These disclosures include those relating to: greenhouse gas emissions; financial instruments and certain financial risks; employee involvement; the employment, training and advancement of disabled persons; the review of the Group’s business during the year and any future developments.
AUDITOR OF THE COMPANY
A resolution to reappoint PricewaterhouseCoopers LLP as auditor of the Company is to be proposed at the 2018 AGM.
DISCLOSURE OF INFORMATION TO THE AUDITOR
Each of the persons who is a Director at the date of approval of this Report confirms that:
££ So far as the Director is aware, there is no relevant audit information of which the Company’s auditor is unaware; and
££ Each Director has taken all the steps that he ought to have taken as a Director in order to make himself aware of any relevant audit information and to establish that the Company’s auditor is aware of that information.
This confirmation is given and should be interpreted in accordance with the provisions of section 418 of the Companies Act 2006.
The Directors’ Report has been approved by the Board and signed on its behalf by
ELIZABETH BLEASE GENERAL COUNSEL AND GROUP COMPANY SECRETARY15 FEBRUARY 2018

106
SEGRO PLC | ANNUAL REPORT & ACCOUNTS 2017
STATEMENT OF DIRECTORS’ RESPONSIBILITIES
The Directors are responsible for preparing the Annual Report, the Directors’ Remuneration Report and the Financial Statements in accordance with applicable law and regulations.
Company law requires the Directors to prepare Financial Statements for each financial year. Under that law the Directors have prepared the Group and Company Financial Statements in accordance with International Financial Reporting Standards (IFRSs) as adopted by the European Union. Under company law the Directors must not approve the Financial Statements unless they are satisfied that they give a true and fair view of the state of affairs of the Group and the Company and of the profit or loss of the Group for that period. In preparing these Financial Statements, the Directors are required to:
££ Select suitable accounting policies and then apply them consistently;
££ Make judgements and accounting estimates that are reasonable and prudent;
££ State whether applicable IFRSs as adopted by the European Union have been followed, subject to any material departures disclosed and explained in the Financial Statements;
££ Prepare the Financial Statements on the going concern basis unless it is inappropriate to presume that the Company will continue in business.
The Directors are responsible for keeping adequate accounting records that are sufficient to show and explain the Company’s transactions and disclose with reasonable accuracy at any time the financial position of the Company and the Group and enable them to ensure that the Financial Statements and the Directors’ Remuneration Report comply with the Companies Act 2006 and, as regards the Group Financial Statements, Article 4 of the IAS Regulation. They are also responsible for safeguarding the assets of the Company and the Group and hence for taking reasonable steps for the prevention and detection of fraud and other irregularities.
The Directors are responsible for the maintenance and integrity of the Company’s website. Legislation in the United Kingdom governing the preparation and dissemination of Financial Statements may differ from legislation in other jurisdictions.
The Directors consider that the Annual Report and Accounts, taken as a whole, is fair, balanced and understandable and provides the information necessary for shareholders to assess a Company’s position and performance, business model and strategy.
Each of the Directors, whose names and functions are listed in the Governance section of the Annual Report confirm that, to the best of their knowledge:
££ The Group Financial Statements, which have been prepared in accordance with IFRSs as adopted by the EU, give a true and fair view of the assets, liabilities, financial position and profit or loss of the Group; and
££ The Strategic Report includes a fair review of the development and performance of the business and the position of the Group, together with a description of the principal risks and uncertainties that it faces.
By order of the Board
DAVID SLEATH SOUMEN DAS CHIEF EXECUTIVE CHIEF FINANCIAL OFFICER 15 FEBRUARY 2018 15 FEBRUARY 2018
In this section we present our Financial Statements for the year, presented in accordance with International Financial Reporting Standards, as adopted by the European Union.
IN THIS SECTION:
INDEPENDENT AUDITOR’S REPORT TO THE MEMBERS OF SEGRO PLC 108
GROUP INCOME STATEMENT 114
GROUP STATEMENT OF COMPREHENSIVE INCOME 114
BALANCE SHEETS 115
STATEMENTS OF CHANGES IN EQUITY 116
CASH FLOW STATEMENTS 118
NOTES TO THE FINANCIAL STATEMENTS 119
FIVE-YEAR FINANCIAL RESULTS 177
FINANCIAL INFORMATION 178
ANALYSIS OF SHAREHOLDERS 178
SHAREHOLDER INFORMATION 179
GLOSSARY OF TERMS 180
FINANCIAL STATEMENTS
REPORT ON THE AUDIT OF THE FINANCIAL STATEMENTS
OpinionIn our opinion, SEGRO plc’s Group Financial Statements and Company Financial Statements (the ‘Financial Statements’):
– Give a true and fair view of the state of the Group’s and of the Company’s affairs as at 31 December 2017 and of the Group’s profit and the Group’s and the Company’s cash flows for the year then ended;
– Have been properly prepared in accordance with IFRSs as adopted by the European Union and, as regards the Company’s Financial Statements, as applied in accordance with the provisions of the Companies Act 2006; and
– Have been prepared in accordance with the requirements of the Companies Act 2006 and, as regards the Group Financial Statements, Article 4 of the IAS Regulation.
We have audited the Financial Statements, included within the Annual Report & Accounts 2017 (the ‘Annual Report’), which comprise: the Group and Company Balance Sheets as at 31 December 2017; the Group Income Statement and the Group Statement of Comprehensive Income, the Group and Company Cash Flow Statements, and the Group and Company Statements of Changes in Equity for the year then ended; and the notes to the Financial Statements, which include a description of the significant accounting policies.
Our opinion is consistent with our reporting to the Audit Committee.
Basis for opinionWe conducted our audit in accordance with International Standards on Auditing (UK) (‘ISAs (UK)’) and applicable law. Our responsibilities under ISAs (UK) are further described in the Auditors’ responsibilities for the audit of the Financial Statements section of our report. We believe that the audit evidence we have obtained is sufficient and appropriate to provide a basis for our opinion.
IndependenceWe remained independent of the Group in accordance with the ethical requirements that are relevant to our audit of the Financial Statements in the UK, which includes the FRC’s Ethical Standard, as applicable to listed public interest entities, and we have fulfilled our other ethical responsibilities in accordance with these requirements.
To the best of our knowledge and belief, we declare that non-audit services prohibited by the FRC’s Ethical Standard were not provided to the Group or the Company.
Other than those disclosed in note 6 to the Financial Statements, we have provided no non-audit services to the Group or the Company in the period from 1 January 2017 to 31 December 2017.
Our audit approach
Overview
– Overall Group materiality: £79.4 million (2016: £61.0 million), based on 1% of total assets.
– Overall Company materiality: £68.6 million (2016: £55.6 million), based on 1% of total assets.
– Group specific overall materiality: £9.7 million (2016: 8 million), based on 5% of adjusted profit before tax, for items impacting adjusted profit before tax.
– Audit procedures on Rental Income and Valuation of Investment Properties are performed centrally by the Group audit team from the UK.
– Full scope audit of the SELP Joint Venture by local auditors.
– Specified procedures performed by local auditors.
– Over 90% coverage of Assets, Liabilities, Income and Expenditure of the Group.
– Valuation of investment properties (Group).
– Large and/or complex transactions (Group and parent).
INDEPENDENT AUDITORS’ REPORT TO THE MEMBERS OF SEGRO PLC
Key auditmatters
Audit scope
Materiality
108
SEGRO PLC | ANNUAL REPORT & ACCOUNTS 2017
FINANCIAL STATEMENTS

The scope of our auditAs part of designing our audit, we determined materiality and assessed the risks of material misstatement in the Financial Statements. In particular, we looked at where the directors made subjective judgements, for example in respect of significant accounting estimates that involved making assumptions and considering future events that are inherently uncertain. We gained an understanding of the legal and regulatory framework applicable to the Group and the industry in which it operates, and considered the risk of acts by the Group which were contrary to applicable laws and regulations, including fraud. We designed audit procedures at group and significant component level to respond to the risk, recognising that the risk of not detecting a material misstatement due to fraud is higher than the risk of not detecting one resulting from error, as fraud may involve deliberate concealment by, for example, forgery or intentional misrepresentations, or through collusion. We focused on laws and regulations that could give rise to a material misstatement in the Group Financial Statements, including but not limited to, the Companies Act 2006, the Listing Rules, the UK tax legislation and equivalent local laws and regulations applicable to significant component teams. Our tests included, but were not limited to, review of the financial statement disclosures and underlying supporting documentation, review of the litigation register, enquiries of management, review of significant components auditors’ work, involving our tax specialists in the audit and review of internal audit reports in so far as they related to the Financial Statements.
There are inherent limitations in the audit procedures described above and the further removed non-compliance with laws and regulations is from the events and transactions reflected in the Financial Statements, the less likely we would become aware of it.
We did not identify any key audit matters relating to irregularities, including fraud. As in all of our audits, we also addressed the risk of management override of internal controls, including testing journals and evaluating whether there was evidence of bias by the directors that represented a risk of material misstatement due to fraud.
Key audit mattersKey audit matters are those matters that, in the auditors’ professional judgement, were of most significance in the audit of the Financial Statements of the current period and include the most significant assessed risks of material misstatement (whether or not due to fraud) identified by the auditors, including those which had the greatest effect on: the overall audit strategy; the allocation of resources in the audit; and directing the efforts of the engagement team. These matters, and any comments we make on the results of our procedures thereon, were addressed in the context of our audit of the Financial Statements as a whole, and in forming our opinion thereon, and we do not provide a separate opinion on these matters. This is not a complete list of all risks identified by our audit.
Key audit matter How our audit addressed the key audit matter
Valuation of investment propertiesRefer to page 79 (Audit Committee Report) and Financial Statements (including notes to the Financial Statements; Note 1, Significant accounting policies; Note 13, Properties; and Note 27, Property valuation techniques and related quantitative information).
The Group’s investment properties were carried at £6,745m as at 31 December 2017 and a total (realised and unrealised) property gain of £889m was recognised in the Group income statement. We focused on this area due to the existence of significant judgement, coupled with the fact that only small differences in individual property valuations when aggregated could result in material misstatement. The portfolio includes warehouses and light industrial buildings, including warehouses used as data centres and for logistics operations. These are concentrated in the UK, France, Germany, Italy and Poland. The remainder of the portfolio is located across other European countries including Spain, Belgium, the Netherlands and the Czech Republic.
The portfolio includes completed investments and properties under construction. The methodology applied in determining the valuation is set out in notes 13 and 27 of the Financial Statements. The valuation of the Group’s portfolio is inherently subjective due to, among other factors, the individual nature of each property, its location and the expected future rentals for that particular property. For developments, factors include projected costs to complete, time until practical completion and the ability to let if no pre-let agreement is in place. Valuations are carried out by third party valuers, CBRE Ltd (the ‘Valuers’). The Valuers were engaged by the Directors, and performed their work in accordance with the Royal Institute of Chartered Surveyors (‘RICS’) Valuation – Professional Standards. The Valuers used by the Group have considerable experience of the markets in which the Group operates. The valuations take into account the property-specific information referred to above (including the current tenancy agreements and rental income, condition and location of the property, future rental prospects), as well as prevailing market yields and market transactions.
Assessing the Valuers’ expertise and objectivityWe assessed the Valuers’ qualifications and expertise and read their terms of engagement with the Group to determine whether there were any matters that might have affected their objectivity or may have imposed scope limitations upon their work. We also considered fee and other contractual arrangements that might exist between the Group and the Valuers. We found no evidence to suggest that the objectivity of the Valuers was compromised.
Testing the valuationsAssumptions and capital movement:We obtained valuation details of every property held by the Group and set an expected range for yield and capital value movement, determined by reference to published benchmarks and using our experience and knowledge of the market. We then obtained and read the CBRE valuation reports covering every property. We determined, based on our expertise and experience, that the valuation approach was in accordance with RICS standards and suitable for use in determining the carrying value for the Financial Statements.
We compared the investment yields used by the Valuers to the expected range of yields and the year on year capital movement to our expected range. We also considered the reasonableness of other assumptions that are not so readily comparable with published benchmarks, such as Estimated Rental Value.
We held meetings with management and the Valuers, at which the valuations and the key assumptions therein were discussed. Our work covered the valuation of every property in the Group, with the discussions with management and the Valuers focussing on the largest properties in the portfolio and those where the assumptions used and/or year on year capital value movement suggested a possible outlier versus externally published market data for the relevant sector. Where assumptions were outside the expected range or otherwise appeared unusual, and/or valuations showed unexpected movements, we undertook further investigations and, when necessary, held further discussions with the Valuers and obtained evidence to support explanations received.
The valuation commentaries provided by the Valuers and the supporting evidence, enabled us to consider the property specific factors that had or may have had an impact on value, including recent comparable transactions where appropriate. We also satisfied ourselves that for properties where there could be alternative use opportunities, this had been appropriately taken into account.
Information and standing data:We tested the standing data the Group provided to the Valuers for use in the performance of the valuation. This involved re-performing controls on a sample basis over the input of lease data for leases and testing the accuracy of lease and other property information. For development properties we also confirmed that the supporting information for construction contracts and budgets was consistent with the Group’s records, for example by inspecting original construction contracts. For developments, capitalised expenditure was tested on a sample basis to invoices, and budgeted costs to complete were compared to supporting evidence (for example construction contracts). We agreed the amounts per the valuation reports to the accounting records and from there we agreed the related balances through to the Financial Statements.
Overall outcomeBased on the work performed we found that the assumptions used were supported by the evidence we obtained.
OVERVIEW STRATEGIC REPORT GOVERNANCE FINANCIAL STATEMENTS
109

INDEPENDENT AUDITORS’ REPORT TO THE MEMBERS OF SEGRO PLC CONTINUED
Key audit matter How our audit addressed the key audit matter
Large and/or complex transactionsRefer to page 79 (Audit Committee Report) and Financial Statements (including notes to the Financial Statements; Note 1, Significant accounting policies; Note 13, Properties; Note 16, Net Borrowings; and Note 19, Share Capital and Share-Based Payments. There were a number of transactions during the year which warranted particular additional audit focus due to the magnitude of the transactions and/or the potential for complex contractual terms that introduce judgement into how they were accounted for. Key transactions subject to additional audit focus were:
– Acquisition of investment property assets for £1,212 million (including £1,113 million through the APP asset acquisition);
– Disposal of investment property assets of £480 million;
– Raising of £1,898 million via issuance of bonds, Rights Issue and through US private placement; and
– Asset acquisition of the APP Joint Venture
For each large and/or complex transaction, we made inquiries with management in order to understand their nature and obtained supporting documentation as necessary to verify the transactions. We assessed the proposed accounting treatment in relation to the Group’s accounting policies and relevant IFRSs.
Acquisitions and disposalsWe tested acquisitions and disposals of investment properties by examining:
– Sale and Purchase Agreements and completion statements;
– Bank statements to agree consideration received or paid; and
– For the disposal of assets to SELP, the fair value of assets used in determining the transaction price.
Bond issuance, Rights Issue and US private placementFor the bond issue, Rights Issue and US private placement, we examined legal agreements, resolutions passed by the Board and cash receipts.
Asset acquisition of the APP Joint VentureInquired about the treatment of the asset acquisition with management. We have reviewed the sale and purchase agreements and verified that the transaction meets the criteria for an asset acquisition under IFRS 3.
Overall outcomeNo material issues were identified as a result of our testing.
How we tailored the audit scopeWe tailored the scope of our audit to ensure that we performed enough work to be able to give an opinion on the Financial Statements as a whole, taking into account the structure of the Group and the Company, the accounting processes and controls, and the industry in which they operate.
The Group’s reportable segments are the geographical Business Units: Greater London, Thames Valley and National Logistics, Northern Europe, Southern Europe and Central Europe. We tailored the scope of our audit to ensure that we performed enough work to be able to give an opinion on the Financial Statements as a whole, taking into account the geographic structure of the Group, the accounting processes and controls, and the industry in which the Group operates.
The Group operates a common IT environment, processes and controls for rental income and payroll across all its reported segments. The Group’s valuation and treasury functions are also based at the corporate centre in the UK. The related balances were therefore audited by the Group audit team from the UK, using Computer Assisted Audit Techniques for the work on rental income. Additional specified procedures were performed by audit teams on location in each business unit, such that the total testing programme provided sufficient audit evidence over all financial statement line items.
The SELP Joint Venture was included as being in scope for a full scope audit, with the work on rental income and valuation for the joint venture performed by the Group audit team.
Throughout the audit process, the Group audit team has had various interactions with the audit teams on location in each business unit to oversee the audit process. Taking into account the components and Joint Ventures subject to a full scope audit, the centralised and other testing performed, coverage over the Group Balance Sheet and Group Income Statement was as follows:
Assets 99% coverage
Liabilities 96% coverage
Income 98% coverage
Expenditure 92% coverage
The audit of the Company Financial Statements was performed entirely by the Group audit team in the UK, leveraging on the work performed on the Group audit where appropriate with additional audit procedures performed on other Company specific balances.
110
SEGRO PLC | ANNUAL REPORT & ACCOUNTS 2017
FINANCIAL STATEMENTS
MaterialityThe scope of our audit was influenced by our application of materiality. We set certain quantitative thresholds for materiality. These, together with qualitative considerations, helped us to determine the scope of our audit and the nature, timing and extent of our audit procedures on the individual financial statement line items and disclosures and in evaluating the effect of misstatements, both individually and in aggregate on the Financial Statements as a whole.
Based on our professional judgement, we determined materiality for the Financial Statements as a whole as follows:
Group Financial Statements Company Financial Statements
Overall materiality £79.4 million (2016: £61.0 million). £68.6 million (2016: £55.6 million).
How we determined it 1% of total assets. 1% of total assets.
Rationale for benchmark applied The primary measurement attribute of the Group is the carrying value of property investments. On this basis, we set an overall Group materiality level based on total assets.
The primary measurement attribute of the Company is the carrying value of investments in subsidiaries. On this basis, we set an overall Company materiality level based on total assets.
For each component in the scope of our Group audit, we allocated a materiality that is less than our overall Group materiality. The range of materiality allocated across components was between £30.0 million and £71.4 million. In addition, we set a specific overall materiality level of £9.7 million, equating to 5% of adjusted profit before tax, for items impacting adjusted profit before tax. In arriving at this judgement we had regard to the fact that the adjusted profit before tax is a secondary financial indicator of the Group (refer to note 2 of the Financial Statements on page 125 where the term is defined in full.). Certain components were audited to a local statutory audit materiality that was also less than our overall Group materiality.
We agreed with the Audit Committee that we would report to them misstatements identified during our audit above £4.0 million (Group audit) (2016: £1.0 million) or £1.0 million in the case of misstatements impacting adjusted profit before tax, and £3.4 million (Company audit) (2016: £1.0 million) as well as misstatements below those amounts that, in our view, warranted reporting for qualitative reasons.
Going concernIn accordance with ISAs (UK) we report as follows:
Reporting obligation Outcome
We are required to report if we have anything material to add or draw attention to in respect of the directors’ statement in the Financial Statements about whether the directors considered it appropriate to adopt the going concern basis of accounting in preparing the Financial Statements and the directors’ identification of any material uncertainties to the Group’s and the Company’s ability to continue as a going concern over a period of at least twelve months from the date of approval of the Financial Statements.
We have nothing material to add or to draw attention to. However, because not all future events or conditions can be predicted, this statement is not a guarantee as to the Group’s and Company’s ability to continue as a going concern.
We are required to report if the directors’ statement relating to going concern in accordance with Listing Rule 9.8.6R(3) is materially inconsistent with our knowledge obtained in the audit.
We have nothing to report.
OVERVIEW STRATEGIC REPORT GOVERNANCE FINANCIAL STATEMENTS
111
INDEPENDENT AUDITORS’ REPORT TO THE MEMBERS OF SEGRO PLC CONTINUED
Reporting on other informationThe other information comprises all of the information in the Annual Report other than the Financial Statements and our auditors’ report thereon. The directors are responsible for the other information. Our opinion on the Financial Statements does not cover the other information and, accordingly, we do not express an audit opinion or, except to the extent otherwise explicitly stated in this report, any form of assurance thereon.
In connection with our audit of the Financial Statements, our responsibility is to read the other information and, in doing so, consider whether the other information is materially inconsistent with the Financial Statements or our knowledge obtained in the audit, or otherwise appears to be materially misstated. If we identify an apparent material inconsistency or material misstatement, we are required to perform procedures to conclude whether there is a material misstatement of the Financial Statements or a material misstatement of the other information. If, based on the work we have performed, we conclude that there is a material misstatement of this other information, we are required to report that fact. We have nothing to report based on these responsibilities.
With respect to the Strategic Report, Directors’ Report and Corporate Governance Statement, we also considered whether the disclosures required by the UK Companies Act 2006 have been included.
Based on the responsibilities described above and our work undertaken in the course of the audit, the Companies Act 2006, (CA06), ISAs (UK) and the Listing Rules of the Financial Conduct Authority (FCA) require us also to report certain opinions and matters as described below (required by ISAs (UK) unless otherwise stated).
Strategic report and Directors’ reportIn our opinion, based on the work undertaken in the course of the audit, the information given in the Strategic Report and Directors’ Report for the year ended 31 December 2017 is consistent with the Financial Statements and has been prepared in accordance with applicable legal requirements. (CA06).
In light of the knowledge and understanding of the Group and Company and their environment obtained in the course of the audit, we did not identify any material misstatements in the Strategic Report and Directors’ Report. (CA06).
Corporate governance statementIn our opinion, based on the work undertaken in the course of the audit, the information given in the Corporate Governance Statement (on pages 62 to 83) about internal controls and risk management systems in relation to financial reporting processes and about share capital structures in compliance with rules 7.2.5 and 7.2.6 of the Disclosure Guidance and Transparency Rules sourcebook of the FCA (‘DTR’) is consistent with the Financial Statements and has been prepared in accordance with applicable legal requirements. (CA06).In light of the knowledge and understanding of the Group and Company and their environment obtained in the course of the audit, we did not identify any material misstatements in this information. (CA06).In our opinion, based on the work undertaken in the course of the audit, the information given in the Corporate Governance Statement (on pages 62 to 83) with respect to the Company’s Corporate Governance Code and practices and about its administrative, management and supervisory bodies and their committees complies with rules 7.2.2, 7.2.3 and 7.2.7 of the DTR. (CA06).
We have nothing to report arising from our responsibility to report if a Corporate Governance Statement has not been prepared by the Company. (CA06).
The directors’ assessment of the prospects of the Group and of the principal risks that would threaten the solvency or liquidity of the GroupWe have nothing material to add or draw attention to regarding: – The directors’ confirmation on page 106 of the Annual Report that they have carried out a robust assessment of the principal risks facing the Group, including those that would threaten its business model, future performance, solvency or liquidity.
– The disclosures in the Annual Report that describe those risks and explain how they are being managed or mitigated. – The directors’ explanation on page 57 of the Annual Report as to how they have assessed the prospects of the Group, over what period they have done so and why they consider that period to be appropriate, and their statement as to whether they have a reasonable expectation that the Group will be able to continue in operation and meet its liabilities as they fall due over the period of their assessment, including any related disclosures drawing attention to any necessary qualifications or assumptions.
We have nothing to report having performed a review of the directors’ statement that they have carried out a robust assessment of the principal risks facing the Group and statement in relation to the longer-term viability of the Group. Our review was substantially less in scope than an audit and only consisted of making inquiries and considering the directors’ process supporting their statements; checking that the statements are in alignment with the relevant provisions of the UK Corporate Governance Code (the ‘Code’); and considering whether the statements are consistent with the knowledge and understanding of the Group and Company and their environment obtained in the course of the audit. (Listing Rules)
Other code provisionsWe have nothing to report in respect of our responsibility to report when: – The statement given by the directors, on page 106, that they consider the Annual Report taken as a whole to be fair, balanced and understandable, and provides the information necessary for the members to assess the Group’s and Company’s position and performance, business model and strategy is materially inconsistent with our knowledge of the Group and Company obtained in the course of performing our audit.
– The section of the Annual Report on pages 77 to 81 describing the work of the Audit Committee does not appropriately address matters communicated by us to the Audit Committee.
– The directors’ statement relating to the Company’s compliance with the Code does not properly disclose a departure from a relevant provision of the Code specified, under the Listing Rules, for review by the auditors.
Directors’ remunerationIn our opinion, the part of the Directors’ Remuneration Report to be audited has been properly prepared in accordance with the Companies Act 2006. (CA06)
112
SEGRO PLC | ANNUAL REPORT & ACCOUNTS 2017
FINANCIAL STATEMENTS

Responsibilities for the Financial Statements and the auditResponsibilities of the directors for the Financial StatementsAs explained more fully in the Statement of Directors’ Responsibilities set out on page 106, the directors are responsible for the preparation of the Financial Statements in accordance with the applicable framework and for being satisfied that they give a true and fair view. The directors are also responsible for such internal control as they determine is necessary to enable the preparation of Financial Statements that are free from material misstatement, whether due to fraud or error.
In preparing the Financial Statements, the directors are responsible for assessing the Group’s and the Company’s ability to continue as a going concern, disclosing as applicable, matters related to going concern and using the going concern basis of accounting unless the directors either intend to liquidate the Group or the Company or to cease operations, or have no realistic alternative but to do so.
Auditors’ responsibilities for the audit of the Financial StatementsOur objectives are to obtain reasonable assurance about whether the Financial Statements as a whole are free from material misstatement, whether due to fraud or error, and to issue an auditors’ report that includes our opinion. Reasonable assurance is a high level of assurance, but is not a guarantee that an audit conducted in accordance with ISAs (UK) will always detect a material misstatement when it exists. Misstatements can arise from fraud or error and are considered material if, individually or in the aggregate, they could reasonably be expected to influence the economic decisions of users taken on the basis of these Financial Statements.
A further description of our responsibilities for the audit of the Financial Statements is located on the FRC’s website at: www.frc.org.uk/auditorsresponsibilities. This description forms part of our auditors’ report.
Use of this reportThis report, including the opinions, has been prepared for and only for the Company’s members as a body in accordance with Chapter 3 of Part 16 of the Companies Act 2006 and for no other purpose. We do not, in giving these opinions, accept or assume responsibility for any other purpose or to any other person to whom this report is shown or into whose hands it may come save where expressly agreed by our prior consent in writing.
OTHER REQUIRED REPORTING
Companies Act 2006 exception reportingUnder the Companies Act 2006 we are required to report to you if, in our opinion:
– We have not received all the information and explanations we require for our audit; or – Adequate accounting records have not been kept by the Company, or returns adequate for our audit have not been received from branches not visited by us; or
– Certain disclosures of directors’ remuneration specified by law are not made; or – The Company Financial Statements and the part of the Directors’ Remuneration Report to be audited are not in agreement with the accounting records and returns.
We have no exceptions to report arising from this responsibility.
AppointmentFollowing the recommendation of the audit committee, we were appointed by the members on 22 April 2016 to audit the Financial Statements for the year ended 31 December 2016 and subsequent financial periods. The period of total uninterrupted engagement is 2 years, covering the years ended 31 December 2016 to 31 December 2017.
CRAIG HUGHES (SENIOR STATUTORY AUDITOR)FOR AND ON BEHALF OF PRICEWATERHOUSECOOPERS LLP CHARTERED ACCOUNTANTS AND STATUTORY AUDITORS LONDON 15 FEBRUARY 2018
OVERVIEW STRATEGIC REPORT GOVERNANCE FINANCIAL STATEMENTS
113

Notes2017
£m2016
£m
Revenue 4 334.7 283.5
Gross rental income 4 272.9 225.5
Property operating expenses 5 (52.2) (44.9)
Net rental income 220.7 180.6
Joint venture management fee income 4 24.3 18.6
Administration expenses 6 (39.7) (31.4)
Share of profit from joint ventures after tax 7 108.1 85.1
Realised and unrealised property gain 8 889.0 246.0
Goodwill and other amounts written off on acquisitions and amortisation of intangibles (0.6) (0.2)
Operating profit 1,201.8 498.7
Finance income 9 40.6 46.7
Finance costs 9 (266.1) (119.0)
Profit before tax 976.3 426.4
Tax 10 (20.0) (7.7)
Profit after tax 956.3 418.7
Attributable to equity shareholders 952.7 417.7
Attributable to non-controlling interests 3.6 1.0
Earnings per share (pence)¹
Basic 12 98.5 51.6
Diluted 12 97.9 51.3
1 The comparative earnings per share has been re-presented following the Rights Issue detailed in Note 12.
GROUP STATEMENT OF COMPREHENSIVE INCOMEFOR THE YEAR ENDED 31 DECEMBER 2017
Notes2017
£m2016
£m
Profit for the year 956.3 418.7
Items that will not be reclassified subsequently to profit or loss
Actuarial (loss)/gain on defined benefit pension schemes 18 (16.2) 15.0
(16.2) 15.0
Items that may be reclassified subsequently to profit or loss
Foreign exchange movement arising on translation of international operations 27.3 114.1
Decrease in value of available-for-sale investments – (0.3)
Fair value movements on derivatives in effective hedge relationships (6.4) (86.4)
20.9 27.4
Tax on components of other comprehensive income – –
Other comprehensive profit before transfers 4.7 42.4
Transfer to income statement of amount realised on fair value of interest rate swaps and derivatives 3.1 –
Transfer to income statement of realised foreign exchange movements – (2.0)
Total comprehensive profit for the year 964.1 459.1
Attributable to equity shareholders 960.6 458.5
Attributable to non-controlling interests 3.5 0.6
GROUP INCOME STATEMENTFOR THE YEAR ENDED 31 DECEMBER 2017
114
SEGRO PLC | ANNUAL REPORT & ACCOUNTS 2017
FINANCIAL STATEMENTS

Notes
Group Company
2017 £m
2016 £m
2017 £m
2016 £m
Assets Non-current assets Goodwill and other intangibles 4.0 3.1 – –Investment properties 13 6,745.4 4,714.4 – –Other interests in property 13.4 9.6 – –Plant and equipment 14.7 16.1 1.4 1.3Investments in subsidiaries 7 – – 6,672.9 5,391.1Investments in joint ventures 7 792.0 1,066.2 – –Available-for-sale investments – 0.7 – –Derivative financial instruments 17 60.7 80.1 60.7 80.1Pension assets 18 38.7 45.7 38.7 45.7
7,668.9 5,935.9 6,773.7 5,518.2Current assets Trading properties 13 12.5 25.4 – –Trade and other receivables 14 141.8 102.8 6.3 4.5Derivative financial instruments 17 2.6 12.6 2.6 12.6Cash and cash equivalents 16 109.3 32.0 76.4 22.1
266.2 172.8 85.3 39.2Total assets 7,935.1 6,108.7 6,859.0 5,557.4Liabilities Non-current liabilities Borrowings 16 2,063.5 1,630.4 2,061.6 1,631.1Deferred tax liabilities 10 34.6 16.3 – –Trade and other payables 15 – 4.7 1,442.4 1,470.6Derivative financial instruments 17 – 14.7 – 14.7 2,098.1 1,666.1 3,504.0 3,116.4Current liabilities Trade and other payables 15 247.5 246.5 51.3 69.1Derivative financial instruments 17 4.0 11.1 4.0 11.1Tax liabilities 1.3 4.1 – 0.1
252.8 261.7 55.3 80.3Total liabilities 2,350.9 1,927.8 3,559.3 3,196.7Net assets 5,584.2 4,180.9 3,299.7 2,360.7Equity Share capital 19 100.3 83.0 100.3 83.0Share premium 20 1,998.6 1,431.1 1,998.6 1,431.1Capital redemption reserve 20 113.9 113.9 113.9 113.9Own shares held 21 (3.3) (5.5) (3.3) (5.5)Other reserves 20 225.7 196.2 223.3 220.5Retained earnings brought forward 2,363.4 2,050.3 517.7 309.9Profit for the year attributable to owners of the parent 952.7 417.7 518.5 312.7Other movements (165.9) (104.6) (169.3) (104.9)
Retained earnings 3,150.2 2,363.4 866.9 517.7Total equity attributable to owners of the parent 5,585.4 4,182.1 3,299.7 2,360.7Non-controlling interests (1.2) (1.2) – –Total equity 5,584.2 4,180.9 3,299.7 2,360.7Net assets per ordinary share (pence)¹ Basic 12 557 482 Diluted 12 554 480
1 The comparative net assets per ordinary share have been re-presented as detailed in Note 12.
The Financial Statements of SEGRO plc (registered number 167591) on pages 114 to 171 were approved by the Board of Directors and authorised for issue on 15 February 2018 and signed on its behalf by:
BALANCE SHEETSAS AT 31 DECEMBER 2017
DJR SLEATH S DASDIRECTORS
OVERVIEW STRATEGIC REPORT GOVERNANCE FINANCIAL STATEMENTS
115
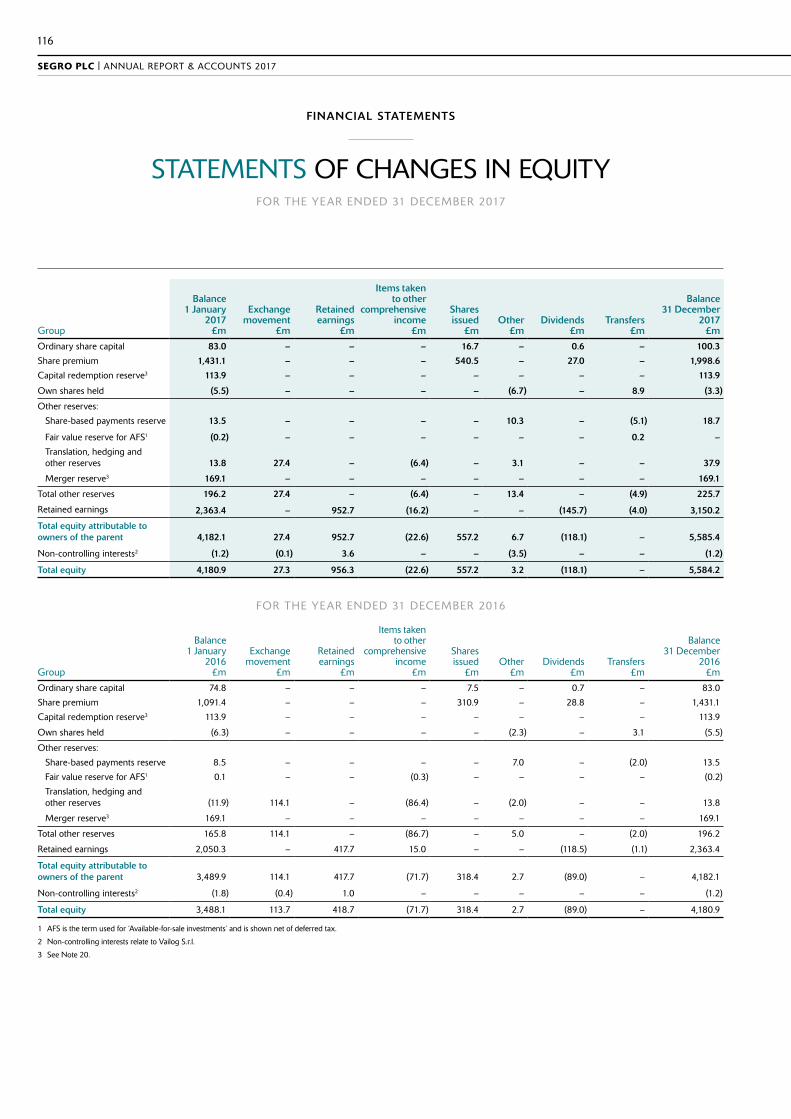
STATEMENTS OF CHANGES IN EQUITYFOR THE YEAR ENDED 31 DECEMBER 2017
Group
Balance 1 January
2017 £m
Exchange movement
£m
Retained earnings
£m
Items taken to other
comprehensive income
£m
Shares issued
£mOther
£mDividends
£mTransfers
£m
Balance 31 December
2017 £m
Ordinary share capital 83.0 – – – 16.7 – 0.6 – 100.3
Share premium 1,431.1 – – – 540.5 – 27.0 – 1,998.6
Capital redemption reserve3 113.9 – – – – – – – 113.9
Own shares held (5.5) – – – – (6.7) – 8.9 (3.3)
Other reserves:
Share-based payments reserve 13.5 – – – – 10.3 – (5.1) 18.7
Fair value reserve for AFS1 (0.2) – – – – – – 0.2 –
Translation, hedging and other reserves 13.8 27.4 – (6.4) – 3.1 – – 37.9
Merger reserve3 169.1 – – – – – – – 169.1
Total other reserves 196.2 27.4 – (6.4) – 13.4 – (4.9) 225.7
Retained earnings 2,363.4 – 952.7 (16.2) – – (145.7) (4.0) 3,150.2
Total equity attributable to owners of the parent 4,182.1 27.4 952.7 (22.6) 557.2 6.7 (118.1) – 5,585.4
Non-controlling interests2 (1.2) (0.1) 3.6 – – (3.5) – – (1.2)
Total equity 4,180.9 27.3 956.3 (22.6) 557.2 3.2 (118.1) – 5,584.2
FOR THE YEAR ENDED 31 DECEMBER 2016
Group
Balance 1 January
2016 £m
Exchange movement
£m
Retained earnings
£m
Items taken to other
comprehensive income
£m
Shares issued
£mOther
£mDividends
£mTransfers
£m
Balance 31 December
2016 £m
Ordinary share capital 74.8 – – – 7.5 – 0.7 – 83.0
Share premium 1,091.4 – – – 310.9 – 28.8 – 1,431.1
Capital redemption reserve3 113.9 – – – – – – – 113.9
Own shares held (6.3) – – – – (2.3) – 3.1 (5.5)
Other reserves:
Share-based payments reserve 8.5 – – – – 7.0 – (2.0) 13.5
Fair value reserve for AFS1 0.1 – – (0.3) – – – – (0.2)
Translation, hedging and other reserves (11.9) 114.1 – (86.4) – (2.0) – – 13.8
Merger reserve3 169.1 – – – – – – – 169.1
Total other reserves 165.8 114.1 – (86.7) – 5.0 – (2.0) 196.2
Retained earnings 2,050.3 – 417.7 15.0 – – (118.5) (1.1) 2,363.4
Total equity attributable to owners of the parent 3,489.9 114.1 417.7 (71.7) 318.4 2.7 (89.0) – 4,182.1
Non-controlling interests2 (1.8) (0.4) 1.0 – – – – – (1.2)
Total equity 3,488.1 113.7 418.7 (71.7) 318.4 2.7 (89.0) – 4,180.9
1 AFS is the term used for ‘Available-for-sale investments’ and is shown net of deferred tax.
2 Non-controlling interests relate to Vailog S.r.l.
3 See Note 20.
116
SEGRO PLC | ANNUAL REPORT & ACCOUNTS 2017
FINANCIAL STATEMENTS

Company
Balance 1 January
2017 £m
Retained earnings
£m
Items taken to other
comprehensive income
£m
Shares issued
£mOther
£mDividends
£mTransfers
£m
Balance 31 December
2017 £m
Ordinary share capital 83.0 – – 16.7 – 0.6 – 100.3
Share premium 1,431.1 – – 540.5 – 27.0 – 1,998.6
Capital redemption reserve1 113.9 – – – – – – 113.9
Own shares held (5.5) – – – (6.7) – 8.9 (3.3)
Other reserves:
Share-based payments reserve 4.0 – – – 4.3 – (1.5) 6.8
Translation hedging and other reserves 47.4 – – – – – – 47.4
Merger reserve1 169.1 – – – – – 169.1
Total other reserves 220.5 – – – 4.3 (1.5) 223.3
Retained earnings 517.7 518.5 (16.2) – – (145.7) (7.4) 866.9
Total equity attributable to equity shareholders 2,360.7 518.5 (16.2) 557.2 (2.4) (118.1) – 3,299.7
FOR THE YEAR ENDED 31 DECEMBER 2016
Company
Balance 1 January
2016 £m
Retained earnings
£m
Items taken to other
comprehensive income
£m
Shares issued
£mOther
£mDividends
£mTransfers
£m
Balance 31 December
2016 £m
Ordinary share capital 74.8 – – 7.5 – 0.7 – 83.0
Share premium 1,091.4 – – 310.9 – 28.8 – 1,431.1
Capital redemption reserve1 113.9 – – – – – – 113.9
Own shares held (6.3) – – – (2.3) – 3.1 (5.5)
Other reserves:
Share-based payments reserve 2.3 – – – 3.4 – (1.7) 4.0
Translation hedging and other reserves 47.4 – – – – – – 47.4
Merger reserve1 169.1 – – – – – – 169.1
Total other reserves 218.8 – – – 3.4 – (1.7) 220.5
Retained earnings 309.9 312.7 15.0 – – (118.5) (1.4) 517.7
Total equity attributable to equity shareholders 1,802.5 312.7 15.0 318.4 1.1 (89.0) – 2,360.7
1 See Note 20.
STATEMENTS OF CHANGES IN EQUITYFOR THE YEAR ENDED 31 DECEMBER 2017
OVERVIEW STRATEGIC REPORT GOVERNANCE FINANCIAL STATEMENTS
117
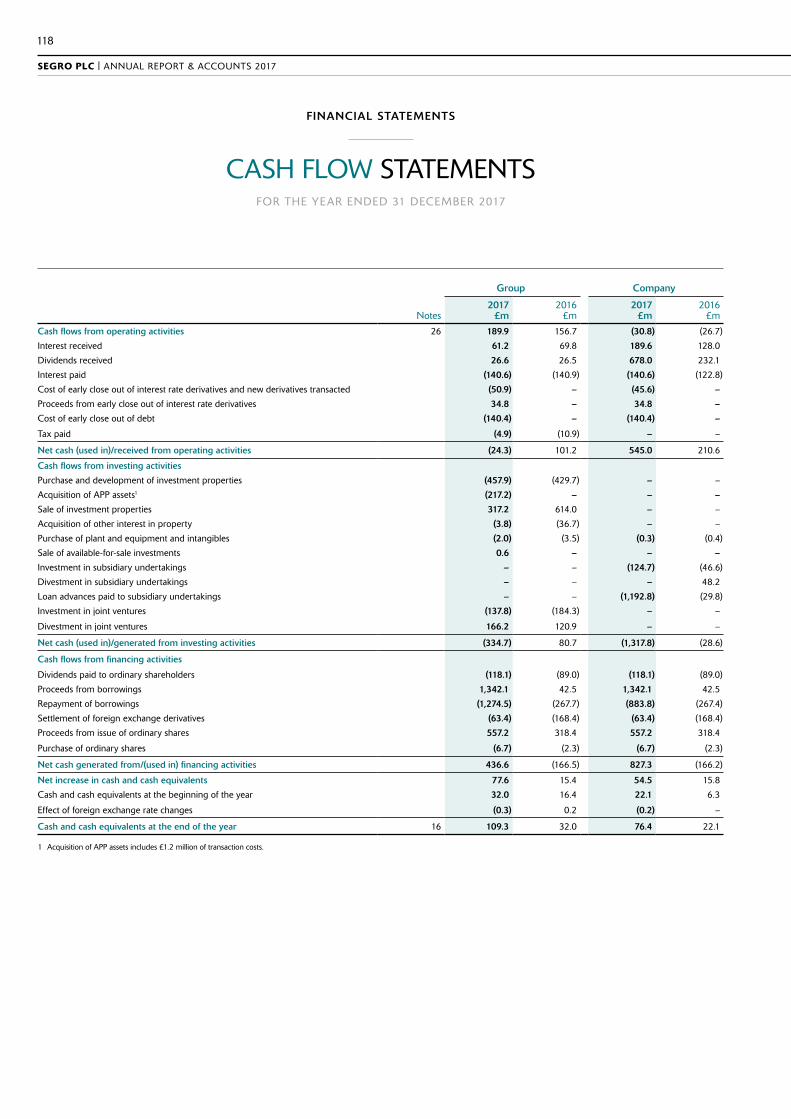
CASH FLOW STATEMENTSFOR THE YEAR ENDED 31 DECEMBER 2017
Notes
Group Company
2017 £m
2016 £m
2017 £m
2016 £m
Cash flows from operating activities 26 189.9 156.7 (30.8) (26.7)
Interest received 61.2 69.8 189.6 128.0
Dividends received 26.6 26.5 678.0 232.1
Interest paid (140.6) (140.9) (140.6) (122.8)
Cost of early close out of interest rate derivatives and new derivatives transacted (50.9) – (45.6) –
Proceeds from early close out of interest rate derivatives 34.8 – 34.8 –
Cost of early close out of debt (140.4) – (140.4) –
Tax paid (4.9) (10.9) – –
Net cash (used in)/received from operating activities (24.3) 101.2 545.0 210.6
Cash flows from investing activities
Purchase and development of investment properties (457.9) (429.7) – –
Acquisition of APP assets1 (217.2) – – –
Sale of investment properties 317.2 614.0 – –
Acquisition of other interest in property (3.8) (36.7) – –
Purchase of plant and equipment and intangibles (2.0) (3.5) (0.3) (0.4)
Sale of available-for-sale investments 0.6 – – –
Investment in subsidiary undertakings – – (124.7) (46.6)
Divestment in subsidiary undertakings – – – 48.2
Loan advances paid to subsidiary undertakings – – (1,192.8) (29.8)
Investment in joint ventures (137.8) (184.3) – –
Divestment in joint ventures 166.2 120.9 – –
Net cash (used in)/generated from investing activities (334.7) 80.7 (1,317.8) (28.6)
Cash flows from financing activities
Dividends paid to ordinary shareholders (118.1) (89.0) (118.1) (89.0)
Proceeds from borrowings 1,342.1 42.5 1,342.1 42.5
Repayment of borrowings (1,274.5) (267.7) (883.8) (267.4)
Settlement of foreign exchange derivatives (63.4) (168.4) (63.4) (168.4)
Proceeds from issue of ordinary shares 557.2 318.4 557.2 318.4
Purchase of ordinary shares (6.7) (2.3) (6.7) (2.3)
Net cash generated from/(used in) financing activities 436.6 (166.5) 827.3 (166.2)
Net increase in cash and cash equivalents 77.6 15.4 54.5 15.8
Cash and cash equivalents at the beginning of the year 32.0 16.4 22.1 6.3
Effect of foreign exchange rate changes (0.3) 0.2 (0.2) –
Cash and cash equivalents at the end of the year 16 109.3 32.0 76.4 22.1
1 Acquisition of APP assets includes £1.2 million of transaction costs.
118
SEGRO PLC | ANNUAL REPORT & ACCOUNTS 2017
FINANCIAL STATEMENTS
1. SIGNIFICANT ACCOUNTING POLICIES
General informationSEGRO plc (the Company) is a company incorporated in the United Kingdom under the Companies Act. The address of the registered office is given on the inside back cover.
The principal activities of the Company and its subsidiaries (the Group) and the nature of the Group’s operations are set out in the Strategic Report on pages 16 to 20.
These Financial Statements are presented in pounds sterling because that is the currency of the primary economic environment in which the Group operates and is the functional currency of the Company.
Basis of preparationThe Financial Statements have been prepared in accordance with EU Endorsed International Financial Reporting Standards (IFRS), IFRS Interpretations Committee (IFRS IC), and the Companies Act 2006 applicable to companies reporting under IFRS. The Group’s Financial Statements also comply with Article 4 of the EU IAS Regulations. In addition, the Group has also disclosed additional measures relating to the Best Practice Recommendations Guidelines issued by the European Public Real Estate Association (EPRA) as appropriate, as discussed further in Note 2.
The Financial Statements have been prepared on a going concern basis. This is discussed in the Financial Review on page 35.
The Directors have taken advantage of the exemption offered by section 408 of the Companies Act 2006 not to present a separate income statement and statement of comprehensive income for the Company. The Financial Statements have been prepared under the historical cost convention as modified by the revaluation of properties, available-for-sale investments and certain financial assets and liabilities including derivatives.
In the current year, the Group has applied a number of amendments to IFRSs and a new Interpretation issued by the International Accounting Standards Board (IASB) that are mandatorily effective for an accounting period that begins on or after 1 January 2017.
The following standards and amendments have been adopted by the Group and the Company for the first time for the financial year beginning on 1 January 2017:
– Recognition of deferred tax assets for unrealised losses – amendments to IAS 12 – Disclosure initiative – amendments to IAS 7
The adoption of these amendments did not have any impact on the Financial Statements of the Group or the Company for the current period or any prior period and is not likely to affect future periods. The amendments to IAS 7 requires disclosure of changes in financial liabilities and assets arising from financing activities. See Note 26 (iv) for the Group and Company analysis.
A number of new standards and amendments to standards and interpretations are effective for annual periods beginning after 1 January 2017, and have not been applied in preparing these Financial Statements:
– Amendments to IFRS 2, ‘Share-based payments’, on clarifying how to account for certain types of share-based payment transactions – IFRS 9 ‘Financial instruments’ – IFRS 15 ‘Revenue from contracts with customers’ – IFRS 16 ‘Leases’ – Amendment to IAS 40, ‘Investment property’ relating to transfers of investment property – Annual improvements 2014–2016 – IFRIC 22 ‘Foreign currency transactions and advance consideration’
NOTES TO THE FINANCIAL STATEMENTS FOR THE YEAR ENDED 31 DECEMBER 2017
OVERVIEW STRATEGIC REPORT GOVERNANCE FINANCIAL STATEMENTS
119

NOTES TO THE FINANCIAL STATEMENTS CONTINUED
FOR THE YEAR ENDED 31 DECEMBER 2017
1. SIGNIFICANT ACCOUNTING POLICIES CONTINUED
None of these standards not yet effective are expected to have a significant effect on the Financial Statements of the Group or Company. Certain Standards which might have an impact are discussed below.
Title of standard IFRS 9 Financial Instruments
Nature of change IFRS 9 addresses the classification, measurement and derecognition of financial assets and financial liabilities, introduces new rules for hedge accounting and a new impairment model for financial assets.
Impact The Group has reviewed its financial assets and liabilities and is expecting the following impact from the adoption of the new standard on 1 January 2018:
i. Classification – Financial assets and liabilitiesIFRS 9 contains three principal classification categories for financial assets: measured at amortised cost, FVOCI and FVTPL. The standard eliminates the existing IAS 39 categories of held to maturity, loans and receivables and available for sale.
At 31 December 2017 the Group held no equity investments classified as available for sale and so IFRS 9 will have no impact on this financial asset category.
There will be no impact on the Group’s accounting for financial liabilities, as the new requirements only affect the accounting for financial liabilities that are designated at fair value through profit or loss and the Group does not have any such liabilities. The derecognition rules have been transferred from IAS 39 Financial Instruments: Recognition and Measurement and have not been changed.
ii. Impairment – Financial assets and contract assetsThe new impairment model requires the recognition of impairment provisions based on expected credit losses (ECL) rather than only incurred credit losses as is the case under IAS 39. It applies to financial assets classified at amortised cost, debt instruments measured at FVOCI, contract assets under IFRS 15 Revenue from Contracts with Customers, lease receivables, loan commitments and certain financial guarantee contracts.
The significant financial assets held by the Group that will be impacted by the impairment losses recognised under IFRS 9 are trade receivables. Gross trade receivables held at 31 December 2017 were £30.4m with an impairment provision recognised under IAS 39 of £3.7m. Based on the reasons set out in the Credit risk management section in Note 17 the credit risk associated with unpaid rent is deemed to be low. Management have performed an assessment of the impact of impairment losses recognised for trade receivables under IFRS 9 at 31 December 2017 through estimating the ECLs based on actual credit loss experienced over the past three years. Based on this assessment the impact and volatility on impairment losses recognised under IFRS 9 is estimated to be immaterial.
The Company holds intercompany loan and receivables balances with the subsidiaries of the Group as disclosed in Note 7 and 14. Management do not estimate there to be a material impact on the Company only Financial Statements from the recognition of impairment provisions for the loans and receivables under IFRS 9 compared to the current provision held under IAS 39.
iii. Hedge accountingAs a general rule, more hedge relationships might be eligible for hedge accounting, as the standard introduces a more principles-based approach. The Group has confirmed that the current hedge relationships in place at 31 December 2017 for foreign exchange contracts and cross currency swap contracts designated as net investment hedges will qualify as continuing hedges upon the adoption of IFRS 9.
The Group does not currently intend to designate other derivatives instruments currently used as part of its risk management strategy as hedging relationships under IFRS 9.
iv. DisclosuresThe new standard also introduces expanded disclosure requirements and changes in presentation. These are expected to change the nature and extent of the Group’s disclosures about its financial instruments particularly in the year of the adoption of the new standard.
Date of adoption by Group Must be applied for financial years commencing on or after 1 January 2018. The Group will apply the new rules retrospectively from 1 January 2018, with the practical expedients permitted under the standard. Comparatives for 2017 are not expected to be restated.
Title of standard IFRS 15 Revenue from Contracts with Customers
Nature of change The IASB has issued a new standard for the recognition of revenue. This will replace IAS 18 which covers contracts for goods and services. The new standard is based on the principle that revenue is recognised when control of a good or service transfers to a customer. The standard permits either a full retrospective or a modified retrospective approach for the adoption.
Impact Management has assessed the effects of applying the new standard on the Group’s Financial Statements.
i. Revenue recognition IFRS 15 does not apply to rental income which makes up over 80 per cent of total revenue of the Group, but does apply to other non-core revenue streams; service charge income, management and performance fees and trading property disposals. At present the Group does not estimate IFRS 15 to have a significant difference in the amount or timing of the recognition of revenue for the non-core income streams that fall under the scope and an immaterial impact on the Group Income Statement.
ii. DisclosuresThe new standard also introduces expanded disclosure requirements. These will change the nature and extent of the Group’s revenue disclosures.
Date of adoption by Group Mandatory for financial years commencing on or after 1 January 2018. The Group intends to adopt the standard using the modified retrospective approach which means that the cumulative impact of the adoption will be recognised in retained earnings as of 1 January 2018 and that comparatives will not be restated.
120
SEGRO PLC | ANNUAL REPORT & ACCOUNTS 2017
FINANCIAL STATEMENTS

1. SIGNIFICANT ACCOUNTING POLICIES CONTINUED
Title of standard IFRS 16 Leases
Nature of change IFRS 16 was issued in January 2016. It will result in almost all leases being recognised on the balance sheet for a lessee, as the distinction between operating and finance leases is removed. Under the new standard, an asset (the right to use the leased item) and a financial liability to pay rentals are recognised. The only exceptions are short-term and low-value leases. The accounting for lessors will not significantly change.
Impact At present, as a lessee the Group holds a limited number of operating leases, with the non-cancellable future lease payments at 31 December 2017 of £5.1 (see Note 24). Management have performed an assessment of the impact of bringing operating leases on balance sheet based on leases held at 31 December 2017. IFRS 16 is estimated to have an immaterial impact to the Group.
Date of adoption by Group Mandatory for financial years commencing on or after 1 January 2019. At this stage, the Group does not intend to adopt the standard before its effective date. The Group intends to apply the simplified transition approach and will not restate comparative amounts for the year prior to first adoption.
There are no other IFRSs or IFRS IC interpretations that are not yet effective that would be expected to have a material impact on the Group or the Company.
Basis of consolidationThe consolidated Financial Statements comprise the Financial Statements of the Company and the Subsidiaries “the Group”, plus the Group’s share of the results and net assets of the joint ventures.
SubsidiariesSubsidiaries are entities controlled by the Group. The Group controls an entity when it is exposed to, or has rights to, variable returns from its involvement with the entity and has the ability to affect those returns through its power over the entity. In assessing control, the Group takes into consideration potential voting rights. The acquisition date is the date on which control is transferred to the acquirer. The Financial Statements of subsidiaries are included in the consolidated Financial Statements from the date that control commences until the date that control ceases. Losses applicable to the non-controlling interests in a subsidiary are allocated to the non-controlling interests even if doing so causes the non-controlling interests to have a deficit balance.
Joint VenturesA joint venture is a contract under which the Group and other parties undertake an activity or invest in an entity, under joint control. The Group uses equity accounting for such entities, carrying its investment at cost plus the movement in the Group’s share of net assets after acquisition, less impairment.
Transactions eliminated on consolidationIntra-group balances and transactions, and any unrealised income and expenses arising from intra-group transactions, are eliminated. Unrealised gains arising from transactions with equity-accounted investees are eliminated against the investment to the extent of the Group’s interest in the investee. Unrealised losses are eliminated in the same way as unrealised gains, but only to the extent that there is no evidence of impairment on the asset transferred.
The Company holds investments in subsidiaries and joint ventures at cost less accumulated impairment losses.
Business combinationsThe acquisition of subsidiaries is accounted for using the acquisition method. The cost of the acquisition is measured at the aggregate of the fair values of assets given, liabilities incurred or assumed, and equity instruments issued by the Group in exchange for control of the acquiree. Acquisition related costs are recognised in the Income Statement as incurred. The acquiree’s identifiable assets, liabilities and contingent liabilities that meet the conditions for recognition under IFRS 3 are recognised at their fair value at the acquisition date, except for non-current assets (or disposal groups) that are classified as held for sale in accordance with IFRS 5 Non-Current Assets Held for Sale and Discontinued Operations, which are recognised and measured at fair value less costs to sell.
Goodwill arising on acquisition is recognised as an asset measured at cost, being the excess of the cost of the business combination over the Group’s interest in the net fair value of the identifiable assets, liabilities and contingent liabilities recognised. If, after reassessment, the Group’s interest in the net fair value of the acquiree’s identifiable assets, liabilities and contingent liabilities exceeds the cost of the business combination, the excess is recognised immediately in the Income Statement.
The interest of non-controlling interest shareholders in the acquiree is initially measured at their proportion of the net fair value of the assets, liabilities and contingent liabilities recognised.
When the consideration transferred by the Group in a business combination includes a contingent consideration arrangement, the contingent consideration is measured at its acquisition-date fair value. Changes in fair value of the contingent consideration that qualify as measurement period adjustments are adjusted retrospectively, with corresponding adjustments against goodwill. Measurement period adjustments are adjustments that arise from additional information obtained during the ‘measurement period’ (which cannot exceed one year from the acquisition date) about facts and circumstances that existed at the acquisition date.
Contingent consideration that is classified as an asset or a liability is re-measured at subsequent reporting dates in accordance with IAS 39, as appropriate, with the corresponding gain or loss being recognised in the Income Statement.
OVERVIEW STRATEGIC REPORT GOVERNANCE FINANCIAL STATEMENTS
121

NOTES TO THE FINANCIAL STATEMENTS CONTINUED
FOR THE YEAR ENDED 31 DECEMBER 2017
1. SIGNIFICANT ACCOUNTING POLICIES CONTINUED
Foreign currency transactionsForeign currency transactions are translated to the respective functional currency of Group entities at the foreign exchange rate ruling on the transaction date. Foreign exchange gains and losses resulting from settling these, or from retranslating monetary assets and liabilities held in foreign currencies, are booked in the Income Statement. The exception is for foreign currency loans and derivatives that hedge investments in foreign subsidiaries, where exchange differences are booked in equity until the investment is realised.
Consolidation of foreign entitiesAssets and liabilities of foreign entities are translated into sterling at exchange rates ruling at the Balance Sheet date. Their income, expenses and cash flows are translated at the average rate for the period or at spot rate for significant items. Resultant exchange differences are booked in other comprehensive income and recognised in the Group Income Statement when the operation is sold.
The principal exchange rates used to translate foreign currency denominated amounts in 2017 are:
Balance Sheet: £1 = €1.13 (31 December 2016: £1 = €1.17). Income Statement: £1= €1.14 (2016: £1 = €1.22).
Investment propertiesThese properties include completed properties that are generating rent or are available for rent, and development properties that are under development or available for development. Investment properties comprise freehold and leasehold properties and are first measured at cost (including transaction costs), then revalued to market value at each reporting date by independent professional valuers. Leasehold properties are shown gross of the leasehold payables (which are accounted for as finance lease obligations). Valuation gains and losses in a period are taken to the Income Statement. As the Group uses the fair value model, as per IAS 40 Investment Properties, no depreciation is provided. An asset will be classified as held for sale within investment properties, in line with IFRS 5 Non-Current Assets Held for Sale and Discontinued Operations, where there is Board approval at the year-end date and the asset is expected to be disposed of within 12 months of the balance sheet date.
Other interests in propertyOther interests in property include the cost and related fees in respect of land options, which are initially capitalised and regularly tested for impairment. The impairment review includes consideration of the resale value of the option and likelihood of achieving planning consent.
Trading propertiesThese are properties being developed for sale or being held for sale after development is complete, and are shown at the lower of cost and net realisable value. Cost includes direct expenditure and capitalised interest.
Trading properties are transferred to investment properties when there is a change in use evidenced by the commencement of an operating lease to another party, together with the intention to hold the property to generate rent, or for capital appreciation, or for both.
Property acquisitions and disposalsProperties are treated as acquired at the point when the Group assumes the significant risks and rewards of ownership and as disposed when these are transferred to the buyer. Generally this would occur on completion of contract. Any gains or loss arising on de-recognition of the property (calculated as the difference between the net disposal proceeds and the carrying amount of the asset) is included in profit or loss in the period in which the property is derecognised.
LeasesLeases where substantially all of the risks and rewards of ownership are transferred to the lessee are classified as finance leases. All others are deemed operating leases. Under operating leases, properties leased to tenants are accounted for as investment properties. In cases where only the buildings part of a property lease qualifies as a finance lease, the land is shown as an investment property.
RevenueRevenue includes gross rental income, joint venture management fee income, income from service charges and proceeds from the sale of trading properties. Joint venture management fee income is recognised as income in the period to which it relates.
Rental incomeRental income from properties let as operating leases are recognised on a straight-line basis over the lease term. Lease incentives and initial costs to arrange leases are capitalised, then amortised on a straight-line basis over the lease term (‘rent averaging’). Surrender premiums received in the period are included in rental income.
Service charges and other recoveries from tenantsThese include income in relation to service charges, directly recoverable expenditure and management fees. Revenue from services is recognised by reference to the state of completion of the relevant services provided at the reporting date. Where the Group acts as an agent, service charge income is netted against the relevant property operating expenses.
122
SEGRO PLC | ANNUAL REPORT & ACCOUNTS 2017
FINANCIAL STATEMENTS
1. SIGNIFICANT ACCOUNTING POLICIES CONTINUED
Sale of trading propertiesProceeds from the sale of trading properties are recognised when the risks and rewards of ownership have been transferred to the purchaser. This generally occurs on completion of the contract.
Intangible assetsIntangible assets principally relate to computer software costs and are stated at cost less accumulated amortisation and accumulated impairment losses. Software costs include both acquired and internal development costs directly attributable to the design and testing of identifiable and unique software products controlled by the Group.
Amortisation is charged to the income statement on a straight-line basis over the estimated useful lives from the point at which the asset is ready for use:
Software 33% per annum
Plant and equipment
Plant and equipment is stated at historic cost less accumulated depreciation. Cost includes purchase price and any directly attributable costs.
Depreciation is recognised so as to write off the cost or valuation of assets (other than investment properties) less their residual values, using the straight-line method, on the following bases:
Plant and equipment 20% per annum
Solar panels 5% per annum
The estimated useful lives, residual values and depreciation method are reviewed at the end of each reporting period, with the effect of any changes in estimate accounted for on a prospective basis.
Financial instruments
BorrowingsBorrowings are recognised initially at fair value less attributable transaction costs. Subsequent to initial recognition, borrowings are stated at amortised cost with any difference between the amount initially recognised and the redemption value being recognised in the Income Statement over the period of the borrowings, using the effective interest rate method.
Gross borrowing costs relating to direct expenditure on properties under development or undergoing major refurbishment are capitalised. The interest capitalised is calculated using the Group’s weighted average cost of borrowing for the relevant currency. Interest is capitalised as from the commencement of the development work until the date of practical completion. The capitalisation of finance costs is suspended if there are prolonged periods when development activity is interrupted.
Derivative financial instrumentsThe Group uses derivatives (principally interest rate swaps, currency swaps, forward foreign exchange contracts and interest caps) in managing interest rate risk and currency risk, and does not use them for trading. They are recorded, and subsequently revalued, at fair value, with revaluation gains or losses being immediately taken to the Income Statement. The exception is for derivatives qualifying as hedges, when the treatment of the gain/loss depends upon the item being hedged, and may go to Other Comprehensive Income.
Derivatives with a maturity of less than 12 months or that expect to be settled within 12 months of the Balance Sheet date are presented as current assets or liabilities. Other derivatives are presented as non-current assets or liabilities.
Trade and other receivables and payablesTrade and other receivables are booked at fair value and subsequently measured at amortised cost using the effective interest method. An impairment provision is created for receivables where there is objective evidence that the Group will not be able to collect in full. Trade and other payables are initially measured at fair value, net of transaction costs and subsequently measured at amortised costs using the effective interest method.
Available-for-sale (AFS) investmentsAFS investments are initially measured at cost, and then revalued to fair value. Gains and losses arising from valuation are taken to equity, and then recycled through the Income Statement on realisation. If there is objective evidence that the asset is impaired, any cumulative loss recognised in equity is removed from equity and recognised in the Income Statement within other investment income.
OVERVIEW STRATEGIC REPORT GOVERNANCE FINANCIAL STATEMENTS
123
NOTES TO THE FINANCIAL STATEMENTS CONTINUED
FOR THE YEAR ENDED 31 DECEMBER 2017
1. SIGNIFICANT ACCOUNTING POLICIES CONTINUED
Pensions – Defined benefit schemeThe Scheme’s assets are measured at fair value, their obligations are calculated at discounted present value, and any net surplus or deficit is recognised in the Balance Sheet. Operating and financing costs are charged to the Income Statement, with service costs spread systematically over employees’ working lives, and financing costs expensed in the period in which they arise. Actuarial gains and losses are recognised in other comprehensive income within the Statement of Comprehensive Income. Where the actuarial valuation of the scheme demonstrates that the scheme is in surplus, the recognisable asset is limited to that for which the Group can benefit in the future either through a cash refund or reduction in future payments is available. Professional actuaries are used in relation to defined benefit schemes and the assumptions made are outlined in Note 18.
Share-based paymentsThe cost of granting share options and other share-based remuneration is measured at their fair value at the grant date. The costs are expensed straight-line over the vesting period in the Income Statement, based on estimates of the shares or options that will eventually vest. Charges are reversed if it appears that non-market-based performance conditions will not be met.
The fair value excludes the effect of non-market-based vesting conditions.
At each Balance Sheet date, the Group revises its estimate of the number of equity instruments expected to vest as a result of the effect of non-market-based vesting conditions. The impact of the revision of the original estimates, if any, is recognised in profit or loss such that the cumulative expense reflects the revised estimate, with a corresponding adjustment to equity within the share based payment reserve.
Share capital
Ordinary sharesOrdinary shares are classified as equity. Incremental costs directly attributable to the issue of new shares or options are shown in equity as a deduction, net of tax, from the proceeds.
When shares recognised as equity are repurchased, the amount of the consideration paid, which includes directly attributable costs, is recognised as a deduction from equity. Repurchased shares are classified as treasury shares and are presented in the treasury share reserve. When treasury shares are sold or reissued subsequently, the amount received is recognised as an increase in equity and the resulting surplus or deficit on the transaction is presented within share premium.
Shares held by Estera Trust (Jersey) Limited and Equiniti Limited to satisfy various Group share schemes are disclosed as own shares held and deducted from contributed equity.
Income taxIncome tax on the profit for the year comprises current and deferred tax. Current tax is the tax payable on the taxable income for the year and any adjustment in respect of previous years. Current tax is calculated on the basis of the tax laws enacted or substantively enacted at the end of the reporting period in the countries where the Company’s subsidiaries and associates operate and generate taxable income.
Deferred tax is provided in full using the Balance Sheet liability method on temporary differences between the carrying amounts of assets and liabilities for financial reporting purposes and the amounts used for taxation purposes. Deferred tax is determined using tax rates that have been enacted or substantively enacted by the reporting date and are expected to apply when the asset is realised or the liability is settled.
No provision is made for temporary differences (i) arising on the initial recognition of assets or liabilities, other than a business combination, that affect neither accounting nor taxable profit and (ii) relating to investments in subsidiaries to the extent that they will not reverse in the foreseeable future.
Deferred tax assets are recognised to the extent that it is probable that suitable taxable profits will be available against which deductible temporary differences can be utilised.
Critical accounting judgements and key sources of estimation uncertaintyIn the application of the Group’s accounting policies, the Directors are required to make judgements, estimates and assumptions about the carrying amount of assets and liabilities that are not readily apparent from other sources. The estimates and associated assumptions are based on historical experience and other factors that are considered to be relevant. Actual results may differ from these estimates. The estimates and underlying assumptions are reviewed on an ongoing basis. Revisions to accounting estimates are recognised in the period in which the estimate is revised if the revision affects only that period, or in the period of the revisions and future periods if the revision affects both current and future periods.
124
SEGRO PLC | ANNUAL REPORT & ACCOUNTS 2017
FINANCIAL STATEMENTS

1. SIGNIFICANT ACCOUNTING POLICIES CONTINUED
Significant areas of estimation uncertainty
Property valuationsValuation of property is a central component of the business. In estimating the fair value, the Group engage a third party qualified valuer to perform the valuation. Information about the valuation techniques and inputs used in determining the fair value of the property portfolio is disclosed in Note 27 property valuation techniques and related quantitative information.
Significant areas of judgements in applying the Group’s accounting policies
Accounting for significant property transactionsProperty transactions are complex in nature. Management considers each material transaction separately, with an assessment carried out to determine the most appropriate accounting treatment and judgements applied. The judgements include whether the transaction represents an asset acquisition or business combination and the cut off for property transactions on recognition of property assets and revenue recognition. In making its judgement over the cut-off for property transactions, management considers whether the significant risks and rewards of ownership of the assets acquired or disposed of has transferred to or from the Group (this consideration includes the revenue recognition criteria set out in IAS 18 Revenue for the sale of trading properties). In making its judgement on whether the acquisition of property through the purchase of a corporate vehicle represents an asset acquisition or business combination, management consider whether the integrated set of assets and activities acquired contain both input and processes along with the ability to create outputs.
The judgements used in accounting for the Airport Property Portfolio as an asset acquisition during 2017 are set out in Note 13(i).
REIT StatusThe Company has elected for UK REIT and French SIIC status. To continue to benefit from these tax regimes, the Group is required to comply with certain conditions as outlined in Note 10. Management intends that the Group should continue as a UK REIT and a French SIIC for the foreseeable future.
Other less significant judgements and sources of uncertainty relate to estimating the fair value of financial instruments and the actuarial assumptions used in calculating the Group’s retirement benefit obligations.
2. ADJUSTED PROFIT
Adjusted profit is a non-GAAP measure and is the Group’s measure of underlying profit, which is used by the Board and senior management to measure and monitor the Group’s income performance.
It is based on the Best Practices Recommendations Guidelines of European Public Real Estate Association (EPRA), which calculate profit excluding investment and development property revaluations and gains or losses on disposals. Changes in the fair value of financial instruments and associated close-out costs and their related taxation, as well as other permitted one-off items, are also excluded. Refer to the Supplementary Notes for all EPRA adjustments.
The Directors may also exclude from the EPRA profit measure additional items (gains and losses) which are considered by them to be non-recurring, unusual or significant by virtue of size and nature. No non-EPRA adjustments to underlying profit were made in the current or prior periods.
OVERVIEW STRATEGIC REPORT GOVERNANCE FINANCIAL STATEMENTS
125

NOTES TO THE FINANCIAL STATEMENTS CONTINUED
FOR THE YEAR ENDED 31 DECEMBER 2017
2. ADJUSTED PROFIT CONTINUED
2017
£m2016
£m
Gross rental income 272.9 225.5
Property operating expenses (52.2) (44.9)
Net rental income 220.7 180.6
Joint venture management fee income 24.3 18.6
Administration expenses (39.7) (31.4)
Share of joint ventures’ Adjusted profit after tax1 47.6 55.4
Adjusted operating profit before interest and tax 252.9 223.2
Net finance costs (including adjustments) (58.7) (68.7)
Adjusted profit before tax 194.2 154.5
Adjustments to reconcile to IFRS:
Adjustments to the share of profit from joint ventures after tax¹ 60.5 29.7
Profit on sale of investment properties 17.0 16.4
Valuation surplus on investment properties 872.4 231.3
(Loss)/gain on sale of trading properties (0.4) 0.3
Increase in provision for impairment of trading properties – (2.0)
Goodwill and other amounts written off on acquisitions and amortisation of intangibles (0.6) (0.2)
Cost of early close out of bank debt (145.3) (1.0)
Net fair value loss on interest rate swaps and other derivatives (21.5) (2.6)
Total adjustments 782.1 271.9
Profit before tax 976.3 426.4
Tax
On Adjusted profit (1.2) (1.8)
In respect of adjustments (18.8) (5.9)
Total tax adjustments (20.0) (7.7)
Profit after tax before non-controlling interests 956.3 418.7
Non-controlling interests:
Less: share of adjusted profit attributable to non-controlling interests (0.2) (0.1)
: share of adjustments attributable to non-controlling interests (3.4) (0.9)
Profit after tax and non-controlling interests 952.7 417.7
Of which:
Adjusted profit after tax and non-controlling interests 192.8 152.6
Total adjustments after tax and non-controlling interests 759.9 265.1
Profit attributable to equity shareholders 952.7 417.7
1 A detailed breakdown of the adjustments to the share of profit from joint ventures is included in Note 7.
126
SEGRO PLC | ANNUAL REPORT & ACCOUNTS 2017
FINANCIAL STATEMENTS

3. SEGMENTAL ANALYSIS
The Group’s reportable segments are the geographical Business Units: Greater London, Thames Valley and National Logistics, Northern Europe (principally Germany), Southern Europe (principally France) and Central Europe (principally Poland), which are managed and reported to the Board as separate distinct Business Units.
31 December 2017
Gross rental
income £m
Net rental
income £m
Share of joint ventures’
Adjusted profit £m
Adjusted PBIT £m
Total directly owned
property assets
£m
Investments in joint ventures
£m
Capitalexpenditure2
£m
Greater London 112.4 101.8 (1.8) 108.3 3,227.6 – 1,174.9
Thames Valley and National Logistics 99.2 91.9 (0.1) 91.7 2,280.9 7.5 141.5
Northern Europe 24.8 15.4 21.5 40.6 409.2 474.0 55.6
Southern Europe 30.6 22.0 16.2 40.4 729.9 386.8 212.9
Central Europe 5.9 3.1 17.9 24.3 110.3 356.5 15.3
Other1 – (13.5) (6.1) (52.4) – (432.8) 2.0
Total 272.9 220.7 47.6 252.9 6,757.9 792.0 1,602.2
31 December 2016
Gross rental
income £m
Net rental
income £m
Share of joint ventures’
Adjusted profit £m
Adjusted PBIT £m
Total directly owned
property assets
£m
Investments in joint ventures
£m
Capitalexpenditure2
£m
Greater London 76.7 67.5 14.5 88.5 1,777.5 363.4 28.6
Thames Valley and National Logistics 95.6 88.7 (0.1) 88.5 1,991.7 12.6 230.2
Northern Europe 25.0 17.5 16.5 36.5 378.8 396.9 88.4
Southern Europe 22.9 15.5 12.6 28.9 474.6 222.3 179.5
Central Europe 5.3 2.9 13.2 19.1 117.2 319.5 10.3
Other1 – (11.5) (1.3) (38.3) – (248.5) 0.8
Total 225.5 180.6 55.4 223.2 4,739.8 1,066.2 537.8
1 Other includes the corporate centre, SELP holding companies and costs relating to the operational business which are not specifically allocated to a geographical business unit. This includes the bonds held by SELP Finance S.à r.l, a Luxembourg entity.
2 Capital expenditure includes additions and acquisitions of investment and trading properties but does not include tenant incentives, letting fees and rental guarantees. This includes the APP asset acquisition disclosed in Note 7. The ‘Other’ category includes non-property related spend, primarily IT.
Revenues from the most significant countries within the Group were UK £229.6 million (2016: £185.8 million), France £29.8 million (2016: £30.4 million), Germany £27.0 million (2016: £26.8 million) and Poland £12.0 million (2016: £10.9 million).
OVERVIEW STRATEGIC REPORT GOVERNANCE FINANCIAL STATEMENTS
127

NOTES TO THE FINANCIAL STATEMENTS CONTINUED
FOR THE YEAR ENDED 31 DECEMBER 2017
4. REVENUE
2017
£m2016
£m
Rental income from investment properties 257.8 210.6
Rental income from trading properties 1.8 1.8
Rent averaging 11.8 11.8
Management fees 1.1 1.2
Surrender premiums 0.4 0.1
Gross rental income 272.9 225.5
Joint venture fees – management fees 16.8 17.7
– performance and other fees 7.5 0.9
Service charge income 23.8 19.4
Proceeds from sale of trading properties 13.7 20.0
Total revenue 334.7 283.5
5. PROPERTY OPERATING EXPENSES
2017
£m2016
£m
Vacant property costs 7.6 5.6
Letting, marketing, legal and professional fees 8.4 7.9
Bad debt expense 0.9 0.2
Other expenses, net of service charge income1 10.2 9.8
Property management expenses 27.1 23.5
Property administration expenses2 29.3 25.0
Costs capitalised3 (4.2) (3.6)
Total property operating expenses 52.2 44.9
1 Total Other expenses were £34.0 million (2016: £29.2 million) and are presented net of service charge income of £23.8 million (2016: £19.4 million) in the table above.
2 Administration expenses predominantly relate to the employee staff costs of personnel directly involved in managing the property portfolio.
3 Costs capitalised relate to internal employee staff costs directly involved in developing the property portfolio.
6. ADMINISTRATION EXPENSES
6(i) – Total administration expenses
2017
£m2016
£m
Directors’ remuneration 9.1 7.6
Depreciation 1.9 3.1
Other administration expenses 28.7 20.7
Total administration expenses 39.7 31.4
The full 2017 depreciation charge, including amounts charged under other headings, is £1.9 million (2016: £3.1 million), and relates to assets owned by the Group. Other administration expenses include the cost of services of the Group’s auditor, as described overleaf.
128
SEGRO PLC | ANNUAL REPORT & ACCOUNTS 2017
FINANCIAL STATEMENTS

6. ADMINISTRATION EXPENSES CONTINUED
6(ii) – Fees in relation to services provided by the Group’s auditor
2017
£m2016
£m
Audit services:
Parent company 0.5 0.3
Subsidiary undertakings 0.3 0.3
Total audit fees 0.8 0.6
Audit related assurance services 0.1 0.1
Audit and audited related assurance services 0.9 0.7
Other fees:
Other1 0.4 –
Total other fees 0.4 –
Total fees in relation to audit and other services 1.3 0.7
1 Other services principally relate to the role of reporting accountant for the Rights Issue and bond issue in 2017.
In addition to the above the Group’s auditor was paid £504,000 being £415,000 in respect of the audit of SEGRO European Logistics Partnership (SELP) for the year ended 31 December 2017 (2016: £367,000), £nil in respect of the audit of the Group’s associated pension scheme (2016: £30,000), and £89,000 of other fees in respect of SELP (2016: £30,000).
An audit fee of £48,000 was due to the Group’s auditor in respect of the audit of Airport Property Partnership (APP) joint venture for the year ended 31 December 2016. The Airport Property Partnership (APP) is now wholly-owned and the audit fee for the year ended 31 December 2017 is included in the above table.
6(iii) – Staff costsThe table below presents staff costs of the Group (including directors) which are recognised in both property operating expenses and administration expenses in the Income Statement.
2017
£m2016
£m
Wages and salaries 32.4 28.3
Social security costs 5.2 4.6
Pension costs1 1.6 1.6
Share scheme costs 10.0 6.1
Termination benefits 0.3 0.4
Total 49.5 41.0
Average number of Group employees 293 285
– Direct property 184 178
– Indirect property and administration 109 107
1 Excludes past service cost credit in 2016 of £2.3 million.
Disclosures required by the Companies Act 2006 on Directors’ remuneration, including salaries, share options, pension contributions and pension entitlement and those specified by the Listing Rules of the Financial Services Authority are included on pages 84 to 98 in the Remuneration Report and form part of these Financial Statements.
OVERVIEW STRATEGIC REPORT GOVERNANCE FINANCIAL STATEMENTS
129

NOTES TO THE FINANCIAL STATEMENTS CONTINUED
FOR THE YEAR ENDED 31 DECEMBER 2017
7. INVESTMENTS IN JOINT VENTURES AND SUBSIDIARIES
7(i) – Profit from joint ventures after taxThe table below presents a summary Income Statement of the Group’s largest joint ventures, all of which are accounted for using the equity method as set out in Note 1. Roxhill operates in the UK and develops big box logistics assets and SELP is incorporated in Luxembourg and owns logistics property assets in Continental Europe. The Group holds 50 per cent of the share capital and voting rights in the joint ventures.
On 9 March 2017 SEGRO acquired the remaining 50 per cent interest in the Airport Property Partnership (APP) joint venture property portfolio it did not already own for £365.0 million (funded with a combination of £216 million of cash and the disposal of £149 million of assets to the joint venture partner). Consequently, the APP share of profit is only included in the table below to 9 March 2017 (the date of acquisition) and no balance sheet in respect of APP is included at 31 December 2017. This asset acquisition transaction has primarily resulted in property acquisitions of £1,112.6 million (see Note 13) and associated net debt of £379.2 million (see Note 26) being recognised.
SEGRO European Logistics
Partnership £m
Airport Property
Partnership £m
Roxhill £m
At 100%2017
£m
At 100%2016
£m
At 50% 2017
£m
At 50%2016
£m
Gross rental income 138.5 8.9 – 147.4 165.5 73.7 82.7
Property operating expenses:
– underlying property operating expenses (5.9) (0.2) – (6.1) (5.7) (3.0) (2.8)
– vacant property costs (1.3) (0.6) – (1.9) (2.1) (0.9) (1.1)
– property management fees (12.5) (1.5) – (14.0) (16.8) (7.0) (8.4)
– performance and other fees – (8.5) – (8.5) (0.7) (4.3) (0.3)
Net rental income 118.8 (1.9) – 116.9 140.2 58.5 70.1
Administration expenses (1.6) – (0.1) (1.7) (1.6) (0.9) (0.8)
Net finance costs (including adjustments) (10.8) (1.6) – (12.4) (24.5) (6.2) (12.2)
EPRA profit/(loss) before tax 106.4 (3.5) (0.1) 102.8 114.1 51.4 57.1
Tax (7.5) – – (7.5) (3.3) (3.8) (1.7)
Adjusted profit/(loss) after tax 98.9 (3.5) (0.1) 95.3 110.8 47.6 55.4
Adjustments:
Profit on sale of investment properties 0.7 0.9 – 1.6 6.9 0.8 3.5
Valuation surplus on investment properties 153.6 0.1 – 153.7 78.6 76.9 39.3
Cost of early close out of bank debt (3.7) – – (3.7) (13.6) (1.9) (6.8)
Net fair value loss on interest rate swaps and other derivatives – (6.2) – (6.2) (2.8) (3.1) (1.4)
Tax in respect of adjustments (24.4) – – (24.4) (9.8) (12.2) (4.9)
Total adjustments 126.2 (5.2) – 121.0 59.3 60.5 29.7
Profit/(loss) after tax 225.1 (8.7) (0.1) 216.3 170.1 108.1 85.1
Other comprehensive income/(loss) – 6.2 – 6.2 (4.2) 3.1 (2.1)
Total comprehensive income/(loss)for the year 225.1 (2.5) (0.1) 222.5 165.9 111.2 83.0
Trading properties held by joint ventures were externally valued resulting in no increase in provision (2016: nil). Based on the fair value at 31 December 2017, the Group’s share of joint ventures’ trading property portfolio has no unrecognised surplus of (2016: £nil). Other comprehensive income at share of £3.1 million is included in the Group Statement of Comprehensive Income as transfer to the Income Statement of realised loss on derivatives (2016: £2.1 million loss in respect of fair value of derivatives in effective hedge relationships).
SELP is a SPPICAV in France, and does not pay tax on its French property income or gains on property sales, provided that at least 85 per cent of the French subsidiaries’ property income is distributed to their immediate shareholder. In addition, SELP has to meet certain conditions such as ensuring the property rental business of each French subsidiary represents more than 80 per cent of its assets. Any potential or proposed changes to the SPPICAV legislation are monitored.
130
SEGRO PLC | ANNUAL REPORT & ACCOUNTS 2017
FINANCIAL STATEMENTS

7. INVESTMENTS IN JOINT VENTURES AND SUBSIDIARIES CONTINUED
7(ii) – Summarised Balance Sheet information in respect of the Group’s joint ventures
SEGRO European Logistics
Partnership £m
Roxhill £m
Other £m
At 100% 2017
£m
At 100% 2016
£m
At 50% 2017
£m
At 50% 2016
£m
Investment properties¹ 2,556.8 3.6 – 2,560.4 3,210.0 1,280.2 1,605.0
Other interests in property – 16.1 – 16.1 13.3 8.1 6.6
Other assets – – – – 0.2 – 0.1
Total non-current assets 2,556.8 19.7 – 2,576.5 3,223.5 1,288.3 1,611.7
Trading properties – – 1.1 1.1 1.1 0.6 0.6
Other receivables 77.3 3.8 1.0 82.1 80.9 41.1 40.4
Cash and cash equivalents 39.9 – – 39.9 123.9 20.0 62.0
Total current assets 117.2 3.8 2.1 123.1 205.9 61.7 103.0
Total assets 2,674.0 23.5 2.1 2,699.6 3,429.4 1,350.0 1,714.7
Borrowings (926.9) – – (926.9) (1,109.1) (463.5) (554.6)
Deferred tax (104.2) – – (104.2) (76.0) (52.1) (38.0)
Other liabilities – (8.5) – (8.5) (5.3) (4.3) (2.6)
Total non-current liabilities (1,031.1) (8.5) – (1,039.6) (1,190.4) (519.9) (595.2)
Other liabilities (75.6) (0.5) – (76.1) (99.8) (38.1) (49.9)
Derivative financial instruments – – – – (6.9) – (3.4)
Total current liabilities (75.6) (0.5) – (76.1) (106.7) (38.1) (53.3)
Total liabilities (1,106.7) (9.0) – (1,115.7) (1,297.1) (558.0) (648.5)
Net assets 1,567.3 14.5 2.1 1,583.9 2,132.3 792.0 1,066.2
1 Investment properties held by SELP include assets held for sale of £48.0 million (at 100%) at 31 December 2017 (2016: £nil).
The external borrowings of the joint ventures are non-recourse to the Group. At 31 December 2017, the fair value of £926.9 million (2016: £1,109.1 million) of borrowings was £938.6 million (2016: £1,108.6 million). This results in a fair value adjustment decrease in net assets of £11.7 million (2016: £0.5 million increase), at share £5.9 million (2016: £0.2 million), see Note 12. On 20 November 2017 SELP issued an eight year, €500.0 million unsecured bond at an annual coupon of 1.50 per cent as discussed further in the Finance Review on page 34.
In February 2016, SEGRO entered into an agreement with Roxhill Development Group to develop a portfolio of big box logistics assets in the UK through a series of joint ventures which are at various stages of planning and development.
SEGRO provides certain services, including venture advisory and asset management to the SELP joint venture and receives fees for doing so. Performance fees may also be payable from SELP to SEGRO based on its IRR subject to certain hurdle rates. The first calculation and potential payment is on the fifth anniversary of the inception of SELP, October 2018, but 50 per cent of this is subject to clawback based on performance over the period to the tenth anniversary, October 2023. If performance has improved at this point, additional fees might be triggered.
Based on property values at 31 December 2017, the net profit impact on the Group of the first calculation, taking account of the gross fee due, the cost of the fee payable by SELP (at share) and the clawback terms, is estimated to be around £7 million but subject to change for transactions and market related performance through the remainder of the measurement period.
OVERVIEW STRATEGIC REPORT GOVERNANCE FINANCIAL STATEMENTS
131

NOTES TO THE FINANCIAL STATEMENTS CONTINUED
FOR THE YEAR ENDED 31 DECEMBER 2017
7. INVESTMENTS IN JOINT VENTURES AND SUBSIDIARIES CONTINUED
7(iii) – Investments by the Group
2017
£m2016
£m
Cost or valuation at 1 January 1,066.2 867.3
Exchange movement 24.9 87.8
Acquisitions – 13.2
Additions 51.7 47.1
Disposals and net divestments¹ (435.4) (5.7)
Dividends received (26.6) (26.5)
Share of profit after tax 108.1 85.1
Items taken to other comprehensive income 3.1 (2.1)
Cost or valuation at 31 December 792.0 1,066.2
1 Net divestments represents the net movement of loans held with joint ventures.
Dividends received were £26.6 million (2016: £26.5 million), of which £19.6 million (2016: £9.6 million) was from SELP and £7.0 million (2016: £16.9 million) was from APP.
7(iv) – Investments by the companyInvestments Loans Total
2017
£m2016
£m2017
£m2016
£m2017
£m2016
£m
Cost or valuation of subsidiaries at 1 January 2,403.1 2,230.4 2,988.1 1,811.4 5,391.2 4,041.8
Exchange movement – – 30.0 108.2 30.0 108.2
Additions 124.7 46.6 – – 124.7 46.6
Disposals – (48.2) – – – (48.2)
Loan movement – – 1,155.2 1,071.3 1,155.2 1,071.2
(Increase)/decrease in provision for investments in and loans to subsidiaries (178.2) 174.3 150.0 (2.8) (28.2) 171.5
Cost or valuation of subsidiaries at 31 December 2,349.6 2,403.1 4,323.3 2,988.1 6,672.9 5,391.1
Subsidiary entities are detailed in Note 28. The net asset value of subsidiaries is considered to be the approximation of its value in use. This results in the recognition of a reversal or charge for impairment at the end of the reporting period. Since subsidiary companies primarily hold property, assumptions and inputs used in determining their fair value are shown in Note 27.
8. REALISED AND UNREALISED PROPERTY GAIN
2017
£m2016
£m
Profit on sale of investment properties 17.0 16.4
Valuation surplus on investment properties 872.4 231.3
(Loss)/gain on sale of trading properties (0.4) 0.3
Increase in provision for impairment of trading properties – (2.0)
Total realised and unrealised property gain 889.0 246.0
9. NET FINANCE COSTS
Finance income2017
£m2016
£m
Interest received on bank deposits and related derivatives 34.7 32.0
Fair value gain on interest rate swaps and other derivatives 4.5 13.8
Net interest income on defined benefit asset 1.3 0.9
Exchange differences 0.1 –
Total finance income 40.6 46.7
132
SEGRO PLC | ANNUAL REPORT & ACCOUNTS 2017
FINANCIAL STATEMENTS

9. NET FINANCE COSTS CONTINUED
Finance costs2017
£m2016
£m
Interest on overdrafts, loans and related derivatives (98.8) (103.4)
Cost of early close out of debt (145.3) (1.0)
Amortisation of issue costs (2.6) (2.9)
Total borrowing costs (246.7) (107.3)
Less amounts capitalised on the development of properties 6.6 5.0
Net borrowing costs (240.1) (102.3)
Fair value loss on interest rate swaps and other derivatives (26.0) (16.4)
Exchange differences – (0.3)
Total finance costs (266.1) (119.0)
Net finance costs (225.5) (72.3)
Net finance costs (including adjustments) in Adjusted profit (Note 2) are £58.7 million (2016: £68.7 million). This excludes net fair value gains and losses on interest rate swaps and other derivatives of £21.5 million loss (2016: £2.6 million loss) and the cost of early close out of debt of £145.3 million (2016: £1.0 million).
The early close out of debt arose as part of the debt refinancing exercise which took place during the year and is discussed in more detail in the Finance Review on page 34. This primarily arises in respect of premium paid, and to a lesser extent reduced fees and the acceleration of unamortised costs, in September 2017 to close out of £550 million sterling bonds, which totalled £133.1 million. The balance relates to similar costs incurred in repaying the £200 million 2018 bond in May 2017 and the cost to early repay a term loan in July 2017.
The interest capitalisation rates for 2017 ranged from 3.0 per cent to 4.0 per cent (2016: 4.0 per cent to 5.3 per cent). Interest is capitalised gross of tax relief. Further analysis of exchange differences is given in Note 17 within the foreign exchange and currency swap contracts section.
10. TAX
10(i) – Tax on profit
2017
£m2016
£m
Tax:
On Adjusted profit (1.2) (1.8)
In respect of adjustments (18.8) (5.9)
Total tax charge (20.0) (7.7)
Current tax
United Kingdom
Current tax charge – (1.7)
Total current UK tax charge – (1.7)
Overseas
Current tax charge (1.9) (3.9)
Adjustments in respect of earlier years – 0.1
(1.9) (3.8)
Total current tax charge (1.9) (5.5)
Deferred tax
Origination and reversal of temporary differences (1.3) (1.1)
Released in respect of property disposals in the year 1.0 4.8
On valuation movements (18.1) (5.1)
Total deferred tax in respect of investment properties (18.4) (1.4)
Other deferred tax 0.3 (0.8)
Total deferred tax charge (18.1) (2.2)
Total tax charge on profit on ordinary activities (20.0) (7.7)
OVERVIEW STRATEGIC REPORT GOVERNANCE FINANCIAL STATEMENTS
133

NOTES TO THE FINANCIAL STATEMENTS CONTINUED
FOR THE YEAR ENDED 31 DECEMBER 2017
10. TAX CONTINUED
10(ii) – Factors affecting tax charge for the yearThe tax charge is lower than the standard rate of UK corporation tax. The differences are:
2017
£m2016
£m
Profit on ordinary activities before tax 976.3 426.4
Exclude valuation surplus in respect of UK properties not taxable (742.3) (244.4)
234.0 182.0
Multiplied by standard rate of UK corporation tax of 19.25 per cent (2016: 20.0 per cent) (45.0) (36.4)
Effects of:
REIT & SIIC exemption on income and gains 18.7 22.5
Non-deductible items (1.5) (0.1)
Joint venture tax adjustment 21.6 11.6
Higher tax rates on international earnings (17.3) (5.9)
Adjustment in respect of prior years (0.3) 0.4
Adjustment in respect of assets not recognised 3.8 0.2
Total tax charge on profit on ordinary activities (20.0) (7.7)
10(iii) – REIT and SIIC regimes and other tax judgementsSEGRO is a Real Estate Investment Trust (REIT) and does not pay tax on its UK property income or gains on property sales, provided that at least 90 per cent of the Group’s UK property income is distributed as a dividend to shareholders, which becomes taxable in their hands. In addition, the Group has to meet certain conditions such as ensuring its worldwide property rental business represents more than 75 per cent of total profits and assets. Any potential or proposed changes to the REIT legislation are monitored and discussed with HMRC. It is management’s intention that the Group will continue as a REIT for the foreseeable future.
SEGRO is also a SIIC in France, and does not pay tax on its French property income or gains on property sales, provided that at least 95 per cent of the French subsidiaries’ property income is distributed to their immediate shareholder. In addition, the Group has to meet certain conditions such as ensuring the property rental business of each French subsidiary represents more than 80 per cent of its assets. Any potential or proposed changes to the SIIC legislation are monitored. It is management’s intention that the Group will continue as a SIIC for the foreseeable future.
The joint venture tax adjustment is required because the profit on ordinary activities before tax includes share of profit from joint ventures after tax, whereas the total tax balance excludes joint ventures.
The Group believes that its accruals for tax liabilities are adequate for all open tax years based on its assessment of many factors, including interpretations of tax laws and prior experience.
10(iv) – Deferred tax liabilitiesMovement in deferred tax was as follows:
Group – 2017
Balance 1 January
£m
Exchange movement
£m
Acquisitions/ disposals
£m
Recognised in income
£m
Balance 31 December
£m
Valuation surpluses and deficits on properties 8.2 0.7 (0.7) 17.4 25.6
Accelerated tax allowances 6.1 0.3 (0.3) 1.3 7.4
Deferred tax asset on revenue losses (0.3) – – (0.9) (1.2)
Others 2.3 0.2 – 0.3 2.8
Total deferred tax liabilities 16.3 1.2 (1.0) 18.1 34.6
Group – 2016
Balance 1 January
£m
Exchange movement
£m
Acquisitions/ disposals
£m
Recognised in income
£m
Balance 31 December
£m
Valuation surpluses and deficits on properties 3.8 0.7 (0.3) 4.0 8.2
Accelerated tax allowances 8.0 0.7 – (2.6) 6.1
Deferred tax asset on revenue losses (0.3) – – – (0.3)
Others 1.1 0.4 – 0.8 2.3
Total deferred tax liabilities 12.6 1.8 (0.3) 2.2 16.3
134
SEGRO PLC | ANNUAL REPORT & ACCOUNTS 2017
FINANCIAL STATEMENTS

10. TAX CONTINUED
The Group has recognised revenue tax losses of £1.2 million (2016: £0.3 million) available for offset against future profits. Further unrecognised tax losses of £813.0 million also exist at 31 December 2017 (2016: £799.9 million) of which £48.6 million (2016: £46.2 million) expires in nine years. The majority of the unrecognised tax loss balance relates to historic capital losses that arose on property disposals and on losses generated from debt close-out costs.
For the purposes of measuring deferred tax liabilities or deferred tax assets arising from investment properties that are measured using the fair value model, the Directors have reviewed the Group’s investment property portfolios and concluded that the Group’s investment properties are not held under a business model whose objective is to consume substantially all of the economic benefits embodied in the investment properties over time, rather than through sale. Therefore, in determining the Group’s deferred taxation on investment properties, the Directors have determined that the presumption that the carrying amounts of investment properties measured using the fair value model are recovered entirely through sale is not rebutted. As a result, the Group has recognised deferred taxes on changes in fair value of investment properties for all jurisdictions, with the exception of the UK and France, where the Group is not subject to any corporate income taxes on the fair value changes of the investment properties on disposal.
10(v) – Factors that may affect future tax chargesNo deferred tax is recognised on the unremitted earnings of international subsidiaries and joint ventures. In the event of their remittance to the UK, no net UK tax is expected to be payable.
The standard rate of UK corporation tax is due to fall in stages to 17 per cent by 2020. This is unlikely to significantly impact the Group’s tax charge.
11. DIVIDENDS
2017
£m2016
£m
Ordinary dividends paid
Interim dividend for 2017 @ 5.25 pence per share 52.7 –
Final dividend for 2016 @ 10.7 pence per share1 93.0 –
Interim dividend for 2016 @ 5.0 pence per share1 – 39.2
Final dividend for 2015 @ 10.1 pence per share1 – 79.3
Total dividends 145.7 118.5
1 As adjusted by a bonus adjustment factor, see Note 12.
The Board recommends a final dividend for 2017 of 11.35 pence which is estimated to result in a distribution of up to £113.8 million. The total dividend paid and proposed per share in respect of the year ended 31 December 2017 is 16.6 pence (2016: 15.7 pence). For details on scrip dividends see Note 19.
12. EARNINGS AND NET ASSETS PER SHARE
The earnings per share calculations use the weighted average number of shares in issue during the year and the net assets per share calculations use the number of shares in issue at year end. Earnings per share calculations exclude 1.2 million shares (2016: 1.5 million) being the average number of shares held on trust for employee share schemes and net assets per share calculations exclude 0.9 million shares (2016: 1.4 million) being the actual number of shares held on trust for employee share schemes at year end.
OVERVIEW STRATEGIC REPORT GOVERNANCE FINANCIAL STATEMENTS
135
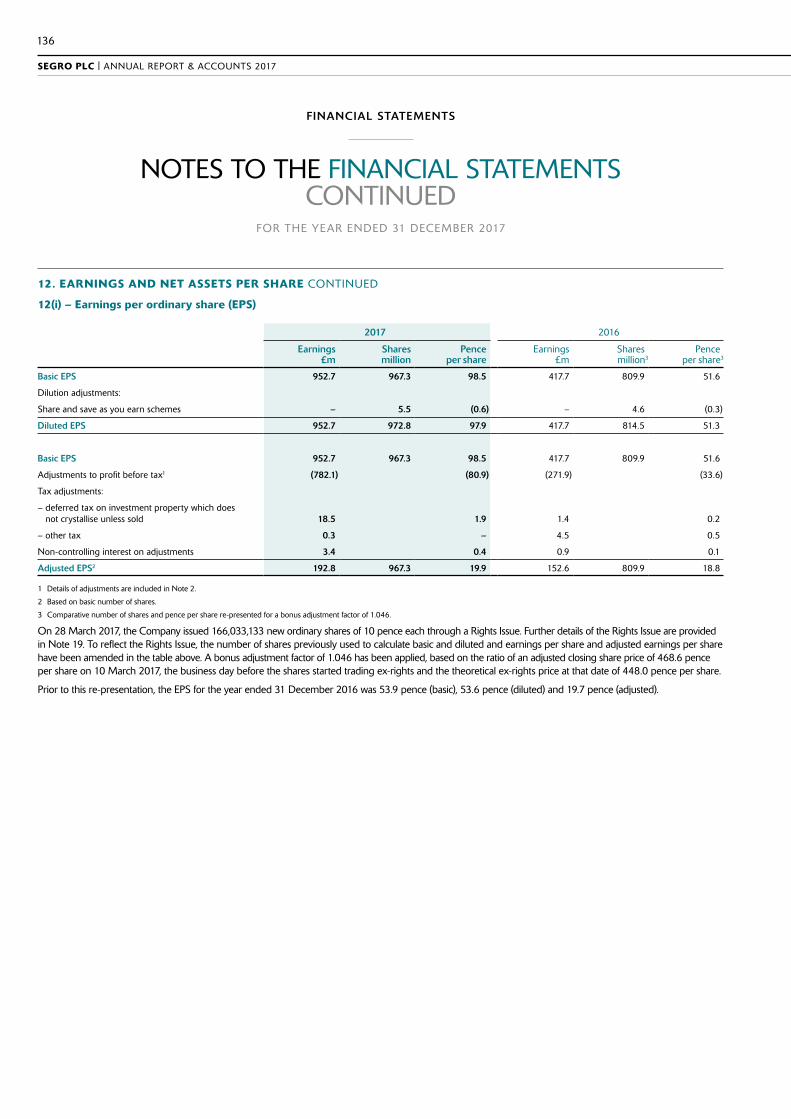
NOTES TO THE FINANCIAL STATEMENTS CONTINUED
FOR THE YEAR ENDED 31 DECEMBER 2017
12. EARNINGS AND NET ASSETS PER SHARE CONTINUED
12(i) – Earnings per ordinary share (EPS)
2017 2016
Earnings £m
Shares million
Pence per share
Earnings £m
Shares million3
Penceper share3
Basic EPS 952.7 967.3 98.5 417.7 809.9 51.6
Dilution adjustments:
Share and save as you earn schemes – 5.5 (0.6) – 4.6 (0.3)
Diluted EPS 952.7 972.8 97.9 417.7 814.5 51.3
Basic EPS 952.7 967.3 98.5 417.7 809.9 51.6
Adjustments to profit before tax1 (782.1) (80.9) (271.9) (33.6)
Tax adjustments:
– deferred tax on investment property which does not crystallise unless sold 18.5 1.9 1.4 0.2
– other tax 0.3 – 4.5 0.5
Non-controlling interest on adjustments 3.4 0.4 0.9 0.1
Adjusted EPS2 192.8 967.3 19.9 152.6 809.9 18.8
1 Details of adjustments are included in Note 2.
2 Based on basic number of shares.
3 Comparative number of shares and pence per share re-presented for a bonus adjustment factor of 1.046.
On 28 March 2017, the Company issued 166,033,133 new ordinary shares of 10 pence each through a Rights Issue. Further details of the Rights Issue are provided in Note 19. To reflect the Rights Issue, the number of shares previously used to calculate basic and diluted and earnings per share and adjusted earnings per share have been amended in the table above. A bonus adjustment factor of 1.046 has been applied, based on the ratio of an adjusted closing share price of 468.6 pence per share on 10 March 2017, the business day before the shares started trading ex-rights and the theoretical ex-rights price at that date of 448.0 pence per share.
Prior to this re-presentation, the EPS for the year ended 31 December 2016 was 53.9 pence (basic), 53.6 pence (diluted) and 19.7 pence (adjusted).
136
SEGRO PLC | ANNUAL REPORT & ACCOUNTS 2017
FINANCIAL STATEMENTS
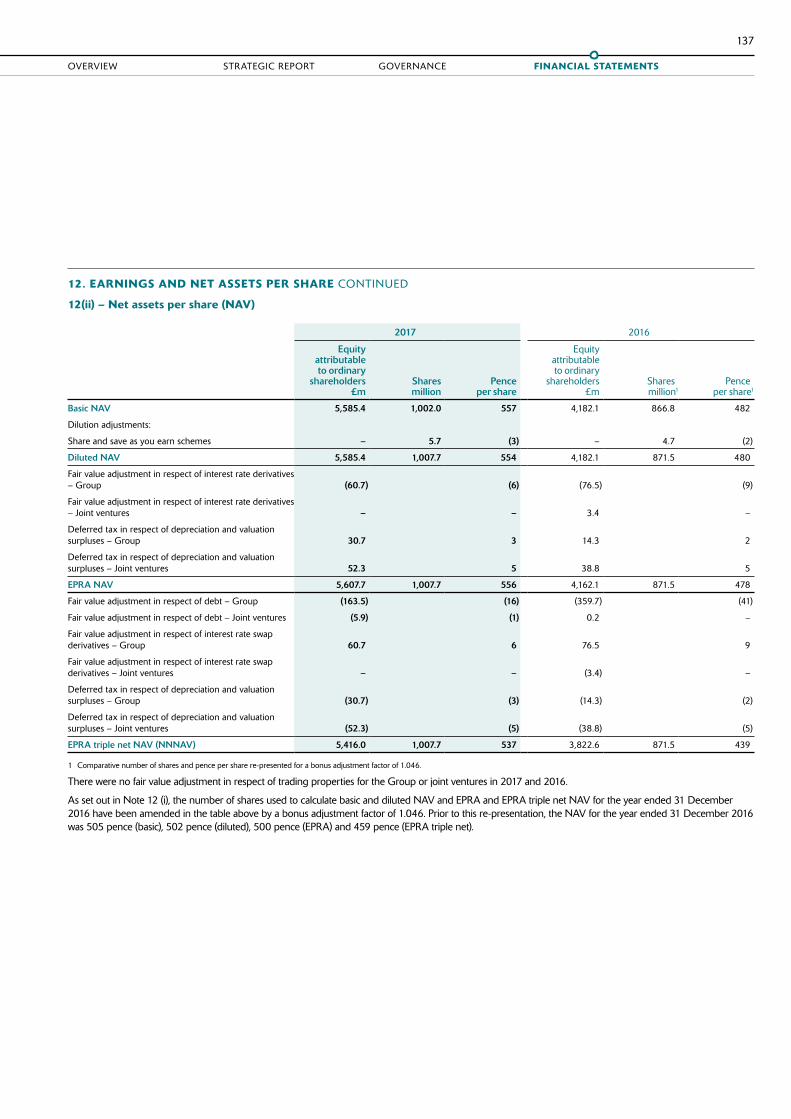
12. EARNINGS AND NET ASSETS PER SHARE CONTINUED
12(ii) – Net assets per share (NAV)
2017 2016
Equity attributable to ordinary
shareholders £m
Shares million
Pence per share
Equity attributable to ordinary
shareholders £m
Sharesmillion1
Penceper share1
Basic NAV 5,585.4 1,002.0 557 4,182.1 866.8 482
Dilution adjustments:
Share and save as you earn schemes – 5.7 (3) – 4.7 (2)
Diluted NAV 5,585.4 1,007.7 554 4,182.1 871.5 480
Fair value adjustment in respect of interest rate derivatives – Group (60.7) (6) (76.5) (9)
Fair value adjustment in respect of interest rate derivatives – Joint ventures – – 3.4 –
Deferred tax in respect of depreciation and valuation surpluses – Group 30.7 3 14.3 2
Deferred tax in respect of depreciation and valuation surpluses – Joint ventures 52.3 5 38.8 5
EPRA NAV 5,607.7 1,007.7 556 4,162.1 871.5 478
Fair value adjustment in respect of debt – Group (163.5) (16) (359.7) (41)
Fair value adjustment in respect of debt – Joint ventures (5.9) (1) 0.2 –
Fair value adjustment in respect of interest rate swap derivatives – Group 60.7 6 76.5 9
Fair value adjustment in respect of interest rate swap derivatives – Joint ventures – – (3.4) –
Deferred tax in respect of depreciation and valuation surpluses – Group (30.7) (3) (14.3) (2)
Deferred tax in respect of depreciation and valuation surpluses – Joint ventures (52.3) (5) (38.8) (5)
EPRA triple net NAV (NNNAV) 5,416.0 1,007.7 537 3,822.6 871.5 439
1 Comparative number of shares and pence per share re-presented for a bonus adjustment factor of 1.046.
There were no fair value adjustment in respect of trading properties for the Group or joint ventures in 2017 and 2016.
As set out in Note 12 (i), the number of shares used to calculate basic and diluted NAV and EPRA and EPRA triple net NAV for the year ended 31 December 2016 have been amended in the table above by a bonus adjustment factor of 1.046. Prior to this re-presentation, the NAV for the year ended 31 December 2016 was 505 pence (basic), 502 pence (diluted), 500 pence (EPRA) and 459 pence (EPRA triple net).
OVERVIEW STRATEGIC REPORT GOVERNANCE FINANCIAL STATEMENTS
137

NOTES TO THE FINANCIAL STATEMENTS CONTINUED
FOR THE YEAR ENDED 31 DECEMBER 2017
13. PROPERTIES
13(i) – Investment propertiesCompleted
£mDevelopment
£mTotal £m
At 1 January 2016 3,863.9 482.6 4,346.5
Exchange movement 90.5 30.9 121.4
Property acquisitions 82.0 172.2 254.2
Additions to existing investment properties 17.2 261.6 278.8
Disposals (526.8) (62.5) (589.3)
Transfers on completion of development 349.8 (349.8) –
Revaluation surplus during the year 168.6 62.7 231.3
At 31 December 2016 4,045.2 597.7 4,642.9
Add tenant lease incentives, letting fees and rental guarantees 71.5 – 71.5
Total investment properties 4,116.7 597.7 4,714.4
Completed £m
Development £m
Total £m
At 1 January 2017 4,045.2 597.7 4,642.9
Exchange movement 25.3 10.1 35.4
Property acquisitions 1,130.0 82.2 1,212.2
Additions to existing investment properties 19.7 367.8 387.5
Disposals (393.5) (86.3) (479.8)
Transfers on completion of development 306.2 (306.2) –
Revaluation surplus during the year 759.2 113.2 872.4
At 31 December 2017 5,892.1 778.5 6,670.6
Add tenant lease incentives, letting fees and rental guarantees 74.8 – 74.8
Total investment properties 5,966.9 778.5 6,745.4
Investment properties are stated at fair value as at 31 December 2017 based on external valuations performed by professionally qualified valuers. The Group’s wholly-owned and joint venture property portfolio is valued by CBRE Ltd on a half yearly basis. The valuations conform to International Valuation Standards and were arrived at by reference to market evidence of the transaction prices paid for similar properties. In estimating the fair value of the properties, the valuers consider the highest and best use of the properties. There has been no change to the valuation technique during the year.
Fees payable to CBRE Ltd for the valuation of the Group’s wholly-owned properties are based on a fixed percentage of the property portfolio’s valuation. CBRE Ltd also undertakes some professional and agency work on behalf of the Group, although this is limited in relation to the activities of the Group as a whole. The firm advises us that the total fees paid by the Group represent less than 5 per cent of its total revenue in any year.
Completed properties include buildings that are occupied or are available for occupation. Development properties include land available for development (land bank), land under development and construction in progress.
Property acquisitions include £1,112.6 million in respect of the APP property portfolio acquisition, discussed further in Note 7. The purchase of the APP property portfolio and associated net assets has been accounted for as an asset acquisition, on the basis that the acquisition only resulted in the transfer of ownership of property and related net assets, no employees were being acquired or inherited as part of the transaction and the acquired assets cannot operate independently from the rest of the SEGRO Group.
No trading properties were transferred to investment properties during 2017 (2016: £nil).
Long-term leasehold values within investment properties amount to £60.8 million (2016: £34.1 million). All other properties are freehold.
Further details on property valuation techniques and related quantitative information is set out in Note 27.
138
SEGRO PLC | ANNUAL REPORT & ACCOUNTS 2017
FINANCIAL STATEMENTS

13. PROPERTIES CONTINUED
13(ii) – Trading propertiesCompleted
£mDevelopment
£mTotal £m
At 1 January 2016 14.2 23.1 37.3
Exchange movement 2.2 3.1 5.3
Additions 0.2 3.8 4.0
Disposals (0.5) (19.1) (19.6)
Increase in provision for impairment during the year (1.0) (1.0) (2.0)
At 31 December 2016 15.1 9.9 25.0
Add tenant lease incentives, letting fees and rental guarantees 0.4 – 0.4
Total trading properties 15.5 9.9 25.4
Completed £m
Development £m
Total £m
At 1 January 2017 15.1 9.9 25.0
Exchange movement 0.3 0.4 0.7
Additions – 0.5 0.5
Disposals (11.7) (2.0) (13.7)
Increase in provision for impairment during the year – – –
At 31 December 2017 3.7 8.8 12.5
Add tenant lease incentives, lettings fees and rental guarantees – – –
Total trading properties 3.7 8.8 12.5
Trading properties were externally valued, as detailed in Note 13(i), resulting in an increase in the provision for impairment of £nil million (2016: £2.0 million). Based on the fair value at 31 December 2017, the portfolio has no unrecognised surplus (2016: £nil). Further information on valuation techniques and related quantitative information is given in Note 27.
14. TRADE AND OTHER RECEIVABLES
Group Company
2017 £m
2016 £m
2017 £m
2016 £m
Current
Trade receivables 26.7 22.8 – –
Other receivables 92.1 55.4 5.5 3.7
Prepayments and accrued income 8.8 11.1 0.8 0.8
Amounts due from related parties 14.2 13.5 – –
Total current trade and other receivables 141.8 102.8 6.3 4.5
Group other receivables also include tax recoverable of £0.3 million (2016: £0.2 million). Group trade receivables are net of provisions for doubtful debts of £3.7 million (2016: £4.7 million).
OVERVIEW STRATEGIC REPORT GOVERNANCE FINANCIAL STATEMENTS
139
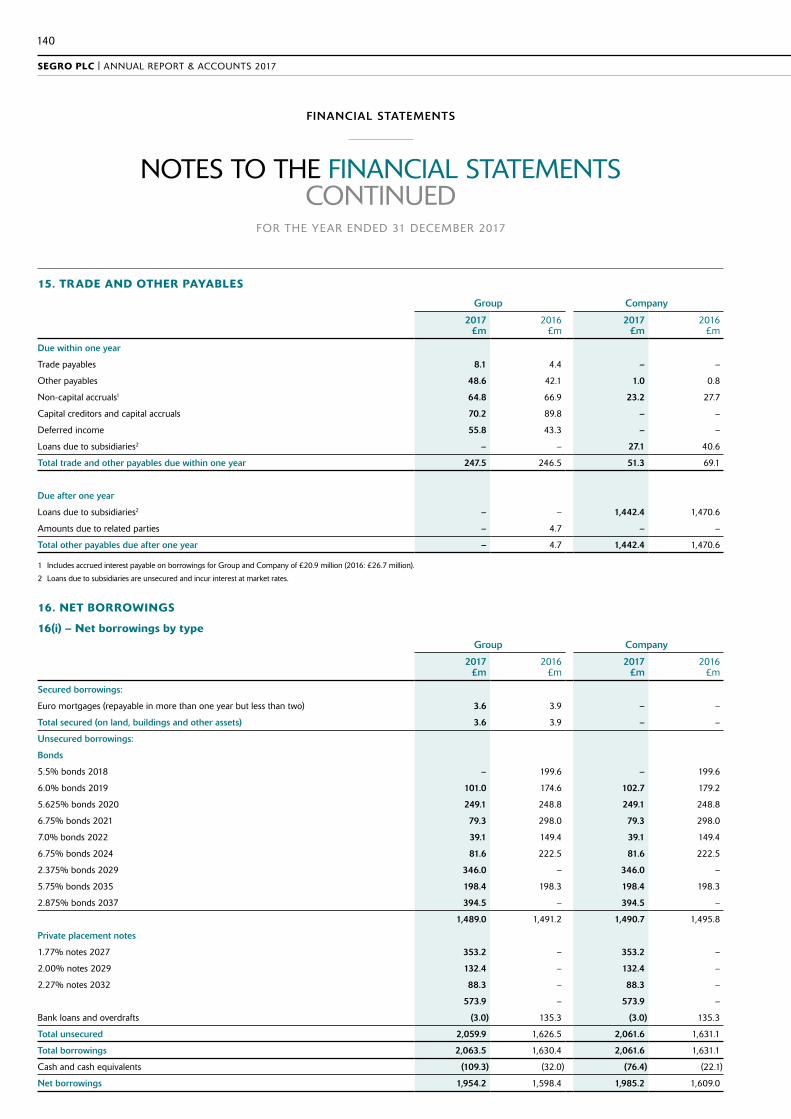
NOTES TO THE FINANCIAL STATEMENTS CONTINUED
FOR THE YEAR ENDED 31 DECEMBER 2017
15. TRADE AND OTHER PAYABLES
Group Company
2017 £m
2016 £m
2017 £m
2016 £m
Due within one year
Trade payables 8.1 4.4 – –
Other payables 48.6 42.1 1.0 0.8
Non-capital accruals1 64.8 66.9 23.2 27.7
Capital creditors and capital accruals 70.2 89.8 – –
Deferred income 55.8 43.3 – –
Loans due to subsidiaries2 – – 27.1 40.6
Total trade and other payables due within one year 247.5 246.5 51.3 69.1
Due after one year
Loans due to subsidiaries2 – – 1,442.4 1,470.6
Amounts due to related parties – 4.7 – –
Total other payables due after one year – 4.7 1,442.4 1,470.6
1 Includes accrued interest payable on borrowings for Group and Company of £20.9 million (2016: £26.7 million).
2 Loans due to subsidiaries are unsecured and incur interest at market rates.
16. NET BORROWINGS
16(i) – Net borrowings by type Group Company
2017 £m
2016 £m
2017 £m
2016 £m
Secured borrowings:
Euro mortgages (repayable in more than one year but less than two) 3.6 3.9 – –
Total secured (on land, buildings and other assets) 3.6 3.9 – –
Unsecured borrowings:
Bonds
5.5% bonds 2018 – 199.6 – 199.6
6.0% bonds 2019 101.0 174.6 102.7 179.2
5.625% bonds 2020 249.1 248.8 249.1 248.8
6.75% bonds 2021 79.3 298.0 79.3 298.0
7.0% bonds 2022 39.1 149.4 39.1 149.4
6.75% bonds 2024 81.6 222.5 81.6 222.5
2.375% bonds 2029 346.0 – 346.0 –
5.75% bonds 2035 198.4 198.3 198.4 198.3
2.875% bonds 2037 394.5 – 394.5 –
1,489.0 1,491.2 1,490.7 1,495.8
Private placement notes
1.77% notes 2027 353.2 – 353.2 –
2.00% notes 2029 132.4 – 132.4 –
2.27% notes 2032 88.3 – 88.3 –
573.9 – 573.9 –
Bank loans and overdrafts (3.0) 135.3 (3.0) 135.3
Total unsecured 2,059.9 1,626.5 2,061.6 1,631.1
Total borrowings 2,063.5 1,630.4 2,061.6 1,631.1
Cash and cash equivalents (109.3) (32.0) (76.4) (22.1)
Net borrowings 1,954.2 1,598.4 1,985.2 1,609.0
140
SEGRO PLC | ANNUAL REPORT & ACCOUNTS 2017
FINANCIAL STATEMENTS

16. NET BORROWINGS CONTINUED
The maturity profile of borrowings is as follows:
Group Company
Maturity profile of borrowings2017
£m2016
£m2017
£m2016
£m
In one year or less – – – –
In more than one year but less than two 104.6 199.6 102.7 199.6
In more than two years but less than five 364.5 860.6 364.5 861.3
In more than five years but less than ten 434.8 371.9 434.8 371.9
In more than ten years 1,159.6 198.3 1,159.6 198.3
In more than one year 2,063.5 1,630.4 2,061.6 1,631.1
Total borrowings 2,063.5 1,630.4 2,061.6 1,631.1
Cash and cash equivalents (109.3) (32.0) (76.4) (22.1)
Net borrowings 1,954.2 1,598.4 1,985.2 1,609.0
Cash and cash equivalents comprise cash balances, call deposits held with banks and highly liquid short-term investments that are readily convertible to known amounts of cash within three months from acquisition and subject to an insignificant risk of changes in value.
There are no early settlement or call options on any of the borrowings. Financial covenants relating to the borrowings include maximum limits to the Group’s gearing ratio and minimum limits to permitted interest cover. Financial covenants are discussed in more detail in the ‘Gearing and financial covenants’ section in the Financial Review on page 35.
Bank loans and overdrafts include capitalised finance costs on committed facilities which were undrawn at the year end.
During the year the Group undertook a debt refinancing exercise including issuing €650 million of US Private Placement notes and £750 million of long dated sterling bonds and repurchasing £550 million of shorter dated sterling bonds all stated at face value. The debt refinancing is discussed in more detail in the Finance Review on page 34.
Group Company
Maturity profile of undrawn borrowing facilities2017
£m2016
£m2017
£m2016
£m
In one year or less 5.0 5.0 – –
In more than one year but less than two – – – –
In more than two years but less than five 1,077.9 529.9 1,077.9 526.0
Total available undrawn borrowing facilities 1,082.9 534.9 1,077.9 526.0
During the year the Group increased its revolving credit facility commitments by €438 million to €1,218 million.
OVERVIEW STRATEGIC REPORT GOVERNANCE FINANCIAL STATEMENTS
141
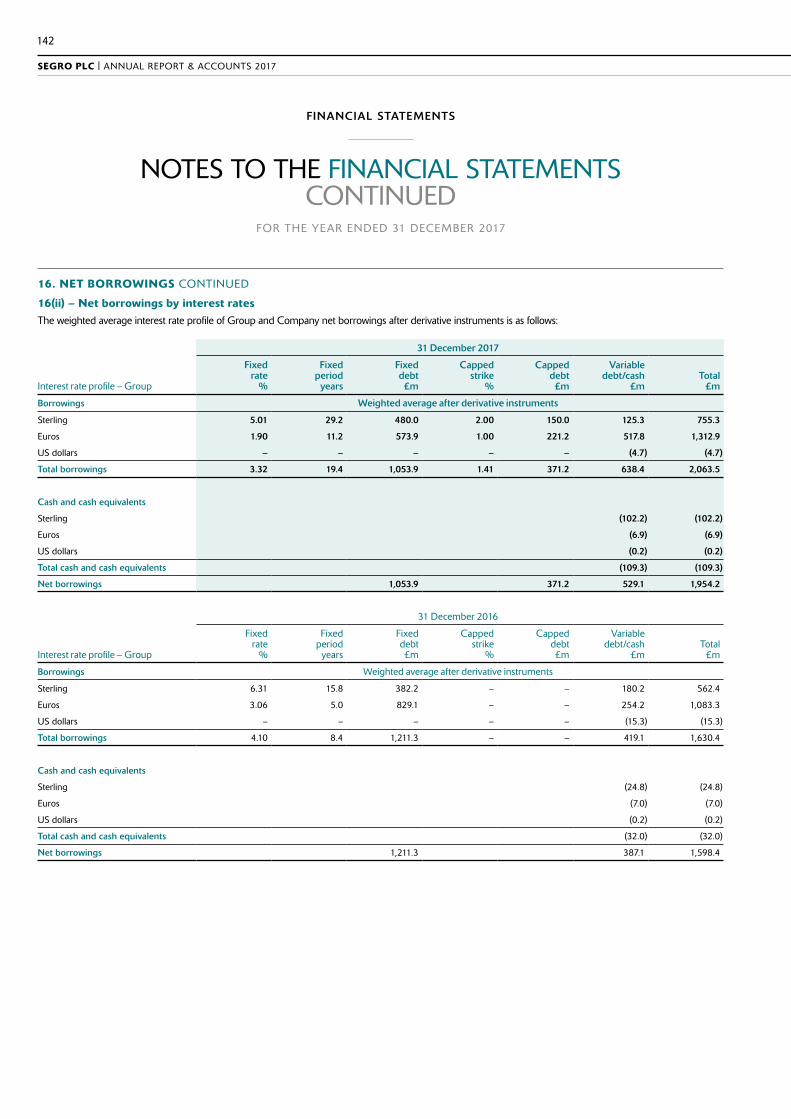
NOTES TO THE FINANCIAL STATEMENTS CONTINUED
FOR THE YEAR ENDED 31 DECEMBER 2017
16. NET BORROWINGS CONTINUED
16(ii) – Net borrowings by interest ratesThe weighted average interest rate profile of Group and Company net borrowings after derivative instruments is as follows:
31 December 2017
Interest rate profile – Group
Fixed rate
%
Fixed period years
Fixed debt £m
Capped strike
%
Capped debt £m
Variable debt/cash
£mTotal
£m
Borrowings Weighted average after derivative instruments
Sterling 5.01 29.2 480.0 2.00 150.0 125.3 755.3
Euros 1.90 11.2 573.9 1.00 221.2 517.8 1,312.9
US dollars – – – – – (4.7) (4.7)
Total borrowings 3.32 19.4 1,053.9 1.41 371.2 638.4 2,063.5
Cash and cash equivalents
Sterling (102.2) (102.2)
Euros (6.9) (6.9)
US dollars (0.2) (0.2)
Total cash and cash equivalents (109.3) (109.3)
Net borrowings 1,053.9 371.2 529.1 1,954.2
31 December 2016
Interest rate profile – Group
Fixed rate
%
Fixed period years
Fixed debt £m
Capped strike
%
Capped debt £m
Variable debt/cash
£mTotal £m
Borrowings Weighted average after derivative instruments
Sterling 6.31 15.8 382.2 – – 180.2 562.4
Euros 3.06 5.0 829.1 – – 254.2 1,083.3
US dollars – – – – – (15.3) (15.3)
Total borrowings 4.10 8.4 1,211.3 – – 419.1 1,630.4
Cash and cash equivalents
Sterling (24.8) (24.8)
Euros (7.0) (7.0)
US dollars (0.2) (0.2)
Total cash and cash equivalents (32.0) (32.0)
Net borrowings 1,211.3 387.1 1,598.4
142
SEGRO PLC | ANNUAL REPORT & ACCOUNTS 2017
FINANCIAL STATEMENTS
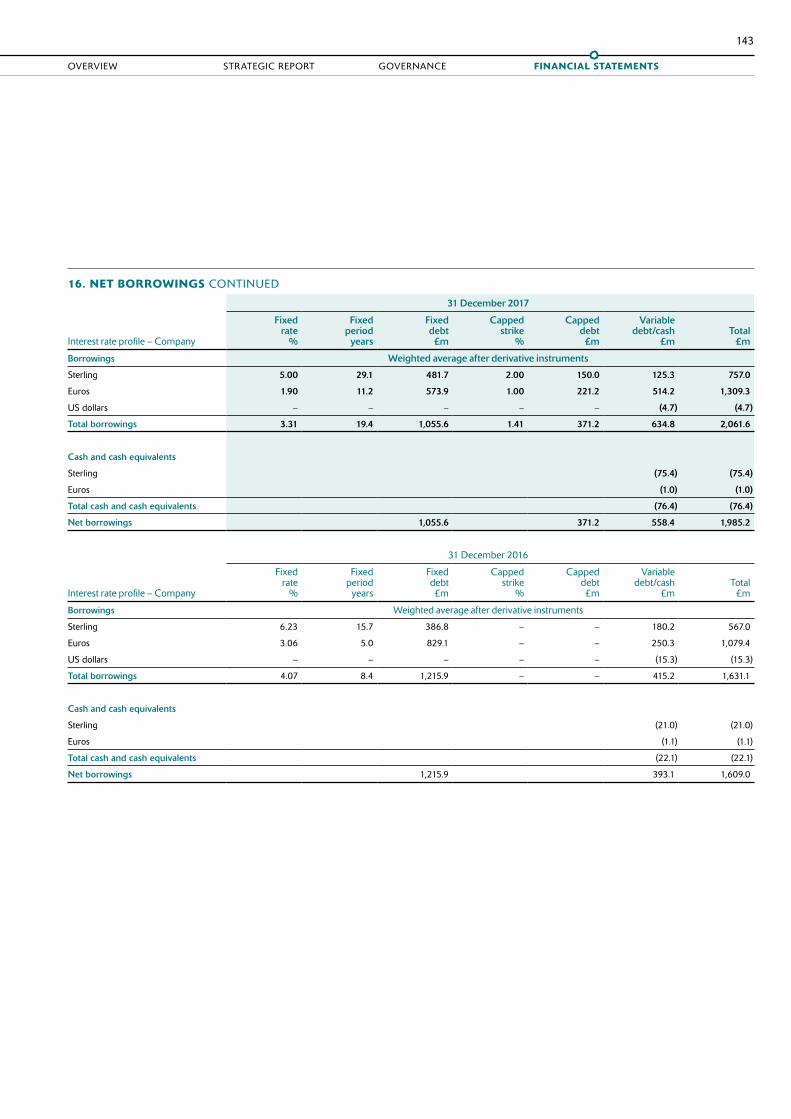
16. NET BORROWINGS CONTINUED
31 December 2017
Interest rate profile – Company
Fixed rate
%
Fixed period years
Fixed debt £m
Capped strike
%
Capped debt £m
Variable debt/cash
£mTotal
£m
Borrowings Weighted average after derivative instruments
Sterling 5.00 29.1 481.7 2.00 150.0 125.3 757.0
Euros 1.90 11.2 573.9 1.00 221.2 514.2 1,309.3
US dollars – – – – – (4.7) (4.7)
Total borrowings 3.31 19.4 1,055.6 1.41 371.2 634.8 2,061.6
Cash and cash equivalents
Sterling (75.4) (75.4)
Euros (1.0) (1.0)
Total cash and cash equivalents (76.4) (76.4)
Net borrowings 1,055.6 371.2 558.4 1,985.2
31 December 2016
Interest rate profile – Company
Fixed rate
%
Fixed period years
Fixed debt £m
Capped strike
%
Capped debt £m
Variable debt/cash
£mTotal £m
Borrowings Weighted average after derivative instruments
Sterling 6.23 15.7 386.8 – – 180.2 567.0
Euros 3.06 5.0 829.1 – – 250.3 1,079.4
US dollars – – – – – (15.3) (15.3)
Total borrowings 4.07 8.4 1,215.9 – – 415.2 1,631.1
Cash and cash equivalents
Sterling (21.0) (21.0)
Euros (1.1) (1.1)
Total cash and cash equivalents (22.1) (22.1)
Net borrowings 1,215.9 393.1 1,609.0
OVERVIEW STRATEGIC REPORT GOVERNANCE FINANCIAL STATEMENTS
143

NOTES TO THE FINANCIAL STATEMENTS CONTINUED
FOR THE YEAR ENDED 31 DECEMBER 2017
17. FINANCIAL INSTRUMENTS AND FAIR VALUES
Derivative assetsGroup Company
2017 £m
2016£m
2017 £m
2016 £m
Current
Fair value of interest rate swaps – non-hedge – 11.1 – 11.1
Fair value of forward foreign exchange contracts – non-hedge 0.9 – 0.9 –
Fair value of forward foreign exchange and currency swap contracts – hedge 1.7 1.5 1.7 1.5
Total current derivative financial instruments 2.6 12.6 2.6 12.6
Non-current
Fair value of interest rate swaps – non-hedge 58.2 80.1 58.2 80.1
Fair value of interest rate caps – non-hedge 2.5 – 2.5 –
Total non-current derivative financial instruments 60.7 80.1 60.7 80.1
Derivative liabilitiesGroup Company
2017 £m
2016 £m
2017 £m
2016 £m
Current
Fair value of forward foreign exchange and currency swap contracts – non-hedge 3.4 10.2 3.4 11.1
Fair value of forward foreign exchange and currency swap contracts – hedge 0.6 0.9 0.6 –
Total current derivative financial instruments 4.0 11.1 4.0 11.1
Non-current
Fair value of interest rate swaps – non-hedge – 14.7 – 14.7
Total non-current derivative financial instruments – 14.7 – 14.7
Categories of financial instrumentsFinancial assets in the Group comprise interest rate swaps, interest rate caps, forward foreign exchange contracts which are categorised as derivatives designated as fair value through the Income Statement (non-hedge) and forward foreign exchange contracts and cross-currency swap contracts designated as net investment hedges. Financial assets also include trade and other receivables (excluding prepaid expenses), available-for-sale investments, loans to joint ventures and cash and cash equivalents, which are all classified as other financial assets.
Financial liabilities in the Group comprise forward foreign exchange contracts and cross-currency swap contracts which are categorised as fair value through the Income Statement (non-hedge) and forward foreign exchange contracts, cross-currency swap contracts designated and unsecured US Private Placement notes as net investment hedges. Financial liabilities also include secured and unsecured bank loans, unsecured bond issues and unsecured US Private Placement not designated as net investment hedges notes which are categorised as debt and initially recognised at fair value less costs and subsequently at amortised cost; and trade and other payables (excluding deferred revenue) which are classified as other financial liabilities.
The carrying values of these financial assets and liabilities approximate their fair value, with the exception of unsecured bond issues and unsecured US Private Placement notes. At 31 December 2017, the fair value of £1,489.0 million of unsecured bonds issued was £1,680.4 million (2016: £1,491.2 million compared with £1,850.9 million fair value). At 31 December 2017, the fair value of £573.9 million of unsecured US Private Placement notes was £546.0 million (2016: nil).
The fair values of financial assets and financial liabilities are determined as follows:
– Forward foreign exchange contracts are measured using quoted forward exchange rates and yield curves derived from quoted interest rates with matching maturities of the contracts.
– Interest rate swaps, currency swap contracts and interest rate caps are measured at the present value of future cash flows estimated and discounted based on the applicable yield curves derived from quoted interest rates and the appropriate exchange rate at the Balance Sheet date.
– The fair value of non-derivative financial assets and financial liabilities traded on active liquid markets is determined with reference to the quoted market prices. Unlisted investments, such as those classified as available-for-sale investments, are typically valued by the Fund Manager based on the amount at which the asset would be exchanged between knowledgeable, willing parties in an arm’s length transaction. The methodology used to estimate fair value will depend on the nature and facts and circumstances of the investment but will use one of the following bases: transaction value, earnings multiple, net assets, price of recent investment and sale price, where appropriate a marketability discount will be applied.
– Financial guarantees are issued by the Company to support bank borrowings of 100 per cent owned subsidiary companies domiciled overseas.
144
SEGRO PLC | ANNUAL REPORT & ACCOUNTS 2017
FINANCIAL STATEMENTS

17. FINANCIAL INSTRUMENTS AND FAIR VALUES CONTINUED
Fair value measurements recognised in the Balance SheetThe Group and Company financial instruments that are measured subsequent to initial recognition at fair value are available-for-sale investments, forward exchange and currency swap contracts, interest rate swaps and interest rate caps as detailed above. All of these financial instruments would be classified as level 2 fair value measurements, as defined by IFRS 13, being those derived from inputs other than quoted prices (included within level 1) that are observable for the asset or liability, either directly (i.e. as prices) or indirectly (i.e. derived from prices). There were no transfers between categories in the current or prior year.
Capital risk managementThe Group manages its capital to ensure that entities in the Group will be able to continue as a going concern and as such it aims to maintain a prudent mix between debt and equity financing in keeping with our long-term mid-cycle LTV target of 40 per cent. The current capital structure of the Group consists of a mix of equity and debt. Equity comprises issued capital, reserves and retained earnings as disclosed in the statement of changes in equity and Notes 19 to 21. Debt primarily comprises long-term debt issues and drawings against medium-term committed revolving credit facilities from banks as disclosed in Note 16.
The Group is not subject to externally imposed capital requirements.
Foreign currency risk managementThe Group’s transactional foreign exchange exposures mainly arise as a result of treasury financing and hedging activities. These activities are carried out in SEGRO plc on behalf of the Group and the resulting exposures to euro or US dollar are not routinely hedged. The Group does not have any regular transactional foreign currency exposures resulting from cross border flows. The business does however have operations in Continental Europe which transact business denominated mostly in euros, hence there is currency exposure caused by translating the local trading performance and local net assets into sterling for each financial period and at each Balance Sheet date.
The Group’s approach to managing Balance Sheet translation exposure is described in the Foreign Currency Translation Risk section in the Financial Review on page 35.
The Group’s and Company’s Balance Sheet translation exposure (including the impact of derivative financial instruments) is summarised below:
2017 2016
Euros
£mUS Dollars
£mTotal
£mEuros
£mUS Dollars
£mTotal £m
Group
Gross currency assets 2,242.6 35.7 2,278.3 1,739.6 39.7 1,779.3
Gross currency liabilities (1,547.2) (21.2) (1,568.4) (1,198.2) (23.3) (1,221.5)
Net exposure 695.4 14.5 709.9 541.4 16.4 557.8
Company
Gross currency assets 1,182.5 25.9 1,208.4 928.2 38.6 966.8
Gross currency liabilities (1,683.4) (47.1) (1,730.5) (1,184.1) (61.9) (1,246.0)
Net exposure (500.9) (21.2) (522.1) (255.9) (23.3) (279.2)
2017 Group gross currency liabilities include €567.2 million (£502.0 million) and USD 28.6 million (£21.2 million) designated as net investment hedges.
2016 Group gross currency liabilities include €299.4 million (£255.9 million) and USD28.6 million (£23.3 million) designated as net investment hedges.
The remaining gross currency liabilities of the Group shown in the table above that are not designated as net investment hedges are either held directly in a euro or US dollar functional currency entity or passed down to such an entity from a sterling functional currency company through inter-company funding arrangements.
Foreign currency sensitivity analysisThe Group’s main currency exposure is the euro. The sensitivity of the net assets of the Group to a 10 per cent change in the value of sterling against the relevant currencies is £64.5 million (2016: £50.7 million), with a sensitivity of £63.2 million against the euro (2016: £49.2 million) and £1.3 million against the US dollar (2016: £1.5 million).
The 10 per cent sensitivity rate is used when reporting foreign currency risk internally to management and represents management’s assessment of the reasonably possible change in foreign exchange rates. The sensitivity analysis adjusts the translation of net assets (after taking account of external loans, currency swap contracts and forward foreign exchange contracts) at the period end for a 10 per cent change in the value of sterling against the relevant currencies.
For the Company, the sensitivity of the net assets is £47.4 million (2016: £25.4 million) with a sensitivity of £45.5 million against the euro (2016: £23.2 million) and £1.9 million against the US dollar (2016: £2.1 million).
OVERVIEW STRATEGIC REPORT GOVERNANCE FINANCIAL STATEMENTS
145

NOTES TO THE FINANCIAL STATEMENTS CONTINUED
FOR THE YEAR ENDED 31 DECEMBER 2017
17. FINANCIAL INSTRUMENTS AND FAIR VALUES CONTINUED
Forward foreign exchange and currency swap contractsSome of the forward foreign exchange and currency swap contracts held by the Group are designated as net investment hedges of euro and US dollar denominated subsidiaries, where exchange differences are booked in reserves and recognised in the Income Statement when the operation is sold. The remaining foreign exchange and currency swap contracts are effectively economic cash flow hedges, for example using surplus cash in one currency to provide (typically through intercompany debt funding arrangements with overseas subsidiaries) funds to repay debt, or to fund development expenditure or acquisitions in another currency. These instruments have not been designated as hedges. As a consequence exchange movements in respect of these instruments are taken through the Income Statement. Offsetting these movements are £30 million exchange gains (2016: £100.6 million gain) arising on intercompany debt funding arrangements discussed above resulting in a gain on exchange differences of £0.1 million (2016: £0.3 million loss) within net finance costs in Note 9.
The Group’s translation exposure risk management policy is that between 30 and 100 per cent of assets denominated in a foreign currency should be hedged by liabilities in the same currency. During the year the foreign currency denominated liabilities of the Group were predominantly the currency leg of foreign exchange and currency swap contracts (both those designated as net investment hedges and those which are effectively cash flow hedges) and the application of this policy is the main economic purpose of these instruments. Further details are provided within the Foreign Currency Translation Risk section of the Financial Review on page 35.
The following table details the forward foreign exchange and currency swap contracts outstanding as at the year end:
Average exchange rates
Currency contract (local currency)
Contract value
Fair value
2017 20162017
m2016
m2017
£m2016
£m2017
£m2016
£m
Group
Economic cash flow hedges
Sell euros (buy sterling) 1.13 1.19 525.1 822.6 463.6 703.1 (1.3) (9.3)
Buy euros (sell sterling) 1.13 1.17 120.4 18.3 106.8 15.7 (0.1) 0.1
Buy US dollars (sell sterling) 1.30 1.25 35.0 47.5 26.9 38.6 (1.1) 0.6
Net investment hedges
Sell euros (buy sterling) 1.13 1.17 426.3 299.4 377.8 255.9 0.9 (0.8)
Sell US dollars (buy sterling) 1.35 1.24 28.6 28.6 21.3 23.3 0.2 (0.2)
Total (1.4) (9.6)
Company
Economic cash flow hedges
Sell euros (buy sterling) 1.13 1.18 951.4 1,122.0 841.4 959.0 (0.4) (10.1)
Buy euros (sell sterling) 1.13 1.17 120.4 18.3 106.8 15.7 (0.1) 0.1
Buy US dollars (sell sterling) 1.30 1.25 35.0 47.5 26.9 38.6 (1.1) 0.6
Sell US dollars (buy sterling) 1.35 1.24 28.6 28.6 21.3 23.3 0.2 (0.2)
Total (1.4) (9.6)
Interest rate risk managementThe Group is exposed to interest rate risk as entities in the Group borrow funds at both fixed and floating interest rates. The risk is managed by maintaining an appropriate mix between fixed and floating rate borrowings. The current Group policy states that 50 to 100 per cent of net borrowings should be at fixed rate provided by long-term debt issues attracting a fixed coupon or from floating rate bank borrowings converted into fixed rate or hedged via interest rate swaps, forwards, caps, collars or floors or options on these products. Hedging activities require the approval of the Finance Committee and are evaluated and reported on regularly to ensure that the policy is being adhered to. The Board reviews the policy on interest rate exposure annually with a view to establishing that it is still relevant in the prevailing and forecast economic environment.
Interest rate sensitivity analysisThe sensitivity analysis below has been determined based on the exposure to interest rates for both derivative and non-derivative instruments at the Balance Sheet date. For floating rate liabilities, the analysis is prepared assuming that the amount of liability outstanding at the Balance Sheet date was outstanding for the whole year. A 1 per cent increase or decrease is used when reporting interest rate risk internally to key management personnel and represents management’s assessment of the reasonably possible change in interest rates.
If interest rates had been 1 per cent higher/lower and all other variables were held constant, the Group’s profit for the year ended 31 December 2017 would decrease/increase by £5.8 million (2016: decrease/increase by £2.7 million). This is attributable to the Group’s exposure to interest rates on its variable rate borrowings and cash deposits. Fixed rate debt issues are held at amortised cost and are not re-valued in the Balance Sheet to reflect interest rate movements.
146
SEGRO PLC | ANNUAL REPORT & ACCOUNTS 2017
FINANCIAL STATEMENTS

17. FINANCIAL INSTRUMENTS AND FAIR VALUES CONTINUED
Interest rate swap contractsUnder interest rate swap contracts, the Group agrees to exchange the difference between fixed and floating rate interest amounts calculated on agreed notional principal amounts. Such contracts enable the Group to manage the interest rate risk of the Group’s borrowings. The fair value of interest rate swaps at the reporting date is determined by discounting the future cash flows using the yield curves at the reporting date and the credit risk inherent in the contract, and is disclosed below. The average interest rate is based on the outstanding balances at the end of the financial year.
The following tables detail the notional principal amounts and remaining terms of interest rate swap contracts, based on their contractual maturities, outstanding as at the reporting date:
Average contract – fixed interest rate
Notional principal amount
Fair value
2017
%2016
%2017
£m2016
£m2017
£m2016
£m
Pay fixed, receive floating contracts:
Group
In one year or less – – – – – –
In more than one year but less than two – – – – – –
In more than two years but less than five – 0.24 – 606.9 – (10.0)
In more than five years – 0.34 – 222.2 – (4.7)
Total – 829.1 – (14.7)
Company
In one year or less – – – – – –
In more than one year but less than two – – – – – –
In more than two years but less than five – 0.24 – 606.9 – (10.0)
In more than five years – 0.34 – 222.2 – (4.7)
Total – 829.1 – (14.7)
Receive fixed, pay floating contracts:
Group
In one year or less – 5.63 – 250.0 – 11.1
In more than one year but less than two 6.41 3.42 181.0 350.0 16.6 14.9
In more than two years but less than five 3.52 6.44 828.0 509.0 41.6 65.2
In more than five years – – – – – –
Total 1,009.0 1,109.0 58.2 91.2
Company
In one year or less – 5.63 – 250.0 – 11.1
In more than one year but less than two 6.41 3.42 181.0 350.0 16.6 14.9
In more than two years but less than five 3.52 6.44 828.0 509.0 41.6 65.2
In more than five years – – – – – –
Total 1,009.0 1,109.0 58.2 91.2
The above are effective economic hedges although the Group has not elected to adopt hedge accounting for them, hence their change in fair value is taken direct to the Income Statement.
The interest rate swaps settle on either a three-month or six-month basis with the floating rate side based on the EURIBOR or sterling LIBOR rate for the relevant period. The Group will settle or receive the difference between the fixed and floating interest rate on a net basis.
OVERVIEW STRATEGIC REPORT GOVERNANCE FINANCIAL STATEMENTS
147

NOTES TO THE FINANCIAL STATEMENTS CONTINUED
FOR THE YEAR ENDED 31 DECEMBER 2017
17. FINANCIAL INSTRUMENTS AND FAIR VALUES CONTINUED
Interest rate cap contracts Under interest rate caps, the Group agrees to receive floating rate interest amounts calculated on agreed notional principal amounts, should prevailing market rates rise above a specified strike rate.
Such contracts enable the Group to manage the interest rate risk of the Group’s floating rate borrowings. The fair value of interest rate caps at the reporting date is determined by discounting the future cash flows using the yield curves at the reporting date and the credit risk inherent in the contract, and is disclosed below. The average interest rate is based on the outstanding balances at the end of the financial year.
The following tables detail the notional principal amounts and remaining terms of interest rate cap contracts, based on their contractual maturities, outstanding as at the reporting date:
Average contract – capped interest rate
Notional principal amount
Fair value
2017 %
2016 %
2017 £m
2016 £m
2017 £m
2016 £m
Group
In one year or less – – – – – –
In more than one year but less than two – – – – – –
In more than two years but less than five 1.40 – 371.2 – 2.5 –
In more than five years – – – – – –
Total 371.2 – 2.5 –
Company
In one year or less – – – – – –
In more than one year but less than two – – – – – –
In more than two years but less than five 1.40 – 371.2 – 2.5 –
In more than five years – – – – – –
Total 371.2 – 2.5 –
The above are effective economic hedges although the Group has not elected to adopt hedge accounting for them, hence their change in fair value is taken direct to the Income Statement.
The interest rate caps settle on either a three-month or six-month basis based on the EURIBOR or sterling LIBOR rate for the relevant period. The Group will receive the difference between the floating rate and the specified strike rate.
148
SEGRO PLC | ANNUAL REPORT & ACCOUNTS 2017
FINANCIAL STATEMENTS

17. FINANCIAL INSTRUMENTS AND FAIR VALUES CONTINUED
Credit risk management Credit risk refers to the risk that a counterparty will default on its contractual obligations resulting in financial loss to the Group. Potential customers are evaluated for creditworthiness and where necessary collateral is secured. There is no concentration of credit risk within the lease portfolio to either business sector or individual company as the Group has a diverse customer base with no one customer accounting for more than 5 per cent of rental income. Trade receivables were less than 1 per cent of total assets at 31 December 2017 and at 31 December 2016. The Directors are of the opinion that the credit risk associated with unpaid rent is low. In excess of 95 per cent of rent due is generally collected within 21 days of the due date.
Ageing of past due trade but not impaired receivables were as follows:
2017
£m2016
£m
0–30 days 2.1 1.5
30–60 days 1.0 0.9
60–90 days 0.1 1.1
90–180 days 1.0 0.4
180 days 0.7 0.6
Past due 4.9 4.5
Not due 21.8 18.3
Total trade receivables 26.7 22.8
No other receivables were considered impaired or overdue.
Investment in financial instruments is restricted to banks and short-term liquidity funds with a good credit rating. Derivative financial instruments are transacted via International Swaps and Derivatives Association (ISDA) agreements with counterparties with a good investment grade credit rating. The Group’s exposure and the credit ratings of its counterparties are continuously monitored and the aggregate value of transactions concluded is spread among approved counterparties.
Liquidity risk management Ultimate responsibility for liquidity risk management rests with the Board, which has built an appropriate liquidity risk management framework for the management of the Group’s short, medium and long-term funding and liquidity management requirements. The Group manages liquidity risk by requiring that adequate cash and committed bank facilities are available to cover and match all debt maturities, development spend, trade related and corporate cash flows over a rolling 18-month period. This is achieved by continuously monitoring forecast and actual cash flows and matching the maturity profiles of financial assets and liabilities. Liquidity risk management is discussed in more detail in the Financial Position and Funding section in the Financial Review on pages 33 to 34.
Liquidity and interest risk tables The following tables detail the Group’s and Company’s remaining contractual maturity profile for its financial instruments. The tables have been drawn up based on the undiscounted cash flows of financial liabilities based on the earliest date on which the Group and the Company can be required to pay. The tables include both interest and principal cash flows.
OVERVIEW STRATEGIC REPORT GOVERNANCE FINANCIAL STATEMENTS
149

NOTES TO THE FINANCIAL STATEMENTS CONTINUED
FOR THE YEAR ENDED 31 DECEMBER 2017
17. FINANCIAL INSTRUMENTS AND FAIR VALUES CONTINUED
2017 2016
Weighted average
interest rate %
Under 1 year
£m
1–2 years
£m
2–5 years
£m
Over 5 years
£mTotal
£m
Weighted average
interest rate %
Under 1 year
£m
1–2 Years
£m
2–5 Years
£m
Over 5 years
£mTotal £m
Group
Non-derivative financial liabilities:
Trade and other payables 170.8 – – – 170.8 176.4 – 4.7 – 181.1
Variable rate debt instruments – – – – – – 1.0 1.5 1.5 144.6 – 147.6
Fixed rate debt instruments 3.6 76.2 180.2 541.1 2,049.5 2,847.0 6.2 93.1 293.1 938.4 779.2 2,103.8
Derivative financial instruments:
Net settled interest rate swaps – – – – – 4.9 4.7 7.4 – 17.0
Gross settled foreign exchange – Forward contracts
– Inflowing (589.2) – – – (589.2) (694.1) – – – (694.1)
– Outflowing 592.0 – – – 592.0 703.6 – – – 703.6
Total 249.8 180.2 541.1 2,049.5 3,020.6 285.4 299.3 1,095.1 779.2 2,459.0
2017 2016
Weighted average
interest rate %
Under 1 year
£m
1–2 years
£m
2–5 years
£m
Over 5 years
£mTotal
£m
Weighted average
interest rate %
Under 1 year
£m
1–2 years
£m
2–5 years
£m
Over 5 years
£mTotal £m
Company
Non-derivative financial liabilities:
Trade and other payables 30.4 1,442.4 – – 1,472.8 42.4 1,470.6 – – 1,513.0
Variable rate debt instruments – – – – – – 1.0 1.4 1.4 140.5 – 143.3
Fixed rate debt instruments 3.7 76.1 176.5 541.1 2,049.5 2,843.2 6.2 93.1 293.1 938.4 779.2 2,103.8
Derivative financial instruments:
Net settled interest rate swaps – – – – – 4.9 4.7 7.4 – 17.0
Gross settled foreign exchange – Forward contracts
– Inflowing (589.2) – – – (589.2) (694.1) – – – (694.1)
– Outflowing 592.0 – – – 592.0 703.6 – – – 703.6
Total 109.3 1,618.9 541.1 2,049.5 4,318.8 151.3 1,769.8 1,086.3 779.2 3,786.6
150
SEGRO PLC | ANNUAL REPORT & ACCOUNTS 2017
FINANCIAL STATEMENTS

18. RETIREMENT BENEFIT SCHEMES
Background The Group has one defined benefit pension scheme, the SEGRO Pension Scheme (“the Scheme”), following the buy-out of the Bilton Group Pension Scheme which was finalised during 2017 with members’ benefits now secured with an insurance company. The terms and conditions of the Bilton Scheme buy-out were agreed on 30 April 2015, subject to true-up, following a data cleanse exercise followed by the issuance of individual policies completed in 2017. The impact of derecognising the Bilton Group Pension Scheme was net asset neutral and no gain or loss was recognised in 2017.
Defined benefit pension provision is through the SEGRO trust-based scheme. This arrangement is now closed to new entrants and to future accrual of benefits (effective from the end of 2016 giving rise to a past service credit of £2.3 million recognised in 2016). In this arrangement, the assets of the Scheme are invested separately from those of the Group and the Scheme is run by an independent Trustee Board. The Trustee Board of the pension scheme is required by law to act in the best interests of the fund and its members and also takes into consideration the interests of the employers. There is a requirement for the Trustee Board to have member representation, with the other Trustees being company appointed.
The Trustee Board is responsible for the investment policy in respect of the assets of the relevant fund, although the Company must be consulted on this and typically has some input into the investment decisions.
Cash contributions payable to the Scheme are reviewed at least every three years as part of an actuarial valuation. Following each actuarial valuation the Company agrees a deficit recovery plan with the Trustee Board if necessary. SEGRO and the Trustee Board are required to agree prudent assumptions for the actuarial valuation, which differs to the corporate bond yield based discount rate and best estimate assumptions required to measure the scheme’s obligations under IAS 19 for the purpose of our Company accounts. This is the main reason why the IAS 19 position disclosed in these accounts shows a surplus, whereas the Scheme’s most recent actuarial valuation at 31 March 2016 revealed a deficit of £17.7 million. To meet this deficit SEGRO agreed to pay annual contributions of £7.24 million, payable in monthly instalments over the period up to February 2018 which, together with a prudent allowance for investment returns, is expected to remove the deficit. As a result, the Company paid contributions of £7.9 million in 2017 (2016: £7.7 million, which included contributions towards the build-up of member benefits before the scheme closed to future benefit accrual at 31 December 2016). In addition, SEGRO meets the costs of running the Scheme including all statutory levies. In 2017 total costs of £0.5 million were recognised within administration expenses (2016: £0.9 million). The Scheme’s funding position and cash contributions will be reviewed as part of the next actuarial valuation due to take place as at 31 March 2019.
For some pension schemes, IFRIC 14 potentially:
– limits the surplus in a pension scheme that can be recognised on the balance sheet; and/or – requires additional pension liabilities to be recognised where scheduled future deficit contributions are greater than the unadjusted accounting deficit.
SEGRO considers that were a pension asset to be realised in respect of this scheme after all member benefits have been paid and after the scheme is wound up, this would be fully recoverable by SEGRO in line with the rules of the scheme. In the meantime, in the ordinary course of business the Trustee Board has no rights to unilaterally wind up the Scheme or otherwise augment the benefits payable to members. Therefore, any pension surplus is recognised in full under current accounting standards.
In 2015, the International Accounting Standards Board (IASB) published an Exposure Draft setting out proposed changes to IFRIC 14. Management understands that there have been subsequent discussions and further developments are expected in 2018. SEGRO will reconsider the impact of IFRIC 14 once there is greater certainty around the proposed changes to IFRIC 14.
The IAS 19 valuation of the Scheme has been based on the most recent actuarial valuation at 31 March 2016 and updated by the independent actuary to 31 December 2017.
Approximately 80 per cent of the Scheme’s assets are held in a Liability Driven Investment (LDI) matching portfolio of gilts, leveraged gilt funds, swaps and corporate bonds, which provide a broad hedge for the Scheme’s liabilities to changes to both future interest rate and inflation expectations. It is the intention to further reduce investment risk by moving the remaining 20 per cent of assets invested in equities and other return seeking assets into lower risk investments over the period to 2030, accelerating this to take advantage of any opportunities to lock in funding level improvements in the meantime. The Scheme’s insured pensions are valued by an actuary and the asset value is equal to the corresponding benefit obligation for the vast majority of these policies. All other fair asset values, including those for the Scheme’s LDI investments, are provided by the relevant fund managers. As the Scheme mostly invests in pooled funds, the fair asset values reflect the fund managers’ valuations, rather than quoted prices in active markets. However, the fund values are all based on the prices of the underlying investments within each fund. The Schemes assets do not include any financial instruments or property owned by the Group.
There is a risk to the Company that other adverse experience (e.g. if members live longer than assumed) could lead to a requirement for SEGRO to make additional contributions to recover any deficit that arises. Other than market and demographic risks, which are common to most retirement benefit schemes, there are no specific risks in the Scheme which the Group considers to be significant or unusual.
OVERVIEW STRATEGIC REPORT GOVERNANCE FINANCIAL STATEMENTS
151

NOTES TO THE FINANCIAL STATEMENTS CONTINUED
FOR THE YEAR ENDED 31 DECEMBER 2017
18. RETIREMENT BENEFIT SCHEMES CONTINUED
The major assumptions used were as follows:2017
%2016
%
Discount rate for scheme liabilities 2.4 2.7
Rate of inflation (RPI/CPI) 3.4/2.3 3.4/2.3
Rate of increase to pensions in payment in excess of GMP:
Before April 2003 (SEGRO/Bilton) 4.3 4.2/3.2
From April 2003 to October 2005 3.2 3.2
After October 2005 2.1 2.2
Rate of general long-term increase in salaries n/a¹ 3.4
1 The SEGRO scheme has closed to future benefit accrual at the end of 2016, and there are no active members in 2017.
Composition of schemes’ assets
Analysis of assets
2017 £m
Analysis of assets
2016 £m
EQUITIES
UK 1.2 3.4
US 11.1 30.1
Europe 3.0 7.7
Japan 1.8 4.5
Other 2.2 5.5
LIABILITY DRIVEN INVESTMENT PORTFOLIO
Gilts, leveraged gilt funds and swaps 140.2 136.6
Corporate bonds 99.8 69.4
OTHER ASSETS
Diversified Growth Funds 23.2 22.6
Cash 1.5 2.2
Insured Pensions 21.8 27.2
Total, of which
SEGRO scheme 305.8 283.1
Bilton scheme – 26.1
TOTAL 305.8 309.2
The life expectancies at age 65 are as follows:
2017 2016
Male Female Male Female
Current pensioners 24.7 25.8 24.3 25.3
Future pensioners (in 20 years’ time) 26.9 28.1 26.0 27.2
152
SEGRO PLC | ANNUAL REPORT & ACCOUNTS 2017
FINANCIAL STATEMENTS

18. RETIREMENT BENEFIT SCHEMES CONTINUED
Both life expectancy estimates use the standard S2PA (2016: S2PA) base tables with a scaling factor of 80 per cent for males and 90 per cent for females (2016: 80 per cent and 90 per cent respectively). Future improvements to the life expectancy are in line with CMI 2014 projections with an assumed long-term rate of improvement of one and a half per cent p.a. (2016: one and a quarter per cent p.a.).
Credits/(Charges) on the basis of the assumptions were:2017
£m2016
£m
Credit/(Charge) to Group Income Statement
Operating profit: Current service cost – (0.4)
Past service costs – 2.3
Net finance costs: Net interest income 1.3 0.9
Net credit to the Group Income Statement 1.3 2.8
(Charge)/credit to Group Statement of Comprehensive Income (16.2) 15.0
All actuarial gains and losses are recognised immediately and relate to continuing operations. The cumulative recognised actuarial losses are £30.3 million (2016: £14.1 million).
Fair value of the assets and liabilities of the schemesThe amount included in the Balance Sheet arising from the Group’s assets in respect of its defined benefit retirement schemes is as follows:
2017
£m2016
£m
Movement in assets
1 January 309.2 255.0
Interest on scheme assets 7.4 9.4
Actuarial gains 28.2 54.5
Employer cash contributions 7.9 7.7
Member cash contributions – 0.1
Benefits paid (20.9) (17.5)
Settlement of Bilton scheme (26.0) –
31 December 305.8 309.2
Movement in liabilities
1 January 263.5 234.8
Service cost – 0.4
Interest cost 6.1 8.5
Past service cost – (2.3)
Actuarial (gains)/losses – changes in demographic assumptions 6.0 (4.7)
– changes in financial assumptions 17.5 51.6
– changes due to liability experience 20.9 (7.4)
Benefits paid (20.9) (17.5)
Settlement of Bilton scheme (26.0) –
Other – 0.1
31 December 267.1 263.5
Analysis of net assets:
Market value of schemes’ assets 305.8 309.2
Present value of funded schemes’ liabilities 267.1 263.5
Retirement benefit asset recognised in Pension assets in the Balance Sheet 38.7 45.7
The actual return on the Scheme assets in the period was a gain of £35.6 million (2016: £63.9 million). Both assets and liabilities include an extra £20.0 million of insured pensions in the Trustee’s name at 31 December 2017, which had not previously been recognised. This does not change the net balance sheet position nor the amounts recognised in Group Income Statement and Other Comprehensive Income.
The average duration of the benefit obligations at the end of the reporting period is 21 years (2016: 20 years) for the Scheme. As the Scheme has closed to future benefit accrual, there are no active members within the Scheme. The liabilities are split 42 per cent (2016: 39 per cent) to deferred and 58 per cent (2016: 54 per cent) to retired members. In 2016 7 per cent related to active members.
OVERVIEW STRATEGIC REPORT GOVERNANCE FINANCIAL STATEMENTS
153
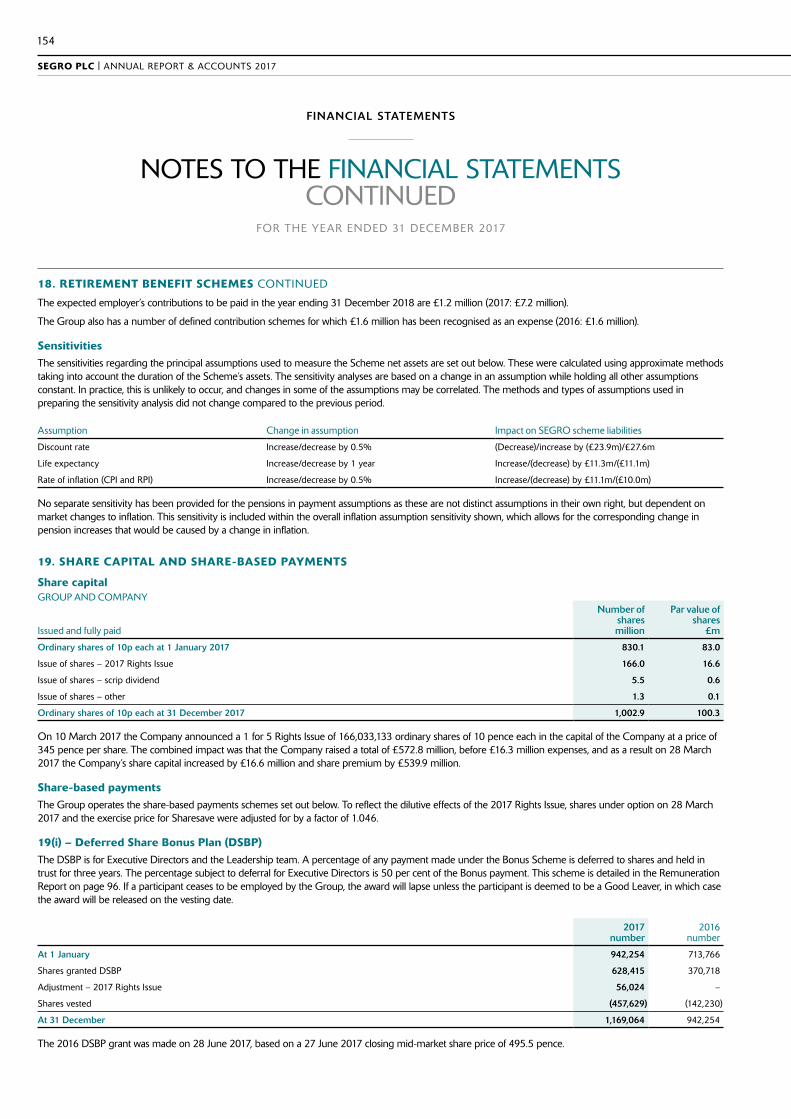
NOTES TO THE FINANCIAL STATEMENTS CONTINUED
FOR THE YEAR ENDED 31 DECEMBER 2017
18. RETIREMENT BENEFIT SCHEMES CONTINUED
The expected employer’s contributions to be paid in the year ending 31 December 2018 are £1.2 million (2017: £7.2 million).
The Group also has a number of defined contribution schemes for which £1.6 million has been recognised as an expense (2016: £1.6 million).
Sensitivities The sensitivities regarding the principal assumptions used to measure the Scheme net assets are set out below. These were calculated using approximate methods taking into account the duration of the Scheme’s assets. The sensitivity analyses are based on a change in an assumption while holding all other assumptions constant. In practice, this is unlikely to occur, and changes in some of the assumptions may be correlated. The methods and types of assumptions used in preparing the sensitivity analysis did not change compared to the previous period.
Assumption Change in assumption Impact on SEGRO scheme liabilities
Discount rate Increase/decrease by 0.5% (Decrease)/increase by (£23.9m)/£27.6m
Life expectancy Increase/decrease by 1 year Increase/(decrease) by £11.3m/(£11.1m)
Rate of inflation (CPI and RPI) Increase/decrease by 0.5% Increase/(decrease) by £11.1m/(£10.0m)
No separate sensitivity has been provided for the pensions in payment assumptions as these are not distinct assumptions in their own right, but dependent on market changes to inflation. This sensitivity is included within the overall inflation assumption sensitivity shown, which allows for the corresponding change in pension increases that would be caused by a change in inflation.
19. SHARE CAPITAL AND SHARE-BASED PAYMENTS
Share capitalGROUP AND COMPANY
Issued and fully paid
Number of shares million
Par value of shares
£m
Ordinary shares of 10p each at 1 January 2017 830.1 83.0
Issue of shares – 2017 Rights Issue 166.0 16.6
Issue of shares – scrip dividend 5.5 0.6
Issue of shares – other 1.3 0.1
Ordinary shares of 10p each at 31 December 2017 1,002.9 100.3
On 10 March 2017 the Company announced a 1 for 5 Rights Issue of 166,033,133 ordinary shares of 10 pence each in the capital of the Company at a price of 345 pence per share. The combined impact was that the Company raised a total of £572.8 million, before £16.3 million expenses, and as a result on 28 March 2017 the Company’s share capital increased by £16.6 million and share premium by £539.9 million.
Share-based paymentsThe Group operates the share-based payments schemes set out below. To reflect the dilutive effects of the 2017 Rights Issue, shares under option on 28 March 2017 and the exercise price for Sharesave were adjusted for by a factor of 1.046.
19(i) – Deferred Share Bonus Plan (DSBP)The DSBP is for Executive Directors and the Leadership team. A percentage of any payment made under the Bonus Scheme is deferred to shares and held in trust for three years. The percentage subject to deferral for Executive Directors is 50 per cent of the Bonus payment. This scheme is detailed in the Remuneration Report on page 96. If a participant ceases to be employed by the Group, the award will lapse unless the participant is deemed to be a Good Leaver, in which case the award will be released on the vesting date.
2017
number2016
number
At 1 January 942,254 713,766
Shares granted DSBP 628,415 370,718
Adjustment – 2017 Rights Issue 56,024 –
Shares vested (457,629) (142,230)
At 31 December 1,169,064 942,254
The 2016 DSBP grant was made on 28 June 2017, based on a 27 June 2017 closing mid-market share price of 495.5 pence.
154
SEGRO PLC | ANNUAL REPORT & ACCOUNTS 2017
FINANCIAL STATEMENTS

19. SHARE CAPITAL AND SHARE-BASED PAYMENTS CONTINUED
19(ii) – Long Term Incentive Plan (LTIP) The LTIP is a discretionary employee share scheme for Executive Directors and senior managers. Vesting of awards is subject to three or four-year performance conditions and is at the discretion of the Remuneration Committee. The performance conditions of the LTIP are detailed in the Remuneration Report on pages 94 to 95. If a participant ceases to be employed by the Group, the award will lapse, unless the participant is deemed to be a Good Leaver, in which case the award will be reduced pro-rata on length of employment in relation to the award date. From 2017 onwards, a mandatory two-year holding period after vesting was introduced for the Executive Directors.
2017
number2016
number
At 1 January 7,516,984 7,502,947
Shares granted LTIP 2,145,438 1,940,183
Adjustment – 2017 Rights Issue 342,245 –
Shares vested (1,763,884) (765,570)
Shares expired/lapsed (380,392) (1,160,576)
At 31 December 7,860,391 7,516,984
The 2017 LTIP award was made on 28 April 2017. The calculation of the award was based on a share price of 493.0 pence, the closing mid-market share price on 28 April 2017. No consideration was paid for the grant of any award.
The Black-Scholes model has been used to fair value the shares granted currently under award, apart from the TSR elements of the award which uses the Monte Carlo model. The assumptions used are as follows:
Date of grant 6 Aug 2013 9 Apr 2014 22 May 2015 7 April 2016 28 April 2017
Market price used for award 311.6p 339.5p 422.5p 420.7p 493.0p
Risk-free interest rate 1.1% 1.3% 1.0% 0.5% 0.1%
Dividend yield 4.7% 4.4% 3.6% 3.7% 3.3%
Volatility 26.0% 24.0% 20.0% 19.0% 21.5%
Term 4 years 4 years 4 years 4 years 3 years
Fair value per share 257.6p 285.1p 366.1p 362.6p 446.1p
19(iii) – Share Incentive Plan (SIP)The SIP is an HMRC approved all-employee share plan. UK employees, who have been employed by the Group since 1 October of the preceding year, may be awarded shares in relation to the Company’s prior year PBT performance. In 2017, as the PBT performance target was achieved in full participating employees were each awarded shares to the value of £3,000. If a participant ceases to be employed by the Group within three years from the date of award the shares will be forfeited, unless the employee is deemed to be a Good Leaver, in which case the shares will be transferred out of the trust to the participant.
2017
number2016
number
At 1 January 484,145 482,202
Shares granted 84,180 102,080
Adjustment – 2017 Rights Issue 7,513 –
Shares released (84,317) (78,704)
Shares forfeited (17,161) (21,433)
At 31 December 474,360 484,145
As at 31 December 2017, 486,289 shares (2016: 502,970 shares) are held in the SIP trust. 233,945 of these shares have been held by the SIP Trust on behalf of employees for over three years.
OVERVIEW STRATEGIC REPORT GOVERNANCE FINANCIAL STATEMENTS
155

NOTES TO THE FINANCIAL STATEMENTS CONTINUED
FOR THE YEAR ENDED 31 DECEMBER 2017
19. SHARE CAPITAL AND SHARE-BASED PAYMENTS CONTINUED
19(iv) – Global Share Incentive Plan (GSIP)The GSIP was launched in 2008 as an all-employee share scheme for non-UK based employees. It is not HMRC approved but the eligibility and performance conditions of the award are designed to replicate the SIP. Employees are granted awards which are released by the Trustees at the conclusion of a three-year holding period. If a participant ceases to be employed by the Group during the three-year period then the award will lapse unless the participant is deemed to be a Good Leaver. Shares in respect of the GSIP are held in the SEGRO plc Employees Benefit Trust.
2017
number2016
number
At 1 January 154,924 146,623
Shares granted 70,150 74,624
Adjustment – 2017 Rights Issue 6,851 –
Shares released (38,142) (53,473)
Shares forfeited (26,488) (12,850)
At 31 December 167,295 154,924
19(v) – SharesaveThe Group operates an HMRC approved all-employee savings related share option plan for UK-based employees. For 2017, a three-year period was offered to employees and if they remain in employment, employees can purchase shares in the Company at a price which is fixed at the start of the saving period. The price is usually set at a 20 per cent discount to the market price. If a participant ceases to be employed by the Group, in certain circumstances the participant may be able to exercise their options within a fixed period from the date of leaving. During 2017, the movements in Sharesave options were as follows:
2017 2016
Number of options
Weighted average
exercise priceNumber of
options
Weighted average
exercise price1
At 1 January 319,589 293.9p 326,155 273.9p
Options granted 137,420 366.2p 80,843 315.0p
Adjustment – 2017 Rights Issue 14,461 293.7p – –
Options exercised (144,047) 295.6p (64,629) 215.6p
Options expired/lapsed (20,515) 207.0p (22,780) 304.7p
At 31 December 306,908 339.1p 319,589 293.9p
1 Weighted average exercise price for shares under option on 28 March 2017 were adjusted for by a factor of 1.046 to reflect the dilutive effects of the 2017 Rights Issue.
The consideration received by the Company from options exercised during the year was £377,185 (2016: £140,145). The grants have been fair valued using the Black-Scholes model. The assumptions are as follows:
Date of grant
Number of options
outstandingMarket
priceExercise
priceRisk-free
interest rateDividend
yield Volatility Exercisable
Fair value per share
Three years
1 May 20151 105,532 419.5p 320.8p 1.0% 3.6% 20.0% 2018 78p
1 May 20161 69,066 411.9p 315.0p 0.5% 3.8% 19.0% 2019 70p
2 May 2017 132,310 457.8p 366.2p 0.09% 4.0% 21.5% 2020 79p
Total 306,908
1 Exercise prices were adjusted for by a factor of 1.046 to reflect the dilutive effects of the 2017 Rights Issue.
A total of 306,908 (2016: 319,589) options exist at 31 December 2017 in relation to the Sharesave with a weighted average remaining contractual life of 2.04 years (2016: 1.76 years).
156
SEGRO PLC | ANNUAL REPORT & ACCOUNTS 2017
FINANCIAL STATEMENTS
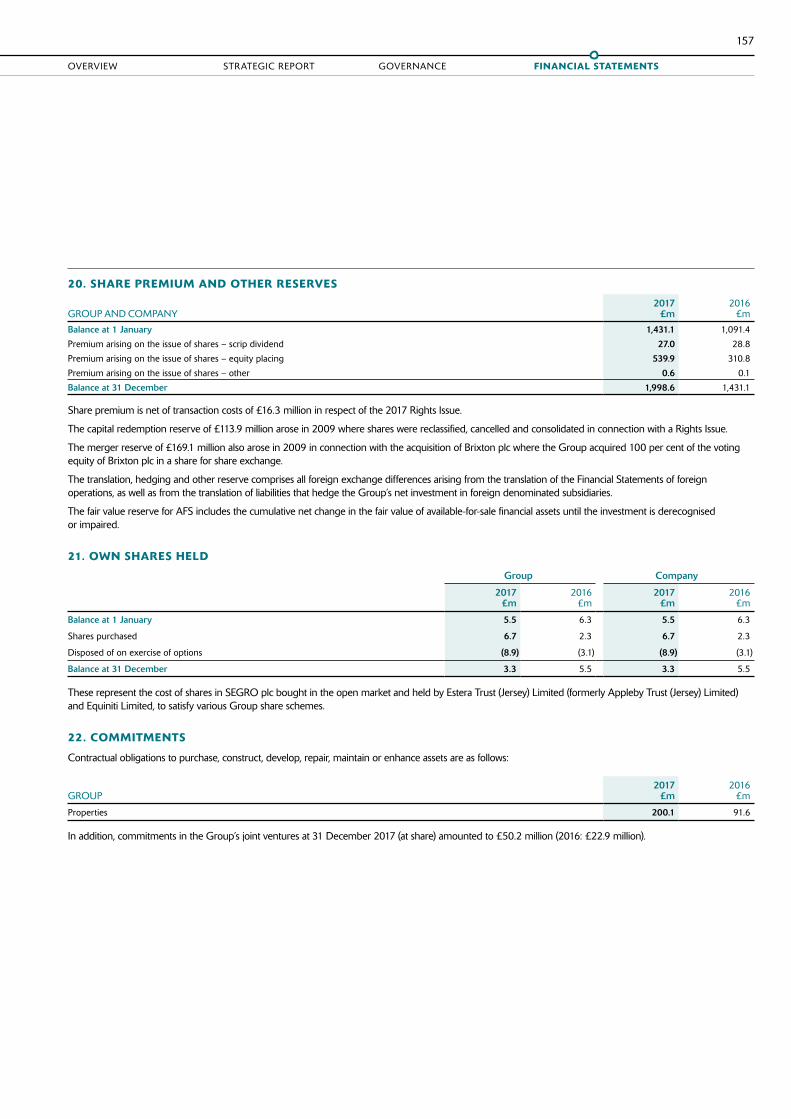
20. SHARE PREMIUM AND OTHER RESERVES
GROUP AND COMPANY2017
£m2016
£m
Balance at 1 January 1,431.1 1,091.4
Premium arising on the issue of shares – scrip dividend 27.0 28.8
Premium arising on the issue of shares – equity placing 539.9 310.8
Premium arising on the issue of shares – other 0.6 0.1
Balance at 31 December 1,998.6 1,431.1
Share premium is net of transaction costs of £16.3 million in respect of the 2017 Rights Issue.
The capital redemption reserve of £113.9 million arose in 2009 where shares were reclassified, cancelled and consolidated in connection with a Rights Issue.
The merger reserve of £169.1 million also arose in 2009 in connection with the acquisition of Brixton plc where the Group acquired 100 per cent of the voting equity of Brixton plc in a share for share exchange.
The translation, hedging and other reserve comprises all foreign exchange differences arising from the translation of the Financial Statements of foreign operations, as well as from the translation of liabilities that hedge the Group’s net investment in foreign denominated subsidiaries.
The fair value reserve for AFS includes the cumulative net change in the fair value of available-for-sale financial assets until the investment is derecognised or impaired.
21. OWN SHARES HELD
Group Company
2017
£m2016
£m2017
£m2016
£m
Balance at 1 January 5.5 6.3 5.5 6.3
Shares purchased 6.7 2.3 6.7 2.3
Disposed of on exercise of options (8.9) (3.1) (8.9) (3.1)
Balance at 31 December 3.3 5.5 3.3 5.5
These represent the cost of shares in SEGRO plc bought in the open market and held by Estera Trust (Jersey) Limited (formerly Appleby Trust (Jersey) Limited) and Equiniti Limited, to satisfy various Group share schemes.
22. COMMITMENTS
Contractual obligations to purchase, construct, develop, repair, maintain or enhance assets are as follows:
GROUP2017
£m2016
£m
Properties 200.1 91.6
In addition, commitments in the Group’s joint ventures at 31 December 2017 (at share) amounted to £50.2 million (2016: £22.9 million).
OVERVIEW STRATEGIC REPORT GOVERNANCE FINANCIAL STATEMENTS
157
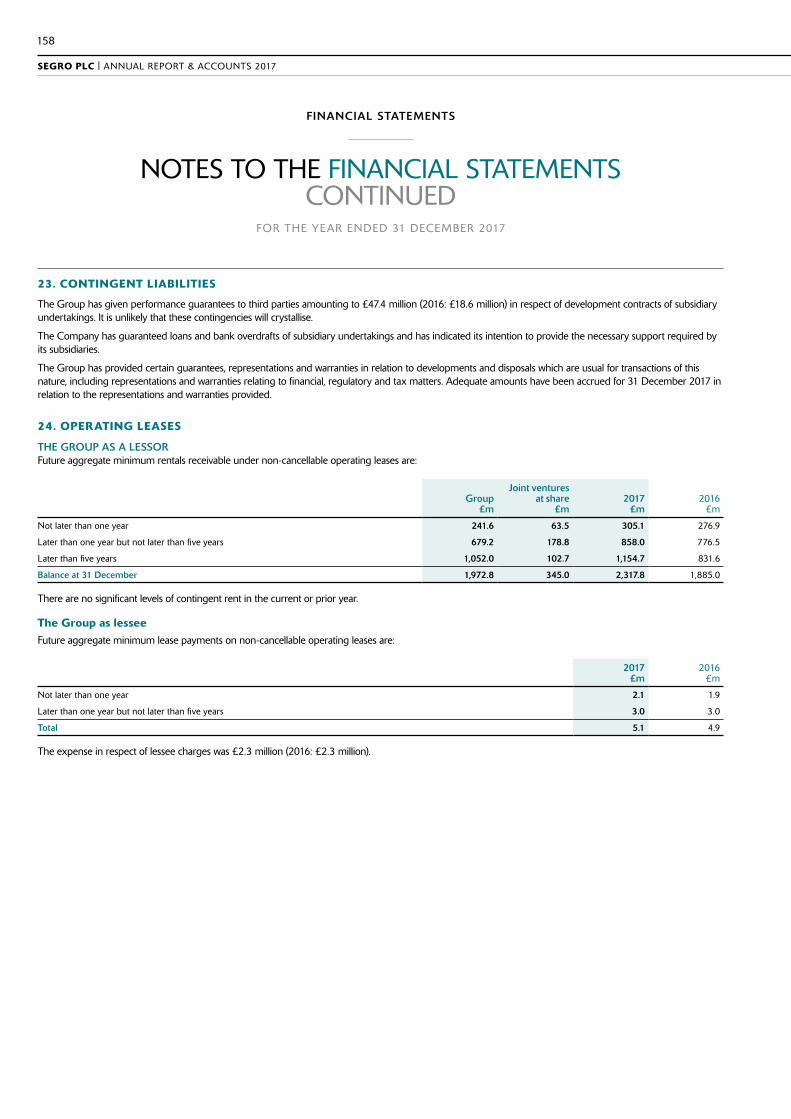
NOTES TO THE FINANCIAL STATEMENTS CONTINUED
FOR THE YEAR ENDED 31 DECEMBER 2017
23. CONTINGENT LIABILITIES
The Group has given performance guarantees to third parties amounting to £47.4 million (2016: £18.6 million) in respect of development contracts of subsidiary undertakings. It is unlikely that these contingencies will crystallise.
The Company has guaranteed loans and bank overdrafts of subsidiary undertakings and has indicated its intention to provide the necessary support required by its subsidiaries.
The Group has provided certain guarantees, representations and warranties in relation to developments and disposals which are usual for transactions of this nature, including representations and warranties relating to financial, regulatory and tax matters. Adequate amounts have been accrued for 31 December 2017 in relation to the representations and warranties provided.
24. OPERATING LEASES
THE GROUP AS A LESSORFuture aggregate minimum rentals receivable under non-cancellable operating leases are:
Group
£m
Joint ventures at share
£m2017
£m2016
£m
Not later than one year 241.6 63.5 305.1 276.9
Later than one year but not later than five years 679.2 178.8 858.0 776.5
Later than five years 1,052.0 102.7 1,154.7 831.6
Balance at 31 December 1,972.8 345.0 2,317.8 1,885.0
There are no significant levels of contingent rent in the current or prior year.
The Group as lesseeFuture aggregate minimum lease payments on non-cancellable operating leases are:
2017
£m2016
£m
Not later than one year 2.1 1.9
Later than one year but not later than five years 3.0 3.0
Total 5.1 4.9
The expense in respect of lessee charges was £2.3 million (2016: £2.3 million).
158
SEGRO PLC | ANNUAL REPORT & ACCOUNTS 2017
FINANCIAL STATEMENTS

25. RELATED PARTY TRANSACTIONS
GroupTransactions during the year between the Group and its joint ventures are disclosed below:
2017
£m2016
£m
Dividends received 26.6 26.5
Assets sold to joint ventures 52.9 182.0
Management and performance fee income 24.3 18.6
On 9 March 2017 SEGRO acquired the remaining 50 per cent interest in the Airport Property Partnership property portfolio that it did not already own. See Note 7 for details of this transaction.
Transactions between the Company and its subsidiaries eliminate on consolidation and are not disclosed in this note.
Transactions between the Group and the pension scheme are set out in Note 18.
CompanyAmounts due from subsidiaries are disclosed in Note 7 and 14 and amounts due to subsidiaries are disclosed in Note 15.
None of the above Group or Company balances are secured.
Remuneration of key management personnelKey management personnel comprise Executive and Non-Executive Directors, as outlined in the Governance Report on pages 64 to 74. Key management personnel compensation is shown in the table below:
2017
£m2016
£m
Salaries and short-term benefits 5.3 4.9
Post-employment benefits 0.4 0.3
Share-based payments 3.4 2.4
Total remuneration 9.1 7.6
More detailed information concerning Directors’ remuneration, shareholdings, pension entitlements, share options and other long-term incentive plans, as required by the Companies Act 2006, is shown in the Remuneration Report on pages 84 to 103.
OVERVIEW STRATEGIC REPORT GOVERNANCE FINANCIAL STATEMENTS
159
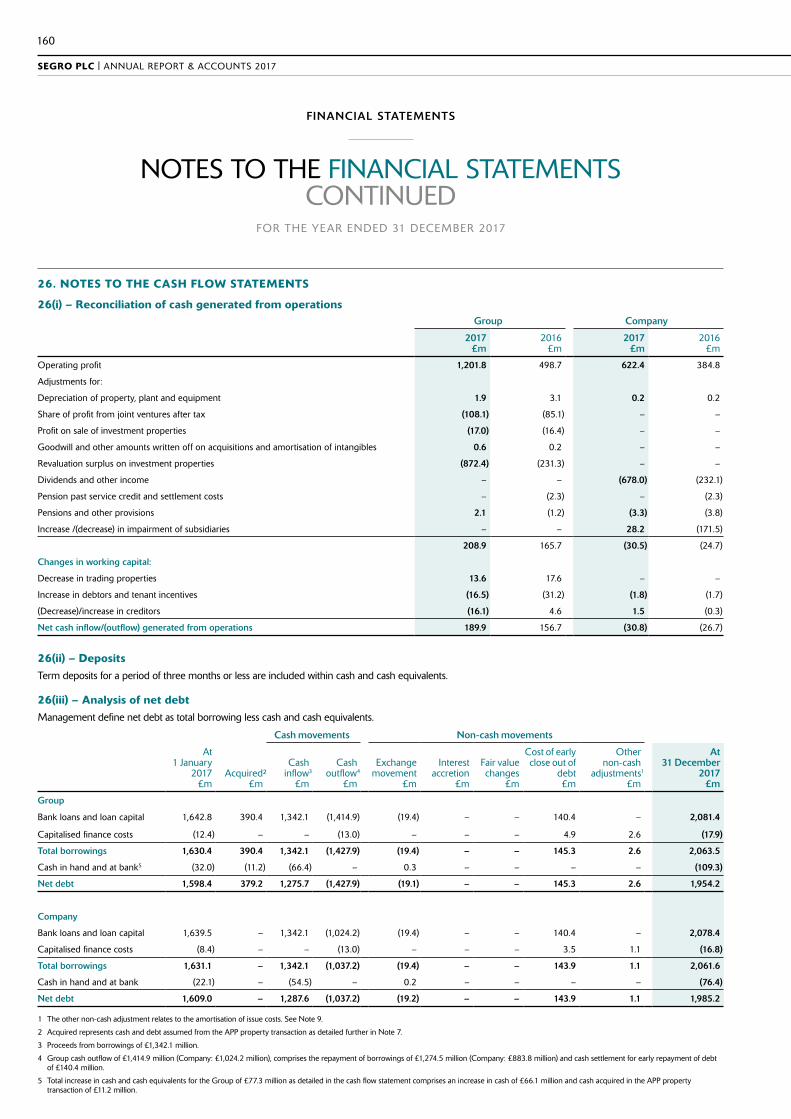
NOTES TO THE FINANCIAL STATEMENTS CONTINUED
FOR THE YEAR ENDED 31 DECEMBER 2017
26. NOTES TO THE CASH FLOW STATEMENTS
26(i) – Reconciliation of cash generated from operationsGroup Company
2017
£m2016
£m2017
£m2016
£m
Operating profit 1,201.8 498.7 622.4 384.8
Adjustments for:
Depreciation of property, plant and equipment 1.9 3.1 0.2 0.2
Share of profit from joint ventures after tax (108.1) (85.1) – –
Profit on sale of investment properties (17.0) (16.4) – –
Goodwill and other amounts written off on acquisitions and amortisation of intangibles 0.6 0.2 – –
Revaluation surplus on investment properties (872.4) (231.3) – –
Dividends and other income – – (678.0) (232.1)
Pension past service credit and settlement costs – (2.3) – (2.3)
Pensions and other provisions 2.1 (1.2) (3.3) (3.8)
Increase /(decrease) in impairment of subsidiaries – – 28.2 (171.5)
208.9 165.7 (30.5) (24.7)
Changes in working capital:
Decrease in trading properties 13.6 17.6 – –
Increase in debtors and tenant incentives (16.5) (31.2) (1.8) (1.7)
(Decrease)/increase in creditors (16.1) 4.6 1.5 (0.3)
Net cash inflow/(outflow) generated from operations 189.9 156.7 (30.8) (26.7)
26(ii) – DepositsTerm deposits for a period of three months or less are included within cash and cash equivalents.
26(iii) – Analysis of net debtManagement define net debt as total borrowing less cash and cash equivalents.
Cash movements Non-cash movements
At 1 January
2017 £m
Acquired²£m
Cash inflow3
£m
Cash outflow4
£m
Exchange movement
£m
Interest accretion
£m
Fair value changes
£m
Cost of early close out of
debt £m
Other non-cash
adjustments1
£m
At 31 December
2017 £m
Group
Bank loans and loan capital 1,642.8 390.4 1,342.1 (1,414.9) (19.4) – – 140.4 – 2,081.4
Capitalised finance costs (12.4) – – (13.0) – – – 4.9 2.6 (17.9)
Total borrowings 1,630.4 390.4 1,342.1 (1,427.9) (19.4) – – 145.3 2.6 2,063.5
Cash in hand and at bank5 (32.0) (11.2) (66.4) – 0.3 – – – – (109.3)
Net debt 1,598.4 379.2 1,275.7 (1,427.9) (19.1) – – 145.3 2.6 1,954.2
Company
Bank loans and loan capital 1,639.5 – 1,342.1 (1,024.2) (19.4) – – 140.4 – 2,078.4
Capitalised finance costs (8.4) – – (13.0) – – – 3.5 1.1 (16.8)
Total borrowings 1,631.1 – 1,342.1 (1,037.2) (19.4) – – 143.9 1.1 2,061.6
Cash in hand and at bank (22.1) – (54.5) – 0.2 – – – – (76.4)
Net debt 1,609.0 – 1,287.6 (1,037.2) (19.2) – – 143.9 1.1 1,985.2
1 The other non-cash adjustment relates to the amortisation of issue costs. See Note 9.
2 Acquired represents cash and debt assumed from the APP property transaction as detailed further in Note 7.
3 Proceeds from borrowings of £1,342.1 million.
4 Group cash outflow of £1,414.9 million (Company: £1,024.2 million), comprises the repayment of borrowings of £1,274.5 million (Company: £883.8 million) and cash settlement for early repayment of debt of £140.4 million.
5 Total increase in cash and cash equivalents for the Group of £77.3 million as detailed in the cash flow statement comprises an increase in cash of £66.1 million and cash acquired in the APP property transaction of £11.2 million.
160
SEGRO PLC | ANNUAL REPORT & ACCOUNTS 2017
FINANCIAL STATEMENTS

26. NOTES TO THE CASH FLOW STATEMENTS CONTINUED
26(iv) – Analysis of financial liabilities and assets arising from financing activitiesCash movements Non-cash movements
Group
At 1 January
2017 £m
Acquired£m
Cash inflow6
£m
Cashoutflow7
£m
Exchangemovement8
£m
Interestaccretion9
£m
Fair value changes
£m
Cost of early close out of
debt £m
Other non-cash
adjustments£m
At 31 December
2017 £m
Total borrowings (Note 16) (1,630.4) (390.4) (1,342.1) 1,427.9 19.4 – – (145.3) (2.6) (2,063.5)
Other financial (liabilities)/assets
Accrued interest payable on borrowings (Note 15) (26.7) – – 99.4 – (93.6) – – – (20.9)
Derivatives: (Net) Fair value of forward foreign exchange and currency swap contracts (Note 17) (9.6) – (24.4) 80.7 (55.7) 7.4 0.2 – – (1.4)
Derivatives: (Net) Fair value of interest rate swaps and interest rate caps (Note 17) 76.5 (6.2) (71.6) 61.8 – 21.9 (21.7) – – 60.7
Total net other financial assets 40.2 (6.2) (96.0) 241.9 (55.7) (64.3) (21.5) – – 38.4
Total net financial liabilities arising from financing activities (1,590.2) (396.6) (1,438.1) 1,669.8 (36.3) (64.3) (21.5) (145.3) (2.6) (2,025.1)
6 Cash inflows of £96.0 million from other financial liabilities and assets consists of interest received on derivatives of £61.2 million and proceeds from early close out of interest rate derivatives of £34.8 million.
7 Cash outflow of £241.9 million from other financial liabilities and assets consists of:
– Cash flows from operating activities of £178.5 million: Arising from interest paid on overdrafts, loans and related derivatives of £127.6 million (total interest paid per the cash flow statement of £140.6 million also includes cash paid for the issue of debt of £13.0 million) and cost of early close out of interest rate derivatives and new derivatives transacted in the year of £50.9 million.
– Cash flows from financing activities arising from the net settlement of foreign exchange derivatives of £63.4 million.
8 Exchange movement of £55.7 million from forward foreign exchange and currency swap contracts consists of: FX losses on effective hedge relationships recognised in OCI of £6.4m and FX losses recognised within the Income Statement of £49.3m. See Note 17 forward foreign exchange and currency swap contracts for further details.
9 Net interest accretion of £64.3 million consists of interest expense of £98.8 million and interest income of £34.5 million. Total interest received per Note 9 of £34.7 million also includes £0.2 million interest received on bank deposits.
Company
The Company’s financial liabilities and assets arising from financing activities are materially the same as those shown for the Group other than the following items:
– Total interest received of £189.6 million shown within the Company cash flow statement also includes interest received from intercompany loans in addition to the interest received for the Group.
– Cost of early close out of interest rate derivatives and new derivatives transacted of £45.6 million for the Company excludes £5.3 million acquired through APP shown in the Group cash flow.
– The repayment of borrowings shown in the Company cash flow statement of £883.8 million differs from the Group equivalent primarily because it excludes the repayment of the APP loan acquired for £390.4 million.
OVERVIEW STRATEGIC REPORT GOVERNANCE FINANCIAL STATEMENTS
161

NOTES TO THE FINANCIAL STATEMENTS CONTINUED
FOR THE YEAR ENDED 31 DECEMBER 2017
27. PROPERTY VALUATION TECHNIQUES AND RELATED QUANTITATIVE INFORMATION
All of the Group’s properties are level 3, as defined by IFRS 13, in the fair value hierarchy as at 31 December 2017 and there were no transfers between levels during the year. Level 3 inputs used in valuing the properties are those which are unobservable, as opposed to level 1 (inputs from quoted prices) and level 2 (observable inputs either directly, i.e. as prices, or indirectly, i.e. derived from prices).
Based on different approaches for different properties, the following valuation techniques can be used for the same class of assets:
The yield methodology valuation technique is used when valuing the Group’s assets which uses market rental values capitalised with a market capitalisation rate. The resulting valuations are cross-checked against the initial yields and the fair market values per square metre derived from actual market transactions for similar assets.
For properties under construction and the majority of land held for development, properties are valued using a residual method valuation. Under this methodology, the valuer assesses the investment value (using the above mentioned methodology for completed buildings). Deductions are then made for the total estimated costs to complete, including notional finance costs and developer’s profit, to take into account the hypothetical purchaser’s management of the remaining development process and their perception of risk with regard to construction and the property market (e.g. as regards potential cost overruns and letting risk). Land values are cross-checked against the rate per hectare derived from actual market transactions. Other land is also valued on this comparative basis, the ranges for which are (per hectare) £0.1 million – £3.6 million (2016: £1.8 million – £9.1 million) for the UK and £0.1 million – £2.6 million (2016: £0.2 million – £2.5 million) for Continental Europe.
An increase/decrease to ERV will increase/decrease valuations, while an increase/decrease to yield will decrease/increase valuations. A sensitivity analysis showing the impact on valuations of changes in yields and ERV on the property portfolio (including joint ventures at share) is shown below.
Sensitivity analysis
Impact on valuation of 25bp change in nominal equivalent yield
Impact on valuation of 5% change in estimated rental value (ERV)
Group total completed property portfolio
£mIncrease
£mDecrease
£mIncrease
£mDecrease
£m
2017 7,160.4 (346.1) 383.3 272.1 (266.0)
2016 5,666.2 (243.7) 266.2 228.3 (221.6)
There are interrelationships between all these inputs as they are determined by market conditions. The existence of an increase in more than one input would be to magnify the impact on the valuation. The impact on the valuation will be mitigated by the interrelationship of two inputs in opposite directions, e.g. an increase in rent may be offset by an increase in yield. The below table includes the Group’s wholly-owned and joint venture assets at share in order to include the entire portfolio. The equivalent analysis for the range of inputs on a wholly-owned basis would not be significantly different.
Valuation Inputs
2017 By asset type
Completed£m
Land &development¹
£m
Combined property portfolio
£m
ERV²£ per sq m
ERVrange²£ per sq m
Net true equivalent
yield³%
Net true equivalent yield range
%
Big box warehouses > 10,000 sq m 2,928.3 2,928.3 51.3 22.6–251.1 5.5 4.3–10.4
Urban warehouses and light industrial buildings 3,565.5 3,565.5 111.4 26.5–280.2 5.1 4.1–9.5
Urban warehouses used as data centres 371.8 371.8 185.4 99.0–231.7 5.1 4.5–5.1
Higher value uses4 294.8 294.8 159.6 53.1–236.8 5.9 4.3–8.3
7,160.4 878.3 8,038.7
By ownership
Wholly-owned5 5,970.6 787.3 6,757.9 99.3 22.6–280.2 5.1 4.1–10.4
Joint ventures 1,189.8 91.0 1,280.8 43.7 31.9–112.4 6.0 4.6–7.3
Group Total 7,160.4 878.3 8,038.7 70.5 22.6–280.2 5.3 4.1–10.4
1 Land and development valuations by asset type are not available as land sites are not categorised by asset type. Combined property portfolio column will not cast down but row does cast across.
2 On a fully occupied basis.
3 In relation to the completed properties only.
4 Higher value uses includes offices and retail uses, such as trade counters, car showrooms and self-storage facilities.
5 Included in the completed portfolio, the wholly owned assets are: Big box £1,791.8 million (£1,216.3 million); light industrial £3,514.7 million (2016: £2,381.6 million); data centres £371.8 million (2016: £314.2 million); and higher value uses £292.3 million (2016: £219.7 million including offices).
162
SEGRO PLC | ANNUAL REPORT & ACCOUNTS 2017
FINANCIAL STATEMENTS
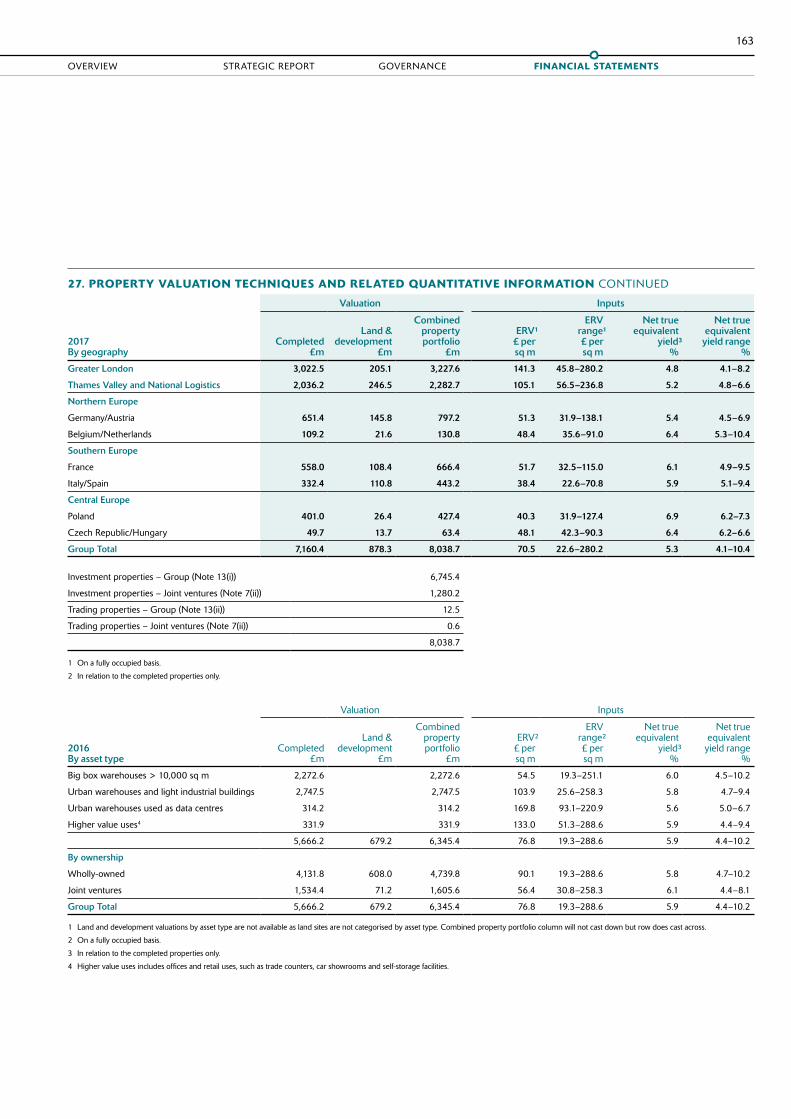
27. PROPERTY VALUATION TECHNIQUES AND RELATED QUANTITATIVE INFORMATION CONTINUED
Valuation Inputs
2017 By geography
Completed £m
Land & development
£m
Combined property portfolio
£m
ERV¹£ per sq m
ERVrange¹£ per sq m
Net true equivalent
yield³%
Net true equivalent yield range
%
Greater London 3,022.5 205.1 3,227.6 141.3 45.8–280.2 4.8 4.1–8.2
Thames Valley and National Logistics 2,036.2 246.5 2,282.7 105.1 56.5–236.8 5.2 4.8–6.6
Northern Europe
Germany/Austria 651.4 145.8 797.2 51.3 31.9–138.1 5.4 4.5–6.9
Belgium/Netherlands 109.2 21.6 130.8 48.4 35.6–91.0 6.4 5.3–10.4
Southern Europe
France 558.0 108.4 666.4 51.7 32.5–115.0 6.1 4.9–9.5
Italy/Spain 332.4 110.8 443.2 38.4 22.6–70.8 5.9 5.1–9.4
Central Europe
Poland 401.0 26.4 427.4 40.3 31.9–127.4 6.9 6.2–7.3
Czech Republic/Hungary 49.7 13.7 63.4 48.1 42.3–90.3 6.4 6.2–6.6
Group Total 7,160.4 878.3 8,038.7 70.5 22.6–280.2 5.3 4.1–10.4
Investment properties – Group (Note 13(i)) 6,745.4
Investment properties – Joint ventures (Note 7(ii)) 1,280.2
Trading properties – Group (Note 13(ii)) 12.5
Trading properties – Joint ventures (Note 7(ii)) 0.6
8,038.7
1 On a fully occupied basis.
2 In relation to the completed properties only.
Valuation Inputs
2016 By asset type
Completed £m
Land &development
£m
Combined property portfolio
£m
ERV²£ per sq m
ERVrange²£ per sq m
Net true equivalent
yield³%
Net true equivalent yield range
%
Big box warehouses > 10,000 sq m 2,272.6 2,272.6 54.5 19.3–251.1 6.0 4.5–10.2
Urban warehouses and light industrial buildings 2,747.5 2,747.5 103.9 25.6–258.3 5.8 4.7–9.4
Urban warehouses used as data centres 314.2 314.2 169.8 93.1–220.9 5.6 5.0–6.7
Higher value uses4 331.9 331.9 133.0 51.3–288.6 5.9 4.4–9.4
5,666.2 679.2 6,345.4 76.8 19.3–288.6 5.9 4.4–10.2
By ownership
Wholly-owned 4,131.8 608.0 4,739.8 90.1 19.3–288.6 5.8 4.7–10.2
Joint ventures 1,534.4 71.2 1,605.6 56.4 30.8–258.3 6.1 4.4–8.1
Group Total 5,666.2 679.2 6,345.4 76.8 19.3–288.6 5.9 4.4–10.2
1 Land and development valuations by asset type are not available as land sites are not categorised by asset type. Combined property portfolio column will not cast down but row does cast across.
2 On a fully occupied basis.
3 In relation to the completed properties only.
4 Higher value uses includes offices and retail uses, such as trade counters, car showrooms and self-storage facilities.
OVERVIEW STRATEGIC REPORT GOVERNANCE FINANCIAL STATEMENTS
163

NOTES TO THE FINANCIAL STATEMENTS CONTINUED
FOR THE YEAR ENDED 31 DECEMBER 2017
27. PROPERTY VALUATION TECHNIQUES AND RELATED QUANTITATIVE INFORMATION CONTINUED
Valuation Inputs
2016 By geography
Completed £m
Land &development
£m
Combined property portfolio
£m
ERV¹£ per sq m
ERVrange¹£ per sq m
Net true equivalent
yield²%
Net true equivalent yield range
%
Greater London 2,142.5 183.4 2,325.9 131.4 40.1–258.3 5.4 4.4–8.2
Thames Valley and National Logistics 1,837.6 153.9 1,991.5 97.4 29.6–288.6 5.8 4.7–6.8
Northern Europe
Germany 550.4 123.4 673.8 50.6 19.3–170.1 6.0 5.2–9.7
Belgium/Netherlands/Austria 112.7 18.7 131.4 48.1 34.4–88.3 7.1 5.5–10.2
Southern Europe
France 469.6 48.9 518.5 52.5 31.4–111.1 6.9 5.7–9.2
Italy/Spain 153.9 99.6 253.5 44.1 25.6–161.6 6.7 6.0–9.4
Central Europe
Poland 360.2 28.3 388.5 40.0 29.2–123.1 6.9 6.2–7.5
Czech Republic/Hungary 39.3 23.0 62.3 45.1 39.2–64.1 6.9 6.8–7.8
Group Total 5,666.2 679.2 6,345.4 76.8 19.3–288.6 5.9 4.4–10.2
Investment properties – Group (Note 13(i)) 4,714.4
Investment properties – Joint ventures (Note 7(ii)) 1,605.0
Trading properties – Group (Note 13(ii)) 25.4
Trading properties – Joint ventures (Note 7(ii)) 0.6
6,345.4
1 On a fully occupied basis.
2 In relation to the completed properties only.
164
SEGRO PLC | ANNUAL REPORT & ACCOUNTS 2017
FINANCIAL STATEMENTS

28. RELATED UNDERTAKINGS
A list of the Group’s related undertakings as at 31 December 2017 is detailed below. Except where the Group’s percentage effective holding is disclosed below, the entire share capital of the subsidiary undertaking is held by the Group. Unless otherwise stated, the Group’s holding in the subsidiary undertaking comprises ordinary shares. Where subsidiaries have different classes of shares, the percentage effective holding shown represents both the Group’s voting rights and equity holding. All subsidiaries are consolidated in the Group’s Financial Statements. The Group’s related undertakings also include its joint ventures primarily SELP and Roxhill.
Company Name Jurisdiction
% effective holding if not 100% Direct/Indirect Registered Office
Airport Property GP (No. 2) Limited England & Wales Indirect Cunard House, 15 Regent Street, London SW1Y 4LR
Airport Property H1 Limited1 England & Wales Indirect Cunard House, 15 Regent Street, London SW1Y 4LR
Airport Property Partnership England & Wales Indirect Cunard House, 15 Regent Street, London SW1Y 4LR
Allnatt London Properties PLC2 England & Wales Direct Cunard House, 15 Regent Street, London SW1Y 4LR
Amdale Holdings Limited NV Belgium Indirect Louizalaan 331 – 333, 1050 Elsene, Belgium
Beira Investments Sp. z.o.o. Poland Indirect 61-894 Poznan, Pl. Andersa 5, Poland
Big Box GP Limited5 England & Wales Indirect 55 Baker Street, London, W1U 7EU
Bilton Homes Limited England & Wales Indirect Cunard House, 15 Regent Street, London SW1Y 4LR
Bilton p.l.c. England & Wales Direct Cunard House, 15 Regent Street, London SW1Y 4LR
Bonsol S.R.L. Italy 90 Indirect Strada 3 Palazzo B3, 20090 Assago (Milano) Italy
Brixton (Axis Park) Limited England & Wales Indirect Cunard House, 15 Regent Street, London SW1Y 4LR
Brixton (Equiton) 1 Limited5 England & Wales Indirect 55 Baker Street, London, W1U 7EU
Brixton (Equiton) 2 Limited5 England & Wales Indirect 55 Baker Street, London, W1U 7EU
Brixton (Equiton) 3 Limited5 England & Wales Indirect 55 Baker Street, London, W1U 7EU
Brixton (Equiton) 4 Limited5 England & Wales Indirect 55 Baker Street, London, W1U 7EU
Brixton (Equiton) 5 Limited5 England & Wales Indirect 55 Baker Street, London, W1U 7EU
Brixton (Equiton) 6 Limited5 England & Wales Indirect 55 Baker Street, London, W1U 7EU
Brixton (Fairway Units 7-11) 1 Limited England & Wales Indirect Cunard House, 15 Regent Street, London SW1Y 4LR
Brixton (Great Western, Southall) Limited England & Wales Indirect Cunard House, 15 Regent Street, London SW1Y 4LR
Brixton (Hatton Cross) 1 Limited England & Wales Indirect Cunard House, 15 Regent Street, London SW1Y 4LR
Brixton (Heathrow Big Box) 1 Limited5 England & Wales Indirect 55 Baker Street, London, W1U 7EU
Brixton (Heathrow Big Box) 2 Limited5 England & Wales Indirect 55 Baker Street, London, W1U 7EU
Brixton (Heathrow Big Box) 3 Limited5 England & Wales Indirect 55 Baker Street, London, W1U 7EU
Brixton (Heathrow Big Box) 4 Limited5 England & Wales Indirect 55 Baker Street, London, W1U 7EU
Brixton (Heathrow Big Box) 5 Limited5 England & Wales Indirect 55 Baker Street, London, W1U 7EU
Brixton (Heathrow Big Box) 6 Limited5 England & Wales Indirect 55 Baker Street, London, W1U 7EU
Brixton (Heathrow Big Box) 7 Limited5 England & Wales Indirect 55 Baker Street, London, W1U 7EU
Brixton (Heathrow Big Box) 8 Limited5 England & Wales Indirect 55 Baker Street, London, W1U 7EU
Brixton (Heathrow Estate) Limited England & Wales Indirect Cunard House, 15 Regent Street, London SW1Y 4LR
Brixton (Metropolitan Park) 1 Limited England & Wales Indirect Cunard House, 15 Regent Street, London SW1Y 4LR
Brixton (Origin) Limited England & Wales Indirect Cunard House, 15 Regent Street, London SW1Y 4LR
Brixton (Victoria Industrial Estate) 1 Limited5 England & Wales Indirect 55 Baker Street, London, W1U 7EU
Brixton Asset Management UK Limited England & Wales Indirect Cunard House, 15 Regent Street, London SW1Y 4LR
Brixton Equiton Limited5 England & Wales Indirect 55 Baker Street, London, W1U 7EU
Brixton Greenford Park Limited England & Wales Indirect Cunard House, 15 Regent Street, London SW1Y 4LR
Brixton Limited England & Wales Direct Cunard House, 15 Regent Street, London SW1Y 4LR
Brixton Nominee 26 (Jersey) Limited Jersey Indirect 3rd Floor, One The Esplanade, St Helier, JE2 3QA Jersey
Brixton Nominee 27 (Jersey) Limited Jersey Indirect 3rd Floor, One The Esplanade, St Helier, JE2 3QA Jersey
OVERVIEW STRATEGIC REPORT GOVERNANCE FINANCIAL STATEMENTS
165

NOTES TO THE FINANCIAL STATEMENTS CONTINUED
FOR THE YEAR ENDED 31 DECEMBER 2017
Company Name Jurisdiction
% effective holding if not 100% Direct/Indirect Registered Office
Brixton Nominee 38 (Jersey) Limited Jersey Indirect 3rd Floor, One The Esplanade, St Helier, JE2 3QA Jersey
Brixton Nominee 39 (Jersey) Limited Jersey Indirect 3rd Floor, One The Esplanade, St Helier, JE2 3QA Jersey
Brixton Nominee 40 (Jersey) Limited Jersey Indirect 3rd Floor, One The Esplanade, St Helier, JE2 3QA Jersey
Brixton Nominee 41 (Jersey) Limited Jersey Indirect 3rd Floor, One The Esplanade, St Helier, JE2 3QA Jersey
Brixton Nominee 8 (Jersey) Limited Jersey Indirect 3rd Floor, One The Esplanade, St Helier, JE2 3QA Jersey
Brixton Nominee 9 (Jersey) Limited Jersey Indirect 3rd Floor, One The Esplanade, St Helier, JE2 3QA Jersey
Brixton Nominee Axis Park 1 Limited Jersey Indirect 3rd Floor, One The Esplanade, St Helier, JE2 3QA Jersey
Brixton Nominee Axis Park 2 Limited Jersey Indirect 3rd Floor, One The Esplanade, St Helier, JE2 3QA Jersey
Brixton Nominee Polar Park 1 Limited Jersey Indirect 3rd Floor, One The Esplanade, St Helier, JE2 3QA Jersey
Brixton Nominee Polar Park 2 Limited Jersey Indirect 3rd Floor, One The Esplanade, St Helier, JE2 3QA Jersey
Brixton Nominee Premier Park 1 Limited Jersey Indirect 3rd Floor, One The Esplanade, St Helier, JE2 3QA Jersey
Brixton Nominee Premier Park 2 Limited Jersey Indirect 3rd Floor, One The Esplanade, St Helier, JE2 3QA Jersey
Brixton Northfields (Wembley 1) Limited England & Wales Indirect Cunard House, 15 Regent Street, London SW1Y 4LR
Brixton Northfields (Wembley) Holdings Limited England & Wales Indirect Cunard House, 15 Regent Street, London SW1Y 4LR
Brixton Northfields (Wembley) Limited England & Wales Indirect Cunard House, 15 Regent Street, London SW1Y 4LR
Brixton Northfields 1 Limited England & Wales Indirect Cunard House, 15 Regent Street, London SW1Y 4LR
Brixton Northfields 2 Limited England & Wales Indirect Cunard House, 15 Regent Street, London SW1Y 4LR
Brixton Northfields 3 Limited England & Wales Indirect Cunard House, 15 Regent Street, London SW1Y 4LR
Brixton Northfields 4 Limited England & Wales Indirect Cunard House, 15 Regent Street, London SW1Y 4LR
Brixton Northfields 5 Limited England & Wales Indirect Cunard House, 15 Regent Street, London SW1Y 4LR
Brixton Northfields 6 Limited England & Wales Indirect Cunard House, 15 Regent Street, London SW1Y 4LR
Brixton Premier Park Limited England & Wales Indirect Cunard House, 15 Regent Street, London SW1Y 4LR
Brixton Properties Limited England & Wales Indirect Cunard House, 15 Regent Street, London SW1Y 4LR
Brixton Sub-Holdings Limited England & Wales Indirect Cunard House, 15 Regent Street, London SW1Y 4LR
Brixton Woodside Limited5 England & Wales Indirect 55 Baker Street, London, W1U 7EU
B-Serv Limited England & Wales Indirect Cunard House, 15 Regent Street, London SW1Y 4LR
CHR Holdings II LLC6 Delaware Indirect 1209 Orange Street, Wilmington, Delaware, United States
CHR Holdings LLC Delaware Indirect 2711, 400 Centerville Road, Wilmington, New Castle, Delaware, 19808 United States
De Hoek-Noord S-Park B.V. Netherlands Indirect Gustav Mahlerplein 62, ITO-toren, 8th Floor, 1082MA Amsterdam, Netherlands
Devon Nominees (No. 1) Limited England & Wales Indirect Cunard House, 15 Regent Street, London SW1Y 4LR
Devon Nominees (No. 2) Limited England & Wales Indirect Cunard House, 15 Regent Street, London SW1Y 4LR
Devon Nominees (No. 3) Limited England & Wales Indirect Cunard House, 15 Regent Street, London SW1Y 4LR
EUROPA MAGNESIUM S.R.L. Italy Indirect Strada 3 Palazzo B3, 20090 Assago (Milano) Italy
FBH France 1 SARL France 90 Indirect 47 rue de Ponthieu, 75008 Paris, France
Granby Investment Sp. z.o.o. Poland Indirect Pl. Andersa 3, 61-894 Poznan, Poland
GrontFour s.r.o. Czech Republic Indirect Praha 1, Na Pr ıkope 9/392 a 11/393, PSC 110 00, Czech Republic
Helios Northern Limited1 England & Wales Indirect Cunard House, 15 Regent Street, London SW1Y 4LR
HelioSlough Limited England & Wales Indirect Cunard House, 15 Regent Street, London SW1Y 4LR
HEREF Distribution Limited Jersey Indirect 3rd Floor, One The Esplanade, St Helier, JE2 3QA Jersey
Holbury Investments Sp. z.o.o. Poland Indirect Pl. Andersa 3, 61-894 Poznan, Poland
IFP S.R.L. Italy 90 Indirect Strada 3 Palazzo B3, 20090 Assago (Milano) Italy
IMPIANTI FTV S.R.L. Italy 90 Indirect Strada 3 Palazzo B3, 20090 Assago (Milano) Italy
28. RELATED UNDERTAKINGS CONTINUED
166
SEGRO PLC | ANNUAL REPORT & ACCOUNTS 2017
FINANCIAL STATEMENTS

Company Name Jurisdiction
% effective holding if not 100% Direct/Indirect Registered Office
Invest Sun NV Belgium Indirect Louizalaan 331–333, 1050 Elsene, Belgium
Karnal Investments Sp. z.o.o. Poland Indirect Zielna 37, 00-108 Warszawa Mazowieckie, Poland
LIACOM-A Ingatlanforgalmazó Korlátolt Felelösségü Társaság
Hungary Indirect 1024 Budapest, Löv˝oház u. 39, Hungary
Lynford Investments Sp z.o.o. Poland Indirect Zielna 37, 00-108 Warszawa Mazowieckie, Poland
M0M4 Üzleti Park Ingatlanfejlesztö Korlátolt Felelösségü Társaság
Hungary Indirect 1024 Budapest, Löv˝oház u. 39, Hungary
Nivindus NV Belgium 50 Indirect Louizalaan 331–333, 1050 Elsene, Belgium
Novara Logistics Park SARL Italy 90 Indirect Strada 3 Palazzo B3, 20090 Assago (Milano) Italy
Ozarow Biznes Park Sp .z.o.o Poland Indirect Pl. Andersa 3, 61-894 Poznan, Poland
Pegatec NV Belgium Indirect Louizalaan 331–333, 1050 Elsene, Belgium
Premier Greenford GP Limited1 England & Wales Indirect Cunard House, 15 Regent Street, London SW1Y 4LR
Roxhill (Coventry M6 J2) Limited England & Wales 50 Indirect Lumonics House Valley Drive, Swift Valley, Rugby Warwickshire
Roxhill (Coventry) Limited England & Wales 50 Indirect Lumonics House Valley Drive, Swift Valley, Rugby Warwickshire
Roxhill (Howbury) Limited England & Wales 50 Indirect Lumonics House Valley Drive, Swift Valley, Rugby Warwickshire
Roxhill (Junction 15) Limited England & Wales 50 Indirect Lumonics House Valley Drive, Swift Valley, Rugby Warwickshire
Roxhill (Maidstone) Limited England & Wales 50 Indirect Lumonics House Valley Drive, Swift Valley, Rugby Warwickshire
Roxhill (Reading) Limited England & Wales 50 Indirect Lumonics House Valley Drive, Swift Valley, Rugby Warwickshire
Roxhill (Rushden) Limited England & Wales 50 Indirect Lumonics House Valley Drive, Swift Valley, Rugby Warwickshire
Roxhill (Tilbury 2) Limited England & Wales 50 Indirect Lumonics House Valley Drive, Swift Valley, Rugby Warwickshire
Roxhill Warth 3 Limited England & Wales 50 Indirect Lumonics House Valley Drive, Swift Valley, Rugby Warwickshire
Roxhill-SEGRO (Rugby Gateway) LLP England & Wales 50 Indirect Lumonics House Valley Drive, Swift Valley, Rugby Warwickshire
SC Union Business SRL Romania 90 Indirect Str. Caimatei n. 10, Corpo B, Sector 2, 030167 Bucharest, Romainia
SEGRO (225 Bath Road) Limited England & Wales Indirect Cunard House, 15 Regent Street, London SW1Y 4LR
SEGRO (Acton Park Estate) Limited England & Wales Indirect Cunard House, 15 Regent Street, London SW1Y 4LR
SEGRO (Barking 1) Limited England & Wales Indirect Cunard House, 15 Regent Street, London SW1Y 4LR
SEGRO (Barking 2) Limited England & Wales Indirect Cunard House, 15 Regent Street, London SW1Y 4LR
SEGRO (Barking 3) Limited England & Wales Indirect Cunard House, 15 Regent Street, London SW1Y 4LR
SEGRO (Barking) Limited England & Wales Indirect Cunard House, 15 Regent Street, London SW1Y 4LR
SEGRO (Blanc Mesnil) SARL France Indirect 20, rue Brunel, 75017 Paris, France
SEGRO (Brackmills) Limited England & Wales Indirect Cunard House, 15 Regent Street, London SW1Y 4LR
SEGRO (Bracknell) Limited England & Wales Indirect Cunard House, 15 Regent Street, London SW1Y 4LR
SEGRO (Burton upon Trent) Limited England & Wales Indirect Cunard House, 15 Regent Street, London SW1Y 4LR
SEGRO (Crick) Limited England & Wales Indirect Cunard House, 15 Regent Street, London SW1Y 4LR
SEGRO (Den Bosch) B.V. Netherlands Indirect Gustav Mahlerplein 62, ITO-toren, 8th Floor, 1082MA Amsterdam, Netherlands
SEGRO (Deptford Trading Estate) Limited England & Wales Indirect Cunard House, 15 Regent Street, London SW1Y 4LR
28. RELATED UNDERTAKINGS CONTINUED
OVERVIEW STRATEGIC REPORT GOVERNANCE FINANCIAL STATEMENTS
167

NOTES TO THE FINANCIAL STATEMENTS CONTINUED
FOR THE YEAR ENDED 31 DECEMBER 2017
Company Name Jurisdiction
% effective holding if not 100% Direct/Indirect Registered Office
SEGRO (D-Link House) Limited England & Wales Indirect Cunard House, 15 Regent Street, London SW1Y 4LR
SEGRO (East Plus) Limited England & Wales Indirect Cunard House, 15 Regent Street, London SW1Y 4LR
SEGRO (East Plus) Trading Limited England & Wales Indirect Cunard House, 15 Regent Street, London SW1Y 4LR
SEGRO (EMG Management Company) Limited4 England & Wales Indirect Cunard House, 15 Regent Street, London SW1Y 4LR
SEGRO (EMG Unit 1) Limited England & Wales Indirect Cunard House, 15 Regent Street, London SW1Y 4LR
SEGRO (EMG Unit 2) Limited England & Wales Indirect Cunard House, 15 Regent Street, London SW1Y 4LR
SEGRO (EMG) Limited England & Wales Indirect Cunard House, 15 Regent Street, London SW1Y 4LR
SEGRO (Fairways Industrial Estate) Limited England & Wales Indirect Cunard House, 15 Regent Street, London SW1Y 4LR
SEGRO (Grange Park) Limited England & Wales Indirect Cunard House, 15 Regent Street, London SW1Y 4LR
SEGRO (Great Cambridge Industrial Estate) Limited England & Wales Indirect Cunard House, 15 Regent Street, London SW1Y 4LR
SEGRO (Hatton Farm Site A) Limited England & Wales Indirect Cunard House, 15 Regent Street, London SW1Y 4LR
SEGRO (Hatton Farm Site B) Limited England & Wales Indirect Cunard House, 15 Regent Street, London SW1Y 4LR
SEGRO (Hatton Farm Site C) Limited England & Wales Indirect Cunard House, 15 Regent Street, London SW1Y 4LR
SEGRO (Hayes) Limited England & Wales Indirect Cunard House, 15 Regent Street, London SW1Y 4LR
SEGRO (Howbury) Limited England & Wales Indirect Cunard House, 15 Regent Street, London SW1Y 4LR
SEGRO (Kettering) Limited England & Wales Indirect Cunard House, 15 Regent Street, London SW1Y 4LR
SEGRO (Lee Park Distribution) Limited England & Wales Indirect Cunard House, 15 Regent Street, London SW1Y 4LR
SEGRO (Loop) Limited England & Wales Indirect Cunard House, 15 Regent Street, London SW1Y 4LR
SEGRO (Lutterworth) Limited England & Wales Indirect Cunard House, 15 Regent Street, London SW1Y 4LR
SEGRO (Nelson Trade Park) Limited England & Wales Indirect Cunard House, 15 Regent Street, London SW1Y 4LR
SEGRO (New Cross Business Centre) Limited England & Wales Indirect Cunard House, 15 Regent Street, London SW1Y 4LR
SEGRO (Newport Pagnell) Limited England & Wales Indirect Cunard House, 15 Regent Street, London SW1Y 4LR
SEGRO (Parc des Damiers) SAS France Indirect 20, rue Brunel, 75017 Paris, France
SEGRO (Purfleet) Limited England & Wales Indirect Cunard House, 15 Regent Street, London SW1Y 4LR
SEGRO (Rainham 1) Limited England & Wales Indirect Cunard House, 15 Regent Street, London SW1Y 4LR
SEGRO (Rainham 2) Limited England & Wales Indirect Cunard House, 15 Regent Street, London SW1Y 4LR
SEGRO (Rainham, Enterprise 1) Limited England & Wales Indirect Cunard House, 15 Regent Street, London SW1Y 4LR
SEGRO (Rainham, Enterprise 2) Limited England & Wales Indirect Cunard House, 15 Regent Street, London SW1Y 4LR
SEGRO (Rockware Avenue) Limited England & Wales Indirect Cunard House, 15 Regent Street, London SW1Y 4LR
SEGRO (Rugby Gateway 1) Limited England & Wales Indirect Cunard House, 15 Regent Street, London SW1Y 4LR
SEGRO (Rugby Gateway 2) Limited England & Wales Indirect Cunard House, 15 Regent Street, London SW1Y 4LR
SEGRO (Rugby Gateway 3) Limited England & Wales Indirect Cunard House, 15 Regent Street, London SW1Y 4LR
SEGRO (Rugby Gateway 4) Limited England & Wales Indirect Cunard House, 15 Regent Street, London SW1Y 4LR
SEGRO (Rugby Gateway 5) Limited England & Wales Indirect Cunard House, 15 Regent Street, London SW1Y 4LR
SEGRO (Stockley Close) Limited England & Wales Indirect Cunard House, 15 Regent Street, London SW1Y 4LR
SEGRO (Trilogy) Management Company Limited England & Wales Indirect Cunard House, 15 Regent Street, London SW1Y 4LR
SEGRO (Tudor) Limited England & Wales Indirect Cunard House, 15 Regent Street, London SW1Y 4LR
SEGRO (UK Logistics) Limited England & Wales Indirect Cunard House, 15 Regent Street, London SW1Y 4LR
SEGRO (Victoria Industrial Estate) Limited England & Wales Indirect Cunard House, 15 Regent Street, London SW1Y 4LR
SEGRO (Watchmoor) Limited England & Wales Indirect Cunard House, 15 Regent Street, London SW1Y 4LR
SEGRO (Welham Green) Limited England & Wales Indirect Cunard House, 15 Regent Street, London SW1Y 4LR
SEGRO (West Zaan) B.V. Netherlands Indirect Gustav Mahlerplein 62, ITO-toren, 8th Floor, 1082MA Amsterdam, Netherlands
SEGRO (Westway Estate) Limited England & Wales Indirect Cunard House, 15 Regent Street, London SW1Y 4LR
28. RELATED UNDERTAKINGS CONTINUED
168
SEGRO PLC | ANNUAL REPORT & ACCOUNTS 2017
FINANCIAL STATEMENTS

Company Name Jurisdiction
% effective holding if not 100% Direct/Indirect Registered Office
SEGRO Achte Grundbesitz GmbH Germany Indirect Fichtenstrasse 33, Düsseldorf 40233, Germany
SEGRO Achtzehnte Grundbesitz GmbH Germany Indirect Fichtenstrasse 33, Düsseldorf 40233, Germany
SEGRO Administration Limited England & Wales Direct Cunard House, 15 Regent Street, London SW1Y 4LR
SEGRO APP 1 Limited England & Wales Indirect Cunard House, 15 Regent Street, London SW1Y 4LR
SEGRO APP 2 Limited England & Wales Indirect Cunard House, 15 Regent Street, London SW1Y 4LR
SEGRO APP 3 Limited England & Wales Indirect Cunard House, 15 Regent Street, London SW1Y 4LR
SEGRO APP 4 Limited England & Wales Indirect Cunard House, 15 Regent Street, London SW1Y 4LR
SEGRO APP Management Limited England & Wales Indirect Cunard House, 15 Regent Street, London SW1Y 4LR
SEGRO Asset Management Limited England & Wales Indirect Cunard House, 15 Regent Street, London SW1Y 4LR
SEGRO B.V. Netherlands Indirect Gustav Mahlerplein 62, ITO-toren, 8th Floor, 1082MA Amsterdam, Netherlands
SEGRO Belgium NV Belgium Indirect Louizalaan 331–333, 1050 Elsene, Belgium
SEGRO Benelux B.V.4 Netherlands Indirect Gustav Mahlerplein 62, ITO-toren, 8th Floor, 1082MA Amsterdam, Netherlands
SEGRO CHUSA Limited England & Wales Indirect Cunard House, 15 Regent Street, London SW1Y 4LR
SEGRO Communities Limited England & Wales Indirect Cunard House, 15 Regent Street, London SW1Y 4LR
SEGRO Czech Republic s.r.o. Czech Republic Indirect Praha 1, Na Pr ıkope 9/392 a 11/393, PSC 110 00, Czech Republic
SEGRO De Hoek B.V. Netherlands Indirect Gustav Mahlerplein 62, ITO-toren, 8th Floor, 1082MA Amsterdam, Netherlands
SEGRO Dreiundzwanzigste Grundbesitz GmbH Germany Indirect Fichtenstrasse 33, Düsseldorf 40233, Germany
SEGRO Dreizehnte Grundbesitz GmbH Germany 94 Indirect Fichtenstrasse 33, Düsseldorf 40233, Germany
SEGRO Dritte Grundbesitz GmbH Germany Indirect Fichtenstrasse 33, Düsseldorf 40233, Germany
SEGRO Einundzwanzigste Grundbesitz GmbH Germany Indirect Fichtenstrasse 33, Düsseldorf 40233, Germany
SEGRO Elfte Grundbesitz GmbH Germany Indirect Fichtenstrasse 33, Düsseldorf 40233, Germany
SEGRO Erste Grundbesitz GmbH Germany Indirect Fichtenstrasse 33, Düsseldorf 40233, Germany
SEGRO Europe Limited England & Wales Indirect Cunard House, 15 Regent Street, London SW1Y 4LR
SEGRO European Logistics Partnership S.à r.l. Luxembourg 50 Indirect 35–37 avenue de la Liberté, L-1931 Luxembourg
SEGRO Finance plc England & Wales Direct Cunard House, 15 Regent Street, London SW1Y 4LR
SEGRO France SA France Indirect 20, rue Brunel, 75017 Paris, France
SEGRO Fünfte Grundbesitz GmbH Germany Indirect Fichtenstrasse 33, Düsseldorf 40233, Germany
SEGRO Fünfundzwanzigste Grundbesitz GmbH Germany Indirect Fichtenstrasse 33, Düsseldorf 40233, Germany
SEGRO Fünfzehnte Grundbesitz GmbH Germany Indirect Fichtenstrasse 33, Düsseldorf 40233, Germany
SEGRO Gennevilliers (SCI) France Indirect 20, rue Brunel, 75017 Paris, France
SEGRO Germany GmbH Germany Indirect Fichtenstrasse 33, Düsseldorf 40233, Germany
SEGRO Glinde B.V. Netherlands Indirect Gustav Mahlerplein 62, ITO-toren, 8th Floor, 1082MA Amsterdam, Netherlands
SEGRO Holdings France SAS France Indirect 20, rue Brunel, 75017 Paris, France
SEGRO Industrial Estates Limited England & Wales Indirect Cunard House, 15 Regent Street, London SW1Y 4LR
SEGRO Industrial Nederland B.V. Netherlands Indirect Gustav Mahlerplein 62, ITO-toren, 8th Floor, 1082MA Amsterdam, Netherlands
SEGRO Insurance Limited Isle Of Man Direct Third Floor, St George’s Court, Upper Church Street, Douglas IM1 1EE, Isle of Man
SEGRO Investments Limited England & Wales Indirect Cunard House, 15 Regent Street, London SW1Y 4LR
SEGRO Investments Spain, SL Spain Direct Calle Conde de Aranda 22 5° Izquierda, Madrid, 28001 Spain
28. RELATED UNDERTAKINGS CONTINUED
OVERVIEW STRATEGIC REPORT GOVERNANCE FINANCIAL STATEMENTS
169

NOTES TO THE FINANCIAL STATEMENTS CONTINUED
FOR THE YEAR ENDED 31 DECEMBER 2017
Company Name Jurisdiction
% effective holding if not 100% Direct/Indirect Registered Office
SEGRO ITALY S.R.L. Italy Indirect Strada 3 Palazzo B3, 20090 Assago (Milano) Italy
SEGRO Kontich NV Belgium Indirect Louizalaan 331–333, 1050 Elsene, Belgium
SEGRO Logistics Park Aulnay SCI France Indirect 20, rue Brunel, 75017 Paris, France
SEGRO Logistics Properties Spain, SL Spain Direct Avenida Diagonal, 467, 6º2º, 08036 Barcelona, Spain
SEGRO Luge S.à r.l. Luxembourg Indirect 5 rue Guillaume Kroll, Luxembourg, L-1882 Luxembourg
SEGRO Luxembourg S.à r.l. Luxembourg Indirect 35–37 avenue de la Liberté, L-1931 Luxembourg
SEGRO Lyon 1 SCI France Indirect 20, rue Brunel, 75017 Paris, France
SEGRO Lyon 2 SCI France Indirect 20, rue Brunel, 75017 Paris, France
SEGRO Lyon Holding SAS France Indirect 20, rue Brunel, 75017 Paris, France
SEGRO Management Limited England & Wales Indirect Cunard House, 15 Regent Street, London SW1Y 4LR
SEGRO Management NV Belgium Indirect Louizalaan 331–333, 1050 Elsene, Belgium
SEGRO Netherlands B.V. Netherlands Indirect Gustav Mahlerplein 62, ITO-toren, 8th Floor, 1082MA Amsterdam, Netherlands
SEGRO Netherlands Holding B.V. Netherlands Indirect Gustav Mahlerplein 62, ITO-toren, 8th Floor, 1082MA Amsterdam, Netherlands
SEGRO Neunte Grundbesitz GmbH Germany Indirect Fichtenstrasse 33, Düsseldorf 40233, Germany
SEGRO Neunzehnte Grundbesitz GmbH Germany Indirect Fichtenstrasse 33, Düsseldorf 40233, Germany
SEGRO Overseas Holdings Limited England & Wales Direct Cunard House, 15 Regent Street, London SW1Y 4LR
SEGRO Pension Scheme Trustees Limited England & Wales Indirect Cunard House, 15 Regent Street, London SW1Y 4LR
SEGRO plc French Branch France Direct 20, rue Brunel, 75017 Paris, France
SEGRO Plessis (SCI) France Indirect 20, rue Brunel, 75017 Paris, France
SEGRO Poland Sp. z.o.o. Poland Indirect Pl. Andersa 3, 61-894 Poznan, Poland
SEGRO Properties Limited England & Wales Direct Cunard House, 15 Regent Street, London SW1Y 4LR
SEGRO Properties Spain SL Spain Direct Calle Conde de Aranda 22 5° Izquierda, Madrid, 28001 Spain
SEGRO Reisholz GmbH Germany Indirect Fichtenstrasse 33, Düsseldorf 40233, Germany
SEGRO Sechste Grundbesitz GmbH Germany Indirect Fichtenstrasse 33, Düsseldorf 40233, Germany
SEGRO Sechzehnte Grundbesitz GmbH Germany Indirect Fichtenstrasse 33, Düsseldorf 40233, Germany
SEGRO Siebte Grundbesitz GmbH Germany Indirect Fichtenstrasse 33, Düsseldorf 40233, Germany
SEGRO Siebzehnte Grundbesitz GmbH Germany Indirect Fichtenstrasse 33, Düsseldorf 40233, Germany
SEGRO Spain Management, S.L. Spain Indirect Calle Conde de Aranda 22 5° Izquierda, Madrid, 28001 Spain
SEGRO Spain Spare 1 S.L.U. Spain Indirect Avenida Diagonal, 467, 6º2º, 08036 Barcelona, Spain
SEGRO Spain Spare 2 S.L.U. Spain Indirect Avenida Diagonal, 467, 6º2º, 08036 Barcelona, Spain
SEGRO Spain Spare 3 S.L.U. Spain Indirect Avenida Diagonal, 467, 6º2º, 08036 Barcelona, Spain
SEGRO Trading (France) SNC France Indirect 20, rue Brunel, 75017 Paris, France
SEGRO Vierte Grundbesitz GmbH Germany Indirect Fichtenstrasse 33, Düsseldorf 40233, Germany
SEGRO Vierundzwanzigste Grundbesitz GmbH Germany Indirect Fichtenstrasse 33, Düsseldorf 40233, Germany
SEGRO Vierzehnte Grundbesitz GmbH Germany Indirect Fichtenstrasse 33, Düsseldorf 40233, Germany
SEGRO Wissous (SCI) France Indirect 20, rue Brunel, 75017 Paris, France
SEGRO Zehnte Grundbesitz GmbH Germany Indirect Fichtenstrasse 33, Düsseldorf 40233, Germany
SEGRO Zwanzigste Grundbesitz GmbH Germany Indirect Fichtenstrasse 33, Düsseldorf 40233, Germany
SEGRO Zweite Grundbesitz GmbH Germany Indirect Fichtenstrasse 33, Düsseldorf 40233, Germany
SEGRO Zweiundzwanzigste Grundbesitz GmbH Germany Indirect Fichtenstrasse 33, Düsseldorf 40233, Germany
SEGRO Zwölfte Grundbesitz GmbH Germany Indirect Fichtenstrasse 33, Düsseldorf 40233, Germany
28. RELATED UNDERTAKINGS CONTINUED
170
SEGRO PLC | ANNUAL REPORT & ACCOUNTS 2017
FINANCIAL STATEMENTS

Company Name Jurisdiction
% effective holding if not 100% Direct/Indirect Registered Office
SELL INVEST ITALY S.R.L. Italy Indirect Strada 3 Palazzo B3, 20090 Assago (Milano) Italy
SELP (Alpha JV) S.à r.l. Luxembourg 50 Indirect 35–37 avenue de la Liberté, L-1931 Luxembourg
SELP Finance S.à r.l. Luxembourg 50 Indirect 35–37 avenue de la Liberté, L-1931 Luxembourg
SELP Investments S.à r.l. Luxembourg 50 Indirect 35–37 avenue de la Liberté, L-1931 Luxembourg
SELP Management Limited England & Wales Indirect Cunard House, 15 Regent Street, London SW1Y 4LR
Severnside Distribution Park (Bristol) Management Limited
England & Wales Indirect Cunard House, 15 Regent Street, London SW1Y 4LR
SG Austria Brunnerstrasse GmbH Austria Indirect c/o ECOVIS Austrail Wirtschaftsprüfungs, und Steuerberatungsgesellschaft m.b.H., 1060 Wien, Schmalzhofgasse 4, Austria
Slough Trading Estate Limited England & Wales Direct Cunard House, 15 Regent Street, London SW1Y 4LR
TENEDOR S.R.L. Italy Indirect Strada 3 Palazzo B3, 20090 Assago (Milano) Italy
The UK Logistics (Nominee 1) Limited England & Wales Indirect Cunard House, 15 Regent Street, London SW1Y 4LR
The UK Logistics (Nominee 2) Limited England & Wales Indirect Cunard House, 15 Regent Street, London SW1Y 4LR
The UK Logistics General Partner Limited England & Wales Indirect Cunard House, 15 Regent Street, London SW1Y 4LR
The UK Logistics Limited Partnership England & Wales Indirect Cunard House, 15 Regent Street, London SW1Y 4LR
Trafford Park Estates Limited England & Wales Indirect Cunard House, 15 Regent Street, London SW1Y 4LR
UK Logistics Fund Unit Trust Jersey Indirect Ogier House, The Esplanade, St Helier JE4 9WG, Jersey
UK Logistics Properties No 1 Unit Trust Jersey Indirect Ogier House, The Esplanade, St Helier JE4 9WG, Jersey
UK Logistics Properties No 2 Unit Trust Jersey Indirect Ogier House, The Esplanade, St Helier JE4 9WG, Jersey
UK Logistics Trustee Limited Jersey Indirect Ogier House, The Esplanade, St Helier JE4 9WG, Jersey
Unitair General Partner Limited England & Wales Indirect Cunard House, 15 Regent Street, London SW1Y 4LR
Unitair Limited Partnership England & Wales Indirect Cunard House, 15 Regent Street, London SW1Y 4LR
Vailog Bonneuil SARL France 90 Indirect 47 rue de Ponthieu, 75008 Paris, France
Vailog Energy 1 S.R.L. Italy 90 Indirect Strada 3 Palazzo B3, 20090 Assago (Milano) Italy
Vailog Energy 2 S.R.L. Italy 90 Indirect Strada 3 Palazzo B3, 20090 Assago (Milano) Italy
Vailog Energy 3 S.R.L. Italy 90 Indirect Strada 3 Palazzo B3, 20090 Assago (Milano) Italy
Vailog Holding France France 90 Indirect 47 rue de Ponthieu, 75008 Paris, France
Vailog S.R.L. Italy 90 Indirect Strada 3 Palazzo B3, 20090 Assago (Milano) Italy
Vailpar B.V. Netherlands 90 Indirect Herengracht 289D, 1016 BL Amsterdam, Netherlands
Voyager Park South Management Company Limited3 England & Wales 88.49 Indirect Cunard House, 15 Regent Street, London SW1Y 4LR
Warth Park (No. 1) Limited England & Wales Indirect Cunard House, 15 Regent Street, London SW1Y 4LR
Woodside GP Limited England & Wales Indirect Cunard House, 15 Regent Street, London SW1Y 4LR
Wroclaw Industrial Park Sp. z.o.o Poland Indirect Pl. Andersa 3, 61-894 Poznan, Poland
ZINC FIVE S.R.L. Italy Indirect Strada 3 Palazzo B3, 20090 Assago (Milano) Italy
ZINC FOUR S.R.L. Italy Indirect Strada 3 Palazzo B3, 20090 Assago (Milano) Italy
ZINC ONE S.R.L. Italy Indirect Strada 3 Palazzo B3, 20090 Assago (Milano) Italy
ZINC SEVEN S.R.L Italy Indirect Strada 3 Palazzo B3, 20090 Assago (Milano) Italy
ZINC SIX S.R.L. Italy Indirect Strada 3 Palazzo B3, 20090 Assago (Milano) Italy
ZINC THREE S.R.L. Italy Indirect Strada 3 Palazzo B3, 20090 Assago (Milano) Italy
ZINC TWO S.R.L. Italy Indirect Strada 3 Palazzo B3, 20090 Assago (Milano) Italy
1 Ownership held in class A and B shares.
2 Ownership held in class of ordinary shares and deferred shares.
3 Ownership held in class of A shares.
4 Ownership held in class of G shares, K shares, S shares and preference shares.
5 Company in liquidation.
6 Company registered in the Isle of Man. Isle of Man registered office address is 1st Floor, Rose House, 51-59 Circular Road, Douglas, Isle of Man.
28. RELATED UNDERTAKINGS CONTINUED
OVERVIEW STRATEGIC REPORT GOVERNANCE FINANCIAL STATEMENTS
171

NOTES TO THE FINANCIAL STATEMENTS CONTINUED
FOR THE YEAR ENDED 31 DECEMBER 2017
SUPPLEMENTARY NOTES NOT PART OF AUDITED FINANCIAL STATEMENTS
Table 1: EPRA performance measures summary2017 2016
Notes £mPence
per share £mPence
per share
EPRA Earnings Table 2 192.8 19.9 152.6 18.8
EPRA NAV Table 3 5,607.7 556 4,162.1 478
EPRA NNNAV 12 5,416.0 537 3,822.6 439
EPRA net initial yield Table 4 4.3% 4.8%
EPRA ‘topped-up’ net initial yield Table 4 4.8% 5.3%
EPRA vacancy rate Table 5 4.0% 5.7%
EPRA cost ratio (including vacant property costs) Table 6 24.6% 23.0%
EPRA cost ratio (excluding vacant property costs) Table 6 22.1% 20.8%
Table 2: Income Statement, proportionally consolidated2017 2016
NotesGroup
£mJoint ventures
£mTotal
£mGroup
£mJoint ventures
£mTotal £m1
Gross rental income 2,7 272.9 73.7 346.6 225.5 82.7 308.2
Property operating expenses 2,7 (52.2) (3.9) (56.1) (44.9) (3.9) (48.8)
Net rental income 220.7 69.8 290.5 180.6 78.8 259.4
Joint venture management fee income² 2 24.3 (11.3) 13.0 18.6 (8.7) 9.9
Administration expenses 2,7 (39.7) (0.9) (40.6) (31.4) (0.8) (32.2)
Operating profit before interest and tax 205.3 57.6 262.9 167.8 69.3 237.1
Net finance costs (including adjustments) 2,7 (58.7) (6.2) (64.9) (68.7) (12.2) (80.9)
Profit before tax 146.6 51.4 198.0 99.1 57.1 156.2
Tax on EPRA earnings 2,7 (1.2) (3.8) (5.0) (1.8) (1.7) (3.5)
EPRA earnings 145.4 47.6 193.0 97.3 55.4 152.7
Less: non-controlling interest on EPRA earnings 2,7 (0.2) – (0.2) (0.1) – (0.1)
EPRA earnings after non-controlling interest 145.2 47.6 192.8 97.2 55.4 152.6
Number of shares, million 12 967.3 809.9
EPRA EPS, pence per share – basic 12 19.9 18.8
Number of shares 972.8 814.5
EPRA EPS, pence per share – diluted 12 19.8 18.7
1 Prior to the re-presentation in Note 12 (i) the number of shares million for 31 December 2016 was 774.3 and 778.7 (diluted). The EPS was 19.7 (basic) and 19.6 (diluted).
2 Joint venture management fee income includes the cost of such fees borne by the joint ventures which are shown in Note 7 within net rental income.
172
SEGRO PLC | ANNUAL REPORT & ACCOUNTS 2017
FINANCIAL STATEMENTS

SUPPLEMENTARY NOTES NOT PART OF AUDITED FINANCIAL STATEMENTS CONTINUED
Table 3: Balance Sheet, proportionally consolidated2017 2016
NotesGroup
£mJoint ventures
£mTotal
£mGroup
£mJoint ventures
£mTotal£m²
Investment properties 13,7 6,745.4 1,280.2 8,025.6 4,714.4 1,605.0 6,319.4
Trading properties 13,7 12.5 0.6 13.1 25.4 0.6 26.0
Total properties 6,757.9 1,280.8 8,038.7 4,739.8 1,605.6 6,345.4
Investment in joint ventures 7 792.0 (792.0) – 1,066.2 (1,066.2) –
Other net liabilities (10.3) (45.3) (55.6) (25.5) (46.8) (72.3)
Net borrowings 16,7 (1,954.2) (443.5) (2,397.7) (1,598.4) (492.6) (2,091.0)
Total shareholders’ equity1 5,585.4 – 5,585.4 4,182.1 – 4,182.1
EPRA adjustments 12 22.3 (20.0)
EPRA NAV 12 5,607.7 4,162.1
Number of shares, million 12 1,007.7 871.5
EPRA NAV, pence per share 12 556 478
1 After non-controlling interests.
2 Prior to the re-presentation in Note 12 (i) the shares million for 31 December 2016 was 833.2 and the EPRA NAV was 500.
Note: Loan to value of 29.8 per cent is calculated as net borrowings of £2,397.7 million divided by total properties £8,038.7 million (2016: 33 per cent; £2,091.0 million net borrowings; £6,345.4 million total properties).
Table 4: EPRA net initial yield and topped-up net initial yield
Combined property portfolio including joint ventures at share – 2017 NotesUK £m
Continental Europe
£mTotal
£m
Total properties per financial statements Table 3 5,510.3 2,528.4 8,038.7
Add valuation surplus not recognised on trading properties¹ – – –
Combined property portfolio per external valuers’ reports 5,510.3 2,528.4 8,038.7
Less development properties (investment, trading and joint ventures) (451.6) (426.7) (878.3)
Net valuation of completed properties 5,058.7 2,101.7 7,160.4
Add notional purchasers’ costs 340.9 99.8 440.7
Gross valuation of completed properties including notional purchasers’ costs A 5,399.6 2,201.5 7,601.1
£m £m £m
Income
Gross passing rent² 213.1 122.5 335.6
Less irrecoverable property costs (3.0) (5.4) (8.4)
Net passing rent B 210.1 117.1 327.2
Adjustment for notional rent in respect of rent frees 18.3 16.3 34.6
Topped up net rent C 228.4 133.4 361.8
Including fixed/minimum uplifts4 9.0 1.1 10.1
Total topped up net rent 237.4 134.5 371.9
Yields – 2017 UK %
Continental Europe
%Total
%
EPRA net initial yield³ B/A 3.9 5.3 4.3
EPRA topped-up net initial yield³ C/A 4.2 6.1 4.8
Net true equivalent yield 5.0 6.0 5.3
1 Trading properties are recorded in the Financial Statements at the lower of cost and net realisable value, therefore valuations above cost have not been recognised.
2 Gross passing rent excludes short-term lettings and licences.
3 In accordance with the Best Practices Recommendations of EPRA.
4 Certain leases contain clauses which guarantee future rental increases, whereas most leases contain five yearly, upwards only rent review clauses (UK) or indexation clauses (Continental Europe).
OVERVIEW STRATEGIC REPORT GOVERNANCE FINANCIAL STATEMENTS
173

NOTES TO THE FINANCIAL STATEMENTS CONTINUED
FOR THE YEAR ENDED 31 DECEMBER 2017
SUPPLEMENTARY NOTES NOT PART OF AUDITED FINANCIAL STATEMENTS CONTINUED
Table 5: EPRA vacancy rate
2017
£m2016
£m
Annualised potential rental value of vacant premises 16.0 20.3
Annualised potential rental value for the completed property portfolio 401.2 354.0
EPRA vacancy rate 4.0% 5.7%
Table 6: EPRA cost ratio/Total cost ratio
EPRA cost ratio Notes2017
£m2016
£m
Costs
Property operating expenses¹ 5 52.2 44.9
Administration expenses 6 39.7 31.4
Share of joint venture property operating and administration expenses² 7 11.8 13.1
Less:
Joint venture property management fee income and management fees3 (19.1) (18.9)
Total costs (A) 84.6 70.5
Group vacant property costs 5 (7.6) (5.6)
Share of joint venture vacant property costs 7 (0.9) (1.1)
Total costs excluding vacant property costs (B) 76.1 63.8
Gross rental income
Gross rental income 4 272.9 225.5
Share of joint venture property gross rental income 7 73.7 82.7
Less:
Management fees3 (2.3) (1.2)
Total gross rental income (C) 344.3 307.0
Total EPRA cost ratio (including vacant property costs) (A)/(C) 24.6% 23.0%
Total EPRA cost ratio (excluding vacant property costs) (B)/(C) 22.1% 20.8%
Total costs (A) 84.6 70.5
Share based payments 6 (10.0) (6.1)
Total costs after share based payments (D) 74.6 64.4
Total gross rental income (C) 344.3 307.0
Total cost ratio after share based payments (D)/(C) 21.7% 21.0%
1 Property operating expenses are net of costs capitalised in accordance with IFRS of £4.2 million (2016: £3.6 million) (see Note 5 for further detail on the nature of costs capitalised).
2 Share of joint venture property operating and administration expenses after deducting costs related to performance and other fees.
3 Includes joint venture management fees income of £16.8 million (2016: £17.7 million) and management fees, including joint ventures, of £2.3 million (2016: £1.2 million) which have been represented as an offset against costs rather than a component of income in accordance with EPRA BPR Guidelines as they are reimbursing the Group for costs incurred.
174
SEGRO PLC | ANNUAL REPORT & ACCOUNTS 2017
FINANCIAL STATEMENTS

SUPPLEMENTARY NOTES NOT PART OF AUDITED FINANCIAL STATEMENTS CONTINUED
Table 7: EPRA capital expenditure analysis2017 2016
Wholly owned
£m
Joint ventures
£mTotal
£m
Wholly owned
£m
Joint ventures
£mTotal £m
Acquisitions 1,212.21 82.2 1,294.4 254.21 105.1 359.3
Development4 368.32 45.8 414.1 265.42 36.2 301.6
Completed properties4 19.73 4.6 24.3 17.43 4.6 22.0
Other5 16.7 4.7 21.4 19.8 6.8 26.6
Total 1,616.9 137.3 1,754.2 556.8 152.7 709.5
1 Being £1,212.2 million investment property (including £1,112.6 million in respect of the APP property portfolio) and £nil trading property (2016: £254.2 million and £nil million respectively) see Note 13.
2 Being £367.8 million investment property and £0.5 million trading property (2016: £261.6 million and £3.8 million respectively) see Note 13.
3 Being £19.7 million investment property and £nil million trading property (2016: £17.2 million and £0.4 million respectively) see Note 13.
4 Includes wholly-owned capitalised interest of £6.6 million (2016: £5.0 million) as further analysed in Note 9 and share of joint venture capitalised interest of £0.8 million (2016: £0.8 million).
5 Tenant incentives, letting fees and rental guarantees.
Table 8: Like-for-like net rental income
(including JVs at share)2017
£m2016
£mChange
%
UK 154.9 147.4 5.1
Continental Europe 68.9 70.7 (2.5)
Like-for-like net rental income 223.8 218.1 2.6
Other1 (4.8) (3.6)
Like-for-like net rental income (after other) 219.0 214.5 2.1
Development lettings 27.1 6.7
Properties taken back for development 0.2 1.7
Like-for-like net rental income plus developments 246.3 222.9
Properties acquired 22.6 2.7
Properties sold 13.9 32.7
Net rental income before surrenders, dilapidations and exchange 282.8 258.3
Lease surrender premiums and dilapidation income 1.8 1.8
Other items and rent lost from lease surrenders 5.9 5.5
Impact of exchange rate difference between periods – (6.2)
Net rental income (including joint ventures at share) 290.5 259.4
SEGRO share of joint venture fees (11.3) (8.7)
Net rental income after SEGRO share of joint venture fees 279.2 250.7
1 Other includes the corporate centre and other costs relating to the operational business which are not specifically allocated to a geographical business unit.
OVERVIEW STRATEGIC REPORT GOVERNANCE FINANCIAL STATEMENTS
175

NOTES TO THE FINANCIAL STATEMENTS CONTINUED
FOR THE YEAR ENDED 31 DECEMBER 2017
Table 9: Top 10 estates as at 31 December 2017 (by value, including joint ventures at share)
UK Ownership Location
Lettable area (100%)
sq m
Headline rent £m
Vacancy by ERV
%WAULT
years¹ Asset type
Slough Trading Estate 100 Slough 503,210 64.1 3.2 8.6 Multi-let urban warehouse estate
Heathrow Cargo Area (Shoreham Road)
100 Heathrow 94,154 10.6 0.0 4.6 Multi-let cargo facility
Premier Park 100 Park Royal 78,431 10.1 1.7 5.1 Multi-let urban warehouse estate
Greenford Park 100 Park Royal 79,507 10.0 0.0 6.8 Multi-let urban warehouse estate
SEGRO Logistics Park Rugby Gateway 100 Midlands 113,413 8.5 0.0 10.9 Big box warehouse park
North Feltham Trading Estate 100 Heathrow 65,993 6.7 22.0 4.9 Multi-let urban warehouse estate
Metropolitan Park 100 Park Royal 70,003 7.1 5.2 3.1 Multi-let urban warehouse estate
Axis Park 100 Heathrow 61,753 8.1 0.0 3.2 Multi-let urban warehouse estate
BA World Cargo Centre 100 Heathrow n/a n/a2 0.0 33.3 Single-let cargo facility
SEGRO Logistics Park East Midlands Gateway
100 Midlands n/a n/a n/a n/a Development site
Continental Europe
SEGRO Logistics Park Krefeld-Süd 50 Germany 191,644 4.7 0.0 6.7 Big box warehouse park
VAILOG DC1 Rome 100 Italy 158,373 n/a² 0.0 14.6 Single-let big box warehouse
SEGRO Park Düsseldord-Sud 100 Germany 79,921 5.0 0.0 7.1 Multi-let urban warehouse estate
SEGRO Logistics Park Poznan, Komorniki
50 Poland 206,834 4.5 0.3 7.1 Big box warehouse park
SEGRO Logistics Park Stryków 50 Poland 227,020 4.2 0.6 3.9 Big box warehouse park
SEGRO Logistics Park Gliwice 50 Poland 223,751 4.3 13.3 3.7 Big box warehouse park
SEGRO Business Park Le Blanc-Mesnil 100 France 37,847 3.9 0.0 3.0 Multi-let urban warehouse estate
VAILOG Interporto Bologna 50/100 Italy 71,918 2.6 0.0 9.9 Big box warehouse park
SEGRO Logistics Park Prague 50/100 Czech Republic
139,668 3.2 5.5 3.1 Big box warehouse park
SEGRO Logistics Park Aulnay 100 France n/a n/a n/a n/a Development site
1 Weighted average unexpired lease term to earlier of break of expiry.
2 Confidential.
176
SEGRO PLC | ANNUAL REPORT & ACCOUNTS 2017
FINANCIAL STATEMENTS
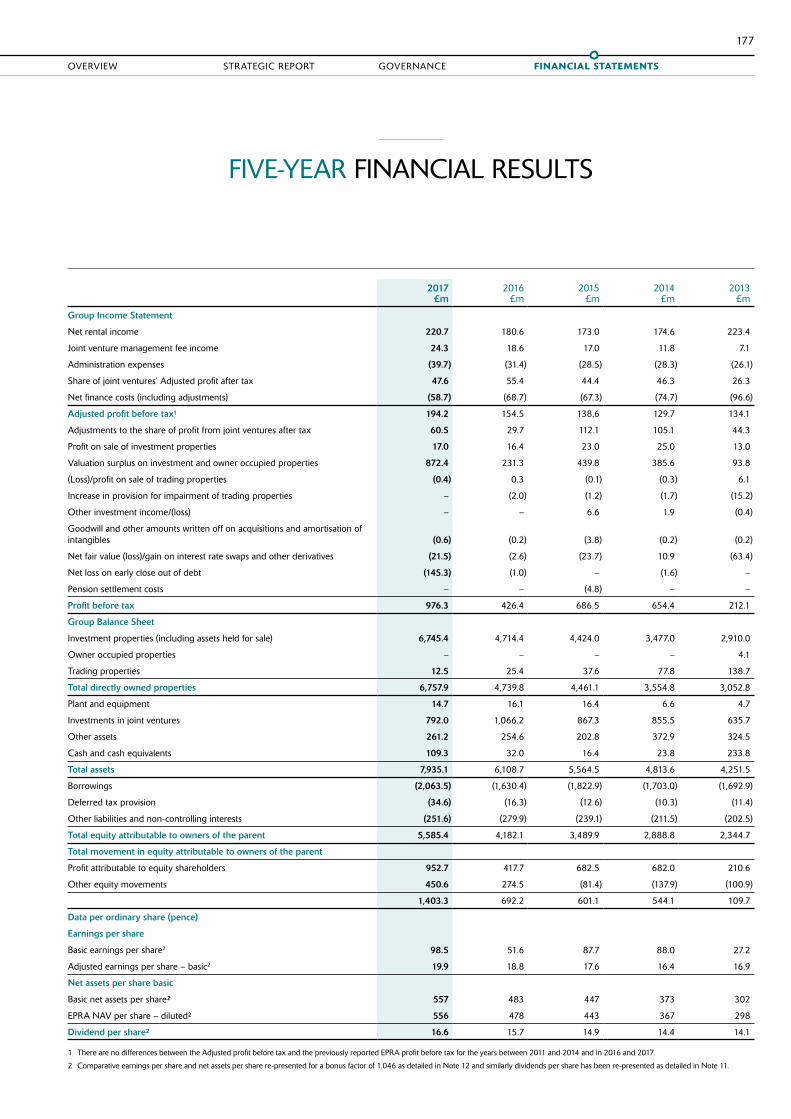
FIVE-YEAR FINANCIAL RESULTS
2017
£m2016
£m2015
£m2014
£m2013
£m
Group Income Statement
Net rental income 220.7 180.6 173.0 174.6 223.4
Joint venture management fee income 24.3 18.6 17.0 11.8 7.1
Administration expenses (39.7) (31.4) (28.5) (28.3) (26.1)
Share of joint ventures’ Adjusted profit after tax 47.6 55.4 44.4 46.3 26.3
Net finance costs (including adjustments) (58.7) (68.7) (67.3) (74.7) (96.6)
Adjusted profit before tax¹ 194.2 154.5 138.6 129.7 134.1
Adjustments to the share of profit from joint ventures after tax 60.5 29.7 112.1 105.1 44.3
Profit on sale of investment properties 17.0 16.4 23.0 25.0 13.0
Valuation surplus on investment and owner occupied properties 872.4 231.3 439.8 385.6 93.8
(Loss)/profit on sale of trading properties (0.4) 0.3 (0.1) (0.3) 6.1
Increase in provision for impairment of trading properties – (2.0) (1.2) (1.7) (15.2)
Other investment income/(loss) – – 6.6 1.9 (0.4)
Goodwill and other amounts written off on acquisitions and amortisation of intangibles (0.6) (0.2) (3.8) (0.2) (0.2)
Net fair value (loss)/gain on interest rate swaps and other derivatives (21.5) (2.6) (23.7) 10.9 (63.4)
Net loss on early close out of debt (145.3) (1.0) – (1.6) –
Pension settlement costs – – (4.8) – –
Profit before tax 976.3 426.4 686.5 654.4 212.1
Group Balance Sheet
Investment properties (including assets held for sale) 6,745.4 4,714.4 4,424.0 3,477.0 2,910.0
Owner occupied properties – – – – 4.1
Trading properties 12.5 25.4 37.6 77.8 138.7
Total directly owned properties 6,757.9 4,739.8 4,461.1 3,554.8 3,052.8
Plant and equipment 14.7 16.1 16.4 6.6 4.7
Investments in joint ventures 792.0 1,066.2 867.3 855.5 635.7
Other assets 261.2 254.6 202.8 372.9 324.5
Cash and cash equivalents 109.3 32.0 16.4 23.8 233.8
Total assets 7,935.1 6,108.7 5,564.5 4,813.6 4,251.5
Borrowings (2,063.5) (1,630.4) (1,822.9) (1,703.0) (1,692.9)
Deferred tax provision (34.6) (16.3) (12.6) (10.3) (11.4)
Other liabilities and non-controlling interests (251.6) (279.9) (239.1) (211.5) (202.5)
Total equity attributable to owners of the parent 5,585.4 4,182.1 3,489.9 2,888.8 2,344.7
Total movement in equity attributable to owners of the parent
Profit attributable to equity shareholders 952.7 417.7 682.5 682.0 210.6
Other equity movements 450.6 274.5 (81.4) (137.9) (100.9)
1,403.3 692.2 601.1 544.1 109.7
Data per ordinary share (pence)
Earnings per share
Basic earnings per share2 98.5 51.6 87.7 88.0 27.2
Adjusted earnings per share – basic2 19.9 18.8 17.6 16.4 16.9
Net assets per share basic
Basic net assets per share² 557 483 447 373 302
EPRA NAV per share – diluted² 556 478 443 367 298
Dividend per share² 16.6 15.7 14.9 14.4 14.1
1 There are no differences between the Adjusted profit before tax and the previously reported EPRA profit before tax for the years between 2011 and 2014 and in 2016 and 2017.
2 Comparative earnings per share and net assets per share re-presented for a bonus factor of 1.046 as detailed in Note 12 and similarly dividends per share has been re-presented as detailed in Note 11.
OVERVIEW STRATEGIC REPORT GOVERNANCE FINANCIAL STATEMENTS
177
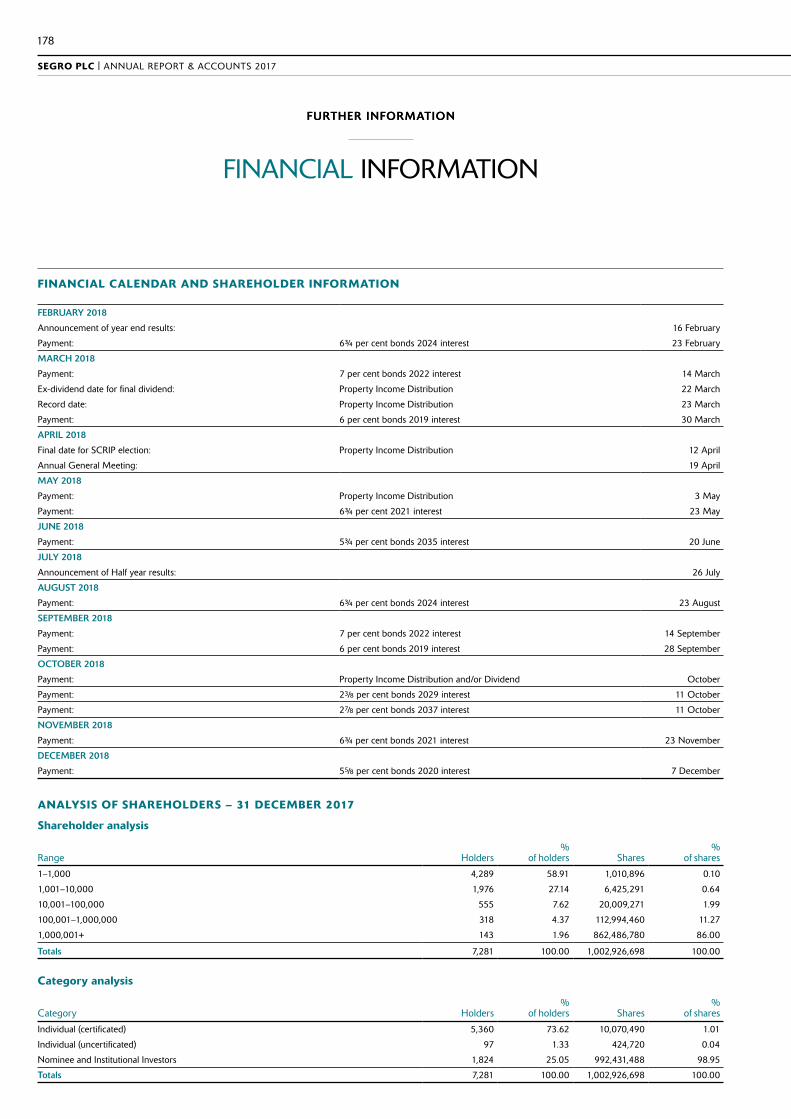
FINANCIAL INFORMATION
FINANCIAL CALENDAR AND SHAREHOLDER INFORMATION
FEBRUARY 2018
Announcement of year end results: 16 February
Payment: 6¾ per cent bonds 2024 interest 23 February
MARCH 2018
Payment: 7 per cent bonds 2022 interest 14 March
Ex-dividend date for final dividend: Property Income Distribution 22 March
Record date: Property Income Distribution 23 March
Payment: 6 per cent bonds 2019 interest 30 March
APRIL 2018
Final date for SCRIP election: Property Income Distribution 12 April
Annual General Meeting: 19 April
MAY 2018
Payment: Property Income Distribution 3 May
Payment: 6¾ per cent 2021 interest 23 May
JUNE 2018
Payment: 5¾ per cent bonds 2035 interest 20 June
JULY 2018
Announcement of Half year results: 26 July
AUGUST 2018
Payment: 6¾ per cent bonds 2024 interest 23 August
SEPTEMBER 2018
Payment: 7 per cent bonds 2022 interest 14 September
Payment: 6 per cent bonds 2019 interest 28 September
OCTOBER 2018
Payment: Property Income Distribution and/or Dividend October
Payment: 23/8 per cent bonds 2029 interest 11 October
Payment: 27/8 per cent bonds 2037 interest 11 October
NOVEMBER 2018
Payment: 6¾ per cent bonds 2021 interest 23 November
DECEMBER 2018
Payment: 55/8 per cent bonds 2020 interest 7 December
ANALYSIS OF SHAREHOLDERS – 31 DECEMBER 2017
Shareholder analysis
Range Holders%
of holders Shares%
of shares
1–1,000 4,289 58.91 1,010,896 0.10
1,001–10,000 1,976 27.14 6,425,291 0.64
10,001–100,000 555 7.62 20,009,271 1.99
100,001–1,000,000 318 4.37 112,994,460 11.27
1,000,001+ 143 1.96 862,486,780 86.00
Totals 7,281 100.00 1,002,926,698 100.00
Category analysis
Category Holders%
of holders Shares%
of shares
Individual (certificated) 5,360 73.62 10,070,490 1.01
Individual (uncertificated) 97 1.33 424,720 0.04
Nominee and Institutional Investors 1,824 25.05 992,431,488 98.95
Totals 7,281 100.00 1,002,926,698 100.00
178
SEGRO PLC | ANNUAL REPORT & ACCOUNTS 2017
FURTHER INFORMATIONFURTHER INFORMATION

SHAREHOLDER INFORMATION
USEFUL HISTORICAL INFORMATION
Share history of the Company £ On 20 August 2007, the ordinary share capital was consolidated on the basis of 12 new ordinary shares of 271/12 pence for every 13 ordinary shares of 25 pence held on the 17 August 2007. A special dividend of 53 pence per share was paid in connection with the consolidation on 31 August 2007.
£ On 4 March 2009, a rights issue was announced on the basis of 12 new ordinary shares for every existing share held on 17 March 2009 at a subscription price of 10 pence per share. Each 271/12 pence ordinary share in issue was sub-divided and re-classified into one ordinary share of one pence each and one deferred share of 261/12 pence each. The deferred shares were created for technical reasons in order to maintain the aggregate nominal value of the Company’s share capital upon sub-division of its ordinary shares. The very limited rights attached to the deferred shares rendered them effectively valueless and they were cancelled on 8 May 2009.
£ In relation to the acquisition of Brixton plc, on 24 August 2009, SEGRO plc undertook a share consolidation, open offer and private placing. On 31 July 2009, every 10 ordinary shares of one pence each were consolidated into one ordinary share of 10 pence each and, 0.10484 open offer shares of 10 pence each were offered to every shareholder of SEGRO plc who, on 13 July 2009, held 10 ordinary shares of one pence each. The acquisition of Brixton was conducted by a scheme of arrangement. Brixton shareholders were offered 0.175 consideration shares of 10 pence each in SEGRO plc for each Brixton share held.
£ On 2 September 2016, the Company placed 74,770,950 new ordinary shares at a price of 435 pence by way of an equity placing. The shares were issued and admitted to the Official List of the Financial Conduct Authority and to trading on the main market for listed securities of the London Stock Exchange plc on 6 September 2016. Total gross proceeds of approximately £325m were raised from the placing.
£ On 10 March 2017, a Rights Issue was announced on the basis of one new share for every five shares held on 8 March 2017 at a subscription price of 345 pence per share. 166,033,133 new ordinary shares were issued and admitted to the Official List of the Financial Conduct Authority and to trading on the main market for listed securities of the London Stock Exchange plc on 28 March 2017. Total gross proceedings of approximately £573m were raised from the Rights Issue.
Shareholder enquiriesIf you have any questions about your shareholding or if you require further guidance (e.g. to notify a change of address) please contact our Registrar, Equiniti Limited, Aspect House, Spencer Road, Lancing, West Sussex BN99 6DA, telephone +44 (0)371 384 2186. Alternatively, you can check your shareholding and access dividend information by registering at www.shareview.co.uk, or you can securely send queries via the website by visiting https://help.shareview.co.uk.
Electronic communicationsShareholders have the opportunity to elect to receive shareholder communications electronically, e.g. Annual Reports, Notice of the Annual General Meeting and Proxy Forms. You can elect to receive email notifications of shareholder communications by registering at www.shareview.co.uk where you can also set up a bank mandate to receive dividends directly to your bank account and to submit proxy votes for shareholder meetings. Receiving the Company’s communications electronically allows the Company to communicate with its shareholders in a more environmentally friendly, cost effective and timely manner.
AGM The 2018 AGM will be held on 19 April 2018 at RSA House, 8 John Adam Street, London WC2N 6EZ.
ShareGiftShareGift is a charity (registered under the name The Orr Mackintosh Foundation, registered charity number 1052686) which specialises in accepting donations of small numbers of shares which are uneconomic to sell on their own. Shares which have been donated to ShareGift are aggregated and sold when practicable, with the proceeds passed on to a wide range of UK charities. ShareGift can also help with larger donations of shares. Further details about ShareGift can be obtained from its website at www.sharegift.org or by writing to ShareGift at 17 Carlton House Terrace, London, SW1Y 5AH, telephone: +44 (0)207 930 3737.
Dividends A requirement of the REIT regime is that a REIT must distribute to shareholders by way of dividend at least 90 per cent of its profits from its tax-exempt UK property rental business (calculated under UK tax principles after the deduction of interest and capital allowances and excluding chargeable gains). Such distributions are referred to as Property Income Distributions, or PIDs. Any further distributions may be paid as ordinary dividends, which are derived from profits earned by its UK, non-REIT taxable business, as well as its overseas operations.
SCRIP DividendShareholders approved the re-introduction of a scrip dividend option (SCRIP) in respect of cash dividends (including those treated as Property Income Distributions) at the 2015 AGM. This authority will expire at the 2018 AGM.
The Board has decided to recommend the renewal of the Director’s authority to offer a SCRIP which, if approved by shareholders at the forthcoming AGM will allow shareholders who elect to receive the SCRIP, to take the final dividend in shares rather than cash. If shareholders approve the re-introduction of the SCRIP, it will run from three years ending on the earlier of 18 April 2021 and the three years beginning of the third AGM of the Company following 19 April 2018.
Details of the proposed SCRIP, together with information on how shareholders can elect to receive it subject to shareholder approval, will be provided in the Notice of Meeting and full terms and conditions of the SCRIP will be set out in the Scrip Dividend Scheme Booklet, which will be available on the Company’s website www.SEGRO.com.
Withholding tax – PIDsSEGRO is required to withhold tax at source from its PIDs at the basic tax rate (20 per cent). UK shareholders need take no immediate action (unless they qualify for exemption as described below) and will receive with each dividend payment a tax deduction certificate stating the amount of tax deducted.
UK shareholders who fall into one of the classes of shareholder able to claim an exemption from withholding tax may be able to receive a gross PID payment if they have submitted a valid relevant Exemption Declaration form, either as a beneficial owner of the shares, or as an intermediary if the shares are not registered in the name of the beneficial owner, to Equiniti. The Exemption Declaration form is available at www.SEGRO.com under Investors/Shareholder Information/REIT. A valid declaration form, once submitted, will continue to apply to future payments of PIDs until rescinded, and so it is a shareholder’s responsibility to notify SEGRO if their circumstances change and they are no longer able to claim an exemption from withholding tax.
Shareholders resident outside the UK may be able to claim a full or partial refund of withholding tax (either as an individual or as a company) from HMRC, subject to the terms of a double tax treaty, if any, between the UK and the country in which the shareholder is resident.
Ordinary dividends Ordinary, non-PID dividends will be treated in exactly the same way by shareholders as ordinary dividends paid before the Company became a REIT. From 6 April 2016 the notional 10 per cent tax credit has been abolished and replaced with a tax free dividend allowance, which will apply to the ordinary, non-PID dividends received by UK resident shareholders who are subject to UK income tax. This allowance does not apply to the PID element of dividends. Further information is available from HMRC at www.gov.uk/government/publications/dividend-allowance-factsheet.
OVERVIEW STRATEGIC REPORT GOVERNANCE FINANCIAL STATEMENTS
179

GLOSSARY OF TERMS
APP: Airport Property Partnership, a 50-50 joint venture between SEGRO and Aviva Investors, which was dissolved in 2017 when SEGRO acquired Aviva’s 50 per cent interest in the portfolio.
Completed portfolio: The completed investment properties and the Group’s share of joint ventures’ completed investment properties. Includes properties held throughout the period, completed developments and properties acquired during the period.
Development pipeline: The Group’s current programme of developments authorised or in the course of construction at the Balance Sheet date (Current Pipeline), together with potential schemes not yet commenced on land owned or controlled by the Group (Future Pipeline).
EPRA: The European Public Real Estate Association, a real estate industry body, which has issued Best Practices Recommendations in order to provide consistency and transparency in real estate reporting across Europe.
Estimated cost to completion: Costs still to be expended on a development or redevelopment to practical completion, including attributable interest.
Estimated rental value (ERV): The estimated annual market rental value of lettable space as determined biannually by the Group’s valuers. This will normally be different from the rent being paid.
Gearing: Net borrowings divided by total shareholders’ equity excluding intangible assets and deferred tax provisions.
Gross rental income: Contracted rental income recognised in the period in the Income Statement, including surrender premiums. Lease incentives, initial costs and any contracted future rental increases are amortised on a straight-line basis over the lease term.
Headline rent: The annual rental income currently receivable on a property as at the Balance Sheet date (which may be more or less than the ERV) ignoring any rent-free period.
Hectares (Ha): The area of land measurement used in this analysis. The conversion factor used, where appropriate, is 1 hectare = 2.471 acres.
IFRS: International Financial Reporting Standards, the standards under which SEGRO reports its financial accounts.
Investment property: Completed land and buildings held for rental income return and/or capital appreciation.
Joint venture: An entity in which the Group holds an interest and which is jointly controlled by the Group and one or more partners under a contractual arrangement whereby decisions on financial and operating policies essential to the operation, performance and financial position of the venture require each partner’s consent.
Loan to value (LTV): Net borrowings divided by the carrying value of total property assets (investment, owner occupied, trading properties and, if appropriate, assets held for sale on the balance sheet). This is reported on a ‘look-through’ basis (including joint ventures at share).
MSCI-IPD: MSCI Real Estate calculates the IPD indices of real estate performance around the world.
Net initial yield: Passing rent less non-recoverable property expenses such as empty rates, divided by the property valuation plus notional purchasers’ costs. This is in accordance with EPRA’s Best Practices Recommendations.
Net rental income: Gross rental income less ground rents paid, net service charge expenses and property operating expenses.
Net true equivalent yield: The internal rate of return from an investment property, based on the value of the property assuming the current passing rent reverts to ERV and assuming the property becomes fully occupied over time. It assumes that rent is received quarterly in advance.
Passing rent: The annual rental income currently receivable on a property as at the Balance Sheet date (which may be more or less than the ERV). Excludes rental income where a rent free period is in operation. Excludes service charge income (which is netted off against service charge expenses).
Pre-let: A lease signed with an occupier prior to commencing construction of a building.
REIT: A qualifying entity which has elected to be treated as a Real Estate Investment Trust for tax purposes. In the UK, such entities must be listed on a recognised stock exchange, must be predominantly engaged in property investment activities and must meet certain ongoing qualifications. SEGRO plc and its UK subsidiaries achieved REIT status with effect from 1 January 2007.
Rent-free period: An incentive provided usually at commencement of a lease during which a customer pays no rent. The amount of rent free is the difference between passing rent and headline rent.
Rent roll: See Passing Rent.
SELP: SEGRO European Logistics Partnership, a 50-50 joint venture between SEGRO and Public Sector Pension Investment Board (PSP Investments) established in 2013 to own big box warehouses in Continental Europe.
SIIC: Sociétés d’investissements Immobiliers Cotées are the French equivalent of UK Real Estate Investment Trusts (see REIT).
Speculative development: Where a development has commenced prior to a lease agreement being signed in relation to that development.
Square metres (sq m): The area of buildings measurements used in this analysis. The conversion factor used, where appropriate, is one square metre = 10.7639 square feet.
Takeback: Rental income lost due to lease expiry, exercise of break option, surrender or insolvency.
Topped up net initial yield: Net initial yield adjusted to include notional rent in respect of let properties which are subject to a rent free period at the valuation date. This is in accordance with EPRA’s Best Practices Recommendations.
Total property return (TPR): A measure of the ungeared return for the portfolio and is calculated as the change in capital value, less any capital expenditure incurred, plus net income, expressed as a percentage of capital employed over the period concerned, as calculated by MSCI Real Estate and excluding land.
Total shareholder return (TSR): A measure of return based upon share price movement over the period and assuming reinvestment of dividends.
Trading property: Property being developed for sale or one which is being held for sale after development is complete.
Yield on cost: The expected gross yield based on the estimated current market rental value (ERV) of the developments when fully let, divided by the book value of the developments at the earlier of commencement of the development or the balance sheet date plus future development costs and estimated finance costs to completion.
Yield on new money: The yield on cost excluding the book value of land if the land is owned by the Group in the reporting period prior to commencement of the development.
180
SEGRO PLC | ANNUAL REPORT & ACCOUNTS 2017
FURTHER INFORMATION

Forward-looking statementsThe Annual Report contains certain forward-looking statements with respect to SEGRO’s expectations and plans, strategy, management objectives, future developments and performances, costs, revenues and other trend information. These statements are subject to assumptions, risks and uncertainties. Many of these assumptions, risks and uncertainties relate to factors that are beyond SEGRO’s ability to control or estimate precisely and which could cause actual results or developments to differ materially from those expressed or implied by these forward-looking statements. Certain statements have been made with reference to forecast process changes, economic conditions and the current regulatory environment. Any forward-looking statements made by or on behalf of SEGRO are based upon the knowledge and information available to Directors on the date of this Annual Report. Accordingly, no assurance can be given that any particular expectation will be met and SEGRO’s shareholders are cautioned not to place undue reliance on the forward-looking statements. Additionally, forward-looking statements regarding past trends or activities should not be taken as a representation that such trends or activities will continue in the future. Other than in accordance with its legal or regulatory obligations (including under the UK Listing Rules and the Disclosure Guidance and Transparency Rules of the Financial Conduct Authority), SEGRO does not undertake to update forward-looking statements to reflect any changes in events, conditions or circumstances on which any such statement is based. Past share performance cannot be relied on as a guide to future performance. Nothing in this Annual Report should be construed as a profit forecast. The information in this Annual Report does not constitute an offer to sell or an invitation to buy securities in SEGRO plc or an invitation or inducement to engage in any other investment activities.
Go online
To keep up to date with SEGRO, you can source facts and figures about the Group through the various sections on our website and sign up for email alerts for fast communication of breaking news.
Financial reports, shareholder information and property analysis are frequently updated and our current share price is always displayed on the Home Page.
As well as featuring detailed information about available property throughout the portfolio, www.SEGRO.com now also includes a dedicated property search function making it easy for potential customers, or their agents, to find business space that fits their requirement exactly. SEGRO’s performance in areas such as sustainability and customer care are also featured on the site, www.SEGRO.com.
Other publications
Additional disclosures on our property portfolio can be found in the 2017 Property Analysis Report at www.SEGRO.com.
Our CSR policies, reporting guidelines, assurance statements and further case studies can be found at www.SEGRO.com/csr.
The printer and paper mill are both accredited with ISO14001 Environmental Management System and are both Forest Stewardship Council® certified.
CPI Colour is a Carbon Neutral printing company.
Designed and produced by www.ry.com
Registered office SEGRO plc Cunard House 15 Regent Street London SW1Y 4LR
Registered in England and Wales Registered number 167591

SEGRO PLC
CUNARD HOUSE
15 REGENT STREET
LONDON SW1Y 4LR
T +44(0)20 7451 9100
F +44(0)20 7451 9150
WWW.SEGRO.COM/INVESTORS