Embed Size (px)
Citation preview
Seismic AcquisitionEnergy Sector
2
Seismic Acquisition
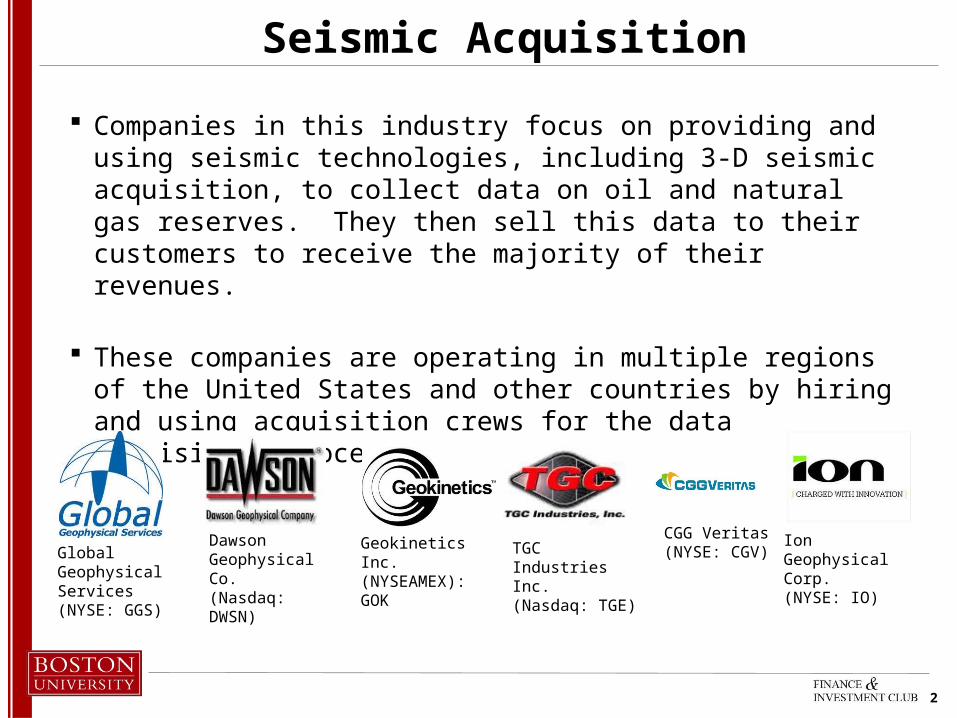
Companies in this industry focus on providing and using seismic technologies, including 3-D seismic acquisition, to collect data on oil and natural gas reserves. They then sell this data to their customers to receive the majority of their revenues.
These companies are operating in multiple regions of the United States and other countries by hiring and using acquisition crews for the data acquisition process.
Global Geophysical Services(NYSE: GGS)
Dawson Geophysical Co.(Nasdaq: DWSN)
Geokinetics Inc.(NYSEAMEX): GOK
TGC Industries Inc.(Nasdaq: TGE)
CGG Veritas(NYSE: CGV)
Ion Geophysical Corp.(NYSE: IO)
3
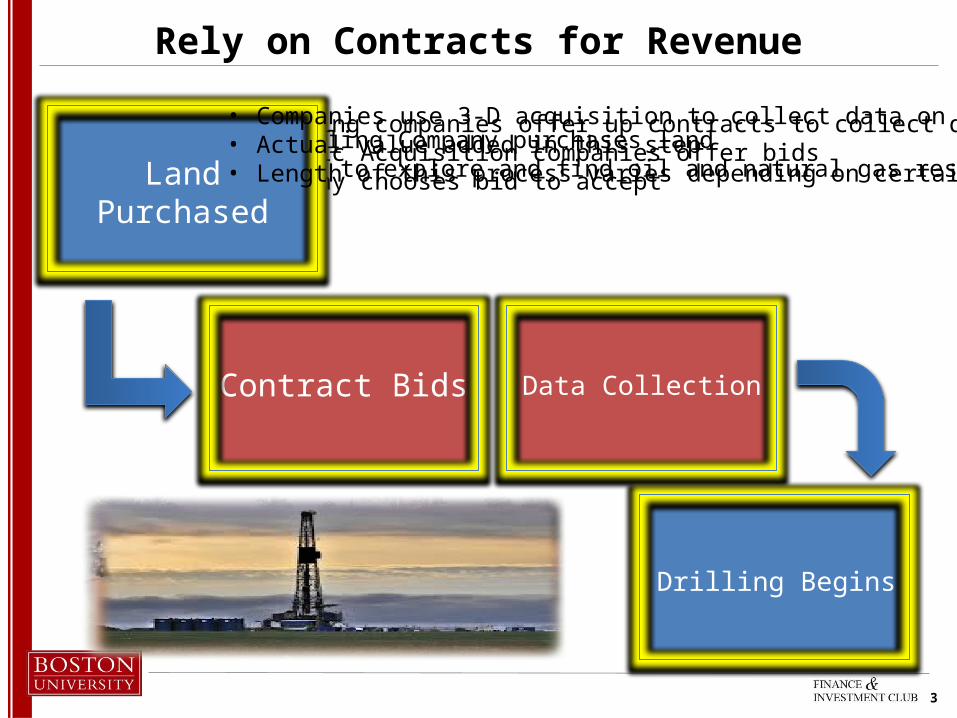
Rely on Contracts for Revenue
• Drilling Company purchases land• Need to explore and find oil and natural gas reserves
• Drilling companies offer up contracts to collect data on land• Seismic Acquisition companies offer bids • Company chooses bid to acceptLand Purchased
Contract Bids Data Collection
Drilling Begins
• Companies use 3-D acquisition to collect data on reserves• Actual value added in this step• Length of this process varies depending on certain factors
4
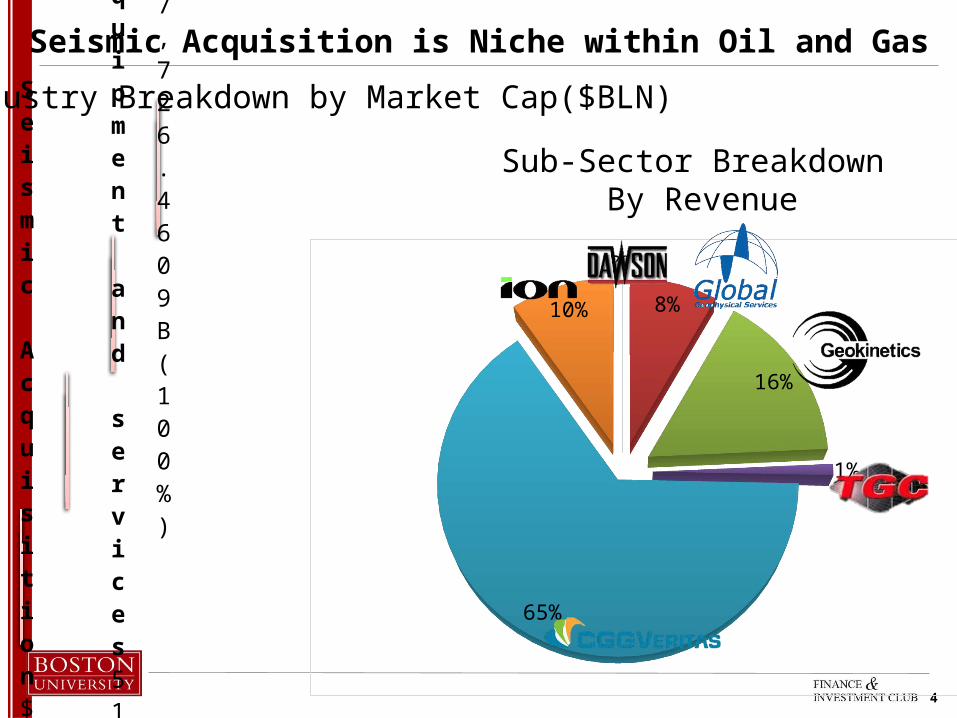
Energy7,726.4609B(100%)
Energy equipment and services518.7B
Seismic Acquisition$20B (0.26%)
Industry Breakdown by Market Cap($BLN)
Seismic Acquisition is Niche within Oil and Gas
Sub-Sector Breakdown By Revenue
0%
8%
16%
1%
65%
10%
5
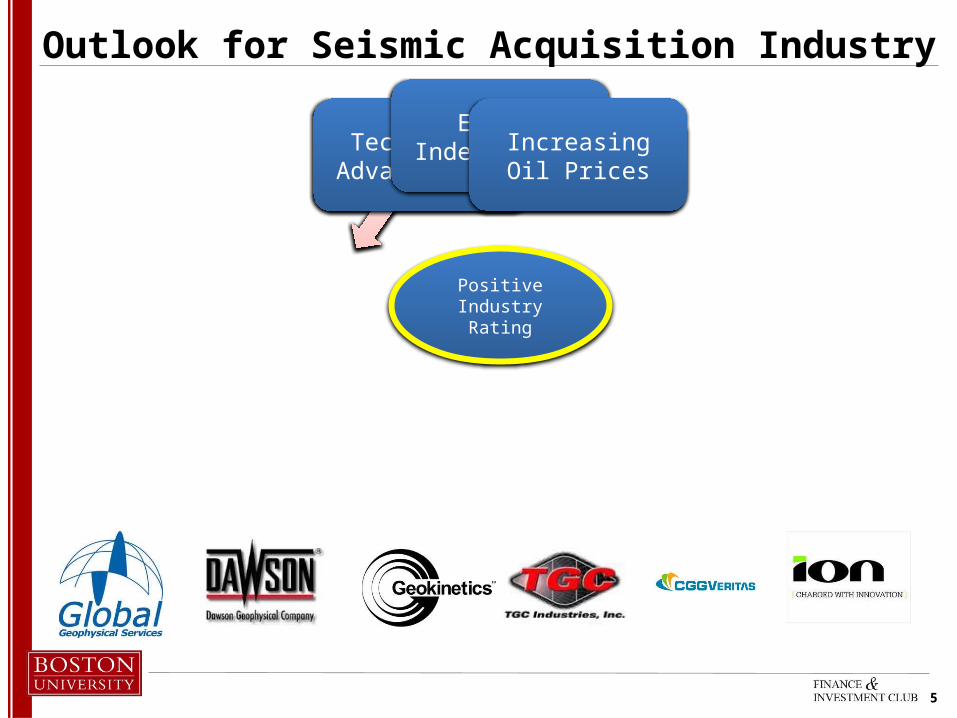
Outlook for Seismic Acquisition Industry
Key Industry Trends
Technology Advancements
Energy IndependenceIncreasing Oil Prices
Positive Industry Rating
Technology Advancements
Energy IndependenceIncreasing Oil Prices
6
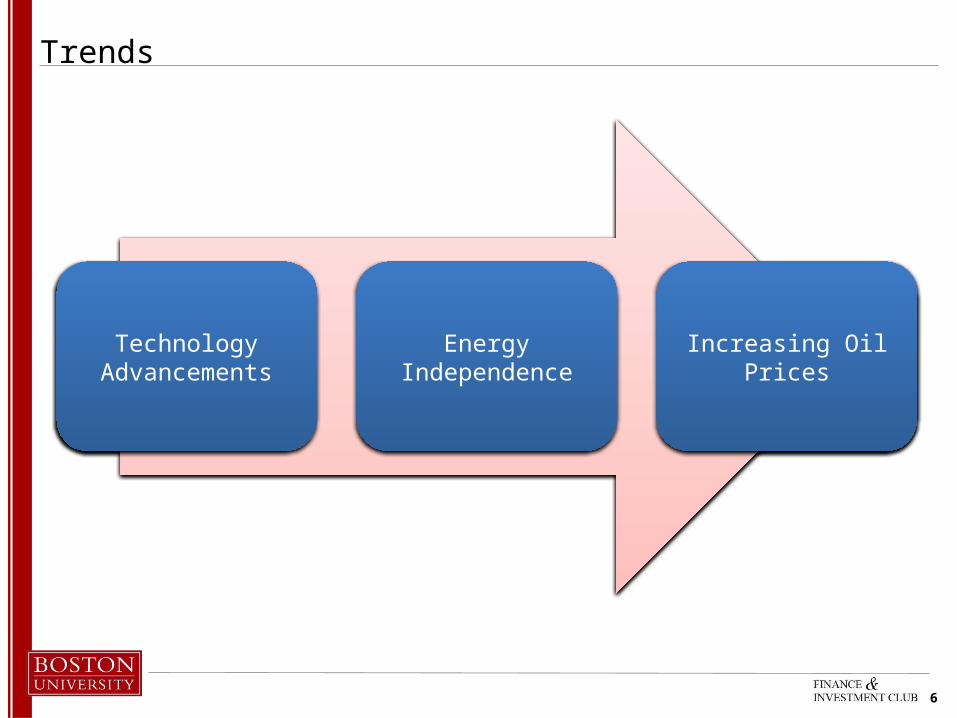
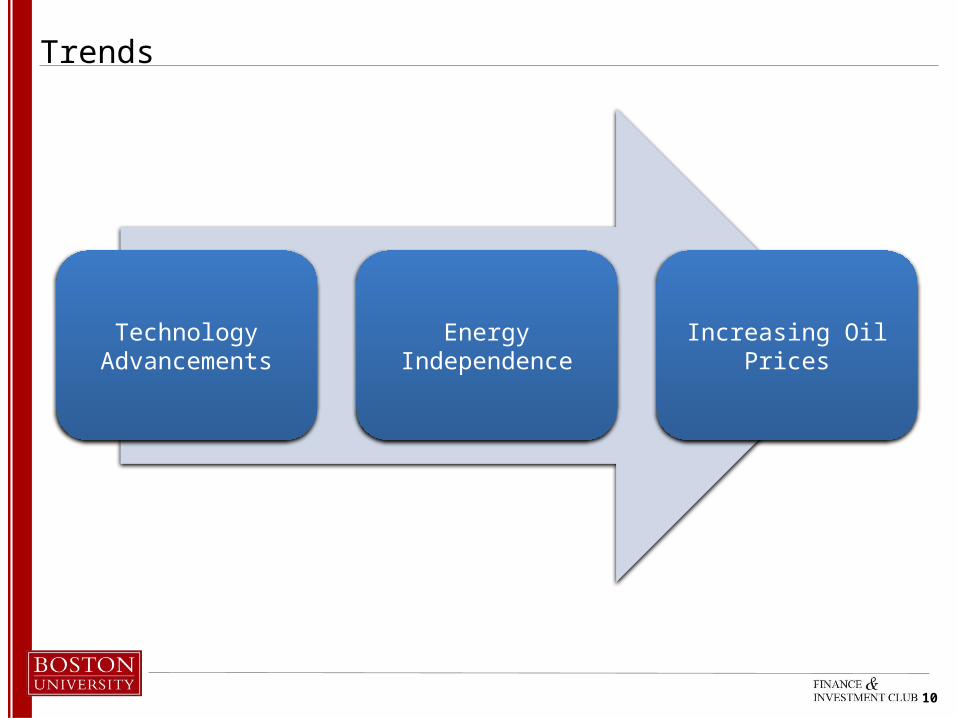
Trends
Technology Advancements Energy Independence Increasing Oil PricesTechnology Advancements Energy Independence Increasing Oil Prices
7
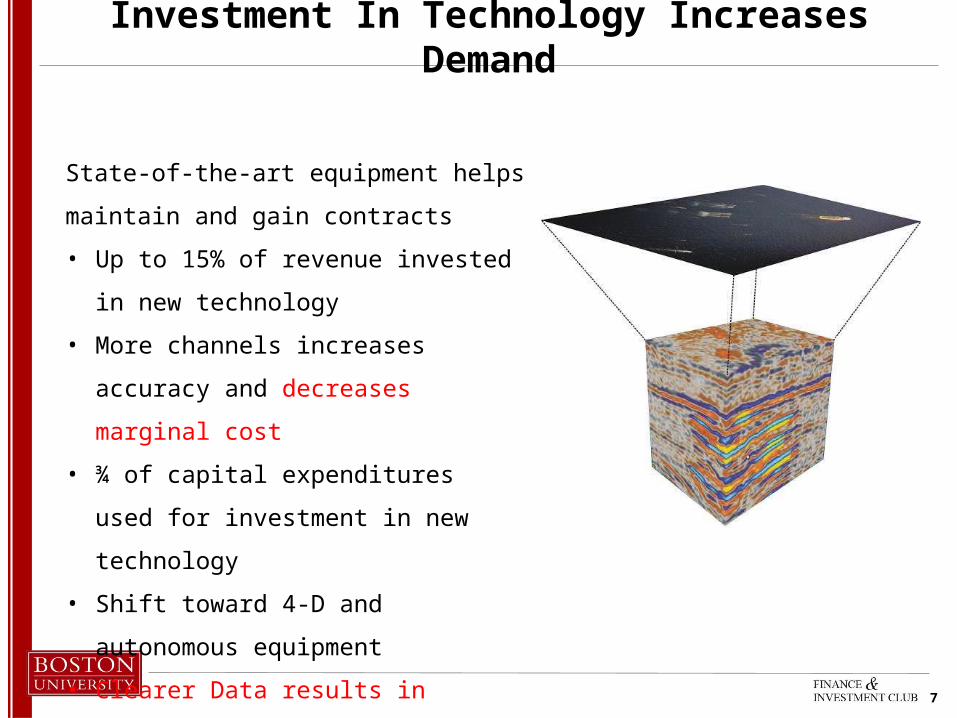
Investment In Technology Increases Demand
State-of-the-art equipment helps maintain and gain
contracts
• Up to 15% of revenue invested in new technology
• More channels increases accuracy and
decreases marginal cost
• ¾ of capital expenditures used for investment in
new technology
• Shift toward 4-D and autonomous equipment
• Clearer Data results in higher demand and
revenue

8
Trends
Technology Advancements Energy Independence Increasing Oil Prices
9
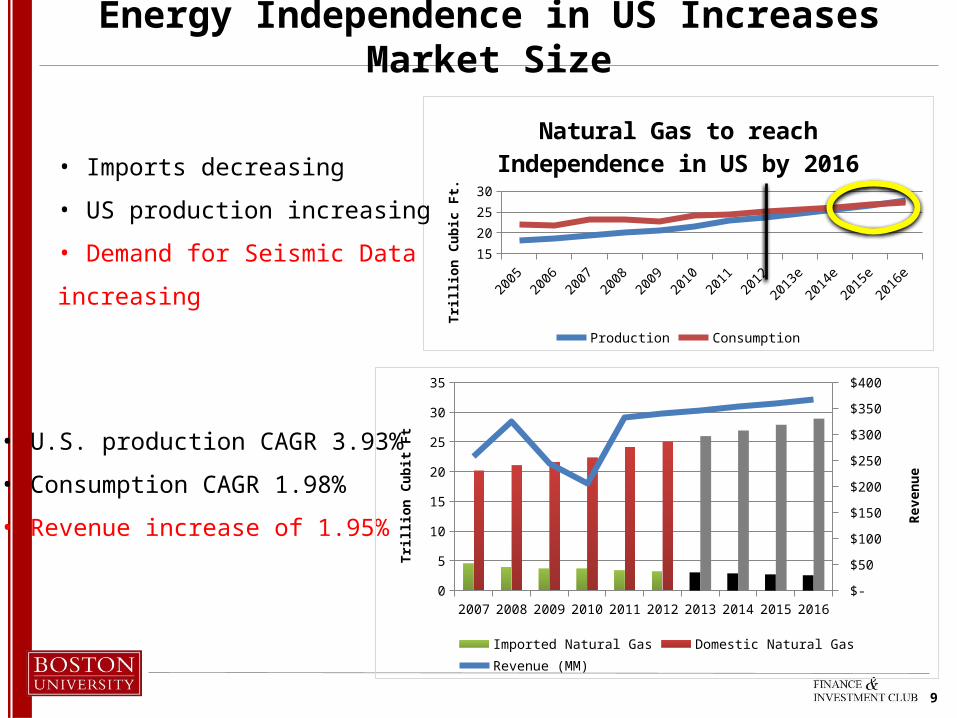
Energy Independence in US Increases Market Size
2005 2006 2007 2008 2009 2010 2011 2012 2013e 2014e 2015e 2016e1517192123252729
Natural Gas to reach Independence in US by 2016
Production Consumption
Trill
ion
Cub
ic F
t.• U.S. production CAGR 3.93%
• Consumption CAGR 1.98%
• Revenue increase of 1.95%
• Imports decreasing
• US production increasing
• Demand for Seismic Data increasing
2007 2008 2009 2010 2011 2012 2013 2014 2015 20160
5
10
15
20
25
30
35
$-
$50
$100
$150
$200
$250
$300
$350
$400
Imported Natural Gas Domestic Natural Gas Revenue (MM)
Trill
ion
Cub
it Ft
Rev
enue
10
Trends
Technology Advancements Energy Independence Increasing Oil Prices
11
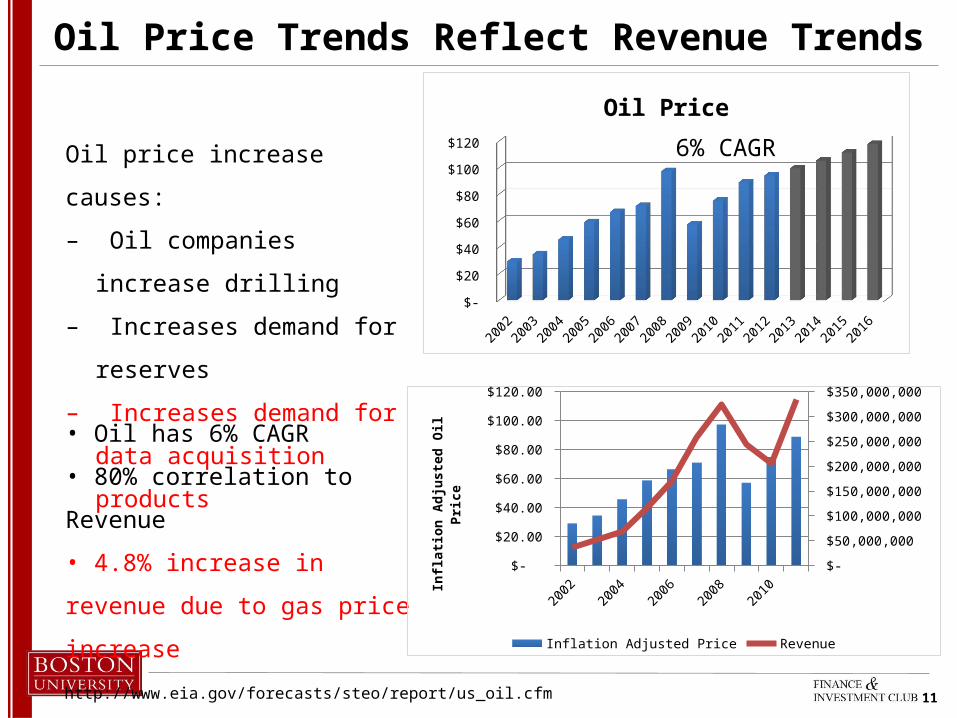
Oil Price Trends Reflect Revenue Trends
• Oil has 6% CAGR
• 80% correlation to Revenue
• 4.8% increase in revenue due to gas
price increase
2002 2003 2004 2005 2006 2007 2008 2009 2010 2011 2012 2013 2014 2015 2016 $-
$20
$40
$60
$80
$100
$120
Oil Price
Oil price increase causes:
– Oil companies increase drilling
– Increases demand for reserves
– Increases demand for data
acquisition products
http://www.eia.gov/forecasts/steo/report/us_oil.cfm
6% CAGR
2002 2003 2004 2005 2006 2007 2008 2009 2010 2011 $-
$20.00
$40.00
$60.00
$80.00
$100.00
$120.00
$-
$50,000,000
$100,000,000
$150,000,000
$200,000,000
$250,000,000
$300,000,000
$350,000,000
Inflation Adjusted Price Revenue
Infla
tion
Adj
uste
d O
il Pr
ice
12
Risks
GovernmentRegulation Oil and Gas Price Drop Lack of
TechnologyGovernmentRegulation Oil and Gas Price Drop Lack of
Technology

13
Government Regulation is a High Long-Term Risk
Reasons for proposed regulation– Air and water contamination worries– Lack of disclosure of used in chemicals in fracking– EPA estimates 40% of US methane from fracking
New Legislation on regulation of fracking will:- Slow down permit process, decreasing production rates- Decrease in revenues and increase in expenses
Short-Term Risk: LOW- Would cut jobs and slow economy- Booming industry despite recession- Legislation takes time to pass
Long-Term Risk: HIGH– Water contamination is serious risk– Disclosure of chemicals already passed in many states

14
Risks
GovernmentRegulation Oil and Gas Price Drop Lack of
Technology
15
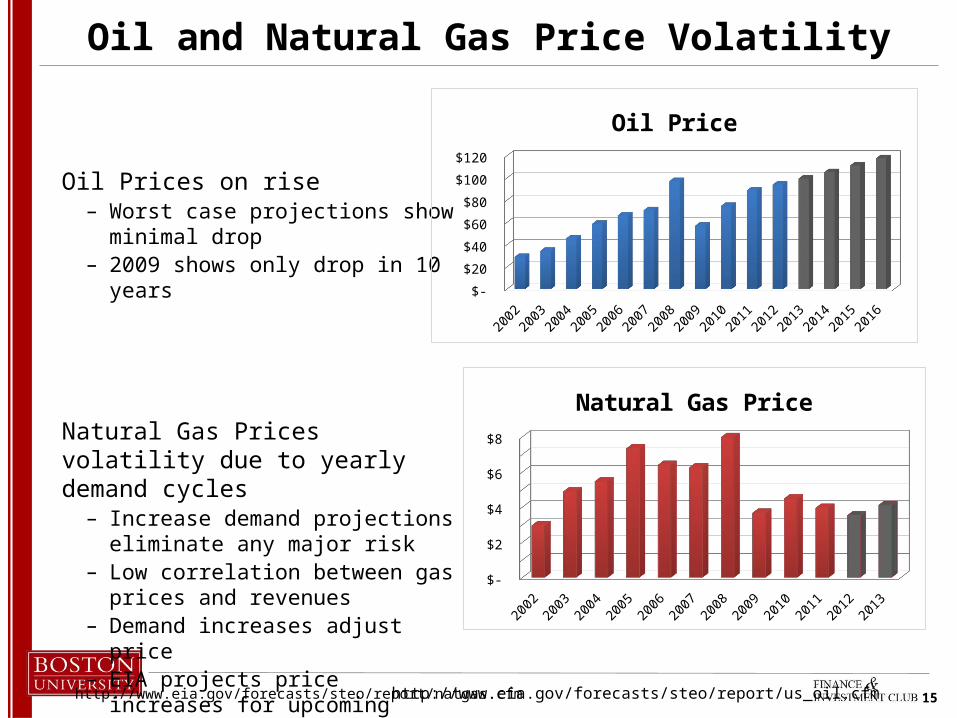
Oil and Natural Gas Price Volatility
Oil Prices on rise– Worst case projections show minimal drop– 2009 shows only drop in 10 years
Natural Gas Prices volatility due to yearly demand cycles
– Increase demand projections eliminate any major risk
– Low correlation between gas prices and revenues
– Demand increases adjust price– EIA projects price increases for upcoming
years
2002 2003 2004 2005 2006 2007 2008 2009 2010 2011 2012 2013 2014 2015 2016 $-
$20
$40
$60
$80
$100
$120
Oil Price
2002 2003 2004 2005 2006 2007 2008 2009 2010 2011 2012 2013 $-
$1
$2
$3
$4
$5
$6
$7
$8
Natural Gas Price
http://www.eia.gov/forecasts/steo/report/natgas.cfm http://www.eia.gov/forecasts/steo/report/us_oil.cfm
16
Risks
GovernmentRegulation Oil and Gas Price Drop Lack of
Technology

17
Lag in Technology Loses Competitive Advantage
Invest in New Technology
Clearer Seismic Data
Higher Service Demand
Increased Revenues
• Buyer Power in Industry: HIGH
• Transitioning from 3D to 4D imaging
• Companies using 3D lose customers
18
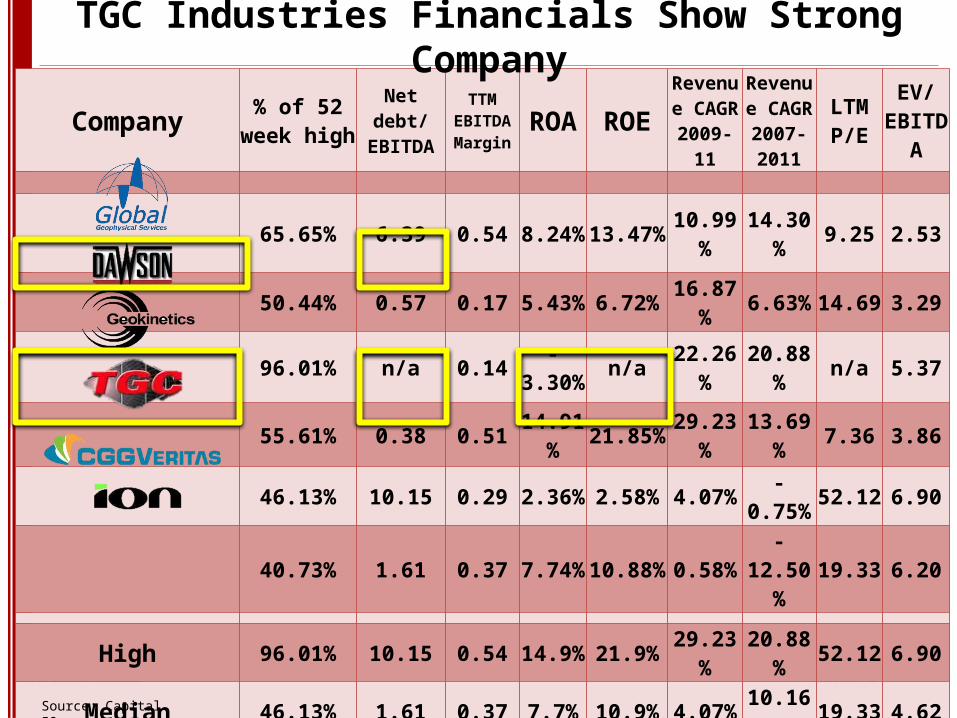
Company % of 52 week high
Net debt/ EBITDA
TTM EBITDA Margin
ROA ROERevenue
CAGR 2009-11
Revenue CAGR
2007-2011
LTMP/E
EV/EBITDA
65.65% 6.39 0.54 8.24% 13.47% 10.99% 14.30% 9.25 2.53
50.44% 0.57 0.17 5.43% 6.72% 16.87% 6.63% 14.69 3.29
96.01% n/a 0.14 -3.30% n/a 22.26% 20.88% n/a 5.37
55.61% 0.38 0.51 14.91% 21.85% 29.23% 13.69% 7.36 3.86
46.13% 10.15 0.29 2.36% 2.58% 4.07% -0.75% 52.12 6.90
40.73% 1.61 0.37 7.74% 10.88% 0.58% -12.50% 19.33 6.20
High 96.01% 10.15 0.54 14.9% 21.9% 29.23% 20.88% 52.12 6.90
Median 46.13% 1.61 0.37 7.7% 10.9% 4.07% 10.16% 19.33 4.62
Mean 47.49% 4.04 0.39 8.3% 11.8% 11.29% 7.04% 26.27 4.69
Low 40.73% -8.17 0.14 -3.3% 2.6% 0.58% -12.50% 7.36 2.53
Source: Capital IQ
TGC Industries Financials Show Strong Company
19
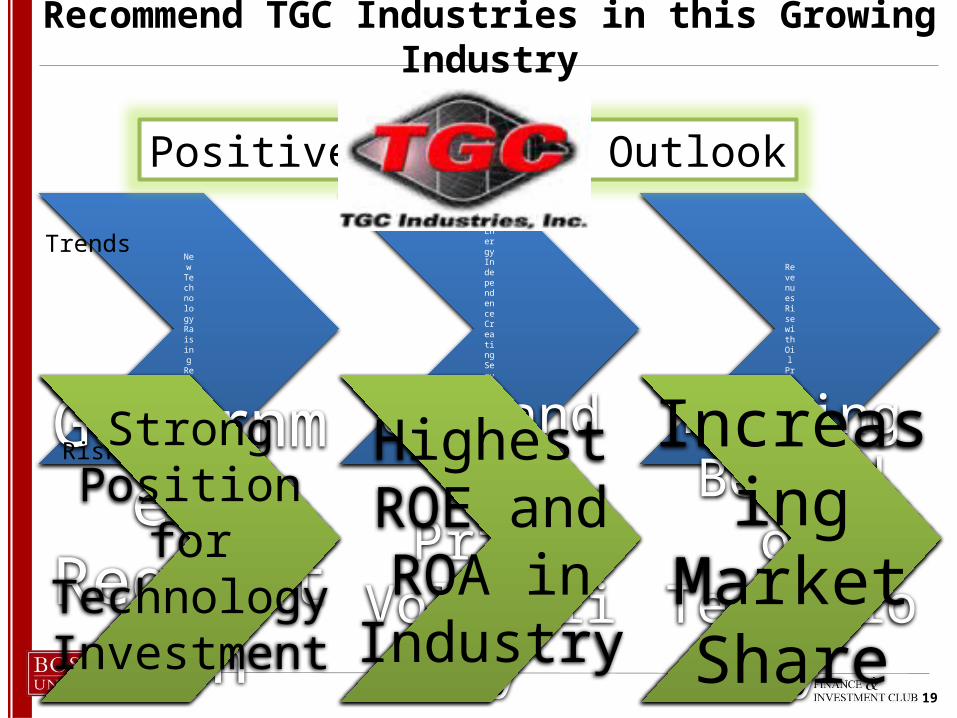
Recommend TGC Industries in this Growing Industry
New Technology Raising Revenues
Energy Independence Creating
Service Demand
Revenues Rise with Oil
Prices
Government
Regulation
Oil and Gas Price Volatility
Falling Behind on Technolog
y
Trends
Risks
Positive Industry Outlook
Strong Position for Technology Investment
Highest ROE and ROA in Industry
Increasing Market
Share
20
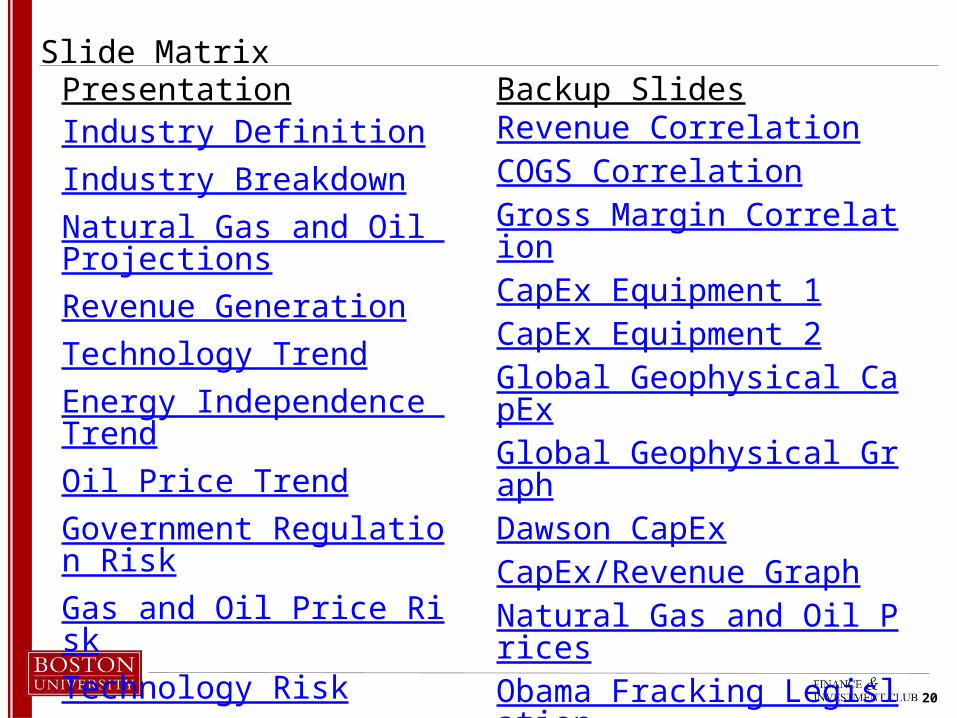
Slide MatrixPresentationIndustry DefinitionIndustry BreakdownNatural Gas and Oil ProjectionsRevenue GenerationTechnology TrendEnergy Independence TrendOil Price TrendGovernment Regulation RiskGas and Oil Price RiskTechnology RiskComparable ChartTGC Recommendation
Backup SlidesRevenue CorrelationCOGS CorrelationGross Margin CorrelationCapEx Equipment 1CapEx Equipment 2Global Geophysical CapExGlobal Geophysical GraphDawson CapExCapEx/Revenue GraphNatural Gas and Oil PricesObama Fracking LegislationNatural Gas and Oil Projections
21
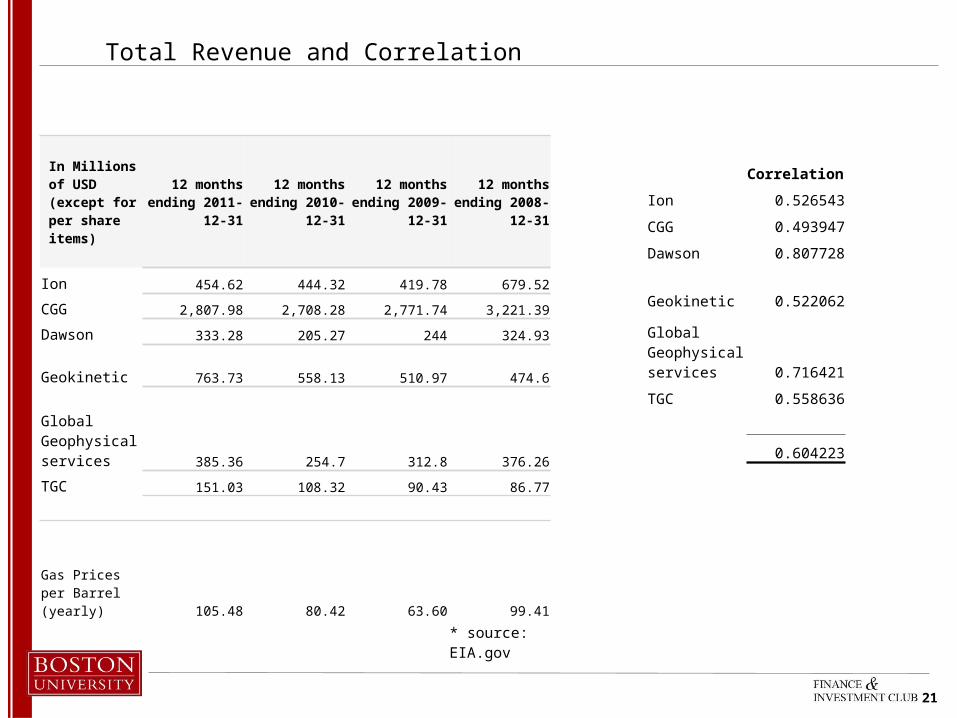
Total Revenue and Correlation
In Millions of USD (except for per share items)
12 months ending 2011-12-
31
12 months ending 2010-
12-31
12 months ending 2009-
12-31
12 months ending 2008-
12-31
Ion 454.62 444.32 419.78 679.52
CGG 2,807.98 2,708.28 2,771.74 3,221.39
Dawson 333.28 205.27 244 324.93
Geokinetic 763.73 558.13 510.97 474.6
Global Geophysical services 385.36 254.7 312.8 376.26
TGC 151.03 108.32 90.43 86.77
Gas Prices per Barrel (yearly) 105.48 80.42 63.60 99.41
* source: EIA.gov
Correlation
Ion 0.526543
CGG 0.493947
Dawson 0.807728
Geokinetic 0.522062
Global Geophysical services 0.716421
TGC 0.558636
0.604223
22
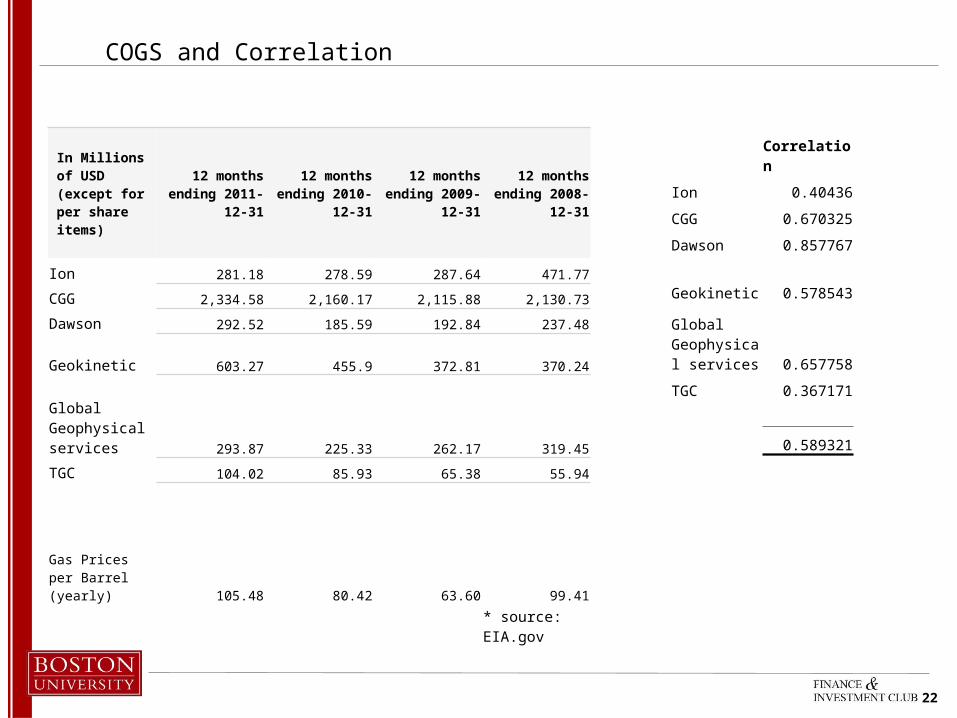
COGS and Correlation
In Millions of USD (except for per share items)
12 months ending 2011-12-
31
12 months ending 2010-12-
31
12 months ending 2009-12-
31
12 months ending 2008-12-
31
Ion 281.18 278.59 287.64 471.77
CGG 2,334.58 2,160.17 2,115.88 2,130.73
Dawson 292.52 185.59 192.84 237.48
Geokinetic 603.27 455.9 372.81 370.24
Global Geophysical services 293.87 225.33 262.17 319.45
TGC 104.02 85.93 65.38 55.94
Gas Prices per Barrel (yearly) 105.48 80.42 63.60 99.41
* source: EIA.gov
Correlation
Ion 0.40436
CGG 0.670325
Dawson 0.857767
Geokinetic 0.578543
Global Geophysical services 0.657758
TGC 0.367171
0.589321

23
Gross Profit and Correlation
In Millions of USD (except for per share items)
12 months ending 2011-12-
31
12 months ending 2010-12-
31
12 months ending 2009-12-
31
12 months ending 2008-12-
31
Ion 173.44 165.73 132.14 207.75
CGG 470.55 544.03 646.58 1,088.56
Dawson 40.76 19.68 51.16 87.44
Geokinetic 160.45 102.23 138.15 104.36
Global Geophysical services 91.49 29.38 50.63 56.8
TGC 47.01 22.39 25.05 30.84
Gas Prices per Barrel (yearly) 105.48 80.42 63.60 99.41
* source: EIA.gov
Correlation
Ion 0.816491
CGG 0.181412
Dawson 0.288426
Geokinetic 0.149726
Global Geophysical services 0.656385
TGC 0.776954
0.478233
24
CAPEX Equipment Overview
Channel – device that carries data from receiver to recorder– 500-2000 channels in 3D seismic acquisition– 120-240 channels in onshore 2D seismic acquisition
Geophone – sensors that measure ground displacement– Collect sound waves created by vibration equipment– At least one connected to each channel (the more, the better)– “Hydrophones” are the same for marine exploration
Seismic geometry – grid of seismic energy sources & receivers– Used to acquire a complete seismic survey
24
25
CAPEX Equipment Overview
State-of-the-art equipment is huge selling point– Rapid growth in imaging technology & equipment autonomy– Largest CAPEX is in multi-client libraries – only included by GGS
3D imaging still vast majority of industry– Trending toward high-density & 4D
4D “Time Lapse” Seismic Surveying– Determines changes in flow, temperature, pressure, and saturation– Important because as hydrocarbons (i.e. oil/natural gas) are extracted, pressure and
composition of field may change
Source: GGC 10-K
25
26
Global Geophysical Services (GGS)
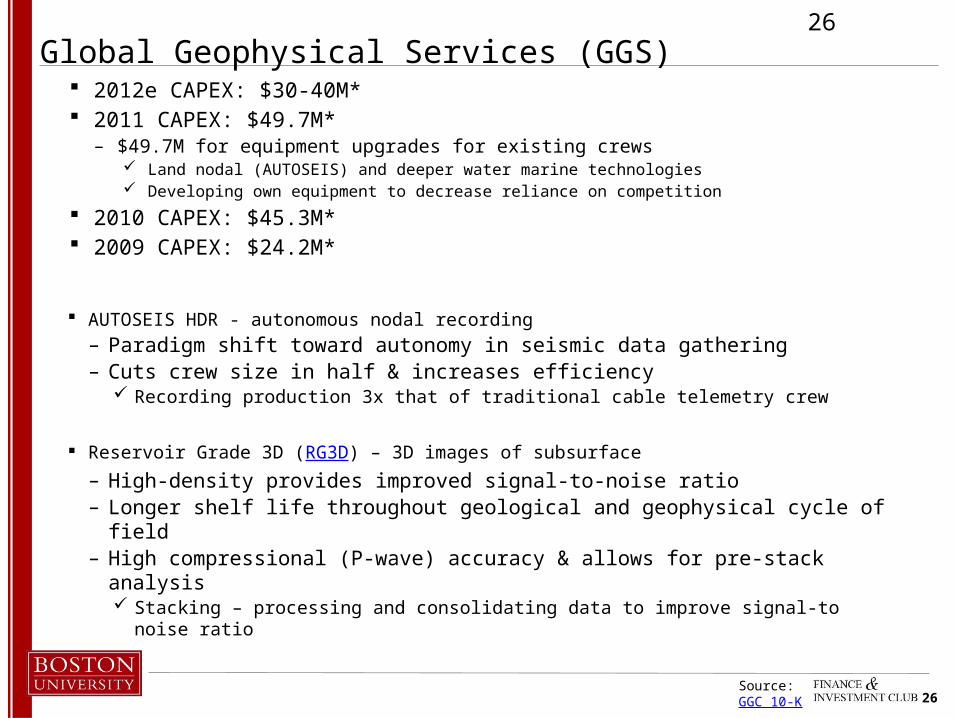
AUTOSEIS HDR - autonomous nodal recording– Paradigm shift toward autonomy in seismic data gathering– Cuts crew size in half & increases efficiency
Recording production 3x that of traditional cable telemetry crew
Reservoir Grade 3D (RG3D) – 3D images of subsurface– High-density provides improved signal-to-noise ratio– Longer shelf life throughout geological and geophysical cycle of field– High compressional (P-wave) accuracy & allows for pre-stack analysis
Stacking – processing and consolidating data to improve signal-to noise ratio
Source: GGC 10-K
26
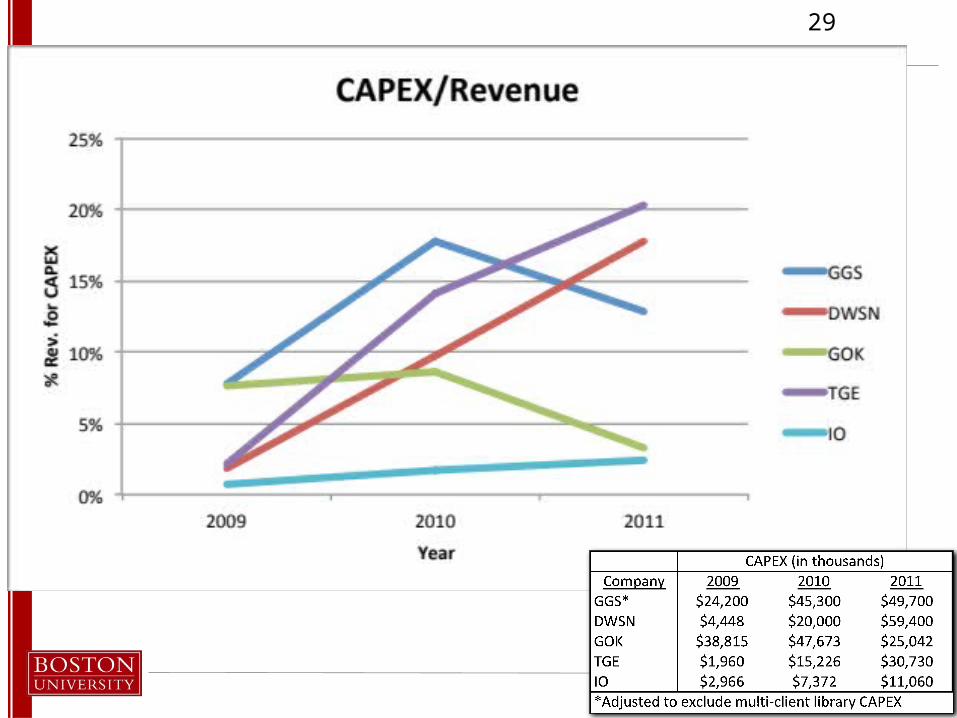
2012e CAPEX: $30-40M* 2011 CAPEX: $49.7M*
– $49.7M for equipment upgrades for existing crews Land nodal (AUTOSEIS) and deeper water marine technologies Developing own equipment to decrease reliance on competition
2010 CAPEX: $45.3M* 2009 CAPEX: $24.2M*

27
Global Geophysical Services (GGS)
Source: Dahlman Rose Oil Service Conference (November 2011)
27
28
Dawson Geophysical Co. (DWSN)
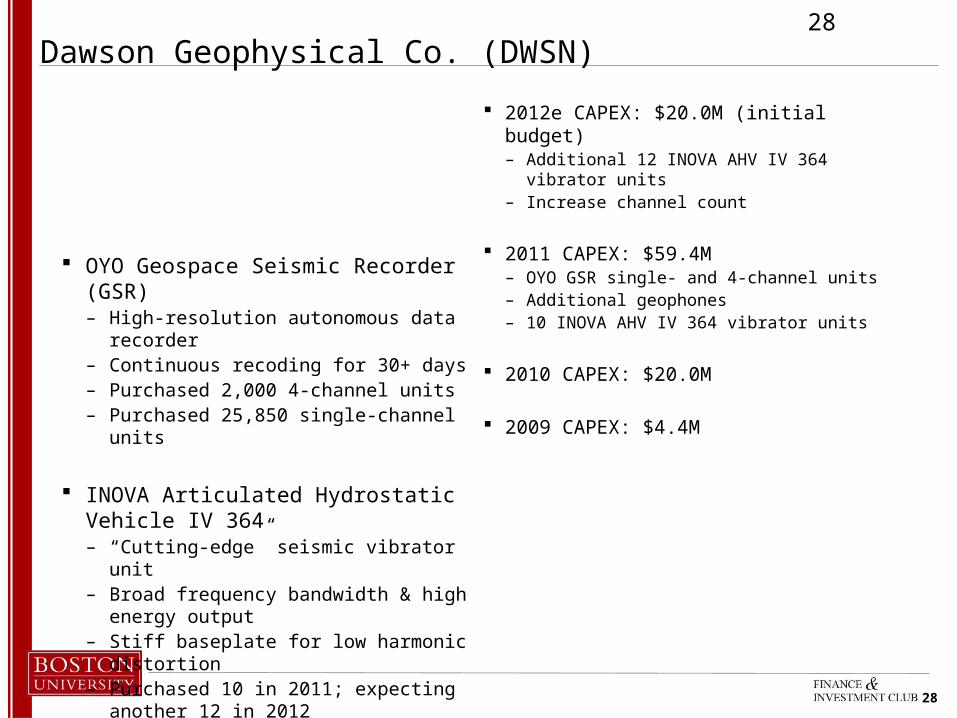
OYO Geospace Seismic Recorder (GSR)– High-resolution autonomous data recorder– Continuous recoding for 30+ days– Purchased 2,000 4-channel units– Purchased 25,850 single-channel units
INOVA Articulated Hydrostatic Vehicle IV 364– “Cutting-edge” seismic vibrator unit– Broad frequency bandwidth & high energy output– Stiff baseplate for low harmonic distortion– Purchased 10 in 2011; expecting another 12 in 2012
28
2012e CAPEX: $20.0M (initial budget)– Additional 12 INOVA AHV IV 364 vibrator units– Increase channel count
2011 CAPEX: $59.4M– OYO GSR single- and 4-channel units– Additional geophones– 10 INOVA AHV IV 364 vibrator units
2010 CAPEX: $20.0M
2009 CAPEX: $4.4M
29
29

30
Risk: Price drop in natural gas and oil
Jan 20
08
Apr 20
08
Jul 20
08
Oct 200
8
Jan 20
09
Apr 20
09
Jul 20
09
Oct 200
9
Jan 20
10
Apr 20
10
Jul 20
10
Oct 201
0
Jan 20
11
Apr 20
11
Jul 20
11
Oct 201
1
Jan 20
12
Apr 20
12
Jul 20
12
Oct 201
2
Jan 20
13
Apr 20
13
Jul 20
13
Oct 201
30.00
5.00
10.00
15.00
20.00
25.00
U.S. Natural Gas Prices(dollars per thousand cubic feet)
Residential priceHenry Hub spot priceComposite Wellhead price
Jan
2008
Mar
200
8M
ay 2
008
Jul 2
008
Sep
2008
Nov
2008
Jan
2009
Mar
200
9M
ay 2
009
Jul 2
009
Sep
2009
Nov
2009
Jan
2010
Mar
201
0M
ay 2
010
Jul 2
010
Sep
2010
Nov
2010
Jan
2011
Mar
201
1M
ay 2
011
Jul 2
011
Sep
2011
Nov
2011
Jan
2012
Mar
201
2M
ay 2
012
Jul 2
012
Sep
2012
Nov
2012
Jan
2013
Mar
201
3M
ay 2
013
Jul 2
013
Sep
2013
Nov
2013
0.000.501.001.502.002.503.003.50
U.S. Crude Oil Prices(dollars per gallon)
Crude Oil
31
New Legislation could add costs up to $2.5B/ year
Obama: – New Legislation on regulation of fracking
Slow down the drilling permit approval process and decrease production rates Western Energy Alliance estimates it will add $1. 2 B to costs of new wells EPA: wont add any new costs Industry: 2.5 B in added costs Bloomberg Government: $316-511 M a year (less than 1% of revenues associated with oil and gas production)
32
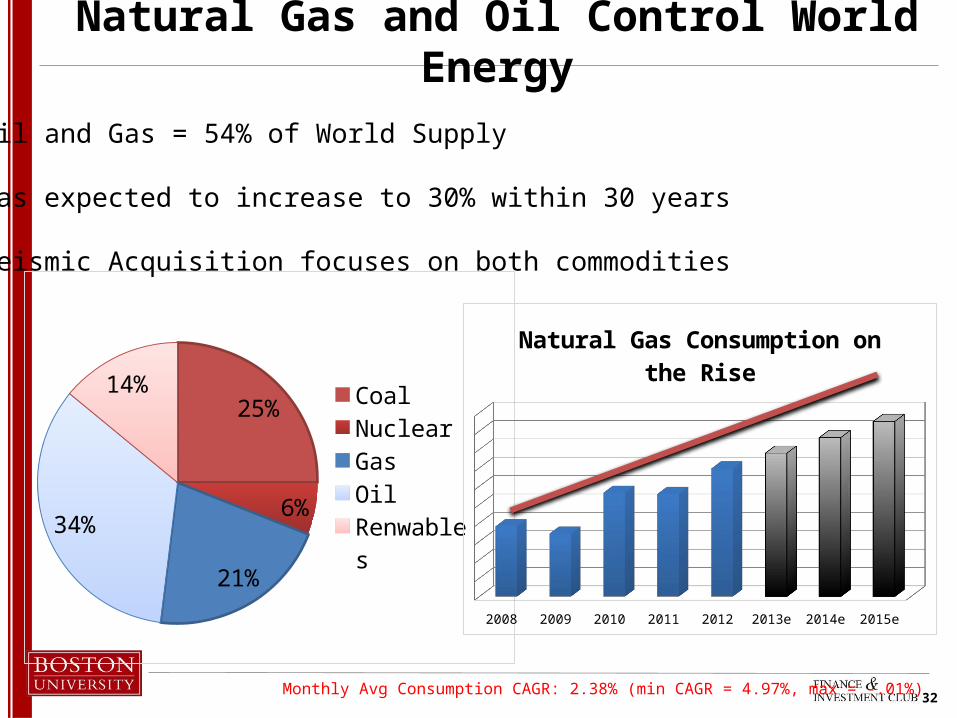
Natural Gas and Oil Control World Energy
25%
6%
21%
34%
14%
Coal
Nuclear
Gas
Oil
Renwables
• Oil and Gas = 54% of World Supply
• Gas expected to increase to 30% within 30 years
• Seismic Acquisition focuses on both commodities
2008 2009 2010 2011 2012 2013e 2014e 2015e
Natural Gas Consumption on the Rise
Monthly Avg Consumption CAGR: 2.38% (min CAGR = 4.97%, max = -.01%)