Embed Size (px)
Citation preview
50
SEISMIC BEHAVIOR OF BRIDGE WITH PIER AND
FOUNDATION STRENGTHENING USING PSEUDO-DYNAMIC TEST
Anawat CHOTESUWAN 1), Hiroshi MUTSUYOSHI
1) and Takeshi MAKI
1)
1) Structural Material Lab., Department of Civil and Environmental Engineering, Saitama University
ABSTRACT
This paper describes the seismic behavior of reinforced concrete (RC) bridge piers and
foundations based on pseudo-dynamic (PSD) tests for cases where pier strengthening and foundation
strengthening are implemented. In addition, analysis based on the PSD test algorithm is conducted to
investigate the influence of pier strengthening on seismic damage to the foundation. The PSD-tests
and the analysis show that the foundation suffers increased hysteretic response when pier
strengthening is applied. The results also show that the foundation strengthening can prevent
foundation damage.
KEYWORDS: pseudodynamic test, structure-foundation interaction, seismic strengthening
1. INTRODUCTION
In the 1995 Great Hanshin Earthquake (Kobe),
the severe damage caused to many bridges mainly
arose because their RC piers lacked sufficient load
carrying capacity and ductility (Kawashima and
Shigeki 1995). Consequently, many bridge piers in
Japan have since been strengthened (Unjoh et al.
2000), using various techniques, so that they will
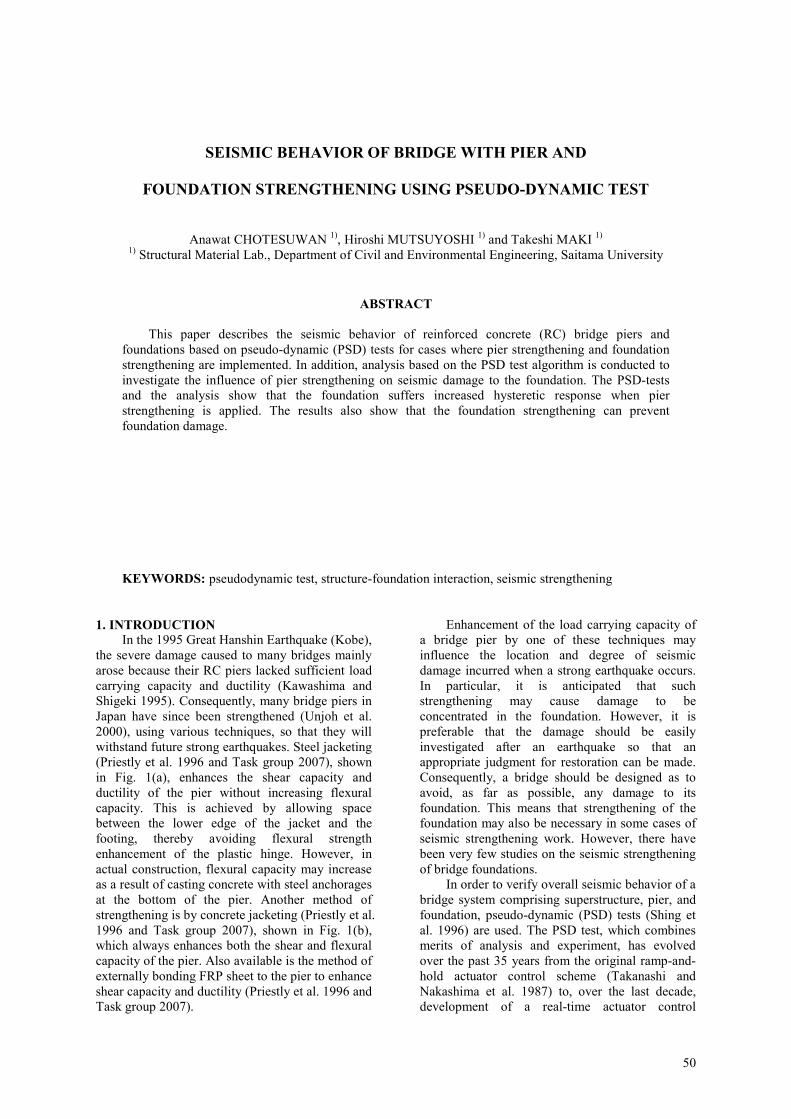
withstand future strong earthquakes. Steel jacketing
(Priestly et al. 1996 and Task group 2007), shown
in Fig. 1(a), enhances the shear capacity and
ductility of the pier without increasing flexural
capacity. This is achieved by allowing space
between the lower edge of the jacket and the
footing, thereby avoiding flexural strength
enhancement of the plastic hinge. However, in
actual construction, flexural capacity may increase
as a result of casting concrete with steel anchorages
at the bottom of the pier. Another method of
strengthening is by concrete jacketing (Priestly et al.
1996 and Task group 2007), shown in Fig. 1(b),
which always enhances both the shear and flexural
capacity of the pier. Also available is the method of
externally bonding FRP sheet to the pier to enhance
shear capacity and ductility (Priestly et al. 1996 and
Task group 2007).
Enhancement of the load carrying capacity of
a bridge pier by one of these techniques may
influence the location and degree of seismic
damage incurred when a strong earthquake occurs.
In particular, it is anticipated that such
strengthening may cause damage to be
concentrated in the foundation. However, it is
preferable that the damage should be easily
investigated after an earthquake so that an
appropriate judgment for restoration can be made.
Consequently, a bridge should be designed as to
avoid, as far as possible, any damage to its
foundation. This means that strengthening of the
foundation may also be necessary in some cases of
seismic strengthening work. However, there have
been very few studies on the seismic strengthening
of bridge foundations.
In order to verify overall seismic behavior of a
bridge system comprising superstructure, pier, and
foundation, pseudo-dynamic (PSD) tests (Shing et
al. 1996) are used. The PSD test, which combines
merits of analysis and experiment, has evolved
over the past 35 years from the original ramp-and-
hold actuator control scheme (Takanashi and
Nakashima et al. 1987) to, over the last decade,
development of a real-time actuator control
51
algorithm (Nakashima et al. 1987, Pinto et al. 2004,
and Jung et al. 2007). Using a sub-structuring
technique (Dermitzakis et al. 1985), researchers
can investigate the seismic response of the whole
structural system by conducting experiments
focusing on target members whose behavior is
unclear. There were several interesting PSD tests
conducted at ELSA laboratory in Italy (Pinto et al.
2004 and Pegon and Pinto 2000) for seismic
assessment of bridges, but the presence of
foundation was not considered. Toki et al. (1990)
have utilized the PSD test to study the frequency-
dependent dynamic characteristic of a foundation,
but the interaction between pier and foundation was
not included. Also, Kobayashi et al. (2002)
introduced a sophisticated hybrid system utilizing a
real-time actuator with a large shaking table
attached to the base. However, such a system
cannot be used extensively due to cost limitations.
The objectives of this paper are to 1) develop
a PSD test system for evaluating overall seismic
behavior of a bridge; 2) investigate foundation
damage in bridges with pier strengthening; and 3)
investigate the behavior of bridges with foundation
strengthening.
2. SIMPLIFIED MODEL OF BRIDGE PIER
SYSTEM FOR PSD TESTS
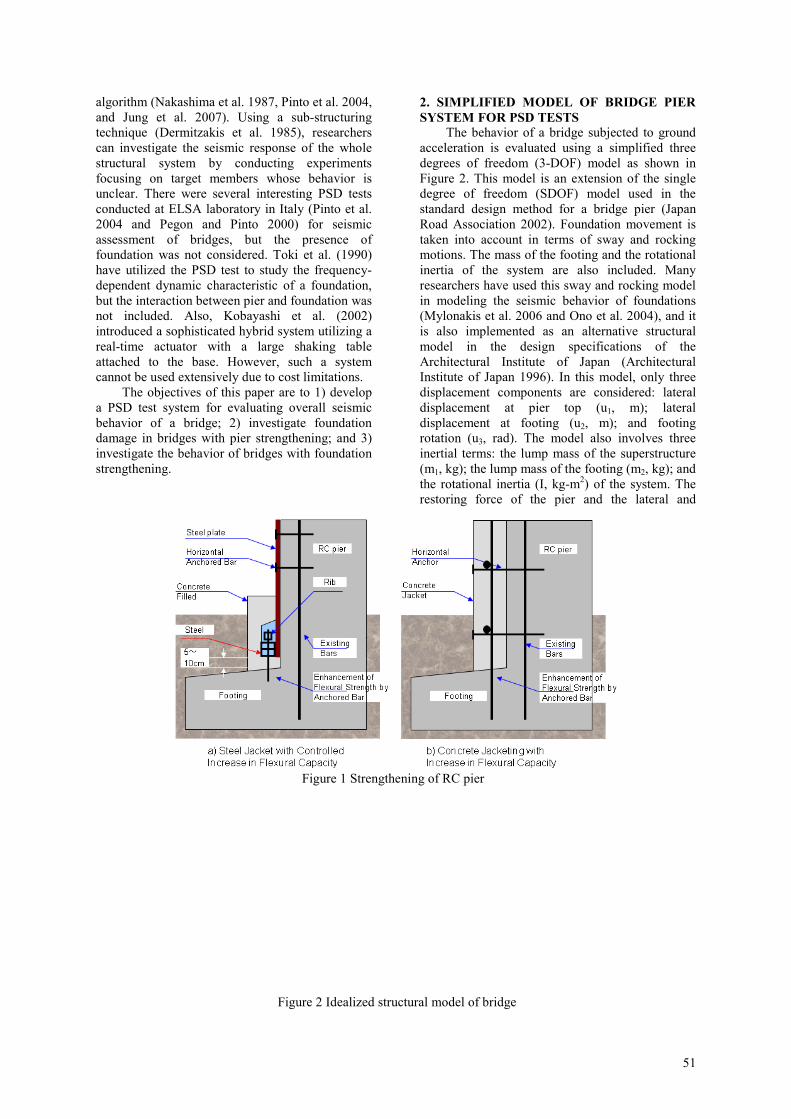
The behavior of a bridge subjected to ground
acceleration is evaluated using a simplified three
degrees of freedom (3-DOF) model as shown in
Figure 2. This model is an extension of the single
degree of freedom (SDOF) model used in the
standard design method for a bridge pier (Japan
Road Association 2002). Foundation movement is
taken into account in terms of sway and rocking
motions. The mass of the footing and the rotational
inertia of the system are also included. Many
researchers have used this sway and rocking model
in modeling the seismic behavior of foundations
(Mylonakis et al. 2006 and Ono et al. 2004), and it
is also implemented as an alternative structural
model in the design specifications of the
Architectural Institute of Japan (Architectural
Institute of Japan 1996). In this model, only three
displacement components are considered: lateral
displacement at pier top (u1, m); lateral
displacement at footing (u2, m); and footing
rotation (u3, rad). The model also involves three
inertial terms: the lump mass of the superstructure
(m1, kg); the lump mass of the footing (m2, kg); and
the rotational inertia (I, kg-m2) of the system. The
restoring force of the pier and the lateral and
Figure 1 Strengthening of RC pier
Figure 2 Idealized structural model of bridge
52
rotational restoring forces of the foundation are
represented by three springs, respectively: pier
spring (Rp, N); sway spring (Rs, N); and rocking
spring (Rr, N). The pier height in meters is denoted
by H. The equation of motion for the system can be
formulated as Eq. (1).
[ ]
−=
+
+
000
00
00
00
00
00
2
1
3
2
1
3
2
1
3
2
1
2
1
g
g
u
u
I
m
m
R
R
R
u
u
u
C
u
u
u
I
m
m
&&
&&
&
&
&
&&
&&
&&
(1)
In which, [C] is the damping matrix and gu&& is the
ground acceleration (m/s2). The restoring force
vector, {R} = {R1 R2 R3}T , is given here in the
global-coordinate sense.
After initializing the dynamic terms relating to
displacement, a solution is obtained for each time
step by applying Newmark’s integration scheme
(average acceleration). Firstly, the displacement
vector { }1~ +nu and the velocity vector { }1~ +nu& of the
predictor step (in global coordinates) are calculated
from Eq. (2) and Eq. (3) using the displacement
vector { }nu~ and the velocity vector { }nu~& from the
previous step, and ∆t is the interval time step in seconds (Combescure and Pegon 1997).
{ } { } { } { }nnnn
n
n
n
ut
utuu
u
u
u
&&&4
~
~
~
~2
1
1
3
1
2
1
1∆
+∆+==
+
+
+
+
(2)
{ } { } { }nnn
n
n
n
ut
uu
u
u
u
&&&&
&
&
&
2
~
~
~
~
1
1
3
1
2
1
1∆
+==
+
+
+
+
(3)
This displacement of the predictor step
{ }1~ +nglobalu is then mapped into the local coordinates
{ }1~ +nlocalu of each restoring spring using a
transformation matrix [T] given in Eq. (4). Next,
the displacements in the local coordinates are
applied to either a restoring force versus
displacement model or a displacement-controlled
test in order to evaluate the restoring force vector
{ }1~ +nlocalR in the local coordinates (predictor step). The
restoring force vector is then reversel-mapped back
to the global coordinates { }1~ +nglobalR using a
contravariant relationship, Eq. (5). In this study, the
restoring force of the pier spring was assumed to fit
a bi-linear model, whereas the restoring forces of
the sway and rocking springs are obtained from a
displacement-controlled test on a foundation
specimen.
−−
=
+
+
+
+
+
+
1
3
1
2
1
1
1
1
1
~
~
~
100
010
H11
~
~
~
n
n
n
n
r
n
s
n
p
u
u
u
u
u
u
or { } [ ]{ }11 ~~ ++ = n
global
n
local uTu
(4)
{ } [ ] { }11 ~~ ++ = n
local
Tn
global RTR
(5)
To avoid iteration in the calculation, the
restoring forces of the corrector step { }1+nR in Eq.
(6) is approximated according to the operator
splitting method (Nakashima et al. 1990), in which
the difference between the restoring forces in the
predictor step and the corrector step is assumed to
vary linearly with a stiffness equals to the initial
stiffness.
{ } [ ]{ } { } [ ]{ }1111 ~~ ++++ −+= nnnn uKIRuKIR
(6)
With the displacements { }1+nu and the
velocities { }1+nu& of the corrector step as shown in
Eq.(7) and Eq.(8), the acceleration vector { }1+nu&& is
found to be the only unknown in Eq. (1), so this
acceleration vector can be solved. The calculation
can thus proceed to the next step.
{ } { } { }12
11
1
3
1
2
1
1
4
~ +++
+
+
+
∆+==
nnn
n
n
n
ut
uu
u
u
u
&& (7)
{ } { } { }111
1
3
1
2
1
1
2
~ +++
+
+
+
∆+==
nnn
n
n
n
ut
uu
u
u
u
&&&&
&
&
& (8)
It should be noted that this 3-DOF model has a
limitation in that only the inertial interactions can
be taken into account. As a result, this system is
applicable when the inertial interactions play a
dominant role, which is valid in most cases of
bridges subjected to strong ground accelerations
(Meymand 1998).
3. EXPERIMENTAL SET UP
3.1 Target structure
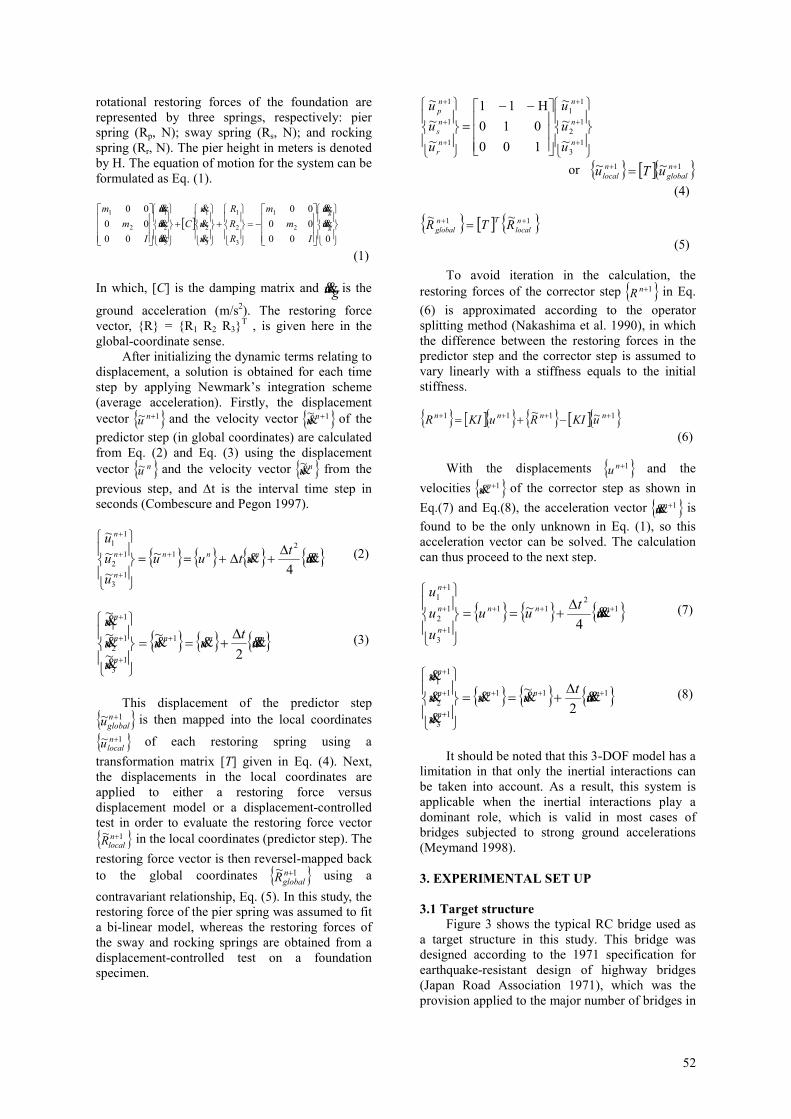
Figure 3 shows the typical RC bridge used as
a target structure in this study. This bridge was
designed according to the 1971 specification for
earthquake-resistant design of highway bridges
(Japan Road Association 1971), which was the
provision applied to the major number of bridges in
53
Japan before the 1995 Great Hanshin Earthquake.
The design lateral seismic force is 0.25 times the
weight of the superstructure, adopting the
allowable stress design method. Subsequently, the
bridge pier was strengthened by the concrete
jacketing technique with two times enhancement in
flexural capacity.
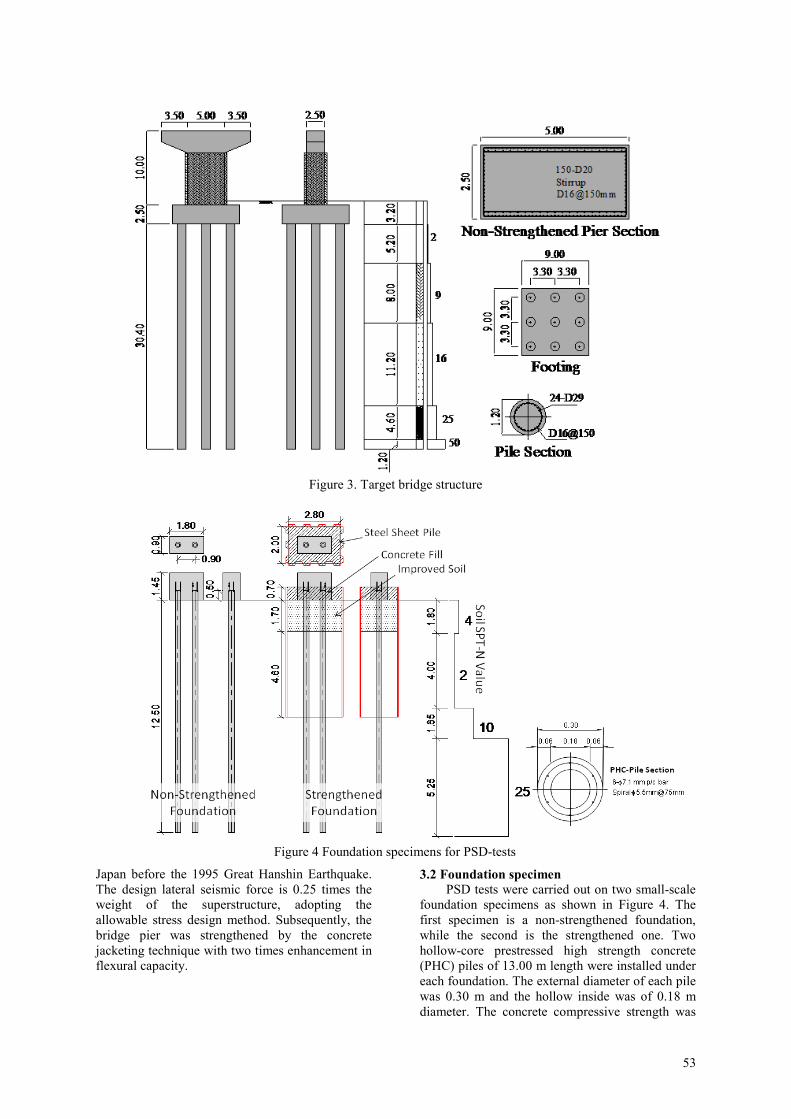
3.2 Foundation specimen
PSD tests were carried out on two small-scale
foundation specimens as shown in Figure 4. The
first specimen is a non-strengthened foundation,
while the second is the strengthened one. Two
hollow-core prestressed high strength concrete
(PHC) piles of 13.00 m length were installed under
each foundation. The external diameter of each pile
was 0.30 m and the hollow inside was of 0.18 m
diameter. The concrete compressive strength was
Figure 3. Target bridge structure
Figure 4 Foundation specimens for PSD-tests
54
79 MPa, and the yield stress of the prestressing
bars was 1,275 MPa. Strain gages were attached
along the prestressing bar inside the piles to
investigate damage.
The piles were installed using the outside-
drilling technique. In the installation process, the
ground was first removed with an auger and then
the drilled holes were stabilized by cement-
bentonite slurry. The piles were then installed with
their lower tips resting at -12.50 m in a sand
stratum with a standard penetration value (SPT-N
value) of 25. The full soil profile is also presented
in Figure 4. The piles tops were anchored 0.50 m
into the footing. The dimension of the footing was
0.90x1.80x1.45 m. In the case of the non-
strengthened foundation, a gap of 0.03 m was
provided in order to prevent friction between the
footing and the ground.
The strengthening of the second specimen
(Fukada et al. 2007) was carried out by installing
steel sheet piles around the perimeter of the footing,
maintaining a nominal clearance of 0.50 m. The
sheet piles were of 7.00 m length, and were
embedded -6.30 m into the ground. Their sections
were 400 x 100 x 10.5 mm (width x depth x
thickness). The ground enclosed by the sheet piles
was removed and replaced by improved soil with a
compressive strength of 1.8 MPa down to a depth
of -1.75 m. Above the ground, the space between
the footing and the sheet piles was filled up with
concrete.
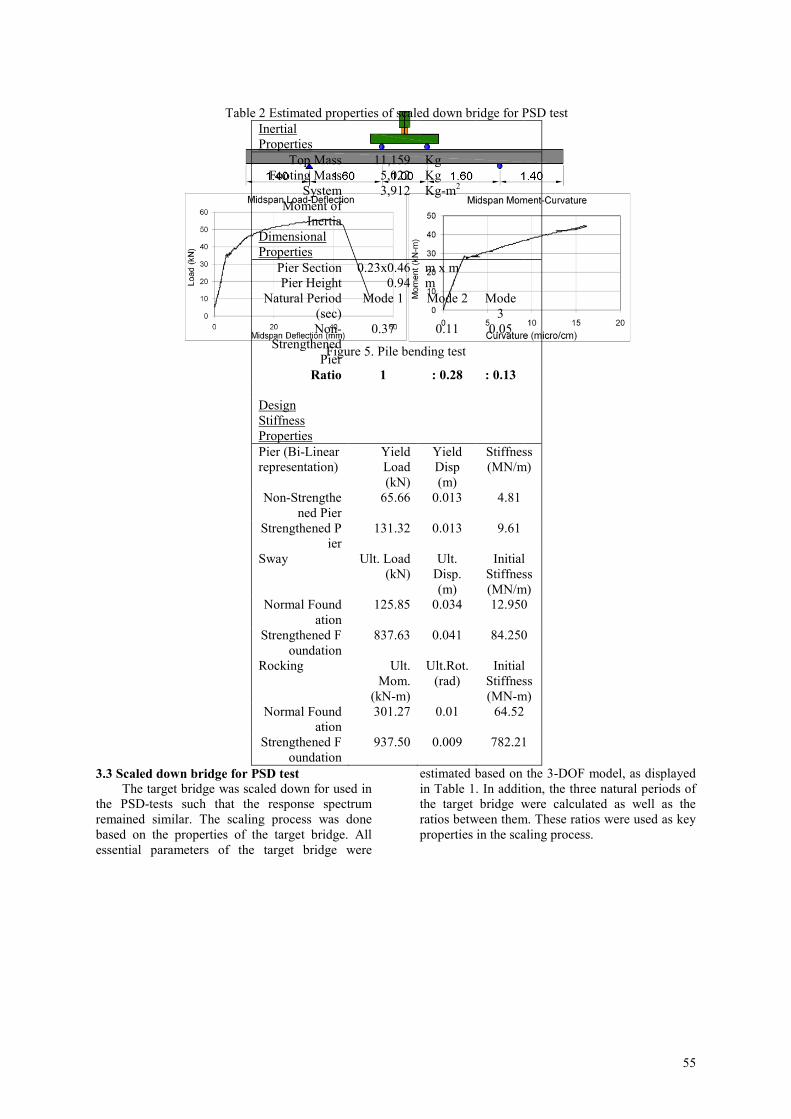
A bending test was conducted on a 7.00 m
length pile with a similar cross section, with the
results shown in Figure 5. The cracking curvature
was 2.3x10⁻⁶ mm
-1. However, no clear yield point
was observed. The failure mode was rupture of the
prestressing bar at a corresponding ultimate
curvature of 16.3x10⁻⁶ mm
-1.
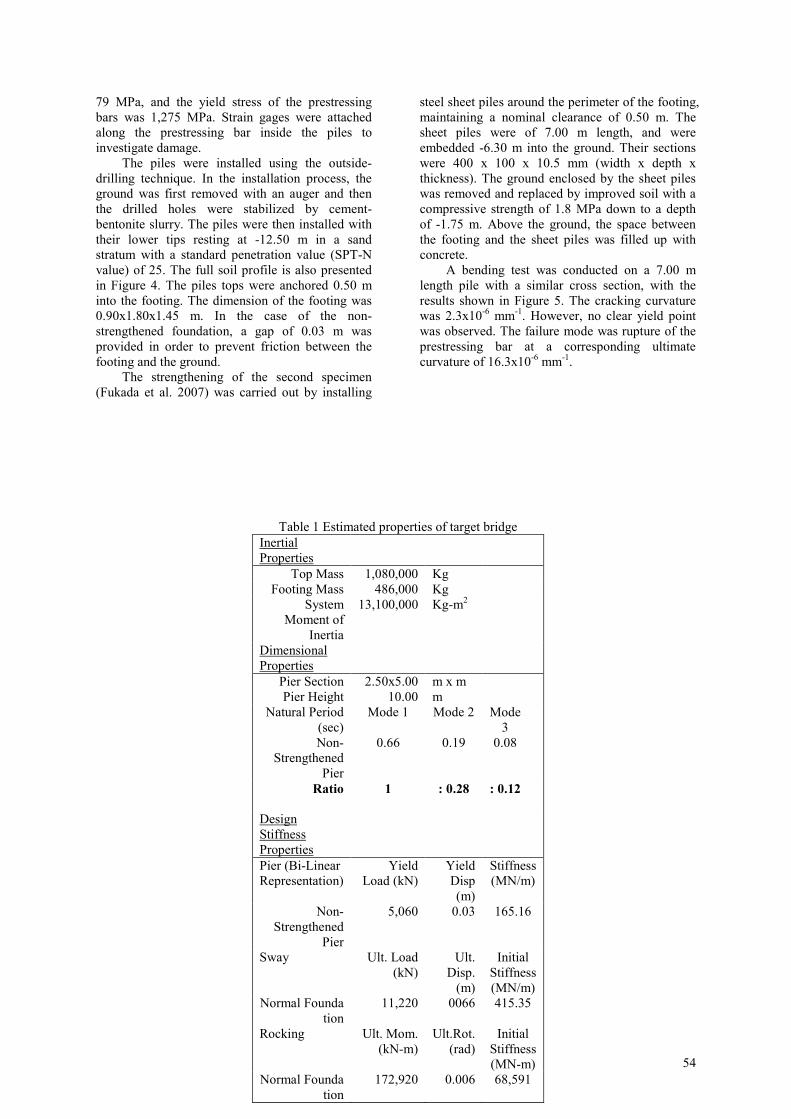
Table 1 Estimated properties of target bridge
Inertial
Properties
Top Mass 1,080,000 Kg
Footing Mass 486,000 Kg
System
Moment of
Inertia
13,100,000 Kg-m2
Dimensional
Properties
Pier Section 2.50x5.00 m x m
Pier Height 10.00 m
Natural Period
(sec)
Mode 1 Mode 2 Mode
3
Non-
Strengthened
Pier
0.66 0.19 0.08
Ratio 1 : 0.28 : 0.12
Design
Stiffness
Properties
Pier (Bi-Linear
Representation)
Yield
Load (kN)
Yield
Disp
(m)
Stiffness
(MN/m)
Non-
Strengthened
Pier
5,060 0.03 165.16
Sway Ult. Load
(kN)
Ult.
Disp.
(m)
Initial
Stiffness
(MN/m)
Normal Founda
tion
11,220 0066 415.35
Rocking Ult. Mom.
(kN-m)
Ult.Rot.
(rad)
Initial
Stiffness
(MN-m)
Normal Founda
tion
172,920 0.006 68,591
55
3.3 Scaled down bridge for PSD test The target bridge was scaled down for used in
the PSD-tests such that the response spectrum
remained similar. The scaling process was done
based on the properties of the target bridge. All
essential parameters of the target bridge were
estimated based on the 3-DOF model, as displayed
in Table 1. In addition, the three natural periods of
the target bridge were calculated as well as the
ratios between them. These ratios were used as key
properties in the scaling process.
Figure 5. Pile bending test
Table 2 Estimated properties of scaled down bridge for PSD test
Inertial
Properties
Top Mass 11,159 Kg
Footing Mass 5,022 Kg
System
Moment of
Inertia
3,912 Kg-m2
Dimensional
Properties
Pier Section 0.23x0.46 m x m
Pier Height 0.94 m
Natural Period
(sec)
Mode 1 Mode 2 Mode
3
Non-
Strengthened
Pier
0.37 0.11 0.05
Ratio 1 : 0.28 : 0.13
Design
Stiffness
Properties
Pier (Bi-Linear
representation)
Yield
Load
(kN)
Yield
Disp
(m)
Stiffness
(MN/m)
Non-Strengthe
ned Pier
65.66 0.013 4.81
Strengthened P
ier
131.32 0.013 9.61
Sway Ult. Load
(kN)
Ult.
Disp.
(m)
Initial
Stiffness
(MN/m)
Normal Found
ation
125.85 0.034 12.950
Strengthened F
oundation
837.63 0.041 84.250
Rocking Ult.
Mom.
(kN-m)
Ult.Rot.
(rad)
Initial
Stiffness
(MN-m)
Normal Found
ation
301.27 0.01 64.52
Strengthened F
oundation
937.50 0.009 782.21
56
The ultimate loads and deformations of the
non-strengthened foundation specimen were
separately estimated for sway and rocking motions.
The other parameters of the scaled-down bridge
were then selected in order that the ratios of the
three natural periods of the target bridge match
those of the scaled-down bridge. As a result,
parameters for the non-strengthened scaled-down
bridge could be set up as shown in Table 2. Finally,
the properties of the pier strengthening, also shown
in Table 2, were determined assuming two times
enhanced load carrying capacity and stiffness. In
addition, the ultimate load and deformation of the
strengthened foundation specimen were also
estimated.
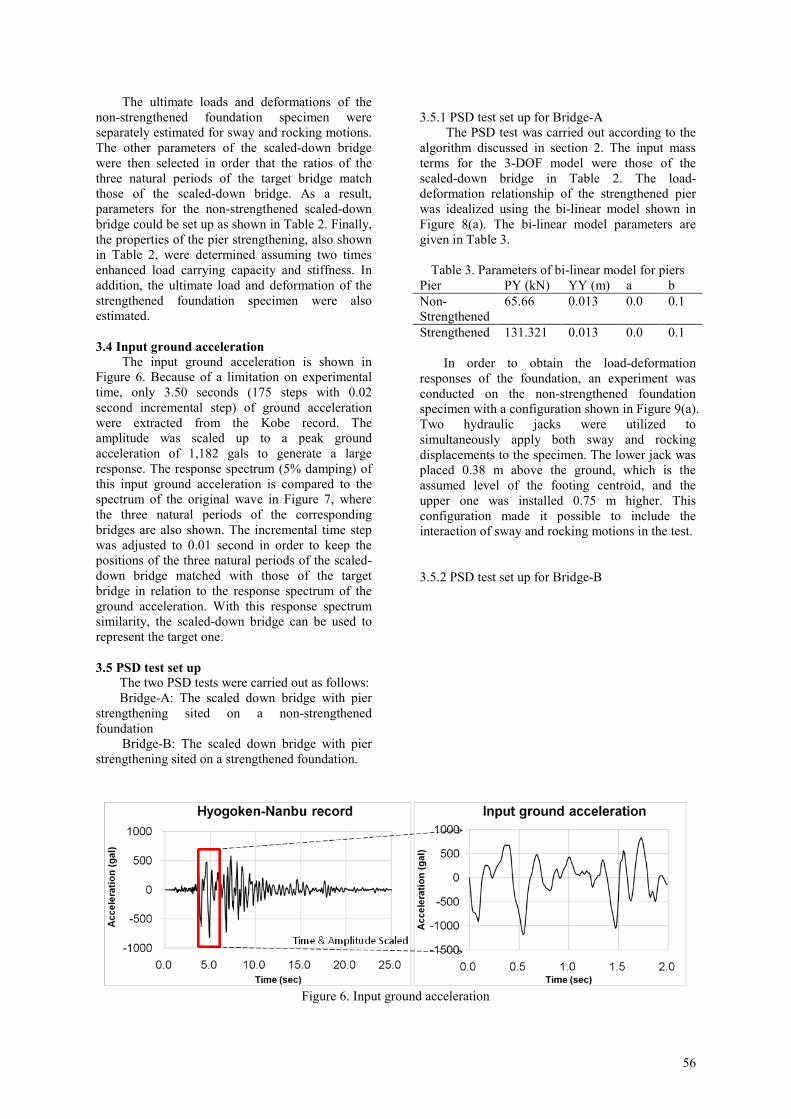
3.4 Input ground acceleration
The input ground acceleration is shown in
Figure 6. Because of a limitation on experimental
time, only 3.50 seconds (175 steps with 0.02
second incremental step) of ground acceleration
were extracted from the Kobe record. The
amplitude was scaled up to a peak ground
acceleration of 1,182 gals to generate a large
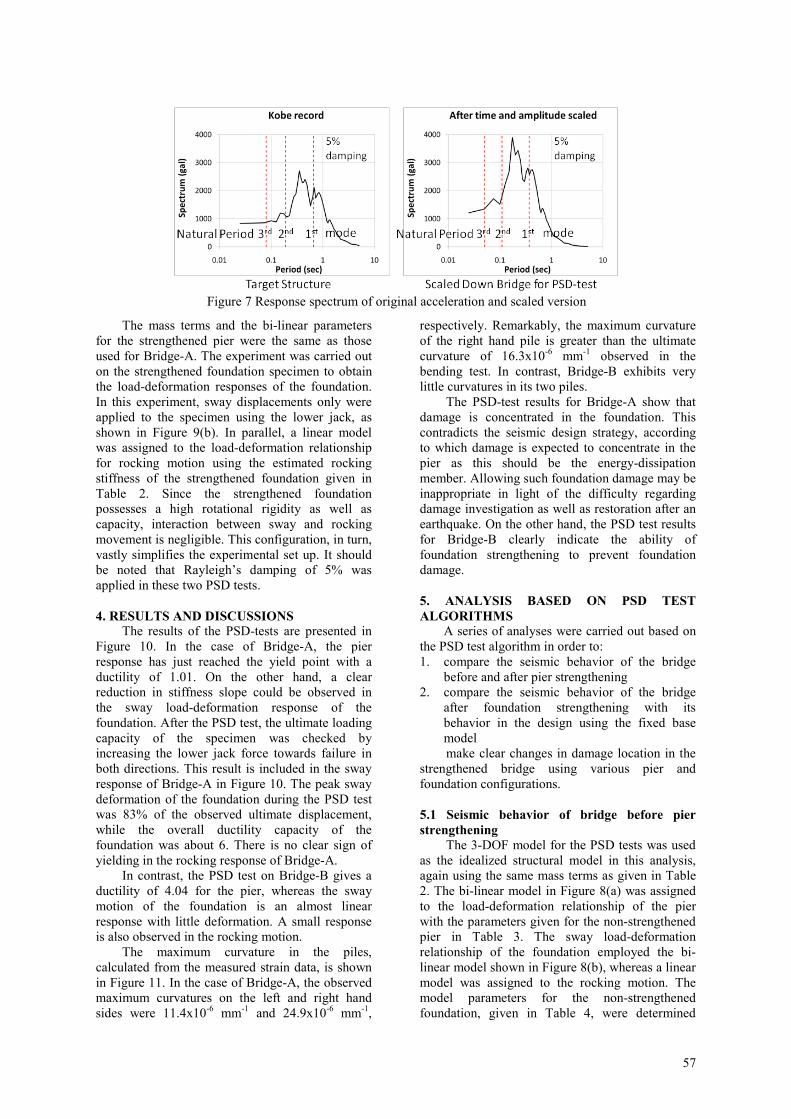
response. The response spectrum (5% damping) of
this input ground acceleration is compared to the
spectrum of the original wave in Figure 7, where
the three natural periods of the corresponding
bridges are also shown. The incremental time step
was adjusted to 0.01 second in order to keep the
positions of the three natural periods of the scaled-
down bridge matched with those of the target
bridge in relation to the response spectrum of the
ground acceleration. With this response spectrum
similarity, the scaled-down bridge can be used to
represent the target one.
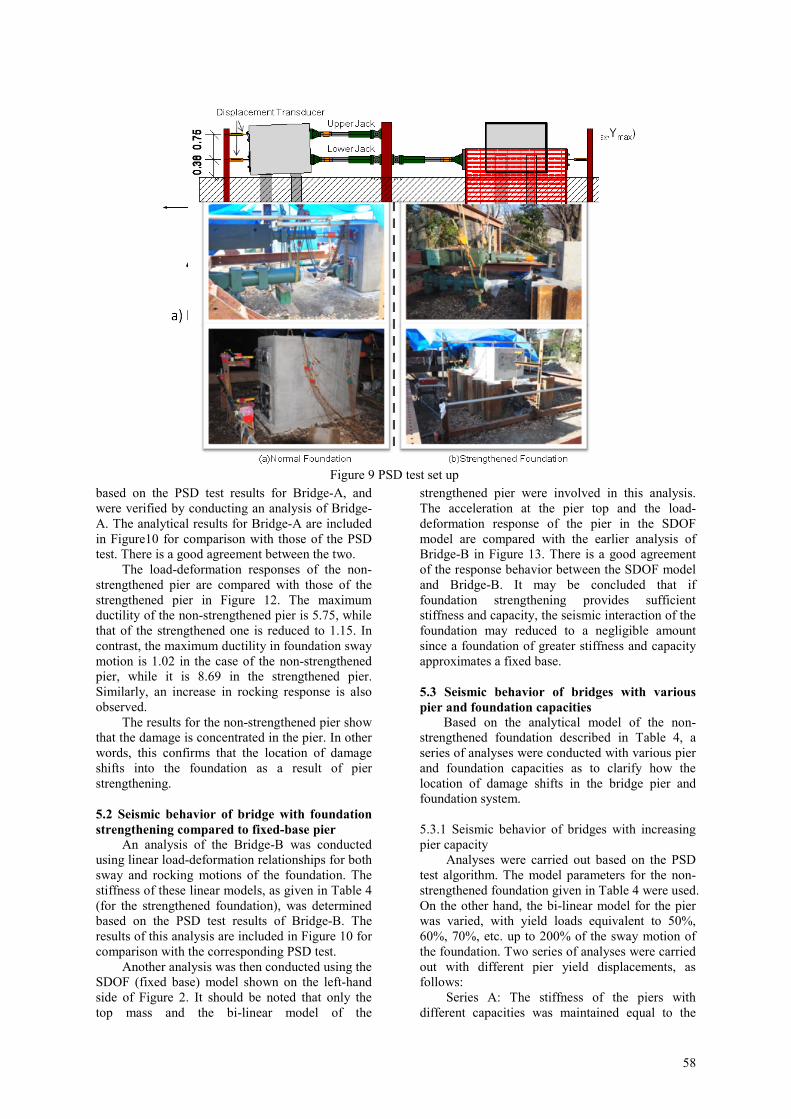
3.5 PSD test set up
The two PSD tests were carried out as follows:
Bridge-A: The scaled down bridge with pier
strengthening sited on a non-strengthened
foundation
Bridge-B: The scaled down bridge with pier
strengthening sited on a strengthened foundation.
3.5.1 PSD test set up for Bridge-A
The PSD test was carried out according to the
algorithm discussed in section 2. The input mass
terms for the 3-DOF model were those of the
scaled-down bridge in Table 2. The load-
deformation relationship of the strengthened pier
was idealized using the bi-linear model shown in
Figure 8(a). The bi-linear model parameters are
given in Table 3.
Table 3. Parameters of bi-linear model for piers
Pier PY (kN) YY (m) a b
Non-
Strengthened
65.66 0.013 0.0 0.1
Strengthened 131.321 0.013 0.0 0.1
In order to obtain the load-deformation
responses of the foundation, an experiment was
conducted on the non-strengthened foundation
specimen with a configuration shown in Figure 9(a).
Two hydraulic jacks were utilized to
simultaneously apply both sway and rocking
displacements to the specimen. The lower jack was
placed 0.38 m above the ground, which is the
assumed level of the footing centroid, and the
upper one was installed 0.75 m higher. This
configuration made it possible to include the
interaction of sway and rocking motions in the test.
3.5.2 PSD test set up for Bridge-B
Figure 6. Input ground acceleration
57
The mass terms and the bi-linear parameters
for the strengthened pier were the same as those
used for Bridge-A. The experiment was carried out
on the strengthened foundation specimen to obtain
the load-deformation responses of the foundation.
In this experiment, sway displacements only were
applied to the specimen using the lower jack, as
shown in Figure 9(b). In parallel, a linear model
was assigned to the load-deformation relationship
for rocking motion using the estimated rocking
stiffness of the strengthened foundation given in
Table 2. Since the strengthened foundation
possesses a high rotational rigidity as well as
capacity, interaction between sway and rocking
movement is negligible. This configuration, in turn,
vastly simplifies the experimental set up. It should
be noted that Rayleigh’s damping of 5% was
applied in these two PSD tests.
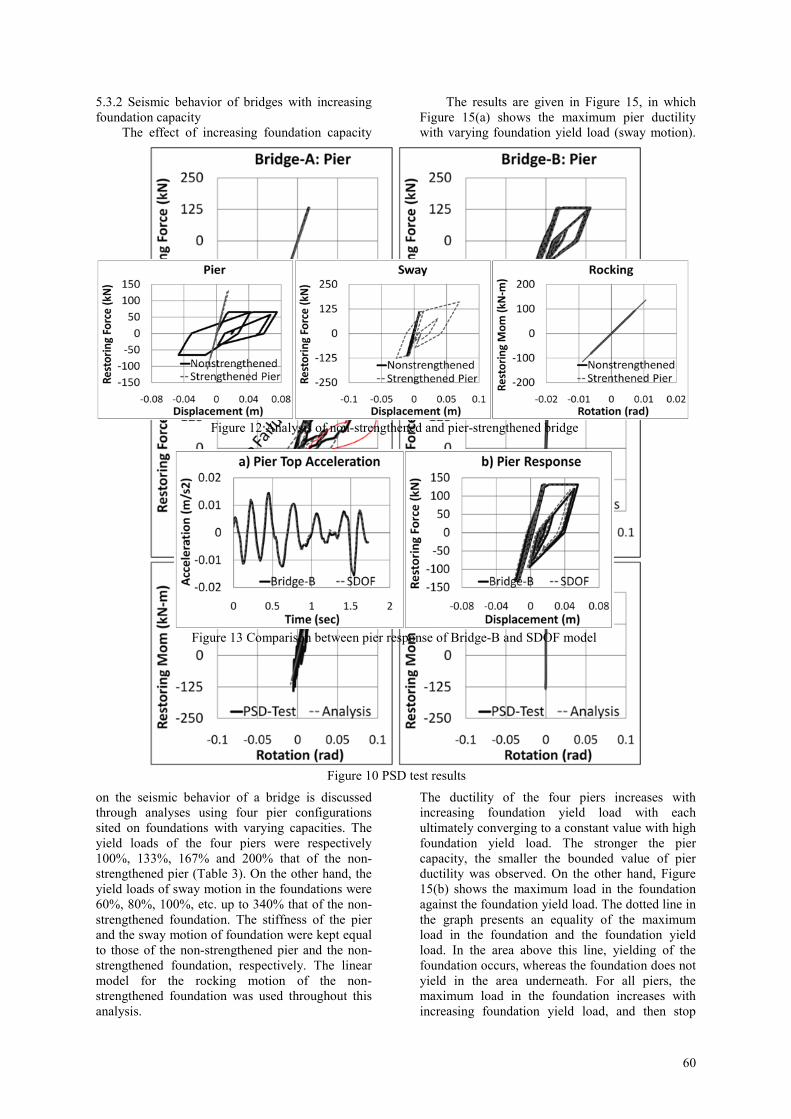
4. RESULTS AND DISCUSSIONS
The results of the PSD-tests are presented in
Figure 10. In the case of Bridge-A, the pier
response has just reached the yield point with a
ductility of 1.01. On the other hand, a clear
reduction in stiffness slope could be observed in
the sway load-deformation response of the
foundation. After the PSD test, the ultimate loading
capacity of the specimen was checked by
increasing the lower jack force towards failure in
both directions. This result is included in the sway
response of Bridge-A in Figure 10. The peak sway
deformation of the foundation during the PSD test
was 83% of the observed ultimate displacement,
while the overall ductility capacity of the
foundation was about 6. There is no clear sign of
yielding in the rocking response of Bridge-A.
In contrast, the PSD test on Bridge-B gives a
ductility of 4.04 for the pier, whereas the sway
motion of the foundation is an almost linear
response with little deformation. A small response
is also observed in the rocking motion.
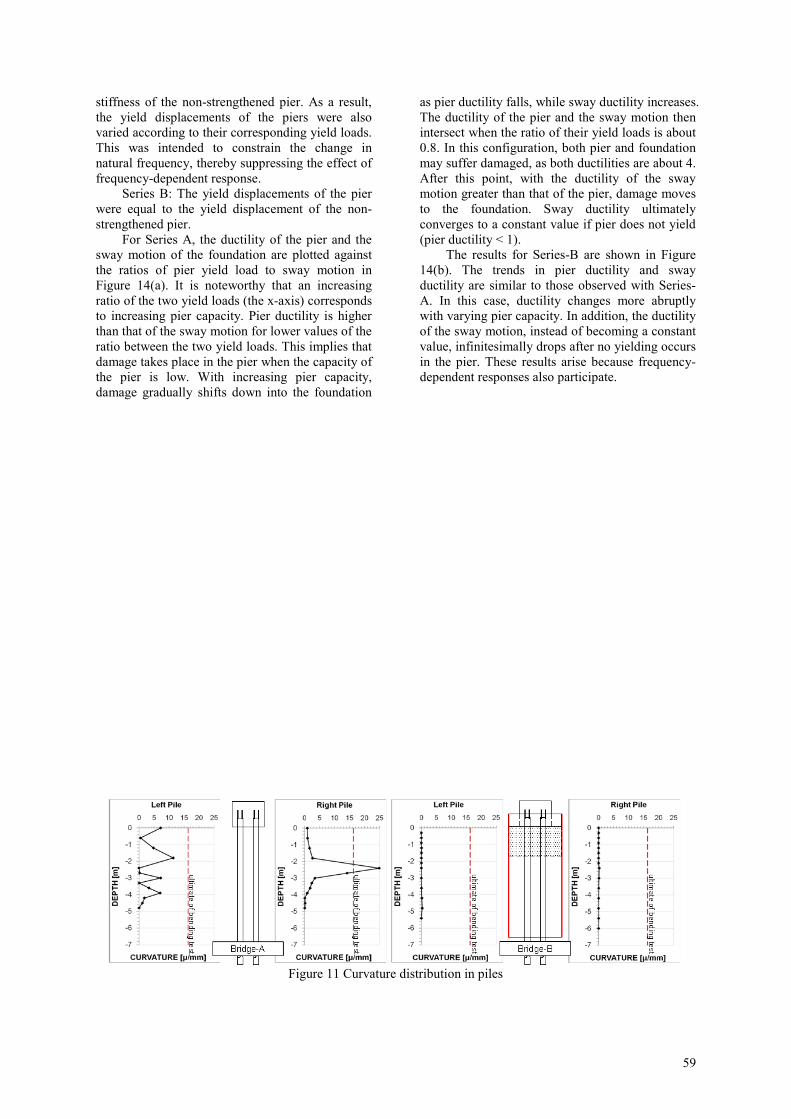
The maximum curvature in the piles,
calculated from the measured strain data, is shown
in Figure 11. In the case of Bridge-A, the observed
maximum curvatures on the left and right hand
sides were 11.4x10⁻⁶ mm
-1 and 24.9x10
-6 mm
-1,
respectively. Remarkably, the maximum curvature
of the right hand pile is greater than the ultimate
curvature of 16.3x10⁻⁶ mm
-1 observed in the
bending test. In contrast, Bridge-B exhibits very
little curvatures in its two piles.
The PSD-test results for Bridge-A show that
damage is concentrated in the foundation. This
contradicts the seismic design strategy, according
to which damage is expected to concentrate in the
pier as this should be the energy-dissipation
member. Allowing such foundation damage may be
inappropriate in light of the difficulty regarding
damage investigation as well as restoration after an
earthquake. On the other hand, the PSD test results
for Bridge-B clearly indicate the ability of
foundation strengthening to prevent foundation
damage.
5. ANALYSIS BASED ON PSD TEST
ALGORITHMS
A series of analyses were carried out based on
the PSD test algorithm in order to:
1. compare the seismic behavior of the bridge
before and after pier strengthening
2. compare the seismic behavior of the bridge
after foundation strengthening with its
behavior in the design using the fixed base
model
make clear changes in damage location in the
strengthened bridge using various pier and
foundation configurations.
5.1 Seismic behavior of bridge before pier
strengthening The 3-DOF model for the PSD tests was used
as the idealized structural model in this analysis,
again using the same mass terms as given in Table
2. The bi-linear model in Figure 8(a) was assigned
to the load-deformation relationship of the pier
with the parameters given for the non-strengthened
pier in Table 3. The sway load-deformation
relationship of the foundation employed the bi-
linear model shown in Figure 8(b), whereas a linear
model was assigned to the rocking motion. The
model parameters for the non-strengthened
foundation, given in Table 4, were determined
Figure 7 Response spectrum of original acceleration and scaled version
58
based on the PSD test results for Bridge-A, and
were verified by conducting an analysis of Bridge-
A. The analytical results for Bridge-A are included
in Figure10 for comparison with those of the PSD
test. There is a good agreement between the two.
The load-deformation responses of the non-
strengthened pier are compared with those of the
strengthened pier in Figure 12. The maximum
ductility of the non-strengthened pier is 5.75, while
that of the strengthened one is reduced to 1.15. In
contrast, the maximum ductility in foundation sway
motion is 1.02 in the case of the non-strengthened
pier, while it is 8.69 in the strengthened pier.
Similarly, an increase in rocking response is also
observed.
The results for the non-strengthened pier show
that the damage is concentrated in the pier. In other
words, this confirms that the location of damage
shifts into the foundation as a result of pier
strengthening.
5.2 Seismic behavior of bridge with foundation
strengthening compared to fixed-base pier An analysis of the Bridge-B was conducted
using linear load-deformation relationships for both
sway and rocking motions of the foundation. The
stiffness of these linear models, as given in Table 4
(for the strengthened foundation), was determined
based on the PSD test results of Bridge-B. The
results of this analysis are included in Figure 10 for
comparison with the corresponding PSD test.
Another analysis was then conducted using the
SDOF (fixed base) model shown on the left-hand
side of Figure 2. It should be noted that only the
top mass and the bi-linear model of the
strengthened pier were involved in this analysis.
The acceleration at the pier top and the load-
deformation response of the pier in the SDOF
model are compared with the earlier analysis of
Bridge-B in Figure 13. There is a good agreement
of the response behavior between the SDOF model
and Bridge-B. It may be concluded that if
foundation strengthening provides sufficient
stiffness and capacity, the seismic interaction of the
foundation may reduced to a negligible amount
since a foundation of greater stiffness and capacity
approximates a fixed base.
5.3 Seismic behavior of bridges with various
pier and foundation capacities Based on the analytical model of the non-
strengthened foundation described in Table 4, a
series of analyses were conducted with various pier
and foundation capacities as to clarify how the
location of damage shifts in the bridge pier and
foundation system.
5.3.1 Seismic behavior of bridges with increasing
pier capacity
Analyses were carried out based on the PSD
test algorithm. The model parameters for the non-
strengthened foundation given in Table 4 were used.
On the other hand, the bi-linear model for the pier
was varied, with yield loads equivalent to 50%,
60%, 70%, etc. up to 200% of the sway motion of
the foundation. Two series of analyses were carried
out with different pier yield displacements, as
follows:
Series A: The stiffness of the piers with
different capacities was maintained equal to the
Figure 8 Bi-linear model for calculation of restoring force
Figure 9 PSD test set up
59
stiffness of the non-strengthened pier. As a result,
the yield displacements of the piers were also
varied according to their corresponding yield loads.
This was intended to constrain the change in
natural frequency, thereby suppressing the effect of
frequency-dependent response.
Series B: The yield displacements of the pier
were equal to the yield displacement of the non-
strengthened pier.
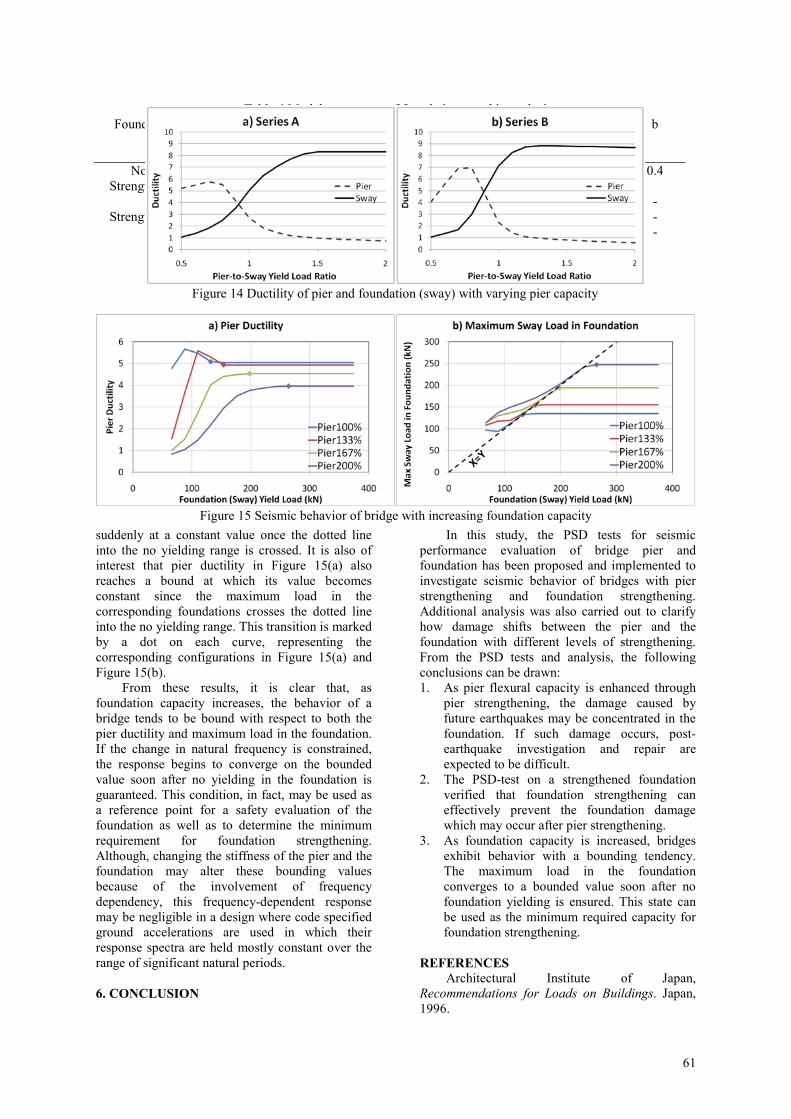
For Series A, the ductility of the pier and the
sway motion of the foundation are plotted against
the ratios of pier yield load to sway motion in
Figure 14(a). It is noteworthy that an increasing
ratio of the two yield loads (the x-axis) corresponds
to increasing pier capacity. Pier ductility is higher
than that of the sway motion for lower values of the
ratio between the two yield loads. This implies that
damage takes place in the pier when the capacity of
the pier is low. With increasing pier capacity,
damage gradually shifts down into the foundation
as pier ductility falls, while sway ductility increases.
The ductility of the pier and the sway motion then
intersect when the ratio of their yield loads is about
0.8. In this configuration, both pier and foundation
may suffer damaged, as both ductilities are about 4.
After this point, with the ductility of the sway
motion greater than that of the pier, damage moves
to the foundation. Sway ductility ultimately
converges to a constant value if pier does not yield
(pier ductility < 1).
The results for Series-B are shown in Figure
14(b). The trends in pier ductility and sway
ductility are similar to those observed with Series-
A. In this case, ductility changes more abruptly
with varying pier capacity. In addition, the ductility
of the sway motion, instead of becoming a constant
value, infinitesimally drops after no yielding occurs
in the pier. These results arise because frequency-
dependent responses also participate.
Figure 11 Curvature distribution in piles
60
5.3.2 Seismic behavior of bridges with increasing
foundation capacity
The effect of increasing foundation capacity
on the seismic behavior of a bridge is discussed
through analyses using four pier configurations
sited on foundations with varying capacities. The
yield loads of the four piers were respectively
100%, 133%, 167% and 200% that of the non-
strengthened pier (Table 3). On the other hand, the
yield loads of sway motion in the foundations were
60%, 80%, 100%, etc. up to 340% that of the non-
strengthened foundation. The stiffness of the pier
and the sway motion of foundation were kept equal
to those of the non-strengthened pier and the non-
strengthened foundation, respectively. The linear
model for the rocking motion of the non-
strengthened foundation was used throughout this
analysis.
The results are given in Figure 15, in which
Figure 15(a) shows the maximum pier ductility
with varying foundation yield load (sway motion).
The ductility of the four piers increases with
increasing foundation yield load with each
ultimately converging to a constant value with high
foundation yield load. The stronger the pier
capacity, the smaller the bounded value of pier
ductility was observed. On the other hand, Figure
15(b) shows the maximum load in the foundation
against the foundation yield load. The dotted line in
the graph presents an equality of the maximum
load in the foundation and the foundation yield
load. In the area above this line, yielding of the
foundation occurs, whereas the foundation does not
yield in the area underneath. For all piers, the
maximum load in the foundation increases with
increasing foundation yield load, and then stop
Figure 10 PSD test results
Figure 12 Analysis of non-strengthened and pier-strengthened bridge
Figure 13 Comparison between pier response of Bridge-B and SDOF model
61
suddenly at a constant value once the dotted line
into the no yielding range is crossed. It is also of
interest that pier ductility in Figure 15(a) also
reaches a bound at which its value becomes
constant since the maximum load in the
corresponding foundations crosses the dotted line
into the no yielding range. This transition is marked
by a dot on each curve, representing the
corresponding configurations in Figure 15(a) and
Figure 15(b).
From these results, it is clear that, as
foundation capacity increases, the behavior of a
bridge tends to be bound with respect to both the
pier ductility and maximum load in the foundation.
If the change in natural frequency is constrained,
the response begins to converge on the bounded
value soon after no yielding in the foundation is
guaranteed. This condition, in fact, may be used as
a reference point for a safety evaluation of the
foundation as well as to determine the minimum
requirement for foundation strengthening.
Although, changing the stiffness of the pier and the
foundation may alter these bounding values
because of the involvement of frequency
dependency, this frequency-dependent response
may be negligible in a design where code specified
ground accelerations are used in which their
response spectra are held mostly constant over the
range of significant natural periods.
6. CONCLUSION
In this study, the PSD tests for seismic
performance evaluation of bridge pier and
foundation has been proposed and implemented to
investigate seismic behavior of bridges with pier
strengthening and foundation strengthening.
Additional analysis was also carried out to clarify
how damage shifts between the pier and the
foundation with different levels of strengthening.
From the PSD tests and analysis, the following
conclusions can be drawn:
1. As pier flexural capacity is enhanced through
pier strengthening, the damage caused by
future earthquakes may be concentrated in the
foundation. If such damage occurs, post-
earthquake investigation and repair are
expected to be difficult.
2. The PSD-test on a strengthened foundation
verified that foundation strengthening can
effectively prevent the foundation damage
which may occur after pier strengthening.
3. As foundation capacity is increased, bridges
exhibit behavior with a bounding tendency.
The maximum load in the foundation
converges to a bounded value soon after no
foundation yielding is ensured. This state can
be used as the minimum required capacity for
foundation strengthening.
REFERENCES
Architectural Institute of Japan,
Recommendations for Loads on Buildings. Japan,
1996.
Table 4 Model parameters of foundations used in analysis
Foundation Motion Model Initial Stiffness
(kN/m) or (kN-
m/rad)
PY
(kN)
YY
(m)
a b
Sway Bi-
linear
13,750 110 0.008 0.06 0.4 Non-
Strengthened
Rocking Linear 12,904 - - - -
Sway Linear 103,647 - - - - Strengthened
Rocking Linear 782,000 - - - -
Figure 15 Seismic behavior of bridge with increasing foundation capacity
Figure 14 Ductility of pier and foundation (sway) with varying pier capacity
62
Combescure D, Pegon P. α-operator splitting time integration technique for pseudodynamic
testing-error propagation analysis. Soil Dynamics
and Earthquake Engineering, 1997; 16: 427-443.
Dermitzakis SN, Stavros N, Mahin SA.
Development of substructuring techniques for on-
line computer controlled seismic performance
testing. UCB/EERC-85/04, Earthquake Engineering
Research Center: Berkeley, 1985.
Fukada H, Kato K, Segawa N, Ooya T and
Shioi Y. A study of reinforcement methods for
existing bridges on soft ground with a solidification
improvement. Advanced in Deep Foundations,
Taylor & Francis Group, London, 2007.
Japan Road Association, Specifications for
highway bridges. Japan, 2002.
Japan Road Association, Specifications for
highway bridges. Japan, 1971. (in Japanese).
Jung RY, Shing PB, Stauffer E and Thoen B.
Performance of a real-time pseudo-dynamic test
system considering non-linear structural response.
Earthquake Engineering and Structural Dynamics
2007; 36:1785-1809.
Kawashima K, Shigeki U. Impact of
Hanshin/Awaji earthquake on seismic design and
seismic strengthening of highway bridges. 1995
Hyogoken-nanbu earthquake, Committee of
Earthquake Engineering – Japan Society of Civil
Engineers, June, 1996.
Kobayashi H, Tamura K, Tanimoto S, Hybrid
vibration experiments with a bridge foundation
system model. Soil Dynamics and Earthquake
Engineering 2002; 22:1135-1141.
Meymand PJ, ‘Shaking table scale model test
of non-linear soil-pile-superstructure interaction in
soft clay’, Ph.D. Dissertation, University of
California, Berkeley, 1998.
Unjoh S, Terayama T, Adachi Y and Hishikuma J.
Seismic retrofit of existing highway bridges in
Japan. Cement and concrete composites 2000;
22(1):1-16.
Mylonakis G, Nikolaou S and Gazetas G.
Footing under seismic loading: analysis and design
issues with emphasis on bridge foundations. Soil
Dynamics and Earthquake Engineering 2006;
26:824-853.
Nakashima M, Kaminosono T, Ishida M, Ando
K. Integration Technique for Substructure Pseudo
Dynamic Test. Proc. of the 4th U.S. National
Conference on Earthquake Engineering, 1990;
2:515-524.
Nakashima N, Kato H, Takaoka E.
Development of real-time pseudo dynamic testing.
Earthquake Engineering and Structural Dynamics
1992; 21:79-92.
Ono Y, Kiyono J, Toki K. Effects of pile-
foundation-soil interaction on demanded strength
of highway bridge pier. Proc. of the 13th World
Conference on Earthquake Engineering, Paper no.
168, Vancouver, Canada, 2004.
Pegon P, Pinto AV. Pseudo-dynamic testing
with substructuring at the ELSA laboratory.
Earthquake Engineering and Structural Dynamics
2000; 29:905-925.
Pinto AV, Pegon P, Magonette G and Tsionis
G. Pseudo-dynamic testing of bridges using non-
linear substructuring. Earthquake Engineering and
Structural Dynamics 2004; 33:1125-1146.
Priestly NMJ, Seible F and Calvi M. Seismic
Design and Retrofit of Bridges. John Wiley &
Sons: New York, 1996.
Shing PB, Nakashima M, Bursi OS.
Application of pseudodynamic test method to
structural research. Earthquake Spectra 1996;
12(1):29-56.
Takanashi K, Nakashima M. Japanese
activities on on-Line testing. Journal of
Engineering Mechanics (ASCE) 1987;
113(7):1014-1032.
Task Group 7.4 – International Federation for
Structural Concrete (fib) (Bullentin 39), Seismic
bridge design and retrofit – structural solutions.
Sprint-Digital-Druck: Stuttgart, 2007.
Toki K, Sato T, Kiyono J, Garmroudi N K,
Emi S, Yoshikawa M, Hybrid experiments on non-
linear earthquake-induced soil-structure interaction.
Earthquake Engineering & Structural Dynamics
1990; 19:709-723.