Embed Size (px)
Citation preview
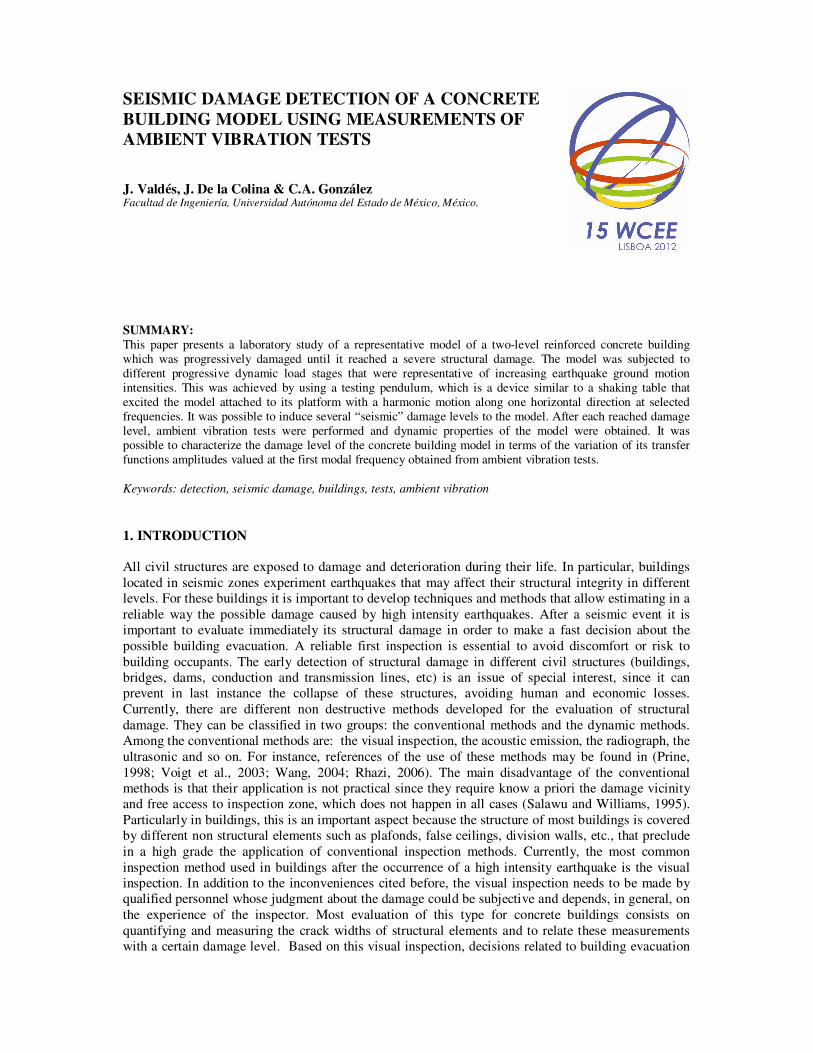
SEISMIC DAMAGE DETECTION OF A CONCRETE
BUILDING MODEL USING MEASUREMENTS OF
AMBIENT VIBRATION TESTS
J. Valdés, J. De la Colina & C.A. González Facultad de Ingeniería, Universidad Autónoma del Estado de México, México.
SUMMARY: This paper presents a laboratory study of a representative model of a two-level reinforced concrete building
which was progressively damaged until it reached a severe structural damage. The model was subjected to
different progressive dynamic load stages that were representative of increasing earthquake ground motion
intensities. This was achieved by using a testing pendulum, which is a device similar to a shaking table that
excited the model attached to its platform with a harmonic motion along one horizontal direction at selected
frequencies. It was possible to induce several “seismic” damage levels to the model. After each reached damage
level, ambient vibration tests were performed and dynamic properties of the model were obtained. It was
possible to characterize the damage level of the concrete building model in terms of the variation of its transfer
functions amplitudes valued at the first modal frequency obtained from ambient vibration tests.
Keywords: detection, seismic damage, buildings, tests, ambient vibration
1. INTRODUCTION
All civil structures are exposed to damage and deterioration during their life. In particular, buildings
located in seismic zones experiment earthquakes that may affect their structural integrity in different
levels. For these buildings it is important to develop techniques and methods that allow estimating in a
reliable way the possible damage caused by high intensity earthquakes. After a seismic event it is
important to evaluate immediately its structural damage in order to make a fast decision about the
possible building evacuation. A reliable first inspection is essential to avoid discomfort or risk to
building occupants. The early detection of structural damage in different civil structures (buildings,
bridges, dams, conduction and transmission lines, etc) is an issue of special interest, since it can
prevent in last instance the collapse of these structures, avoiding human and economic losses.
Currently, there are different non destructive methods developed for the evaluation of structural
damage. They can be classified in two groups: the conventional methods and the dynamic methods.
Among the conventional methods are: the visual inspection, the acoustic emission, the radiograph, the
ultrasonic and so on. For instance, references of the use of these methods may be found in (Prine,
1998; Voigt et al., 2003; Wang, 2004; Rhazi, 2006). The main disadvantage of the conventional
methods is that their application is not practical since they require know a priori the damage vicinity
and free access to inspection zone, which does not happen in all cases (Salawu and Williams, 1995).
Particularly in buildings, this is an important aspect because the structure of most buildings is covered
by different non structural elements such as plafonds, false ceilings, division walls, etc., that preclude
in a high grade the application of conventional inspection methods. Currently, the most common
inspection method used in buildings after the occurrence of a high intensity earthquake is the visual
inspection. In addition to the inconveniences cited before, the visual inspection needs to be made by
qualified personnel whose judgment about the damage could be subjective and depends, in general, on
the experience of the inspector. Most evaluation of this type for concrete buildings consists on
quantifying and measuring the crack widths of structural elements and to relate these measurements
with a certain damage level. Based on this visual inspection, decisions related to building evacuation
or conducting detailed studies are made. The large number of building structures that need to be
evaluated after an intense earthquake and the small number of qualified personnel that can perform
these visual inspections shows the necessity of changing conventional inspection for automatic and
more reliable methods.
In contrast, the dynamic methods are based on the vibration measurements of the structure to evaluate
the damage. These methods are supported on the hypothesis that any structural damage represents a
degradation of the structure stiffness which will modify their building dynamic properties (natural
frequencies, modal damping ratios, mode shapes (including derivatives), etc.). Dynamic methods seem
to be one of the most practical procedures for damage detection. They have the advantage of not
requiring a priori information about damage location, nor complete free access to inspection zones.
Studies using these types of methods have been carried out with results that show the advantages of
using them. Doebling et al. (1996) present an extensive description of different dynamic methods and
a literature review related to them. The future for dynamic methods is promissory, but there are many
questions to be solved before they can be reliably applied in an extensive way.
This paper presents a laboratory study of a representative model of a two-level reinforced concrete
building which was progressively damaged until it reached a severe structural damage. Unlike other
similar experimental studies in which the structural damage was made in an “artificial” way, in this
study the model was subjected to different progressive dynamic load stages that were representative of
increasing earthquake ground motion intensities. This was achieved by using a testing pendulum,
which is a device similar to a shaking table that excited the model attached to its platform with a
harmonic motion along one horizontal direction at selected frequencies. Using this device, it was
possible to induce several “seismic” damage levels to the model. After each reached damage level,
ambient vibration tests were performed and dynamic properties of the model were obtained. The
objective of the study was to characterize the damage level of the concrete building model tested on
laboratory in terms of the variation of some characteristic related to its dynamic response calculated through ambient vibration tests. It was possible to characterize the damage level of the concrete
building model tested on laboratory in terms of the variation of its transfer functions amplitudes
valued at the first modal frequency of the model.
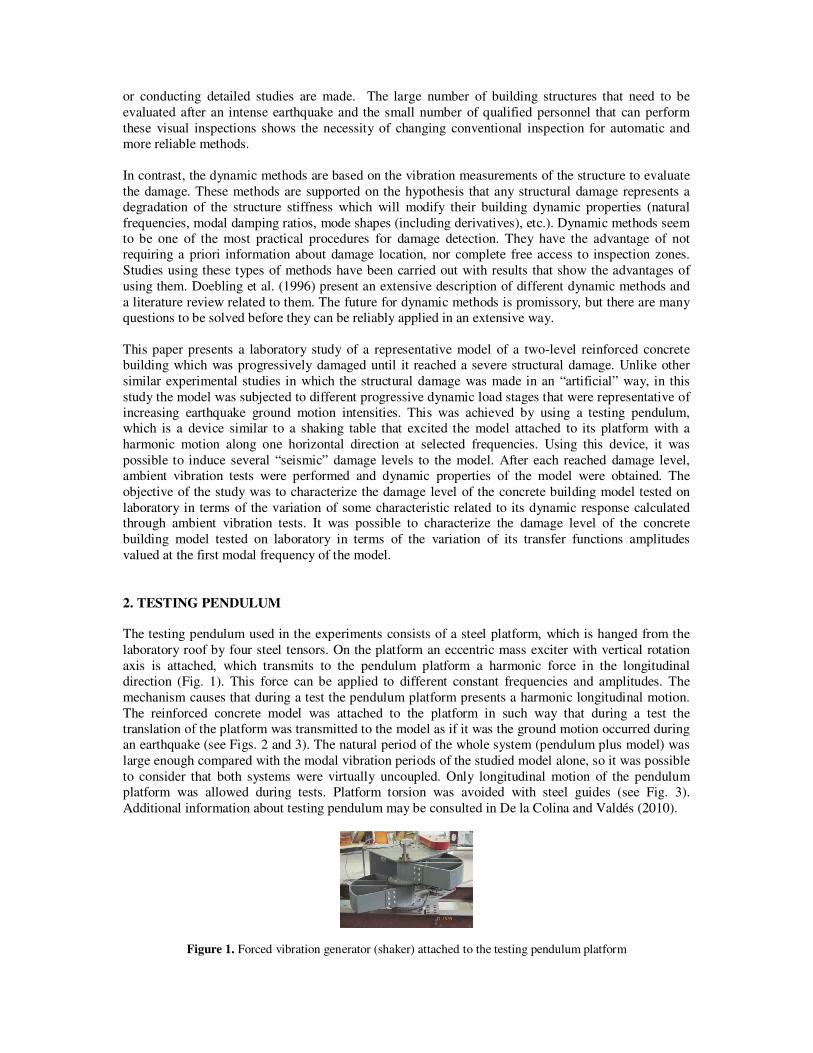
2. TESTING PENDULUM
The testing pendulum used in the experiments consists of a steel platform, which is hanged from the
laboratory roof by four steel tensors. On the platform an eccentric mass exciter with vertical rotation
axis is attached, which transmits to the pendulum platform a harmonic force in the longitudinal
direction (Fig. 1). This force can be applied to different constant frequencies and amplitudes. The
mechanism causes that during a test the pendulum platform presents a harmonic longitudinal motion.
The reinforced concrete model was attached to the platform in such way that during a test the
translation of the platform was transmitted to the model as if it was the ground motion occurred during
an earthquake (see Figs. 2 and 3). The natural period of the whole system (pendulum plus model) was
large enough compared with the modal vibration periods of the studied model alone, so it was possible
to consider that both systems were virtually uncoupled. Only longitudinal motion of the pendulum
platform was allowed during tests. Platform torsion was avoided with steel guides (see Fig. 3).
Additional information about testing pendulum may be consulted in De la Colina and Valdés (2010).
Figure 1. Forced vibration generator (shaker) attached to the testing pendulum platform
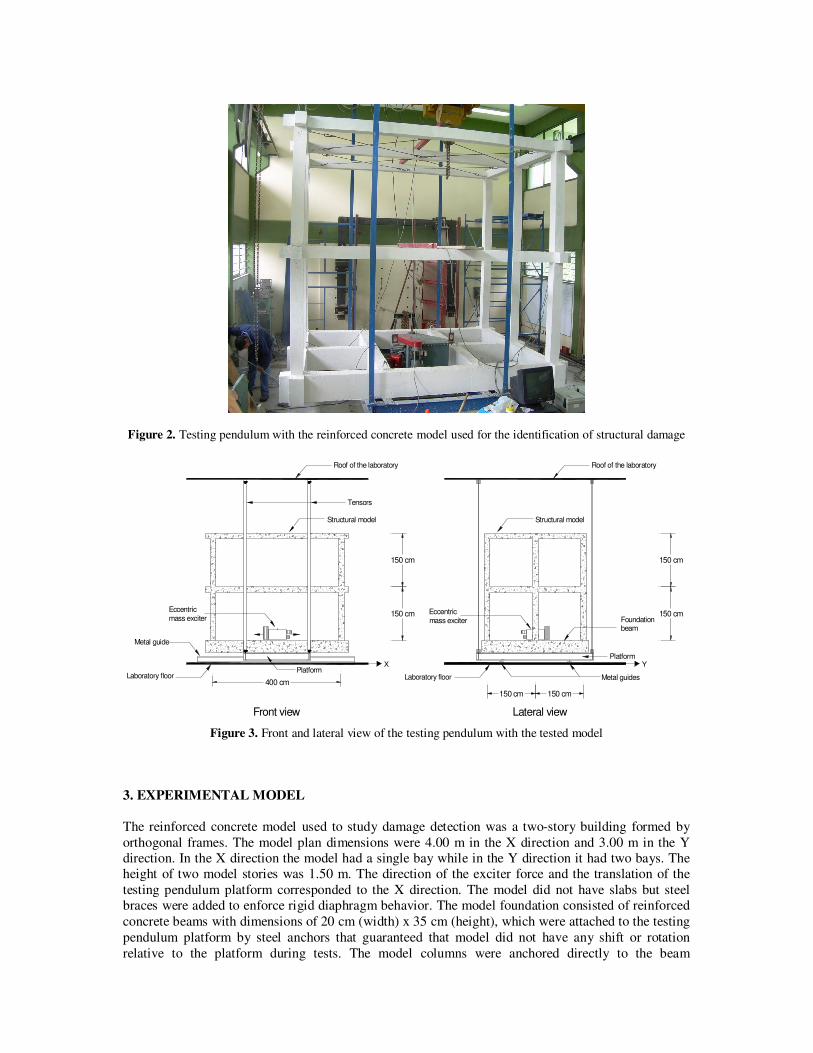
Figure 2. Testing pendulum with the reinforced concrete model used for the identification of structural damage
400 cm
Front view
Tensors
Structural model
Roof of the laboratory
Laboratory floorPlatform
Metal guide
Structural model
Laboratory floor
Platform
Metal guides
Roof of the laboratory
beam
150 cm
150 cm
150 cm 150 cm
Lateral view
150 cm
150 cm
Foundation
X Y
Eccentricmass exciter
Eccentricmass exciter
Figure 3. Front and lateral view of the testing pendulum with the tested model
3. EXPERIMENTAL MODEL
The reinforced concrete model used to study damage detection was a two-story building formed by
orthogonal frames. The model plan dimensions were 4.00 m in the X direction and 3.00 m in the Y
direction. In the X direction the model had a single bay while in the Y direction it had two bays. The
height of two model stories was 1.50 m. The direction of the exciter force and the translation of the
testing pendulum platform corresponded to the X direction. The model did not have slabs but steel
braces were added to enforce rigid diaphragm behavior. The model foundation consisted of reinforced
concrete beams with dimensions of 20 cm (width) x 35 cm (height), which were attached to the testing
pendulum platform by steel anchors that guaranteed that model did not have any shift or rotation
relative to the platform during tests. The model columns were anchored directly to the beam
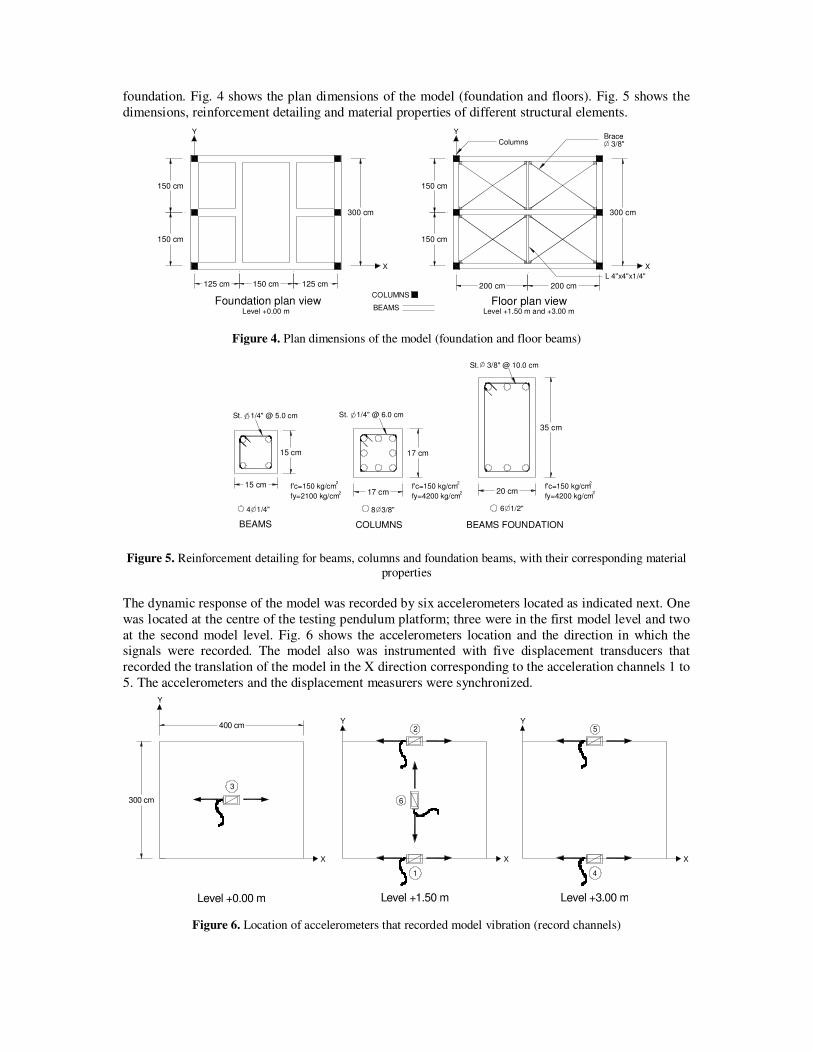
foundation. Fig. 4 shows the plan dimensions of the model (foundation and floors). Fig. 5 shows the
dimensions, reinforcement detailing and material properties of different structural elements.
125 cm 125 cm150 cm
300 cm
150 cm
150 cm
COLUMNSFoundation plan view
BEAMS
200 cm 200 cm
300 cm
150 cm
150 cm
Columns
Floor plan view
Brace3/8"
L 4"x4"x1/4"
Level +0.00 m Level +1.50 m and +3.00 m
X
Y
X
Y
Figure 4. Plan dimensions of the model (foundation and floor beams)
15 cm17 cm
15 cm 17 cm
4 1/4"
St. 1/4" @ 5.0 cm
8 3/8"
St. 1/4" @ 6.0 cm
COLUMNSBEAMS
f'c=150 kg/cm2
fy=2100 kg/cm
f'c=150 kg/cm
fy=4200 kg/cm20 cm
35 cm
6 1/2"
St. 3/8" @ 10.0 cm
BEAMS FOUNDATION
f'c=150 kg/cm
fy=4200 kg/cm2
2
2 2
2
Figure 5. Reinforcement detailing for beams, columns and foundation beams, with their corresponding material
properties
The dynamic response of the model was recorded by six accelerometers located as indicated next. One
was located at the centre of the testing pendulum platform; three were in the first model level and two
at the second model level. Fig. 6 shows the accelerometers location and the direction in which the
signals were recorded. The model also was instrumented with five displacement transducers that
recorded the translation of the model in the X direction corresponding to the acceleration channels 1 to
5. The accelerometers and the displacement measurers were synchronized.
Level +0.00 m
3
Level +1.50 m
6
1
2400 cm
300 cm
Level +3.00 m
4
5
X
Y
Y Y
X X
Figure 6. Location of accelerometers that recorded model vibration (record channels)
4. DAMAGE STAGES
Seventeen different damage stages were induced to the model by forced vibration tests. Each one
corresponded to a specific test related to a particular operating frequency and rotational mass (applied
force) of the exciter (shaker). Because the amplitude of the force induced by the shaker to the
pendulum platform depends on operating frequency and rotational mass, this amplitude varied from
one test to another. The rotational mass was increased progressively from one test to another in an
approximate constant quantity. The shaker operating frequencies were f = 3.0 Hz for tests 1 to 6, f =
2.3 Hz for tests 7 to 9, f = 2.1 Hz for tests 10 to 14 and f = 2.0 Hz for tests 15 to 17. The frequency
variation was necessary to attain approximate constant increments of the exciter induced forces.
According to the variation of the operating frequency and rotational mass, and normalizing platform
accelerations in terms of a shaker frequency f = 3.0 Hz, the maximum acceleration registered in testing
pendulum platform (exciting intensity) increased approximately in a constant quantity from one test to
another.
After each forced vibration test that produced a specific damage level in the model, an ambient
vibration test was conducted. The ambient vibration tests consisted of recording during two minutes
the vibration of the pendulum model system caused just by traffic and human activities in the
surroundings of the laboratory. Because the model was located inside the laboratory, the wind did not
excite it during these tests.
The accelerations obtained during all these forced and ambient vibration tests were baseline corrected
and filtered in accordance with the recommendation of Chiu (1997). With this procedure, also
displacement and velocity records were calculated.
To characterize the damage level for each forced vibration test, the maximum interstory drift
corresponding to the upper model story was calculated (γ2nd). This was achieved by using the calculated displacement obtained from accelerations recorded during the forced vibration test. These
calculations were made within the steady state response. The interstory drift was calculated as the
quotient of the relative displacement for the 2nd story divided by the story height. Fig, 7 shows typical
acceleration and displacement records obtained for test number 9 (N = 9).
Accelerations
-500
-400
-300
-200
-100
0
100
200
300
400
500
0 20 40 60 80
t(s)
A(c
m/s
2 )
Displacements
-2
-1.5
-1
-0.5
0
0.5
1
1.5
2
0 10 20 30 40 50 60 70 80
t(s)
D(c
m) '
Figure 7. Acceleration and displacement records corresponding to channel 5 and test N = 9
Fig. 8 shows the values of the maximum interstory drift corresponding to the 2nd model story,
calculated for each forced vibration test. It is clearly observed that the model remains in elastic
behavior without apparent major damage during first six tests (N =1 to 6), that corresponds to values
of γ2nd < 0.0026. The first cracks were detected visually after the test N = 4 (γ2nd = 0.0018). In
accordance to the secant intersection criteria, the yielding point of the model was at γ2nd = 0.005. Using
an analytical model, it was corroborated that the yielding point was located nearly γ2nd = 0.005. It
could be established that yielding stage started from test N = 7. Considering that the largest interstory
drift was close to γ2nd = 0.03, then the largest ductility demand of the model was µ = 6.0 (approx.). The
model was designed with the strong column and weak beam criteria, so the yielding stage
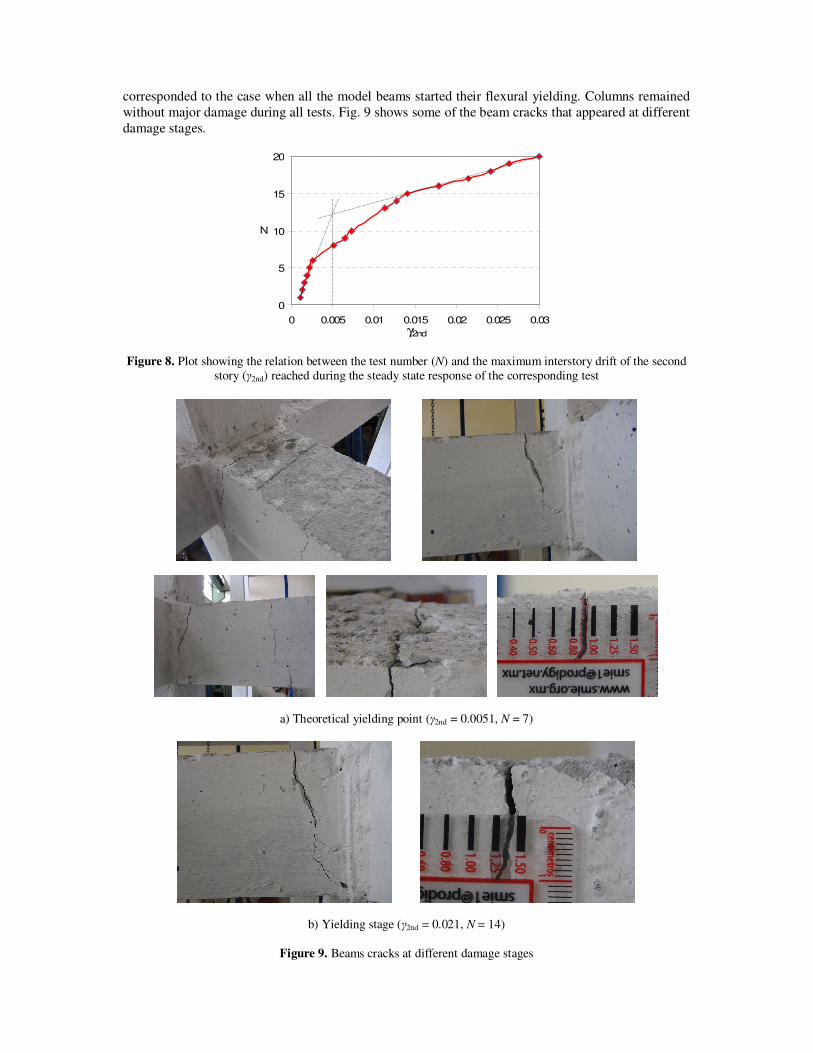
corresponded to the case when all the model beams started their flexural yielding. Columns remained
without major damage during all tests. Fig. 9 shows some of the beam cracks that appeared at different
damage stages.
0
5
10
15
20
0 0.005 0.01 0.015 0.02 0.025 0.03γ2nd
N
Figure 8. Plot showing the relation between the test number (N) and the maximum interstory drift of the second
story (γ2nd) reached during the steady state response of the corresponding test
a) Theoretical yielding point (γ2nd = 0.0051, N = 7)
b) Yielding stage (γ2nd = 0.021, N = 14)
Figure 9. Beams cracks at different damage stages
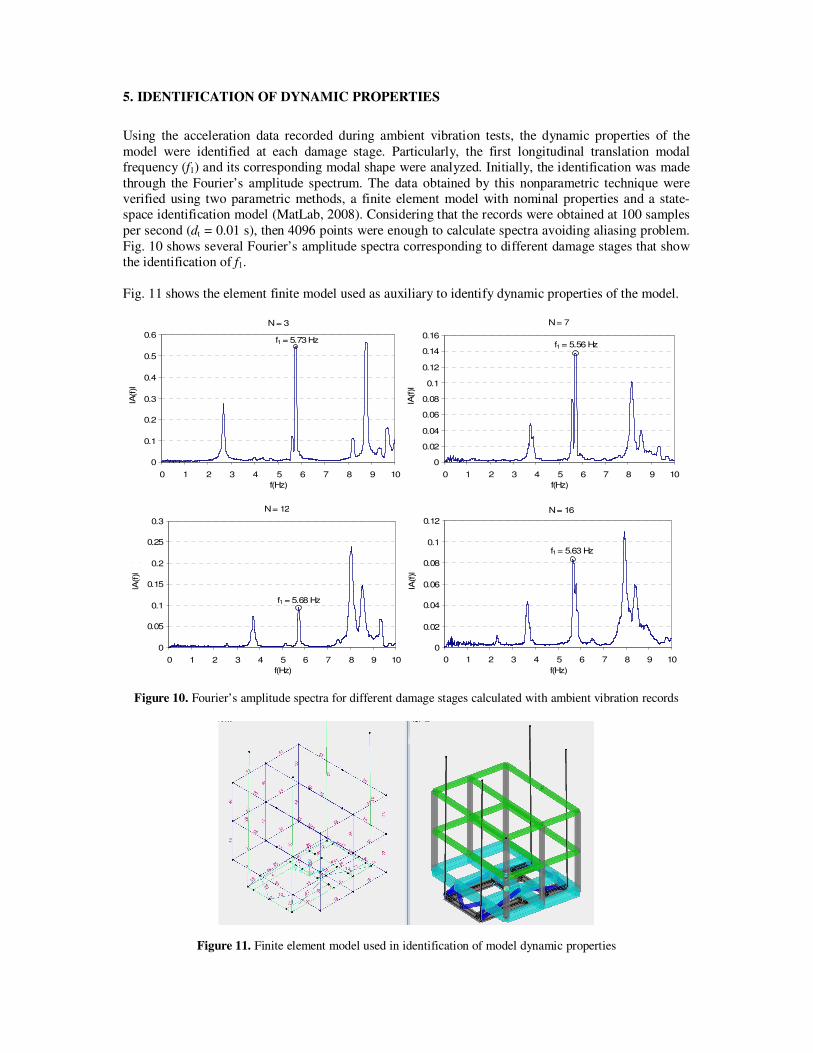
5. IDENTIFICATION OF DYNAMIC PROPERTIES
Using the acceleration data recorded during ambient vibration tests, the dynamic properties of the
model were identified at each damage stage. Particularly, the first longitudinal translation modal
frequency (f1) and its corresponding modal shape were analyzed. Initially, the identification was made
through the Fourier’s amplitude spectrum. The data obtained by this nonparametric technique were
verified using two parametric methods, a finite element model with nominal properties and a state-
space identification model (MatLab, 2008). Considering that the records were obtained at 100 samples
per second (dt = 0.01 s), then 4096 points were enough to calculate spectra avoiding aliasing problem.
Fig. 10 shows several Fourier’s amplitude spectra corresponding to different damage stages that show
the identification of f1.
Fig. 11 shows the element finite model used as auxiliary to identify dynamic properties of the model.
f1 = 5.73 Hz
0
0.1
0.2
0.3
0.4
0.5
0.6
0 1 2 3 4 5 6 7 8 9 10
f(Hz)
lA(f)l )l
N = 3
f1 = 5.56 Hz
0
0.02
0.04
0.06
0.08
0.1
0.12
0.14
0.16
0 1 2 3 4 5 6 7 8 9 10
f(Hz)
lA(f)l )l
N = 7
f1 = 5.68 Hz
0
0.05
0.1
0.15
0.2
0.25
0.3
0 1 2 3 4 5 6 7 8 9 10
f(Hz)
lA(f)l )l
N = 12
f1 = 5.63 Hz
0
0.02
0.04
0.06
0.08
0.1
0.12
0 1 2 3 4 5 6 7 8 9 10
f(Hz)
lA(f)l )l
N = 16
Figure 10. Fourier’s amplitude spectra for different damage stages calculated with ambient vibration records
Figure 11. Finite element model used in identification of model dynamic properties
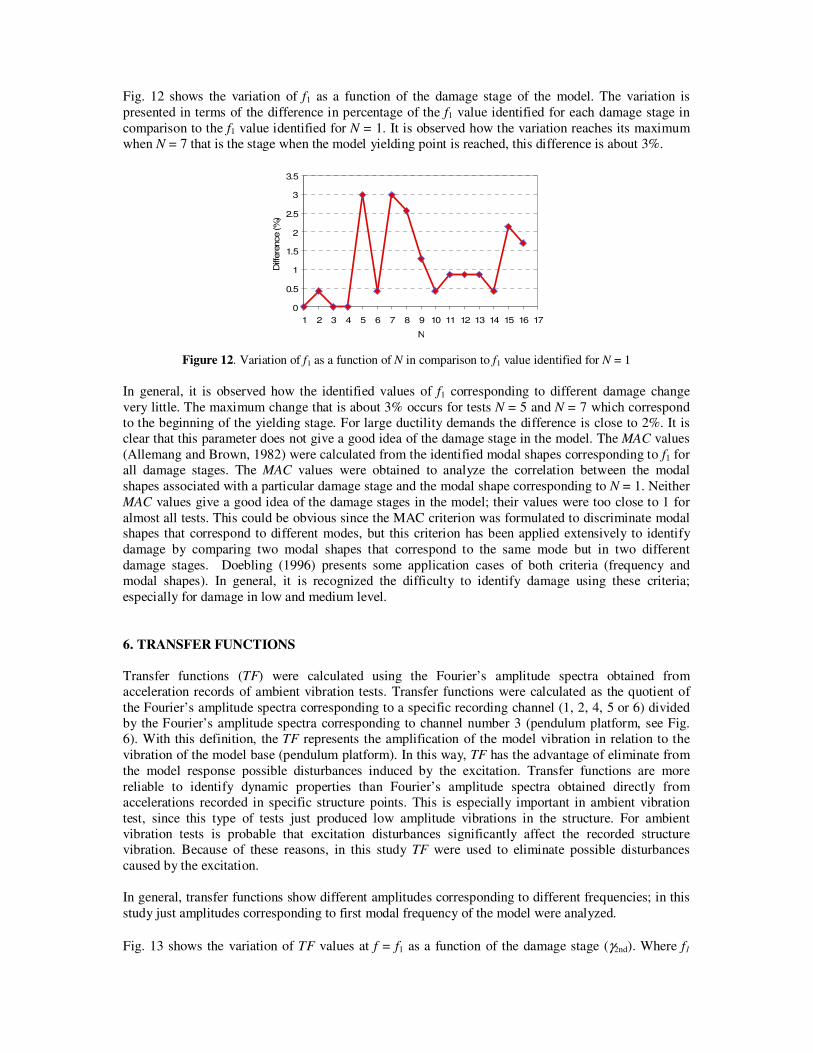
Fig. 12 shows the variation of f1 as a function of the damage stage of the model. The variation is
presented in terms of the difference in percentage of the f1 value identified for each damage stage in
comparison to the f1 value identified for N = 1. It is observed how the variation reaches its maximum
when N = 7 that is the stage when the model yielding point is reached, this difference is about 3%.
0
0.5
1
1.5
2
2.5
3
3.5
1 2 3 4 5 6 7 8 9 10 11 12 13 14 15 16 17
N
Diff
ere
nce (%
) e
Figure 12. Variation of f1 as a function of N in comparison to f1 value identified for N = 1
In general, it is observed how the identified values of f1 corresponding to different damage change
very little. The maximum change that is about 3% occurs for tests N = 5 and N = 7 which correspond
to the beginning of the yielding stage. For large ductility demands the difference is close to 2%. It is
clear that this parameter does not give a good idea of the damage stage in the model. The MAC values
(Allemang and Brown, 1982) were calculated from the identified modal shapes corresponding to f1 for
all damage stages. The MAC values were obtained to analyze the correlation between the modal
shapes associated with a particular damage stage and the modal shape corresponding to N = 1. Neither
MAC values give a good idea of the damage stages in the model; their values were too close to 1 for
almost all tests. This could be obvious since the MAC criterion was formulated to discriminate modal shapes that correspond to different modes, but this criterion has been applied extensively to identify
damage by comparing two modal shapes that correspond to the same mode but in two different
damage stages. Doebling (1996) presents some application cases of both criteria (frequency and
modal shapes). In general, it is recognized the difficulty to identify damage using these criteria;
especially for damage in low and medium level.
6. TRANSFER FUNCTIONS
Transfer functions (TF) were calculated using the Fourier’s amplitude spectra obtained from
acceleration records of ambient vibration tests. Transfer functions were calculated as the quotient of
the Fourier’s amplitude spectra corresponding to a specific recording channel (1, 2, 4, 5 or 6) divided
by the Fourier’s amplitude spectra corresponding to channel number 3 (pendulum platform, see Fig.
6). With this definition, the TF represents the amplification of the model vibration in relation to the
vibration of the model base (pendulum platform). In this way, TF has the advantage of eliminate from
the model response possible disturbances induced by the excitation. Transfer functions are more
reliable to identify dynamic properties than Fourier’s amplitude spectra obtained directly from
accelerations recorded in specific structure points. This is especially important in ambient vibration
test, since this type of tests just produced low amplitude vibrations in the structure. For ambient
vibration tests is probable that excitation disturbances significantly affect the recorded structure
vibration. Because of these reasons, in this study TF were used to eliminate possible disturbances
caused by the excitation.
In general, transfer functions show different amplitudes corresponding to different frequencies; in this
study just amplitudes corresponding to first modal frequency of the model were analyzed.
Fig. 13 shows the variation of TF values at f = f1 as a function of the damage stage (γ2nd). Where f1
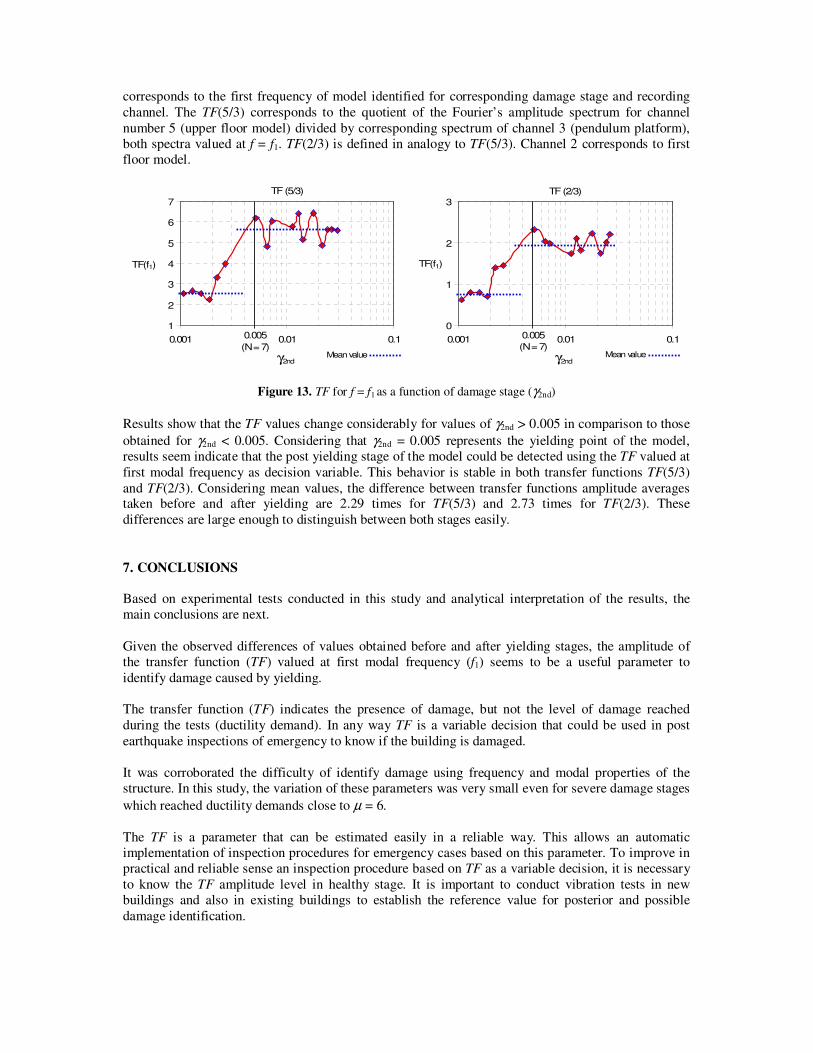
corresponds to the first frequency of model identified for corresponding damage stage and recording
channel. The TF(5/3) corresponds to the quotient of the Fourier’s amplitude spectrum for channel
number 5 (upper floor model) divided by corresponding spectrum of channel 3 (pendulum platform),
both spectra valued at f = f1. TF(2/3) is defined in analogy to TF(5/3). Channel 2 corresponds to first
floor model.
1
2
3
4
5
6
7
0.001 0.01 0.1
γ2nd
TF(f1)
TF (5/3)
0.005
(N = 7)Mean value
0
1
2
3
0.001 0.01 0.1
γ2nd
TF(f1)
TF (2/3)
0.005
(N = 7)Mean value
Figure 13. TF for f = f1 as a function of damage stage (γ2nd)
Results show that the TF values change considerably for values of γ2nd > 0.005 in comparison to those
obtained for γ2nd < 0.005. Considering that γ2nd = 0.005 represents the yielding point of the model,
results seem indicate that the post yielding stage of the model could be detected using the TF valued at
first modal frequency as decision variable. This behavior is stable in both transfer functions TF(5/3)
and TF(2/3). Considering mean values, the difference between transfer functions amplitude averages taken before and after yielding are 2.29 times for TF(5/3) and 2.73 times for TF(2/3). These
differences are large enough to distinguish between both stages easily.
7. CONCLUSIONS Based on experimental tests conducted in this study and analytical interpretation of the results, the
main conclusions are next.
Given the observed differences of values obtained before and after yielding stages, the amplitude of
the transfer function (TF) valued at first modal frequency (f1) seems to be a useful parameter to
identify damage caused by yielding.
The transfer function (TF) indicates the presence of damage, but not the level of damage reached
during the tests (ductility demand). In any way TF is a variable decision that could be used in post
earthquake inspections of emergency to know if the building is damaged.
It was corroborated the difficulty of identify damage using frequency and modal properties of the
structure. In this study, the variation of these parameters was very small even for severe damage stages
which reached ductility demands close to µ = 6.
The TF is a parameter that can be estimated easily in a reliable way. This allows an automatic
implementation of inspection procedures for emergency cases based on this parameter. To improve in
practical and reliable sense an inspection procedure based on TF as a variable decision, it is necessary
to know the TF amplitude level in healthy stage. It is important to conduct vibration tests in new
buildings and also in existing buildings to establish the reference value for posterior and possible
damage identification.
REFERENCES
Allemang, R.J., Brown, D.L. (1982). A correlation coefficient for modal vector analysis. Proceedings of the 1st
international modal analysis conference. Orlando, Florida, USA.
Chiu, H. CH. (1997). Stable base line correction of digital strong – motion data. Bull. of the Seismological
Society of America, 87:4, 932–944.
De la Colina, J., Valdés, J. (2010). Péndulo de prueba para el estudio dinámico de modelos estructurales. Revista
de Ingeniería Sísmica, No. 82, 35 – 56.
Doebling, S., Farrar, C., Prime, M., Shevitz, D. (1996). Damage identification and health monitoring of
structural and mechanical systems from changes in their vibration characteristics: a literature review. Los
Alamos National Laboratory. MatLab package software (2008), The Mathworks, Inc.
Prine, D. (1998). Steel bridge retrofit evaluation. Proceedings of SPIE - The International Society for Optical
Engineering, 442-450.
Rhazi, J. (2006). Evaluation of concrete structures by the acoustic tomography technique. Structural Health
Monitoring, An International Journal. 5:4, 333 – 342.
Salawu, O., Williams, C. (1995). Bridge assessment using forced-vibration testing. Journal of Structural
Engineering, 121:2, 161-173.
Voigt, T., Akkaya, Y., Shah, S. (2003). Determination of early age mortar and concrete strength by ultrasonic
wave reflections. Journal of Materials in Civil Engineering, 15:3, 247-254.
Voigt, T., Shah, P. (2003). Nondestructive monitoring of setting and hardening of Portland cement mortar with
sonic methods. Proceedings of the Sixth International Symposium on Non-Destructive Testing in Civil
Engineering (NDT-CE 2003). Berlin, Germany.
Wang, H. (2004). Theoretical evaluation of embedded plate-like and solid cylindrical concrete structures with
guided waves, Ph.D. Thesis, Northwestern University.