Embed Size (px)
Citation preview
1
SEISMIC DISPLACEMENT BEHAVIOR OF ANCHORS CONNECTING NONSTRUCTURAL COMPONENTS TO CYCLING CRACKED
CONCRETE
Philipp MAHRENHOLTZ1, Rolf ELIGEHAUSEN2 and Tara C. HUTCHINSON3
ABSTRACT
Post-installed anchors are often used to fix nonstructural components and systems (NCS) to concrete. For applications in earthquake prone areas, the anchors have to be qualified for the extreme demands arising from seismic actions. As the structure responds to the ground motion, the anchor loads develop according to the inertial response of the NCS to the floor acceleration. Simultaneously, cracks in the concrete member the NCS is attached to open and close cyclically. As a result, the anchors displace substantially, which may render the NCS inoperable. The anchor behavior under this complex load demand condition was investigated by shake table tests. For these tests, a suspended model component was connected to a cyclically cracked concrete slab by means of post-installed anchors. The effects of anchor type, as well as anchor load level and maximum crack width on the resulting anchor displacements were investigated. This paper presents the experimental test setup and describes the measured dynamic behavior of the anchored component. Displacement data is presented and compared to results obtained from quasi-static tests carried out on isolated anchors for seismic qualification. The findings help to evaluate new testing procedures for seismic anchor qualification.
INTRODUCTION
Nonstructural components and systems (NCS) may be broadly categorized as mechanical-electrical-plumbing (MEP), architectural, or contents. Importantly, NCSs are designed to facilitate the service needs of a building, and for this reason are not considered explicitly in the seismic design of the primary structure, nor intended to contribute as a as load carrying element (Eurocode 8 (2006), ASCE 7 (2010)). Poor seismic performance in past earthquakes has shifted NCSs into the focus of the seismic research community (e.g. Gould and Griffin 2003, Taghavi and Miranda 2003, Whittaker and Soong 2003). It was concluded that, first, the NCSs generally represent the major portion of the total building investment costs and thus represent a large potential loss. Second, damage to NCSs in buildings is usually triggered at levels of deformation much smaller than those required to initiate structural damage. Third, important economic loss can result from a temporary loss of function due to NCS failure. However, anchorage especially of an NCS is often neglected in the design process, potentially leading to earthquake damage and significant economic losses caused by anchor failure (e.g. Marxer et al. 2003, Griffin and Winn 2009, Masek and Ridge 2009, Zareian et al. 2012).
1 Engineering Manager Anchoring, Stanley Black & Decker, Powers Fasteners, Europe, Germany, [email protected] 2 Professor Emeritus, Department for Civil and Environmental Engineering, University of Stuttgart, Germany, [email protected] 3 Professor, Structural Engineering Department of the Jacobs School of Engineering, University of California, San Diego, USA, [email protected]
2
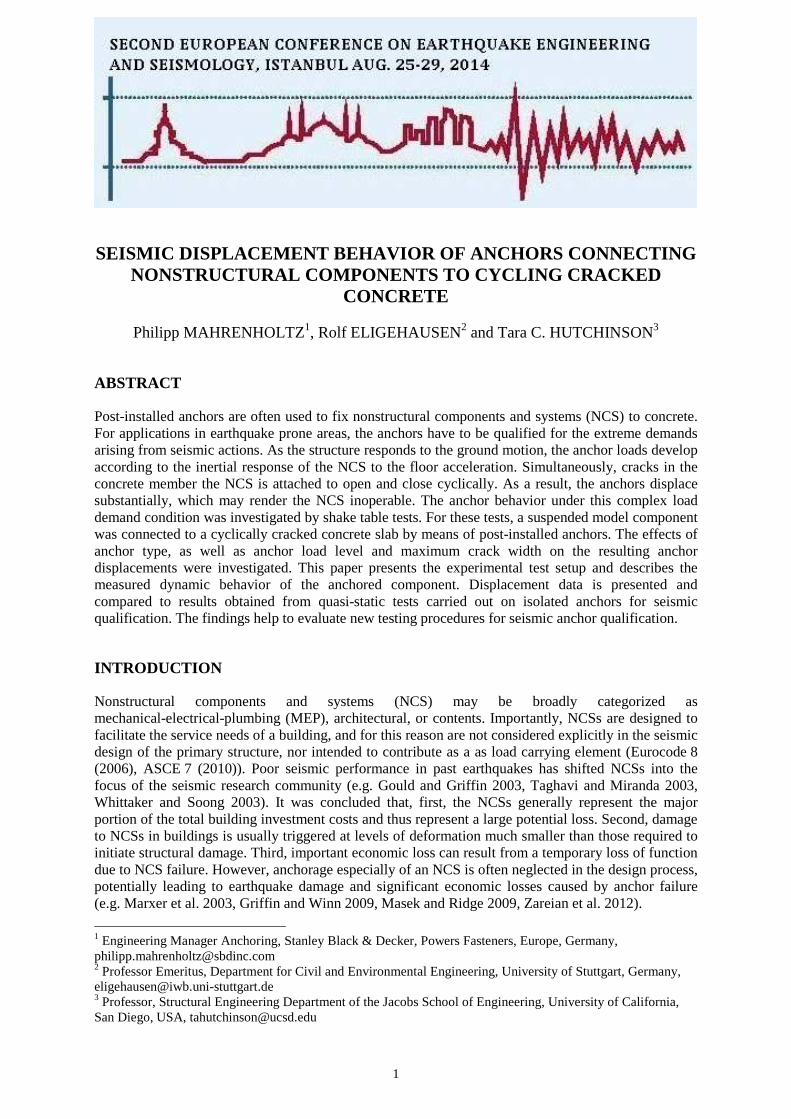
NCSs are connected to concrete structures either by cast-in-place or by post-installed anchors. Due to their flexibility and easy handling, post-installed anchors have clear advantages over cast-in-place anchors. However, earthquakes are very demanding for post-installed anchors as seismic actions cause substantial anchor displacement and may result in severe reduction of load capacity. Moreover, as the primary structure responds to the ground motion, it oscillates and its deformation leads to degradation, which can be potentially significant in the case of reinforced concrete structures. This degradation is in large part expressed through cracking in the structural elements. Considering this scenario, the primary structure serves as a filter, which amplifies the ground acceleration ag near the natural frequencies of the structure. The floor level acceleration afloor varies throughout the height and location of the building. The inertial response of the NCS to the acceleration of the floor they are connected to then results in further amplification of the acceleration aNCS (Fig. 1).
Floor
NCS
Ground
Crack
Concrete structure
Anchor aNCS
Time
afloor
Time
ag
Time
Figure 1. Structure and NCS response to earthquake motion
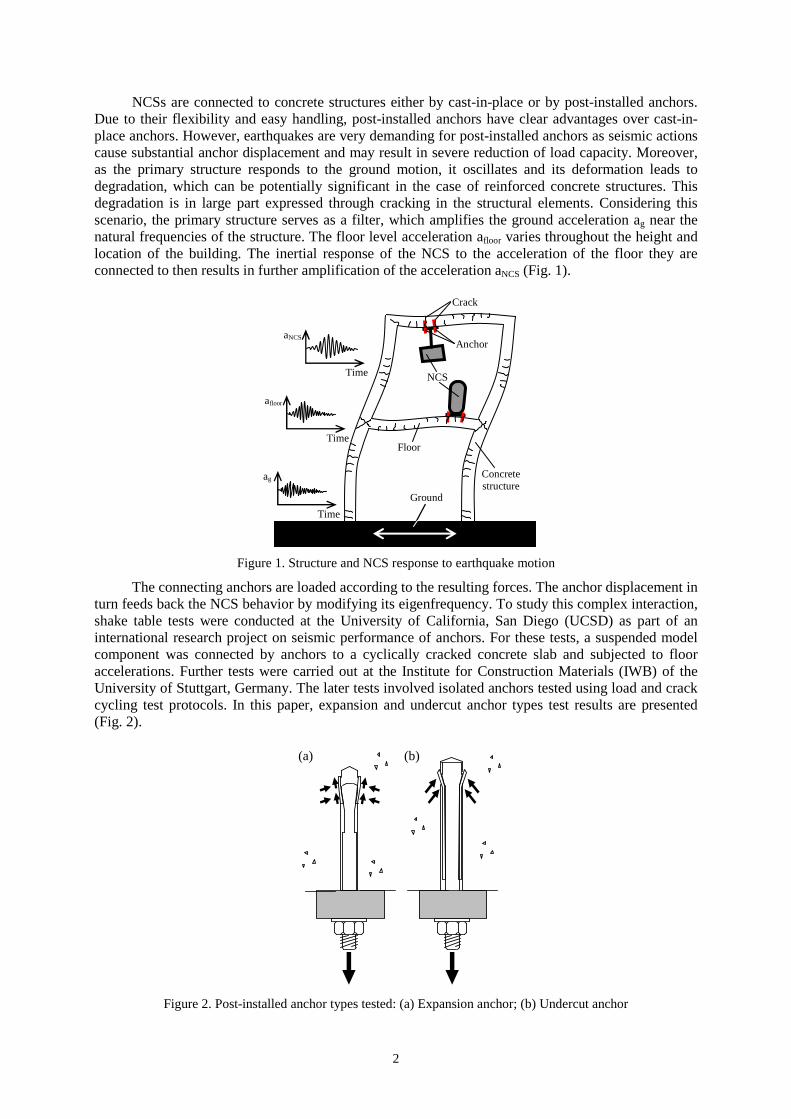
The connecting anchors are loaded according to the resulting forces. The anchor displacement in turn feeds back the NCS behavior by modifying its eigenfrequency. To study this complex interaction, shake table tests were conducted at the University of California, San Diego (UCSD) as part of an international research project on seismic performance of anchors. For these tests, a suspended model component was connected by anchors to a cyclically cracked concrete slab and subjected to floor accelerations. Further tests were carried out at the Institute for Construction Materials (IWB) of the University of Stuttgart, Germany. The later tests involved isolated anchors tested using load and crack cycling test protocols. In this paper, expansion and undercut anchor types test results are presented (Fig. 2).
Figure 2. Post-installed anchor types tested: (a) Expansion anchor; (b) Undercut anchor
(a) (b)
Expansion anchors less stiff and more sensitive to large cracks when compared to undercut anchors. Further details on these anchor types and their specific load-displacement characteristics can be found in Eligehausen et al. (2006).
DYNAMIC SHAKE TABLE TESTS
Test Approach, Setup, and Procedure During a seismic event, the excited reinforced concrete primary structure and attached NCS are loaded cyclically. As a consequence, the seismic event causes simultaneous cycling of the anchor loads and of the crack widths in the concrete elements to which the NCSs are connected. Since cracks have a significant negative influence on the anchor performance in general, in design it is conservatively assumed that the anchor is always situated in an open crack.
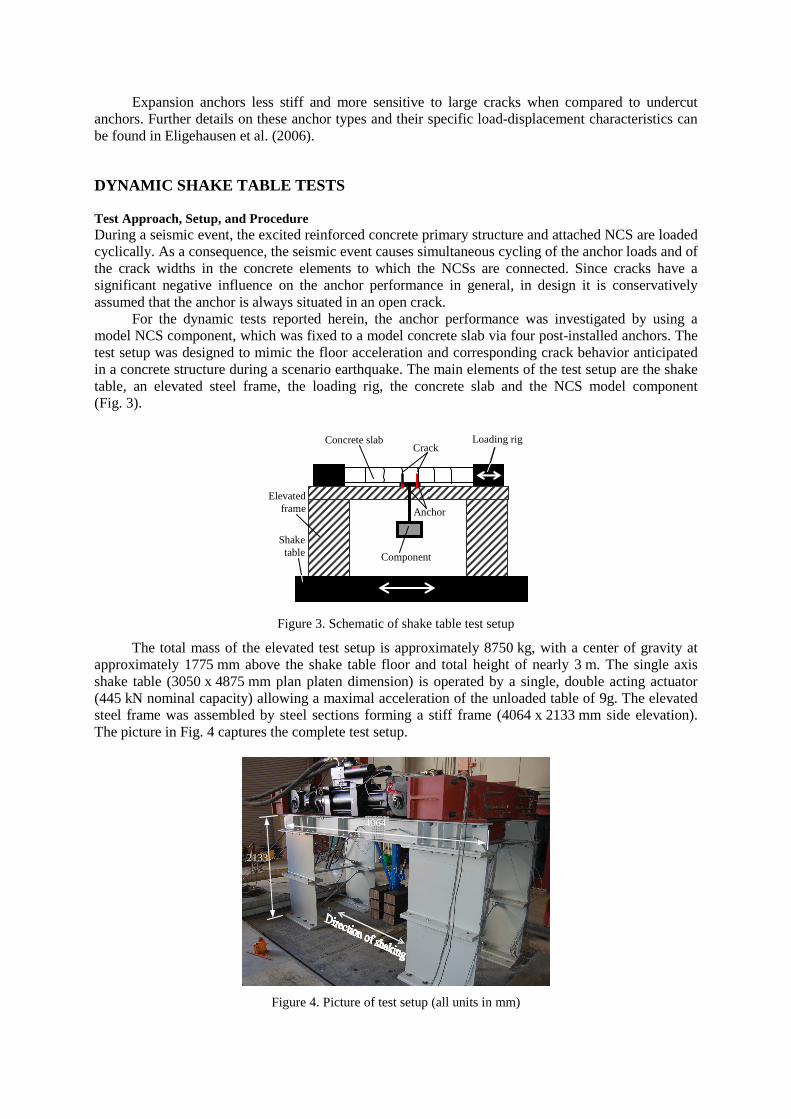
For the dynamic tests reported herein, the anchor performance was investigated by using a model NCS component, which was fixed to a model concrete slab via four post-installed anchors. The test setup was designed to mimic the floor acceleration and corresponding crack behavior anticipated in a concrete structure during a scenario earthquake. The main elements of the test setup are the shake table, an elevated steel frame, the loading rig, the concrete slab and the NCS model component (Fig. 3).
Concrete slab
Component
Shake table
Loading rig Crack
Elevated frame Anchor
Figure 3. Schematic of shake table test setup
The total mass of the elevated test setup is approximately 8750 kg, with a center of gravity at approximately 1775 mm above the shake table floor and total height of nearly 3 m. The single axis shake table (3050 x 4875 mm plan platen dimension) is operated by a single, double acting actuator (445 kN nominal capacity) allowing a maximal acceleration of the unloaded table of 9g. The elevated steel frame was assembled by steel sections forming a stiff frame (4064 x 2133 mm side elevation). The picture in Fig. 4 captures the complete test setup.
Figure 4. Picture of test setup (all units in mm)
2133
4064
4
The loading rig (3238 x 2438 mm plan view) consisted basically of two head beams coupled with a pair of servo hydraulic actuators. The head beams of the loading rig were mounted on the two longitudinal beams of the elevated frame. One head was permanently fixed while the other rested on sliding plates allowing free movement in the longitudinal direction (parallel with shaking direction). The longitudinal reinforcement in the slabs consisted of four high strength bars, with the protruding ends connected to the head beams of the loading rig. The actuators (735 kN each) allowed opening and closing of the cracks in the concrete slab dynamically. The model concrete slab (2438 x 1067 x 254 mm) represents any type of concrete component (e.g. a beam or slab) that a nonstructural component may be anchored to. It was constructed of normal weight concrete with a nominal concrete compressive strength of f’c = 25 MPa and detailed to crack at 330 mm spacing using steel sheet metal crack inducers.
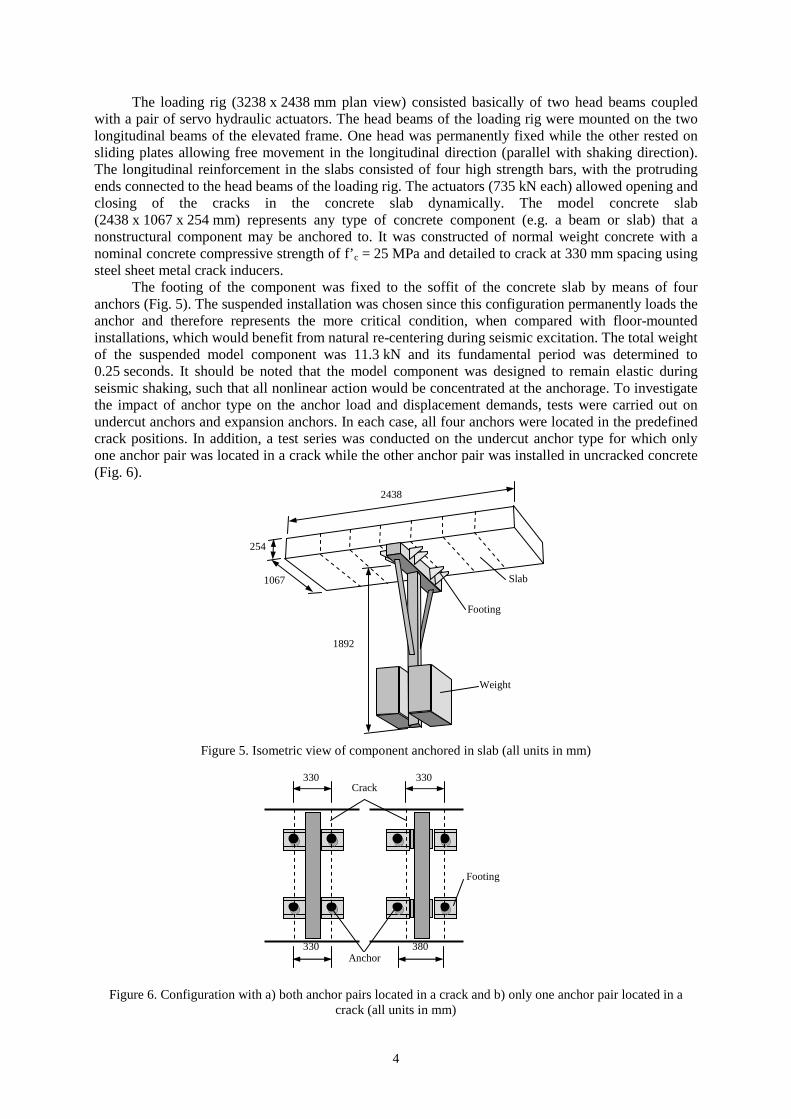
The footing of the component was fixed to the soffit of the concrete slab by means of four anchors (Fig. 5). The suspended installation was chosen since this configuration permanently loads the anchor and therefore represents the more critical condition, when compared with floor-mounted installations, which would benefit from natural re-centering during seismic excitation. The total weight of the suspended model component was 11.3 kN and its fundamental period was determined to 0.25 seconds. It should be noted that the model component was designed to remain elastic during seismic shaking, such that all nonlinear action would be concentrated at the anchorage. To investigate the impact of anchor type on the anchor load and displacement demands, tests were carried out on undercut anchors and expansion anchors. In each case, all four anchors were located in the predefined crack positions. In addition, a test series was conducted on the undercut anchor type for which only one anchor pair was located in a crack while the other anchor pair was installed in uncracked concrete (Fig. 6).
Figure 5. Isometric view of component anchored in slab (all units in mm)
Figure 6. Configuration with a) both anchor pairs located in a crack and b) only one anchor pair located in a
crack (all units in mm)
Footing
Crack
330
330 330
380 Anchor
Footing
Weight
Slab
1892
1067
254
2438
A detailed description of the loading rig, the model slab and model component is available in Watkins et al. (2012). The control command files for the shake table and the loading rig actuators were based on nonlinear simulations of representative reinforced concrete structures presented in Wood and Hutchinson (2012). Frame structures with 2, 4, 8, 12, and 20 stories were subjected to 21 ground motion time histories of real earthquake records. The numerical simulation of the seismic response yielded specific floor acceleration and corresponding curvature time histories. For the test program discussed in the following, 11 floor motions were selected (Table 1).
Table 1. Selected floor motions used in the test program including the basic building details
Building
FM01 K 0.950 7.28 2 1
FM02 N 1.371 13.8 2 1
FM03 S 0.592 1.54 4 1
FM04 N 0.786 1.71 4 2
FM05 K 0.450 2.71 8 5
FM06 S 0.564 2.52 12 2
FM07 S 0.596 1.57 12 5
FM08 K 0.401 1.13 12 10
FM09 K 0.450 1.95 20 4
FM10 S 0.460 1.45 20 9
FM11 S 0.475 0.76 20 18
Floor Motion
EQ1)
Record
PFA2)
100%(g)
Sa3)
@T1=0.25sec
(g)Floor
(story)Height(story)
1) Earthquake: K = Kobe 1995, N = Northridge 1994, S = Superstition 1987;
2) PFA: Peak floor acceleration for 100% scale; 3) Sa: Spectral acceleration at 0.25 sec calculated at 5% damping
It should be noted that a linear relationship between curvature and crack width was adopted, assuming that the NCS would be anchored in a region outside of the plastic hinge zone of any structural component. Anchoring within the plastic hinge zone is not allowed in the anchor design codes (ACI 318 (2011), CEN/TS 1992-4 (2009)). For the tests covered in this paper, a maximum anchor load equal to the seismic design strength was targeted. This load level fully utilizes the nominal anchor capacity and represents the highest load the anchor can be designed for. The seismic strength was taken as the characteristic strength NRk,seis evaluated by load and crack cycling tests on isolated anchors as briefly introduced in the section on quasi-static qualifiication tests of this paper. Utilizing this method, the targeted maximum anchor loads were 24 kN for the undercut anchor and 11 kN for the expansion anchor. To evaluate the influence of the crack width on the anchor performance, maximum crack widths of 0.5 or 0.8 mm were targeted. A value of 0.5 mm is the maximum crack width adopted in current anchor qualification guidelines (ACI 355.2 (2007), ETAG 001 (2006)). A value of 0.8 mm is deemed in excess of these potentially realized in design earthquake scenarios, just outside of plastic hinge zones. Further details regarding the testing conditions can be found in Mahrenholtz et al. (2012).
The response of the model slab, model component and anchors was measured by various sensors, namely displacement transducers, load cells, accelerometers and strain gages. Furthermore, information was collected from the shake table and loading rig actuators, including the displacement, velocity, and acceleration, to control floor acceleration and cracking. In total, 84 data acquisition channels recorded information at a sampling rate of 200 Hz. In the context of this paper, the anchor loads, anchor displacements, and crack widths at the anchor locations are the focused key measurements.
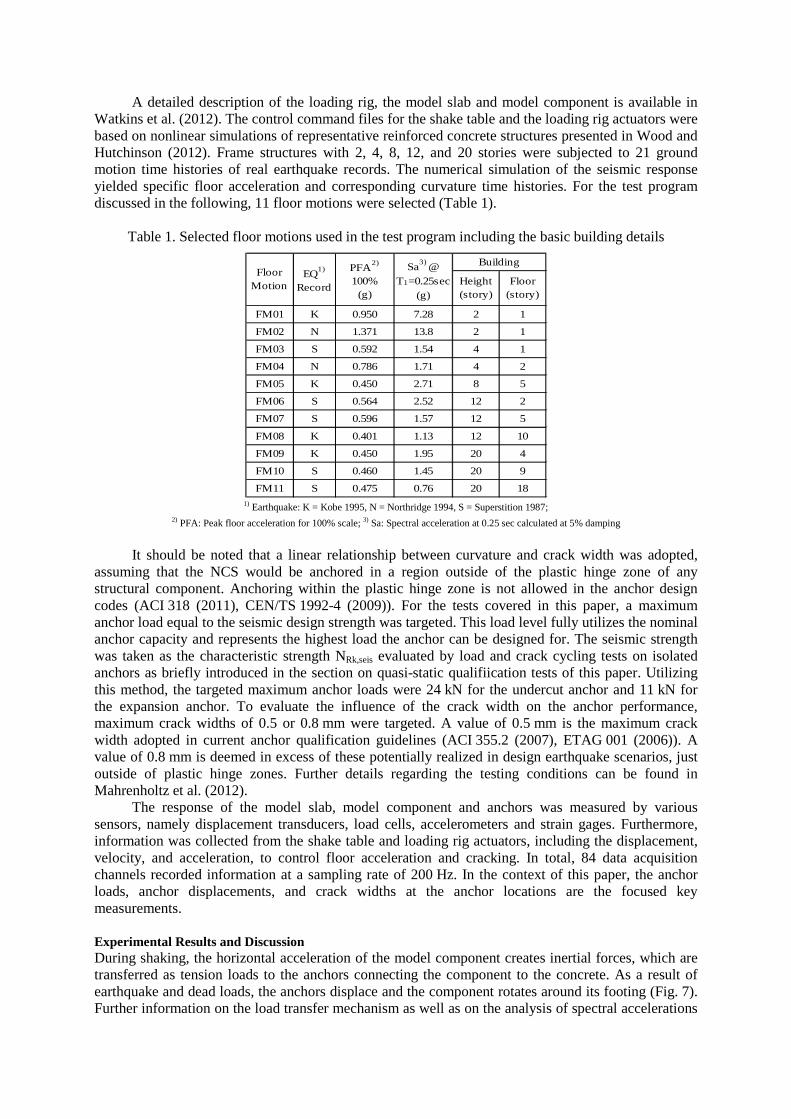
Experimental Results and Discussion During shaking, the horizontal acceleration of the model component creates inertial forces, which are transferred as tension loads to the anchors connecting the component to the concrete. As a result of earthquake and dead loads, the anchors displace and the component rotates around its footing (Fig. 7). Further information on the load transfer mechanism as well as on the analysis of spectral accelerations
6
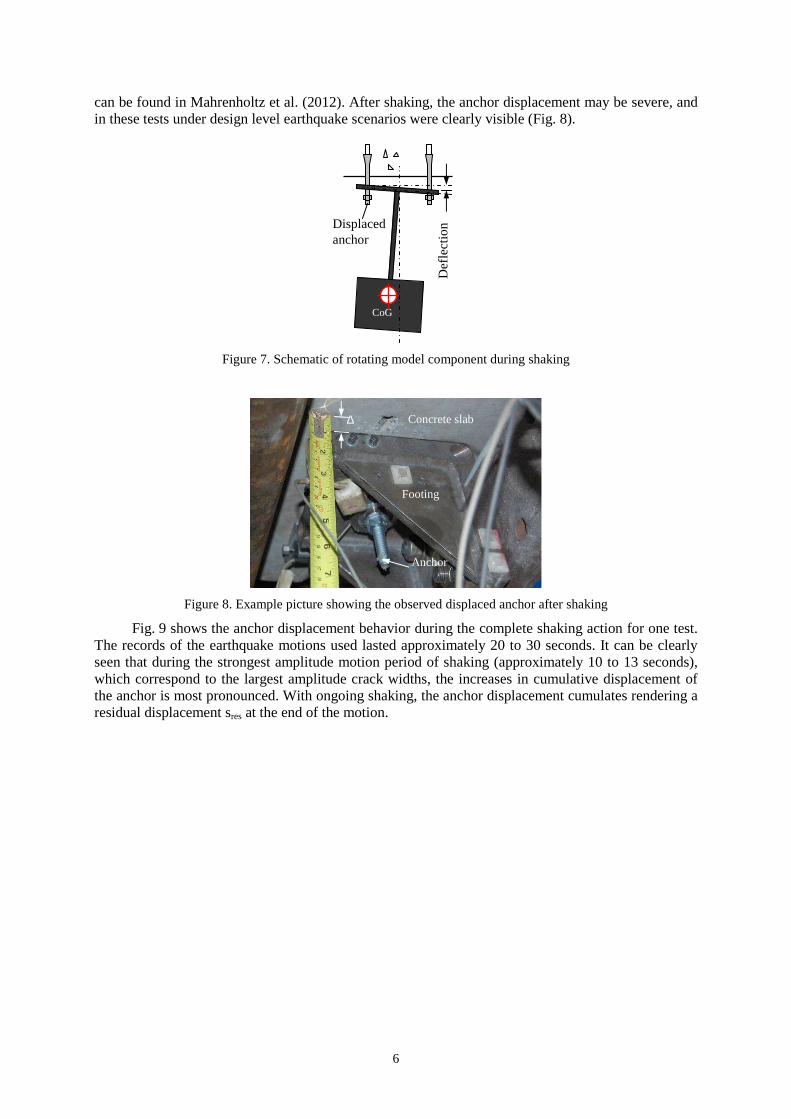
can be found in Mahrenholtz et al. (2012). After shaking, the anchor displacement may be severe, and in these tests under design level earthquake scenarios were clearly visible (Fig. 8).
Figure 7. Schematic of rotating model component during shaking
Figure 8. Example picture showing the observed displaced anchor after shaking
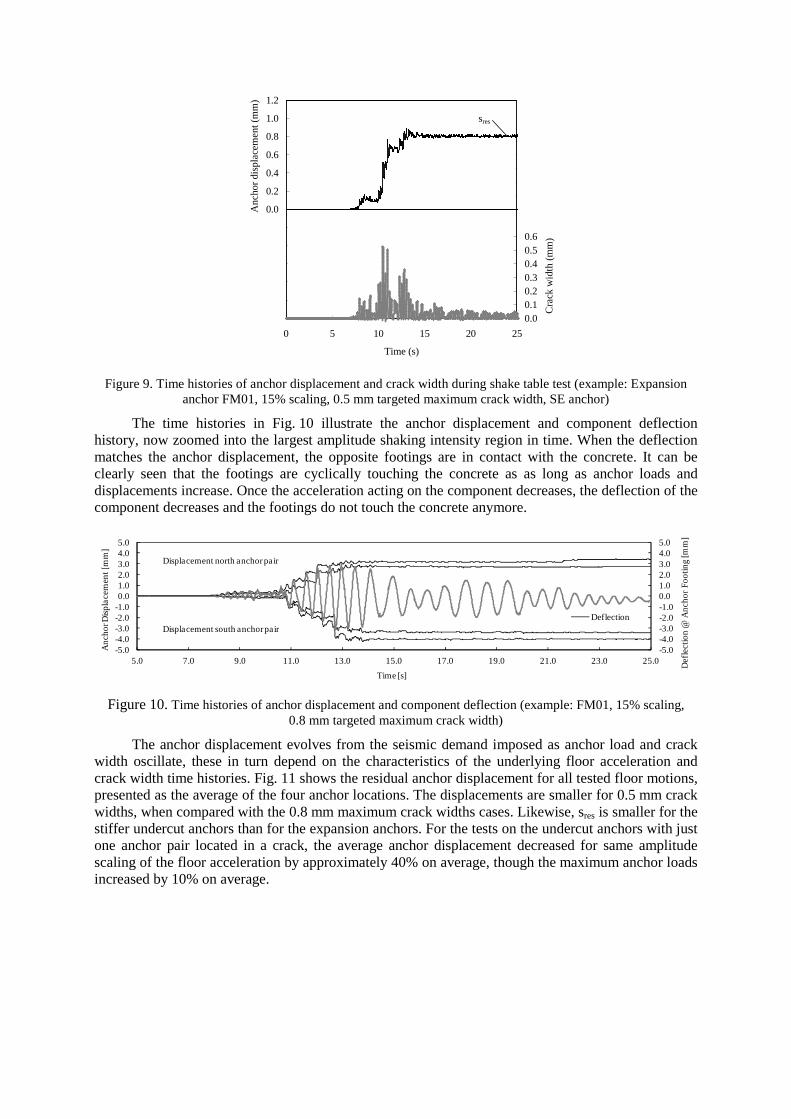
Fig. 9 shows the anchor displacement behavior during the complete shaking action for one test. The records of the earthquake motions used lasted approximately 20 to 30 seconds. It can be clearly seen that during the strongest amplitude motion period of shaking (approximately 10 to 13 seconds), which correspond to the largest amplitude crack widths, the increases in cumulative displacement of the anchor is most pronounced. With ongoing shaking, the anchor displacement cumulates rendering a residual displacement sres at the end of the motion.
Concrete slab
Footing
Anchor
∆
Def
lect
ion
CoG
Displaced anchor
1.2
1.0
0.8
0.6
0.4
0.2
0.0
0.2
0.4
0.6
0.8
1.0
1.2
0 5 10 15 20 25
Time (s)
Anc
hor
disp
lace
me
nt (
mm
)
0.00.10.20.30.40.50.60.70.80.91.01.11.21.31.41.51.6
Cra
ck w
idth
(m
m)
sres
Figure 9. Time histories of anchor displacement and crack width during shake table test (example: Expansion
anchor FM01, 15% scaling, 0.5 mm targeted maximum crack width, SE anchor)
The time histories in Fig. 10 illustrate the anchor displacement and component deflection history, now zoomed into the largest amplitude shaking intensity region in time. When the deflection matches the anchor displacement, the opposite footings are in contact with the concrete. It can be clearly seen that the footings are cyclically touching the concrete as as long as anchor loads and displacements increase. Once the acceleration acting on the component decreases, the deflection of the component decreases and the footings do not touch the concrete anymore.
-5.0-4.0-3.0-2.0-1.00.01.02.03.04.05.0
-5.0-4.0-3.0-2.0-1.00.01.02.03.04.05.0
5.0 7.0 9.0 11.0 13.0 15.0 17.0 19.0 21.0 23.0 25.0 De
flect
ion
@ A
nch
or
Fo
otin
g [m
m]
An
cho
r Dis
pla
cem
en
t [m
m]
Time [s]
Deflection
Displacement north anchor pair
Displacement south anchor pair
Figure 10. Time histories of anchor displacement and component deflection (example: FM01, 15% scaling, 0.8 mm targeted maximum crack width)
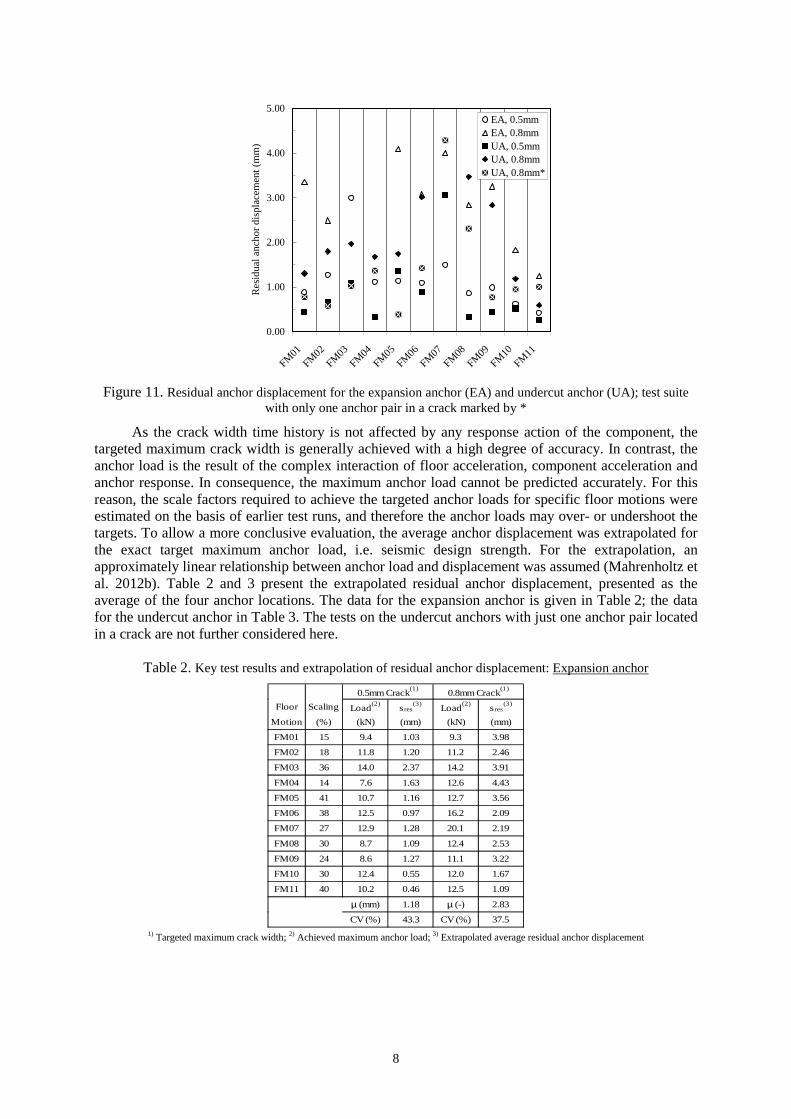
The anchor displacement evolves from the seismic demand imposed as anchor load and crack width oscillate, these in turn depend on the characteristics of the underlying floor acceleration and crack width time histories. Fig. 11 shows the residual anchor displacement for all tested floor motions, presented as the average of the four anchor locations. The displacements are smaller for 0.5 mm crack widths, when compared with the 0.8 mm maximum crack widths cases. Likewise, sres is smaller for the stiffer undercut anchors than for the expansion anchors. For the tests on the undercut anchors with just one anchor pair located in a crack, the average anchor displacement decreased for same amplitude scaling of the floor acceleration by approximately 40% on average, though the maximum anchor loads increased by 10% on average.
8
0.00
1.00
2.00
3.00
4.00
5.00
FM01
FM02
FM03
FM04
FM05
FM06
FM07
FM08
FM09
FM10
FM11
Re
sid
ual
an
cho
r d
isp
lace
men
t (m
m)
EA, 0.5mmEA, 0.8mmUA, 0.5mmUA, 0.8mmUA, 0.8mm*
Figure 11. Residual anchor displacement for the expansion anchor (EA) and undercut anchor (UA); test suite with only one anchor pair in a crack marked by *
As the crack width time history is not affected by any response action of the component, the targeted maximum crack width is generally achieved with a high degree of accuracy. In contrast, the anchor load is the result of the complex interaction of floor acceleration, component acceleration and anchor response. In consequence, the maximum anchor load cannot be predicted accurately. For this reason, the scale factors required to achieve the targeted anchor loads for specific floor motions were estimated on the basis of earlier test runs, and therefore the anchor loads may over- or undershoot the targets. To allow a more conclusive evaluation, the average anchor displacement was extrapolated for the exact target maximum anchor load, i.e. seismic design strength. For the extrapolation, an approximately linear relationship between anchor load and displacement was assumed (Mahrenholtz et al. 2012b). Table 2 and 3 present the extrapolated residual anchor displacement, presented as the average of the four anchor locations. The data for the expansion anchor is given in Table 2; the data for the undercut anchor in Table 3. The tests on the undercut anchors with just one anchor pair located in a crack are not further considered here.
Table 2. Key test results and extrapolation of residual anchor displacement: Expansion anchor
0.5mm Crack(1)
0.8mm Crack(1)
Floor Scaling Load(2)
sres(3)
Load(2)
sres(3)
Motion (%) (kN) (mm) (kN) (mm)
FM01 15 9.4 1.03 9.3 3.98
FM02 18 11.8 1.20 11.2 2.46
FM03 36 14.0 2.37 14.2 3.91
FM04 14 7.6 1.63 12.6 4.43
FM05 41 10.7 1.16 12.7 3.56
FM06 38 12.5 0.97 16.2 2.09
FM07 27 12.9 1.28 20.1 2.19
FM08 30 8.7 1.09 12.4 2.53
FM09 24 8.6 1.27 11.1 3.22
FM10 30 12.4 0.55 12.0 1.67
FM11 40 10.2 0.46 12.5 1.09
µ (mm) 1.18 µ (-) 2.83
CV (%) 43.3 CV (%) 37.5 1) Targeted maximum crack width; 2) Achieved maximum anchor load; 3) Extrapolated average residual anchor displacement
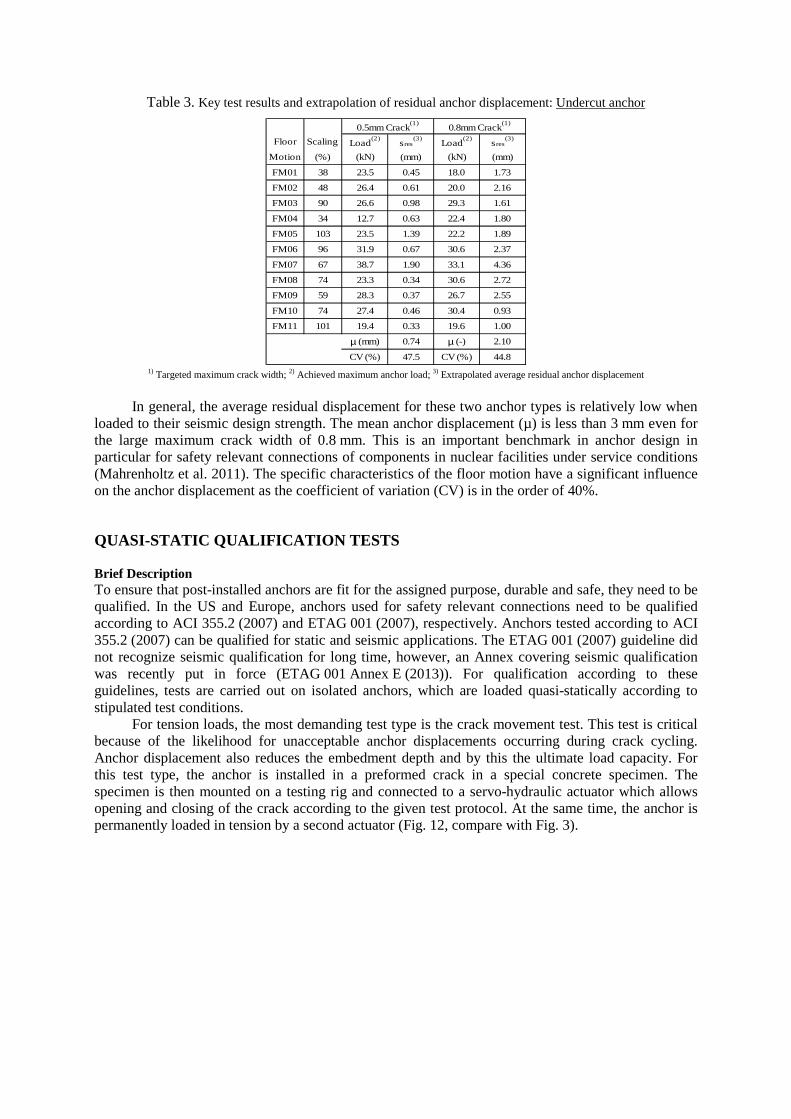
Table 3. Key test results and extrapolation of residual anchor displacement: Undercut anchor
0.5mm Crack(1)
0.8mm Crack(1)
Floor Scaling Load(2)
sres(3)
Load(2)
sres(3)
Motion (%) (kN) (mm) (kN) (mm)
FM01 38 23.5 0.45 18.0 1.73
FM02 48 26.4 0.61 20.0 2.16
FM03 90 26.6 0.98 29.3 1.61
FM04 34 12.7 0.63 22.4 1.80
FM05 103 23.5 1.39 22.2 1.89
FM06 96 31.9 0.67 30.6 2.37
FM07 67 38.7 1.90 33.1 4.36
FM08 74 23.3 0.34 30.6 2.72
FM09 59 28.3 0.37 26.7 2.55
FM10 74 27.4 0.46 30.4 0.93
FM11 101 19.4 0.33 19.6 1.00
µ (mm) 0.74 µ (-) 2.10
CV (%) 47.5 CV (%) 44.8 1) Targeted maximum crack width; 2) Achieved maximum anchor load; 3) Extrapolated average residual anchor displacement
In general, the average residual displacement for these two anchor types is relatively low when
loaded to their seismic design strength. The mean anchor displacement (µ) is less than 3 mm even for the large maximum crack width of 0.8 mm. This is an important benchmark in anchor design in particular for safety relevant connections of components in nuclear facilities under service conditions (Mahrenholtz et al. 2011). The specific characteristics of the floor motion have a significant influence on the anchor displacement as the coefficient of variation (CV) is in the order of 40%.
QUASI-STATIC QUALIFICATION TESTS
Brief Description To ensure that post-installed anchors are fit for the assigned purpose, durable and safe, they need to be qualified. In the US and Europe, anchors used for safety relevant connections need to be qualified according to ACI 355.2 (2007) and ETAG 001 (2007), respectively. Anchors tested according to ACI 355.2 (2007) can be qualified for static and seismic applications. The ETAG 001 (2007) guideline did not recognize seismic qualification for long time, however, an Annex covering seismic qualification was recently put in force (ETAG 001 Annex E (2013)). For qualification according to these guidelines, tests are carried out on isolated anchors, which are loaded quasi-statically according to stipulated test conditions.
For tension loads, the most demanding test type is the crack movement test. This test is critical because of the likelihood for unacceptable anchor displacements occurring during crack cycling. Anchor displacement also reduces the embedment depth and by this the ultimate load capacity. For this test type, the anchor is installed in a preformed crack in a special concrete specimen. The specimen is then mounted on a testing rig and connected to a servo-hydraulic actuator which allows opening and closing of the crack according to the given test protocol. At the same time, the anchor is permanently loaded in tension by a second actuator (Fig. 12, compare with Fig. 3).
10
Concrete specimen
Actuator
Actuator
Crack
Anchor
Figure 12. Schematic of test on isolated anchor
The test protocol used for the crack cycling tests presented in the following was developed at the UCSD and IWB (Wood et al. (2009)) for connections of structural members. This seismic crack cycling test protocol prescribes 59 crack cycles. The crack width is increased in 0.1 mm steps to a maximum crack width of 0.8 mm while the anchor is permanently loaded in tension. A detailed report of the test setup and procedure, as well as more technical background can be found in Mahrenholtz (2012). Further examples of tests based on the same test protocol are presented in Muciaccia (2012).
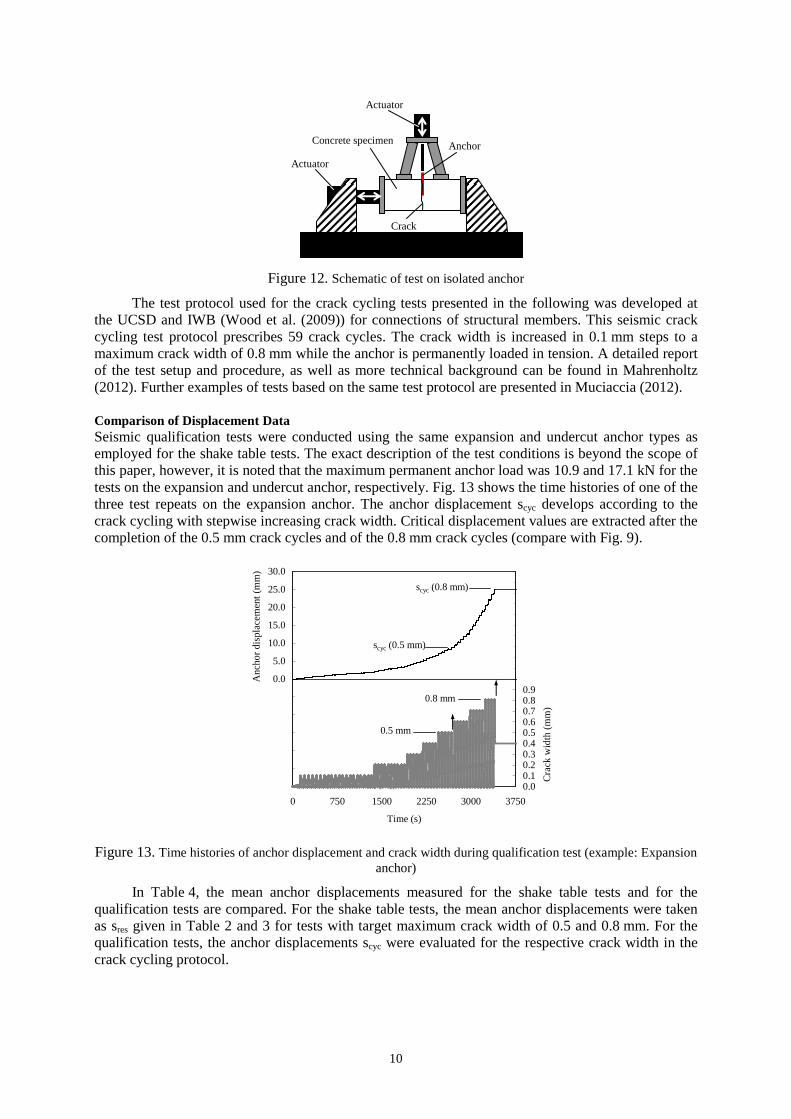
Comparison of Displacement Data Seismic qualification tests were conducted using the same expansion and undercut anchor types as employed for the shake table tests. The exact description of the test conditions is beyond the scope of this paper, however, it is noted that the maximum permanent anchor load was 10.9 and 17.1 kN for the tests on the expansion and undercut anchor, respectively. Fig. 13 shows the time histories of one of the three test repeats on the expansion anchor. The anchor displacement scyc develops according to the crack cycling with stepwise increasing crack width. Critical displacement values are extracted after the completion of the 0.5 mm crack cycles and of the 0.8 mm crack cycles (compare with Fig. 9).
30.0
25.0
20.0
15.0
10.0
5.0
0.0
5.0
10.0
15.0
20.0
25.0
30.0
0 750 1500 2250 3000 3750
Time (s)
Anc
ho
r di
spla
cem
ent
(mm
)
0.00.10.20.30.40.50.60.70.80.91.01.11.21.31.41.51.61.71.81.92.0
Cra
ck w
idth
(m
m)
0.5 mm
scyc (0.8 mm)
0.8 mm
scyc (0.5 mm)
Figure 13. Time histories of anchor displacement and crack width during qualification test (example: Expansion anchor)
In Table 4, the mean anchor displacements measured for the shake table tests and for the qualification tests are compared. For the shake table tests, the mean anchor displacements were taken as sres given in Table 2 and 3 for tests with target maximum crack width of 0.5 and 0.8 mm. For the qualification tests, the anchor displacements scyc were evaluated for the respective crack width in the crack cycling protocol.
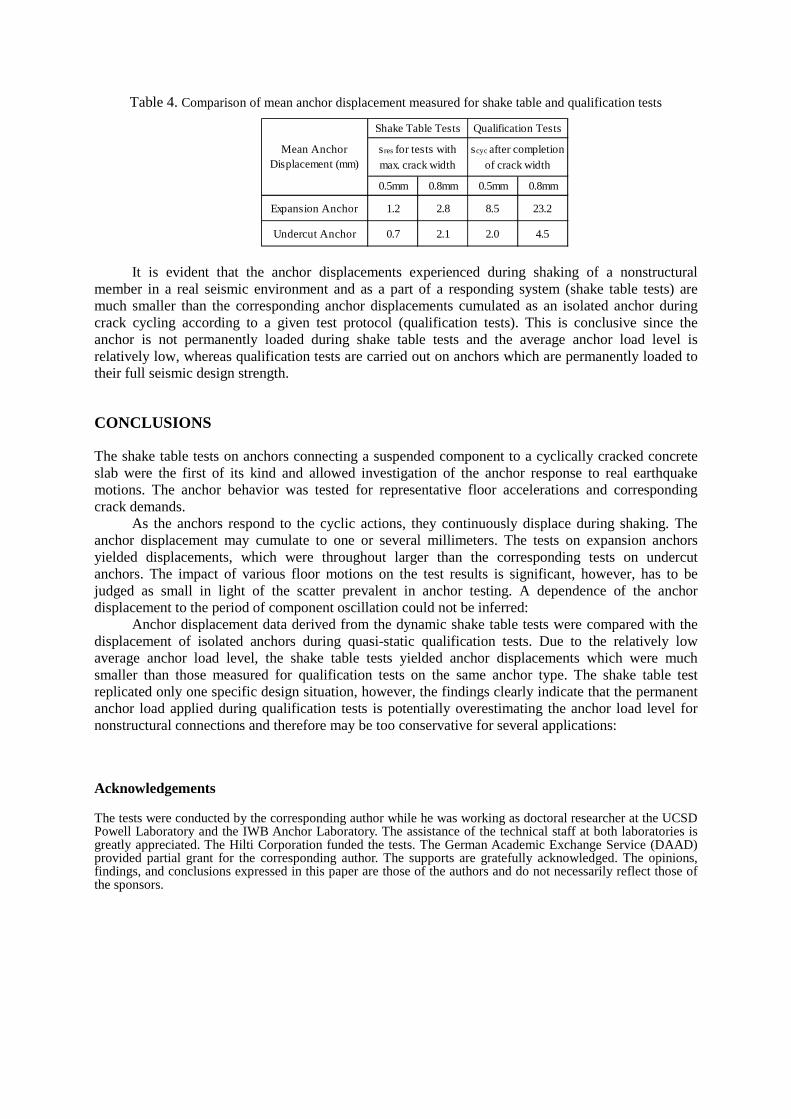
Table 4. Comparison of mean anchor displacement measured for shake table and qualification tests
0.5mm 0.8mm 0.5mm 0.8mm
Expansion Anchor 1.2 2.8 8.5 23.2
Undercut Anchor 0.7 2.1 2.0 4.5
Mean AnchorDisplacement (mm)
scyc after completionof crack width
sres for tests withmax. crack width
Qualification TestsShake Table Tests
It is evident that the anchor displacements experienced during shaking of a nonstructural
member in a real seismic environment and as a part of a responding system (shake table tests) are much smaller than the corresponding anchor displacements cumulated as an isolated anchor during crack cycling according to a given test protocol (qualification tests). This is conclusive since the anchor is not permanently loaded during shake table tests and the average anchor load level is relatively low, whereas qualification tests are carried out on anchors which are permanently loaded to their full seismic design strength.
CONCLUSIONS
The shake table tests on anchors connecting a suspended component to a cyclically cracked concrete slab were the first of its kind and allowed investigation of the anchor response to real earthquake motions. The anchor behavior was tested for representative floor accelerations and corresponding crack demands.
As the anchors respond to the cyclic actions, they continuously displace during shaking. The anchor displacement may cumulate to one or several millimeters. The tests on expansion anchors yielded displacements, which were throughout larger than the corresponding tests on undercut anchors. The impact of various floor motions on the test results is significant, however, has to be judged as small in light of the scatter prevalent in anchor testing. A dependence of the anchor displacement to the period of component oscillation could not be inferred:
Anchor displacement data derived from the dynamic shake table tests were compared with the displacement of isolated anchors during quasi-static qualification tests. Due to the relatively low average anchor load level, the shake table tests yielded anchor displacements which were much smaller than those measured for qualification tests on the same anchor type. The shake table test replicated only one specific design situation, however, the findings clearly indicate that the permanent anchor load applied during qualification tests is potentially overestimating the anchor load level for nonstructural connections and therefore may be too conservative for several applications:
Acknowledgements
The tests were conducted by the corresponding author while he was working as doctoral researcher at the UCSD Powell Laboratory and the IWB Anchor Laboratory. The assistance of the technical staff at both laboratories is greatly appreciated. The Hilti Corporation funded the tests. The German Academic Exchange Service (DAAD) provided partial grant for the corresponding author. The supports are gratefully acknowledged. The opinions, findings, and conclusions expressed in this paper are those of the authors and do not necessarily reflect those of the sponsors.
12
REFERENCES
ACI 355.2 (2007), Qualification of post-installed mechanical anchors in concrete (ACI 355.2-07) and commentary, American Concrete Institute (ACI), Farmington Hills, Michigan.
ACI 318 (2011), Building code requirements for structural concrete (ACI 318-11) and commentary (ACI 318R-11), American Concrete Institute, Farmington Hills, Michigan.
CEN/TS 1992-4 (2009), Design of fastenings for use in concrete – Part 4-1 – 4-5. Technical Specification, European Committee for Standardization (CEN), Brussels.
ETAG 001 (2006), Guideline for European technical approval of metal anchors for use in concrete, Parts 1 – 6, European Organization of Technical Approvals (EOTA), Brussels.
ETAG 001 Annex E (2013), Guideline for European technical approval of metal anchors for use in concrete – Annex E: Assessment of metal anchors under seismic actions.
Eurocode 8 (2006), Design of structures for earthquake resistance. European Committee for Standardization (CEN); DIN EN 1998.
Eligehausen, R., Mallée, R., and Silva, J. (2006), “Anchorage in concrete construction,” Ernst&Sohn, Berlin, 2006.
Gilani, A., Takhirov, S., and Tedesco, L. (2012), “Seismic evaluation procedure for suspended ceilings and components new experimental approach,” Proceedings of the 15th World Conference on Earthquake Engineering, Paper #0326, Lisbon.
Gould, N. and Griffin, M. (2003), “Earthquake performance of nonstructural components,” ABS Consulting, International Risk Management Institute, Inc., January 2003, http://www.irmi.com/Expert/Articles/2003/Gould01.aspx (Date accessed: June 6, 2009).
Griffin, M. and Winn, V. (2009), “Nonstructural seismic performance for facilities in seismic regions,” Proceedings of the ATC & SEI 2009 Conference on Improving the Seismic Performance of Existing Buildings and Other Structures, San Francisco.
Mahrenholtz, P. (2012), “Experimental performance and recommendations for qualification of post-installed anchors for seismic applications,” Dissertation, University of Stuttgart.
Mahrenholtz, P., Asmus, J., and Eligehausen, R. (2011), “Post-installed anchors in nuclear power plants: Performance and qualification,” Proceedings of the 8th International Conference on Structural Mechanics in Reactor Technology, Paper ID# 072, New Delhi.
Mahrenholtz, P., Hutchinson, T., Eligehausen, R., and Hofmann, J. (2012), “Shake table tests: Seismic performance of anchors connecting suspended nonstructural components to concrete,” Proceedings of the 15th World Conference of Earthquake Engineering, Paper ID# 2751, Lisbon.
Mahrenholtz, P., Hutchinson, T., and Eligehausen, R. (2012), “Shake table tests on anchors connecting suspended components to cyclically cracked concrete,” SSRP–12/01, UCSD.
Marxer, G.., Kunz, J., Schoch, M., and Schuler, D. (2003), “Earthquake resistant installations: Guideline for earthquake resistant design of installations and nonstructural elements”, Hilti, December 2003.
Masek, J. and Ridge, R. (2009), “Identification of methods to achieve successful implementation of nonstructural and equipment seismic restraints,” Report, Earthquake Engineering Research Institute (EERI), Oakland, California.
Muciaccia, G.. and Rosati, G.. (2012), “Behavior of bonded anchors under simulated seismic crack movement conditions,” Proceedings of the Conference on Bond in Concrete, 605-612, Brescia.
Taghavi, S. and Miranda, E. (2003), “Response assessment of nonstructural building elements,” PEER 2003/05, Pacific Earthquake Engineering Research Center, University of California, Berkeley College of Engineering.
Watkins, D., Hutchinson, T., and Hoehler, M. (2012), “Cyclic crack and inertial loading system for investigating anchor seismic behavior,” ACI Structural Journal, July-August 2012, Vol. 109, No. 4, 457-466.
Whittaker, A. and Soong, T. (2003), “An overview of nonstructural components research at three U.S. Earthquake Engineering Research Centers,” Proceedings of Seminar on Seismic Design Performance; Retrofit of Nonstructural Components in Critical Facilities, 271-280, Newport Beach.
Wood, R., Hutchinson, T. and Hoehler, M. (2010), “Cyclic load and crack protocols for anchored nonstructural components and systems,” SSRP-2009/12, UCSD.
Wood, R. and Hutchinson, T. (2012), “Effects of ground motion scaling on nonlinear higher mode building response,” Earthquake and Structures.
Zareian, F., Sampere, C., Sandoval, V., McCormick, D., Moehle, J., and Leon, R. (2012), “Reconnaissance of the Chilean wine industry affected by the 2010 Chile Offshore Maule Earthquake”, Earthquake Spectra, Vol. 28, No. S1, S503-S512.