Embed Size (px)
Citation preview

Gabriel-Alexandru Sabau, Martin Poljansek Fabio Taucer, Pierre Pegon, Francisco-Javier Molina, Daniel Tirelli, Bernard Viaccoz, Aurel Stratan, Adriana Ioan-Chesoan, Dan Dubina
Full-scale experimental
validation of dual
eccentrically braced frame
with removable links
SEISMIC ENGINEERING RESEARCH INFRASTRUCTURES FOR EUROPEAN SYNERGIES
2 0 1 4
Report EUR 27030

European Commission
Joint Research Centre
Institute for the Protection and Security of the Citizen
Contact information
Fabio Taucer
Address: Joint Research Centre, Via Enrico Fermi 2749, I - 21027 Ispra (VA), Italia
E-mail: [email protected]
Tel.: +39 0332 78 5886
https://ec.europa.eu/jrc
Legal Notice
This publication is a Science and Policy Report by the Joint Research Centre, the European Commission’s in-house
science service. It aims to provide evidence-based scientific support to the European policy-making process. The
scientific output expressed does not imply a policy position of the European Commission. Neither the European
Commission nor any person acting on behalf of the Commission is responsible for the use which might be made
of this publication.
All images © European Union 2014,
JRC 93136
EUR 27030
ISBN 978-92-79-44717-4 (PDF)
ISSN 1831-9424 (online)
doi: 10.2788/539418
Luxembourg: Publications Office of the European Union, 2014
© European Union, 2014
Reproduction is authorised provided the source is acknowledged.
Printed in Italy
Abstract
Conventional seismic design philosophy is based on dissipative structural response, which implicitly accepts
structural damage under the design earthquake load thus leading to significant economic losses.
Different strategies can be employed in order to reduce damage to structures under moderate to strong
earthquakes such as base isolation and various implementations of active and semi-active structural control. Other
strategies rely on supplemental damping conferred to the structure through various devices. These solutions
require specialized knowledge at the design stage and during erection, careful maintenance and high initial cost.
Another option constitutes a conventional design with replaceable dissipative members, easy to substitute even
after strong earthquake, and thus reducing the repair costs. A system with removable dissipative elements has to
fulfil two requirements to be efficient. Firstly, inelastic deformations should occur in removable elements only.
Secondly, the damaged dissipative elements must be replaceable. Replacing the elements is more efficient if the
structure does not have large permanent deformations. These two concepts were implemented in a dual structure,
obtained by combining steel eccentrically braced frames (with removable bolted links) and moment resisting
frames. The bolted links provide the energy dissipation capacity, while the moment resisting frames provide the
necessary re-centering capability

i
SEVENTH FRAMEWORK PROGRAMME
Capacities Specific Programme
Research Infrastructures
Project No.: 227887
SERIES SEISMIC ENGINEERING RESEARCH INFRASTRUCTURES FOR
EUROPEAN SYNERGIES
Work package 6
DUAREM
Full-scale experimental validation of dual eccentrically braced frame with removable links
TA Project Final Report
Work Package Leader: Fabio Taucer, Joint Research Centre
User Group Leader: Prof. Dan Dubina, Politehnica University of Timisoara
Revision: 6 March 2014
2014
Report EUR 26470 EN

SERIES 227887 DUAREM Project
i
Abstract
Conventional seismic design philosophy is based on dissipative structural response, which implicitly accepts structural damage under the design earthquake load, thus leading to significant economic losses as the permanent (residual) drifts of the structure often impede repair.
Different strategies can be employed in order to reduce damage to structures under moderate to strong earthquakes such as base isolation and various implementations of active and semi-active structural control. Other strategies rely on supplemental damping conferred to the structure through various devices based on viscous, friction, or yielding dampers. These solutions require specialized knowledge at the design stage and during erection, careful maintenance and high initial cost.
Another option constitutes a conventional design with replaceable dissipative members, easy to substitute after a moderate to strong earthquake, and thus reducing the repair costs. A system with removable dissipative elements has to fulfil two requirements to be efficient. Firstly, inelastic deformations should occur in removable elements only. Capacity design rules adopted in modern design codes can be used to achieve this objective. Secondly, the damaged dissipative elements must be replaceable. Replacing the elements is more efficient if the structure does not have large permanent deformations. These two concepts were implemented in a dual structure, obtained by combining steel eccentrically braced frames (with removable bolted links) and moment resisting frames. The bolted links provide the energy dissipation capacity and are easily replaceable, while the more flexible moment resisting frames provide the necessary re-centering capability.
This report contains experimental results from the DUAREM Project, a research program performed on a dual eccentric braced frame structure at the European Laboratory for Structural Assessment (ELSA) of the Joint Research Centre (JRC) of the European Commission at Ispra, within the framework of the Transnational Access activities of the SERIES Project. The DUAREM project aims at validating through pseudo-dynamic testing the re-centering capability of dual structures with removable dissipative members, assessing overall seismic performance of dual eccentrically braced frames and obtaining information on the interaction between the steel frame and the reinforced concrete slab in the link region. Pre-test numerical simulations were performed to preliminary assess the response of the structure under different levels of the seismic input.
Keywords: bolted links, eccentrically braced frame, re-centring, dual frame

SERIES 227887 DUAREM Project
i
Acknowledgements
The research leading to these results has received funding from the European Union Seventh Framework Programme [FP7/2007-2013] under grant agreement n° 227887 [SERIES].
This report and particularly the test campaign is the work not only of the authors but also of numerous colleagues in the ELSA laboratory who were responsible for setting up and running the experiments and that contributed with their knowledge in the design and execution of the tests performed. This project would not have been possible were it not for the contributions of the colleagues listed in alphabetical order below.
Massimo Bevilacqua
Giuseppe Bof
Olivier Hubert
Raoul Kiefer
Marco Peroni
Patrick Petit
Antonio Zorzan

SERIES 227887 DUAREM Project
i
Report Contributors
Joint Research Centre - ELSA Gabriel Alexandru Sabau
Martin Poljanšek
Fabio Taucer
Pierre Pegon
Francisco Javier Molina
Daniel Tirelli
Bernard Viaccoz
Politehnica University of Timisoara Aurel Stratan
Adriana Ioan-Chesoan
Dan Dubina

SERIES 227887 DUAREM Project
i
Contents
Contents ........................................................................................................................................... i
List of Figures .................................................................................................................................. i
1 Introduction .............................................................................................................................7
2 Objectives ................................................................................................................................9
3 Prototype ................................................................................................................................11
4 Specimen description .............................................................................................................13
4.1 General ..........................................................................................................................13
4.2 Materials .......................................................................................................................17
4.3 Steel elements ...............................................................................................................18
4.4 RC slab .........................................................................................................................19
4.5 RC Loading Beam ........................................................................................................20
4.6 Base connection to the reaction floor ...........................................................................21
4.7 Difficulties in replacing the seismic link ......................................................................21
5 Link replacement ...................................................................................................................27
5.1 General ..........................................................................................................................27
5.2 Technical solution for link removal ..............................................................................27
5.3 Link replacement procedure .........................................................................................29
6 Loading ..................................................................................................................................33
6.1 Vertical loading ............................................................................................................33
6.2 Horizontal loading ........................................................................................................35
6.2.1 Snap-back .........................................................................................................35
6.2.2 EQ time history accelerogram ..........................................................................37

SERIES 227887 DUAREM Project
ii
6.2.3 Pseudo dynamic method ..................................................................................39
6.2.4 Push-over..........................................................................................................40
7 Instrumentation ......................................................................................................................43
8 Experimental set-up ...............................................................................................................51
8.1 Snap-back .....................................................................................................................51
8.2 PsD and Push-over tests ...............................................................................................52
8.3 Dampers ........................................................................................................................54
9 Test campaign ........................................................................................................................55
9.1 Testing program ............................................................................................................55
9.2 Snap-back .....................................................................................................................56
9.3 PsD eq test: Full operation limit state ...........................................................................62
9.4 PsD eq test: Serviceability limit state ...........................................................................63
9.5 First link replacement ...................................................................................................64
9.6 PsD eq test: uls .............................................................................................................68
9.7 Push-over test ...............................................................................................................68
9.8 Second link replacement ...............................................................................................68
9.9 PsD eq test: Near Collapse Limit state .........................................................................74
9.10 Cyclic Push-over test ....................................................................................................75
10 Conclusions ...........................................................................................................................79
References ......................................................................................................................................81
11 Annex 1. Global Test Results ................................................................................................83
11.1 PSD Full Operation limit state test ...............................................................................83
11.2 PSD eq test: SLS ...........................................................................................................93
11.3 PSD eq test: ULS ........................................................................................................102
11.4 Push-over Test ............................................................................................................111
11.5 PSD eq test: NC ..........................................................................................................118
11.6 Cyclic Push-over test ..................................................................................................132

SERIES 227887 DUAREM Project
i
List of Figures
Figure 1. Bolted link concept ..................................................................................................... 7
Figure 2. Arrangement of secondary beams to disconnect the RC slab from links ................... 8
Figure 3. 3D view (a) and plan layout (b) of the prototype structure. ..................................... 11
Figure 4. Typical structural members ...................................................................................... 12
Figure 5. 3D view (a) and plan layout (b) of the experimental mock-up. ............................... 13
Figure 6. Experimental mock-up in front of the reaction wall. ............................................... 14
Figure 7. Shear studs arrangement ........................................................................................... 15
Figure 8. Details of gap between RC slab and steel columns. ................................................. 15
Figure 9. Out of plumb 1st floor .............................................................................................. 16
Figure 10. Out of plumb 2nd floor ........................................................................................... 16
Figure 11. Out of plumb 3rd floor ........................................................................................... 17
Figure 12. Specimen materials ................................................................................................. 17
Figure 13. Elevation view of the experimental mock-up. ........................................................ 19
Figure 14. Beam to column connection ................................................................................... 19
Figure 15. Link to beam connection ........................................................................................ 19
Figure 16. Link end braces ....................................................................................................... 19
Figure 17. Floor layout ............................................................................................................ 20
Figure 18. RC loading beam position ...................................................................................... 20
Figure 19. Base connections for: (a) corner and (b) central columns. ..................................... 21
Figure 20. Welding irregularities ............................................................................................. 22
SERIES 227887 DUAREM Project
ii
Figure 21. Slab irregularities.................................................................................................... 22
Figure 22. Dynamometric key tightening the bolts ................................................................. 23
Figure 23. Link to beam connection ........................................................................................ 23
Figure 24. (1) Preloading difficulties ....................................................................................... 24
Figure 25. (2) Preloading difficulties ....................................................................................... 24
Figure 26. Mounting of the second floor link (northern side) ................................................. 24
Figure 27. One story frame: (a) experimental setup and (b) flame cutting of the link. ........... 28
Figure 28. Time history function definition ............................................................................. 28
Figure 29. (a) Vertical cantilever; (b) Vertical cantilever with brace; (c) Vertical cantilever
with brace and damper; (d) Time-history of displacements for the different configurations .. 29
Figure 30. Height-wise link removal order. ............................................................................. 30
Figure 31. (a) Hydraulic jack; (b) Supports to facilitate removal of existing links and fitting
new ones................................................................................................................................... 31
Figure 32. Water tanks on the specimen at the 1st story .......................................................... 34
Figure 33. Water tanks on the specimen at the 2nd story ......................................................... 34
Figure 34. Concrete blocks on the specimen at the 3rd story ................................................... 35
Figure 35. Time-history displacements and loading function ................................................. 36
Figure 36. Average and average +/- one standard deviation response spectra of selected
records (as scaled) versus target spectrum. .............................................................................. 38
Figure 37. Response spectra of selected records (as scaled) versus target spectrum. ............. 38
Figure 38. Acceleration time histories of selected records. ..................................................... 39
Figure 39. General view with the position of the displacement transducers (Heidenhains,
inclinometers and Temposonics) on the northern side ............................................................ 44
Figure 40. General view with the position of the displacement transducers (Heidenhains,
inclinometers and Temposonics) on the southern side ............................................................ 45
Figure 41. Link displacement transducers ............................................................................... 46
Figure 42. EBF braces displacement transducers .................................................................... 46

SERIES 227887 DUAREM Project
iii
Figure 43. EBF beams at 1st story in frame 2 displacement transducers ................................. 46
Figure 44. Inclinometers arrangement ..................................................................................... 47
Figure 45. Strain gauges positions-Grid 1 ............................................................................... 48
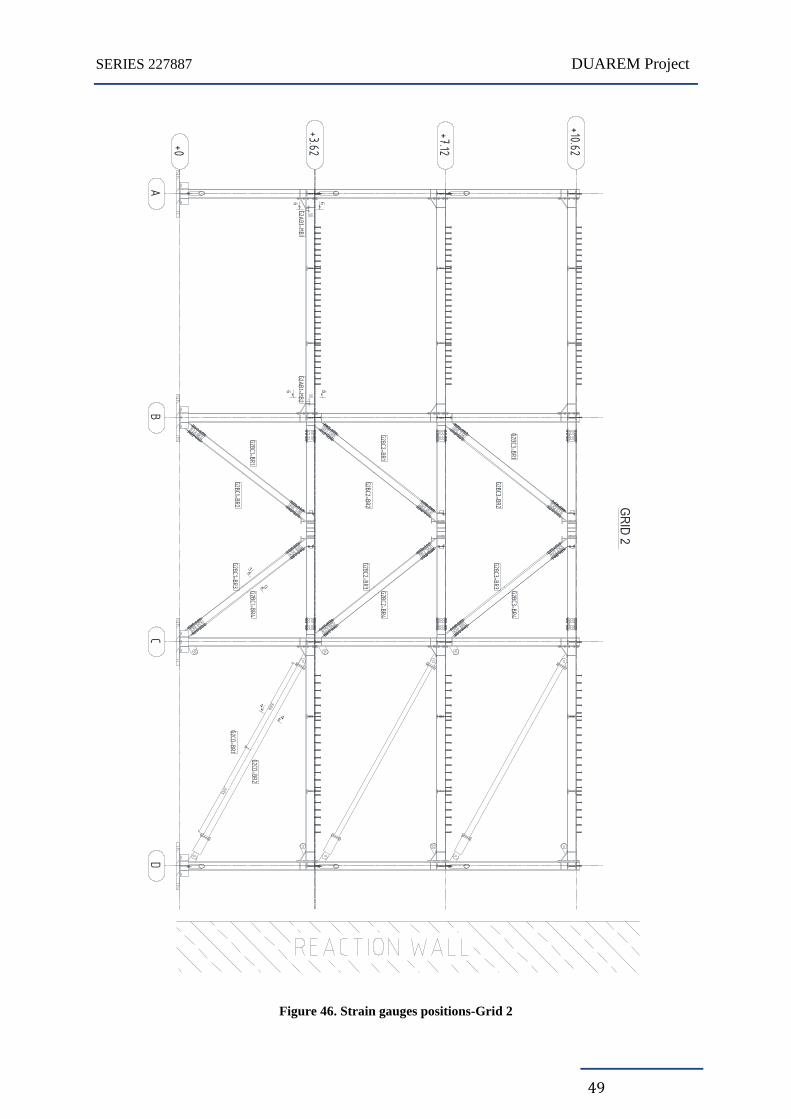
Figure 46. Strain gauges positions-Grid 2 ............................................................................... 49
Figure 47. Strain gages position on braces .............................................................................. 50
Figure 48. Strain gages position on dampers ........................................................................... 50
Figure 49. Strain gages position on beams .............................................................................. 50
Figure 50. Detail of strain gages position on beams ................................................................ 50
Figure 51. Piston assembly ...................................................................................................... 51
Figure 52. Global view of the snap back test set-up ................................................................ 52
Figure 53. Load application for the snap back test .................................................................. 52
Figure 54 PsD Set-up ............................................................................................................... 53
Figure 55. Reference Frames in Yellow .................................................................................. 54
Figure 56. Snap back test with no ALGA dampers: Time history of longitudinal
displacements (at all levels and N and S frame) and applied force at Level 1 N .................... 56
Figure 57. Snap back test: Time history of transversal displacements (at all levels, no ALGA
dampers) and longitudinal displacements (at all levels N and S frame, ALGA dampers) ...... 57
Figure 58. Mode shapes for snap back with ALGA dampers from LVDT readings ............... 57
Figure 59. Location of transducers for the snap back test ....................................................... 58
Figure 60. Accelerations measured during the snap back test ................................................. 58
Figure 61. Snap back test with dampers: Frequencies and damping for the first 16 modes and
identification of the main global modes................................................................................... 59
Figure 62. Snap back test: First three modes in the longitudinal direction.............................. 60
Figure 63. Snap back test: First two torsional modes .............................................................. 61
Figure 64. Snap back test: First two modes in the transverse direction ................................... 62
Figure 65. South View ............................................................................................................. 63

SERIES 227887 DUAREM Project
iv
Figure 66. First link replacement Heidenhain displacement history ....................................... 65
Figure 67. Serviceability Limit State PSD test, Southern frame links..................................... 66
Figure 68. Vertical Positioning ................................................................................................ 67
Figure 69. Horizontal Positioning ............................................................................................ 67
Figure 70. Cutting process of the links .................................................................................... 69
Figure 71. 3rd floor link after flame cutting ............................................................................. 69
Figure 72. Second link replacement Heidenhain displacement history ................................... 70
Figure 73. Additional fixing of the columns ............................................................................ 71
Figure 74. Out of plumb, 2nd measurement, 1st floor ............................................................... 72
Figure 75. Out of plumb, 2nd measurement, 2nd floor .............................................................. 72
Figure 76. Out of plumb, 2nd measurement, 3rd floor ............................................................... 73
Figure 77. Out of plumb, 3rd measurement, 1st floor ............................................................... 73
Figure 78. Out of plumb, 3rd measurement, 2nd floor ............................................................... 74
Figure 79. Out of plumb, 3rd measurement, 3rd floor ............................................................... 74
Figure 80. Detail of link failure ............................................................................................... 76
Figure 81. EBF column base detail .......................................................................................... 76
Figure 82. MRF beam end detail ............................................................................................. 77
Figure 83. Brace’s welding to the footing plate ....................................................................... 77
Figure 84. Damaged slab, 1st floor .......................................................................................... 78
Figure 85. Damaged slab, 2nd floor ......................................................................................... 78
Figure 86. Full operation PSD test, Reference displacements and Restoring forces ............... 84
Figure 87. Full operation PSD test, Interstorey Drift and Shear forces ................................... 85
Figure 88. Full operation PSD test, Reference displacement and Force ................................. 86
Figure 89. Full operation PSD test, Frame Shear force vs Frame drift displacement ............. 87
Figure 90. Full operation PSD test, Kinetic and absorbed energy ........................................... 88
Figure 91. Full operation PSD test, Frame Interstorey absorbed energy ................................. 89

SERIES 227887 DUAREM Project
v
Figure 92. Full operation PSD test, Total absorbed energy by frames .................................... 90
Figure 93. Full operation PSD test, Frequency and Damping of the Tested Structure............ 91
Figure 94. Full operation PSD test, Links rotation time-history.............................................. 92
Figure 95. Service Limit State PSD test, Reference displacements and Restoring forces ...... 93
Figure 96. Service Limit State PSD test, Interstorey Drift and Shear forces ........................... 94
Figure 97 Service Limit State PSD test, Kinetic and absorbed energy ................................... 95
Figure 98. Service Limit State PSD test, Reference displacement and Force ......................... 96
Figure 99. Service Limit State PSD test, Frame Shear force vs Frame drift displacement ..... 97
Figure 100. Service Limit State PSD test, Frame Interstorey absorbed energy ...................... 98
Figure 101. Service Limit State PSD test, Total absorbed energy by frames .......................... 99
Figure 102. Service Limit State PSD test, Frequency and Damping of the Tested Structure100
Figure 103. Service Limit State PSD test, Links Rotation Time-History .............................. 101
Figure 104. Ultimate Limit State PSD test, Reference displacements and Restoring forces 102
Figure 105. Ultimate Limit State PSD test, Interstorey Drift and Shear forces..................... 103
Figure 106 Ultimate Limit State PSD test, Kinetic and absorbed energy ............................. 104
Figure 107. Ultimate Limit State PSD test, Reference displacement and Force ................... 105
Figure 108. Ultimate Limit State PSD test, Frame Shear force vs Frame drift displacement
................................................................................................................................................ 106
Figure 109. Ultimate Limit State PSD test, Frame Interstorey absorbed energy .................. 107
Figure 110. Ultimate Limit State PSD test, Total absorbed energy by frames ...................... 108
Figure 111. Ultimate Limit State PSD test, Frequency and Damping of the Tested Structure
................................................................................................................................................ 109
Figure 112. Ultimate Limit State PSD test, Links Rotation Time-History ............................ 110
Figure 113. Push over test, Reference displacements and Restoring forces .......................... 111
Figure 114. Push over test, Interstorey Drift and Shear forces .............................................. 112
Figure 115. Push over test Shear force vs top displacement .................................................. 113
SERIES 227887 DUAREM Project
vi
Figure 116 Push over test, Frame absorbed energy ............................................................... 114
Figure 117. Push over test, Frame Interstorey absorbed energy ............................................ 115
Figure 118. Push over test, Total absorbed energy by frames ............................................... 116
Figure 119. Push over test, Links Rotation Time-History ..................................................... 117
Figure 120. Near Collapse State PSD test, Reference displacements and Restoring forces . 118
Figure 121. Near Collapse State PSD test, Interstorey Drift and Shear forces ...................... 119
Figure 122 Near Collapse State PSD test, Kinetic and absorbed energy............................... 120
Figure 123. Near Collapse State PSD test, Reference displacement and Force .................... 121
Figure 124. Near Collapse State PSD test, Frame Shear force vs Frame drift displacement 122
Figure 125. Near Collapse State PSD test, Frame Interstorey absorbed energy .................... 123
Figure 126. Near Collapse State PSD test, Total absorbed energy by frames ....................... 124
Figure 127. Near Collapse State PSD test, Frequency and Damping of the Tested Structure
................................................................................................................................................ 125
Figure 128. Near Collapse State PSD test, Links Rotation Time-History ............................. 126
Figure 129. Push-over test, Reference displacements and restoring forces ........................... 127
Figure 130. Push-over test, Interstorey drift vs top displacement ......................................... 128
Figure 131. Push-over test, Top displacement vs base shear ................................................. 129
Figure 132. Push-over test, Frame interstorey absorbed energy ............................................ 130
Figure 133. Push-over test, Total absorbed energy by frames ............................................... 131
Figure 134. Push over test, Reference displacements and Restoring forces .......................... 132
Figure 135. Push over test, Interstorey Drift and Shear forces .............................................. 133
Figure 136. Push over test Shear force vs top displacement .................................................. 134
Figure 137. Push over test, Frame interstorey absorbed energy ............................................ 135
Figure 138. Push over test, Total absorbed energy by frames ............................................... 136
Figure 139. Push over test, 3rd Floor link rotation ................................................................. 137

SERIES 227887 DUAREM Project
7
1 Introduction
A conventional design with replaceable dissipative members (e.g. bolted connections) when damaged in a moderate to strong earthquake allow a reduction in repair costs and time. For the structure to be repairable, in addition to constraining inelastic deformations to removable dissipative members, the permanent (residual) drifts should be eliminated.
The application of the concept of removable dissipative members to eccentrically braced frames (EBFs), where links act as dissipative zones, is presented in Figure 1 (Stratan and Dubina [6]; Dubina et al.[2]). The connection of the link to the beam is done by a flush end-plate and high-strength friction grip bolts. The main advantage over other dissipative devices is that the removable links can be designed using methods readily available to structural engineers and can be fabricated and erected using procedures standard to the profession.
Figure 1. Bolted link concept
The re-centring of the system is attained by designing the structure as a dual one; combining eccentrically braced frames (EBFs) and moment-resisting frames (MRFs). The elastic response of the flexible subsystem (MRF) provides the restoring forces, once the links damaged during an earthquake are removed. For this principle to be efficient, the flexible subsystem must remain in the elastic range. A possible way to ensure re-centring is to use high-strength steel in selected members. Furthermore, the residual deformations of the links should allow for bolt removal. If these deformations are too large, flame cutting of a link prior to unbolting may be necessary to slowly release the residual stresses and deformations.
A possible difficulty in eccentrically braced frames with horizontal links is the interaction between the removable link and concrete slab. On one hand, the concrete slab can affect the link’s shear capacity and the behaviour of the link-beam connection. On the other hand, large link deformations could damage the concrete slab, which results in plastic deformations (damage) outside links. One possible solution is to disconnect the removable link from the reinforced concrete slab, by extending the slab only up to an additional secondary beam placed in parallel with the beam containing the
e

SERIES 227887 DUAREM Project
8
link (see Figure 2). Another possible solution is to use a conventional reinforced concrete slab, connected or not with shear studs to the removable link, and to accept slab damage. In this situation, it would be necessary to repair the slab locally after a damaging earthquake, in addition to replacing the link. It is expected that only the concrete would be damaged in the link region, while the reinforcement and corrugated steel sheet used as formwork would retain their integrity due to larger flexibility. The repair procedure would consist of removing the crushed concrete and casting of new concrete over the affected area.
Figure 2. Arrangement of secondary beams to disconnect the RC slab from links

SERIES 227887 DUAREM Project
9
2 Objectives
The proposed research suggests a solution that provides re-centring capability (as opposed to self-centring), by removable dissipative members and dual (rigid-flexible) structural configuration. The objectives of the proposed research are:
Validate experimentally the re-centring capability of dual structures with removable dissipative members.
Investigate the interaction between the concrete slab and steel structure in the link region.
Assess global seismic performance of dual EBFs with removable links, including the replacement of damaged links.


SERIES 227887 DUAREM Project
11
3 Prototype
The prototype structure is a steel-concrete composite building with three 6 m bays in the transverse direction and five 6 m bays in the longitudinal direction. The building is three storey high, with an inter-storey height of 3.5 m. The main lateral load resisting system is composed of the eccentrically braced frames. Additionally, there are four moment resisting frames in the transverse direction (2 on each side) and ten moment resisting frames in the longitudinal direction (2 on each side and 6 in the structure’s core) to resist the horizontal forces from the earthquake (see Figure 3). The main features of the structure can be summarised as follows (see Figure 4): columns made of high strength steel; braces, beams and removable links made of mild carbon steel; composite secondary beams; reinforced concrete floor cast in place on corrugated steel sheets.
The structure was designed to EN1990, EN1991, EN1992, EN1993, EN1994 and EN1998. Permanent and variable loads of 4.9 kN/m2 and 3.0 kN/m2 were considered, respectively. The building was analysed for stiff clay soil conditions (EC8 type 1 spectrum for soil type C) and designed for a 0.19g peak ground acceleration corresponding to the Ultimate Limit State. A behaviour factor q = 6 (ductility class H) and an inter-storey drift limitation of 0.0075 of the storey height were used. The geometry of the elements used are presented in Table 1.
(a) (b)
Figure 3. 3D view (a) and plan layout (b) of the prototype structure.

SERIES 227887 DUAREM Project
12
Table 1. Elements types
Element Section Height Flange width
Flange thickness
Web thickness
Column HE 240 A 230 240 12 8
MRF Beam IPE 240 240 120 9.8 6.2
EBF Beam HE 240 A 230 240 12 8
Brace HE 200 B 200 200 15 9
Link L1 & L2 - 230 170 12 8
Link L3 - 230 120 12 4
Steel column;
high-strength
steel
Steel main beams
in MRFs; mild
carbon steel
Composite steel
concrete
secondary beams;
mild carbon steel
Steel braces;
mild carbon
steel
Bolted links; mild carbon steel
Figure 4. Typical structural members
The steel structural components were designed in S355 grade steel, with two exceptions. Grade S460 steel was used for columns, in order to obtain a larger capacity without increasing the stiffness. This approach helps promoting the capacity design rules. Links were designed in grade S235 steel which was replaced during fabrication with equivalent DOMEX 240 YP B.

SERIES 227887 DUAREM Project
13
4 Specimen description
4.1 GENERAL
The test structure in the lab was designed to model the two external frames of the prototype building in the transversal direction (Figure 5). The external frames are the only lateral force resisting systems in the direction of the prototype.
The experimental mock-up (Figure 5 and Figure 6) is a three storey structure with 3.5 m inter-storey heights, consisting of three 6 m bays and one 6 m bay in the longitudinal and transverse directions, respectively. The lateral force resisting system is composed of two dual steel frames (eccentrically braced and moment resisting frames).
(a) (b)
Figure 5. 3D view (a) and plan layout (b) of the experimental mock-up.
SERIES 227887 DUAREM Project
14
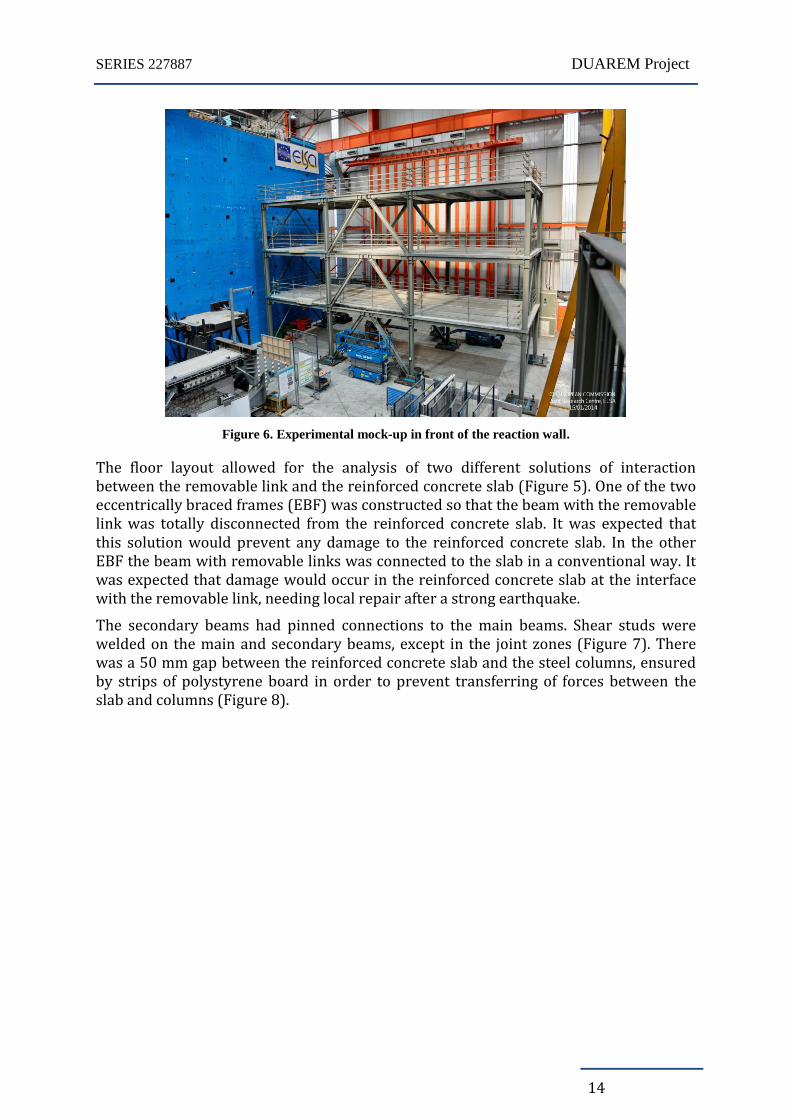
Figure 6. Experimental mock-up in front of the reaction wall.
The floor layout allowed for the analysis of two different solutions of interaction between the removable link and the reinforced concrete slab (Figure 5). One of the two eccentrically braced frames (EBF) was constructed so that the beam with the removable link was totally disconnected from the reinforced concrete slab. It was expected that this solution would prevent any damage to the reinforced concrete slab. In the other EBF the beam with removable links was connected to the slab in a conventional way. It was expected that damage would occur in the reinforced concrete slab at the interface with the removable link, needing local repair after a strong earthquake.
The secondary beams had pinned connections to the main beams. Shear studs were welded on the main and secondary beams, except in the joint zones (Figure 7). There was a 50 mm gap between the reinforced concrete slab and the steel columns, ensured by strips of polystyrene board in order to prevent transferring of forces between the slab and columns (Figure 8).

SERIES 227887 DUAREM Project
15
Figure 7. Shear studs arrangement
Figure 8. Details of gap between RC slab and steel columns.
After the erection of the structure an out of plumb measurement was made to check the initial geometric imperfections of the structure with respect to the required tolerances. The measurement was done with a plumb-line placed at the top of each of the column’s faces and stretched downwards, where it was measured with a calliper just above the footings. The initial out of plumb shape of the structure is presented in Figure 9 to Figure 11.

SERIES 227887 DUAREM Project
16
Figure 9. Out of plumb 1st floor
Figure 10. Out of plumb 2nd floor
ey (
m)
ey (
m)
ex (m) -0.005 -0.0
04
North (composite link)
-0.0
02
0.01 ex (m)
ex (m) -0.004
-0.0
02
South (coupling beam)
-0.0
03 0.008 ex (m)
ey (
m)
ey (
m)
A
B C
D
ey (
m)
ey (
m)
ex (m) 0.012
0.0
02
North (composite link)
0.0
05
0.008 ex (m)
ex (m) 0.002
0.0
03
South (coupling beam)
0.0
04 0.006 ex (m)
ey (
m)
ey (
m)
C
D
B
A
ey (
m)
ey (
m)
ex (m) 0.002
0.0
02
North (composite link)
0.0
02
0.006 ex (m)
ex (m) 0.002
-0.0
02
South (coupling beam)
0.0
04 0.004 ex (m)
ey (
m)
ey (
m)
C
D
B
A

SERIES 227887 DUAREM Project
17
Figure 11. Out of plumb 3rd floor
4.2 MATERIALS
The columns were made of high strength steel S460, the removable links of DOMEX 240 YP B steel, whereas for all the other elements mild carbon steel S355 was used Figure 12). Mechanical characteristics of steel components according to quality certificates (and in some cases also from independent tests) are presented in Table 2.
Figure 12. Specimen materials
The reinforced concrete slab was made of C25/30 concrete with 610HD steel reinforcement bars; the loading beams were reinforced with B450-C bars. The corrugated steel sheeting was made of A55-P600 G5 S250 structural steel. The bolts for the braces in the transverse direction and for the secondary beams were grade 8.8; the rest were grade 10.9. The Nelson shear studs were S235 steel.
Table 2. Mechanical characteristics of steel components according to the quality certificates and
independent tests
Element Component Steel grade fy
(N/mm2)
fu
(N/mm2) fu/fy A (%)
Columns
Web t=8mm S460NL 512 651 1.271 25.5
Flange t=12 mm P460NH 503 650 1.292 25.0
Base plate t=30 mm S355J2+N 387 536 1.385 30.9
Links
(independent
tests)
Web stiffener III t=4 mm DOMEX 240
YP B 303 391 1.290 39.3
Web stiffener I,II t=8 mm DOMEX 240
YP B 293 380 1.297 34.8
Flanges t=12 mm DOMEX 240
YP B 250 361 1.444 39.0
Stiffeners t=10 mm DOMEX 240
YP B 282 377 1.337 39.3
Links (quality
certificates)
Web stiffener III t=4 mm DOMEX 240
YP B
282
326
380
389
1.348
1.193
37.0
36.0
Web stiffener I,II t=8 mm DOMEX 240
YP B
308
307
387
393
1.256
1.280
32.0
29.0
Flanges t=12 mm DOMEX 240
YP B
263
267
369
367
1.403
1.375
34.0
35.0
Stiffeners t=10 mm DOMEX 240
YP B
265
276
378
383
1.426
1.388
34.0
33.0
Link end plate t=25 mm S355J2+N 351 543 1.547 29.9

SERIES 227887 DUAREM Project
18
Element Component Steel grade fy
(N/mm2)
fu
(N/mm2) fu/fy A (%)
EBF braces
HEB200 S355J2+M 405 492 1.215 33.69
Splice connection web plate
t=6 mm S355J2+N 373 495 1.327 26.8
Splice connection flange
plate t=8 mm S355J2+N 378 533 1.410 24.3
EBF beam
HEA240 S355J0+M 384 541 1.409 30.89
Splice connection web plate
t=6 mm S355J2+N 373 495 1.327 26.8
Splice connection flange
plate t=8 mm S355J2+N 378 533 1.410 24.3
MRF beam
IPE240 S355J2+AR 425 553 1.301 29.0
Haunch web t=6 mm S355J2+N 373 495 1.327 26.8
Haunch flange t=16 mm S355J2+N 382 526 1.377 28.2
End plate t=20 mm S355J0+N 460 561 1.220 26.0
Sec. beams IPE220 S355J0+AR 416 568 1.365 30.0
Damper braces CHS 139.7x5 S355J2H 369 536 1.453 28.5
4.3 STEEL ELEMENTS
The columns were fixed at the base and were fabricated from built-up H sections. The main beams from the moment resisting frames are IPE240 sections, the braces are HEB200 sections and the main beams from the braced frames are HEA240, while the removable links were fabricated as built-up H sections. The secondary beams are pinned and are composite steel-concrete beams (IPE220 steel sections), Figure 13 shows an elevation view of the experimental mock-up. The geometry of the sections can be seen in Table 1 and the mechanical characteristics of the steel components in Table 2.
IPE240 IPE240
IPE240 IPE240
IPE240 IPE240
HEA240 HEA240
HEA240 HEA240
HEA240 HEA240
HEB
220
HEB
220
HEB
220
HEB
220
H 230x170x12x8
H 230x120x12x4
H 230x170x12x8
HEB
220
HEB
220
H 2
30
x2
40
x1
2x
8
H 2
30
x2
40
x1
2x
8
H 2
30
x2
40
x1
2x
8
H 2
30
x2
40
x1
2x
8

SERIES 227887 DUAREM Project
19
Figure 13. Elevation view of the experimental mock-up.
The beam to column and the link to beam connections are shown in Figure 14 and Figure 15, respectively
Figure 14. Beam to column connection
Figure 15. Link to beam connection
In the frame with slab over links (northern side), the ends of the links are fixed at the upper side by the slab, while in the frame with disconnected slab (southern side), the lower side by L fly-braces and at both sides by L braces (Figure 16).
Figure 16. Link end braces
4.4 RC SLAB
The reinforced concrete slab (Figure 17) was designed as a one way slab in the longitudinal direction, with a thickness of 90 mm
SERIES 227887 DUAREM Project
20
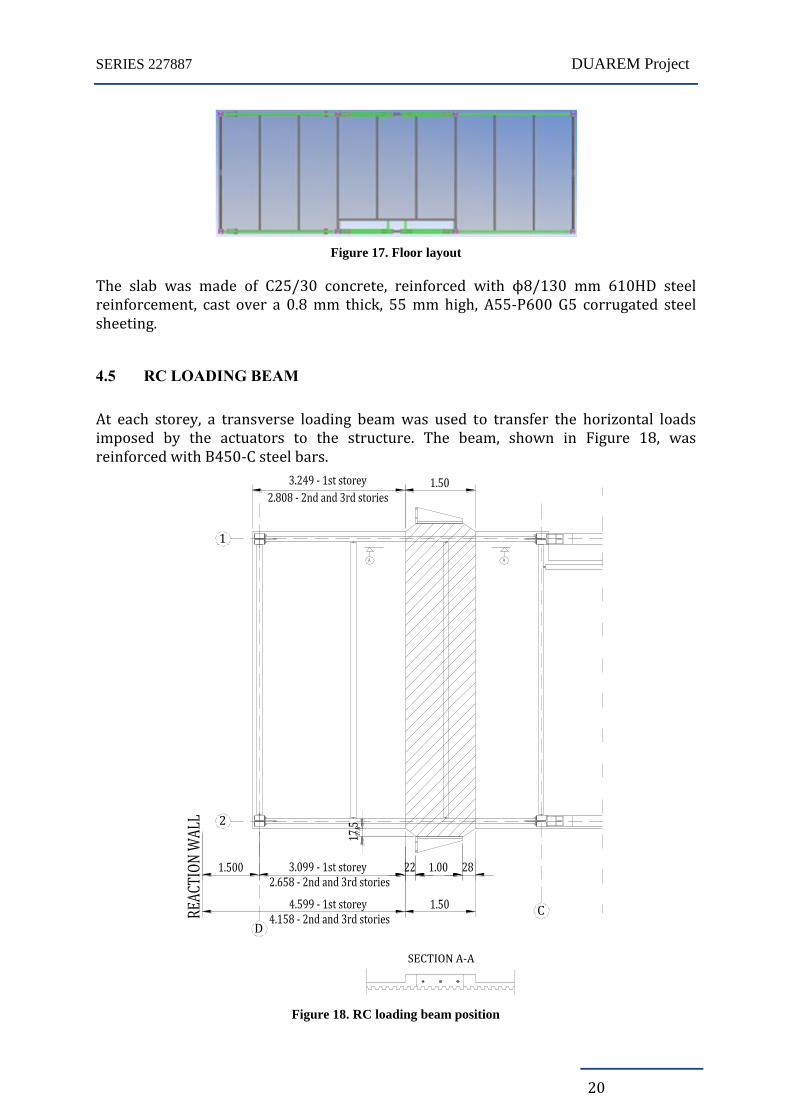
Figure 17. Floor layout
The slab was made of C25/30 concrete, reinforced with ϕ8/130 mm 610HD steel reinforcement, cast over a 0.8 mm thick, 55 mm high, A55-P600 G5 corrugated steel sheeting.
4.5 RC LOADING BEAM
At each storey, a transverse loading beam was used to transfer the horizontal loads imposed by the actuators to the structure. The beam, shown in Figure 18, was reinforced with B450-C steel bars.
Figure 18. RC loading beam position
D
1
SECTION A-A
2
C

SERIES 227887 DUAREM Project
21
4.6 BASE CONNECTION TO THE REACTION FLOOR
A 30 mm thick plate was welded to the base of the columns and bolted to a 100 mm thick plate by 7-M36 10.9 HV bolts (4-M36 for the corner columns). The 100 mm thick plate was anchored to the strong floor by four Dywidag bars (Figure 19) spaced at 1.00 m. 20 mm thick stiffeners were welded to both the column flanges and the steel base plate.
The M36 bolts were tightened with a 500 Nm torque; the 30 mm base plate was welded to the 100 mm thick plate with an 8 mm throat, 550 mm long fillet welds, on all four sides for the central columns and with a 5 mm throat, 560 mm long fillet welds, on all four sides for the corner columns (Figure 19).
(a) (b)
Figure 19. Base connections for: (a) corner and (b) central columns.
4.7 DIFFICULTIES IN REPLACING THE SEISMIC LINK
In order to run the first set of tests – the snapback test – the links had to be removed. The structure had to be pushed apart using a hydraulic jack to generate enough gap to remove the links. In the northern side, where the central beams were connected to the slab, it was more difficult to displace the beams, pushing the hydraulic jack to its maximum capacity. The links still had to be forced out with a crowbar. The maximum capacity of the hydraulic jack was 500 kN at 700 bar. The links were removed in the order presented in Table 3 below.
Table 3. Pressure and forces applied at link removal (snap-back)
Position Bar kN Observation
Set A Links - 1st replacement
S L3 359.8 257 removed
S L2 599.2 428 removed
S L1 499.8 357 removed
N L3 700 500 removed
N L2 700 500 removed
N L1 700 500 removed

SERIES 227887 DUAREM Project
22
The installation of the seismic links after the snap-back test generated a series of difficulties due to some irregularities in the concrete slab and at the level of welding in the links (Figure 20). Another problem was the lack of space under the slab where the seismic links were fitted (Figure 21).
Figure 20. Welding irregularities
Figure 21. Slab irregularities
The links initially fitted in the structure could not be replaced because they were generally too long to fit back into the structure. The length of the links, according to the initial design, were of two lengths: 398 mm and 400 mm, respecting the tolerances of EN 1090-2:2008, Table D.2.7 [8]. The manufacturer provided the links with lengths between 399 mm to 402 mm, still within the tolerances, but could not be fitted even with the support of the hydraulic jack. Therefore, the links had to be machined with a precision of ±0.5 mm according to class M tolerance of ISO 2768-1, Table 1 [9], to total lengths of 396 (one set) and 398 mm (second set).
The preloading of the bolts raised a few problems at the links on the frame where the slab is not disconnected from the beam. The method applied for preloading consisted in tightening the bolts with a torque of 0.75Mr,1, where Mr,1 is the reference torque value to be used for a normal minimum preloading force Fp,C, then turning the dynamometric

SERIES 227887 DUAREM Project
23
key another 60° as stated in EN 1090-2:2008 [8]. This was difficult due to the following factors:
The limited space between the slab and the additional masses placed on the structure allowed only small strokes of the dynamometric key (Figure 22).
Figure 22. Dynamometric key tightening the bolts
The head of the dynamometric key (used to tight nuts or bolts) was machined to allow access to the corner nuts/bolts on the inner face of the link (Figure 23).
Figure 23. Link to beam connection
The stiffeners generated difficulties in placing the dynamometric key in position to tighten the bolts. One key was necessary for keeping the nut in position, while the bolt was being rotated. Since the dynamometric key could not be inserted between the links’ stiffeners and the end plate (Figure 24), it was difficult to hold the nuts correctly for the preloading process (Figure 25).

SERIES 227887 DUAREM Project
24
Figure 24. (1) Preloading difficulties
Figure 25. (2) Preloading difficulties
Good support had to be provided to ensure that the torque was fully applied (approx. 50 kg at the end of the dynamometric key), therefore two support platforms were used (Figure 26).
Figure 26. Mounting of the second floor link (northern side)
Based on the difficulties found in removing the seismic link, it is strongly recommended that the beams along the braced spans where the seismic link is located should be disconnected from the slab. Furthermore, for the future design of the joints special

SERIES 227887 DUAREM Project
25
attention should be given to facilitate easier access for the preloading of bolts. This would consist in keeping:
Minimum distances between bolts;
Minimum distances between the final row of bolts and the flanges of the links;
Minimum distances between the end plate and the stiffeners;
Minimum space for turning the dynamometric key in an efficient manner.


SERIES 227887 DUAREM Project
27
5 Link replacement
5.1 GENERAL
Residual forces and deformations are present in the links after they have undergone plastic deformations during an earthquake. Removing a damaged link involves redistribution of residual forces to other parts of the structure, more precisely from the braces to the moment resisting frame. When residual deformations in links are not significant, links may be removed by unbolting. However, when pronounced plastic deformations are set in the links, residual forces can only be released by flame cutting. This is a relatively fast and technologically straight forward procedure; however, risks during the replacement procedure should be evaluated.
During the design phase there were concerns that a sudden release of force in the shear link may occur during its removal, thus placing the operating personnel at risk. In order to diminish this risk, a temporary bracing system consisting of tension braces and dampers was proposed. During removal of the links, the locked in forces are transferred to the temporary bracing system and smoothly released by the dampers to the moment resisting frame. Investigations underlying the process of link removal and the use of the temporary braces are detailed in Section 5.2.
The procedure for removing the links is performed on a storey-by-storey basis. As brace forces are released, the structure recovers its initial (in plumb) position, becoming free of any locked-in forces and new links can be installed. Additional information on the link removal order and replacement procedure is given in Section 5.3.
5.2 TECHNICAL SOLUTION FOR LINK REMOVAL
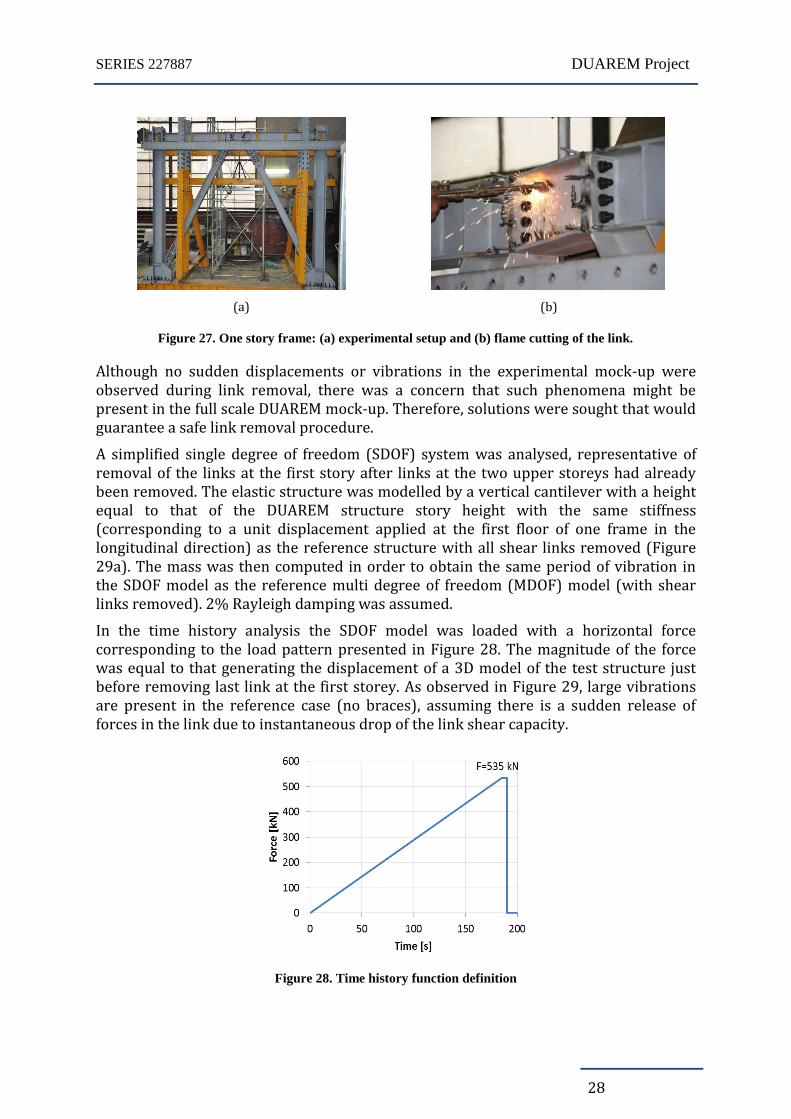
Tests were performed at the Politehnica University of Timisoara on a one storey – one span eccentrically braced frame with a removable link (Figure 27) in order to check the feasibility of link removal through flame cutting (Stratan et al. [7]). It was found that by cutting out the web of the link by oxy-fuel cutting is not enough for eliminating the residual forces in the link, as flanges, in the absence of the web, also contribute to the shear stiffness of the link. Therefore, both the web and the flanges have to be flame cut in order to allow easy replacement of the links.
SERIES 227887 DUAREM Project
28
(a)
(b)
Figure 27. One story frame: (a) experimental setup and (b) flame cutting of the link.
Although no sudden displacements or vibrations in the experimental mock-up were observed during link removal, there was a concern that such phenomena might be present in the full scale DUAREM mock-up. Therefore, solutions were sought that would guarantee a safe link removal procedure.
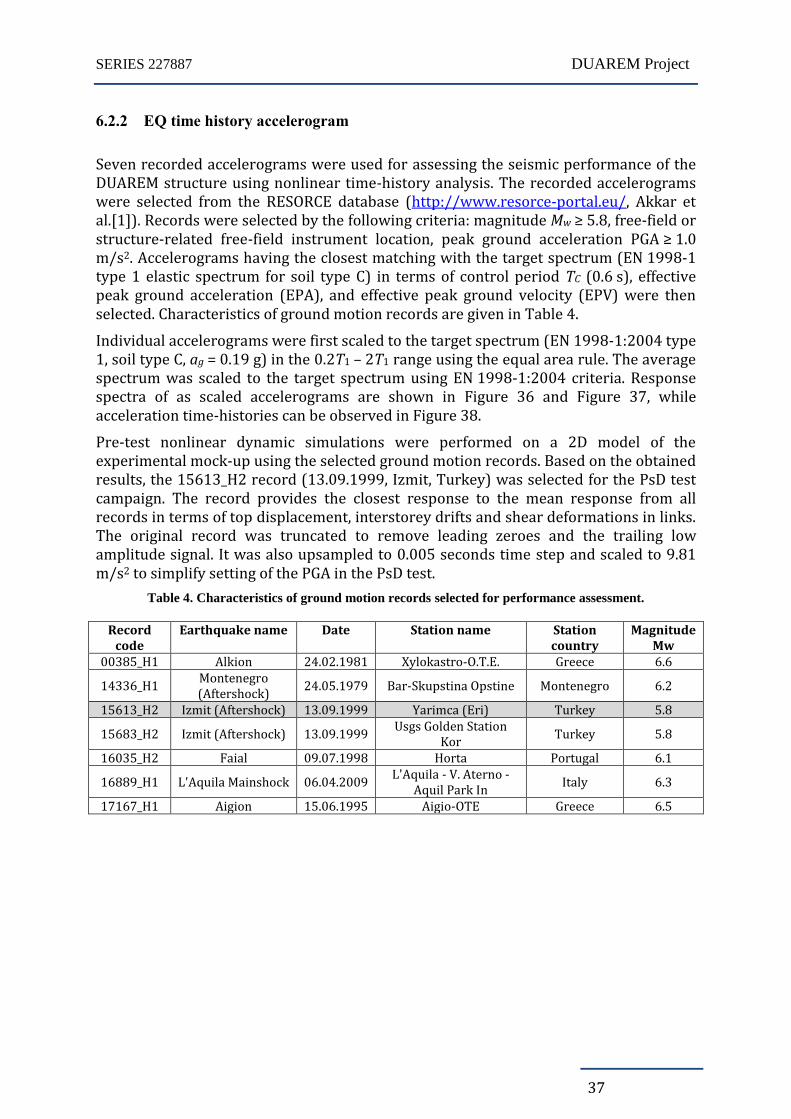
A simplified single degree of freedom (SDOF) system was analysed, representative of removal of the links at the first story after links at the two upper storeys had already been removed. The elastic structure was modelled by a vertical cantilever with a height equal to that of the DUAREM structure story height with the same stiffness (corresponding to a unit displacement applied at the first floor of one frame in the longitudinal direction) as the reference structure with all shear links removed (Figure 29a). The mass was then computed in order to obtain the same period of vibration in the SDOF model as the reference multi degree of freedom (MDOF) model (with shear links removed). 2% Rayleigh damping was assumed.
In the time history analysis the SDOF model was loaded with a horizontal force corresponding to the load pattern presented in Figure 28. The magnitude of the force was equal to that generating the displacement of a 3D model of the test structure just before removing last link at the first storey. As observed in Figure 29, large vibrations are present in the reference case (no braces), assuming there is a sudden release of forces in the link due to instantaneous drop of the link shear capacity.
Figure 28. Time history function definition

SERIES 227887 DUAREM Project
29
Two solutions that would alleviate these vibrations were investigated. In the first case, a tension brace that releases force through manual or hydraulic de-tensioning (Figure 29b), while in the second one a bracing system composed of a brace with a damper (Figure 29). Damper properties were selected to provide a damping coefficient c close the critical one. Damper response was modelled using the law: FD=cvα, with α=1. It can be observed (Figure 29a) that the top displacement amplitude decreases by adding the tension brace but the structure still vibrates. Moreover, there is an important amplification (about 2) of the force in the brace with respect to the static force. However, when using the brace with damper, it can be observed that the structure doesn’t vibrate, meaning that this is the safest solution. The brace force is very close to the force obtained from static linear analysis.
Consequently, two safety braces with dampers were manufactured, in order to be used during removal of links in the experimental mock-up, one for each eccentrically braced frame.
(a)
(b)
(c)
(d)
Figure 29. (a) Vertical cantilever; (b) Vertical cantilever with brace; (c) Vertical cantilever with brace
and damper; (d) Time-history of displacements for the different configurations
5.3 LINK REPLACEMENT PROCEDURE
Numerical simulations were performed in order to investigate the link replacement procedure following significant inelastic deformations (Ioan et al. [5]). Nonlinear static analysis was used, considering that there is no possibility of dynamic effects, especially when safety braces are used. It was found that there is negligible redistribution of forces

SERIES 227887 DUAREM Project
30
among storeys (an increase of link shear force smaller than 10%). Therefore, the link replacement procedure can be performed on a storey by storey basis, starting from the least loaded to the most loaded one (from the upper storey toward the lower one, Figure 30) in parallel for both frames of the experimental mock-up.
(a)
(b)
(c)
(d)
(e)
(f)
Figure 30. Height-wise link removal order.
Once all links have been removed, and the last safety brace is eliminated, the structure recovers its initial (in plumb) geometry. The new (replacement) links should be installed at this stage. To simplify mounting, the links were made slightly shorter (by 2

SERIES 227887 DUAREM Project
31
mm) with respect to the original ones. Shims (1 mm and 2 mm) were made in order to fit possible gaps between the end plates. Additionally, a manually operated hydraulic jack of 500 kN capacity was used to slightly put apart the beam end plates before installing new links. Special supports for the hydraulic jack were foreseen on the braces just under the links (Figure 31).
(a) (b)
Figure 31. (a) Hydraulic jack; (b) Supports to facilitate removal of existing links and fitting new ones.
The test procedure adopted during the PsD tests include link replacement and is outlined as follows:
Gravity loading is applied using water tanks and concrete blocks placed on the RC floor.
Earthquake loading is simulated on the test structure using the PsD test procedure (Figure 30a).
At the end of the PsD test the actuators are disconnected from the mock-up, while the instrumentation is still in operation. Residual deformations are present in this state (Figure 30b).
The two temporary bracings are installed at the third storey by connecting them to the gusset plates available at the moment resisting span closest to the reaction wall.
One of the links from the third story is removed, preferably by flame cutting if the locked in stresses in the link are large (Figure 30c). The central panel of the web is cut out, followed by the flanges. The bolts are then removed by untightening. A hydraulic jack is placed in a special support below the link and is used to apply a force up to 500 kN in order to slightly push apart the end plates to remove the link.
The same procedure is repeated for the other link from the third story and the two bracing systems are removed and installed at the storey immediately below.
The previous two steps are repeated for the second (Figure 30d) and first (Figure
30e) storeys. The structure should recovers its in-plumb position at this stage (Figure 30f).


SERIES 227887 DUAREM Project
33
6 Loading
6.1 VERTICAL LOADING
Gravity loads were determined based on the provisions of EN 1991. The prototype structure was designed for permanent and variable loads on floors amounting to 4.9 kN/m2 (not including self-weight of structural members) and 3.0 kN/m2, respectively. The load combination applied on the specimen prior to pseudo-dynamic testing was:
1.00 Gk + 0.30 Qk
where:
Gk (total permanent load)
= Gksm + Gkrc + Gka
Gksm (self-weight of structural members)
Gkrc (self-weight of the reinforced concrete slab, including steel sheeting)
= 3.14 kN/m2
Gka (additional permanent load)
= 1.76 kN/m2
Qk (variable load)
= 3.0 kN/m2
Therefore, the additional gravity load per floor that needs to be placed on the structure amounts to:
1.00 x 1.76 kN/m2 + 0.30 x 3.00 kN/m2 = 2.66 kN/m2
which was reached by placing water tanks of maximum capacity of 1 ton (1 m3) each, with plan dimensions of 1.0 x 1.2 m, and concrete blocks of 2.7 tonnes (0.87x1.0x1.25 m).The water tanks and concrete blocks were placed above the transversal beams, except where the actuator beam is found (not being necessary any additional loads on this strip). The exact placement of the water tanks and concrete blocks, as well as the level to which the tanks need to be filled (in mm) and the necessary volume of water (in m3) are sketched in Figure 32, Figure 33 and Figure 34.

SERIES 227887 DUAREM Project
34
Figure 32. Water tanks on the specimen at the 1st story
Figure 33. Water tanks on the specimen at the 2nd story

SERIES 227887 DUAREM Project
35
Figure 34. Concrete blocks on the specimen at the 3rd story
6.2 HORIZONTAL LOADING
6.2.1 Snap-back
The test consisted in pulling the structure with an increasing force until the connection snapped, thus releasing the structure in a very short time. A piston was used to pull the structure through a tensioned bar; the displacement induced to the structure was locked in with a nut in the bar. Afterwards the piston continued to generate an internal force until the tensioned notched bar broke suddenly. The transmitted force to the structure until the moment of release was measured by a load cell. When the bolt snapped the structure was released and left to vibrate freely.
The loading function of the test was similar to the one presented in the numeric models for assessing removal of the last seismic link at the first floor (Figure 28), but scaled to a value where the force would not damage the structure’s elements (Figure 35). To this purpose the appropriate range of the force was considered to be 150 kN.

SERIES 227887 DUAREM Project
36
Figure 35. Time-history displacements and loading function
SERIES 227887 DUAREM Project
37
6.2.2 EQ time history accelerogram
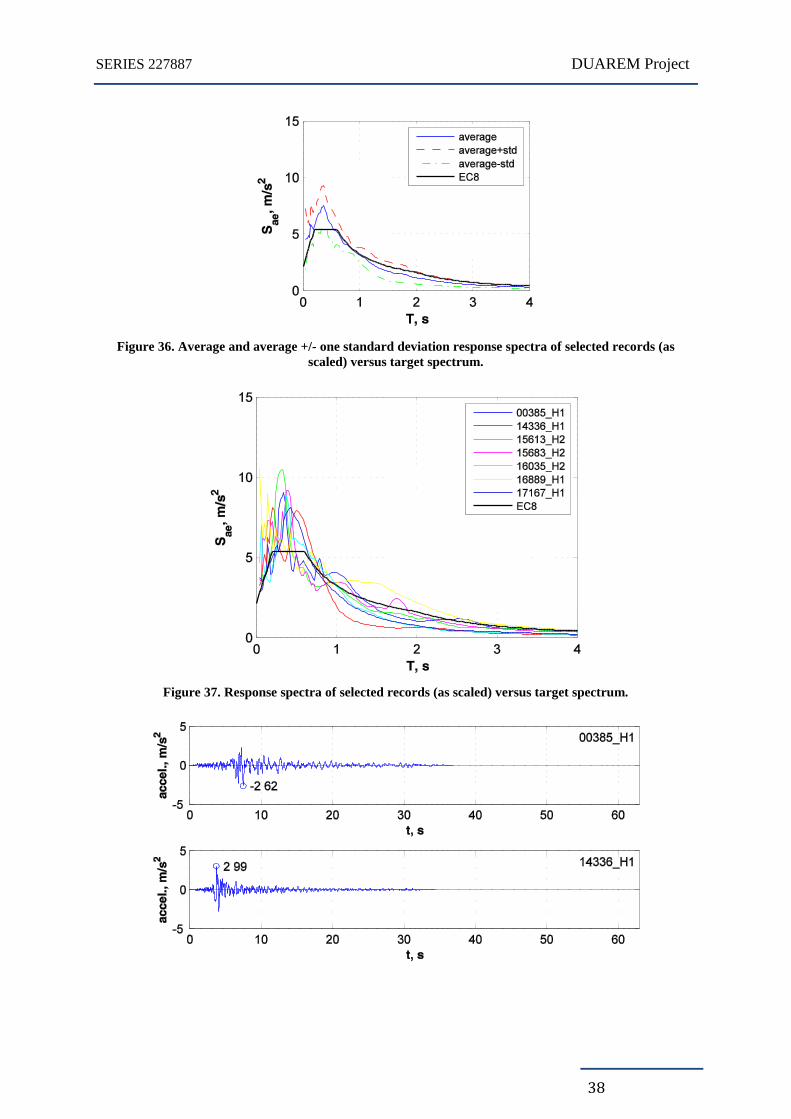
Seven recorded accelerograms were used for assessing the seismic performance of the DUAREM structure using nonlinear time-history analysis. The recorded accelerograms were selected from the RESORCE database (http://www.resorce-portal.eu/, Akkar et al.[1]). Records were selected by the following criteria: magnitude Mw ≥ 5.8, free-field or structure-related free-field instrument location, peak ground acceleration PGA ≥ 1.0 m/s2. Accelerograms having the closest matching with the target spectrum (EN 1998-1 type 1 elastic spectrum for soil type C) in terms of control period TC (0.6 s), effective peak ground acceleration (EPA), and effective peak ground velocity (EPV) were then selected. Characteristics of ground motion records are given in Table 4.
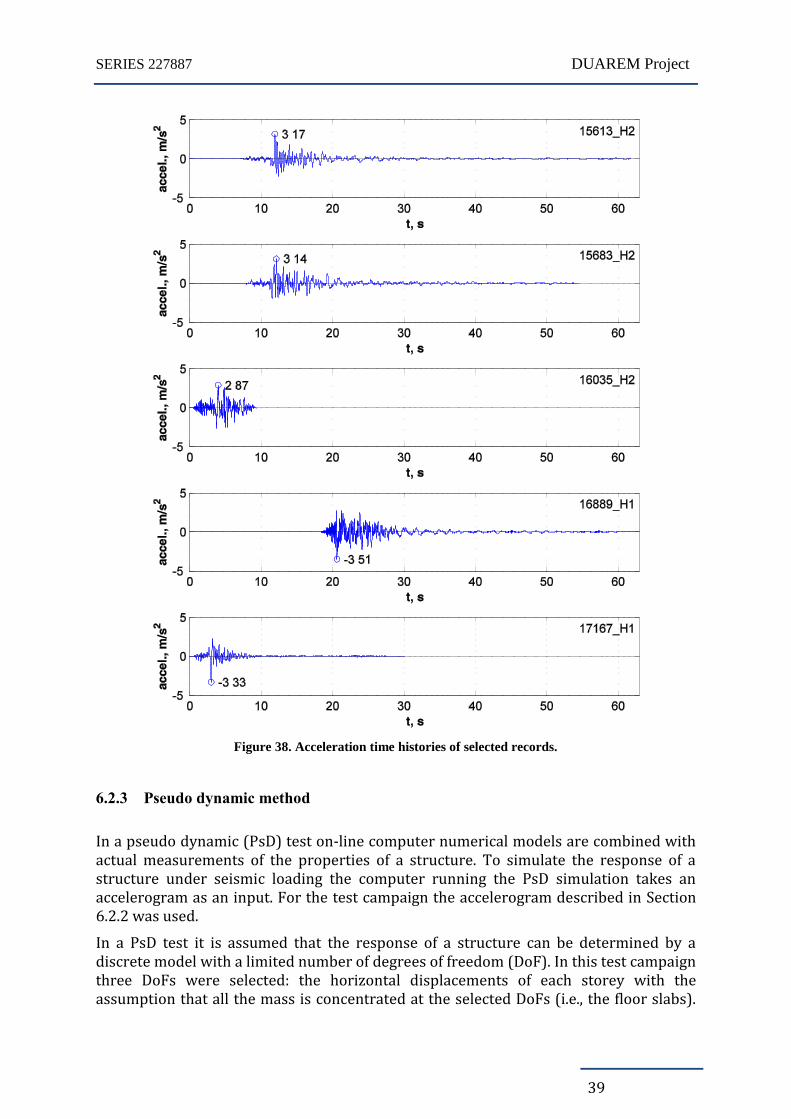
Individual accelerograms were first scaled to the target spectrum (EN 1998-1:2004 type 1, soil type C, ag = 0.19 g) in the 0.2T1 – 2T1 range using the equal area rule. The average spectrum was scaled to the target spectrum using EN 1998-1:2004 criteria. Response spectra of as scaled accelerograms are shown in Figure 36 and Figure 37, while acceleration time-histories can be observed in Figure 38.
Pre-test nonlinear dynamic simulations were performed on a 2D model of the experimental mock-up using the selected ground motion records. Based on the obtained results, the 15613_H2 record (13.09.1999, Izmit, Turkey) was selected for the PsD test campaign. The record provides the closest response to the mean response from all records in terms of top displacement, interstorey drifts and shear deformations in links. The original record was truncated to remove leading zeroes and the trailing low amplitude signal. It was also upsampled to 0.005 seconds time step and scaled to 9.81 m/s2 to simplify setting of the PGA in the PsD test.
Table 4. Characteristics of ground motion records selected for performance assessment.
Record code
Earthquake name Date Station name Station country
Magnitude Mw
00385_H1 Alkion 24.02.1981 Xylokastro-O.T.E. Greece 6.6
14336_H1 Montenegro (Aftershock)
24.05.1979 Bar-Skupstina Opstine Montenegro 6.2
15613_H2 Izmit (Aftershock) 13.09.1999 Yarimca (Eri) Turkey 5.8
15683_H2 Izmit (Aftershock) 13.09.1999 Usgs Golden Station
Kor Turkey 5.8
16035_H2 Faial 09.07.1998 Horta Portugal 6.1
16889_H1 L'Aquila Mainshock 06.04.2009 L'Aquila - V. Aterno -
Aquil Park In Italy 6.3
17167_H1 Aigion 15.06.1995 Aigio-OTE Greece 6.5
SERIES 227887 DUAREM Project
38
Figure 36. Average and average +/- one standard deviation response spectra of selected records (as
scaled) versus target spectrum.
Figure 37. Response spectra of selected records (as scaled) versus target spectrum.
SERIES 227887 DUAREM Project
39
Figure 38. Acceleration time histories of selected records.
6.2.3 Pseudo dynamic method
In a pseudo dynamic (PsD) test on-line computer numerical models are combined with actual measurements of the properties of a structure. To simulate the response of a structure under seismic loading the computer running the PsD simulation takes an accelerogram as an input. For the test campaign the accelerogram described in Section 6.2.2 was used.
In a PsD test it is assumed that the response of a structure can be determined by a discrete model with a limited number of degrees of freedom (DoF). In this test campaign three DoFs were selected: the horizontal displacements of each storey with the assumption that all the mass is concentrated at the selected DoFs (i.e., the floor slabs).

SERIES 227887 DUAREM Project
40
The equations of motion for such an idealized system are second order differential equations which can be expressed in matrix form:
( ) ( ) ( ) ( )M a t C v t r t f t
Where M is the mass matrix, C is the viscous damping matrix (typically assumed null in PsD tests), r(t) is the internal (restoring) force vector and f(t) is the external force vector applied on the structure. Horizontal displacements of the controlled DoFs were solved for a prototype time step of 0.005/1000=5×10-6 s using the explicit Newmark time integration method. Because the constructive solution was different between the two frames but the loading should not introduce torsion, it was decided that the equation of motion was solved for the south frame and the resulting displacements were applied to both the north and south frame. Displacements were then computed and applied by horizontal actuators at each storey at a laboratory time step of 0.002 s corresponding to the sampling rate of the controllers. The forces measured by the load cells in the actuators, following the application of the controlled displacements, represent the restoring forces that are fed back to the computer and that are used in the next time step of the calculation. Restoring forces are thus obtained from the specimen’s response and reflect its state of damage.
Since the inertial and viscous damping forces are modelled in the computer, the test does not have to run in the real time scale. The hysteretic damping is automatically accounted for through inelastic deformation and damage progression of the test structure; consequently no viscous damping matrix was used. During the PsD test campaign the equation of motion was solved for restoring forces coming from the south frame only (calculated from static equilibrium of the load cell force measurements at each floor). Equal displacements were applied to the two frames, in order to avoid rotation of the structure around the vertical axis. The PsD test method used for the test campaign was continuous, which reduces problems of material relaxation and avoids load over-shoot as described by Pegon et al.[10].
Restoring forces in the PsD model were 1.09 times those of the South actuators, minus 0.09 times those of the North actuators (the distance between actuators was 7.080 m, while the frames were distanced at 6.000 m).
The mass used in the equations of motion of the PsD was half of the total mass of the prototype structure, corresponding to one frame, equal to 165 tons for the first two floors and 168 tons for the last floor, assuming the internal frames provide a negligible stiffness (they have no bracing) in the direction of the lateral, seismic forces.
6.2.4 Push-over
The purpose of this test was to determine the failing mechanism of the structure, if the last accelerogram would not be enough to push it to its limit or after a test which did not result in the expected residual displacements. Since the longitudinal frames had different features, therefore different stiffnesses, the test was done in displacement control to avoid torsional effects on the structure.
The displacement was recorded on the side opposite to the loading point at each storey, the same as for the PsD method. The controllers allow several options for load

SERIES 227887 DUAREM Project
41
distribution: inverted triangular distribution and rectangular distribution. The target displacements were introduced manually during the test.


SERIES 227887 DUAREM Project
43
7 Instrumentation
The two frames of the specimen were instrumented on Grid 1, being the frame with the slab over the links (northern side according to the laboratory position), and Grid 2, being the frame where the slab is disconnected from the links (southern side). The instrumentation consists of the following:
6 Heidenhains – to measure the global longitudinal displacement (3 in frame 1 and 3 in frame 2, one per storey);
63 displacement transducers (Figure 39 and Figure 40):
o 12 at the links (±50 mm) – 2 for each of the 6 links of the specimen (Figure 41);
o 24 at the EBF braces (±12.5 mm) – 2 for each of the 12 braces of the specimen (Figure 42);
o 2 at the EBF beams at the 1st story in frame 2 (±12.5 mm) ( Figure 43);
o 3 to measure the global transversal displacement (±25 mm);
o 22 inclinometers ( Figure 44);
28 strain gages (Figure 45 and Figure 46):
o 24 (12 channels) at the EBF braces (Figure 47);
o 4 (2 channels) at the damper braces (Figure 48);
8 strain gages (added after the SLS test)
o 4 on one of the MRF beams at the first floor on both sides (Figure 49, Figure 50)
Whitewashed areas (both web and flanges) with length equal to the height of the corresponding steel section.

SERIES 227887 DUAREM Project
44
det. I
det. I
det. I
det. IIdet. III
det. IV
det. V
det. VI
det. VI
det. VI
det. VI
det. VI
det. VI
det. VI
det. VI
det. VI
det. VI
det. VI
det. VI
Figure 39. General view with the position of the displacement transducers (Heidenhains, inclinometers
and Temposonics) on the northern side

SERIES 227887 DUAREM Project
45
det. I'
det. I'
det. I'
det. II'det. III'
det. IV'
det. V'
det. VI'
det. VI'
det. VI'
det. VI'
det. VI'
det. VI'
det. VI'
det. VI'
det. VI'
det. VI'
det. VI'
det. VI'
det. VII'
det. VII'
Figure 40. General view with the position of the displacement transducers (Heidenhains, inclinometers
and Temposonics) on the southern side

SERIES 227887 DUAREM Project
46
Figure 41. Link displacement transducers
Figure 42. EBF braces displacement transducers
Figure 43. EBF beams at 1st story in frame 2 displacement transducers

SERIES 227887 DUAREM Project
47
Figure 44. Inclinometers arrangement

SERIES 227887 DUAREM Project
48
2
2
1
1
5 5
5 5 de
t. I
Figure 45. Strain gauges positions-Grid 1
SERIES 227887 DUAREM Project
49
4
4
3
3
6 6
6 6
Figure 46. Strain gauges positions-Grid 2

SERIES 227887 DUAREM Project
50
Figure 47. Strain gages position on braces
Figure 48. Strain gages position on dampers
Figure 49. Strain gages position on beams det. I
Figure 50. Detail of strain gages position on beams

SERIES 227887 DUAREM Project
51
8 Experimental set-up
The experimental set-up differed from one experiment to another. For the snap-back test the actuators where not connected to the structure, therefore the test was conducted prior to the connections of the actuator.
The second experiment conducted was the snap-back, for which a small piston was connected to the structure on the northern side to simulate the snap due to a sudden release of forces. This was done prior to the instalment of the actuators which were used for the pseudo-dynamic tests. The details of the set-up are presented in 8.1 and 8.2.
8.1 SNAP-BACK
For the snap-back test a piston was used to induce a displacement in the structure at the first floor on the northern side. The piston was connected to the structure with four bolts placed on the column closest to the reaction wall.
The snap back tests were carried out by imposing and releasing (at a very short time interval) a force at the first floor of the north frame to simulate the last seismic link replacement, where according to numerical simulation is when the highest forces are locked into the seismic links (Figure 52). This was achieved by pulling the structure towards the reaction wall with a piston linked to an M27 (with an 18.6 mm notch) bolt that gave the sudden release of force when breaking after reaching its maximum strength (Figure 53, Figure 51).
Figure 51. Piston assembly

SERIES 227887 DUAREM Project
52
Figure 52. Global view of the snap back test set-up
Figure 53. Load application for the snap back test
8.2 PSD AND PUSH-OVER TESTS
For the pseudo-dynamic tests four actuators were connected on each frame (northern and southern), two on the first floor, one on the second and one on the third floor. Each of the four actuators connected at the first floor had a capacity of 500 kN, while the remaining actuators on the second and third floors had a capacity of 1000 kN each. The

SERIES 227887 DUAREM Project
53
actuators were connected to the wall using an end plate and a loading beam on the structure as seen in Figure 54. To facilitate the concomitant action of the first floor actuators, a connection was designed to transfer the forces from the actuators to the loading beam.
Figure 54 PsD Set-up
The actuators were commanded by 2 master controllers, one for the first floor actuators and one for the second and third floor. Two reference frames were installed on the side opposite from the wall (eastern side) on which Hedenhain and Temposonic transducers were positioned to measure the longitudinal and transverse displacement, respectively (Figure 55).

SERIES 227887 DUAREM Project
54
Figure 55. Reference Frames in Yellow
The masses shown in Figure 32, Figure 33 and Figure 34 were placed for the PsD tests.
The same set-up was kept for both PsD and Push-Over tests, the only difference being in the input of the displacement. For the PsD test an accelerogram input was used while for the Push-Over, a target displacement was used as input.
8.3 DAMPERS
A set of two dampers constructed by Alga SpA were designed with the purpose of preventing the structure to snap due to a sudden release of force during removal of the link. The snap-back tests were designed to assess, on the one hand, the amplitude of the free vibrations, and, on the other hand, the effectiveness of dampers in limiting such vibrations; for this, two configurations were considered: with and without the dampers.

SERIES 227887 DUAREM Project
55
9 Test campaign
9.1 TESTING PROGRAM
The testing sequence comprised several experiments, some of which were meant for calibration of the instrumentation and for assessing the correct application of the methods used. The experiments presented in Table 5 are those used for assessing structural response. The results from these experiments may be found in the ELSA database. The value 0 of the instruments was set at the beginning of the representative tests: SLS, ULS and NC, to track the displacement of the structure during the links replacement.
Table 5. Duarem experiments
Description Date Structure
Snap Back 1 26/02/2014 Configuration 1 without links
Snap Back 2 27/02/2014 Configuration 1 without links,
with dampers
PsD 1: full operational level, 0.02 g 29/04/2014 Configuration 1 with Links LA
PsD 2: SLS, 0.191 g 29/04/2014 Configuration 1 with Links LA
Removal of links LA 30/04/2014 Configuration 1 with Links LA
PsD 3: full operational level, 0.02 g 22/05/2014 Configuration 2 with Links LB
PsD 4: ULS, 0.324 g 26/05/2014 Configuration 2 with Links LB
Push Over, 55mm 27/05/2014 Configuration 2 with Links LB
Removal of all links LB and stabilising 12-18/06/2014 Configuration 2 with Links LB
Removal of all links LB and repositioning of column
12-30/06/2014 Configuration 2 with Links LB
PsD 5: full operational level, 0.02 g 21/07/2014 Configuration 3 with Links LC
PsD 6: near collapse, 0.557 g 24-25/07/2014 Configuration 3 with Links LC
Push Over, 150mm (uniform forces South frame) 25/07/2014 Configuration 3 with Links LC
Final Push Over, 400mm 29/07/2014 Configuration 3 with Links LC

SERIES 227887 DUAREM Project
56
9.2 SNAP-BACK
The time histories of displacements in the longitudinal direction at the third, second and first floors for the north and south frames are shown in Figure 56 (top) and Figure 57 (lower) without and with the ALGA dampers, respectively. The results show a maximum displacement of 2 mm and confirm that the dampers were not activated due to the small size of displacements imposed on the frame. In Figure 56 (top) is shown the time history of the force imposed, equal to a maximum of 150 kN. The transverse displacements were also small, with a maximum value of 1 mm (Figure 57, bottom).
The frequencies measured during the snap back tests were obtained by means of two methodologies. The first one, based on time-domain identification of a Filter Model (Molina et al.[11], [12]) involved the use of readings from displacement transducers placed in the longitudinal direction, resulting in frequencies equal to 2.6, 5.1 and 7.3 Hz for the first longitudinal, first transverse and second longitudinal modes, respectively, with a damping ratio of approximately 5% (Figure 58). The second method, based on automatic modal parameter selection, used readings from accelerometers and displacement transducers placed in the longitudinal and transverse direction (Figure 59and Figure 60) with a higher sampling rate than that used in the first method. The modal frequencies and damping obtained for the first 16 modes are given in Figure 61, highlighting the main global modes. The mode shapes and frequencies for the first three longitudinal, two torsional and two transverse modes are given in Figure 62, Figure 63 and Figure 64, respectively.
Figure 56. Snap back test with no ALGA dampers: Time history of longitudinal displacements (at all
levels and N and S frame) and applied force at Level 1 N

SERIES 227887 DUAREM Project
57
Figure 57. Snap back test: Time history of transversal displacements (at all levels, no ALGA dampers)
and longitudinal displacements (at all levels N and S frame, ALGA dampers)
Figure 58. Mode shapes for snap back with ALGA dampers from LVDT readings
It is possible to see that the two methods are in agreement with the frequencies of the first and second modes in the longitudinal direction and for the first torsional mode. The identification based on the displacement measurements was not able to see the other modes because their associated displacements were too small to be distinguished

SERIES 227887 DUAREM Project
58
from the signal noise of the instruments. In fact, accelerometer measurements suffer less problems of noise for dynamic tests and specially at the higher frequencies.
The displacements of the frame during the snap back were also measured with a high speed camera using the target points shown in Figure 52. After the snap back the seismic links were remounted on the frame and ready for the first PsD test.
Figure 59. Location of transducers for the snap back test
Figure 60. Accelerations measured during the snap back test

SERIES 227887 DUAREM Project
59
Frequencies (Hz)
Longitudinal Torsional Transverse
2.65
3.12
5.16
7.42 11.7
12.2
14.0
Figure 61. Snap back test with dampers: Frequencies and damping for the first 16 modes and
identification of the main global modes
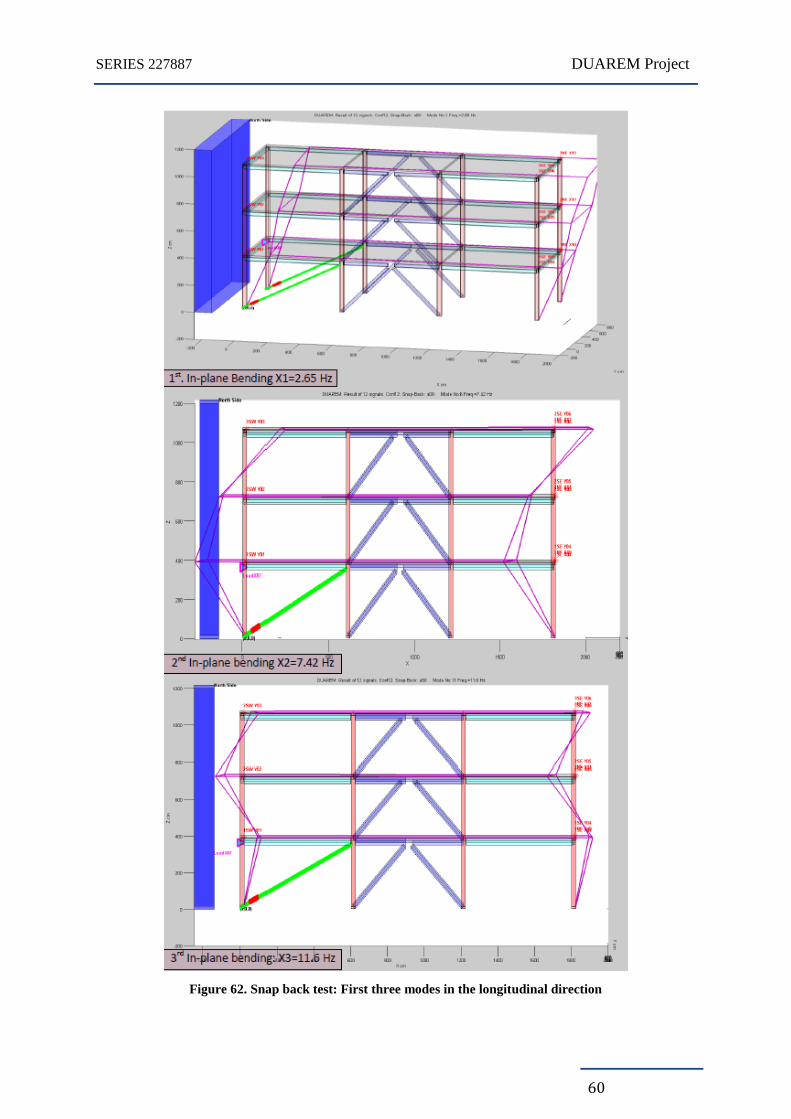
SERIES 227887 DUAREM Project
60
Figure 62. Snap back test: First three modes in the longitudinal direction
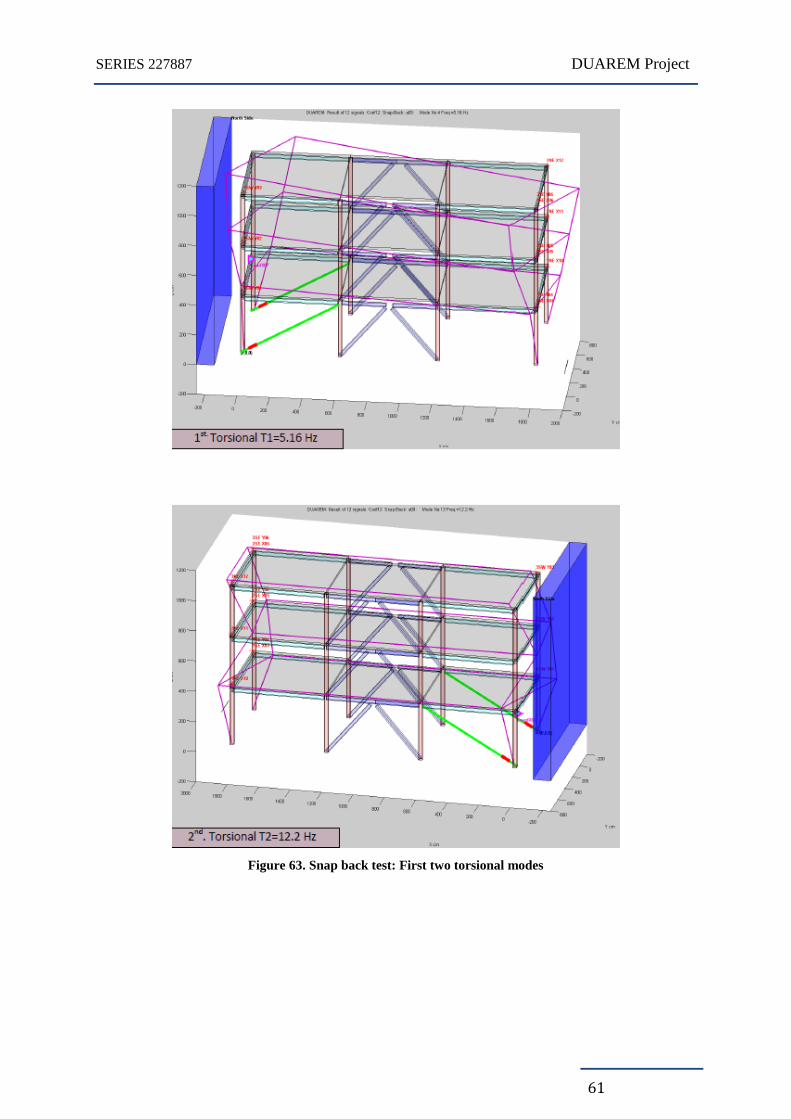
SERIES 227887 DUAREM Project
61
Figure 63. Snap back test: First two torsional modes
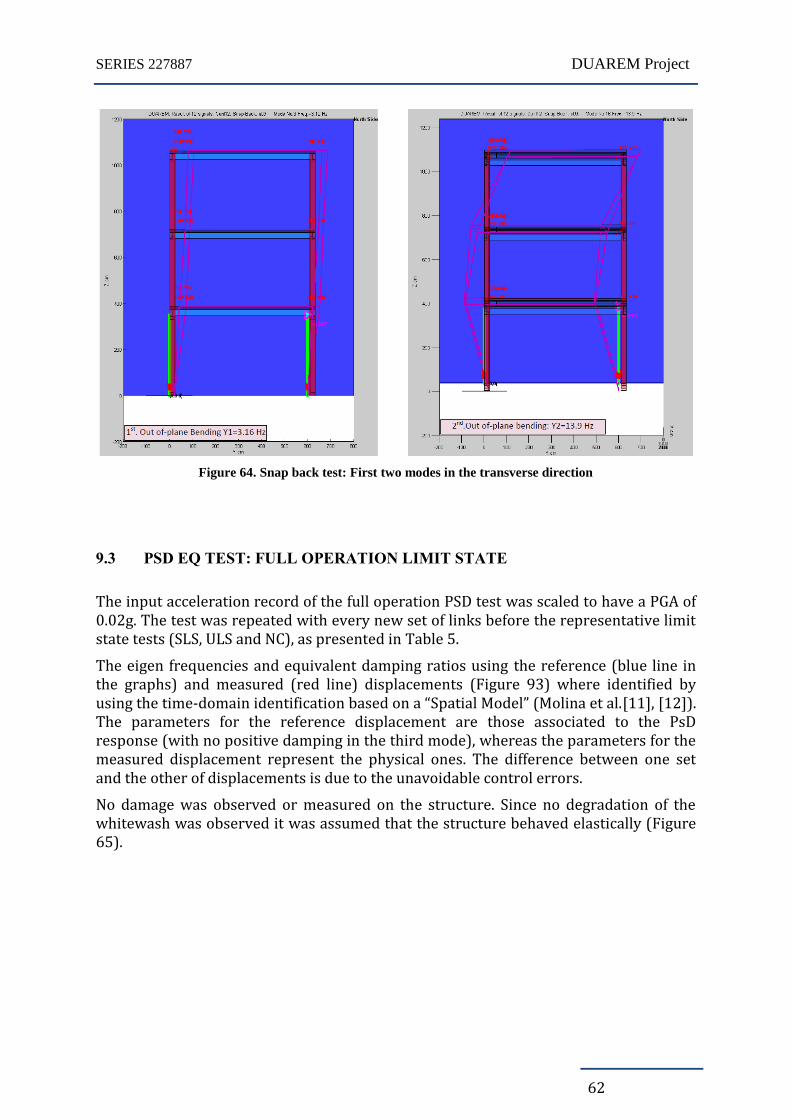
SERIES 227887 DUAREM Project
62
Figure 64. Snap back test: First two modes in the transverse direction
9.3 PSD EQ TEST: FULL OPERATION LIMIT STATE
The input acceleration record of the full operation PSD test was scaled to have a PGA of 0.02g. The test was repeated with every new set of links before the representative limit state tests (SLS, ULS and NC), as presented in Table 5.
The eigen frequencies and equivalent damping ratios using the reference (blue line in the graphs) and measured (red line) displacements (Figure 93) where identified by using the time-domain identification based on a “Spatial Model” (Molina et al.[11], [12]). The parameters for the reference displacement are those associated to the PsD response (with no positive damping in the third mode), whereas the parameters for the measured displacement represent the physical ones. The difference between one set and the other of displacements is due to the unavoidable control errors.
No damage was observed or measured on the structure. Since no degradation of the whitewash was observed it was assumed that the structure behaved elastically (Figure 65).

SERIES 227887 DUAREM Project
63
Figure 65. South View
The maximum displacement recorded at the top of the structure was 5.71 mm towards the reaction wall and 5.68 in the opposite direction (Figure 86). Taking into account that both frames were in displacement control they both had the same displacement with a different force input. The maximum base shear forces were -783.4 kN and 765.3 kN, and -670.8 and 693 kN, for the north and south frames, respectively. These results show the difference in stiffness between the two frame configurations due to the presence of the slab above the links.
9.4 PSD EQ TEST: SERVICEABILITY LIMIT STATE
For the Serviceability Limit State (SLS) pseudo-dynamic test, the acceleration was scaled to a PGA of 0.191g, followed by tailing zeros. This was considered to be an earthquake with a return period of 95 years and a probability of exceedance of 10% in 10 years. The purpose of this test was to induce a minimum plastic deformation in the links and to have a residual displacement in the structure, in order to verify the capacity to remove the links through unbolting and the ability of the structure to recover its initial geometry.
The maximum displacement recorded at the top of the structure was 11.61 mm towards the reaction wall and 31.65 mm in the opposite direction. Taking into account that both frames were in displacement control they both had the same displacement with a different force input.
The structure responded as predicted by the numerical model, with a residual displacement of 5.8 mm at the top floor. This displacement resulted in a chord rotation

SERIES 227887 DUAREM Project
64
of the link of 13 mrad at the 3rd floor. The chord rotation of the link was determined from equation ( 1 ) based displacements DD1 and DD2 of the two transducers placed diagonally on the link (Figure 41).
2 2 ( 2 1)
2
a b DD DD
a b
( 1 )
where a= 218 mm and b=425 mm.
After the PSD test was completed the restoring forces in the actuators were released and the corresponding displacement were recorded in the results database.
The test was performed 400 times slower than real time, for a total testing time of 3 hours and 20 minutes.
Plastic behaviour of the link was observed after the 5th second of the input accelerogram, in correspondence with a sudden increase of the ground acceleration, leading to a peak drift of 11.69 mm at the 3rd floor (Figure 103).
9.5 FIRST LINK REPLACEMENT
The procedure applied was the one described in Section 5.3, no flame cutting was necessary for the first replacement. The links where easily removed from the structure by unscrewing the bolts and using a hydraulic jack. The dampers where not installed because a smooth transition of forces from the link to the frame was expected.
During replacement of the links the Heidenhains were recording the displacement of the structure. After the links where removed the structure reverted on the north side to its initial position (undeformed shape), while on the south side residual displacements of 5 mm, 2.9 mm and 1.1 mm were recorded at the third, second and first storeys. The record of forces and displacements can be found in Figure 66.

SERIES 227887 DUAREM Project
65
Figure 66. First link replacement Heidenhain displacement history
The removal of the links required half a working day of two technicians (approximately 4hx2men). The removal of links started at the north frame of the first floor, followed by the south frame at the same floor. The sequence (north–south) was kept for the second floor. Since the residual displacement of the structure had substantially diminished by removing the links at the first two floors, it was decided for the third floor to remove the south link was first for better operability (the lifting equipment was positioned already for serving the south side).
After unscrewing the bolts, the hydraulic jack had to be used for pushing apart the braces, in order to pull out the links. The pressure introduced in the hydraulic jack and the forces supplied are shown in Table 6.
DUAREM ELSA [Conf18LA] (80: Controller Measured)c01: Removal of links LA 30/04/2014
Master A Con 1 Level 1 S b
Master A Con 3 Level 1 N b
Master D Con 1 Level 2 S
Master D Con 2 Level 2 N
Master D Con 3 Level 3 S
Master D Con 4 Level 3 N
0 5 10 15 20 25-7
-6
-5
-4
-3
-2
-1
0
1
Time (s)
Heid
enhain
Dis
pla
cem
ent
(mm
)

SERIES 227887 DUAREM Project
66
Table 6-Pressure and Forces Applied at Link Removal
Position bar kN Observation
Set A Links - 1st replacement
N L1 400 285.71 movement*
500 357.14 removed
S L1 500 357.14 movement
600 428.57 removed
N L2 550 392.86 movement
600 428.57 removed
S L2 500 357.14 movement
600 428.57 removed
S L3 600 428.57 removed
N L3 600 428.57 removed
*Movement – the link could be moved but not removed due to geometric irregularities
After removal of the links it was confirmed that no bending occurred in the endplates, therefore there was no relative rotation between the beam and the link during the PsD test (Figure 67).
Figure 67. Serviceability Limit State PSD test, Southern frame links

SERIES 227887 DUAREM Project
67
The subsequent insertion of the links did not raise additional problems. They were easily placed in position after prior machining. Links with a length of 398 mm and 396 mm were installed in the north and south side, respectively, to ensure easy placing and a good connection with the beams. For reintroducing the links, the use of the hydraulic jack was not required. Placement of the links in the southern frame was facilitated due to the absence of the slab over the link, which allowed using an overhead crane for their installation. In the north frame, where the presence of the slab did not allow the use of the crane, the links were inserted from the side (Figure 68 and Figure 69).
Figure 68. Vertical Positioning
Figure 69. Horizontal Positioning

SERIES 227887 DUAREM Project
68
9.6 PSD EQ TEST: ULS
The purpose of this test was study the response of the structure at the ULS, inducing larger residual displacements that would further test possible difficulties in the replacement of the links. For this test the accelerogram was set at full scale, with a PGA of 0.324g, corresponding to an earthquake with a return period of 475 years corresponding to a probability of exceedance of 10% in 50 years.
The maximum displacement recorded at the top of the structure was 14.5 mm towards the reaction wall and 50.3 mm in the opposite direction. Taking into account that both frames were in displacement control they both had the same displacement with a different force input. As for the SLS PsD Test, the links started to deform plastically after the 5th second of the accelerogram. The rest of the structure remained elastic.
At the end of the test the residual displacements were equal to -13.2, -8.6 and -3.5 millimetres at the third, second and first floors, with the largest residual interstorey drift being recorded between the first and second floor (Figure 108). These results are confirmed by the larger rotation and deformation of the links at the second storey (Figure 112).
Since the residual interstorey drifts were not sufficiently large to test possible difficulties during link replacement, a push-over test was conducted to reach larger residual displacements.
9.7 PUSH-OVER TEST
The test was carried out with the purpose of reaching residual displacements large enough so that the difficulties associated with unscrewing the bolts would make flame cutting as the best option for removing the links. The test was conducted under displacement control on the third floor with an inverted triangular distribution of forces at the south frame and equal displacements at both frames.
Displacements were imposed incrementally with a step of 10 mm/min and a target displacement of 55 mm at the third floor. The test was stopped before reaching the target displacement, after slipping of the base of the central columns at a base shear in the north frame equal to 1088 kN. The slippage of columns took place between the base plate and the strong floor, as the horizontal forces exceeded the static friction force between these two elements. The resulting residual displacements at the third floor were equal to 33.8 and 32.4 millimetres at the north and south side, respectively. These results show a small torsion along the horizontal plane introduced in the structure due to repositioning of the column.
9.8 SECOND LINK REPLACEMENT
The second link replacement was carried out after the push-over test by means of flame cutting with a torch. The first link removed was at the third floor of the south frame. The technician started by cutting a hole in the web of the link to check for possible sudden force releases. Since the release of forces was gradual, he continued cutting towards the

SERIES 227887 DUAREM Project
69
web and flanges in vertical direction. The order of removal was from the third to the first floor on each side (Figure 70, Figure 71).
Figure 70. Cutting process of the links
Figure 71. 3rd floor link after flame cutting
During removal of the links and the following 48 hours, the Heidenhains remained connected and the acquisition system continued to record the displacement of each floor (Figure 72). As there was no oil pressure, the actuator followed the displacements of the structure with negligible reaction force.

SERIES 227887 DUAREM Project
70
Figure 72. Second link replacement Heidenhain displacement history
Although the hydraulic jack was not necessary to remove the links, they were needed for placing the new set of links back into the structure. The values of forces used for fixing the links are given in the table below (Table 7).
DUAREM ELSA [Conf21LB] (80: Controller Measured) e12: Removal of all links LB and repositioning of column 12-30/06/2014
Master A Con 1 Lev el 1 S b
Master A Con 3 Lev el 1 N b
Master D Con 1 Lev el 2 S / Master A
Master D Con 2 Lev el 2 N / Master A
Master D Con 3 Lev el 3 S / Master A
Master D Con 4 Lev el 3 N / Master A
0 2 4 6 8 10 12 14
x 104
-50
-45
-40
-35
-30
-25
-20
-15
-10
-5
0
Computer Time (s)
Heid
enhain
Dis
pla
cem
ent
(mm
)
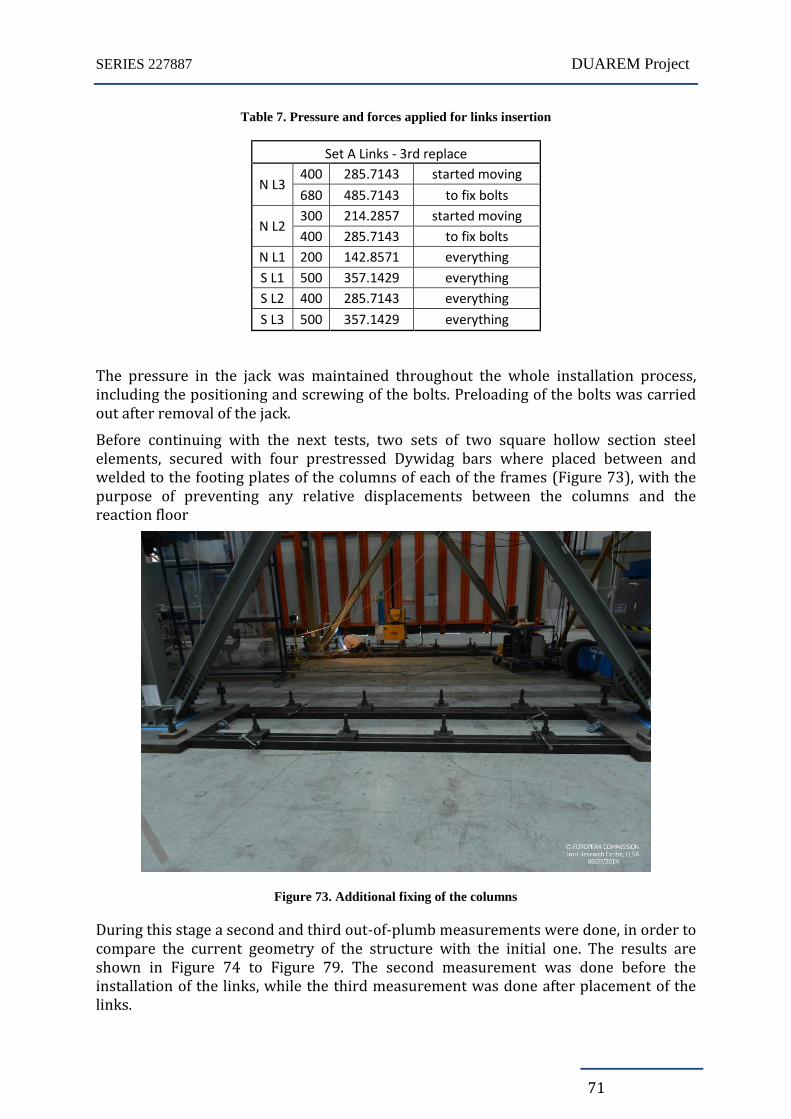
SERIES 227887 DUAREM Project
71
Table 7. Pressure and forces applied for links insertion
Set A Links - 3rd replace
N L3 400 285.7143 started moving
680 485.7143 to fix bolts
N L2 300 214.2857 started moving
400 285.7143 to fix bolts
N L1 200 142.8571 everything
S L1 500 357.1429 everything
S L2 400 285.7143 everything
S L3 500 357.1429 everything
The pressure in the jack was maintained throughout the whole installation process, including the positioning and screwing of the bolts. Preloading of the bolts was carried out after removal of the jack.
Before continuing with the next tests, two sets of two square hollow section steel elements, secured with four prestressed Dywidag bars where placed between and welded to the footing plates of the columns of each of the frames (Figure 73), with the purpose of preventing any relative displacements between the columns and the reaction floor
Figure 73. Additional fixing of the columns
During this stage a second and third out-of-plumb measurements were done, in order to compare the current geometry of the structure with the initial one. The results are shown in Figure 74 to Figure 79. The second measurement was done before the installation of the links, while the third measurement was done after placement of the links.
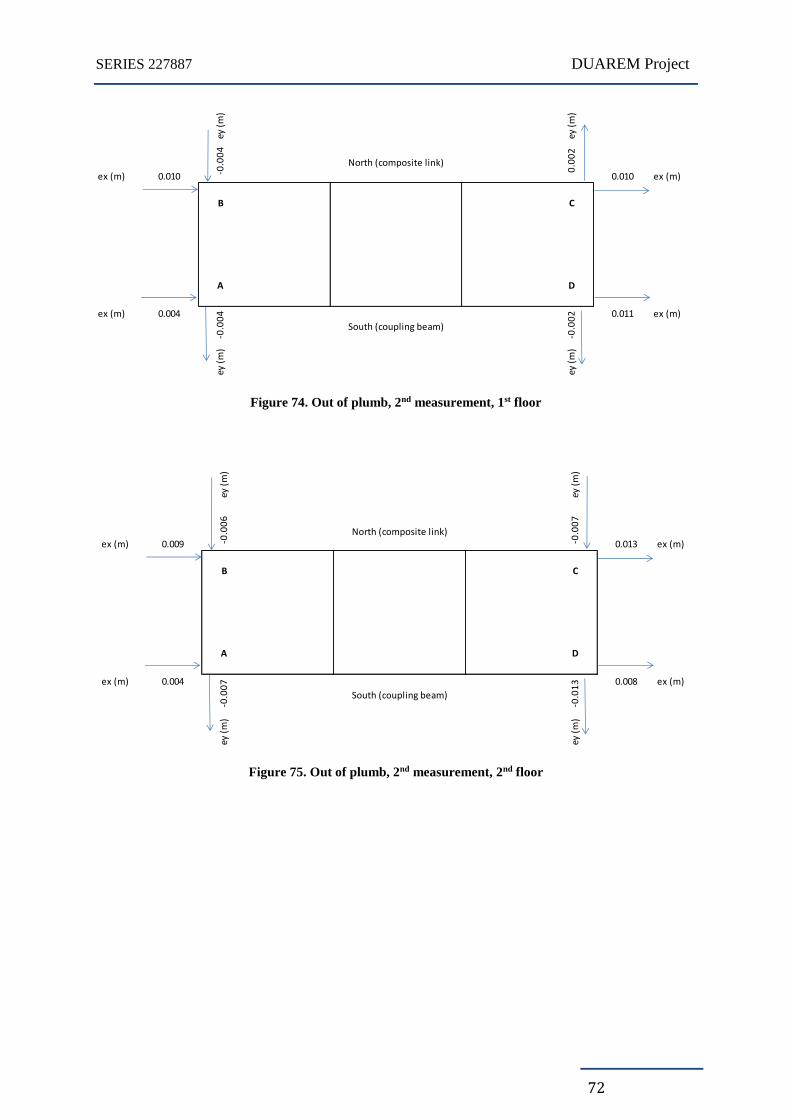
SERIES 227887 DUAREM Project
72
Figure 74. Out of plumb, 2nd measurement, 1st floor
Figure 75. Out of plumb, 2nd measurement, 2nd floor
ey (
m)
ey (
m)
ex (m) 0.010 -0.0
04
North (composite link)
0.0
02
0.010 ex (m)
ex (m) 0.004
-0.0
04
South (coupling beam)
-0.0
02 0.011 ex (m)
ey (
m)
ey (
m)
CB
DA
ey (
m)
ey (
m)
ex (m) 0.009 -0.0
06
North (composite link)
-0.0
07
0.013 ex (m)
ex (m) 0.004
-0.0
07
South (coupling beam)
-0.0
13 0.008 ex (m)
ey (
m)
ey (
m)
CB
DA

SERIES 227887 DUAREM Project
73
Figure 76. Out of plumb, 2nd measurement, 3rd floor
Figure 77. Out of plumb, 3rd measurement, 1st floor
ey (
m)
ey (
m)
ex (m) 0.012 -0.0
09
North (composite link)
-0.0
16
0.017 ex (m)
ex (m) 0.006
0.0
09
South (coupling beam)
-0.0
16 0.006 ex (m)
ey (
m)
ey (
m)
CB
DA
ey (
m)
ey (
m)
ex (m) 0.002 -0.0
06
North (composite link)0
.00
60.008 ex (m)
ex (m) 0.002
-0.0
06
South (coupling beam)
-0.0
03 0.007 ex (m)
ey (
m)
ey (
m)
DA
CB

SERIES 227887 DUAREM Project
74
Figure 78. Out of plumb, 3rd measurement, 2nd floor
Figure 79. Out of plumb, 3rd measurement, 3rd floor
9.9 PSD EQ TEST: NEAR COLLAPSE LIMIT STATE
For this test the accelerogram was up scaled up to 0.557g to reproduce the effect of an earthquake with a return period of 2475 years, corresponding to a probability of exceedance of 2% in 50 years.
The test was automatically stopped before reaching the maximum value of acceleration of the accelerogram, after an alarm was triggered following a difference between the displacement recorded by the displacement transducers placed in the actuators (Temposonics) and those recorded by the Heidehains exceeding 10mm (a sign of high force close to saturation of the actuator). The force in the actuators was suddenly
ey (
m)
ey (
m)
ex (m) 0.012 0.0
06
North (composite link)
0.0
01
0.008 ex (m)
ex (m) 0
-0.0
03
South (coupling beam)
-0.0
07 0.008 ex (m)
ey (
m)
ey (
m)
DA
CBey
(m
)
ey (
m)
ex (m) -0.003 0.0
07
North (composite link)
-0.0
03
0.009 ex (m)
ex (m) -0.007
-0.0
04
South (coupling beam)
-0.0
08 0.003 ex (m)
ey (
m)
ey (
m)
DA
CB

SERIES 227887 DUAREM Project
75
released as the oil pumps stopped and the oil pressure dropped. In order to continue with the PsD test, the structure was brought to a state corresponding to the distribution of displacements measured before the oil pressure was released. This was done manually by gradually increasing the displacements. The alarm trigger was increased to a 20 mm difference between the Temposonic and the Heidehain displacement, while still considering this difference acceptable and not compromising the safety of the test. The PsD test was then resumed and the equation of motion was solved from the step taken from the previous run (before the stop).
After the restart, the test was stopped again a few steps later as the actuators of the first floor reached their maximum capacity when the structure entered the second mode of vibration (in the vertical plane along the longitudinal direction). This corresponded to a situation where the actuators from the first floor were acting in a direction opposite to that of the actuators of the second and third floors.
The maximum displacement recorded at the top of the structure was 118.1 mm, away from the reaction wall. Both frames were in displacement control under equal displacements; the forces applied by the actuators of each floor are shown in Figure 124. The seismic links reached high plastic deformations, exceeding the maximum limit of the transducers (± 25 mm) placed across the links of the first two floors.
Since the whole accelerogram was not completed, including passing through the PGA of the record, it was decided to continue with a push-over test with an inverted triangle distribution of forces. Equal displacements between the north and south frames were imposed at the third floor, the actuators of the first and second floors were under force control. Although equal displacements were imposed on the north and south frames of the third floor (Figure 129), the two lower floors rotated along the horizontal plane due to the different stiffness between the two frames. The test was stopped at 231.6 mm displacement at the top floor as seen in Figure 131.
9.10 CYCLIC PUSH-OVER TEST
An additional cyclic push-over test was carried out under displacement control considering a uniform distribution of forces (in order to avoid force saturation at the actuators). The displacements at each storey of the structure, and the corresponding forces, are shown in Figure 134. Maximum displacements at the third floor were recorded at 405 and 499.4 mm, corresponding to maximum base shears of 1019 kN and 723.3 kN on the north and south frames, respectively.
At the point of maximum displacements the links from the first two floors had already failed and fallen down. The first link to fall was the one from the first floor on the south frame, followed by the link on the opposite frame.
Visual inspection of the connection between the link and the EBF beam didn’t reveal any damage in the end plates of the beams or the links. Also, no relative displacement or rotation was observed. The failure of the links was inside the element close to the welding with the end plate (see Figure 80).

SERIES 227887 DUAREM Project
76
Figure 80. Detail of link failure
The failure of the links was followed by the formation of the plastic hinges in the moment resisting frames. The areas affected were the column bases (Figure 81) and the beams in correspondence with the haunch at the first floor (Figure 82).
Figure 81. EBF column base detail

SERIES 227887 DUAREM Project
77
Figure 82. MRF beam end detail
The welding between the footing plate and the braces on SW side and NE had cracked during the experiment, major damage can be seen in Figure 83.
Figure 83. Brace’s welding to the footing plate
The maximum interstorey drifts were198.7 mm, 170.1 mm and 37.24 mm with the corresponding shear forces of 699.5 kN, 691.2 kN and 358.9 kN for the 1st, 2nd, and 3rd storey respectively for the southern frame as seen in Figure 135. Whereas in the northern frame the forces were 1019 kN at the 1st floor, 691.2 kN at the 2nd floor and 358.9 kN at the 3rd floor.

SERIES 227887 DUAREM Project
78
The slab on the northern side suffered severe damage at the 1st and 2nd storey, leaving the area above the link completely uncovered as seen in Figure 84 andFigure 86, unlike for the 3rd storey where only a few cracks could be noticed. The southern side was left undamaged even at high deformations, since the steel elements did not pierce through the concrete.
Figure 84. Damaged slab, 1st floor
Figure 85. Damaged slab, 2nd floor
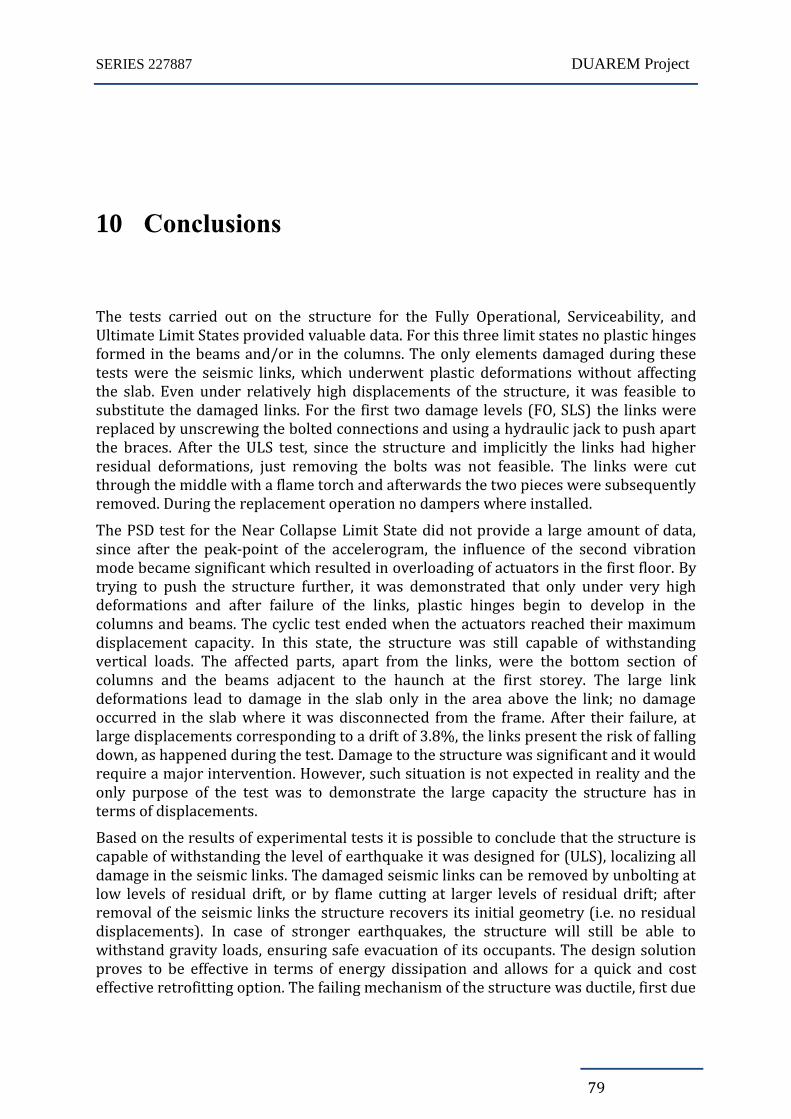
SERIES 227887 DUAREM Project
79
10 Conclusions
The tests carried out on the structure for the Fully Operational, Serviceability, and Ultimate Limit States provided valuable data. For this three limit states no plastic hinges formed in the beams and/or in the columns. The only elements damaged during these tests were the seismic links, which underwent plastic deformations without affecting the slab. Even under relatively high displacements of the structure, it was feasible to substitute the damaged links. For the first two damage levels (FO, SLS) the links were replaced by unscrewing the bolted connections and using a hydraulic jack to push apart the braces. After the ULS test, since the structure and implicitly the links had higher residual deformations, just removing the bolts was not feasible. The links were cut through the middle with a flame torch and afterwards the two pieces were subsequently removed. During the replacement operation no dampers where installed.
The PSD test for the Near Collapse Limit State did not provide a large amount of data, since after the peak-point of the accelerogram, the influence of the second vibration mode became significant which resulted in overloading of actuators in the first floor. By trying to push the structure further, it was demonstrated that only under very high deformations and after failure of the links, plastic hinges begin to develop in the columns and beams. The cyclic test ended when the actuators reached their maximum displacement capacity. In this state, the structure was still capable of withstanding vertical loads. The affected parts, apart from the links, were the bottom section of columns and the beams adjacent to the haunch at the first storey. The large link deformations lead to damage in the slab only in the area above the link; no damage occurred in the slab where it was disconnected from the frame. After their failure, at large displacements corresponding to a drift of 3.8%, the links present the risk of falling down, as happened during the test. Damage to the structure was significant and it would require a major intervention. However, such situation is not expected in reality and the only purpose of the test was to demonstrate the large capacity the structure has in terms of displacements.
Based on the results of experimental tests it is possible to conclude that the structure is capable of withstanding the level of earthquake it was designed for (ULS), localizing all damage in the seismic links. The damaged seismic links can be removed by unbolting at low levels of residual drift, or by flame cutting at larger levels of residual drift; after removal of the seismic links the structure recovers its initial geometry (i.e. no residual displacements). In case of stronger earthquakes, the structure will still be able to withstand gravity loads, ensuring safe evacuation of its occupants. The design solution proves to be effective in terms of energy dissipation and allows for a quick and cost effective retrofitting option. The failing mechanism of the structure was ductile, first due

SERIES 227887 DUAREM Project
80
to the progressive links failure and second because the plastic hinges formed in beams and only at the bottom of columns.
The structural solution of replaceable seismic links proves to be very competitive, as it is a cost effective and requires only a minor retrofitting intervention after an earthquake. Furthermore, existing design codes (EUROCODES) can be strictly followed and the horizontal orientation of the links requires very little additional space.
SERIES 227887 DUAREM Project
81
References
[1] Akkar, S., Sandıkkaya, M.A., Şenyurt, M., Azari, Sisi A., Ay, B.Ö., Traversa, P., Douglas, J., Cotton, F., Luzi, L., Hernandez, B., Godey, S. (2014). "Reference database for seismic ground-motion in Europe (RESORCE)", Bulletin of Earthquake Engineering, DOI: 10.1007/s10518-013-9506-8, Volume 12, Issue 1, pp 311-339.
[2] Dubina, D., Stratan, A., Dinu, F. (2008). "Dual high-strength steel eccentrically braced frames with removable links". Earthquake Engineering & Structural Dynamics, Vol. 37, No. 15, p. 1703-1720.
[3] EN 1991, Eurocode 1: Actions on structures - Part 1-1: general actions, densities, self-weight, imposed loads for buildings, 2002.
[4] EN 1998, Eurocode 8: Design of Structures for Earthquake Resistance Part 1: General Rules, Seismic Actions and Rules for Buildings, 2004.
[5] Ioan, A., Stratan, A., Dubina, D. (2013). Numerical Simulation of bolted links removal in eccentrically braced frames. Pollack Periodica - Vol. 8, No.1, 2013, p. 15-26.
[6] Stratan, A. and Dubina, D. (2004). "Bolted links for eccentrically braced steel frames". Proc. of the Fifth AISC / ECCS International Workshop "Connections in Steel Structures V. Behaviour, Strength & Design", June 3-5, 2004. Ed. F.S.K. Bijlaard, A.M. Gresnigt, G.J. van der Vegte. Delft University of Technology, The Netherlands, pp. 223-232
[7] Stratan, A., Ioan, A., Dubina, D. (2012). Re-centring capability of dual eccentrically braced frames with removable bolted links. STESSA 2012 (Behaviour of Steel Structures in Seismic Areas) Conference, 9-11 January 2012, Santiago, Chile, pp. 723-728.
[8] EN 1090-2: Execution of steel structure and aluminium structures – Part 2: Technical requirements for steel structures, 2008.
[9] ISO 2768-1: General tolerances – Part 1: Tolerances for linear and angular dimensions without individual tolerance indications, 2001.
[10] Pegon P., Molina F. J. and Magonette G.,“Continuous pseudo-dynamic testing at ELSA” in “Hybrid Simulation; Theory, Implementation and Applications”, Eds. Saouma VE, Sivaselvan MV, Taylor & Francis/Balkema Publishers, 2008, .79-88.

SERIES 227887 DUAREM Project
82
[11] Molina F. J., Magonette G., Pegon P.& Zapico B. (2011): Monitoring Damping in Pseudo-Dynamic Tests, Journal of Earthquake Engineering, 15:6, 877-900.
[12] Molina F. J. (2011), Spatial and Filter Models, MATLAB functions available on line at MATWORKS FILE EXCHANGE, The MathWorks, Inc., Natick, Massachusetts (USA), August 22,: http://www.mathworks.com/matlabcentral/fileexchange/32634

SERIES 227887 DUAREM Project
83
11 Annex 1. Global Test Results
11.1 PSD FULL OPERATION LIMIT STATE TEST
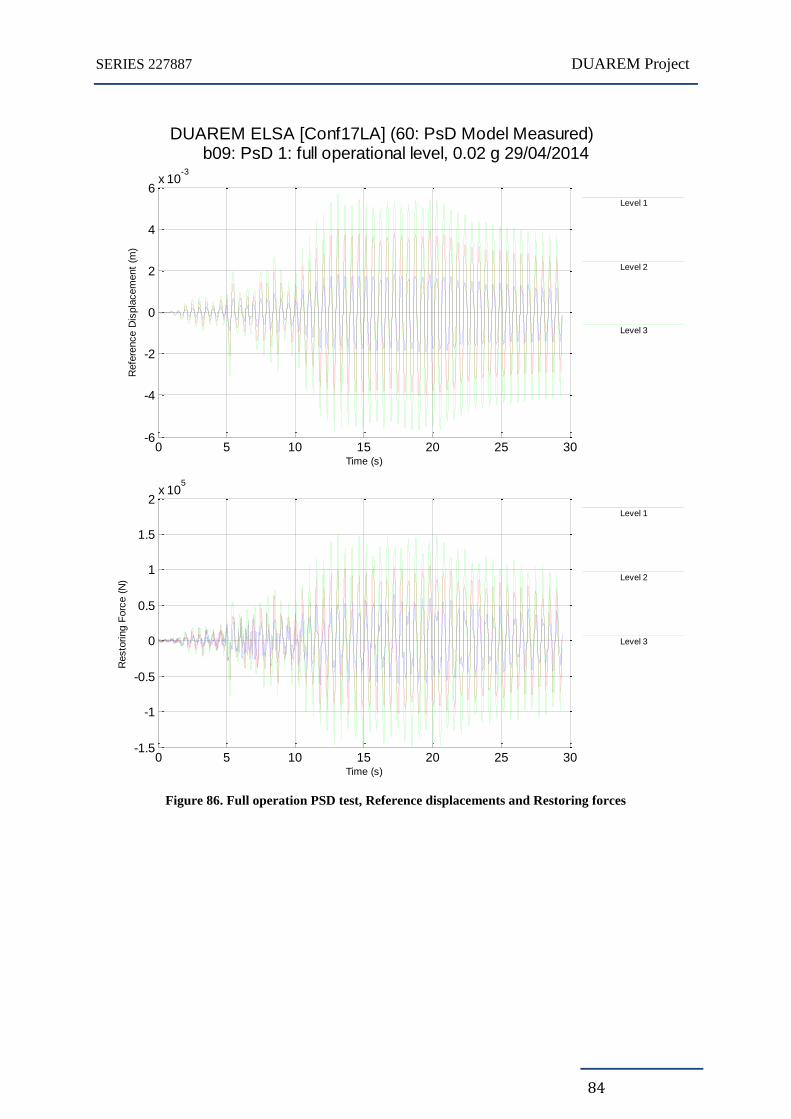
SERIES 227887 DUAREM Project
84
Figure 86. Full operation PSD test, Reference displacements and Restoring forces
DUAREM ELSA [Conf17LA] (60: PsD Model Measured) b09: PsD 1: full operational level, 0.02 g 29/04/2014
Level 1
Level 2
Level 3
0 5 10 15 20 25 30-6
-4
-2
0
2
4
6x 10
-3
Time (s)
Refe
rence D
ispla
cem
ent
(m)
Level 1
Level 2
Level 3
0 5 10 15 20 25 30-1.5
-1
-0.5
0
0.5
1
1.5
2x 10
5
Time (s)
Resto
ring F
orc
e (
N)

SERIES 227887 DUAREM Project
85
Figure 87. Full operation PSD test, Interstorey Drift and Shear forces
DUAREM ELSA [Conf17LA] (62: PsD Model Derived) b09: PsD 1: full operational level, 0.02 g 29/04/2014
Level 1
Level 2
Level 3
0 5 10 15 20 25 30-2.5
-2
-1.5
-1
-0.5
0
0.5
1
1.5
2
2.5x 10
-3
Time (s)
I-S
Drift
Dis
pla
cem
ent
(m)
Level 1
Level 2
Level 3
0 5 10 15 20 25 30-3
-2
-1
0
1
2
3x 10
5
Time (s)
Shear
Forc
e (
N)

SERIES 227887 DUAREM Project
86
Figure 88. Full operation PSD test, Reference displacement and Force
DUAREM ELSA [Conf17LA] (80: Controller Measured) b09: PsD 1: full operational level, 0.02 g 29/04/2014
Master A Con 1 Level 1 S b
Master A Con 2 Level 1 S t
Master A Con 3 Level 1 N b
Master A Con 4 Level 1 N t
Master D Con 1 Level 2 S
Master D Con 2 Level 2 N
Master D Con 3 Level 3 S
Master D Con 4 Level 3 N
0 5 10 15 20 25 30-6
-4
-2
0
2
4
6
Time (s)
Heid
enhain
Dis
pla
cem
ent
(mm
)
Master A Con 1 Level 1 S b
Master A Con 2 Level 1 S t
Master A Con 3 Level 1 N b
Master A Con 4 Level 1 N t
Master D Con 1 Level 2 S
Master D Con 2 Level 2 N
Master D Con 3 Level 3 S
Master D Con 4 Level 3 N
0 5 10 15 20 25 30-200
-150
-100
-50
0
50
100
150
200
Time (s)
Load C
ell
Forc
e (
kN
)

SERIES 227887 DUAREM Project
87
Figure 89. Full operation PSD test, Frame Shear force vs Frame drift displacement
DUAREM ELSA [Conf17LA] (82: Controller Derived) b09: PsD 1: full operational level, 0.02 g 29/04/2014
S
N
-2 -1.5 -1 -0.5 0 0.5 1 1.5 2-400
-200
0
200
400
Level 1
Frame Drift Displacement (mm)
Fra
me S
hear
Forc
e (
kN
)
S
N
-3 -2 -1 0 1 2 3-400
-200
0
200
400
Level 2
Frame Drift Displacement (mm)
Fra
me S
hear
Forc
e (
kN
)
S
N
-2 -1.5 -1 -0.5 0 0.5 1 1.5 2-200
-100
0
100
200
Level 3
Frame Drift Displacement (mm)
Fra
me S
hear
Forc
e (
kN
)
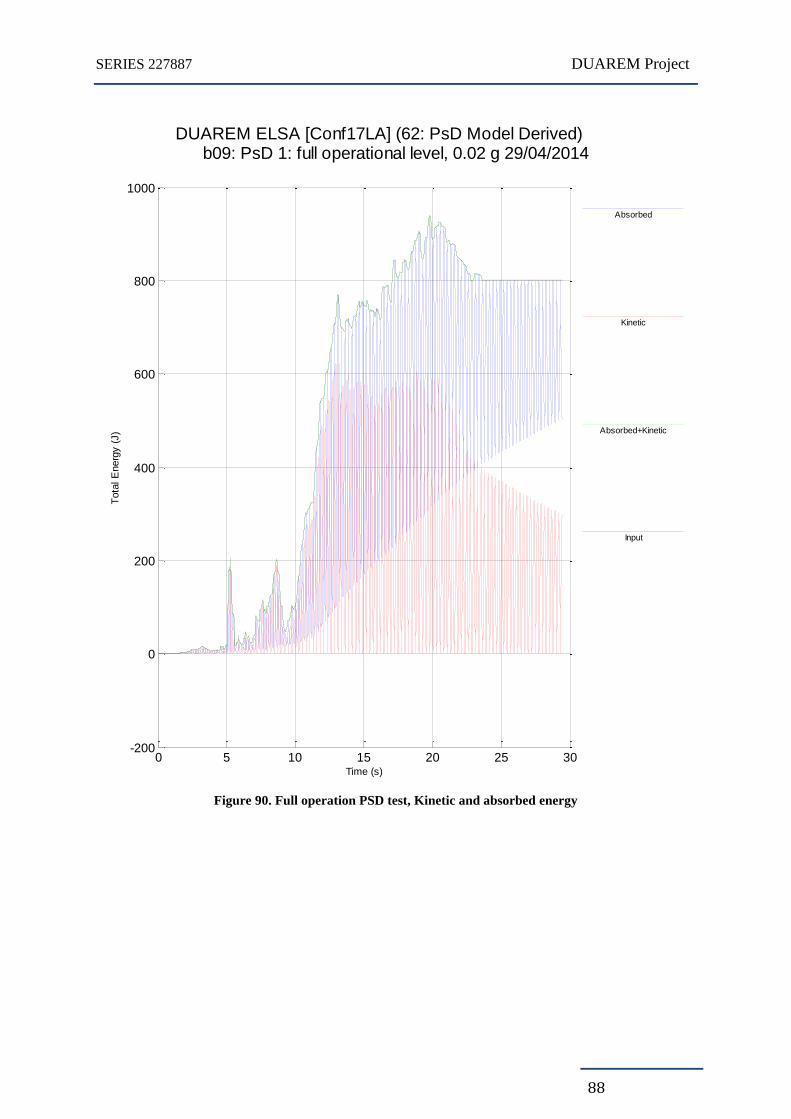
SERIES 227887 DUAREM Project
88
Figure 90. Full operation PSD test, Kinetic and absorbed energy
DUAREM ELSA [Conf17LA] (62: PsD Model Derived) b09: PsD 1: full operational level, 0.02 g 29/04/2014
Absorbed
Kinetic
Absorbed+Kinetic
Input
0 5 10 15 20 25 30-200
0
200
400
600
800
1000
Time (s)
Tota
l E
nerg
y (
J)

SERIES 227887 DUAREM Project
89
Figure 91. Full operation PSD test, Frame Interstorey absorbed energy
DUAREM ELSA [Conf17LA] (82: Controller Derived) b09: PsD 1: full operational level, 0.02 g 29/04/2014
S
N
0 5 10 15 20 25 30-200
0
200
400
600
800
Time (s)
Fra
me
I-S
Ab
so
rbe
d E
ne
rgy (
J)
L
eve
l 1
S
N
0 5 10 15 20 25 30-200
0
200
400
600
800
Time (s)
Fra
me
I-S
Ab
so
rbe
d E
ne
rgy (
J)
L
eve
l 2
S
N
0 5 10 15 20 25 30-100
0
100
200
300
Time (s)
Fra
me
I-S
Ab
so
rbe
d E
ne
rgy (
J)
L
eve
l 3

SERIES 227887 DUAREM Project
90
Figure 92. Full operation PSD test, Total absorbed energy by frames
DUAREM ELSA [Conf17LA] (82: Controller Derived) b09: PsD 1: full operational level, 0.02 g 29/04/2014
S
N
S+N
0 5 10 15 20 25 30-500
0
500
1000
1500
2000
2500
3000
Time (s)
Fra
me T
ota
l A
bsorb
ed E
nerg
y (
J)

SERIES 227887 DUAREM Project
91
Figure 93. Full operation PSD test, Frequency and Damping of the Tested Structure
DUAREM ELSA [Conf17LA] (63: PsD Model Identified) b09: PsD 1: full operational level, 0.02 g 29/04/2014
RefD
MeaD
0 5 10 15 20 25 301.91
1.92
1.93
1.94
1.95
1.96
1.97
1.98
1.99
Time (s)
Spatial-M
odel F
requency (
Hz)
Mode 1
w
=100
RefD
MeaD
0 5 10 15 20 25 305.2
5.25
5.3
5.35
5.4
5.45
5.5
5.55
Time (s)
Spatial-M
odel F
requency (
Hz)
Mode 2
w
=100
RefD
MeaD
0 5 10 15 20 25 307
7.5
8
8.5
9
9.5
Time (s)
Spatial-M
odel F
requency (
Hz)
Mode 3
w
=100
RefD
MeaD
0 5 10 15 20 25 30-2
-1.5
-1
-0.5
0
0.5
1
1.5
2
Time (s)
Spatial-M
odel D
am
pin
g R
atio (
%)
Mode 1
w
=100
RefD
MeaD
0 5 10 15 20 25 30-3
-2.5
-2
-1.5
-1
-0.5
0
0.5
1
1.5
Time (s)
Spatial-M
odel D
am
pin
g R
atio (
%)
Mode 2
w
=100
RefD
MeaD
0 5 10 15 20 25 30-10
-8
-6
-4
-2
0
2
4
6
8
10
Time (s)
Spatial-M
odel D
am
pin
g R
atio (
%)
Mode 3
w
=100

SERIES 227887 DUAREM Project
92
Figure 94. Full operation PSD test, Links rotation time-history
DUAREM ELSA [Conf17LA] b09: PsD 1: full operational level, 0.02 g 29/04/2014
N
S
0 5 10 15 20 25 30-2
-1
0
1
2x 10
-3
Time (s)
(70: Standard Measured)
Rota
tion (
rad)
(72:
Sta
ndard
Derived)
L1 L
ink L
ink L
evel 1
N
S
0 5 10 15 20 25 30-2
-1
0
1
2x 10
-3
Time (s)
(70: Standard Measured)
Rota
tion (
rad)
(72:
Sta
ndard
Derived)
L2 L
ink L
ink L
evel 2
N
S
0 5 10 15 20 25 30-2
-1
0
1
2x 10
-3
Time (s)
(70: Standard Measured)
Rota
tion (
rad)
(72:
Sta
ndard
Derived)
L3 L
ink L
ink L
evel 3

SERIES 227887 DUAREM Project
93
11.2 PSD EQ TEST: SLS
Figure 95. Service Limit State PSD test, Reference displacements and Restoring forces
DUAREM ELSA [Conf17LA] (60: PsD Model Measured)b10: PsD 2: SLS, 0.191 g 29/04/2014
Level 1
Level 2
Level 3
0 5 10 15 20 25 30-0.035
-0.03
-0.025
-0.02
-0.015
-0.01
-0.005
0
0.005
0.01
Time (s)
Refe
rence D
ispla
cem
ent
(m)
Level 1
Level 2
Level 3
0 5 10 15 20 25 30-5
-4
-3
-2
-1
0
1
2
3
4x 10
5
Time (s)
Resto
ring F
orc
e (
N)

SERIES 227887 DUAREM Project
94
Figure 96. Service Limit State PSD test, Interstorey Drift and Shear forces
DUAREM ELSA [Conf17LA] (62: PsD Model Derived)b10: PsD 2: SLS, 0.191 g 29/04/2014
Level 1
Level 2
Level 3
0 5 10 15 20 25 30-12
-10
-8
-6
-4
-2
0
2
4
6x 10
-3
Time (s)
I-S
Drift
Dis
pla
cem
ent
(m)
Level 1
Level 2
Level 3
0 5 10 15 20 25 30-8
-6
-4
-2
0
2
4
6
8x 10
5
Time (s)
Shear
Forc
e (
N)

SERIES 227887 DUAREM Project
95
Figure 97 Service Limit State PSD test, Kinetic and absorbed energy
DUAREM ELSA [Conf17LA] (62: PsD Model Derived)b10: PsD 2: SLS, 0.191 g 29/04/2014
Absorbed
Kinetic
Absorbed+Kinetic
Input
0 5 10 15 20 25 30-0.5
0
0.5
1
1.5
2
2.5
3
3.5x 10
4
Time (s)
Tota
l E
nerg
y (
J)

SERIES 227887 DUAREM Project
96
Figure 98. Service Limit State PSD test, Reference displacement and Force
DUAREM ELSA [Conf17LA] (80: Controller Measured)b10: PsD 2: SLS, 0.191 g 29/04/2014
Master A Con 1 Level 1 S b
Master A Con 2 Level 1 S t
Master A Con 3 Level 1 N b
Master A Con 4 Level 1 N t
Master D Con 1 Level 2 S
Master D Con 2 Level 2 N
Master D Con 3 Level 3 S
Master D Con 4 Level 3 N
0 5 10 15 20 25 30-35
-30
-25
-20
-15
-10
-5
0
5
10
15
Time (s)
Heid
enhain
Dis
pla
cem
ent
(mm
)
Master A Con 1 Level 1 S b
Master A Con 2 Level 1 S t
Master A Con 3 Level 1 N b
Master A Con 4 Level 1 N t
Master D Con 1 Level 2 S
Master D Con 2 Level 2 N
Master D Con 3 Level 3 S
Master D Con 4 Level 3 N
0 5 10 15 20 25 30-600
-400
-200
0
200
400
600
Time (s)
Load C
ell
Forc
e (
kN
)

SERIES 227887 DUAREM Project
97
Figure 99. Service Limit State PSD test, Frame Shear force vs Frame drift displacement
DUAREM ELSA [Conf17LA] (82: Controller Derived)b10: PsD 2: SLS, 0.191 g 29/04/2014
S
N
-12 -10 -8 -6 -4 -2 0 2 4 6-1000
-500
0
500
1000
Level 1
Frame Drift Displacement (mm)
Fra
me S
hear
Forc
e (
kN
)
S
N
-10 -8 -6 -4 -2 0 2 4-1000
-500
0
500
1000
Level 2
Frame Drift Displacement (mm)
Fra
me S
hear
Forc
e (
kN
)
S
N
-12 -10 -8 -6 -4 -2 0 2 4-600
-400
-200
0
200
400
Level 3
Frame Drift Displacement (mm)
Fra
me S
hear
Forc
e (
kN
)

SERIES 227887 DUAREM Project
98
Figure 100. Service Limit State PSD test, Frame Interstorey absorbed energy
DUAREM ELSA [Conf17LA] (82: Controller Derived)b10: PsD 2: SLS, 0.191 g 29/04/2014
S
N
0 5 10 15 20 25 30-5000
0
5000
10000
15000
20000
Time (s)
Fra
me
I-S
Ab
so
rbe
d E
ne
rgy (
J)
L
eve
l 1
S
N
0 5 10 15 20 25 30-5000
0
5000
10000
15000
Time (s)
Fra
me
I-S
Ab
so
rbe
d E
ne
rgy (
J)
L
eve
l 2
S
N
0 5 10 15 20 25 30-2000
0
2000
4000
6000
8000
10000
Time (s)
Fra
me
I-S
Ab
so
rbe
d E
ne
rgy (
J)
L
eve
l 3

SERIES 227887 DUAREM Project
99
Figure 101. Service Limit State PSD test, Total absorbed energy by frames
DUAREM ELSA [Conf17LA] (82: Controller Derived)b10: PsD 2: SLS, 0.191 g 29/04/2014
S
N
S+N
0 5 10 15 20 25 30-1
0
1
2
3
4
5
6
7
8x 10
4
Time (s)
Fra
me T
ota
l A
bsorb
ed E
nerg
y (
J)

SERIES 227887 DUAREM Project
100
Figure 102. Service Limit State PSD test, Frequency and Damping of the Tested Structure
DUAREM ELSA [Conf17LA] (63: PsD Model Identified)b10: PsD 2: SLS, 0.191 g 29/04/2014
RefD
MeaD
0 5 10 15 20 25 300.2
0.4
0.6
0.8
1
1.2
1.4
1.6
1.8
2
Time (s)
Spatial-M
odel F
requency (
Hz)
Mode 1
w
=100
RefD
MeaD
0 5 10 15 20 25 301.5
2
2.5
3
3.5
4
4.5
5
5.5
6
Time (s)
Spatial-M
odel F
requency (
Hz)
Mode 2
w
=100
RefD
MeaD
0 5 10 15 20 25 304.5
5
5.5
6
6.5
7
7.5
8
8.5
9
9.5
Time (s)
Spatial-M
odel F
requency (
Hz)
Mode 3
w
=100
RefD
MeaD
0 5 10 15 20 25 30-5
0
5
10
15
20
25
30
Time (s)
Spatial-M
odel D
am
pin
g R
atio (
%)
Mode 1
w
=100
RefD
MeaD
0 5 10 15 20 25 30-40
-30
-20
-10
0
10
20
30
Time (s)
Spatial-M
odel D
am
pin
g R
atio (
%)
Mode 2
w
=100
RefD
MeaD
0 5 10 15 20 25 30-20
-15
-10
-5
0
5
10
15
20
Time (s)
Spatial-M
odel D
am
pin
g R
atio (
%)
Mode 3
w
=100
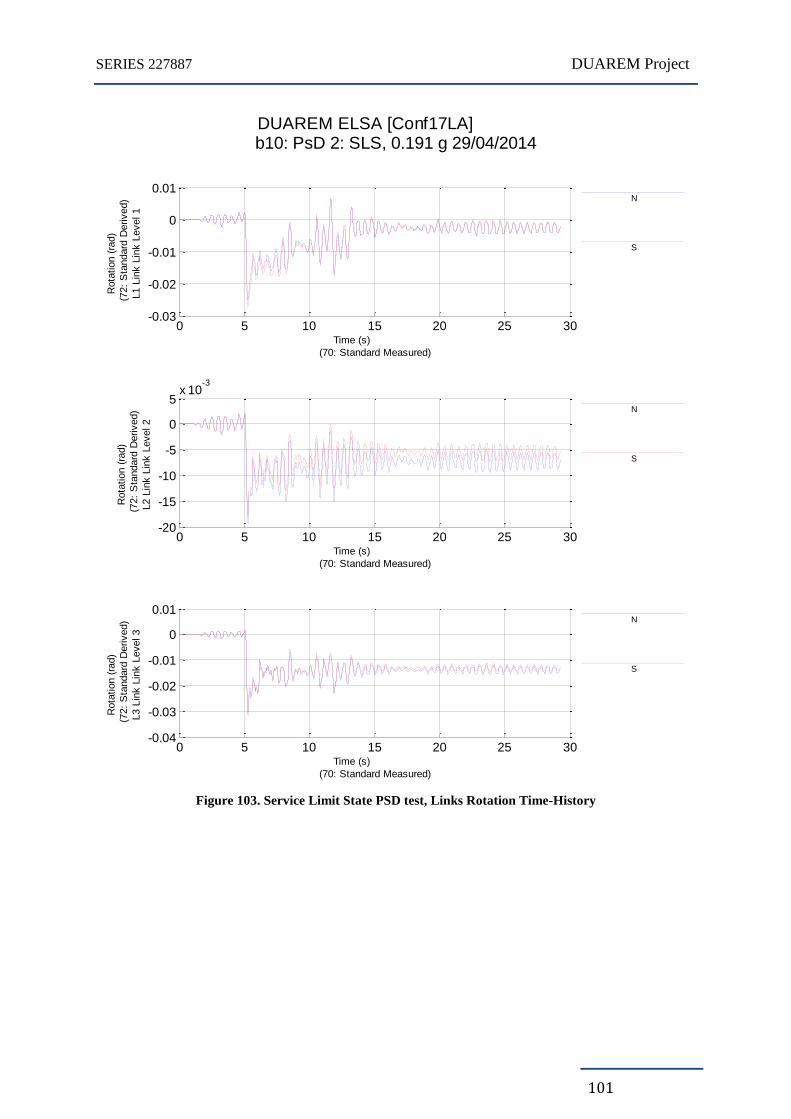
SERIES 227887 DUAREM Project
101
Figure 103. Service Limit State PSD test, Links Rotation Time-History
DUAREM ELSA [Conf17LA] b10: PsD 2: SLS, 0.191 g 29/04/2014
N
S
0 5 10 15 20 25 30-0.03
-0.02
-0.01
0
0.01
Time (s)
(70: Standard Measured)
Rota
tion (
rad)
(72:
Sta
ndard
Derived)
L1 L
ink L
ink L
evel 1
N
S
0 5 10 15 20 25 30-20
-15
-10
-5
0
5x 10
-3
Time (s)
(70: Standard Measured)
Rota
tion (
rad)
(72:
Sta
ndard
Derived)
L2 L
ink L
ink L
evel 2
N
S
0 5 10 15 20 25 30-0.04
-0.03
-0.02
-0.01
0
0.01
Time (s)
(70: Standard Measured)
Rota
tion (
rad)
(72:
Sta
ndard
Derived)
L3 L
ink L
ink L
evel 3

SERIES 227887 DUAREM Project
102
11.3 PSD EQ TEST: ULS
Figure 104. Ultimate Limit State PSD test, Reference displacements and Restoring forces
DUAREM ELSA [Conf20LB] (60: PsD Model Measured)d05: PsD 4: ULS, 0.324 g 26/05/2014
Level 1
Level 2
Level 3
0 5 10 15 20 25 30-0.06
-0.05
-0.04
-0.03
-0.02
-0.01
0
0.01
0.02
Time (s)
Refe
rence D
ispla
cem
ent
(m)
Level 1
Level 2
Level 3
0 5 10 15 20 25 30-6
-4
-2
0
2
4
6x 10
5
Time (s)
Resto
ring F
orc
e (
N)

SERIES 227887 DUAREM Project
103
Figure 105. Ultimate Limit State PSD test, Interstorey Drift and Shear forces
DUAREM ELSA [Conf20LB] (62: PsD Model Derived)d05: PsD 4: ULS, 0.324 g 26/05/2014
Level 1
Level 2
Level 3
0 5 10 15 20 25 30-0.025
-0.02
-0.015
-0.01
-0.005
0
0.005
0.01
Time (s)
I-S
Drift
Dis
pla
cem
ent
(m)
Level 1
Level 2
Level 3
0 5 10 15 20 25 30-10
-8
-6
-4
-2
0
2
4
6
8x 10
5
Time (s)
Shear
Forc
e (
N)

SERIES 227887 DUAREM Project
104
Figure 106 Ultimate Limit State PSD test, Kinetic and absorbed energy
DUAREM ELSA [Conf20LB] (62: PsD Model Derived)d05: PsD 4: ULS, 0.324 g 26/05/2014
Absorbed
Kinetic
Absorbed+Kinetic
Input
0 5 10 15 20 25 30-2
0
2
4
6
8
10x 10
4
Time (s)
Tota
l E
nerg
y (
J)

SERIES 227887 DUAREM Project
105
Figure 107. Ultimate Limit State PSD test, Reference displacement and Force
DUAREM ELSA [Conf20LB] (80: Controller Measured)d05: PsD 4: ULS, 0.324 g 26/05/2014
Master A Con 1 Level 1 S b
Master A Con 2 Level 1 S t
Master A Con 3 Level 1 N b
Master A Con 4 Level 1 N t
Master D Con 1 Level 2 S
Master D Con 2 Level 2 N
Master D Con 3 Level 3 S
Master D Con 4 Level 3 N
0 5 10 15 20 25 30-60
-50
-40
-30
-20
-10
0
10
20
Time (s)
Heid
enhain
Dis
pla
cem
ent
(mm
)
Master A Con 1 Level 1 S b
Master A Con 2 Level 1 S t
Master A Con 3 Level 1 N b
Master A Con 4 Level 1 N t
Master D Con 1 Level 2 S
Master D Con 2 Level 2 N
Master D Con 3 Level 3 S
Master D Con 4 Level 3 N
0 5 10 15 20 25 30-800
-600
-400
-200
0
200
400
600
Time (s)
Load C
ell
Forc
e (
kN
)

SERIES 227887 DUAREM Project
106
Figure 108. Ultimate Limit State PSD test, Frame Shear force vs Frame drift displacement
DUAREM ELSA [Conf20LB] (82: Controller Derived)d05: PsD 4: ULS, 0.324 g 26/05/2014
S
N
-20 -15 -10 -5 0 5 10-2000
-1000
0
1000
Level 1
Frame Drift Displacement (mm)
Fra
me S
hear
Forc
e (
kN
)
S
N
-25 -20 -15 -10 -5 0 5 10-1000
-500
0
500
1000
Level 2
Frame Drift Displacement (mm)
Fra
me S
hear
Forc
e (
kN
)
S
N
-20 -15 -10 -5 0 5-1000
-500
0
500
Level 3
Frame Drift Displacement (mm)
Fra
me S
hear
Forc
e (
kN
)

SERIES 227887 DUAREM Project
107
Figure 109. Ultimate Limit State PSD test, Frame Interstorey absorbed energy
DUAREM ELSA [Conf20LB] (82: Controller Derived)d05: PsD 4: ULS, 0.324 g 26/05/2014
S
N
0 5 10 15 20 25 30-2
0
2
4
6x 10
4
Time (s)
Fra
me I-S
Absorb
ed E
nerg
y (
J)
L
evel 1
S
N
0 5 10 15 20 25 30-1
0
1
2
3
4x 10
4
Time (s)
Fra
me I-S
Absorb
ed E
nerg
y (
J)
L
evel 2
S
N
0 5 10 15 20 25 30-1
0
1
2
3x 10
4
Time (s)
Fra
me I-S
Absorb
ed E
nerg
y (
J)
L
evel 3

SERIES 227887 DUAREM Project
108
Figure 110. Ultimate Limit State PSD test, Total absorbed energy by frames
DUAREM ELSA [Conf20LB] (82: Controller Derived) d06: PsD 4: ULS, 0.324 g + final release of force 26/05/2014
S
N
S+N
0 5 10 15 20 25 30-5
0
5
10
15
20x 10
4
Time (s)
Fra
me T
ota
l A
bsorb
ed E
nerg
y (
J)

SERIES 227887 DUAREM Project
109
Figure 111. Ultimate Limit State PSD test, Frequency and Damping of the Tested Structure
DUAREM ELSA [Conf20LB] (63: PsD Model Identified)d05: PsD 4: ULS, 0.324 g 26/05/2014
RefD
MeaD
0 5 10 15 20 25 301
1.1
1.2
1.3
1.4
1.5
1.6
1.7
1.8
1.9
2
Time (s)
Spatial-M
odel F
requency (
Hz)
Mode 1
w
=100
RefD
MeaD
0 5 10 15 20 25 302.5
3
3.5
4
4.5
5
5.5
6
Time (s)
Spatial-M
odel F
requency (
Hz)
Mode 2
w
=100
RefD
MeaD
0 5 10 15 20 25 304.5
5
5.5
6
6.5
7
7.5
8
8.5
Time (s)
Spatial-M
odel F
requency (
Hz)
Mode 3
w
=100
RefD
MeaD
0 5 10 15 20 25 30-5
0
5
10
15
20
25
30
35
40
Time (s)
Spatial-M
odel D
am
pin
g R
atio (
%)
Mode 1
w
=100
RefD
MeaD
0 5 10 15 20 25 30-40
-30
-20
-10
0
10
20
30
40
Time (s)
Spatial-M
odel D
am
pin
g R
atio (
%)
Mode 2
w
=100
RefD
MeaD
0 5 10 15 20 25 30-20
-15
-10
-5
0
5
10
15
20
25
30
Time (s)
Spatial-M
odel D
am
pin
g R
atio (
%)
Mode 3
w
=100

SERIES 227887 DUAREM Project
110
Figure 112. Ultimate Limit State PSD test, Links Rotation Time-History
DUAREM ELSA [Conf20LB] d05: PsD 4: ULS, 0.324 g 26/05/2014
N
S
0 5 10 15 20 25 30-0.06
-0.04
-0.02
0
0.02
Time (s)
(70: Standard Measured)
Rota
tion (
rad)
(72:
Sta
ndard
Derived)
L1 L
ink L
ink L
evel 1
N
S
0 5 10 15 20 25 30-0.06
-0.04
-0.02
0
0.02
Time (s)
(70: Standard Measured)
Rota
tion (
rad)
(72:
Sta
ndard
Derived)
L2 L
ink L
ink L
evel 2
N
S
0 5 10 15 20 25 30-0.06
-0.04
-0.02
0
0.02
Time (s)
(70: Standard Measured)
Rota
tion (
rad)
(72:
Sta
ndard
Derived)
L3 L
ink L
ink L
evel 3
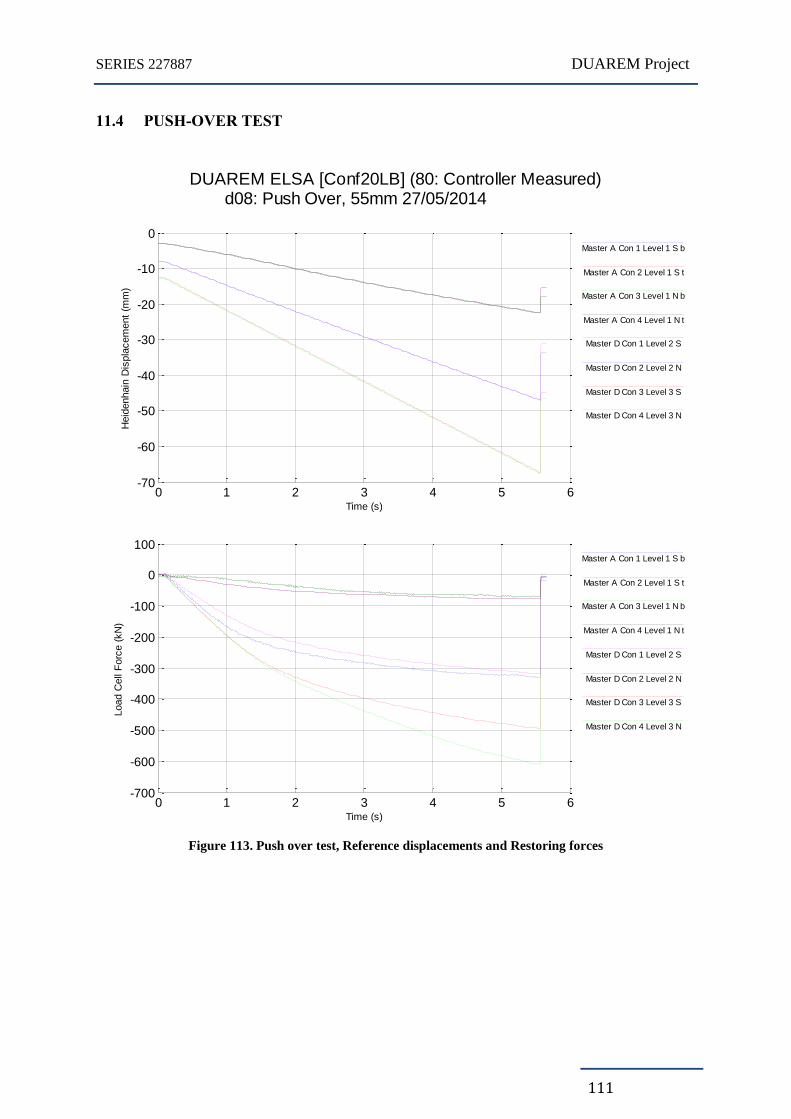
SERIES 227887 DUAREM Project
111
11.4 PUSH-OVER TEST
Figure 113. Push over test, Reference displacements and Restoring forces
DUAREM ELSA [Conf20LB] (80: Controller Measured)d08: Push Over, 55mm 27/05/2014
Master A Con 1 Level 1 S b
Master A Con 2 Level 1 S t
Master A Con 3 Level 1 N b
Master A Con 4 Level 1 N t
Master D Con 1 Level 2 S
Master D Con 2 Level 2 N
Master D Con 3 Level 3 S
Master D Con 4 Level 3 N
0 1 2 3 4 5 6-70
-60
-50
-40
-30
-20
-10
0
Time (s)
Heid
enhain
Dis
pla
cem
ent
(mm
)
Master A Con 1 Level 1 S b
Master A Con 2 Level 1 S t
Master A Con 3 Level 1 N b
Master A Con 4 Level 1 N t
Master D Con 1 Level 2 S
Master D Con 2 Level 2 N
Master D Con 3 Level 3 S
Master D Con 4 Level 3 N
0 1 2 3 4 5 6-700
-600
-500
-400
-300
-200
-100
0
100
Time (s)
Load C
ell
Forc
e (
kN
)

SERIES 227887 DUAREM Project
112
Figure 114. Push over test, Interstorey Drift and Shear forces
DUAREM ELSA [Conf20LB] (82: Controller Derived)d08: Push Over, 55mm 27/05/2014
S
N
-25 -20 -15 -10 -5 0-1500
-1000
-500
0
500
Level 1
Frame Drift Displacement (mm)
Fra
me S
hear
Forc
e (
kN
)
S
N
-25 -20 -15 -10 -5-1000
-500
0
500
Level 2
Frame Drift Displacement (mm)
Fra
me S
hear
Forc
e (
kN
)
S
N
-22 -20 -18 -16 -14 -12 -10 -8 -6 -4-800
-600
-400
-200
0
200
Level 3
Frame Drift Displacement (mm)
Fra
me S
hear
Forc
e (
kN
)

SERIES 227887 DUAREM Project
113
Figure 115. Push over test Shear force vs top displacement
DUAREM ELSA [Conf20LB] (82: Controller Derived)d08: Push Over, 55mm 27/05/2014
S
N
-70 -60 -50 -40 -30 -20 -10-1200
-1000
-800
-600
-400
-200
0
200
Frame Reference Displacement (mm)
Level 3
Fra
me S
hear
Forc
e (
kN
)
L
evel 1
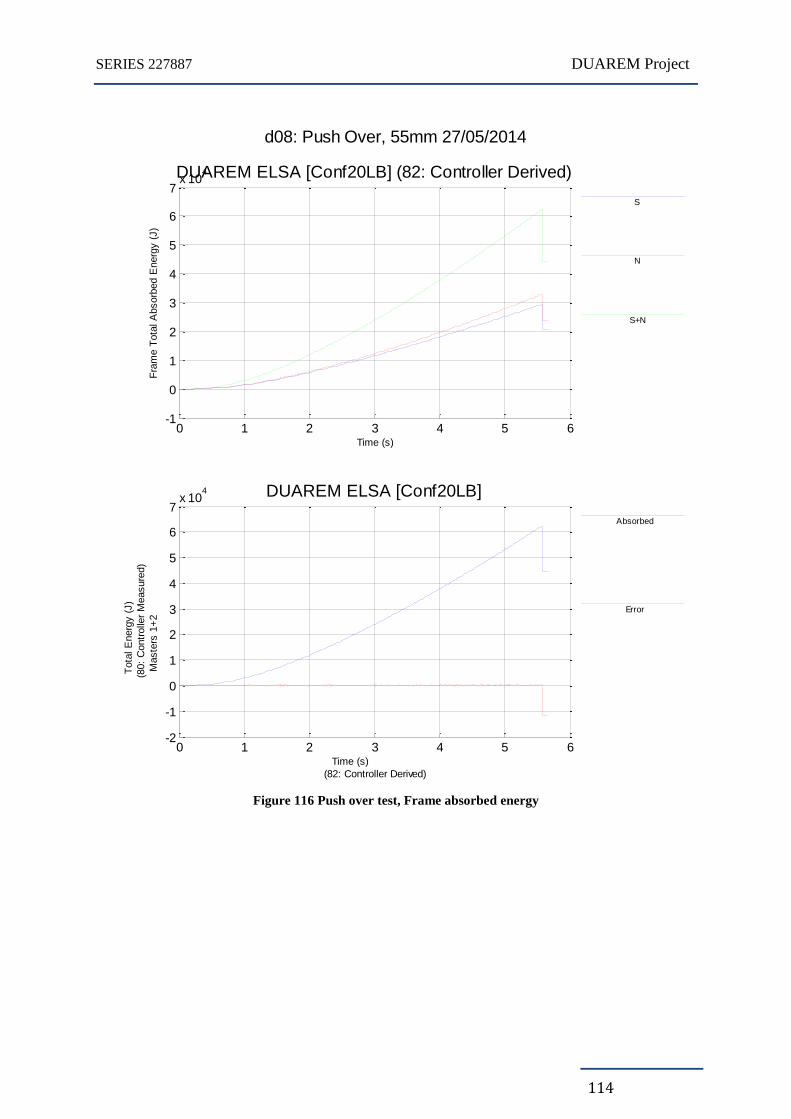
SERIES 227887 DUAREM Project
114
Figure 116 Push over test, Frame absorbed energy
d08: Push Over, 55mm 27/05/2014
S
N
S+N
0 1 2 3 4 5 6-1
0
1
2
3
4
5
6
7x 10
4DUAREM ELSA [Conf20LB] (82: Controller Derived)
Time (s)
Fra
me T
ota
l A
bsorb
ed E
nerg
y (
J)
Absorbed
Error
0 1 2 3 4 5 6-2
-1
0
1
2
3
4
5
6
7x 10
4 DUAREM ELSA [Conf20LB]
Time (s)
(82: Controller Derived)
Tota
l E
nerg
y (
J)
(80:
Contr
olle
r M
easure
d)
Maste
rs 1
+2

SERIES 227887 DUAREM Project
115
Figure 117. Push over test, Frame Interstorey absorbed energy
DUAREM ELSA [Conf20LB] (82: Controller Derived)d08: Push Over, 55mm 27/05/2014
S
N
0 1 2 3 4 5 6-5000
0
5000
10000
15000
Time (s)
Fra
me
I-S
Ab
so
rbe
d E
ne
rgy (
J)
L
eve
l 1
S
N
0 1 2 3 4 5 6-5000
0
5000
10000
15000
Time (s)
Fra
me
I-S
Ab
so
rbe
d E
ne
rgy (
J)
L
eve
l 2
S
N
0 1 2 3 4 5 6-2000
0
2000
4000
6000
8000
Time (s)
Fra
me
I-S
Ab
so
rbe
d E
ne
rgy (
J)
L
eve
l 3

SERIES 227887 DUAREM Project
116
Figure 118. Push over test, Total absorbed energy by frames
DUAREM ELSA [Conf20LB] (82: Controller Derived)d08: Push Over, 55mm 27/05/2014
S
N
S+N
0 1 2 3 4 5 6-1
0
1
2
3
4
5
6
7x 10
4
Time (s)
Fra
me T
ota
l A
bsorb
ed E
nerg
y (
J)
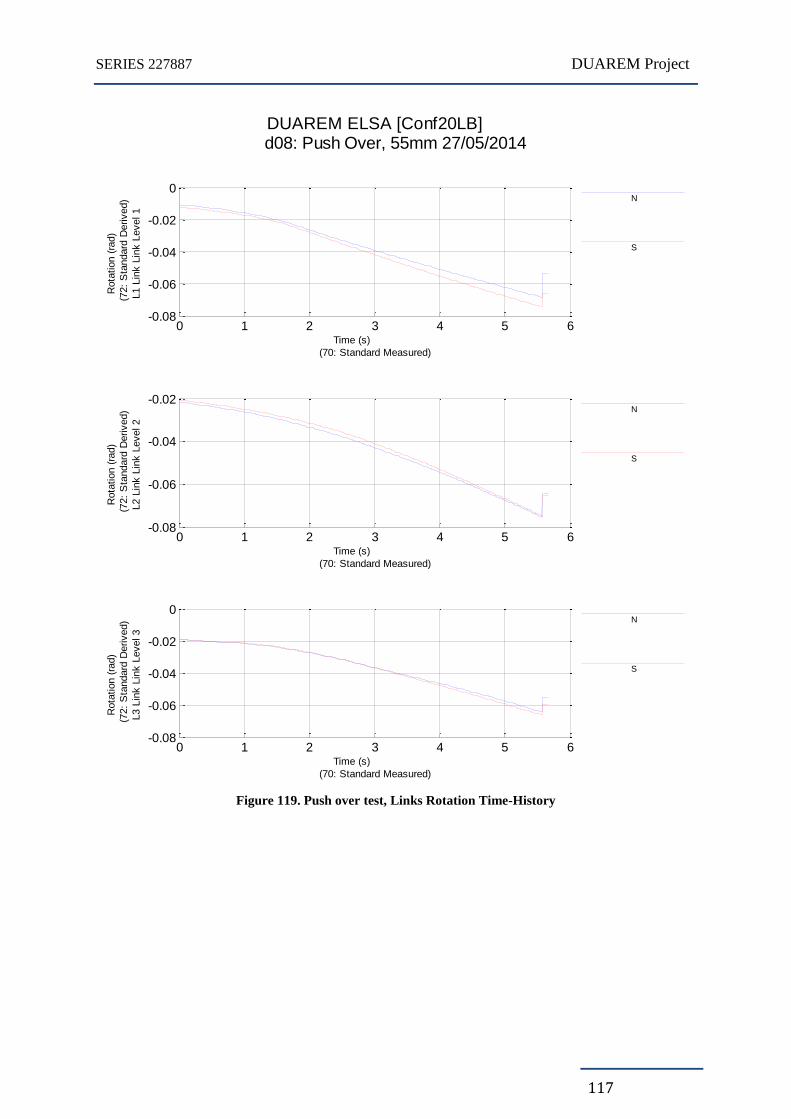
SERIES 227887 DUAREM Project
117
Figure 119. Push over test, Links Rotation Time-History
DUAREM ELSA [Conf20LB] d08: Push Over, 55mm 27/05/2014
N
S
0 1 2 3 4 5 6-0.08
-0.06
-0.04
-0.02
0
Time (s)
(70: Standard Measured)
Rota
tion (
rad)
(72:
Sta
ndard
Derived)
L1 L
ink L
ink L
evel 1
N
S
0 1 2 3 4 5 6-0.08
-0.06
-0.04
-0.02
Time (s)
(70: Standard Measured)
Rota
tion (
rad)
(72:
Sta
ndard
Derived)
L2 L
ink L
ink L
evel 2
N
S
0 1 2 3 4 5 6-0.08
-0.06
-0.04
-0.02
0
Time (s)
(70: Standard Measured)
Rota
tion (
rad)
(72:
Sta
ndard
Derived)
L3 L
ink L
ink L
evel 3

SERIES 227887 DUAREM Project
118
11.5 PSD EQ TEST: NC
Figure 120. Near Collapse State PSD test, Reference displacements and Restoring forces
DUAREM ELSA [Conf31LC] (60: PsD Model Measured) f04: PsD 6: near collapse, 0.557 g 24-25/07/2014
Level 1
Level 2
Level 3
0 1 2 3 4 5 6-0.12
-0.1
-0.08
-0.06
-0.04
-0.02
0
0.02
Time (s)
Refe
rence D
ispla
cem
ent
(m)
Level 1
Level 2
Level 3
0 1 2 3 4 5 6-8
-6
-4
-2
0
2
4
6
8x 10
5
Time (s)
Resto
ring F
orc
e (
N)

SERIES 227887 DUAREM Project
119
Figure 121. Near Collapse State PSD test, Interstorey Drift and Shear forces
DUAREM ELSA [Conf31LC] (62: PsD Model Derived) f04: PsD 6: near collapse, 0.557 g 24-25/07/2014
Level 1
Level 2
Level 3
0 1 2 3 4 5 6-0.06
-0.05
-0.04
-0.03
-0.02
-0.01
0
0.01
Time (s)
I-S
Drift
Dis
pla
cem
ent
(m)
Level 1
Level 2
Level 3
0 1 2 3 4 5 6-1.5
-1
-0.5
0
0.5
1x 10
6
Time (s)
Shear
Forc
e (
N)

SERIES 227887 DUAREM Project
120
Figure 122 Near Collapse State PSD test, Kinetic and absorbed energy
DUAREM ELSA [Conf31LC] (62: PsD Model Derived) f04: PsD 6: near collapse, 0.557 g 24-25/07/2014
Absorbed
Kinetic
Absorbed+Kinetic
Input
0 1 2 3 4 5 6-2
0
2
4
6
8
10
12
14x 10
4
Time (s)
Tota
l E
nerg
y (
J)

SERIES 227887 DUAREM Project
121
Figure 123. Near Collapse State PSD test, Reference displacement and Force
DUAREM ELSA [Conf31LC] (80: Controller Measured)f04: PsD 6: near collapse, 0.557 g 24-25/07/2014
Master A Con 1 Level 1 S b
Master A Con 2 Level 1 S t
Master A Con 3 Level 1 N b
Master A Con 4 Level 1 N t
Master D Con 1 Level 2 S
Master D Con 2 Level 2 N
Master D Con 3 Level 3 S
Master D Con 4 Level 3 N
0 1 2 3 4 5 6-120
-100
-80
-60
-40
-20
0
20
Time (s)
Heid
enhain
Dis
pla
cem
ent
(mm
)
Master A Con 1 Level 1 S b
Master A Con 2 Level 1 S t
Master A Con 3 Level 1 N b
Master A Con 4 Level 1 N t
Master D Con 1 Level 2 S
Master D Con 2 Level 2 N
Master D Con 3 Level 3 S
Master D Con 4 Level 3 N
0 1 2 3 4 5 6-1000
-500
0
500
Time (s)
Load C
ell
Forc
e (
kN
)

SERIES 227887 DUAREM Project
122
Figure 124. Near Collapse State PSD test, Frame Shear force vs Frame drift displacement
DUAREM ELSA [Conf31LC] (82: Controller Derived) f04: PsD 6: near collapse, 0.557 g 24-25/07/2014
S
N
-50 -40 -30 -20 -10 0 10-2000
-1000
0
1000
Level 1
Frame Drift Displacement (mm)
Fra
me S
hear
Forc
e (
kN
)
S
N
-60 -50 -40 -30 -20 -10 0 10-1500
-1000
-500
0
500
1000
Level 2
Frame Drift Displacement (mm)
Fra
me S
hear
Forc
e (
kN
)
S
N
-30 -25 -20 -15 -10 -5 0 5-1000
-500
0
500
Level 3
Frame Drift Displacement (mm)
Fra
me S
hear
Forc
e (
kN
)

SERIES 227887 DUAREM Project
123
Figure 125. Near Collapse State PSD test, Frame Interstorey absorbed energy
DUAREM ELSA [Conf31LC] (82: Controller Derived) f04: PsD 6: near collapse, 0.557 g 24-25/07/2014
S
N
0 1 2 3 4 5 6-2
0
2
4
6x 10
4
Time (s)
Fra
me
I-S
Ab
so
rbe
d E
ne
rgy (
J)
L
eve
l 1
S
N
0 1 2 3 4 5 6-2
0
2
4
6x 10
4
Time (s)
Fra
me
I-S
Ab
so
rbe
d E
ne
rgy (
J)
L
eve
l 2
S
N
0 1 2 3 4 5 6-5000
0
5000
10000
15000
Time (s)
Fra
me
I-S
Ab
so
rbe
d E
ne
rgy (
J)
L
eve
l 3

SERIES 227887 DUAREM Project
124
Figure 126. Near Collapse State PSD test, Total absorbed energy by frames
DUAREM ELSA [Conf31LC] (82: Controller Derived) f04: PsD 6: near collapse, 0.557 g 24-25/07/2014
S
N
S+N
0 1 2 3 4 5 6-0.5
0
0.5
1
1.5
2
2.5x 10
5
Time (s)
Fra
me T
ota
l A
bsorb
ed E
nerg
y (
J)
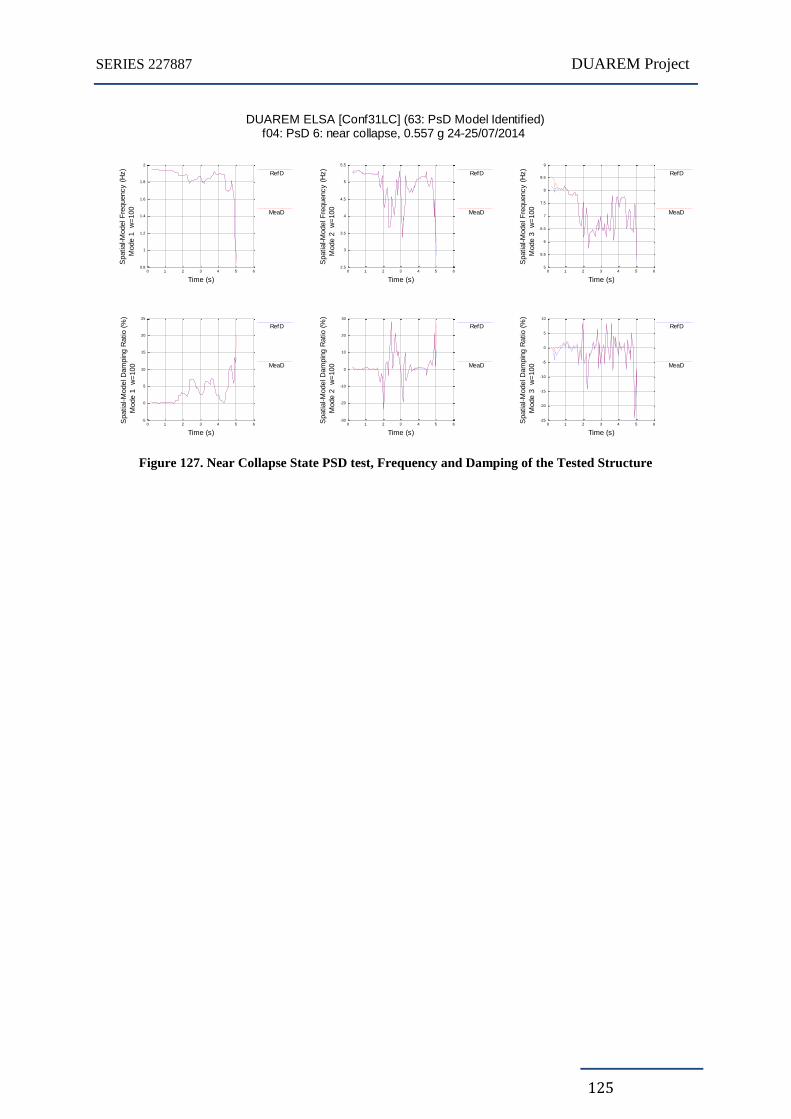
SERIES 227887 DUAREM Project
125
Figure 127. Near Collapse State PSD test, Frequency and Damping of the Tested Structure
DUAREM ELSA [Conf31LC] (63: PsD Model Identified)f04: PsD 6: near collapse, 0.557 g 24-25/07/2014
RefD
MeaD
0 1 2 3 4 5 60.8
1
1.2
1.4
1.6
1.8
2
Time (s)
Spatial-M
odel F
requency (
Hz)
Mode 1
w
=100
RefD
MeaD
0 1 2 3 4 5 62.5
3
3.5
4
4.5
5
5.5
Time (s)
Spatial-M
odel F
requency (
Hz)
Mode 2
w
=100
RefD
MeaD
0 1 2 3 4 5 65
5.5
6
6.5
7
7.5
8
8.5
9
Time (s)
Spatial-M
odel F
requency (
Hz)
Mode 3
w
=100
RefD
MeaD
0 1 2 3 4 5 6-5
0
5
10
15
20
25
Time (s)
Spatial-M
odel D
am
pin
g R
atio (
%)
Mode 1
w
=100
RefD
MeaD
0 1 2 3 4 5 6-30
-20
-10
0
10
20
30
Time (s)
Spatial-M
odel D
am
pin
g R
atio (
%)
Mode 2
w
=100
RefD
MeaD
0 1 2 3 4 5 6-25
-20
-15
-10
-5
0
5
10
Time (s)
Spatial-M
odel D
am
pin
g R
atio (
%)
Mode 3
w
=100
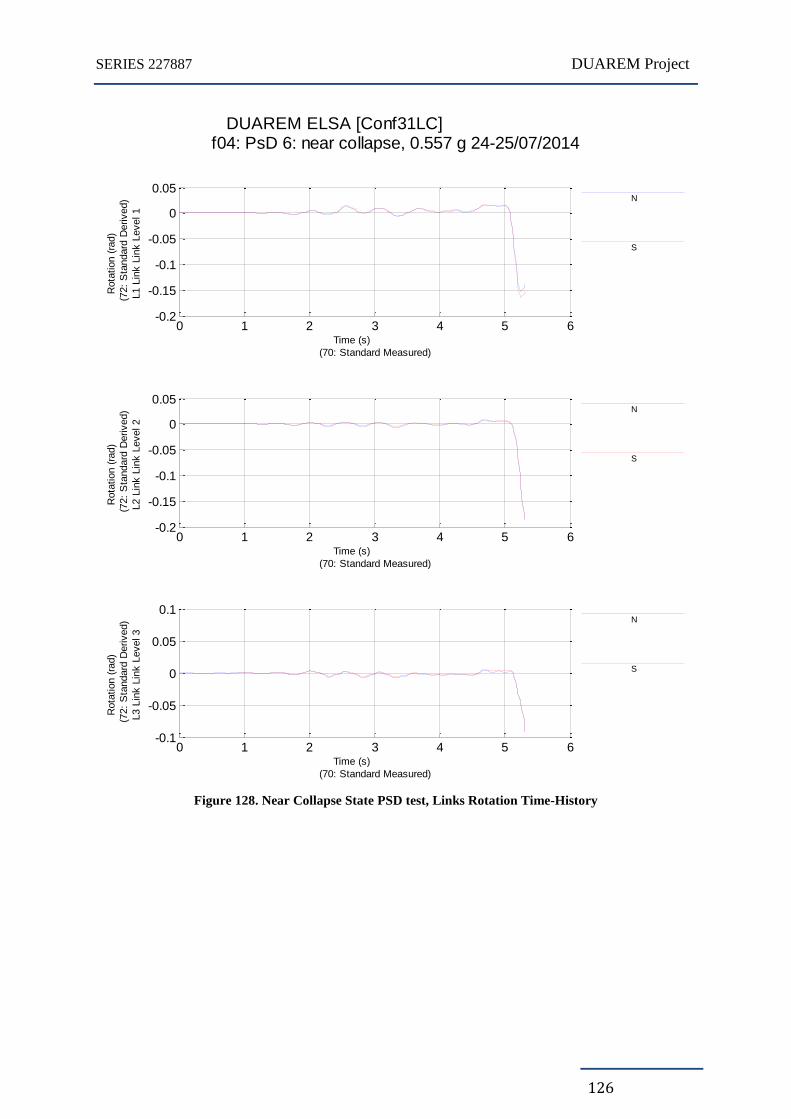
SERIES 227887 DUAREM Project
126
Figure 128. Near Collapse State PSD test, Links Rotation Time-History
DUAREM ELSA [Conf31LC] f04: PsD 6: near collapse, 0.557 g 24-25/07/2014
N
S
0 1 2 3 4 5 6-0.2
-0.15
-0.1
-0.05
0
0.05
Time (s)
(70: Standard Measured)
Rota
tion (
rad)
(72:
Sta
ndard
Derived)
L1 L
ink L
ink L
evel 1
N
S
0 1 2 3 4 5 6-0.2
-0.15
-0.1
-0.05
0
0.05
Time (s)
(70: Standard Measured)
Rota
tion (
rad)
(72:
Sta
ndard
Derived)
L2 L
ink L
ink L
evel 2
N
S
0 1 2 3 4 5 6-0.1
-0.05
0
0.05
0.1
Time (s)
(70: Standard Measured)
Rota
tion (
rad)
(72:
Sta
ndard
Derived)
L3 L
ink L
ink L
evel 3

SERIES 227887 DUAREM Project
127
Figure 129. Push-over test, Reference displacements and restoring forces
DUAREM ELSA [Conf31LC] (80: Controller Measured) f07: Push Over, 150mm (uniform forces South frame) 25/07/2014
Master A Con 1 Level 1 S b
Master A Con 2 Level 1 S t
Master A Con 3 Level 1 N b
Master A Con 4 Level 1 N t
Master D Con 1 Level 2 S
Master D Con 2 Level 2 N
Master D Con 3 Level 3 S
Master D Con 4 Level 3 N
0 1 2 3 4 5 6 7 8-100
-50
0
50
100
150
200
250
Time (s)
Heid
enhain
Dis
pla
cem
ent
(mm
)
Master A Con 1 Level 1 S b
Master A Con 2 Level 1 S t
Master A Con 3 Level 1 N b
Master A Con 4 Level 1 N t
Master D Con 1 Level 2 S
Master D Con 2 Level 2 N
Master D Con 3 Level 3 S
Master D Con 4 Level 3 N
0 1 2 3 4 5 6 7 8-800
-600
-400
-200
0
200
400
600
800
1000
1200
Time (s)
Load C
ell
Forc
e (
kN
)

SERIES 227887 DUAREM Project
128
Figure 130. Push-over test, Interstorey drift vs top displacement
DUAREM ELSA [Conf31LC] (82: Controller Derived) f07: Push Over, 150mm (uniform forces South frame) 25/07/2014
S
N
-40 -20 0 20 40 60 80 100 120-2000
-1000
0
1000
2000
Level 1
Frame Drift Displacement (mm)
Fra
me S
hear
Forc
e (
kN
)
S
N
-20 0 20 40 60 80 100-2000
-1000
0
1000
2000
Level 2
Frame Drift Displacement (mm)
Fra
me S
hear
Forc
e (
kN
)
S
N
-20 -10 0 10 20 30 40-1000
-500
0
500
1000
Level 3
Frame Drift Displacement (mm)
Fra
me S
hear
Forc
e (
kN
)

SERIES 227887 DUAREM Project
129
Figure 131. Push-over test, Top displacement vs base shear
DUAREM ELSA [Conf31LC] (82: Controller Derived) f07: Push Over, 150mm (uniform forces South frame) 25/07/2014
S
N
-100 -50 0 50 100 150 200 250-2000
-1500
-1000
-500
0
500
1000
1500
2000
Frame Reference Displacement (mm)
Level 3
Fra
me S
hear
Forc
e (
kN
)
L
evel 1

SERIES 227887 DUAREM Project
130
Figure 132. Push-over test, Frame interstorey absorbed energy
DUAREM ELSA [Conf31LC] (82: Controller Derived) f07: Push Over, 150mm (uniform forces South frame) 25/07/2014
S
N
0 1 2 3 4 5 6 7 8-1
0
1
2
3x 10
5
Time (s)
Fra
me
I-S
Ab
so
rbe
d E
ne
rgy (
J)
L
eve
l 1
S
N
0 1 2 3 4 5 6 7 8-5
0
5
10
15x 10
4
Time (s)
Fra
me
I-S
Ab
so
rbe
d E
ne
rgy (
J)
L
eve
l 2
S
N
0 1 2 3 4 5 6 7 8-5000
0
5000
10000
15000
20000
Time (s)
Fra
me
I-S
Ab
so
rbe
d E
ne
rgy (
J)
L
eve
l 3

SERIES 227887 DUAREM Project
131
Figure 133. Push-over test, Total absorbed energy by frames
DUAREM ELSA [Conf31LC] (82: Controller Derived) f07: Push Over, 150mm (uniform forces South frame) 25/07/2014
S
N
S+N
0 1 2 3 4 5 6 7 8-1
0
1
2
3
4
5
6
7x 10
5
Time (s)
Fra
me T
ota
l A
bsorb
ed E
nerg
y (
J)

SERIES 227887 DUAREM Project
132
11.6 CYCLIC PUSH-OVER TEST
Figure 134. Push over test, Reference displacements and Restoring forces
DUAREM ELSA [Conf31LC] (80: Controller Measured)f08: Final Push Over, 400mm 29/07/2014
Master A Con 1 Level 1 S b
Master A Con 2 Level 1 S t
Master A Con 3 Level 1 N b
Master A Con 4 Level 1 N t
Master D Con 1 Level 2 S
Master D Con 2 Level 2 N
Master D Con 3 Level 3 S
Master D Con 4 Level 3 N
0 5 10 15 20 25 30 35-400
-300
-200
-100
0
100
200
300
400
500
Time (s)
Heid
enhain
Dis
pla
cem
ent
(mm
)
Master A Con 1 Level 1 S b
Master A Con 2 Level 1 S t
Master A Con 3 Level 1 N b
Master A Con 4 Level 1 N t
Master D Con 1 Level 2 S
Master D Con 2 Level 2 N
Master D Con 3 Level 3 S
Master D Con 4 Level 3 N
0 5 10 15 20 25 30 35-600
-400
-200
0
200
400
600
Time (s)
Load C
ell
Forc
e (
kN
)

SERIES 227887 DUAREM Project
133
Figure 135. Push over test, Interstorey Drift and Shear forces
DUAREM ELSA [Conf31LC] (82: Controller Derived)f08: Final Push Over, 400mm 29/07/2014
S
N
-200 -150 -100 -50 0 50 100 150 200-2000
-1000
0
1000
2000
Level 1
Frame Drift Displacement (mm)
Fra
me S
hear
Forc
e (
kN
)
S
N
-200 -150 -100 -50 0 50 100 150 200-1000
-500
0
500
1000
1500
Level 2
Frame Drift Displacement (mm)
Fra
me S
hear
Forc
e (
kN
)
S
N
-40 -30 -20 -10 0 10 20 30 40-500
0
500
1000
Level 3
Frame Drift Displacement (mm)
Fra
me S
hear
Forc
e (
kN
)

SERIES 227887 DUAREM Project
134
Figure 136. Push over test Shear force vs top displacement
DUAREM ELSA [Conf31LC] (82: Controller Derived)f08: Final Push Over, 400mm 29/07/2014
S
N
-400 -300 -200 -100 0 100 200 300 400 500-1500
-1000
-500
0
500
1000
1500
2000
Frame Displacement (mm)
Level 3
Fra
me S
hear
Forc
e (
kN
)
L
evel 1
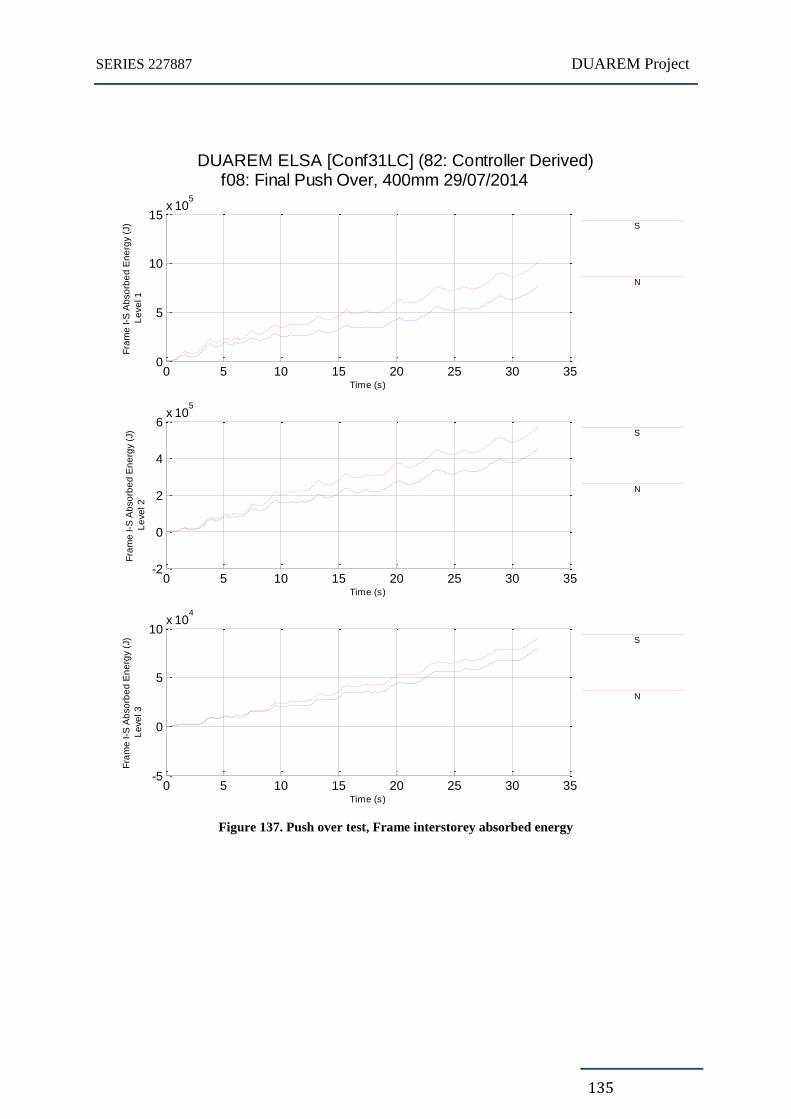
SERIES 227887 DUAREM Project
135
Figure 137. Push over test, Frame interstorey absorbed energy
DUAREM ELSA [Conf31LC] (82: Controller Derived)f08: Final Push Over, 400mm 29/07/2014
S
N
0 5 10 15 20 25 30 350
5
10
15x 10
5
Time (s)
Fra
me
I-S
Ab
so
rbe
d E
ne
rgy (
J)
L
eve
l 1
S
N
0 5 10 15 20 25 30 35-2
0
2
4
6x 10
5
Time (s)
Fra
me
I-S
Ab
so
rbe
d E
ne
rgy (
J)
L
eve
l 2
S
N
0 5 10 15 20 25 30 35-5
0
5
10x 10
4
Time (s)
Fra
me
I-S
Ab
so
rbe
d E
ne
rgy (
J)
L
eve
l 3

SERIES 227887 DUAREM Project
136
Figure 138. Push over test, Total absorbed energy by frames
DUAREM ELSA [Conf31LC] (82: Controller Derived)f08: Final Push Over, 400mm 29/07/2014
S
N
S+N
0 5 10 15 20 25 30 35-0.5
0
0.5
1
1.5
2
2.5
3x 10
6
Time (s)
Fra
me T
ota
l A
bsorb
ed E
nerg
y (
J)

SERIES 227887 DUAREM Project
137
Figure 139. Push over test, 3rd Floor link rotation
DUAREM ELSA [Conf31LC] f08: Final Push Over, 400mm 29/07/2014
N
S
0 5 10 15 20 25 30 35 40-0.2
-0.15
-0.1
-0.05
0
0.05
0.1
0.15
Time (s)
(70: Standard Measured)
Rota
tion (
rad)
(72:
Sta
ndard
Derived)
L3 L
ink L
ink L
evel 3

Europe Direct is a service to help you find answers to your questions about the European Union
Freephone number (*): 00 800 6 7 8 9 10 11
(*) Certain mobile telephone operators do not allow access to 00 800 numbers or these calls may be billed.
A great deal of additional information on the European Union is available on the Internet.
It can be accessed through the Europa server http://europa.eu.
How to obtain EU publications
Our publications are available from EU Bookshop (http://bookshop.europa.eu),
where you can place an order with the sales agent of your choice.
The Publications Office has a worldwide network of sales agents.
You can obtain their contact details by sending a fax to (352) 29 29-42758.
European Commission
EUR 27030 – Joint Research Centre – Institute for the Protection and Security of the Citizen
Title: SEISMIC ENGINEERING RESEARCH INFRASTRUCTURES FOR EUROPEAN SYNERGIES, Full-scale experimental
validation of dual eccentrically braced frame with removable links
Author(s): Gabriel-Alexandru Sabau, Martin Poljansek, Fabio Taucer, Pierre Pegon, Francisco-Javier Molina, Daniel
Tirelli, Bernard Viaccoz, Aurel Stratan, Adriana Ioan-Chesoan, Dan Dubina
Luxembourg: Publications Office of the European Union
2014 – 147 pp. – 21.0 x 29.7 cm
EUR – Scientific and Technical Research series – ISSN 1831-9424 (online)
ISBN 978-92-79-44717-4 (PDF)
doi: 10.2788/539418

ISBN 978-92-79-44717-4
doi: 10.2788/539418
JRC Mission
As the Commission’s
in-house science service,
the Joint Research Centre’s
mission is to provide EU
policies with independent,
evidence-based scientific
and technical support
throughout the whole
policy cycle.
Working in close
cooperation with policy
Directorates-General,
the JRC addresses key
societal challenges while
stimulating innovation
through developing
new methods, tools
and standards, and sharing
its know-how with
the Member States,
the scientific community
and international partners.
Serving society Stimulating innovation Supporting legislation
LB
-NA
-270
30-E
N-N