Embed Size (px)
Citation preview
8/3/2019 Seismic Monitoring of the Olkaria Geothermal Area, Kenya Rift
http://slidepdf.com/reader/full/seismic-monitoring-of-the-olkaria-geothermal-area-kenya-rift 1/12
Ž .Journal of Volcanology and Geothermal Research 95 2000 197–208
www.elsevier.comrlocater jvolgeores
Seismic monitoring of the Olkaria Geothermal area, Kenya Riftvalley
Silas M. Simiyu a,), G. Randy Keller b
aKenya Electricity-Generating Company, Olkaria Geothermal Project, PO Box 785, NaiÕasha, Kenya
b Department of Geological Sciences, UniÕersity of Texas at El Paso, El Paso, TX 79968, USA
Received 14 April 1999; received in revised form 21 July 1999; accepted 21 July 1999
Abstract
Seismic monitoring of the Olkaria Geothermal area in the southern Rift Valley region of Kenya has been carried out
since 1985. The initial purpose of this effort was to determine the background level of seismicity before full exploitation of
the geothermal resource was started. This monitoring began with one seismic station. However, since May 1996, a seismic
network comprising six stations was operated and focused mainly on the East Production Field. During the 5 months of
network recording up to mid-September 1996, more than 460 local events originating within the Olkaria Geothermal areaŽ . ŽT yT -5 s were recorded, out of which 123 were well-located. Also, 62 events were recorded at regional distances 5
s p
. Ž .s-T yT -40 s , and 44 events at teleseismic distance T yT )40 s . During this period, the local microseismicity wass p s p
found to be continuous with swarms occurring every 4–5 days. Duration magnitudes based on the coda length did not
exceed 3.0. Preliminary spectral analysis shows three kinds of seismic signals, with only the first type displaying
well-defined P- and S-phases. The seismicity is mainly concentrated in the central area of the recording network, and the
linear alignments in the epicenters are striking. A prominent alignment occurs along the Ololbutot fault zone extending fromthe northern end of the greater Olkaria volcanic complex to the south near the southern terminus of Hell’s gorge. Two other
prominent alignments occur along NW–SE trends that coincide with fault zones which have been detected by geological and
gravity studies. Consequently, they are interpreted to be associated with fluid movement in the geothermal field. These
preliminary results suggest that seismic monitoring will be useful to both monitor the field during production and to help site
additional wells. q2000 Elsevier Science B.V. All rights reserved.
Keywords: Kenya Rift; geothermal exploration; seismic fault mapping; hydrothermal activity
1. Introduction
The Kenya Rift Valley is the classic example of an active continental rift. It is part of the eastern arm
of the East African rift zone, and its geologic evolu-
)
Corresponding author.Ž . E-mail addresses: [email protected] S.M. Simiyu ,
Ž [email protected] G.R. Keller .
Ž .tion has been reviewed recently by Smith 1994 andŽ .Smith and Mosley 1993 . The Olkaria Geothermal
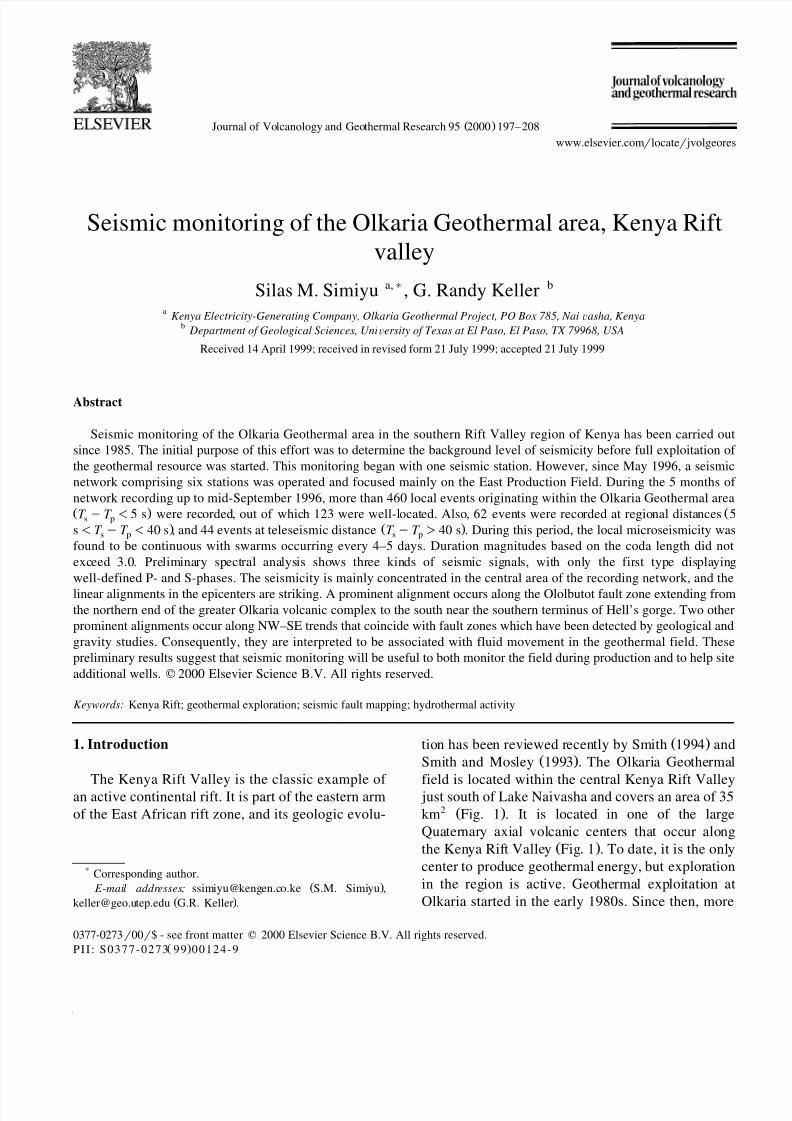
field is located within the central Kenya Rift Valley just south of Lake Naivasha and covers an area of 352 Ž .km Fig. 1 . It is located in one of the large
Quaternary axial volcanic centers that occur alongŽ .the Kenya Rift Valley Fig. 1 . To date, it is the only
center to produce geothermal energy, but exploration
in the region is active. Geothermal exploitation at
Olkaria started in the early 1980s. Since then, more
0377-0273r00r$ - see front matter q 2000 Elsevier Science B.V. All rights reserved.Ž .P I I : S 0 3 7 7 - 0 2 7 3 9 9 0 0 1 2 4 - 9
8/3/2019 Seismic Monitoring of the Olkaria Geothermal Area, Kenya Rift
http://slidepdf.com/reader/full/seismic-monitoring-of-the-olkaria-geothermal-area-kenya-rift 2/12
( )S.M. Simiyu, G.R. Keller r Journal of Volcanology and Geothermal Research 95 2000 197–208198
Fig. 1. Index map of the Kenya Rift Valley showing location of the Olkaria Geothermal area and other significant geothermal areas in the
Rift Valley of Kenya. Also shown are the rift valley lakes.
than 90 wells have been drilled, and a power plant
has been constructed that produces 45 MW, which is
6% of the national electric consumption.
The Olkaria region, an area dominated by young
volcanic rocks and where igneous activity occurredŽin the recent past Clarke and Woodhall, 1987; Mu-
.chemi, 1994; Mungania, 1995 , lies in the southern
part of the Kenya Rift Valley just SW of Lake
Ž .Naivasha. Surface mapping by Naylor 1972 identi-
fied the Olkaria volcanic area as a remnant of an old
caldera complex that has been subsequently cut by
N–S normal faulting. The faults provided the loci for
later eruptions of rhyolitic and pumice domes. Areas
of altered and warm ground are extensive throughoutŽ .the Olkaria area Glover, 1972 . Surface manifesta-
tions show a close association with dominant near
8/3/2019 Seismic Monitoring of the Olkaria Geothermal Area, Kenya Rift
http://slidepdf.com/reader/full/seismic-monitoring-of-the-olkaria-geothermal-area-kenya-rift 3/12
( )S.M. Simiyu, G.R. Keller r Journal of Volcanology and Geothermal Research 95 2000 197–208 199
N–S faults and the ring domes. The youngest lavaŽflow at Ololbutot is about 180 years BP Clarke et
.al., 1990 .
Relatively few seismic stations have been located
in East Africa, and so our knowledge of seismicity inŽ .the region is limited e.g., Fairhead and Stuart, 1982 .
Temporary seismic networks have been operated in a
few areas of the Kenya Rift Valley region and
document the presence of local centers of seismicŽ .activity Tongue et al., 1992 . In the first seismic
monitoring at Olkaria, both passive and active seis-
mic experiments were conducted by the U.S. Geo-Ž .logical Survey Hamilton et al., 1973 using an
eight-station network. Explosions were detonated in
the area to determine a velocity model and station
time corrections. Only earthquakes with body wave
magnitudes less than 2 were recorded, and the epi-
centers were mainly located along the N–S-trending
Ololbutot fault zone. Time distance plots were alsoconstructed and indicated that crystalline basement
rocks with a P-wave velocity of 6.38 kmrs underlie
the Olkaria area.
Large-scale seismic refraction profiles were
recorded across the region by the Kenya Rift Interna-Ž .tional Seismic Project KRISP in 1985 and 1990.
These data provide a good picture of the overallŽcrustal structure of the region Henry et al., 1990;
.Mechie et al., 1994 . The variations in crustal struc-
ture observed across the rift are abrupt but generally
Ž .what one would have expected Maguire et al., 1994 .However, variations in crustal structure along the rift
are surprisingly large, generally correlating with theŽelevation of the Rift Valley floor Keller et al.,
.1994 . At Lake Naivasha and Olkaria, the elevation
is about 2 km and the crust is about 35 km thick,Ž .while to the north at Lake Turkana 3.58N latitude
the average elevation is about 0.5 km and the crust is
only 22 km thick. The main source of the difference
in crustal thickness is the presence of an ;8-km-
thick layer at the base of the crust. This high-velocityŽ .;6.8 kmrs layer has been interpreted as under-
plated material which is the source of the flood
phonolite which covered much of the central portionŽ .of the rift Hay et al., 1995 . Another result of the
KRISP effort was the lack of evidence for an exten-Žsive axial dike along the Rift Valley Henry et al.,
.1990 . An axial dike was a feature common to manyŽearly models of crustal structure in the rift Swain et
Table 1
P-wave velocity model developed from the KRISP 85–90 seismicŽ .refraction data by Simiyu and Keller in review : This velocity
model was used in the location of earthquake hypocentres. Also
given are the layers thicknesses and lithology estimated from drill
hole data, geology and seismic velocity.
Layer Thickness P-wave LithologyŽ .number km velocity
1 0.2 2.0 Pyroclastics
2 0.8 3.7 Trachytesrtuffs
3 1.5 4.2 LavarintrusivesŽ .4 4.0 5.0 Fractured granite ?
5 )6.5 6.0 Crystalline basement
.al., 1994 . For the Olkaria region, the picture of
crustal structure provided by the KRISP effort has
been refined by more detailed analysis comple-
Žmented by gravity data Simiyu, 1996; Simiyu and.Keller, in review and indicates that the Olkaria area
is underlain by a five-layer upper crustal structureŽ .Table 1 . This interpreted model shows a structure
with velocities higher than the average upper crustalŽvelocities within the rift Henry et al., 1990; Mechie
.et al., 1994 , suggesting a localized igneous intrusion
associated with the volcanic field.
2. Data acquisition and processing
Monitoring of the local seismicity by the Kenya
Electricity-Generating Company started in early 1985
with one analog MEQ 800 seismic system equipped
with a vertical component sensor. Data collected by
this station up to early 1996 have been processed andŽ .discussed by Mariita et al. 1996 . These data show
that most of the events at Olkaria have body waveŽ .magnitudes m of about 2, but obviously, moreb
station coverage was needed to locate events.
From May to September of 1996, there was con-
tinuous seismic monitoring using six instruments.
The objectives of this effort were to determine the
locations and nature of the earthquakes in order to:Ž .1 Delineate zones of high fracture permeability
that may channel hot fluids from a deep heat source
to shallow levels;Ž .2 Get a better definition of the reservoir, its
recharge and the associated structures;
8/3/2019 Seismic Monitoring of the Olkaria Geothermal Area, Kenya Rift
http://slidepdf.com/reader/full/seismic-monitoring-of-the-olkaria-geothermal-area-kenya-rift 4/12
( )S.M. Simiyu, G.R. Keller r Journal of Volcanology and Geothermal Research 95 2000 197–208200
Ž .3 Evaluate the main characteristics of the local
seismic activity to define the initial state of seismic-
ity before the whole geothermal area is under full
exploitation; andŽ .4 Delineate zones of high microseismic activity
and use this as a basis for future seismic network
planning.
The network was designed to cover the geother-
mal production area with instrument locations close
enough to detect events of low magnitude. This
paper presents a qualitative description of the seis-
micity recorded from May to September of 1996 and
of its nature and relationship to specific geologic
features. It is expected that with more data and
refinement of the velocity model used in the loca-
tions, the patterns of seismic activity will become
clearer and interpretations may change.
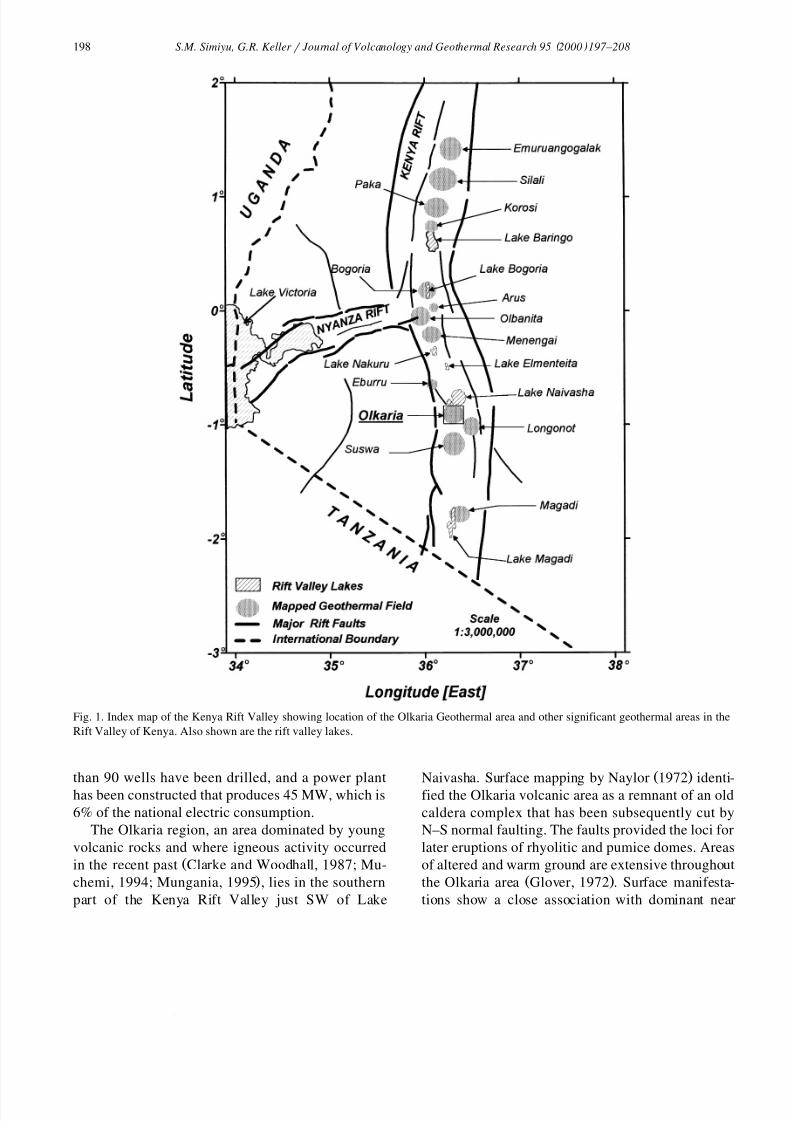
The seismic network shown in Fig. 2 was de-
signed to cover an area of about 8 km across,Ž .centered on the East Production Field EPF . Thus,
Ž .for shallow earthquakes depth-6 km , the outer
stations would record waves refracted through base-
Fig. 2. Tectonic map of the Olkaria Geothermal field area. Locations of seismographs in the networks are shown by triangles. Solid lines
show major faults and some of the production wells are shown as circles. Field divisions are shown as shaded areas; EPF, East Production
Field; OWF, Olkaria West Field; NEP, Northeast Production Field.
8/3/2019 Seismic Monitoring of the Olkaria Geothermal Area, Kenya Rift
http://slidepdf.com/reader/full/seismic-monitoring-of-the-olkaria-geothermal-area-kenya-rift 5/12
( )S.M. Simiyu, G.R. Keller r Journal of Volcanology and Geothermal Research 95 2000 197–208 201
ment rocks and the inner stations would record direct
waves traveling through the shallow layers. Given
the logistic constraints, we felt that this was an
optimal station configuration for epicentral and focal
depth determinations for the area. However, we rec-
ognize the need to have a closer-spaced network in
order to allow determination of hypocenters for
smaller earthquakes in localized areas.
The seismograph network comprised of six sta-
tions including four MEQ-800 drum recorders and
two state-of-the-art, digital Refraction TechnologyŽ .RefTek instruments. The RefTek instruments were
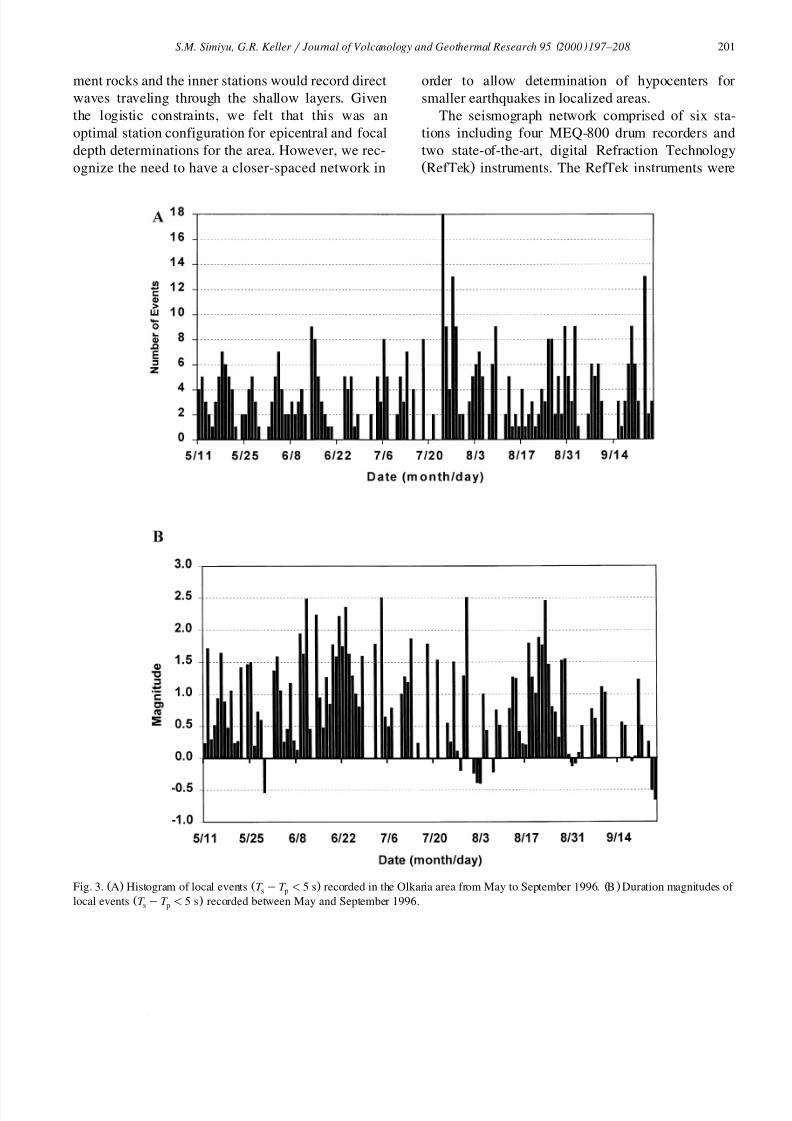
Ž . Ž . Ž .Fig. 3. A Histogram of local events T yT -5 s recorded in the Olkaria area from May to September 1996. B Duration magnitudes of s p
Ž .local events T yT -5 s recorded between May and September 1996.s p
8/3/2019 Seismic Monitoring of the Olkaria Geothermal Area, Kenya Rift
http://slidepdf.com/reader/full/seismic-monitoring-of-the-olkaria-geothermal-area-kenya-rift 6/12
( )S.M. Simiyu, G.R. Keller r Journal of Volcanology and Geothermal Research 95 2000 197–208202
equipped with GURALP three-component broadband
sensors and digital GPS timing systems. Using the
GPS, output through a laptop computer provided the
timing on the MEQ-800s. Station locations were
determined using a hand-held GPS system which
also provided grid coordinates that were converted to
geographical coordinates for use in the hypocenter
determination computer program.
The MEQ-800 instruments recorded continuouslyŽ .at high speed 30 mmrmin . The analog records
were scanned to identify earthquakes and to note
their time of occurrence. The events identified were
photographically enlarged in order to provide accu-
rate picks of the arrival times. The P- and S-waveŽ .arrival times T and T , respectively read from thep s
sections were entered manually into the PCSUDS
program that included the HYPO71 package forŽepicenter and hypocenter location Lee and Lahr,
.1975 . The RefTek data were downloaded directlyfrom the instruments onto a PC and converted from
the RefTek format to the PCSUDS format using the
package provided by the instrument manufacturers.
The data were processed, events were identified,
located and then classified into three categories:Ž . Ž .1 Local events T yT -5 s ;s p
Ž . Ž .2 Regional events 5 s-T yT -40 s ; ands p
Ž . Ž .3 Teleseismic events T yT )40 s .s p
A histogram for local events is shown in Fig. 3.
The daily rate of local seismicity ranges, on average,
from zero to five microearthquakes per day withŽ .small peaks greater than five events over periods of
about 4–7 days, corresponding to swarms of events
with linear alignments in space and time.
In the absence of any specific magnitude formula
determined for the southern Rift Valley of Kenya,Ž .we used the formula given by Lee and Lahr 1975
to derive duration magnitudes:
M s0.97q2log c q0.00325d ,Ž .
Ž .where d is the epicenter distance km and c is theŽ .duration of the event coda s .
The daily average magnitudes of local events are
also shown in Fig. 3. The continuous character of
seismicity is clear. There were no duration magni-
tudes greater than 3.0, but magnitudes around 2.0
occurred regularly. Negative magnitudes were also
detected in areas with very low noise levels. Epicen-
ters and hypocenters for events with clear P- and
S-wave onset were determined with the computerŽ .program, HYPO71 Lee and Lahr, 1975 . The five-
Ž .layer model Table 1 was used to determine the
locations and was based on the calibration shots of Ž .Hamilton et al. 1973 and the KRISP 85 and 90
Žseismic refraction results Simiyu, 1996; Simiyu and.Keller, in review .
The mean residual errors for each station showed
that the P-wave residual errors were rather high forŽ .the four MEQ-800 stations A, B, C and D because
the picks were less accurate from single-component,
analog, vertical records. The S-wave picking errors
were also very large on the single-component verti-
cal records. The residual errors are low on the RefTek
instruments since the P- and S-wave arrival times
were more accurately picked on the broadband,
Ž .three-component data Table 2 . The mean locationerrors that were estimated by HYPO71 for the 123
local events are as follows:
Horizontal error: 0.32 km;
Vertical error: 0.67 km; and
RMS error in arrival times: 19.35 ms.
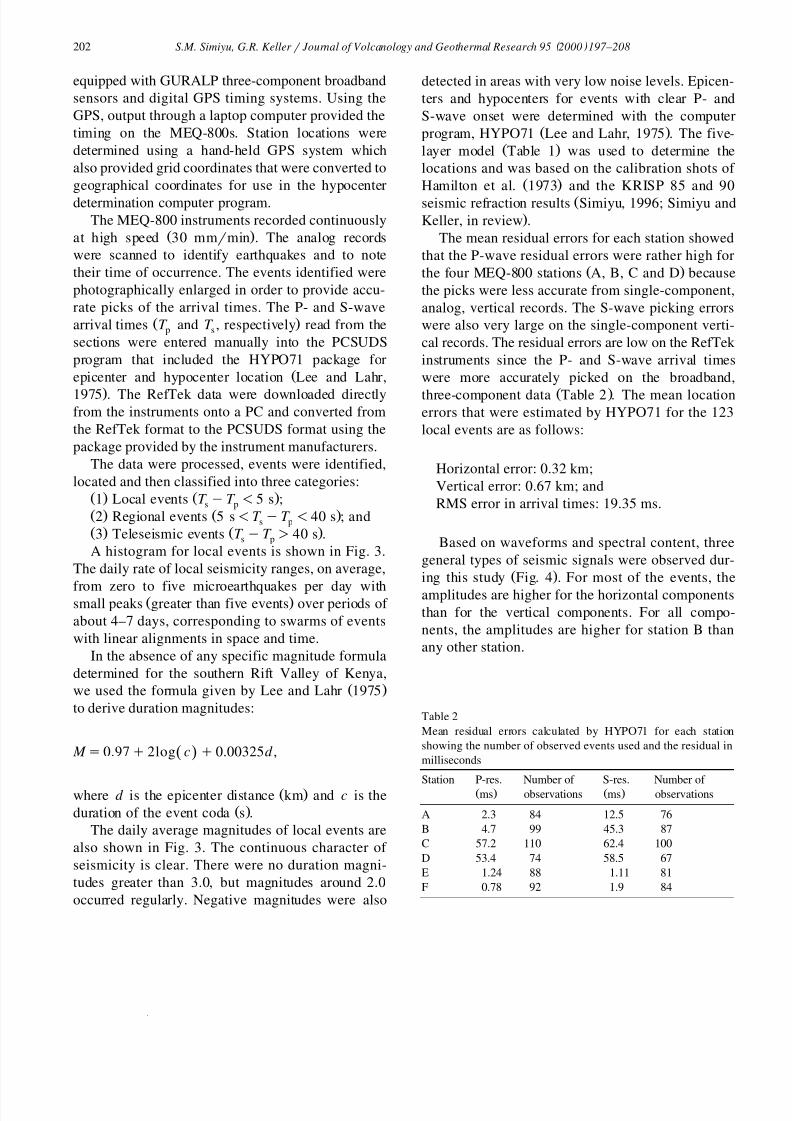
Based on waveforms and spectral content, three
general types of seismic signals were observed dur-Ž .ing this study Fig. 4 . For most of the events, the
amplitudes are higher for the horizontal componentsthan for the vertical components. For all compo-
nents, the amplitudes are higher for station B than
any other station.
Table 2
Mean residual errors calculated by HYPO71 for each station
showing the number of observed events used and the residual in
milliseconds
Station P-res. Number of S-res. Number of Ž . Ž .ms observations ms observations
A 2.3 84 12.5 76
B 4.7 99 45.3 87
C 57.2 110 62.4 100
D 53.4 74 58.5 67
E 1.24 88 1.11 81
F 0.78 92 1.9 84
8/3/2019 Seismic Monitoring of the Olkaria Geothermal Area, Kenya Rift
http://slidepdf.com/reader/full/seismic-monitoring-of-the-olkaria-geothermal-area-kenya-rift 7/12
( )S.M. Simiyu, G.R. Keller r Journal of Volcanology and Geothermal Research 95 2000 197–208 203
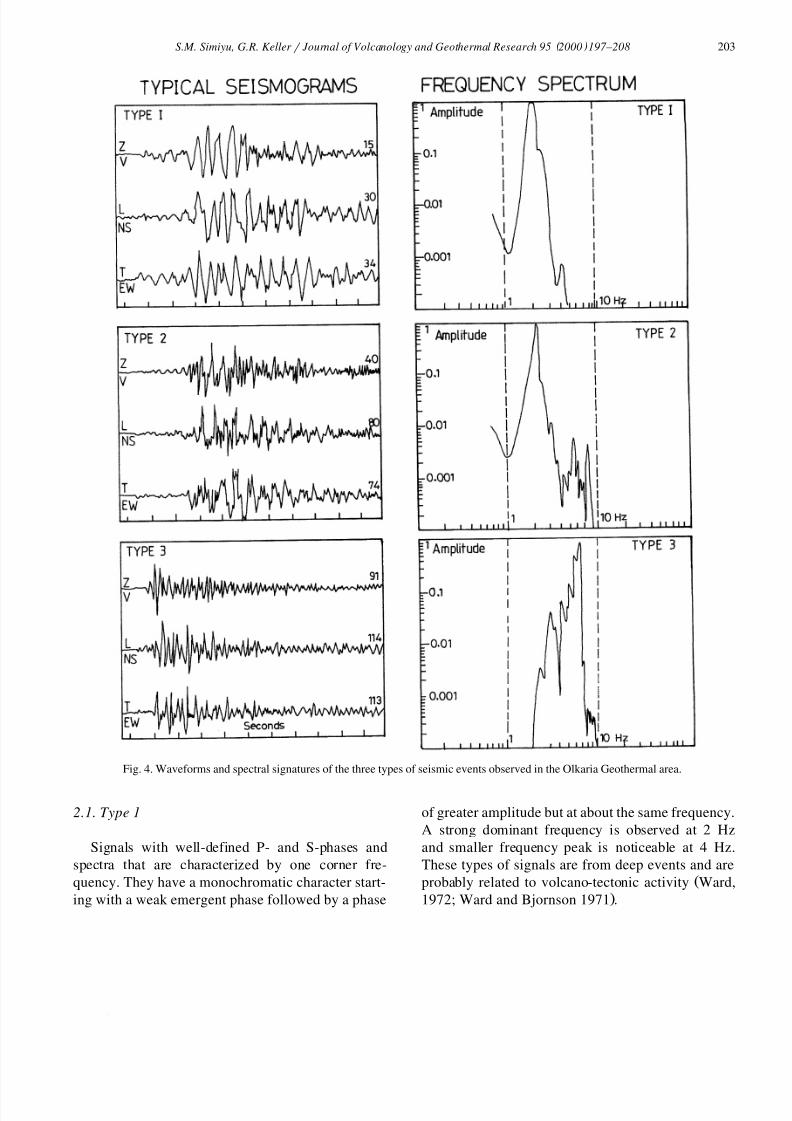
Fig. 4. Waveforms and spectral signatures of the three types of seismic events observed in the Olkaria Geothermal area.
2.1. Type 1
Signals with well-defined P- and S-phases and
spectra that are characterized by one corner fre-
quency. They have a monochromatic character start-
ing with a weak emergent phase followed by a phase
of greater amplitude but at about the same frequency.
A strong dominant frequency is observed at 2 Hz
and smaller frequency peak is noticeable at 4 Hz.
These types of signals are from deep events and areŽprobably related to volcano-tectonic activity Ward,
.1972; Ward and Bjornson 1971 .
8/3/2019 Seismic Monitoring of the Olkaria Geothermal Area, Kenya Rift
http://slidepdf.com/reader/full/seismic-monitoring-of-the-olkaria-geothermal-area-kenya-rift 8/12
( )S.M. Simiyu, G.R. Keller r Journal of Volcanology and Geothermal Research 95 2000 197–208204
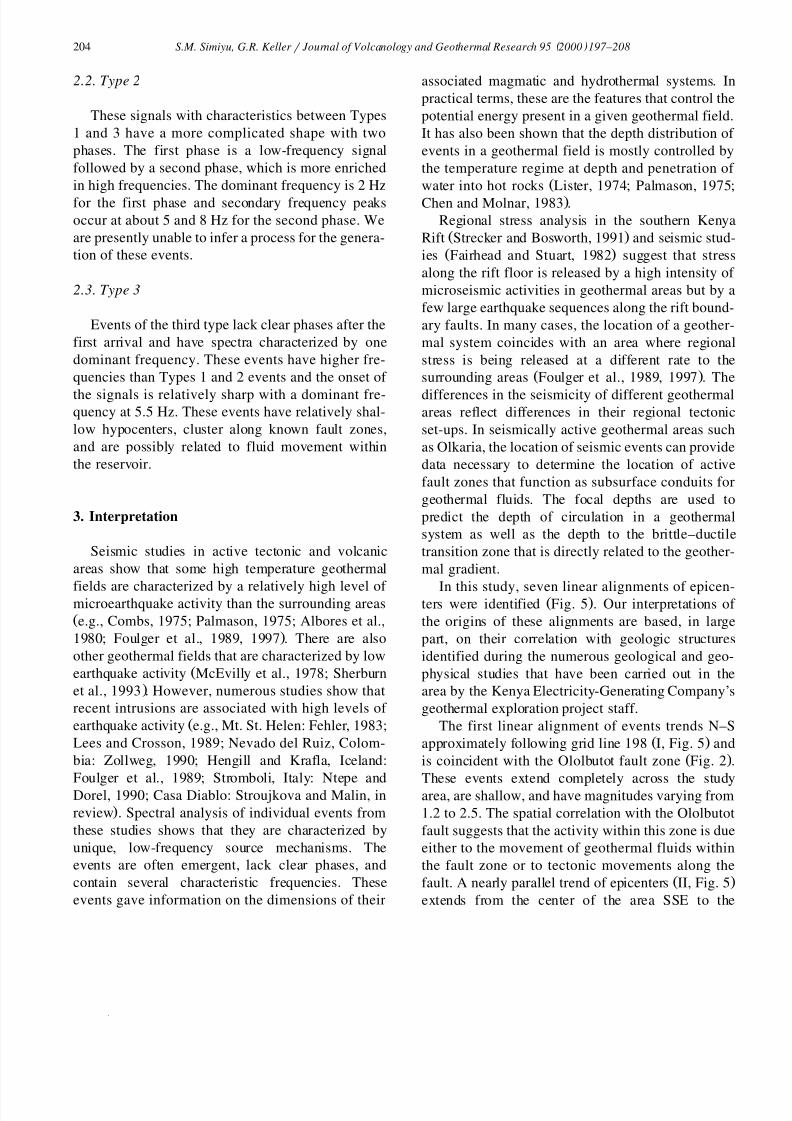
2.2. Type 2
These signals with characteristics between Types
1 and 3 have a more complicated shape with two
phases. The first phase is a low-frequency signal
followed by a second phase, which is more enriched
in high frequencies. The dominant frequency is 2 Hz
for the first phase and secondary frequency peaks
occur at about 5 and 8 Hz for the second phase. We
are presently unable to infer a process for the genera-
tion of these events.
2.3. Type 3
Events of the third type lack clear phases after the
first arrival and have spectra characterized by one
dominant frequency. These events have higher fre-
quencies than Types 1 and 2 events and the onset of
the signals is relatively sharp with a dominant fre-quency at 5.5 Hz. These events have relatively shal-
low hypocenters, cluster along known fault zones,
and are possibly related to fluid movement within
the reservoir.
3. Interpretation
Seismic studies in active tectonic and volcanic
areas show that some high temperature geothermal
fields are characterized by a relatively high level of microearthquake activity than the surrounding areasŽe.g., Combs, 1975; Palmason, 1975; Albores et al.,
.1980; Foulger et al., 1989, 1997 . There are also
other geothermal fields that are characterized by lowŽearthquake activity McEvilly et al., 1978; Sherburn
.et al., 1993 . However, numerous studies show that
recent intrusions are associated with high levels of Žearthquake activity e.g., Mt. St. Helen: Fehler, 1983;
Lees and Crosson, 1989; Nevado del Ruiz, Colom-
bia: Zollweg, 1990; Hengill and Krafla, Iceland:
Foulger et al., 1989; Stromboli, Italy: Ntepe and
Dorel, 1990; Casa Diablo: Stroujkova and Malin, in.review . Spectral analysis of individual events from
these studies shows that they are characterized by
unique, low-frequency source mechanisms. The
events are often emergent, lack clear phases, and
contain several characteristic frequencies. These
events gave information on the dimensions of their
associated magmatic and hydrothermal systems. In
practical terms, these are the features that control the
potential energy present in a given geothermal field.
It has also been shown that the depth distribution of
events in a geothermal field is mostly controlled by
the temperature regime at depth and penetration of Žwater into hot rocks Lister, 1974; Palmason, 1975;
.Chen and Molnar, 1983 .
Regional stress analysis in the southern KenyaŽ .Rift Strecker and Bosworth, 1991 and seismic stud-
Ž .ies Fairhead and Stuart, 1982 suggest that stress
along the rift floor is released by a high intensity of
microseismic activities in geothermal areas but by a
few large earthquake sequences along the rift bound-
ary faults. In many cases, the location of a geother-
mal system coincides with an area where regional
stress is being released at a different rate to theŽ .surrounding areas Foulger et al., 1989, 1997 . The
differences in the seismicity of different geothermalareas reflect differences in their regional tectonic
set-ups. In seismically active geothermal areas such
as Olkaria, the location of seismic events can provide
data necessary to determine the location of active
fault zones that function as subsurface conduits for
geothermal fluids. The focal depths are used to
predict the depth of circulation in a geothermal
system as well as the depth to the brittle–ductile
transition zone that is directly related to the geother-
mal gradient.
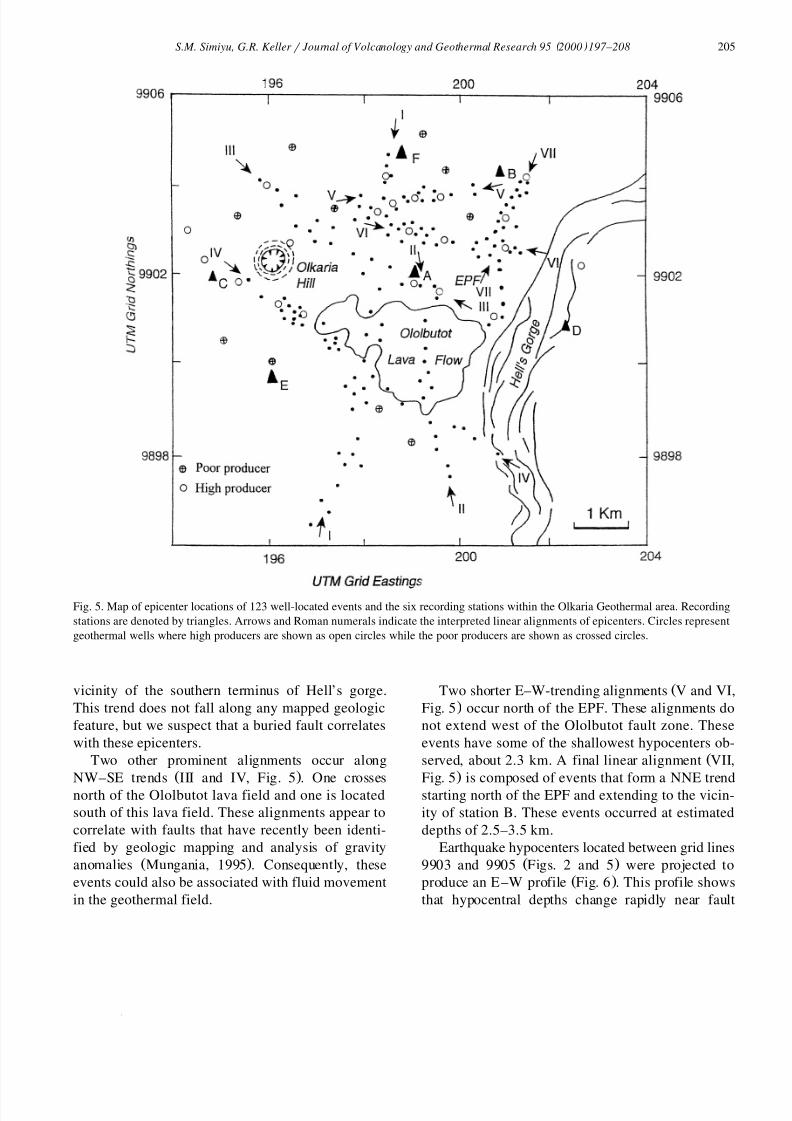
In this study, seven linear alignments of epicen-Ž .ters were identified Fig. 5 . Our interpretations of
the origins of these alignments are based, in large
part, on their correlation with geologic structures
identified during the numerous geological and geo-
physical studies that have been carried out in the
area by the Kenya Electricity-Generating Company’s
geothermal exploration project staff.
The first linear alignment of events trends N–SŽ .approximately following grid line 198 I, Fig. 5 and
Ž .is coincident with the Ololbutot fault zone Fig. 2 .
These events extend completely across the studyarea, are shallow, and have magnitudes varying from
1.2 to 2.5. The spatial correlation with the Ololbutot
fault suggests that the activity within this zone is due
either to the movement of geothermal fluids within
the fault zone or to tectonic movements along theŽ .fault. A nearly parallel trend of epicenters II, Fig. 5
extends from the center of the area SSE to the
8/3/2019 Seismic Monitoring of the Olkaria Geothermal Area, Kenya Rift
http://slidepdf.com/reader/full/seismic-monitoring-of-the-olkaria-geothermal-area-kenya-rift 9/12
( )S.M. Simiyu, G.R. Keller r Journal of Volcanology and Geothermal Research 95 2000 197–208 205
Fig. 5. Map of epicenter locations of 123 well-located events and the six recording stations within the Olkaria Geothermal area. Recording
stations are denoted by triangles. Arrows and Roman numerals indicate the interpreted linear alignments of epicenters. Circles represent
geothermal wells where high producers are shown as open circles while the poor producers are shown as crossed circles.
vicinity of the southern terminus of Hell’s gorge.
This trend does not fall along any mapped geologic
feature, but we suspect that a buried fault correlates
with these epicenters.
Two other prominent alignments occur alongŽ .NW–SE trends III and IV, Fig. 5 . One crosses
north of the Ololbutot lava field and one is located
south of this lava field. These alignments appear to
correlate with faults that have recently been identi-
fied by geologic mapping and analysis of gravityŽ .anomalies Mungania, 1995 . Consequently, these
events could also be associated with fluid movement
in the geothermal field.
ŽTwo shorter E–W-trending alignments V and VI,.Fig. 5 occur north of the EPF. These alignments do
not extend west of the Ololbutot fault zone. These
events have some of the shallowest hypocenters ob-Žserved, about 2.3 km. A final linear alignment VII,
.Fig. 5 is composed of events that form a NNE trend
starting north of the EPF and extending to the vicin-
ity of station B. These events occurred at estimated
depths of 2.5–3.5 km.
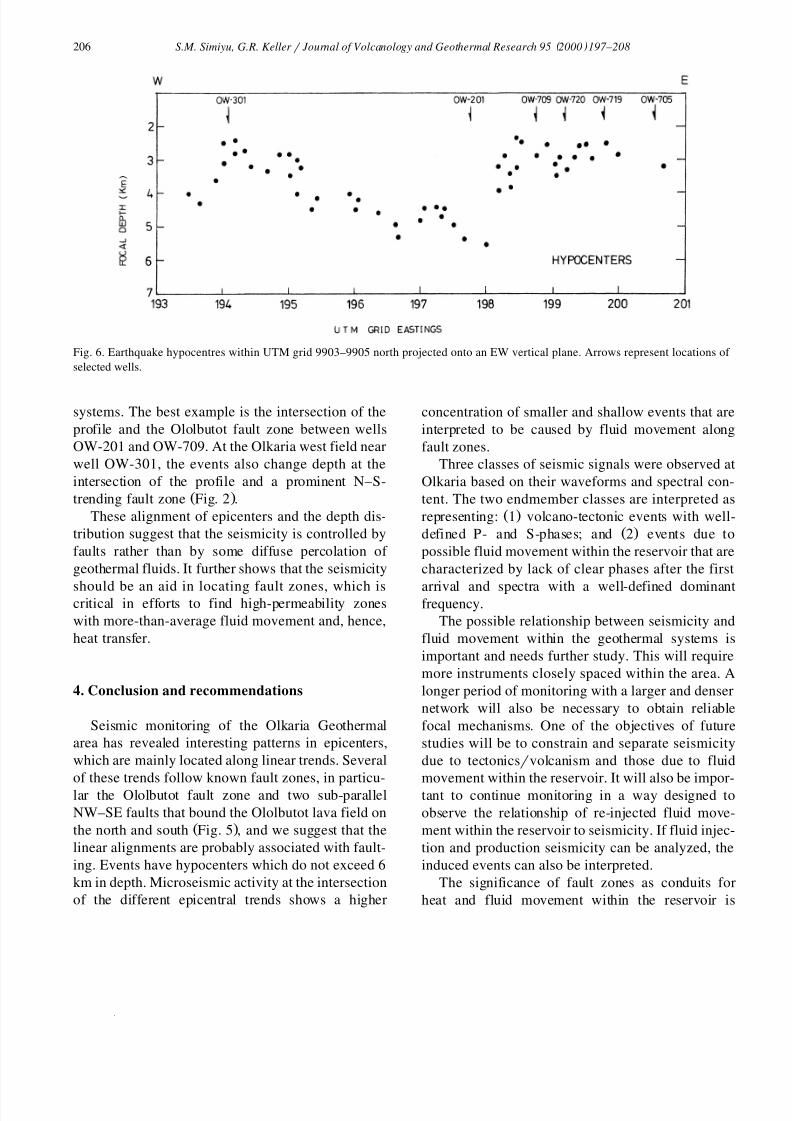
Earthquake hypocenters located between grid linesŽ .9903 and 9905 Figs. 2 and 5 were projected to
Ž .produce an E –W profile Fig. 6 . This profile shows
that hypocentral depths change rapidly near fault
8/3/2019 Seismic Monitoring of the Olkaria Geothermal Area, Kenya Rift
http://slidepdf.com/reader/full/seismic-monitoring-of-the-olkaria-geothermal-area-kenya-rift 10/12
( )S.M. Simiyu, G.R. Keller r Journal of Volcanology and Geothermal Research 95 2000 197–208206
Fig. 6. Earthquake hypocentres within UTM grid 9903–9905 north projected onto an EW vertical plane. Arrows represent locations of
selected wells.
systems. The best example is the intersection of the
profile and the Ololbutot fault zone between wells
OW-201 and OW-709. At the Olkaria west field near
well OW-301, the events also change depth at the
intersection of the profile and a prominent N–S-Ž .trending fault zone Fig. 2 .
These alignment of epicenters and the depth dis-
tribution suggest that the seismicity is controlled by
faults rather than by some diffuse percolation of
geothermal fluids. It further shows that the seismicity
should be an aid in locating fault zones, which iscritical in efforts to find high-permeability zones
with more-than-average fluid movement and, hence,
heat transfer.
4. Conclusion and recommendations
Seismic monitoring of the Olkaria Geothermal
area has revealed interesting patterns in epicenters,
which are mainly located along linear trends. Several
of these trends follow known fault zones, in particu-
lar the Ololbutot fault zone and two sub-parallel
NW–SE faults that bound the Ololbutot lava field onŽ .the north and south Fig. 5 , and we suggest that the
linear alignments are probably associated with fault-
ing. Events have hypocenters which do not exceed 6
km in depth. Microseismic activity at the intersection
of the different epicentral trends shows a higher
concentration of smaller and shallow events that are
interpreted to be caused by fluid movement along
fault zones.
Three classes of seismic signals were observed at
Olkaria based on their waveforms and spectral con-
tent. The two endmember classes are interpreted asŽ .representing: 1 volcano-tectonic events with well-
Ž .defined P- and S-phases; and 2 events due to
possible fluid movement within the reservoir that are
characterized by lack of clear phases after the first
arrival and spectra with a well-defined dominantfrequency.
The possible relationship between seismicity and
fluid movement within the geothermal systems is
important and needs further study. This will require
more instruments closely spaced within the area. A
longer period of monitoring with a larger and denser
network will also be necessary to obtain reliable
focal mechanisms. One of the objectives of future
studies will be to constrain and separate seismicity
due to tectonicsrvolcanism and those due to fluid
movement within the reservoir. It will also be impor-
tant to continue monitoring in a way designed to
observe the relationship of re-injected fluid move-
ment within the reservoir to seismicity. If fluid injec-
tion and production seismicity can be analyzed, the
induced events can also be interpreted.
The significance of fault zones as conduits for
heat and fluid movement within the reservoir is
8/3/2019 Seismic Monitoring of the Olkaria Geothermal Area, Kenya Rift
http://slidepdf.com/reader/full/seismic-monitoring-of-the-olkaria-geothermal-area-kenya-rift 11/12
( )S.M. Simiyu, G.R. Keller r Journal of Volcanology and Geothermal Research 95 2000 197–208 207
clearly shown by the presence of shallow type 3
events. Wells drilled in these zones have the largest
mass output. Future studies should aid in the delin-
eation of such zones as targets for drilling high fluid
producing wells.
Acknowledgements
We wish to thank Mr. Hudson I. Viele, Elvis O.
Oduong and Tom K. Mboya of KenGen for working
tirelessly to collect data both before and during the
period of this study. Special thanks are due to the
Geothermal Development Manager and the Chief
Geothermal Scientist for their support. Many thanks
to Drs. G.R. Raquemore and A.W. Hurst for their
constructive reviews of the original manuscript. Our
grateful thanks are extended to Dr. Jeff Karson forhis informal review that led to the improvement of
this paper. The Department of Geological Sciences,
University of Texas at El Paso provided the RefTek
seismic instruments as part of its participation in the
Kenya Rift International Seismic Project which was
funded by the Continental Dynamics Program of the
U.S. National Science Foundation.
References
Albores, A., Reyes, A., Brune, J.N., Gonzalez, J., Garcilazo, F.,
Suarez, F., 1980. Seismicity studies in the region of the Cerro
Prieto geothermal field. Geothermics 9, 65–77.
Chen, W.P., Molnar, P., 1983. Focal depths of intracontinental
and intraplate earthquakes and their implications for the ther-
mal and mechanical properties of the lithosphere. J. Geophys.
Res. 88, 4183–4214.
Clarke, M.C.G., Woodhall, D.G., 1987. Geological and geother-
mal mapping. British Geological Survey, Exploration for
Geothermal Energy Project, Progress report BGSKENr2, 135
pp.
Combs, J., 1975. Geophysical techniques in geothermal explo-
ration. Proceedings of the 2nd Symposium Development and
Use Geothermal Resources 1, 95–99.
Fairhead, J.D., Stuart, G.W., 1982. The seismicity of the East
African rift system and comparison with other continentalŽ .rifts. In: Palmason, G. Ed. , Continental Rifts. Geodynamic
Series 8 American Geophysical Union, Washington, DC, pp.
41–61.
Fehler, M., 1983. Observation of volcanic tremor on Mount St.
Helen volcano. J. Geophys. Res. 88, 3476–3484.
Foulger, G.R., Long, R.E., Einarsson, P., 1989. Implosive earth-
quakes at the active plate boundaries in Iceland. Nature 337,
640–642.
Foulger, G.R., Grant, C.C., Ross, A., Julian, B.R., 1997. Industri-
ally induced changes in Earth structure at the Geysers geother-Ž .mal area, California. Geophys. Res. Lett. 24 2 , 135–137.
Hamilton, R.M., Smith, B.E., Knapp, F., 1973. Earthquakes in
geothermal areas near Lake Naivasha and Hannington. United
States Geological Survey, Unpublished report UNDPrEAPL,231 pp.
Hay, D.E., Wendlandt, R.F., Keller, G.R., 1995. The origin of
Kenya Rift plateau-type flood phonolite: integrated petrologic
and geophysical constraints on the evolution of the crust and
upper mantle beneath the Kenya Rift. J. Geophys Res. 100,
10549–10557.
Henry, W.J., Mechie, J., Maguire, P.K.H., Khan, M.A., Prodehl,
C., Keller, G.R., Patel, J.P., 1990. A seismic investigation of
the Kenya Rift valley. Geophys J. Int. 100, 107–130.
Keller, G.R., Prodehl, C., Mechie, J., Fuchs, K., Khan, M.A.,
Maguire, P.K.H., Mooney, W.D., Achauer, U., Davis, P.M.,
Meyer, R.P., Braile, L.W., Nyambok, I.O., Thompson, G.A.,
1994. The East African rift system in the light KRISP 90. In:Ž .C., Keller, G.R., Khan, M.A. Eds. , Crustal and Upper Man-
tle Structure of the Kenya Rift. Prodehl, Tectonophysics 236,
465–483.Ž .Lee, W.H.K., Lahr, J.C., 1975. HYPO 71 revised : a computer
program for determining hypocenter, magnitude and first mo-
tion pattern of local earthquakes. U.S. Geol. Surv., Open File
Rep. 75-311, 16 pp.
Lees, J.M., Crosson, R.S., 1989. Tomographic inversion for
three-dimensional velocity structure at Mt. St. Helen using
earthquake data. J. Geophys. Res. 94, 5716–5728.
Lister, R.G.B., 1974. On the penetration of water into hot rock.
Geophys. J.R. Astron. Soc. 39, 465– 501.
Maguire, P.K.H., Swain, C.J., Masotti, R., Khan, M.A., 1994. A
crustal and uppermost mantle cross-sectional model of theKenya Rift derived from seismic and gravity data. In: C.,
Ž .Keller, G.R., Khan, M.A. Eds. , Crustal and Upper Mantle
Structure of the Kenya Rift. Prodehl, Tectonophysics 236,
217–249.
Mariita, O.N., Otieno, C.O., Shako, J.W., 1996. Microseismic
monitoring at the Olkaria Geothermal field, Kenya. Kenya
Power, Unpublished Report, 15 pp.
McEvilly, T.V., Schechter, B., Majer, E.L., 1978. East Mesa
seismic study. Annual Report, Earth Sciences Division,
Lawrence Berkeley Laboratory, University of California, pp.
26–28.
Mechie, J., Keller, G.R., Prodehl, C., Gaciri, S., Braile, L.W.,
Mooney, W.D., Gajewski, D., Sandmeier, K.J., 1994. Crustal
structure beneath the Kenya Rift from axial profile data. In:Ž .C., Keller, G.R., Khan, M.A. Eds. , Crustal and Upper Man-
tle Structure of the Kenya Rift. Prodehl, Tectonophysics 236,
179–199.
Muchemi, G.G., 1994. Geological interpretation of the Olkaria
North East field. KenGen Internal Report, 25 pp.
Mungania, J., 1995. Tephra deposits in Olkaria and the surround-
ing areas. Kenya Power, Unpublished Report, 7 pp.
8/3/2019 Seismic Monitoring of the Olkaria Geothermal Area, Kenya Rift
http://slidepdf.com/reader/full/seismic-monitoring-of-the-olkaria-geothermal-area-kenya-rift 12/12
( )S.M. Simiyu, G.R. Keller r Journal of Volcanology and Geothermal Research 95 2000 197–208208
Naylor, J., 1972. The geology of the Olkaria and Eburru prospects,
UNDPrKEN-GOVT Report No. UNDPrKEN-125r1640r72.
Ntepe, N., Dorel, J., 1990. Observations of seismic volcanicŽ .signals at Stromboli volcano Italy . J. Volcanol. Geotherm.
Res. 43, 235–251.
Palmason, G., 1975. Geophysical methods in geothermal explo-
ration. In: Proceedings of the 2nd Symposium on the Develop-
ment and Use of Geothermal Resources, San Francisco. pp.
1175–1184.Sherburn, S., Clotworthy, A., Hunt, T., 1993. No induced seismic
activity at Ohaaki geothermal field. In: Proceedings of the
15th NZ Geothermal Workshop. pp. 201–2054.
Simiyu, S.M., 1996. Integrated geophysical study of the crustal
structure of the southern Kenya Rift. PhD Dissertation, Uni-
versity Texas El Paso, 240 pp.
Simiyu, S.M., Keller, R.G., in review. Seismic and gravity inter-
pretation of the shallow crustal structure in the Southern
Kenya Rift Valley., Geophys J. Int.
Smith, M., 1994. Stratigraphic and structural constraints on mech-
anisms of active rifting in the Gregory Rift, Kenya. In: C.,Ž .Keller, G.R., Khan, M.A. Eds. , Crustal and Upper Mantle
Structure of the Kenya Rift. Prodehl, Tectonophysics 236,
3–22.
Smith, M., Mosley, P.N., 1993. Crustal heterogeneity and base-
ment influence on the development of the Kenya Rift, East
Africa. Tectonics 12, 591–606.
Strecker, M., Bosworth, W., 1991. Quaternary stress-field changes
in Gregory rift, Kenya. EOS Trans., AGU 72, 3.
Stroujkova, A.F., Malin, P.E., in review. A magma mass beneath
Casa Diablo? Further evidence from seismic reflected waves.
Bull. Seismol. Soc. Am., in review.
Swain, C.J., Maguire, P.K.H., Khan, M.A., 1994. Geophysical
experiments and models of the Kenya Rift before 1989. In: C.,Ž .Keller, G.R., Khan, M.A. Eds. , Crustal and Upper Mantle
Structure of the Kenya Rift. Prodehl, Tectonophysics 236
23–32.
Tongue, J.A., Maguire, P.K.H., Young, P.A.V., 1992. Seismicity
distribution from temporary earthquake recording networks in
Kenya. Tectonophysics 204, 71–79.
Ward, P.L., 1972. Microearthquakes: prospecting tool and possi-
ble hazard in the development of geothermal resources.
Geothermics 1, 3–4.
Ward, P.L., Bjornson, S., 1971. Microearthquakes, swarms, and
the geothermal areas of Iceland. J. Geophys. Res. 76, 3953–
3982.
Zollweg, J.E., 1990. Seismicity following the 1985 eruption of
Nevado del Ruiz Colombia. J. Volcanol. Geotherm. Res. 41,
355–367.