Embed Size (px)
Citation preview
Seismic Observations on Piled Raft Foundation with
Ground Improvement Supporting a Base-Isolated
Building
Junji HAMADA, Tomohiro TANIKAWA, Sadatomo ONIMARU &
Kiyoshi YAMASHITA Research & Development Institute, Takenaka Corporation, Japan
SUMMARY:
The purpose of this study is to clarify the seismic performance of piled raft foundations with ground
improvement based on seismic observation records. The monitored building, which is a twelve-story
base-isolated building, is located on loose silty sand underlain by soft cohesive soil in Tokyo, Japan. On March
11, 2011, the 2011 off the Pacific coast of Tohoku Earthquake struck the building site, the seismic response of
the soil-foundation-structure system was successfully recorded during the earthquake. Axial force and bending
moment of two piles, earth pressure and pore-water pressure beneath the raft, and accelerations of the ground
and structure were measured. It was found that the peak acceleration reduction of input motion caused by ground
improvement. The sectional forces of piles at the pile head and at intermediate depth were almost same behavior.
The bending moments increased during large ground deformation.
Keywords: The 2011 off the Pacific coast of Tohoku Earthquake, Pild raft foundation, Seismic observation, Pile
1. INTRODUCTION
Piled raft foundations are recognized as a considerable economy system without compromising the
safety and performance of the foundation (Poulos, 2001; Mandolini et al., 2005). A lot of experimental
and analytical studies for piled raft foundations have been conducted to investigate the settlement
behavior and the load-sharing between raft and piles for vertical loading (Katzenbach et al., 2000;
Yamashita et al., 2011a). It is necessary to develop a seismic design concept for the piled raft
foundations especially in highly active seismic areas such as Japan. In the last decade, shaking table
tests and static lateral loading tests using centrifuge model or large scale model (Watanabe et al., 2001;
Horikoshi et al., 2003; Matsumoto et al., 2004; Katzenbach & Turek, 2005; Matsumoto et al., 2010;
Hamada et al., 2011), analytical studies (Kitiyodom & Matsumoto, 2003; Hamada et al., 2009) have
been carried out. Mendoza et al. (2000) reported about static and seismic behaviour of a piled-box
foundation supporting an urban bridge in Mexico City clay, i.e. the response of the soil-foundation
system were recorded during the occurrence of two seismic events in 1997 where the maximum
horizontal acceleration of the foundation was 0.31 m/s2. However, only a few case histories exist on
the monitoring the soil-pile-structure interaction behavior during earthquakes.
The purpose of this study is to clarify the seismic performance of piled raft foundations based on
seismic observation records. The monitored building, which is a twelve-story base-isolated building, is
located on loose silty sand underlain by soft cohesive soil in Tokyo, Japan. A piled raft with ground
improvement was employed to cope with the liquefiable sand as well as to improve the bearing
capacity of the raft foundation. On March 11, 2011, the 2011 off the Pacific coast of Tohoku
Earthquake struck the building site, the seismic response of the soil-foundation-structure system was
successfully recorded during the earthquake. Axial force and bending moment of two piles, earth
pressure and pore-water pressure beneath the raft, and accelerations of the ground and structure were
measured. In this paper, the characteristics of observed seismic motion of the ground and the building
as well as the sectional forces of the piles will be discussed.
2. MONITORED BUILDING AND SOIL CONDITIONS
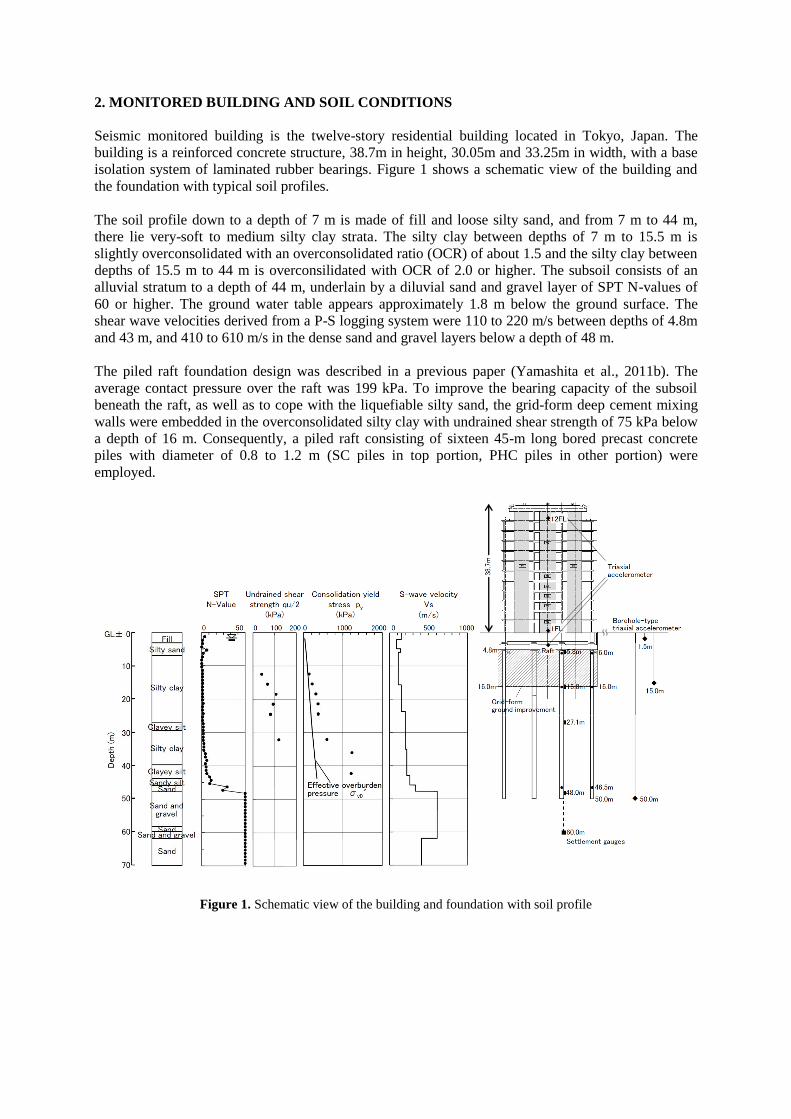
Seismic monitored building is the twelve-story residential building located in Tokyo, Japan. The
building is a reinforced concrete structure, 38.7m in height, 30.05m and 33.25m in width, with a base
isolation system of laminated rubber bearings. Figure 1 shows a schematic view of the building and
the foundation with typical soil profiles.
The soil profile down to a depth of 7 m is made of fill and loose silty sand, and from 7 m to 44 m,
there lie very-soft to medium silty clay strata. The silty clay between depths of 7 m to 15.5 m is
slightly overconsolidated with an overconsolidated ratio (OCR) of about 1.5 and the silty clay between
depths of 15.5 m to 44 m is overconsilidated with OCR of 2.0 or higher. The subsoil consists of an
alluvial stratum to a depth of 44 m, underlain by a diluvial sand and gravel layer of SPT N-values of
60 or higher. The ground water table appears approximately 1.8 m below the ground surface. The
shear wave velocities derived from a P-S logging system were 110 to 220 m/s between depths of 4.8m
and 43 m, and 410 to 610 m/s in the dense sand and gravel layers below a depth of 48 m.
The piled raft foundation design was described in a previous paper (Yamashita et al., 2011b). The
average contact pressure over the raft was 199 kPa. To improve the bearing capacity of the subsoil
beneath the raft, as well as to cope with the liquefiable silty sand, the grid-form deep cement mixing
walls were embedded in the overconsolidated silty clay with undrained shear strength of 75 kPa below
a depth of 16 m. Consequently, a piled raft consisting of sixteen 45-m long bored precast concrete
piles with diameter of 0.8 to 1.2 m (SC piles in top portion, PHC piles in other portion) were
employed.
Figure 1. Schematic view of the building and foundation with soil profile
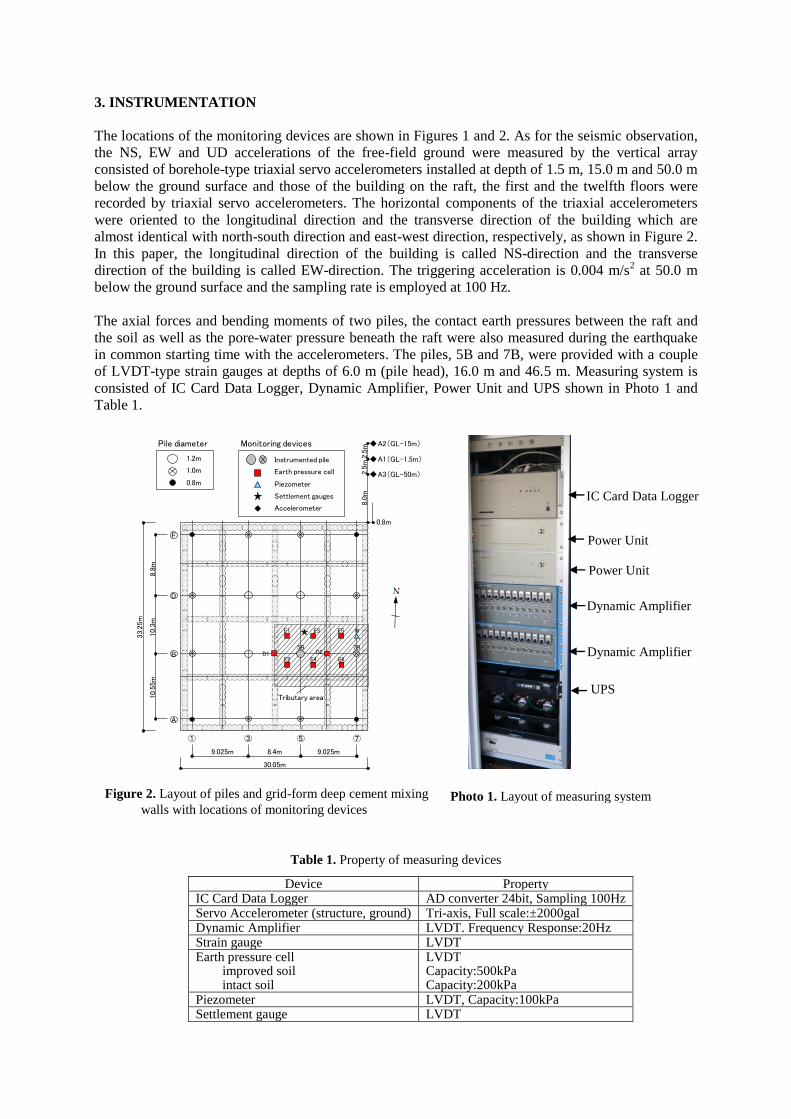
3. INSTRUMENTATION
The locations of the monitoring devices are shown in Figures 1 and 2. As for the seismic observation,
the NS, EW and UD accelerations of the free-field ground were measured by the vertical array
consisted of borehole-type triaxial servo accelerometers installed at depth of 1.5 m, 15.0 m and 50.0 m
below the ground surface and those of the building on the raft, the first and the twelfth floors were
recorded by triaxial servo accelerometers. The horizontal components of the triaxial accelerometers
were oriented to the longitudinal direction and the transverse direction of the building which are
almost identical with north-south direction and east-west direction, respectively, as shown in Figure 2.
In this paper, the longitudinal direction of the building is called NS-direction and the transverse
direction of the building is called EW-direction. The triggering acceleration is 0.004 m/s2 at 50.0 m
below the ground surface and the sampling rate is employed at 100 Hz.
The axial forces and bending moments of two piles, the contact earth pressures between the raft and
the soil as well as the pore-water pressure beneath the raft were also measured during the earthquake
in common starting time with the accelerometers. The piles, 5B and 7B, were provided with a couple
of LVDT-type strain gauges at depths of 6.0 m (pile head), 16.0 m and 46.5 m. Measuring system is
consisted of IC Card Data Logger, Dynamic Amplifier, Power Unit and UPS shown in Photo 1 and
Table 1.
Table 1. Property of measuring devices
Device Property IC Card Data Logger AD converter 24bit, Sampling 100Hz Servo Accelerometer (structure, ground) Tri-axis, Full scale:±2000gal Dynamic Amplifier LVDT. Frequency Response:20Hz Strain gauge LVDT Earth pressure cell
improved soil intact soil
LVDT Capacity:500kPa Capacity:200kPa
Piezometer LVDT, Capacity:100kPa Settlement gauge LVDT
Tributary area
9.025m8.4m9.025m
30.05m
10.5
5m
10.3
m8.8
m
33.2
5m
E1 E3
E2 E4D1 D2
E5
E6
5B 7B
① ③ ⑤ ⑦
F
D
B
A
A2(GL-15m)
A1(GL-1.5m)
A3(GL-50m)
◆
◆
◆
0.8m
2.5
m2.5
m8.0
m
Instrumented pile
Earth pressure cell
Piezometer
Settlement gauges
Accelerometer
Pile diameter
1.2m
1.0m
0.8m
Monitoring devices
◆
W
Figure 2. Layout of piles and grid-form deep cement mixing
walls with locations of monitoring devices Photo 1. Layout of measuring system
IC Card Data Logger
Power Unit
Power Unit
Dynamic Amplifier
Dynamic Amplifier
UPS

4. SEISMIC RESPONSE OF PILED RAFT FOUNDATION AND SURPERSTRUCTURE
The 2011 off the Pacific coast of Tohoku Earthquake struck the building site. The distance from the
epicenter to the building site was about 380 km. The seismic responses of the soil-structure system
were successfully recorded (Yamashita et al., 2012).
4.1. Observed Seismic Response of Foundation and Surperstructure
4.1.1. Accelerations of the ground and the structure
Figure 3 shows the time histories of the EW acceleration (the transverse direction of the building) of
the ground and the structure. Horizontal directions of the borehole-type accelerometers set in the
ground were examined and modified using long-period component of observed seismic accelerations.
The peak horizontal ground acceleration of 1.748 m/s2 was observed near the ground surface. Figure 4
shows the profiles of the maximum amplitudes of the accelerations of the ground and structures.
The peak ground acceleration in EW direction near the ground surface is 3.2 times amplified from the
depth of 50.0 m. The peak acceleration in EW direction of the first floor was 0.527 m/s2 which was
reduced to 52 % from that at the raft of 1.002 m/s2 by the base-isolation system. And also, the peak
acceleration in EW direction of the raft was reduced to 57 % from that at the ground surface of 1.748
m/s2 by the kinematic soil-foundation interaction.
Figure 5 shows the Fourier spectra of the accelerations of the ground and structures, which were
smoothed by 0.05 Hz Parzen wondow. As to the accelerations near the ground surface, a component of
the period around 1.0 second was predominant, and the responses of the superstructures, first and
twelfth floors, were amplified around 3.5 second. The natural period of the base-isolation system in
the horizontal directions of the earthquake was found to be approximately 3.5 second.
-2
0
2
0 100 200 300 400 500 600 time (sec.)
12Fmin=-0.619m/s2 max=0.548m/s2
-2
0
2
0 100 200 300 400 500 600 time (sec.)
1Fmin=-0.411m/s2 max=0.527m/s2
-2
0
2
0 100 200 300 400 500 600 time (sec.)
Pitmin=-1.002m/s2 max=0.910m/s2
-2
0
2
0 100 200 300 400 500 600 time (sec.)
GL-1.5mmin=-1.748m/s2 max=1.455m/s2
-2
0
2
0 100 200 300 400 500 600 time (sec.)
GL-15m min=-0.898m/s2 max=1.124m/s2
-2
0
2
0 100 200 300 400 500 600
GL-50mmin=-0.541m/s2 max=0.462m/s2
Time (sec.)
Acc
eler
atio
n (
m/s
2)
Figure 4. Maximum amplitude of accelerations of
the ground and structure Figure 3. Time histories of EW accelerations of the ground
and the structure
60
50
40
30
20
10
0
10
20
30
40
0.0 0.5 1.0 1.5 2.0
Heig
ht
(m)
Acceleration (m/s2)
Dep
th(m
)
△▲ NS
□■ EW
○● UD
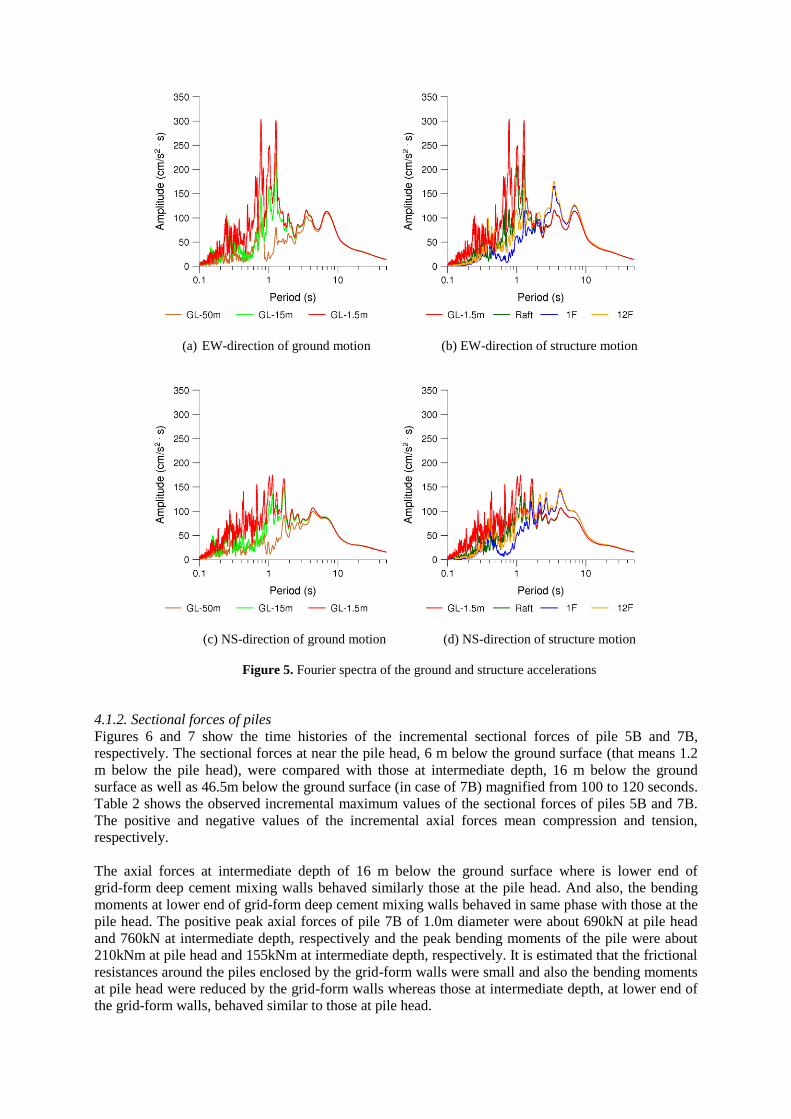
(a) EW-direction of ground motion (b) EW-direction of structure motion
(c) NS-direction of ground motion (d) NS-direction of structure motion
Figure 5. Fourier spectra of the ground and structure accelerations
4.1.2. Sectional forces of piles
Figures 6 and 7 show the time histories of the incremental sectional forces of pile 5B and 7B,
respectively. The sectional forces at near the pile head, 6 m below the ground surface (that means 1.2
m below the pile head), were compared with those at intermediate depth, 16 m below the ground
surface as well as 46.5m below the ground surface (in case of 7B) magnified from 100 to 120 seconds.
Table 2 shows the observed incremental maximum values of the sectional forces of piles 5B and 7B.
The positive and negative values of the incremental axial forces mean compression and tension,
respectively.
The axial forces at intermediate depth of 16 m below the ground surface where is lower end of
grid-form deep cement mixing walls behaved similarly those at the pile head. And also, the bending
moments at lower end of grid-form deep cement mixing walls behaved in same phase with those at the
pile head. The positive peak axial forces of pile 7B of 1.0m diameter were about 690kN at pile head
and 760kN at intermediate depth, respectively and the peak bending moments of the pile were about
210kNm at pile head and 155kNm at intermediate depth, respectively. It is estimated that the frictional
resistances around the piles enclosed by the grid-form walls were small and also the bending moments
at pile head were reduced by the grid-form walls whereas those at intermediate depth, at lower end of
the grid-form walls, behaved similar to those at pile head.
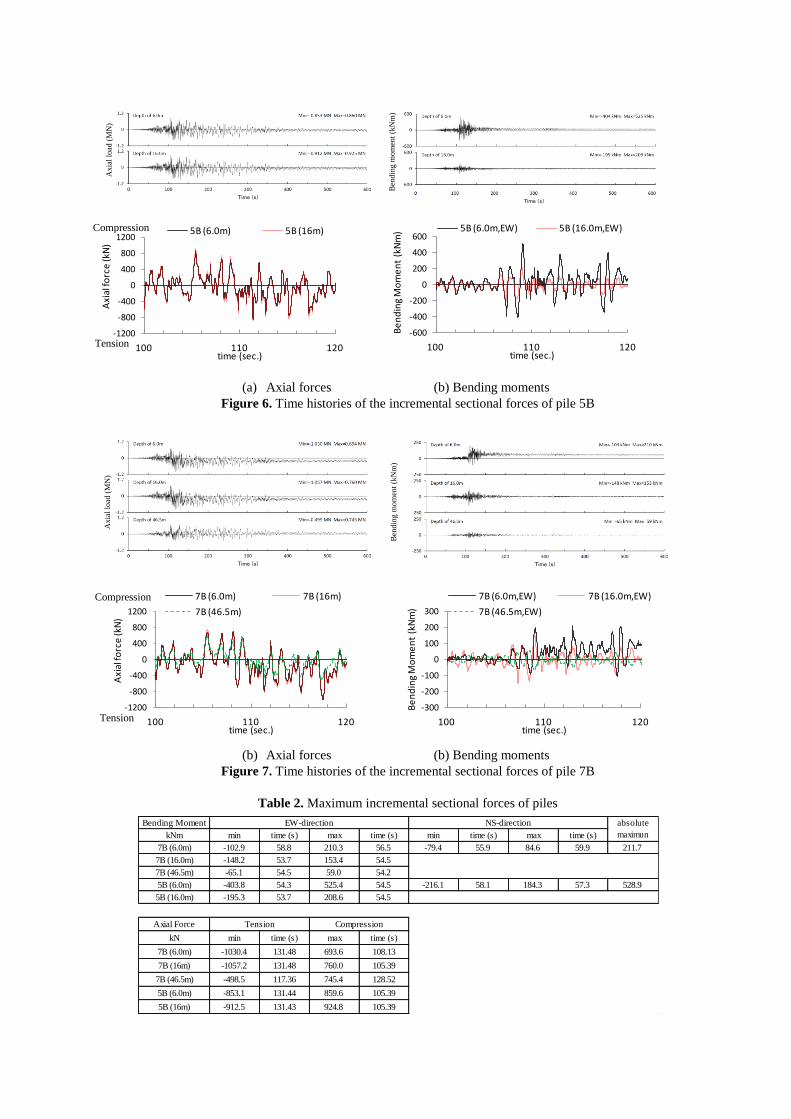
(a) Axial forces (b) Bending moments
Figure 6. Time histories of the incremental sectional forces of pile 5B
(b) Axial forces (b) Bending moments
Figure 7. Time histories of the incremental sectional forces of pile 7B
Table 2. Maximum incremental sectional forces of piles
Ben
din
g m
om
ent
(kN
m)
Axia
l lo
ad (
MN
)
Time (s)
Time (s)
Ben
din
g m
om
ent
(kN
m)
Axia
l lo
ad (
MN
)
-1200
-800
-400
0
400
800
1200
100 110 120
Axi
al fo
rce
(kN
)
time (sec.)
5B (6.0m) 5B (16m)
-1200
-800
-400
0
400
800
1200
100 110 120
Axi
al fo
rce
(kN
)
time (sec.)
7B (6.0m) 7B (16m)
7B (46.5m)
Compression
Tension
Compression
Tension
-600
-400
-200
0
200
400
600
100 110 120
Be
nd
ing
Mo
me
nt
(kN
m)
time (sec.)
5B (6.0m,EW) 5B (16.0m,EW)
-300
-200
-100
0
100
200
300
100 110 120
Be
nd
ing
Mo
me
nt
(kN
m)
time (sec.)
7B (6.0m,EW) 7B (16.0m,EW)
7B (46.5m,EW)
Bending Moment EW-direction NS-direction
kNm min time (s) max time (s) min time (s) max time (s)
7B (6.0m) -102.9 58.8 210.3 56.5 -79.4 55.9 84.6 59.9 211.7
7B (16.0m) -148.2 53.7 153.4 54.5
7B (46.5m) -65.1 54.5 59.0 54.2
5B (6.0m) -403.8 54.3 525.4 54.5 -216.1 58.1 184.3 57.3 528.9
5B (16.0m) -195.3 53.7 208.6 54.5
Axial Force Compression
kN min time (s) max time (s)
7B (6.0m) -1030.4 131.48 693.6 108.13
7B (16m) -1057.2 131.48 760.0 105.39
7B (46.5m) -498.5 117.36 745.4 128.52
5B (6.0m) -853.1 131.44 859.6 105.39
5B (16m) -912.5 131.43 924.8 105.39
absolute
maximun
Tension
Time (s)
Time (s)

4.1.3.Contact earth pressure and water pressure beneath the raft
Figure 8 shows the time histories of the incremental contact pressures between the raft and the
improved soil and those between the raft and the intact soil. The amplitudes of the incremental contact
pressures between the raft and the improved soil were significantly larger than those between the raft
and the intact soil.
The records of the earth pressure cells from E1 to E6 and D2, except for D1, were suddenly increased
after 107 to 109 seconds and residual stresses were occurred, which is generally consistent with the
records of the axial loads on pile 7B as shown in Figure 7.
The excess pore-water pressure induced during the earthquake was considerably smaller than the
contact pressures between the raft and the intact soil. The excess pore-water pressure was gradually
increased 1.2kPa one hour after the start of the event as shown in Figure 9. The aftershock of M7.6
occurred at 29 minutes after the start of the events was recorded, and excess water pressure has been
slightly increasing.
Figure 8. Time histories of contact pressures and excess pore-water pressure
Figure 9. Long term histories of excess pore-water pressure and earth pressures
Con
tact
ear
th p
ress
ure
(k
Pa)
(a) Contact pressures between raft and improved soil
(c) Excess pore-water pressure
Time(s)
-20.0
0.0
20.0
0 100 200 300 400 500 600
D1 Min=-16.59 kPa Max=14.40 kPa
-20.0
0.0
20.0
0 100 200 300 400 500 600
D2 Min=-7.69 kPa Max=14.88 kPa-10.0
0.0
10.0
0 100 200 300 400 500 600
E1 Min=-2.85 kPa Max=2.98 kPa
-10.0
0.0
10.0
0 100 200 300 400 500 600
E2 Min=-4.96 kPa Max=4.88 kPa
-10.0
10.0
0 100 200 300 400 500 600
E3 Min=-0.93 kPa Max=2.96 kPa
-10.0
0.0
10.0
0 100 200 300 400 500 600
E4 Min=-1.86 kPa Max=4.26 kPa
-10.0
0.0
10.0
0 100 200 300 400 500 600
E5 Min=-7.83 kPa Max=5.98 kPa
-10.0
0.0
10.0
0 100 200 300 400 500 600
E6 Min=-9.62 kPa Max=6.98 kPa
(b) Contact pressures between raft and intact soil
-1.0
0.0
1.0
0 100 200 300 400 500 600
GL-4.8m Min=-0.20 kPa Max=0.47 kPa
Time(s)
Time(s)
Pre
ssu
re (k
Pa)
Con
tact
ear
th p
ress
ure
(k
Pa)
Pre
ssu
re (k
Pa)
33938 sec after first record

4.2. Effects of inertial force and ground displacement on bending moment of piles
Figure 10 shows the horizontal displacements near the ground surface relative to those at a depth of 50
m versus the incremental bending moments at the pile head. The horizontal displacements were
calculated by the integration of acceleration records, where components of the period longer than 20
second and shorter than 0.05 second were cut off. The bending moments at the pile head tend to
increase with the increase in the relative horizontal displacements for both piles 5B and 7B.
Figure 11 shows the inertial force of building versus the incremental bending moments at the pile head.
The inertial force of building was estimated from multiplying the building weight by observed
accelerations on the raft, the first and the twelfth floors. The weights of the superstructure above the
isolators and the substructure under the isolators are 152MN and 41MN, respectively. Figure 12 shows
the inertial force of building versus the incremental bending moments at the pile head from 200 to 300
seconds which range is relatively minor ground surface displacement. However the bending moments
at the pile head tend to increase with the increase in the inertial force of building, the effect of the
inertial force for the bending moment of the pile head was not significant comparing with the ground
deformation. The points of Time A and B in Figures 10 and 11 correspond to times shown in Figures
13, 14 and 15.
Figure 10. Relative ground displacements vs. bending moments at pile head
Figure 11. Inertial forces vs. bending moments at pile head
Figure 12. Inertial forces vs. bending moments at pile head (200 to 300 seconds)
-250
-125
0
125
250
-10000 -5000 0 5000 10000
Inertial force of building (kN)
(b) Pile 7B (EW)
Ben
din
g m
om
ent
(kN
m)
Inertial force of building (kN)
(a) Pile 5B (EW)
Ben
din
g m
om
ent
(kN
m)
-600
-300
0
300
600
-10000 -5000 0 5000 10000
-250
-125
0
125
250
-40 -20 0 20 40
Relative displacement (mm)
(b) Pile 7B (EW)
Ben
din
g m
om
ent
(kN
m)
-600
-300
0
300
600
-40 -20 0 20 40
Relative displacement (mm)
(a) Pile 5B (EW)
Ben
din
g m
om
ent
(kN
m)
Time A: Max. Moment
Time B:
Max. Inertial Force Time B:
Max. Inertial Force
Time A:
Max. Moment
Time A: Max. Moment
Time B: Max. Inertial Force
Time A: Max. Moment
Time B:
Max. Inertial Force
-150
-75
0
75
150
-2500 -1250 0 1250 2500
Inertial force of building (kN)
(a) Pile 5B (EW)
Ben
din
g m
om
ent
(kN
m)
0
25
50
75
100
125
-2500 -1250 0 1250 2500
Inertial force of building (kN)
(b) Pile 7B (EW)
Ben
din
g m
om
ent
(kN
m)
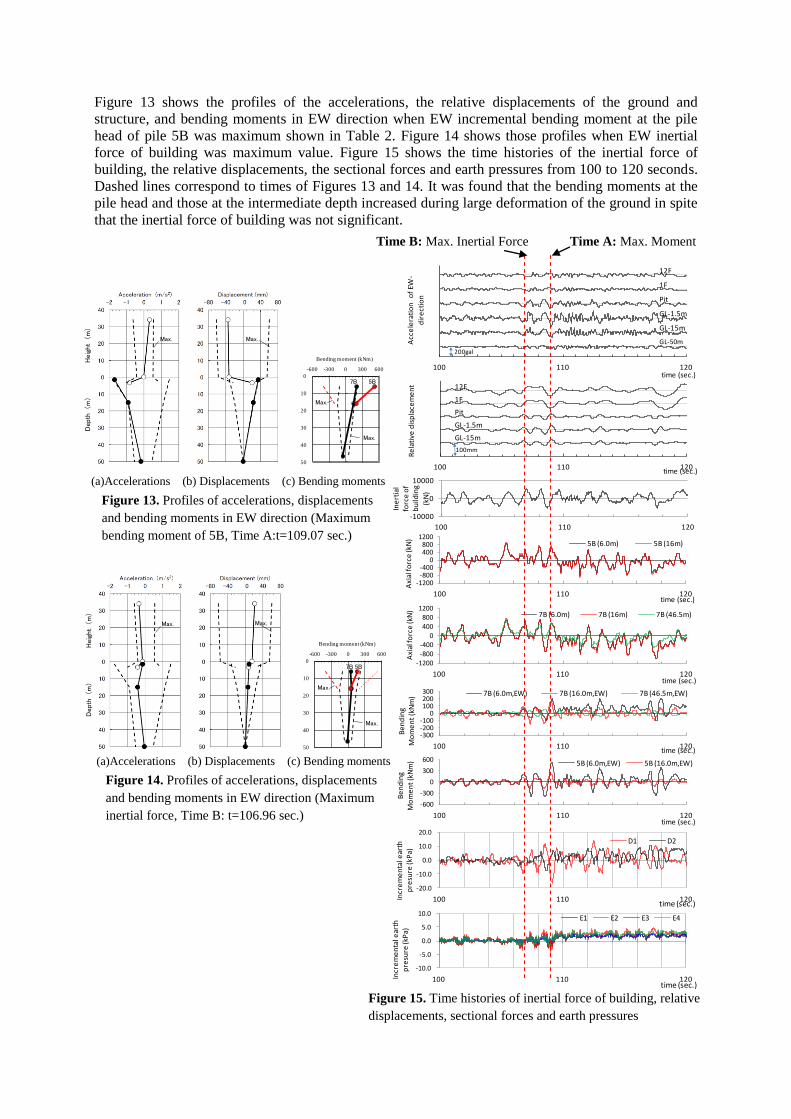
Figure 13 shows the profiles of the accelerations, the relative displacements of the ground and
structure, and bending moments in EW direction when EW incremental bending moment at the pile
head of pile 5B was maximum shown in Table 2. Figure 14 shows those profiles when EW inertial
force of building was maximum value. Figure 15 shows the time histories of the inertial force of
building, the relative displacements, the sectional forces and earth pressures from 100 to 120 seconds.
Dashed lines correspond to times of Figures 13 and 14. It was found that the bending moments at the
pile head and those at the intermediate depth increased during large deformation of the ground in spite
that the inertial force of building was not significant.
-20.0
-10.0
0.0
10.0
20.0
100 110 120 Incr
em
en
tal e
arth
p
resu
re (k
Pa)
time (sec.)
D1 D2
-10.0
-5.0
0.0
5.0
10.0
100 110 120 Incr
em
en
tal e
arth
p
resu
re (k
Pa)
time (sec.)
E1 E2 E3 E4
-1200-800-400
0400800
1200
100 110 120
Axi
al fo
rce
(kN
)
time (sec.)
7B (6.0m) 7B (16m) 7B (46.5m)
-1200-800-400
0400800
1200
100 110 120
Axi
al fo
rce
(kN
)
time (sec.)
5B (6.0m) 5B (16m)
-300-200-100
0100200300
100 110 120
Be
nd
ing
Mo
me
nt
(kN
m)
time (sec.)
7B (6.0m,EW) 7B (16.0m,EW) 7B (46.5m,EW)
-600
-300
0
300
600
100 110 120
Be
nd
ing
Mo
me
nt
(kN
m)
time (sec.)
5B (6.0m,EW) 5B (16.0m,EW)
-10000
0
10000
100 110 120
Ine
rtia
l fo
rce
of
bu
ildin
g
(kN
)
100 110 120
Re
lati
ve d
isp
lace
me
nt
time (sec.)
12F
1F
Pit
GL-1.5m
GL-15m
100mm
100 110 120
Acc
ele
rati
on
of
EW-
dir
ect
ion
time (sec.)
12F
1F
Pit
GL-1.5m
GL-15m
GL-50m
200gal
Figure 14. Profiles of accelerations, displacements
and bending moments in EW direction (Maximum
inertial force, Time B: t=106.96 sec.)
Figure 13. Profiles of accelerations, displacements
and bending moments in EW direction (Maximum
bending moment of 5B, Time A:t=109.07 sec.)
Figure 15. Time histories of inertial force of building, relative
displacements, sectional forces and earth pressures
Time A: Max. Moment Time B: Max. Inertial Force
(a)Accelerations (b) Displacements (c) Bending moments
(a)Accelerations (b) Displacements (c) Bending moments
0
10
20
30
40
50
-600 -300 0 300 600
Dep
th(m
)
Bending moment (kNm)
7B・X
5B・X
Heig
ht (m)
Dept
h (
m)
7B 5B
Max. Max.
Max.
Max.
0
10
20
30
40
50
-600 -300 0 300 600
Dep
th(m
)
Bending moment (kNm)
7B・X
5B・X
Heig
ht (m)
Dept
h (
m)
7B 5B
Max. Max.
Max.
Max.
6. CONCLUSIONS
It was found that the horizontal acceleration, peak of 0.62 m/s2, of the superstructure was significantly
reduced compared to that on the raft, peak of 1.00 m/s2, by the base isolation system. And also, the
peak acceleration on the raft was about 60 percent of that of the ground surface of 1.75 m/s2 in the site
of the building. It is considered that reduction of input motion could be caused by ground
improvement.
The sectional forces of piles at near the pile head and at intermediate depth, where is lower end of
grid-form deep cement mixing walls, were almost same behaviour. The peak compressive axial forces
of pile of 1.0m diameter were about 690kN at pile head and 760kN at intermediate depth, respectively,
and the peak bending moments of the pile were about 210kNm at pile head and 155kNm at
intermediate depth, respectively. It is estimated that the frictional resistances around the piles enclosed
by the grid-form walls were small and also the bending moments at pile head were reduced by the
grid-form walls whereas those at lower end of the grid-form walls behaved similar to those at pile
head. In addition, the bending moments at the pile head and those at the intermediate depth increased
during large deformation of the ground in spite that the inertial force of building was not significant.
REFERENCES
Hamada, J., Tsuchiya, T. and Yamashita, K. (2009): Theoretical equations to evaluate the stress of piles on
piled raft foundation during earthquake, J. Structural Const. Eng. (AIJ), Vol. 74, No. 644, 1759-1767 (in
Japanese).
Hamada, J., Tsuchiya, T., Tanikawa, T. and Yamashita, K. (2011): Lateral loading tests on piled raft foundations
at large scale and their analyses, International Conference on Advances in Geotechnical Engineering,
Nov.7-9, pp.1059-1064.
Horikoshi, K., Matsumoto, T., Hashizume, Y., Watanabe, T. and Fukuyama, H. (2003): Performance of piled
raft foundations subjected to static horizontal loads, International Journal of Physical Modelling in
Geotechnics, 3(2), 37-50.
Katzenbach, R., Arslan, U. and Moormann, C. (2000): Piled raft foundation projects in Germany, Design
applications of raft foundations, Hemsley J.A. Editor, Thomas Telford, 323-392.
Katzenbach, R. and Turek, J. (2005): Combined pile-raft foundation subjected to lateral loads, Proc. 16th
Int.
Conf. On Soil Mechanics and Geotechnical Engineering, pp.2001-2004.
Kitiyodom, P. and Matsumoto, T. (2003): A simplified analysis method for piled raft foundations in
non-homogeneous soils, Int. J. Numer. Anal. Meth. Geomech., pp85-109.
Mandolini, A., Russo, G. and Viggiani, C. (2005): Pile foundations: Experimental investigations, analysis and
design, Proc. 16th ICSMGE, Vol.1, 177-213.
Matsumoto, T., Fukumura, K., Kitiyodom,P., Horikoshi, K. and Oki, A. (2004): “Experimental and analytical
study on behaviour of model piled rafts in sand subjected to horizontal and moment loading”, International
Journal of Physical Modeling in Geotechnics, 4(3), 1-19.
Matsumoto, T., Nemoto, H., Mikami, H., Yaegashi, K., Arai, T. and Kitiyodom, P. (2010): Load tests of piled
raft models with different pile head connection conditions and their analyses, Soils and Foundations, Vol.50,
No.50, 63-81.
Mendoza, M. J., Romo, M.P., Orozco, M. and Dominguez, L. (2000): Static and seismic behavior of a friction
pile-box foundation in Mexico City clay, Soils & Foundations, Vol.40, No.4, 143-154.
Poulos, H.G. (2001): Piled raft foundations: design and applications, Geotechnique 51, No.2, 95-113.
Watanabe,T., Fukuyama,H., Horikoshi,K. and Matsumoto,T (2001): Centrifuge modeling of piled raft
foundations subjected to horizontal loads, Proc. 5th
Int. Conf. On Deep Foundation Practice incorporating
Piletalk Int., pp. 371-378.
Yamashita, K., Yamada, T. and Hamada, J. (2011a): Investigation of settlement and load sharing on piled rafts
by monitoring full-scale structures, Soils & Foundations, Vol.51, No.3, 513-532.
Yamashita, K., Hamada, J. and Yamada, T. (2011b): Field measurements on piled rafts with grid-form deep
mixing walls on soft ground, Geotechnical Engineering Journal of the SEAGS & AGSSEA, Vol.42, No.2,
1-10.
Yamashita, K., Hamada, J., Onimaru, S. and Higashino, M. (2012): Seismic behavior of piled raft with ground
improvement supporting a base-isolated building on soft ground in Tokyo, Soils & Foundations, Vol.52,
No.5, the Special Issue for the 2011 off the Pacific coast of Tohoku Earthquake ( accepted for publication).