Embed Size (px)
Citation preview
Seismic Performance of Eccentrically Braced Frames Designed
According to Canadian Seismic Provisions
Mona Rais Esmaili
A Thesis in
The Department of
Building, Civil and Enviornmental Engineering
Presented in Partial Fullfillment of the Requirements
for the Degree of Master of Applied Science (Civil Engineering)
at Concordia University, Montreal, Quebec, Canada
May 2015
CONCORDIA UNIVERSITY School of Graduate Studies
This is to certify that the thesis prepared
By: Mona Rais Esmaili
Entitled: Seismic Performance of Eccentrically Braced Frames Designed According to Canadian Seismic Provisions and submitted in partial fulfillment of the requirements for the degree of
Master of Applied Science (Civil Engineering)
complies with the regulations of the University and meets the accepted standards with respect to originality and quality.
Signed by the final examining committee:
Dr. Adel M. Hanna Chair
Dr. Ashutosh Bagchi Examiner
Dr. Mohammad Mannan Examiner
Dr. Anjan Bhowmick Supervisor
Approved by Chair of Department or Graduate Program Director
Dean of Faculty
Date
ii
© Mona Rais Esmaili, 2015
ABSTRACT
Seismic Performance of Eccentrically Braced Frames Designed According to
Canadian Seismic Provisions
Mona Rais Esmaili
Eccentrically braced frames (EBFs) are very effective lateral load resisting systems against
earthquakes because of their hybrid behavior that includes great stiffness corresponding to the
bracing actions, and considerable ductility owing to the inelastic activity of a small part of the
floor beam called link. Current capacity design approach of EBFs is to confine the inelastic
behavior of the frame primarily to the link such that other members remain essentially in elastic
range. Limited research works are available in the literature studying the behavior of multi-storey
EBFs designed according to the current Canadian seismic provisions. This thesis was aimed to
study seismic performance of EBFs through nonlinear time history analysis (NLTHA) of three 4-
, 8- and 14-storey chevron eccentrically braced frames. The selected EBFs were subjected to real
and artificial ground motion records scaled to match the response spectrum of Vancouver. All
the EBFs, designed according to current capacity design provisions, exhibited excellent seismic
performance in terms of stiffness, strength, and ductility. It was observed that the inelastic link
rotations of all EBFs were lower than the design limit of 0.08 rad, except for the two upper floors
in 14-storey EBF where the link rotation slightly exceeded the limit. Seismic analysis also
showed that maximum inelastic link shear forces exceeded the values recommended in design
for many earthquake records.
iii
Although NLTHA can precisely estimate structural seismic responses, it requires high
computational demands making it impractical for engineering design offices. On the other hand,
the conventional pushover analysis does not consider contributions of higher modes to the
structural responses and thus it often does not provide good estimation of seismic responses for
taller buildings. Capacity-Spectrum Method (CSM) and modal pushover analysis (MPA) are two
simple nonlinear static methods that have been proposed and recently used for seismic
performance evaluation of few lateral load-resisting systems. This research further studies the
application of CSM and MPA as alternatives for rigorous NLTHA to estimate seismic
performance parameters of EBFs. The three selected EBFs were analyzed using MPA and CSM
and the results were compared with nonlinear seismic analysis results. It was observed that both
CSM and MPA predicted the peak top displacements of EBFs with sufficient accuracy.
iv

To my husband and my best friend, Shahram,
For his beautiful insight about life which always encouraged me to fulfill my dreams
To my dearest mother,
For her endless teachings, supports, love and prayers
v

ACKWNOWLEDGMENTS
Taking the steps to accomplish a master degree in civil engineering was so challenging yet
rewarding for me. In the course of this process, many people have contributed to my academic
achievements. Special thanks are owed to my supervisor, Dr. Anjan Bhowmick, for providing
helpful research guidance in pursuit of my graduate studies. His strong encouragement helped
me remain focused and motivated throughout my research work. I would like to express my
sincere gratitude to Dr. Kinh Ha who introduced me to the world of civil engineering and finite
element modeling concept by instructing his invaluable courses
I also would like to acknowledge the Faculty of Engineering and Computer Science, Concordia
University, Montreal, Canada and the Natural Sciences and Engineering Research Council of
Canada for their support and providing funding to this project.
I wish to appreciate all technical supports and inspirations I have received from my dear friends
and colleges particularly, Moon Moon Dhar, Sandip Dey, and Arghya Chatterjee. Wish you a
happy life and all the best in your future professional careers. Finally, I would like to express my
deepest appreciation to my husband and my family because of their endless supports during my
studies.
vi
TABLE OF CONTENTS
List of Figures ........................................................................................................................................ ix
List of Tables ........................................................................................................................................ xii
List of Symbols .................................................................................................................................... xiii
List of Abbreviations ......................................................................................................................... xvii
Chapter 1. Introduction ..........................................................................................................................1
1.2. General .................................................................................................................................................. 1
1.3. Objectives and Scope ............................................................................................................................ 4
1.4. Methodology ......................................................................................................................................... 5
1.5. Thesis Outline ....................................................................................................................................... 6
Chapter 2. Literature Review ................................................................................................................8
2.1. General .................................................................................................................................................. 8
2.2. Past Studies on EBFs ............................................................................................................................ 8
2.3. Capacity design methodology for EBFs ............................................................................................. 15
2.4. Performance Evaluation of EBFs ........................................................................................................ 21
Chapter 3. Finite Element Modeling of Eccentrically Braced Frames ............................................25
3.1. Introduction ......................................................................................................................................... 25
3.2. Selection of Finite Element Analysis Procedures ............................................................................... 25
3.3. Finite Element Model Specifications .................................................................................................. 26
3.3.1. Geometry and mesh ..................................................................................................................................... 26
3.3.2. Element Type ............................................................................................................................................... 28
3.3.3. Material Properties ...................................................................................................................................... 29
3.3.4. Boundary Conditions ................................................................................................................................... 29
3.4. Types of Analyses ............................................................................................................................... 30
3.5. Description of Selected Experimental Model ..................................................................................... 31
3.6. Validation of Finite Element Model ................................................................................................... 33
3.7. Design of Multi-Storey EBFs ............................................................................................................. 34
3.7.1. Building Geometry and Loading description ............................................................................................... 34
vii
3.7.2. Design procedure ......................................................................................................................................... 38
3.7.3. Finite Element Modeling of 4-Storey, 8-Storey and 14-Storey EBFs ......................................................... 51
3.8. Summary ............................................................................................................................................. 53
Chapter 4. Seismic Performance of Eccentric Braced Frames .........................................................54
4.1. Introduction ......................................................................................................................................... 54
4.2. Nonlinear Dynamic Analysis of EBFs ................................................................................................ 54
4.2.1. Frequency Analysis ..................................................................................................................................... 54
4.2.2. Ground Motion Records .............................................................................................................................. 55
4.3. EBF Seismic Response ....................................................................................................................... 63
4.3.1. Link Responses ............................................................................................................................................ 63
4.3.2. Other Responses .......................................................................................................................................... 65
4.4. Summary ............................................................................................................................................. 78
Chapter 5. Evaluation of Modal Pushover Method for Eccentrically Braced Frames ...................80
5.1. Introduction ......................................................................................................................................... 80
5.2. Modal Pushover Analysis ................................................................................................................... 80
5.3. Application of Modal Pushover Analysis for EBFs ............................................................................ 85
5.4. Evaluation of MPA procedure ............................................................................................................ 94
5.5. Summary ........................................................................................................................................... 102
Chapter 6. Evaluation of Capacity Spectrum Method for Eccentrically Braced Frames ............ 104
6.1. Introduction ....................................................................................................................................... 104
6.2. Capacity Spectrum Method by Fajfar (1999) ................................................................................... 105
6.3. Application of Capacity Spectrum Method (CSM) for EBFs ........................................................... 110
6.4. Summary ........................................................................................................................................... 118
Chapter 7. Summary and Conclusions .............................................................................................. 120
7.1. Summary ........................................................................................................................................... 120
7.2. Conclusions ....................................................................................................................................... 121
7.3. Future Work ...................................................................................................................................... 124
References ............................................................................................................................................ 125
viii
List of Figures
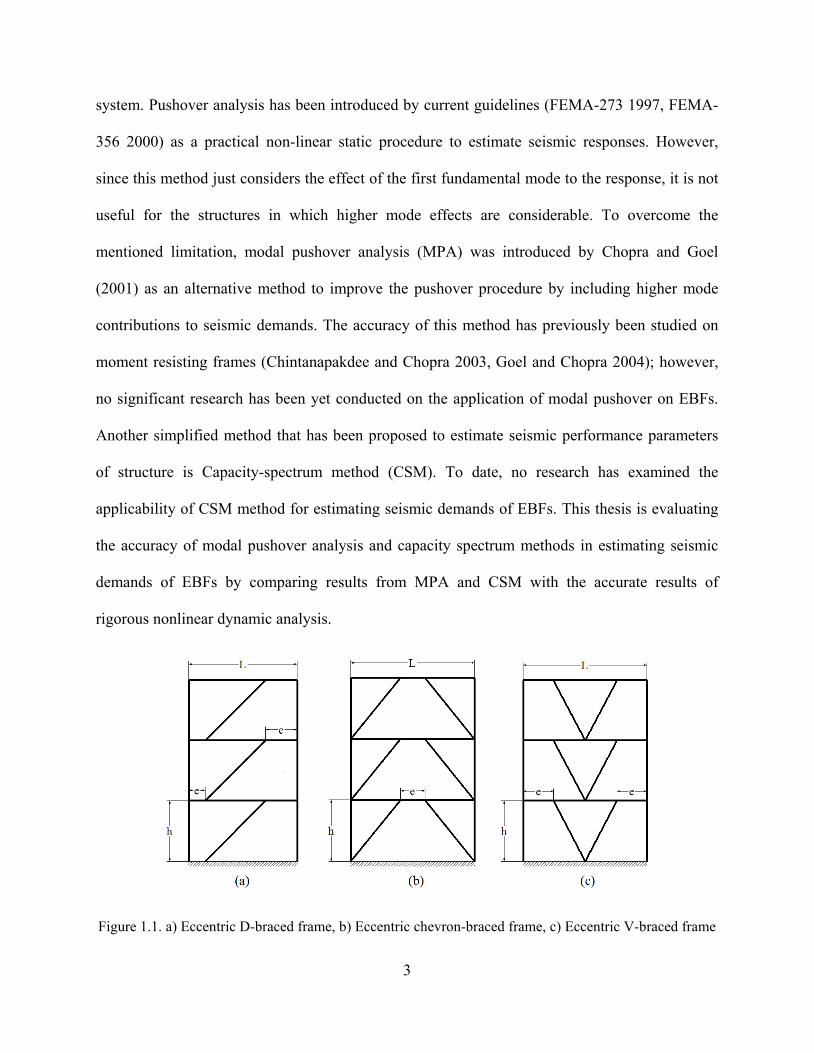
Figure 1.1. a) Eccentric D-braced frame, b) Eccentric chevron-braced frame, c) Eccentric V-braced frame ............... 3
Figure 2.1. Simplified F.B.D of chevron EBF ............................................................................................................. 18
Figure 2.2. Rigid-Plastic mechanism of EBF .............................................................................................................. 19
Figure 2.3. Typical detail for hollow section braces to beam connection (Popov and Engelhardt 1988) .................... 20
Figure 3.1. Mesh convergence study for 4-storey EBF a) Maximum von Mises stress vs. mesh refinement, ............ 28
Figure 3.2. Link specimen 11A (Mansour 2010) ......................................................................................................... 32
Figure 3.3. One-storey EBF with Link specimen 11A (Mansour 2010) ...................................................................... 32
Figure 3.4. FE Model of 1-storey specimen tested by Mansour (2010) ...................................................................... 33
Figure 3.5. validation curve of 1-storey specimen by Mansour (2010) ....................................................................... 34
Figure 3.6. Typical floor plan of office building ......................................................................................................... 36
Figure 3.7. EBFs Elevations ........................................................................................................................................ 37
Figure 3.8. Variation of elastic lateral stiffness with e/L for EBFs (Popov and Engelhardt 1988) .............................. 39
Figure 3.9. Free-Body diagram of EBF ....................................................................................................................... 45
Figure 3.10. Finite element model of 14-storey EBF (only bottom 6-storeys are shown) ........................................... 52
Figure 4.1. Acceleration spectra for selected ground motions and Vancouver design spectra for 4-storey ................ 58
Figure 4.2. Acceleration spectra for selected ground motions and Vancouver design spectra for 8-storey ................ 58
Figure 4.3. Acceleration spectra for selected ground motions and Vancouver design spectra for 14-storey .............. 59
Figure 4.4. Scaled Earthquake records for 4-storey EBF ............................................................................................ 60
Figure 4.5. Scaled Earthquake records for 8-storey EBF ............................................................................................ 61
Figure 4.6. Scaled Earthquake records for 14-storey EBF .......................................................................................... 62
Figure 4.7. Normalized Maximum Link Shear Forces and Link Rotations for 4-storey EBF ..................................... 69
Figure 4.8. Inter-storey Drift and Floor Displacement for 4-storey EBF .................................................................... 70
Figure 4.9. Normalized Maximum Link Shear Forces and Link Rotations for 8-storey EBF ..................................... 71
Figure 4.10. Inter-storey Drift and Floor Displacement for 8-storey EBF .................................................................. 72
Figure 4.11. Normalized Maximum Link Shear Forces and Link Rotations for 14-storey EBF ................................. 73
ix
Figure 4.12. Inter-storey Drift and Floor Displacement for 14-storey EBF ................................................................ 74
Figure 4.13. Dynamic Base shear forces for 8 Earthquake records ............................................................................. 75
Figure 4.14. a) Yield pattern for 4-storey at the time most links are yielded, b) Yield pattern for 14-storey at the time
maximum base shear occurred ........................................................................................................................... 75
Figure 4.15. a) Yield pattern for 8-storey at the time most links are yielded, b) Yield pattern for 14-storey at the time
maximum base shear occurred ........................................................................................................................... 76
Figure 4.16. a) Yield pattern for 14-storey at the time most links are yielded, b) Yield pattern for 14-storey at the
time maximum base shear occurred ................................................................................................................... 77
Figure 5.1. Idealized pushover curve of MDOF, and properties of nth-mode inelastic SDOF system ........................ 84
Figure 5.2. Mode shapes of 4, 8, and 14 Storey EBF .................................................................................................. 86
Figure 5.3. 4- Storey Force Distribution *n nS m= φ .................................................................................................. 86
Figure 5.4. 8-Storey Force Distribution *n nS m= φ ................................................................................................... 86
Figure 5.5. 14-Storey Force Distribution *n nS m= φ ................................................................................................. 87
Figure 5.6. 4-Storey Mode 1, Actual, Idealized ( b1 r1V U− ) and SDOF ( s1 1 1F / L D− ) Pushover Curves .............. 88
Figure 5.7. 4-Storey Mode 2, Actual, Idealized ( b2 r2V U− ) and SDOF ( s2 2 2F / L D− ) Pushover Curves ........... 89
Figure 5.8. 4-Storey Mode 3, Actual, Idealized ( b3 r3V U− ) and SDOF ( s3 3 3F / L D− ) Pushover Curves ............ 89
Figure 5.9. 8-Storey Mode 1, Actual, Idealized ( b1 r1V U− ) and SDOF ( s1 1 1F / L D− ) Pushover Curves .............. 90
Figure 5.10. 8-Storey Mode 2, Actual, Idealized ( b2 r2V U− ) and SDOF ( s2 2 2F / L D− ) Pushover Curves ......... 90
Figure 5.11. 8-Storey Mode 3, Actual, Idealized ( b3 r3V U− ) and SDOF ( s3 3 3F / L D− ) Pushover Curves .......... 91
Figure 5.12. 14-Storey Mode 1, Actual, Idealized ( b1 r1V U− ) and SDOF ( s1 1 1F / L D− ) Pushover Curves .......... 91
Figure 5.13. 14-Storey Mode 2, Actual, Idealized ( b2 r2V U− ) and SDOF ( s2 2 2F / L D− ) Pushover Curves .......... 92
Figure 5.14. 14-Storey Mode 3, Actual, Idealized ( b3 r3V U− ) and SDOF ( s3 3 3F / L D− ) Pushover Curves .......... 92
Figure 5.15. 4-Storey EBF Floor Displacements (MPA and NLTHA) ...................................................................... 99
Figure 5.16. 8-Storey EBF Floor Displacements (MPA and NLTHA) ....................................................................... 99
Figure 5.17. 14-Storey EBF Floor Displacements (MPA and NLTHA) ................................................................... 100
x
Figure 5.18. 4-Storey EBF Inter-Storey Drift (MPA and NLTHA) .......................................................................... 100
Figure 5.19. 8-Storey EBF Inter-Storey Drift (MPA and NLTHA) .......................................................................... 101
Figure 5.20. 14-Storey EBF Inter-Storey Drift (MPA and NLTHA) ........................................................................ 101
Figure 6.1. Schematic figure of an seismic demand spectrum (constant ductility response spectrum in ADRS format)
by Fajfar (1999) ............................................................................................................................................... 107
Figure 6.2. Development of the capacity spectrum of an equivalent SDOF system by Fajfar (1999) ....................... 109
Figure 6.3. Base shear ( )bV - Roof Displacement ( )tD from Non-Linear Pushover Analysis of 4-Storey EBF
(top), 8-Storey EBF (middle), 14-Storey EBF (bottom) .................................................................................. 112
Figure 6.4. Force-Displacement and Idealized Curve as well as Spectral Acceleration vs. Spectral Displacement
Curve of Equivalent SDOF System for 4-Storey EBF (top), 8-Storey EBF (middle), 14-Storey EBF (bottom)
......................................................................................................................................................................... 113
Figure 6.5. Elastic Design Acceleration Response Spectrum of Vancouver for 5% Damping Ratio and the
Corresponding Displacement Spectrum ........................................................................................................... 114
Figure 6.6. Graphical Representation of CSM on 4-Storey EBF in ADRS format ................................................... 117
Figure 6.7. Graphical Representation of CSM on 8-Storey EBF in ADRS format ................................................... 117
Figure 6.8. Graphical Representation of CSM on 14-Storey EBF in ADRS format ................................................. 118
xi
List of Tables
Table 3.1 Summary of 1-storey eccentrically braced frame (Mansour 2010).............................................................. 32
Table 3.2 comparison between fundamental period obtained from frequency analysis and a2T ............................... 40
Table 3.3 14-Storey EBF Design Base Shear .............................................................................................................. 41
Table 3.4 Selected Sections for 4-Storey EBF ............................................................................................................. 49
Table 3.5 Selected Sections for 8-Storey EBF ............................................................................................................. 49
Table 3.6 Selected Sections for 14-Storey EBF ........................................................................................................... 50
Table 4.1 Real Ground Motion Records ...................................................................................................................... 57
Table 4.2 Simulated Ground Motion Records ............................................................................................................. 57
Table 4.3 Non-Linear Dynamic Base Shear (kN) ........................................................................................................ 66
Table 5.1 Modal periods of three EBFs ....................................................................................................................... 85
Table 5.2 Structural Properties of Equivalent SDOF System ...................................................................................... 93
Table 5.3 Comparison of MPA and NLTHA peak values of floor displacements for 4-Storey EBF .......................... 95
Table 5.4 Comparison of MPA and NLTHA peak values of floor displacements for 8-Storey EBF .......................... 96
Table 5.5 Comparison of MPA and NLTHA peak values of floor displacements for 14-Storey EBF ........................ 96
Table 5.6 Comparison of MPA and NLTHA Inter-Storey Drift (% of floor height) for 4-Storey EBF ...................... 97
Table 5.7 Comparison of MPA and NLTHA Inter-Storey Drift (% of floor height) for 8-Storey EBF ...................... 97
Table 5.8 Comparison of MPA and NLTHA Inter-Storey Drift (% of floor height) for 14-Storey EBF .................... 98
Table 5.9 Comparison of the base shear obtained from MPA and NLTHA ................................................................ 98
Table 6.1 Structural Properties of Equivalent SDOF System .................................................................................... 111
Table 6.2 Performance Evaluation of EBFs using CSM and NLTHA ...................................................................... 116
xii
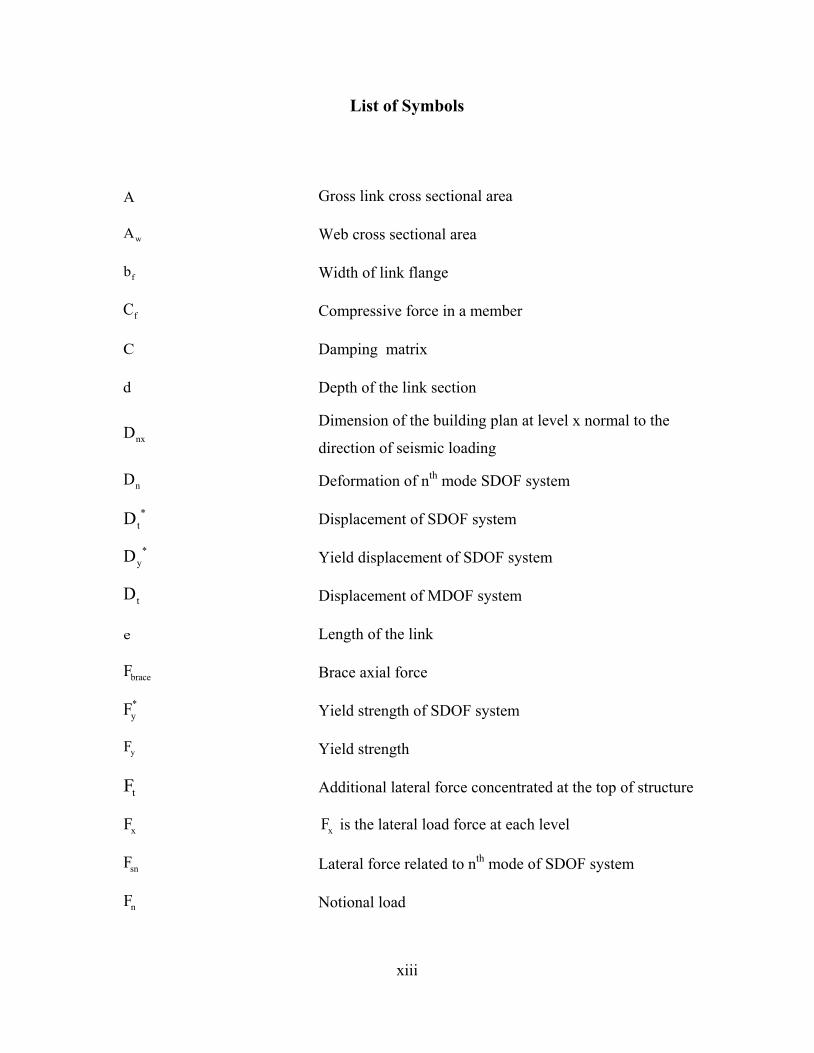
List of Symbols
A Gross link cross sectional area
wA Web cross sectional area
fb Width of link flange
fC Compressive force in a member
C Damping matrix
d Depth of the link section
nxD
Dimension of the building plan at level x normal to the
direction of seismic loading
nD Deformation of nth mode SDOF system
*tD Displacement of SDOF system
*yD Yield displacement of SDOF system
tD Displacement of MDOF system
e Length of the link
braceF Brace axial force
*yF Yield strength of SDOF system
yF Yield strength
tF Additional lateral force concentrated at the top of structure
xF
xF is the lateral load force at each level
snF Lateral force related to nth mode of SDOF system
nF Notional load
xiii
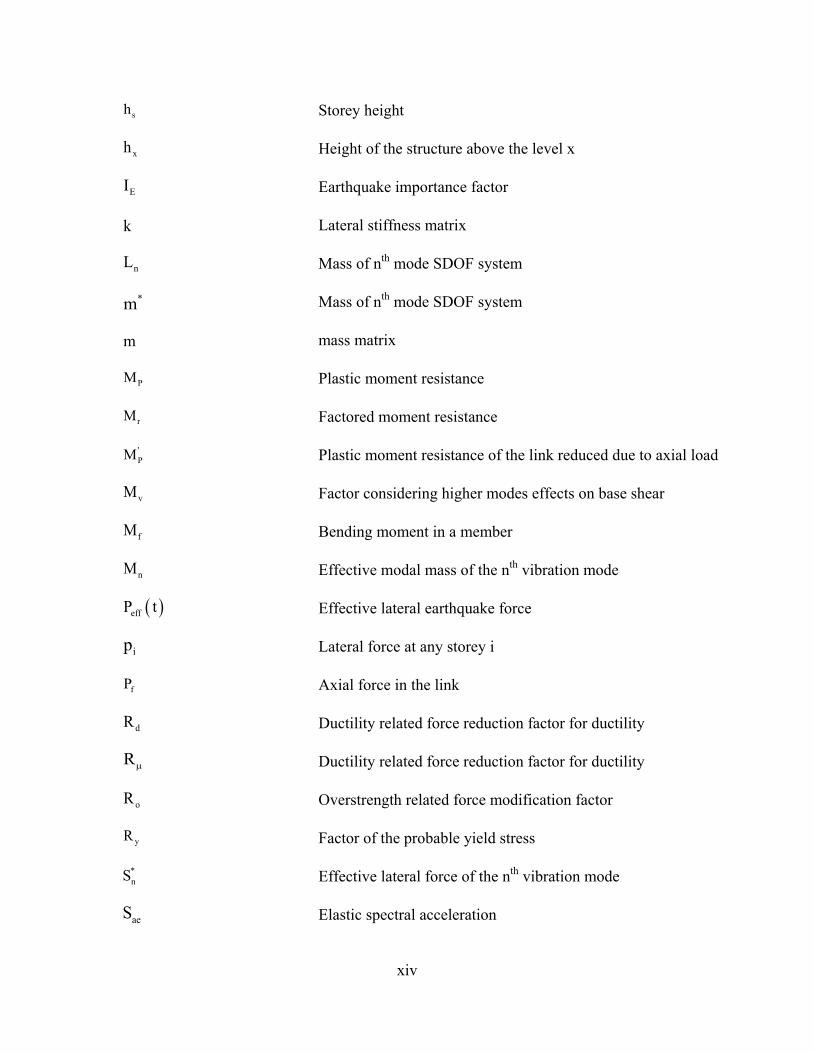
sh Storey height
xh Height of the structure above the level x
EI Earthquake importance factor
k Lateral stiffness matrix
nL Mass of nth mode SDOF system
*m Mass of nth mode SDOF system
m mass matrix
PM Plastic moment resistance
rM Factored moment resistance
'PM Plastic moment resistance of the link reduced due to axial load
vM Factor considering higher modes effects on base shear
fM Bending moment in a member
nM Effective modal mass of the nth vibration mode
( )effP t Effective lateral earthquake force
ip Lateral force at any storey i
fP Axial force in the link
dR Ductility related force reduction factor for ductility
Rµ Ductility related force reduction factor for ductility
oR Overstrength related force modification factor
yR Factor of the probable yield stress
*nS Effective lateral force of the nth vibration mode
aeS Elastic spectral acceleration
xiv
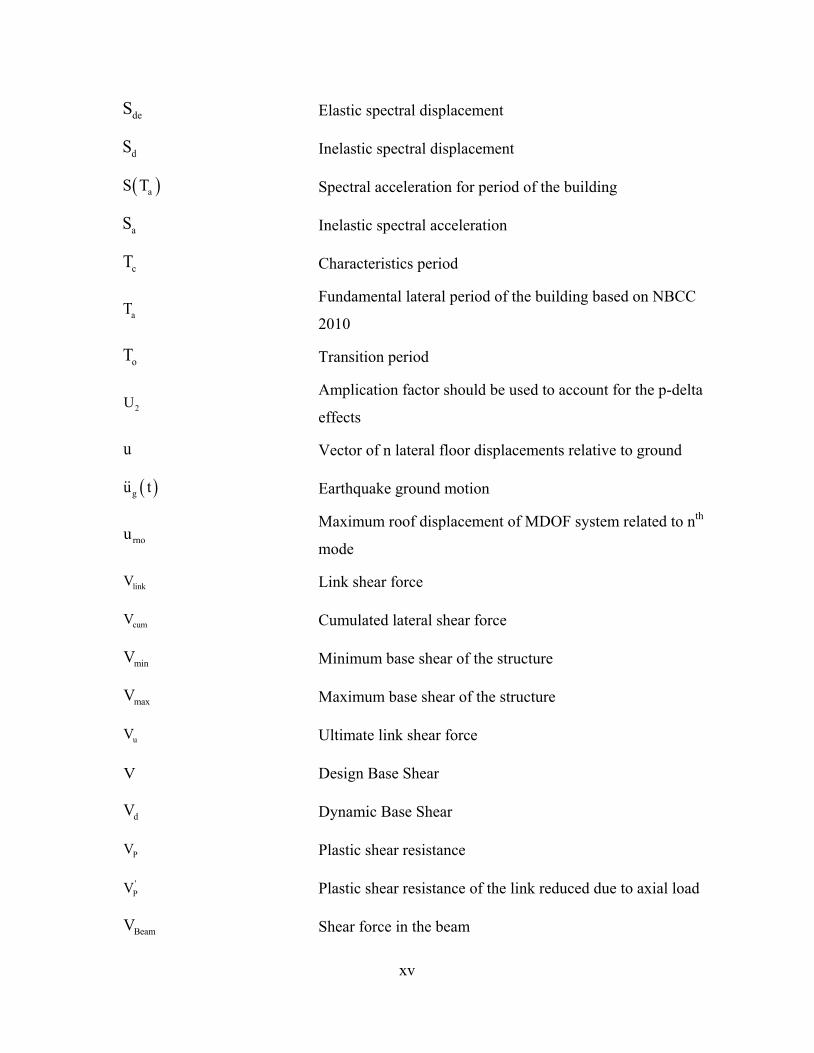
deS Elastic spectral displacement
dS Inelastic spectral displacement
( )aS T Spectral acceleration for period of the building
aS Inelastic spectral acceleration
cT Characteristics period
aT
Fundamental lateral period of the building based on NBCC
2010
oT Transition period
2U
Amplication factor should be used to account for the p-delta
effects
u Vector of n lateral floor displacements relative to ground
( )gu t Earthquake ground motion
rnou
Maximum roof displacement of MDOF system related to nth
mode
linkV Link shear force
cumV Cumulated lateral shear force
minV Minimum base shear of the structure
maxV Maximum base shear of the structure
uV Ultimate link shear force
V Design Base Shear
dV Dynamic Base Shear
PV Plastic shear resistance
'PV Plastic shear resistance of the link reduced due to axial load
BeamV
Shear force in the beam
xv
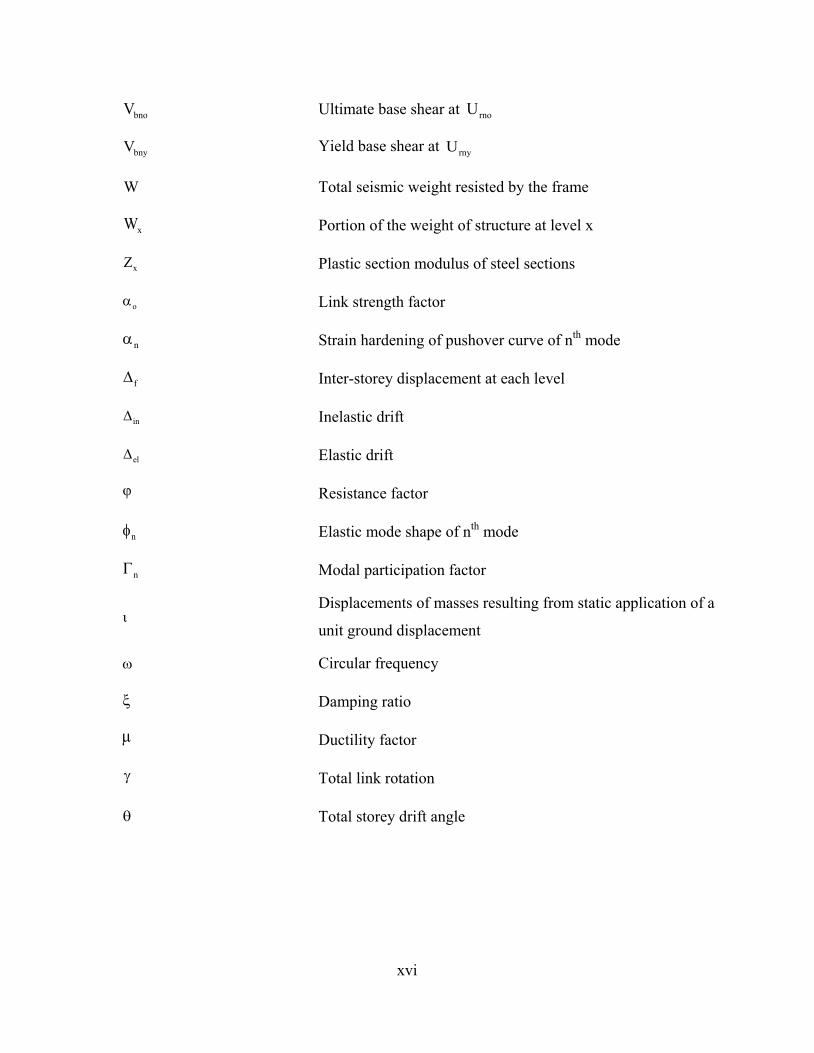
bnoV Ultimate base shear at rnoU
bnyV Yield base shear at rnyU
W Total seismic weight resisted by the frame
xW Portion of the weight of structure at level x
xZ Plastic section modulus of steel sections
oα Link strength factor
nα Strain hardening of pushover curve of nth mode
f∆ Inter-storey displacement at each level
in∆ Inelastic drift
el∆ Elastic drift
ϕ Resistance factor
nφ Elastic mode shape of nth mode
nΓ Modal participation factor
ι
Displacements of masses resulting from static application of a
unit ground displacement
ω Circular frequency
ξ Damping ratio
µ Ductility factor
γ Total link rotation
θ Total storey drift angle
xvi

List of Abbreviations
ADRS Acceleration Displacement Response Spectrum
AISE American Institute Of Steel Construction
ASCE American Society Of Civil Engineers
CSA Canadian Standards Association
CSM Capacity Spectrum Method
EBF Eccentrically Braced Frames
FE Finite Element
FEMA Federal Emergency Management Agency
MDOF Multi Degrees Of Freedom System
MPA Modal Pushover Analysis
NBCC National Building Code Of Canada
NLTHA Non-Linear Time History Analysis
PBSD Performance Based Design
PEER Pacific Earthquake Engineering Research
SDOF Single Degree Of Freedom
xvii
Chapter 1. Introduction
1.2. General
Eccentrically braced frames (EBFs) have been recognized as effective lateral load resisting
systems providing large ductility comparable to moment resisting frames (MRFs) and excellent
stiffness similar to concentric braced frames (CBFs). The high stiffness of EBFs stems from the
existence of the braces, and their superior ductility is due to the inelastic activity of a section
called link. The link is a part of the floor beam located between the ends of the braces or between
the brace end and the column flange. The links are the most important members of EBFs
dissipating large amount of energy through their plastic behavior, and influencing the strength,
stiffness and ductility of the frame. Figure 1.1 illustrates some usual configuration of eccentric
braced frames. Among different configuration of EBFs, the eccentric chevron braced frame is
preferable since it prevents the link to column connection which is recommended to be avoided
in the literature (Engelhardt and Popov 1989).
The underlying concept of EBFs is restricting all inelastic actions into the links so that other
members act elastically under severe earthquake loadings. Therefore, the link is the key member
from which the design of eccentrically braced frame initiates; while other members are designed
to withstand the maximum forces developed by the fully yielded link. The link behavior is
primarily affected by its length. Short links, also called shear links, mainly yield in shear whereas
long links yield in flexure. Generally, the short links are recommended for designing EBFs
(Engelhardt and Popov 1989) because in this case the plastic shear strains are uniformly
distributed along the web of the links, allowing for large inelastic rotation of the link without any
excessive local strains. For long links high bending moments are required at the end of the link in
order to produce large inelastic rotations. The high bending moments create high local plastic
deformations preventing the desired inelastic rotations of the link. The reported maximum link
rotation by the experimental research is about 0.1 radian for shear links (Whittaker et al. 1987)
and about which 0.02 radian for long links (Engelhardt and Popov 1989).
Current Canadian design provisions (CSA 2009, NBCC 2010) require that EBFs be designed
according to capacity design approach. In this approach, the links are sized for the seismic forces
specified by NBCC 2010 and other frame members should be designed for the forces developed
by the fully yielded and strain-hardened link. Limited studies are available in the literature that
focused seismic performance of EBFs designed according to current Canadian seismic
provisions. In this research, seismic performances of 4-, 8-, and 14-storey EBFs are studied. A
detailed finite element model that can accurately simulate monotonic and dynamic behavior of
EBFs is developed. The finite element model included both material and geometric non-
linearities. The reliability of FE model was first validated by comparing FE results with the
experimental ones. The FE models were used to study seismic performance of EBFs through
non-linear dynamic analysis. Although this method is known as the most accurate method in
determining seismic responses, it is not very useful at the design level due to its high
computational demands. The precise prediction of strength and deflection is very important at the
design phase, since it can assure the desired level of performance.
In recent years, the performance-based seismic design (PBSD) is employed as a more reliable
method for designing structures using accurate prediction of seismic demands at the design level.
This demonstrates the need for efficient and precise seismic evaluation tools for every structural
2
system. Pushover analysis has been introduced by current guidelines (FEMA-273 1997, FEMA-
356 2000) as a practical non-linear static procedure to estimate seismic responses. However,
since this method just considers the effect of the first fundamental mode to the response, it is not
useful for the structures in which higher mode effects are considerable. To overcome the
mentioned limitation, modal pushover analysis (MPA) was introduced by Chopra and Goel
(2001) as an alternative method to improve the pushover procedure by including higher mode
contributions to seismic demands. The accuracy of this method has previously been studied on
moment resisting frames (Chintanapakdee and Chopra 2003, Goel and Chopra 2004); however,
no significant research has been yet conducted on the application of modal pushover on EBFs.
Another simplified method that has been proposed to estimate seismic performance parameters
of structure is Capacity-spectrum method (CSM). To date, no research has examined the
applicability of CSM method for estimating seismic demands of EBFs. This thesis is evaluating
the accuracy of modal pushover analysis and capacity spectrum methods in estimating seismic
demands of EBFs by comparing results from MPA and CSM with the accurate results of
rigorous nonlinear dynamic analysis.
Figure 1.1. a) Eccentric D-braced frame, b) Eccentric chevron-braced frame, c) Eccentric V-braced frame
3
1.3. Objectives and Scope
The main objectives of this research are as follows:
1. Develop a detailed finite element model to study the seismic performance of EBFs
designed according to Canadian design requirements. The finite element model, which
considers both material and geometric non-linearities, is validated with an available
experimental study to verify its ability in precise determining the responses of EBFs.
2. Perform non-linear seismic analyses on eccentrically braced frames, using detailed finite
element models, to evaluate the important response parameters of EBFs precisely. The
results of these analyses are employed to investigate differences between the seismic
responses and the design predictions.
3. Investigate the capability of modal pushover method in predicting seismic demands of
EBFs through comparing different response parameters such as storey displacements, inter-
storey drifts, and base shear obtained from MPA with the accurate results of non-linear
time history analyses.
4. Investigate the applicability of capacity-spectrum method for estimating seismic demand
parameters. Roof displacement and structural ductility demand are estimated as the
performance parameters. If the applicability of MPA and CSM on EBFs is justified, it can
be employed as an efficient alternative of rigorous non-linear time history analysis at the
design phase
4
1.4. Methodology
To achieve the presented objectives, three eccentrically braced frames with 4, 8 and 14 storeys
were designed and analyzed for Vancouver representing a high seismic zone in Canada. The
following methodology was used to fulfill the mentioned objectives:
Three eccentric braced frames with 4-, 8- and 14-storeys were designed according to current
Canadian design provisions (NBCC 2010, CSA 2009). The designed EBFs were precisely
modeled using ABAQUS, powerful finite element software capable of solving problems with
significant non-linearities. In order to have a reliable FE model, the finite element modeling
technique was firstly validated by modeling an experimental full-scale EBF and comparing its
results with the corresponding experimental results.
A set of eight real and artificial ground motion records were selected and scaled for the
Vancouver region and employed for non-linear seismic analyses of the three mentioned EBFs to
obtain and study the important seismic responses of EBF such as storey displacements, inter-
storey drifts, link rotations, and link shear forces.
The applicability of modal pushover method to estimate EBFs seismic demands was
investigated. To perform modal pushover procedure, the frequency analyses were conducted on
the three designed EBFs to find the fundamental mode shapes and periods of each frame. Then a
series of non-linear pushover analyses were conducted on the designed EBFs subjected to the
forces related to each mode. The results of these analyses were employed to identify the
properties of the single degree of freedom system corresponding to each mode leading into
determination of different response parameters of EBFs such as storey displacements and inter-
5
storey drifts. The steps are explained in detail in chapter 5. These results were compared with
the results of non-linear seismic analysis.
In the Capacity spectrum method, the capacities of the designed EBFs were determined from
pushover analysis and were combined with design response spectrum of Vancouver to estimate
the peak roof displacement and ductility demand of EBFs. The method is formulated in
acceleration-displacement format and inelastic spectra, rather than elastic spectra are used.
1.5. Thesis Outline
This thesis includes seven chapters. The first chapter presents a brief discussion of the existing
problems corresponding to seismic performance evaluation of eccentrically braced frames. Then
the objectives and the methodology used for this study are introduced. The second chapter
provides a review of some important experimental, analytical and numerical research works
previously done on eccentrically braced frames. Also, some previous studies on modal pushover
analysis are discussed. Chapter 3 describes the modeling technique, details and specifications of
the finite element model developed in ABAQUS to study the performance of EBFs. The
validation of the finite element model is also provided in this chapter. Besides, the capacity
design approach suggested by CSA\CAN S16-09 used for designing three 4-, 8- and 14-storey
EBFs is presented. The created finite element models of the designed frames are also provided in
this chapter. Chapter 4 presents the process of selecting ground motion records for non-linear
time history analysis. Important response parameters of the designed eccentrically braced frames
subjected to the selected earthquakes are also demonstrated and discussed. Chapter 5 describes
the modal pushover analysis method to estimate seismic demands and performance of
eccentrically braced frames. The responses obtained from MPA method are compared with the
6

results of non-linear time history analysis. Chapter 6 presents the application of Capacity
Spectrum method to estimate seismic demands of three selected EBFs. Results from CSM are
compared with those from nonlinear dynamic analysis. Chapter 7 summarizes the conclusions of
the studies and also provides the recommendations for future research.
7
Chapter 2. Literature Review
2.1. General
With the advent of eccentrically braced frames in the mid-1970s, extensive studies were initiated
to investigate the behavior of EBFs under cyclic and seismic loadings. This chapter introduces
the experimental, analytical and finite element studies have been conducted on EBFs; as well as,
the main findings of these studies. Also, the first proposed capacity design method for EBFs is
explained in detail. This chapter also describes the background of modal pushover analysis
which is used for seismic performance evaluation of eccentrically braced frames.
2.2. Past Studies on EBFs
A vast number of studies have been conducted on EBFs over the past 40 years. They can be
classified into three major categories. The first category includes the experimental studies,
having been performed on full scale models or on isolated members of EBFs. The first
experimental study on eccentrically braced frames consists of a series of quasi-static tests which
have been done in 1970s at the University of California, Berkeley (Roder and Popov 1977). In
the study, firstly the behavior of short links under cyclic loading was studied. The results showed
that links which yield in shear have the best energy dissipation mechanism due to their great
stability during large cyclic deflection. They also reported extensive strain hardening, observed
in the shear links. Considering the results of their experiments, they suggested an analytical
model based on sandwich beam theory. Two one-third scale three storey EBFs were modeled
and their results were compared with the responses of analytical model. The results of these
experiments confirmed high strength, stiffness and energy dissipation of EBFs.
8
The first dynamic experiment on eccentric braced frames was a shaking table study on a one
third scale five storey EBF with eccentric x-bracing (Yang 1982). The objective of this study was
to evaluate the seismic resistant efficiency of x-braced EBFs. Based on the dynamic results, it
was reported that damages were limited to buckling and fracture of the shear link. Also, it was
demonstrated that weaker links dissipated more energy and produced smaller forces. It was
concluded that the dynamic response of EBF was governed by strength of shear link.
Later, in 1987, an earthquake simulation test was accomplished on a 0.3-scale model of a six-
story chevron braced frame (Whittaker et al. 1987). Also, a seismic testing was performed on a
full scale 6 storey EBF with eccentric k-braces under 1952 Taft record. In this study, yielding
and buckling of gusset plates were observed at some levels, leading into reducing the strength
and energy absorbing capability of the corresponding floors. However, the overall performance
of EBF was excellent (Roeder et al. 1987).
Popov et al. (1992) investigated the effect of maintaining uniform link strength factor along the
height of frame by evaluating previous full scale experiments on EBFs (Roeder et al. 1987), and
a 13 storey EBF designed by Martini et al. (1990). Neither of cases considered a uniform link
strength factor during design phase which resulted into soft storey mechanism in the first
experiment and using vertical ties in the latter one. They concluded that keeping the link strength
factor uniform along the height of EBF prevents excessive link inelastic rotations in some levels,
and avoids soft storey mechanism in lower storeys.
More recent experiments were also carried out on full scale models. These studies include full
scale testing of one-storey chevron type EBF with replaceable shear link under cyclic loading,
performed by Mansour (2010). He used two types of replaceable links including W sections with 9
end plate connections and back to back channels with web connections. In the experimental
work, seven shear links were used in a full scale EBF with 7.5 m wide and 4.5 meter height
under AISC (2005) loading protocol, to investigate the local response of replaceable links and
the global behavior of the frame. From his experiments, it was concluded that the removable link
meets the performance criteria of Canadian standard (CSA 2009) without any failure or sever
strength degradation. The results of his study showed that EBFs with ductile replaceable links
provide improved ductility comparing to the conventional EBFs.
Another full-scale experiment was a pseudo-dynamic test of a dual EBF with removable link
(Dubina 2014). In the study, he combined eccentrically braced frames with replaceable links to a
moment resisting frames in order to have a dual structure. A reinforced concrete slab was
considered at each floor. The aim of this study was to assess the overall seismic performance of
the dual EBF, and study the link removal technology. He concluded that the structure indicated
an excellent seismic performance. Permanent drifts were resolved by removing bolted links. He
suggested unbolting for removing the links with small plastic deformation, for large deformation
case, flame cutting of the links were suggested.
There are also a large number of experiments which studied isolated members, specially the
links' behavior. In 1983, cyclic behavior of link beams was investigated by some experimental
studies. Popov and his colleagues studied the behavior of shear links with w-shape sections,
being employed in a sub-assemblage, reproducing the link behavior in a real EBF under cyclic
displacements (Hjelmstad and Popov 1983, Kasai and Popov 1986).
Engelhardt and Popov (1989) investigated the behavior of long links by a total of 14 tests on 12
specimens with W sections and A36 steel material. These links were assumed to connect to the 10
columns. The results of their studies showed that short links which yield in shear are more
efficient in dissipating energy than long links which primarily yield in flexure. Also, they found
that web buckling which weakens the load carrying and energy dissipation capacity of the link
can be resolved using evenly spaced web stiffeners. Moreover, because of poor behavior of link
to column connections, they recommended to avoid this type of EBF. Current Canadian standard
(CSA 2009) for designing EBFs permits using both short and long links; however, based on the
aforementioned studies, they also recognized the shear links more preferable in terms of the
design and behavior. Engelhardt and Popov recommended link overstrength factor of 1.5 which
represent the maximum force that can be produced by yielded and strain hardened link.
The mentioned tests used ASTM A36 steel; however, with the spread of ASTM A992 steel in
constructions, researchers started to investigate its applicability and effect on eccentrically
braced frames performance. In 2005, a series of 23 cyclic tests were performed to evaluate the
overstrength factor of w shape links made of A992 (OkazakiArce et al. 2005). The results of
their study showed that the ASTM A992 w shape links showed the maximum overstrength of
1.47 for shear links. They concluded that the overstrength factor of 1.5 which is recommended
by AISC is applicable for new steel under study. Another study was carried out on 37 link
specimen to extend the results of previous experiment (Okazaki and Engelhardt 2007). In this
study, the maximum overstrength factor of 1.62 was observed for ASTM A992 steel. They
explained that sections with high ratios of flange to web area showed lower overstrength factors.
They concluded that the performance of EBF links made of ASTM A992 was well and it could
meet the performance criteria suggested by 2005 AISC Seismic Provisions.
11
Parallel to the experimental researches, some analytical studies have been also done on EBFs.
The aim of these studies was proposing models which can predict the inelastic behavior of EBFs.
One of the early models for link was proposed by Roeder and Popov (1977). In this model, the
shear forces and moments were assumed to be resisted by web and flanges respectively. The
model considered combined isotropic and kinematic hardening. This model was designed to
represent links yielded in shear and with small moments at the ends which is not the case for all
the links.
To overcome the shortages of previous model, Ricles and Popov (1987, 1994) developed another
element which was able to predict the shear and flexural yielding of links successfully. The
element was modeled as a linear beam element with plastic end hinges, representing all inelastic
deformation of the link. The elastic beam limited the axial deformations through itself. Shear and
flexural yielding and combined kinematic and isotropic hardening were considered in this model.
Based on the approach of Ricles and Popov (1987), another analytical model, aimed to be used in
computer codes, was developed by Ramadan and Ghobarah (1995). They intention was to
develop a more simple model comparing to the one suggested by Ricles and Popov, which can
be easily used in the computer codes. This model was employed in DRAIN-2DX (Parkash et al.
1992).
Along with the analytical and experimental studies, the finite element techniques were also
employed to study the behavior of eccentrically braced frames. For finite element modeling of
full scale EBFs or link member, some of the analytical models described above were employed
to investigate their seismic responses. The shear link developed by Ricles and Popov (1987,
1994) was included in ANSR-1 program (Mondkar and Powell 1975) to study seismic behavior
12
of EBFs and to improve their design approach (Koboevic 2000). ANSR-1 is a finite element
program for nonlinear time history analysis (NLTHA).
In 1987, the behavior of EBFs under pseudo dynamic test was investigated by finite element
analysis (Balendra et al. 1987). In the study, the frame was discretized into five elements
including brace, which was modeled by truss element; beam and two columns, being modeled by
beam elements with a bilinear moment curvature relation; and the link, being modeled with the
shear link element yielding under pure kinematic hardening. Also, a finite element model was
employed to study the effect of axial forces in the links on EBFs' performance (Ghobarah and
Ramadan 1990). In modeling of the link, 4 node shell elements, working based on the
incremental Lagrangian continuum mechanics equation, were used. They considered material
nonlinearity by taking into account the actual stress-strain relationship. For geometric
nonlinearity, large displacements and rotations were allowed by updating node coordinates and
normal vectors. This finite element model was used to study seismic performance of links with
various lengths. The advantages of the short links in maximum deformation angle and ductility
were confirmed (Ghobarah and Ramadan 1991). David (2009) used ANSR-1 to perform
nonlinear time history analysis on high-rise eccentrically braced frames. Nonlinear beam column
elements were employed to model the outer beam, braces and the columns. The link was
modeled by the shear link element proposed by Ricles and Popov (1994).
An extensive finite element study was carried out in the University of California, San Diego to
study the effect of the loading protocol on short link rotation capacity (Richards 2004). In this
study, 112 finite element link models ranging from short to long links with different flange to
thickness ratios were analyzed under cyclic loading. They concluded that the flange width-
13
thickness ratio did not influence the plastic link rotation capacity directly. The design rotations
for intermediate links were not conservative. Also they compared the results of A992 with A36
steel material. They found that using ASTM A992 steel for wide flange shapes has not
considerable effect on links overstrength. They also recommended to consider shear forces in the
flanges of the link for determining ultimate strength of the links. They also developed nine
models of 3 and 10 storey EBFs with short, intermediate and long links in Ruaumoko, which is a
finite element application for 2D and 3D nonlinear time history analysis (Karr 2002), to study the
overall frame behavior and different member forces. In these models panel zones were not
modeled and their deformations were neglected. Beams, outer beams, braces, and columns were
modeled as beam-column. Shear links were modeled using a method similar to that
proposed by Ramadan and Ghobarah (1995) with modifications in elastic stiffness of the links.
In 2013, European researchers (Della Corte et al. 2013) performed analytical and numerical
study on shear links made of European shapes HE and IPE, to verify the link plastic overstrength
factor. They proposed a simple analytical model based on the results of finite element model,
validated by some experimental tests. The shear links were developed in ABAQUS, using four
nodes shell elements. Based on their FE model and comparing its results with the available
experimental data, they concluded that for very short links with compact cross section, the shear
strength equal to 2 can be achieved. For compact built-up links with very short length even larger
values of shear strength can be obtained. Also, a finite element study was conducted to optimize
link member of EBFs for maximum energy dissipation (Ohsaki and Nakajima 2012). The
objective function was the plastic dissipated energy before failure. Based on the results of their
study, they concluded that the energy dissipation of the links is greatly affected by optimizing the
locations and thickness of stiffeners.
14
New Zealand Heavy Engineering Research Association (HERA) carried out an advanced finite
element analysis on EBF with removable links to verify the performance of EBFs (Mago 2013).
The FE model was developed in ABAQUS/CAE. The FEA model represents a one storey
eccentrically braced frame. The results of the FEA showed that in the collector beam,
insignificant plastic strains were observed, occurring close to the endplate under the highest
cycles of loading. These plastic strains did not influence the structural performance. It was
concluded that the welded web stiffener attracts significant local plastic strain.
Most of the finite element studies on EBFs didn't use detailed FE models which are able to
capture the local behavior of the structure. To the author's knowledge, there are very limited
detailed FE models available for multi-storey EBFs. Such a model can predict both local and
global behavior of EBFs. Also, validated detailed FE models can be a good replacement for
experimental ones for further investigations. Therefore, providing a full scale model that can
predict all the behavior of full scale real structure is necessary to avoid the high costs and efforts
made by real experiments. In this study, detailed continuous finite element models of short,
medium and high-rise EBFs were created to study the local and global behavior of EBFs in
response to seismic loading.
2.3. Capacity design methodology for EBFs
Some of the early experimental studies (Popov et al. 1987, Popov and Engelhardt 1988) are the
basis of design recommendations that are currently used in Canadian standard for steel structures
(CSA 2009). In 1988, based on the results of experimental works on three and six storey EBFs
and on the links with equal and unequal end moments, Popov and Engelhardt proposed the
capacity design principles for EBFs. In the capacity design procedure, some elements within the
15
structural system are designed to dissipate energy by their inelastic activity, while limiting the
behavior of the other members within the elastic range. In EBFs, the links are designed for
yielding and strain hardening, and the other elements are designed for the forces of fully yielded
links. This assures that all the members of EBFs except for the links are strong enough to behave
elastically. They suggested three considerations for designing EBFs. Firstly, the link sections
should be selected and detailed to provide the required frame strength and ductility. Secondly,
other members of EBFs should be chosen with stronger sections in order to allow developing the
strength and ductility of the links. Finally, the ductility demand of the structure and the link
should be estimated; and the links should be detailed to meet the rotation demand. To follow
these considerations, the links must be designed for the code seismic forces, and all other
members of the frame should be designed for the ultimate forces produced by the links. The
following presents the suggested design guidelines by Popov and Engelhardt (1988) for EBFs.
Bracing arrangement
The first thing that should be decided in design of EBFs is the bracing arrangement to be used.
To choose the bracing arrangements, they recommended avoiding configurations which requires
link to column connections. To consider this recommendation, using a chevron EBF is a good
choice. Moreover, they emphasized that the brace to the beam angle should be chosen more than
40 degrees in order to avoid high axial forces in the beams and links resulting in strength and
stability problems.
16
Link length
Another important decision is choosing the link length at the preliminary stages. They suggested
using short shear link because of its high energy dissipation capacity and ductility. To assure that
the selected links is yielding in shear, they recommended using equation 2.1. Based on the
previous experimental researches, they stated that considerable strain hardening could occur in
shear links, resulting in ultimate shear forces of p1.4 to 1.5V . For shear links, the link end
moments are considerably greater than PM , leading into flanges strains. In order to avoid
excessive strain in flanges, they recommended limiting link end moments to P1.2M . Assuming
perfect plasticity and no M-V interaction, the link length was recognized to be equal to P p2M / V .
Substituting pV by p1.5V and PM with P1.2M , equation 2.1 can be derived.
P pe 1.6M / V≤ 2.1
They recommended this equation to guarantee shear yielding of the links. For preliminary
decision making, using link length on the order of 1 to P p1.3M / V was found effective.
Link size
The first section which should be chosen in EBFs corresponds to the links. The links must be
sized for seismic level forces considering the free body diagram shown in Figure 2.1.
17
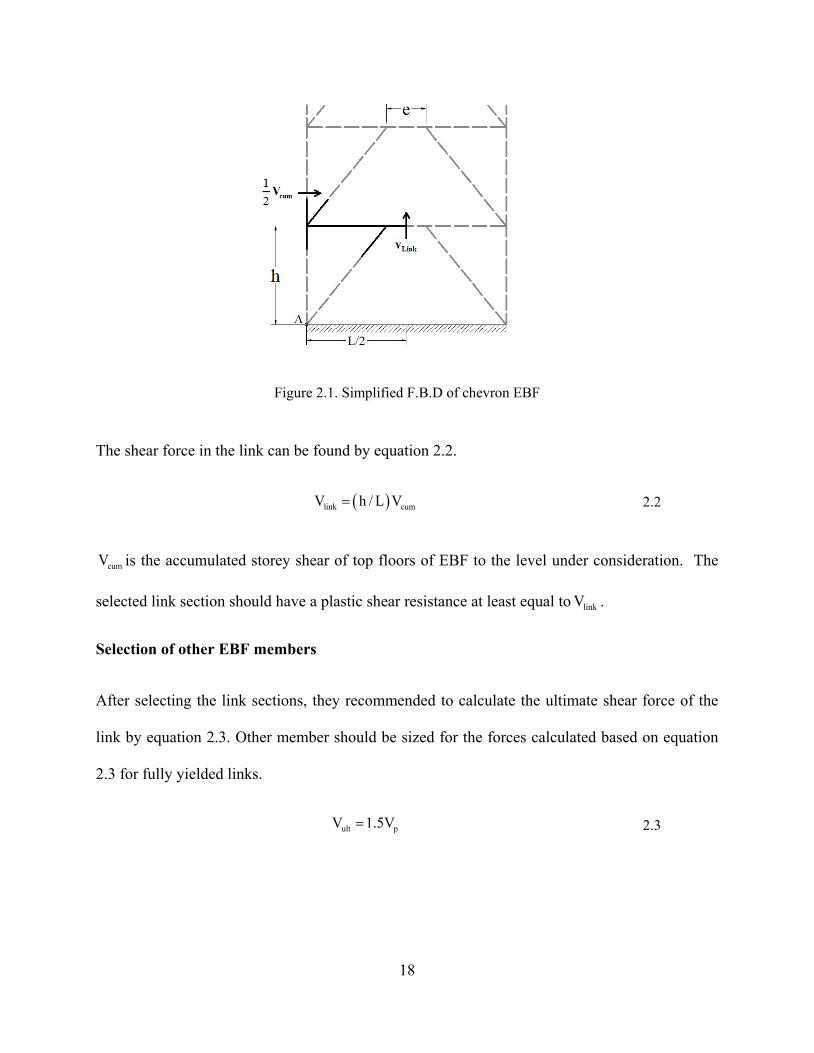
Figure 2.1. Simplified F.B.D of chevron EBF
The shear force in the link can be found by equation 2.2.
( )link cumV h / L V= 2.2
cumV is the accumulated storey shear of top floors of EBF to the level under consideration. The
selected link section should have a plastic shear resistance at least equal to linkV .
Selection of other EBF members
After selecting the link sections, they recommended to calculate the ultimate shear force of the
link by equation 2.3. Other member should be sized for the forces calculated based on equation
2.3 for fully yielded links.
ult pV 1.5V= 2.3
18
Based on the previous experiments, they explained that sometimes the ultimate shear forces in
the links were observed higher than p1.5V . Therefore, they suggested to design the braces
conservatively.
For the beam outside the link (outer beam), since it is subjected to a large axial force and larger
bending moment, they suggested to design it as beam-column. They explained that larger angle
between brace and beam could reduce the axial forces in the beams. To prevent instability in the
beams because of the presence of the high axial forces, using lateral bracing was recommended
by Popov and Engelhardt. Also, Columns should be designed to behave elastically under
ultimate link forces and gravity load effects.
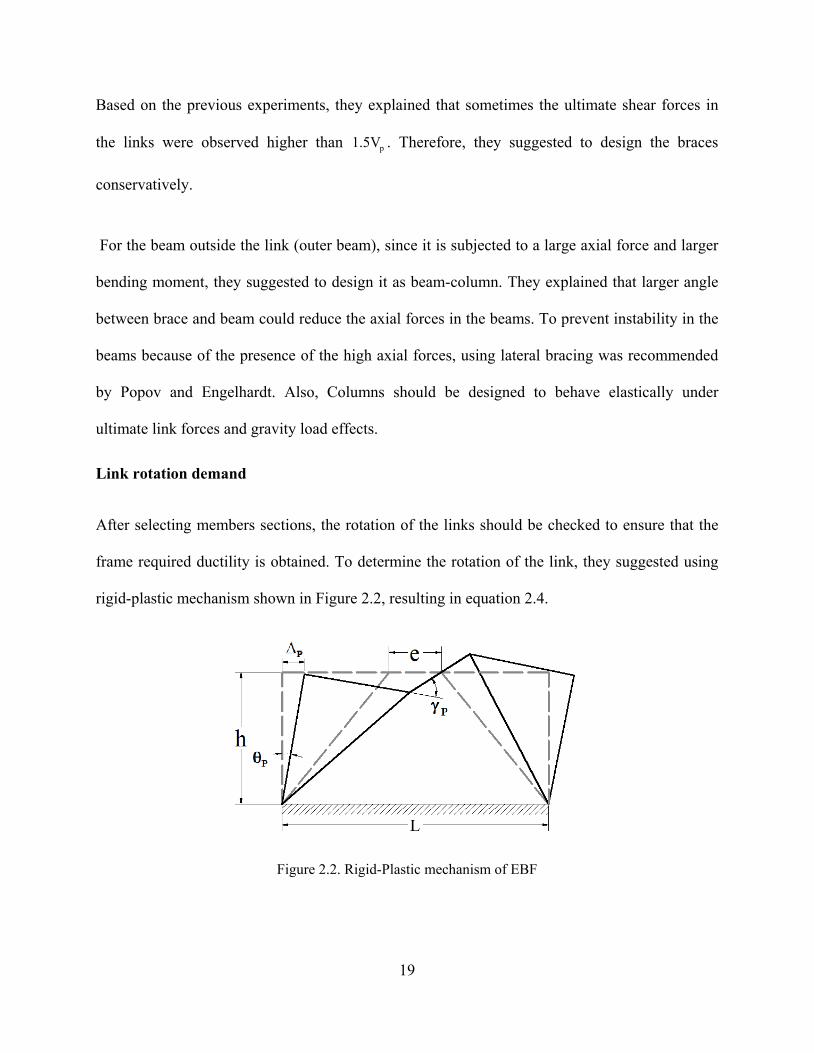
Link rotation demand
After selecting members sections, the rotation of the links should be checked to ensure that the
frame required ductility is obtained. To determine the rotation of the link, they suggested using
rigid-plastic mechanism shown in Figure 2.2, resulting in equation 2.4.
Figure 2.2. Rigid-Plastic mechanism of EBF
19
p pLe
γ = θ
2.4
where θ is ultimate frame drift angle. The elastic drift can be calculated under code level forces
and then multiplied by a factor to account for ultimate drift.
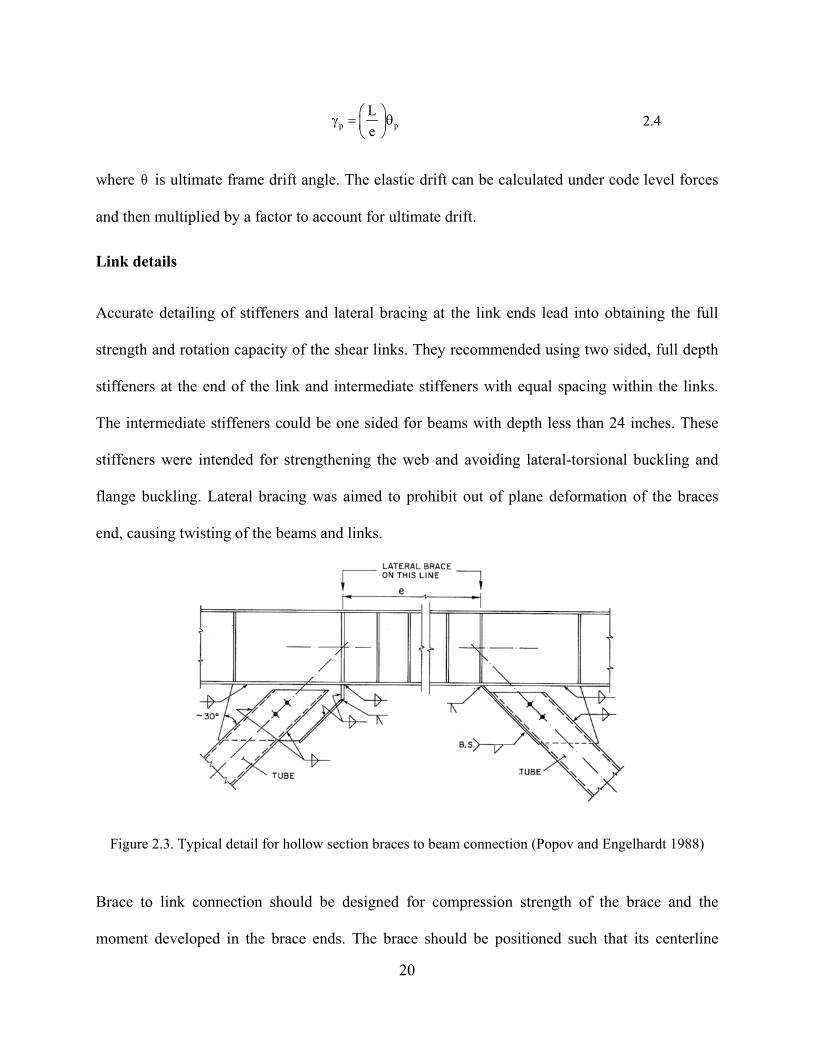
Link details
Accurate detailing of stiffeners and lateral bracing at the link ends lead into obtaining the full
strength and rotation capacity of the shear links. They recommended using two sided, full depth
stiffeners at the end of the link and intermediate stiffeners with equal spacing within the links.
The intermediate stiffeners could be one sided for beams with depth less than 24 inches. These
stiffeners were intended for strengthening the web and avoiding lateral-torsional buckling and
flange buckling. Lateral bracing was aimed to prohibit out of plane deformation of the braces
end, causing twisting of the beams and links.
Figure 2.3. Typical detail for hollow section braces to beam connection (Popov and Engelhardt 1988)
Brace to link connection should be designed for compression strength of the brace and the
moment developed in the brace ends. The brace should be positioned such that its centerline
20
meets the beam centerline at the end or inside the link. Stiffening the gusset plate ends close to
the links are also recommended where the bending moments in the beam causes large stress
along the edge of gusset plate.
For EBFs design, the same design philosophy and considerations is currently used in CSA
(2009) with some modifications in the recommended values and factors for calculating member
forces, link rotations, etc. The current Canadian standard (CSA 2009) criteria for designing
eccentrically braced frames are discussed in detail in chapter 4.
2.4. Performance Evaluation of EBFs
Seismic performance evaluation of structures is an important part of the performance based
design process which gives an estimation of the probable responses of the structure to earthquake
hazards. Performance based design is a new design philosophy in which the design criteria are
defined based on a specified level of performance under a particular level of seismic hazard.
Then the performance of the designed structure should be assessed to determine the probable
responses of the system in the case of extreme loading. If the designed structure doesn't meet the
performance objective, it should be modified until the objectives are met. On the other hand, the
typical design process suggested by the building codes is not performance based. In the typical
design process, the members of the structure should be selected to satisfy some specific criteria
suggested by the building codes. Some of these criteria were provided to satisfy some level of
seismic performance; however, the real seismic performance of the structure is not evaluated at
the design level. Therefore, providing simple methods to assess the performance of the structures
accurately is advantageous for both performance-based and code-based design procedures. Also,
21
the application of the provided methods in accurate prediction of seismic responses should be
evaluated for every new system.
In order to evaluate seismic performance of various types of structures, different analysis
methods are suggested by the guidelines (FEMA-273 1997, FEMA-356 2000). These analysis
procedures can be classified as linear analysis methods including response spectrum analysis and
linear time history analysis; and non-linear analysis procedures consisting of non-linear static
procedure (NSP) and non-linear time history analysis (NLTHA).
The response spectrum method is a linear dynamic analysis method which estimates the peak
modal responses of a structure using the response spectrum of a selected ground motion. The
peak modal responses should then be combined using a modal combination rule such as
Complete Quadratic Combination (CQC) or Square Root of Sum of Squares (SRSS) to
determine total response quantities. Linear time history analysis solves the equation of motion
corresponding to a structure using an appropriate numerical method to estimate the seismic
responses at each time step. However, these methods are limited to the structures in low to
moderate seismic zones, where the responses of the structure are mainly elastic. For irregular
structures, or for structures with highly non-linear responses, these procedures may lead into
wrong results.
On the other hand, non-linear dynamic procedure can be used for any structure and it can provide
the most accurate results. However, this method is complicated and it needs high computational
demands. Therefore non-linear static procedure is suggested as a more simple method to predict
seismic responses of the structure. Pushover analysis method is a non-linear static procedure
offered by current guidelines (FEMA-273, FEMA-356) as a practical method to evaluate seismic 22
demands of structures. In this method, a predefined force distribution is applied to a multi-storey
structure increasingly to reach a target displacement. This method is used to determine the force
deformation relation of the structure; through which other performance parameters can be
evaluated. The pushover method is defined based on two assumptions. Firstly, it assumes that the
mode shape of the structure doesn’t change even after yielding; secondly, it limits the response
of the structure to its fundamental mode. Although both assumptions influence the results,
several researches (Saiidi and Sozen 1981, Fajfar and Fischinger 1988, Krawinkler and
Seneviratna 1998, Skokan and Hart 2000) indicated that the responses of the structure are still
accurate. Krawinkler and Seneviratna (1998) confined the accuracy of NSP responses to low- to
medium-rise structures, behavior of which are dominated by the first mode. However, this
method is not very accurate in prediction of seismic responses of high-rise buildings whose
responses are contributed by higher modes.
To overcome the latter limitation of pushover method, Chopra and Goel (2001) proposed an
improved pushover analysis called modal pushover, in which the contributions of all important
modes of vibration to the responses were combined. While keeping the simplicity of NSP, modal
pushover method provides more accurate results through considering higher mode contributions
to seismic responses of structures. In this method, the lateral distributed forces of each mode
should be firstly determined. Applying these forces to the multi-storey structure, provides the
base shear-roof displacement curve; idealizing which, results into the force-deformation relation
of a single degree of freedom (SDOF) system corresponding to each mode. Solving the equations
of motion of SDOF systems gives the peak deformation which can be converted to the peak roof
displacement of MDOF structure. This peak roof displacement can be finally used to determine
other response parameters of interest using the provided pushover curves of MDOF system. The
23
total responses can be obtained by preferred modal combination rules. The results of proposed
modal pushover analysis can be improved by including the p-delta effects due to gravity loads in
all considered modes (Goel and Chopra 2004). The accuracy of MPA were examined by
applying to the SAC buildings (Goel and Chopra 2004), and to sixty regular and forty eight
irregular frames, concluding the superior accuracy of MPA Comparing to the conventional
pushover procedure (Chintanapakdee and Chopra 2003). Although, MPA method was reported
as a good estimation of seismic demands for studied structures; it still needs to be examined for
every new system, especially when the nonlinearity matters. Because in this case, there would be
some errors arising from the underlying assumptions of MPA, including neglecting the coupling
of modal coordinates nq (t) for nonlinear systems, and assuming the force deformation relation
of the SDOF systems as bilinear curves (Chopra and Goel 2001). To the author's knowledge, no
research has been conducted on the application of modal pushover analysis on EBFs to date. In
this research, the accuracy of modal pushover analysis method on predicting seismic demand of
EBFs is evaluated by comparing MPA results with the results of nonlinear time-history analysis
for short, medium and high-rise EBFs.
24
Chapter 3. Finite Element Modeling of Eccentrically Braced Frames
3.1. Introduction
The main objective of this chapter is to develop a reliable finite element model that can simulate
the behavior of ductile eccentric braced frame. To study the behavior of eccentrically braced
frame, a 3D nonlinear finite element model was developed in ABAQUS (Hibbitt and Sorensen
2011). ABAQUS is a general purpose finite element software solving different static, quasi-
static, and dynamic problems. ABAQUS/CAE offers a user-friendly modeling and visualization
environment with advanced meshing capability. ABAQUS has also extensive element and
material libraries, making it appropriate to solve problems involving material and geometry non-
linearities. This chapter describes the details of the development of the finite element model.
Several key features of finite element model, such as selection of analysis procedure, element
definition, and material properties definitions are discussed first. The validity of the finite
element model is examined using available experimental results. The validated model is then
used for FE modeling of three multi-storey EBFs designed based on the capacity design
approach suggested by CSA S16-09 (CSA 2009). The capacity design procedure for EBFs is also
explained in detail and the final selected sections are presented.
3.2. Selection of Finite Element Analysis Procedures
There are different dynamic analysis options to solve both linear and non-linear problems in
ABAQUS. For severe nonlinear dynamic problems, ABAQUS suggests direct time integration of
all degrees of freedom of the FE model. ABAQUS classifies the dynamic integration operators
into two main categories of implicit and explicit. In the explicit approach, the values of dynamic
25
responses at a time instant ( t t+ ∆ ) can be determined based on the values at the previous instant
(t). Thus, there is no need to form and invert the global mass and stiffness matrices. This makes
the solution of each time step inexpensive. However, this approach is conditionally stable,
meaning that the time increment should be small in compare to the time increment in the
implicit, to provide a stable and an accurate solution. This smaller time step largely increases the
computational demands. ABAQUS/Standard employs the Hilber-Hughes-Taylor time integration
method which is an implicit operator. In the implicit dynamic, the values of responses at time
t t+ ∆ are determined based on the values at both instants t and t t+ ∆ , so the unknown quantities
exist in both sides of the equations. Therefore, a set of nonlinear equilibrium equations must be
solved at each time increment simultaneously. Since this operator is unconditionally stable, the
size increment can be relatively large. The implicit approach was used for all the analyses in this
thesis. This method is preferred because it is using relatively large time increment sizes while it
assures the stability of the system.
3.3. Finite Element Model Specifications
3.3.1. Geometry and mesh
For finite element modeling of EBFs, efforts were made to create a FE model which precisely
represents the similar experimental models. For all the selected EBFs, the dimensions of the
frame geometry and the section were accurately extracted from the available data and were used
for the finite element modeling. The details of the test specimen and designed multi-storey EBFs
are presented in the sections 3.5 and 3.7 respectively.
26
One of the important factors in finite element modeling is selection of the appropriate mesh size
for the FE model, because it directly influences the accuracy of the results and the computational
demands. Using a coarse mesh may result into imprecise solution; on the other hand, employing
a finer mesh may increase the accuracy of the results; but it also increases the computation time.
Therefore, it is important to perform the mesh convergence study to find the optimum mesh
sizes. For the experimental specimen, since it is a one-storey EBF on which the pushover
analysis was conducted, using a fine mesh was not computationally expensive. However, for the
designed multi-storey EBFs which should be employed for nonlinear time history analysis,
finding the optimum mesh size is very important. To investigate the optimal mesh size, four
different mesh sizes, varied from 4500 to 45000 elements, were selected for the designed 4-
storey EBF. For each selected mesh, the top storey displacement and the maximum von Mises
stress under equivalent lateral forces were extracted as the convergence criteria. Figure 3.1
shows the results and their variation with respect to the fine mesh for different mesh sizes. Since
obtaining the stresses convergence is usually more difficult than the displacements, their results
variations are also more considerable, with the maximum variation of %15 for the coarser mesh
and minimum difference of %0.41 for the normal mesh. These variations are less significant for
the displacement, with the maximum of %3.1 for the coarser mesh and the minimum of 0.2% for
the normal mesh. As it can be seen from the Figure 3.1, the normal mesh with 13737 elements is
the optimal mesh size for this structure; because, it not only represents a much higher accuracy
comparing to the coarser meshes, but also it decreases the computational demands significantly
comparing to the finer mesh with 45256 elements which raises the precision of the results only
0.4%. The results of this mesh study were used for judgment of the mesh sizes for the 8 and 14-
storey EBFs.
27
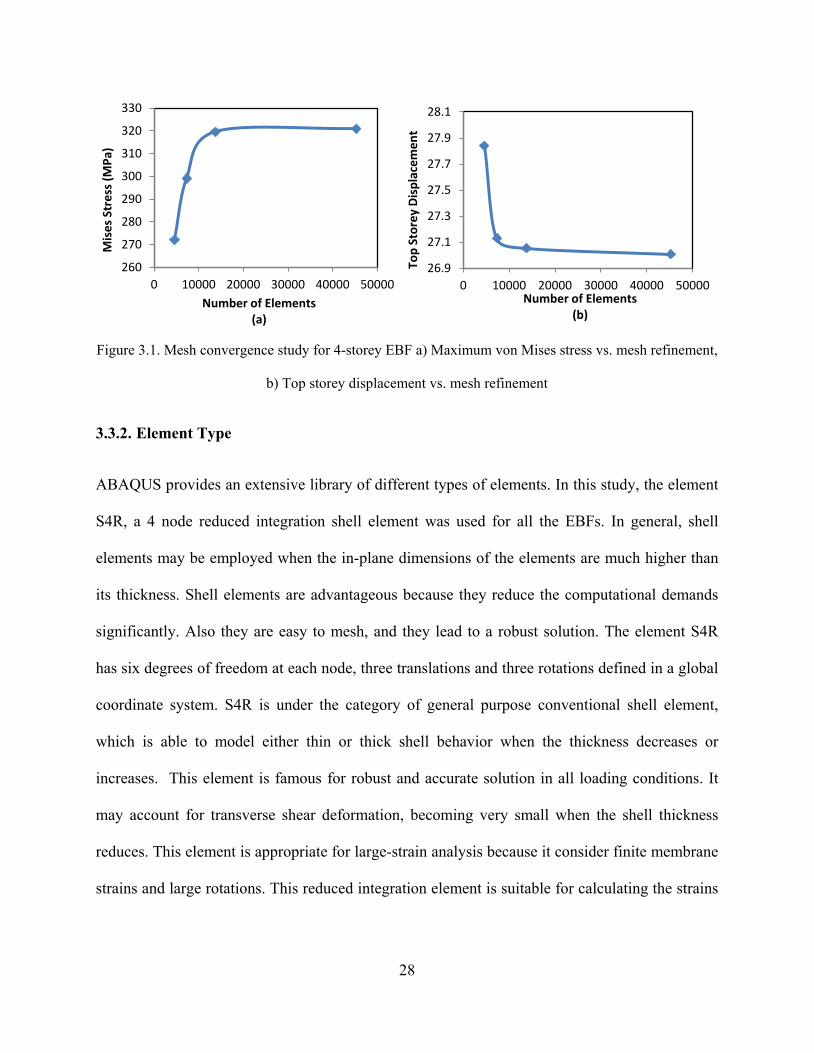
Figure 3.1. Mesh convergence study for 4-storey EBF a) Maximum von Mises stress vs. mesh refinement,
b) Top storey displacement vs. mesh refinement
3.3.2. Element Type
ABAQUS provides an extensive library of different types of elements. In this study, the element
S4R, a 4 node reduced integration shell element was used for all the EBFs. In general, shell
elements may be employed when the in-plane dimensions of the elements are much higher than
its thickness. Shell elements are advantageous because they reduce the computational demands
significantly. Also they are easy to mesh, and they lead to a robust solution. The element S4R
has six degrees of freedom at each node, three translations and three rotations defined in a global
coordinate system. S4R is under the category of general purpose conventional shell element,
which is able to model either thin or thick shell behavior when the thickness decreases or
increases. This element is famous for robust and accurate solution in all loading conditions. It
may account for transverse shear deformation, becoming very small when the shell thickness
reduces. This element is appropriate for large-strain analysis because it consider finite membrane
strains and large rotations. This reduced integration element is suitable for calculating the strains
260
270
280
290
300
310
320
330
0 10000 20000 30000 40000 50000
Mis
es S
tres
s (M
Pa)
Number of Elements (a)
26.9
27.1
27.3
27.5
27.7
27.9
28.1
0 10000 20000 30000 40000 50000
Top
Stor
ey D
ispl
acem
ent
Number of Elements (b)
28
and stresses in the points with optimal accuracy. Also reducing the number of integration points
leads into reduction of CPU usage and storage space.
3.3.3. Material Properties
The comprehensive material library available in ABAQUS offers various material properties to
be able to represent the real material behavior closely. The material properties can be found from
the available stress vs. strain data of steel obtained from tension coupon tests. For finite element
validation, tension coupon test was not provided for the end plate connected link (Figure 3.2) as
the original researcher reported (Mansour 2010). However, Mansour suggested employing the
material model calibrated by Korzekwa and Tremblay (2009) for finite element modeling. This
material model was developed for steel plates made of G40.21-350WT steel with nominal yield
strength 350 MPa and tensile strength 450 MPa. For seismic analysis, the non-linear material
behavior was modeled using an elasto-plastic stress-strain curve with the strain hardening of 2%
of the elastic stiffness, and by considering the kinematic hardening rule and von Mises yield
criteria. A 5% proportional damping ratio was used in all seismic analyses. For all pushover
analyses, the non-linear isotropic hardening was employed.
3.3.4. Boundary Conditions
In the FE modeling, it was attempted to have similar boundary conditions (BCs) to the
corresponding experiment. The columns were modeled to have pin support condition at the base.
Connection between the link and the floor beam was defined by common nodes to be able to
transfer the forces and moments created by the strain-hardened link. Also the connection
between the braces and the beam are moment connections. All other connections were
considered as pin connections. Lateral supports were also provided to restrain the out of plane
29
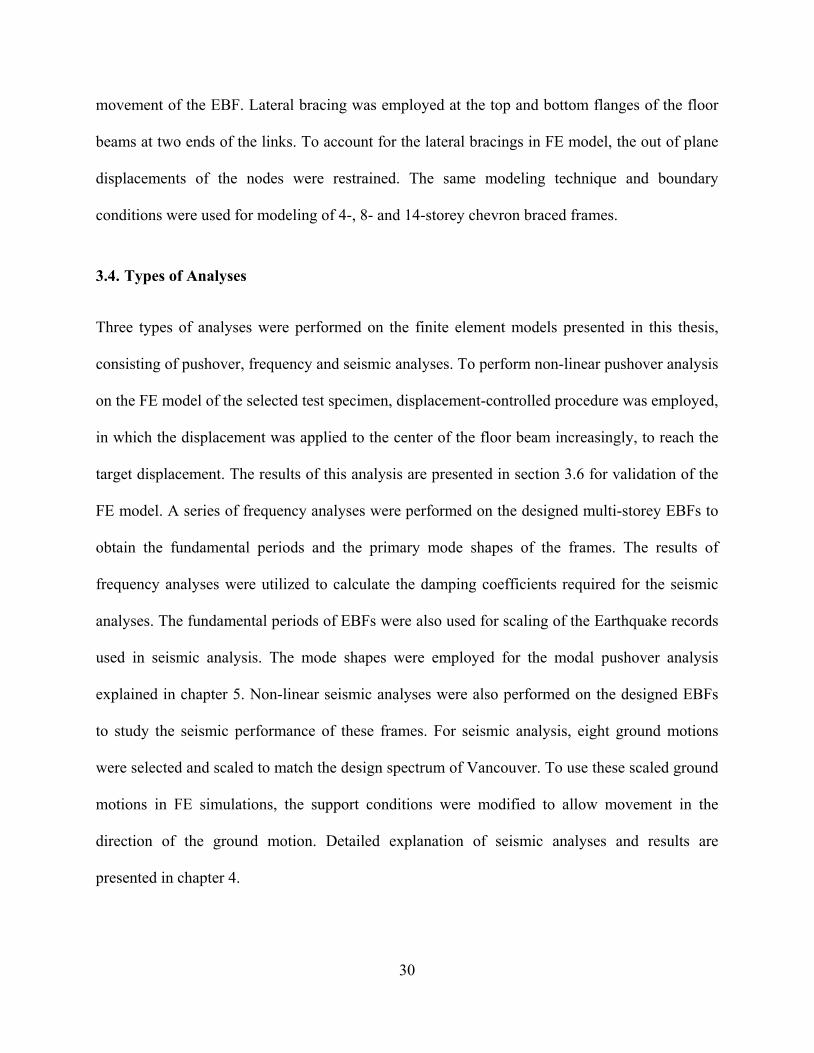
movement of the EBF. Lateral bracing was employed at the top and bottom flanges of the floor
beams at two ends of the links. To account for the lateral bracings in FE model, the out of plane
displacements of the nodes were restrained. The same modeling technique and boundary
conditions were used for modeling of 4-, 8- and 14-storey chevron braced frames.
3.4. Types of Analyses
Three types of analyses were performed on the finite element models presented in this thesis,
consisting of pushover, frequency and seismic analyses. To perform non-linear pushover analysis
on the FE model of the selected test specimen, displacement-controlled procedure was employed,
in which the displacement was applied to the center of the floor beam increasingly, to reach the
target displacement. The results of this analysis are presented in section 3.6 for validation of the
FE model. A series of frequency analyses were performed on the designed multi-storey EBFs to
obtain the fundamental periods and the primary mode shapes of the frames. The results of
frequency analyses were utilized to calculate the damping coefficients required for the seismic
analyses. The fundamental periods of EBFs were also used for scaling of the Earthquake records
used in seismic analysis. The mode shapes were employed for the modal pushover analysis
explained in chapter 5. Non-linear seismic analyses were also performed on the designed EBFs
to study the seismic performance of these frames. For seismic analysis, eight ground motions
were selected and scaled to match the design spectrum of Vancouver. To use these scaled ground
motions in FE simulations, the support conditions were modified to allow movement in the
direction of the ground motion. Detailed explanation of seismic analyses and results are
presented in chapter 4.
30
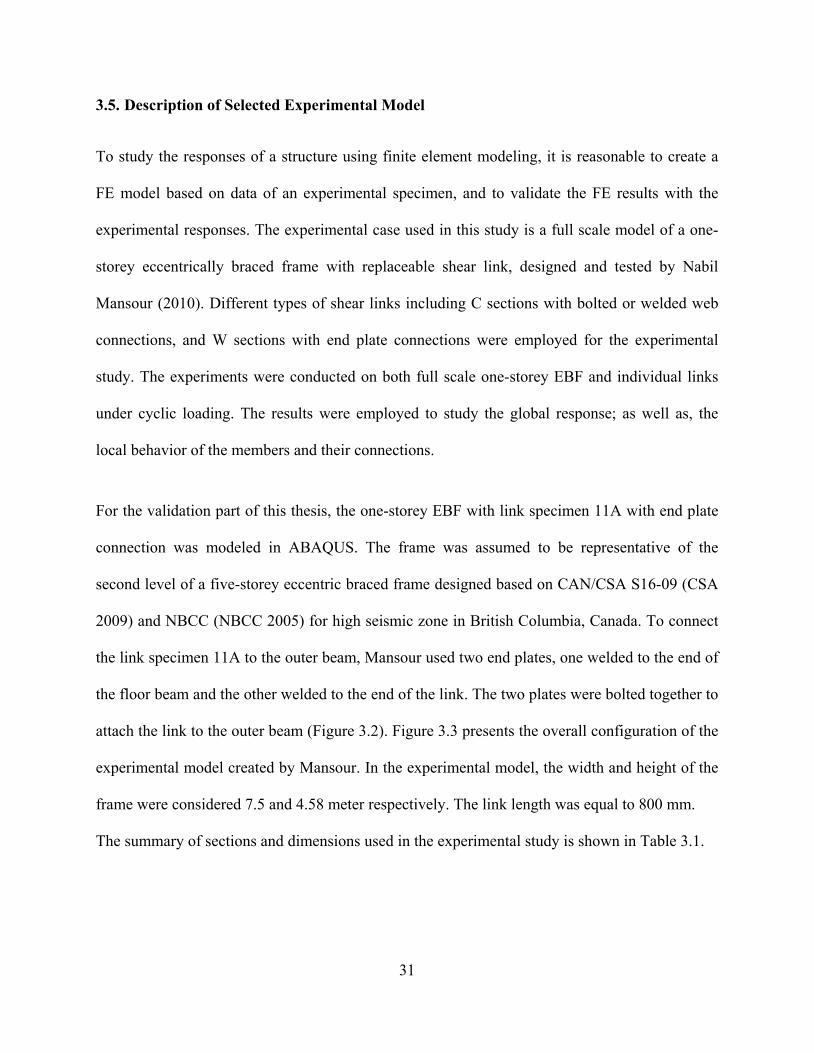
3.5. Description of Selected Experimental Model
To study the responses of a structure using finite element modeling, it is reasonable to create a
FE model based on data of an experimental specimen, and to validate the FE results with the
experimental responses. The experimental case used in this study is a full scale model of a one-
storey eccentrically braced frame with replaceable shear link, designed and tested by Nabil
Mansour (2010). Different types of shear links including C sections with bolted or welded web
connections, and W sections with end plate connections were employed for the experimental
study. The experiments were conducted on both full scale one-storey EBF and individual links
under cyclic loading. The results were employed to study the global response; as well as, the
local behavior of the members and their connections.
For the validation part of this thesis, the one-storey EBF with link specimen 11A with end plate
connection was modeled in ABAQUS. The frame was assumed to be representative of the
second level of a five-storey eccentric braced frame designed based on CAN/CSA S16-09 (CSA
2009) and NBCC (NBCC 2005) for high seismic zone in British Columbia, Canada. To connect
the link specimen 11A to the outer beam, Mansour used two end plates, one welded to the end of
the floor beam and the other welded to the end of the link. The two plates were bolted together to
attach the link to the outer beam (Figure 3.2). Figure 3.3 presents the overall configuration of the
experimental model created by Mansour. In the experimental model, the width and height of the
frame were considered 7.5 and 4.58 meter respectively. The link length was equal to 800 mm.
The summary of sections and dimensions used in the experimental study is shown in Table 3.1.
31
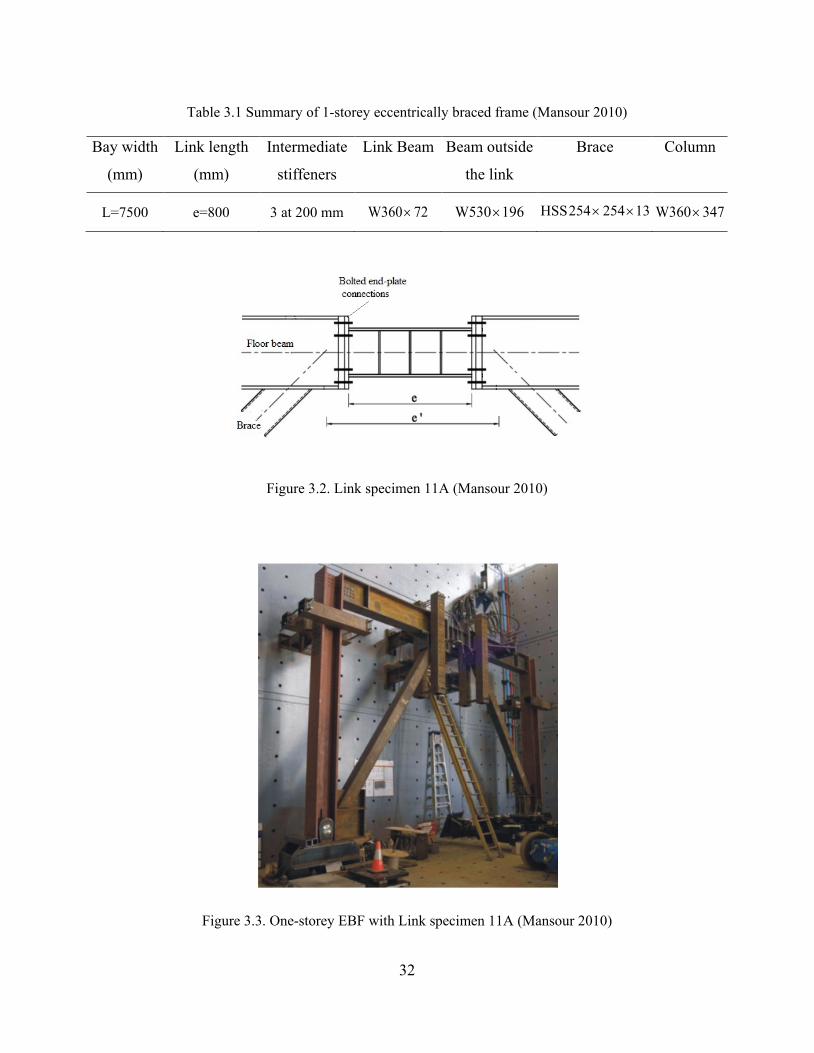
Table 3.1 Summary of 1-storey eccentrically braced frame (Mansour 2010)
Bay width
(mm)
Link length
(mm)
Intermediate
stiffeners
Link Beam Beam outside
the link
Brace Column
L=7500 e=800 3 at 200 mm W360 72× W530 196× HSS254 254 13× × W360 347×
Figure 3.2. Link specimen 11A (Mansour 2010)
Figure 3.3. One-storey EBF with Link specimen 11A (Mansour 2010)
32
3.6. Validation of Finite Element Model
The results of the finite element model were validated using the results of the one-storey EBF
with end plate connected link conducted by Nabil Mansour (2010). Displacement controlled
analysis was used for validation of the experimental model. Based on the reported results of
experimental work, the maximum total frame drift was reported equal to 1.7% corresponding to
the link rotation of γ =0.11 rad. Using equation 3.1, the lateral frame displacement was found
around 78 mm. This displacement was applied to the center of the floor beam, and the structure
was pushed increasingly to reach the target displacement obtained from the experimental test.
12Dh
θ =
3.1
where θ is total storey drift, 12D is lateral frame displacement, and h is height of the frame.
Figure 3.4. FE Model of 1-storey specimen tested by Mansour (2010)
33
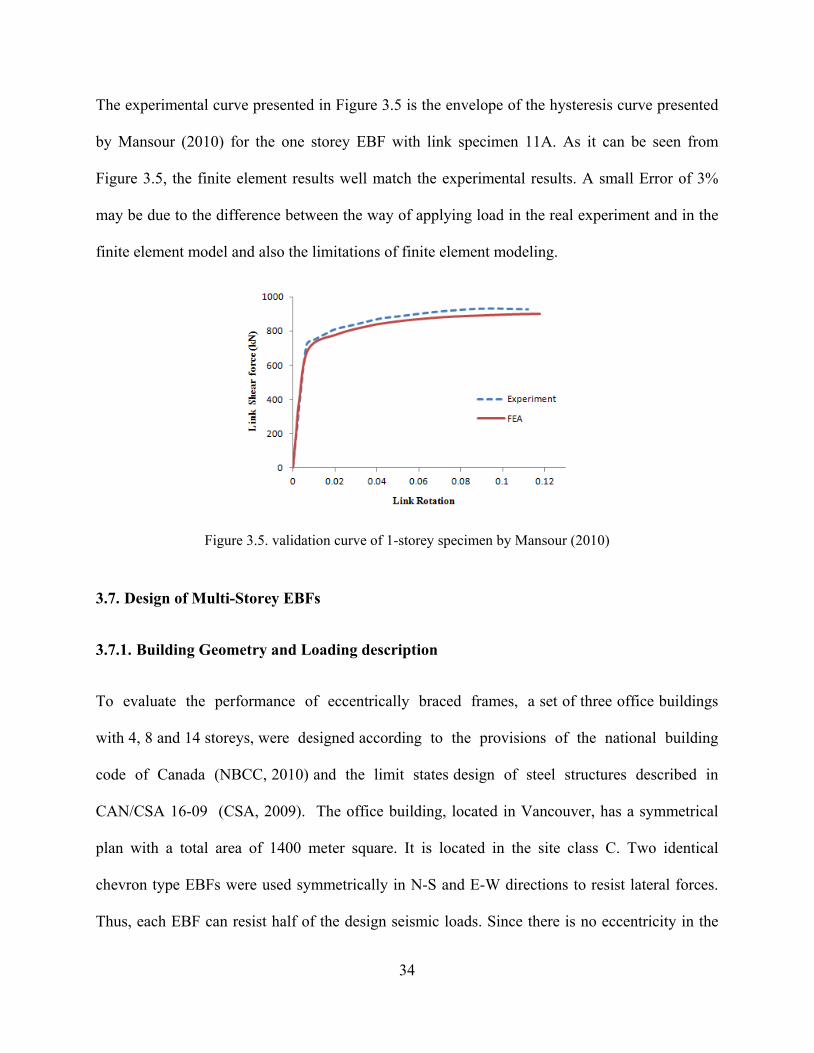
The experimental curve presented in Figure 3.5 is the envelope of the hysteresis curve presented
by Mansour (2010) for the one storey EBF with link specimen 11A. As it can be seen from
Figure 3.5, the finite element results well match the experimental results. A small Error of 3%
may be due to the difference between the way of applying load in the real experiment and in the
finite element model and also the limitations of finite element modeling.
Figure 3.5. validation curve of 1-storey specimen by Mansour (2010)
3.7. Design of Multi-Storey EBFs
3.7.1. Building Geometry and Loading description
To evaluate the performance of eccentrically braced frames, a set of three office buildings
with 4, 8 and 14 storeys, were designed according to the provisions of the national building
code of Canada (NBCC, 2010) and the limit states design of steel structures described in
CAN/CSA 16-09 (CSA, 2009). The office building, located in Vancouver, has a symmetrical
plan with a total area of 1400 meter square. It is located in the site class C. Two identical
chevron type EBFs were used symmetrically in N-S and E-W directions to resist lateral forces.
Thus, each EBF can resist half of the design seismic loads. Since there is no eccentricity in the
34
building, the effect of accidental torsion was only considered in the design. It was calculated
using equation ( )nx x0.10D F± , where xF is the lateral load force at each level and nxD is the plan
dimension of the building at level x perpendicular to the direction of seismic loading (NBCC,
2010). Based on the calculations, a 5% increase in the lateral loads may account for the
accidental torsion for the current building. Notional lateral loads equal to 0.5% of the factored
gravity loads, were also applied at each storey to consider the initial imperfections and
partial yielding in the column (CSA, 2009). The typical floor plan and elevations used for this
study are shown in Figure 3.6 and Figure 3.7 All the frames have equal bay width and storey
height of 8 and 3.8 meter respectively. The dead load and live load of the floors were taken 4.2
kPa and 2.4 kPa. The roof dead load was considered as 1.5kPa and the snow load, calculated
based on NBCC 2010 was equal to 1.82 kPa. The load combinations 1D+0.5L+E and
1D+0.25S+E were selected for the floors and the roof in compliance with NBCC 2010. The
nominal yield strength of 350 MPa and modulus of elasticity of 200,000 MPa were considered
for all the members.
35
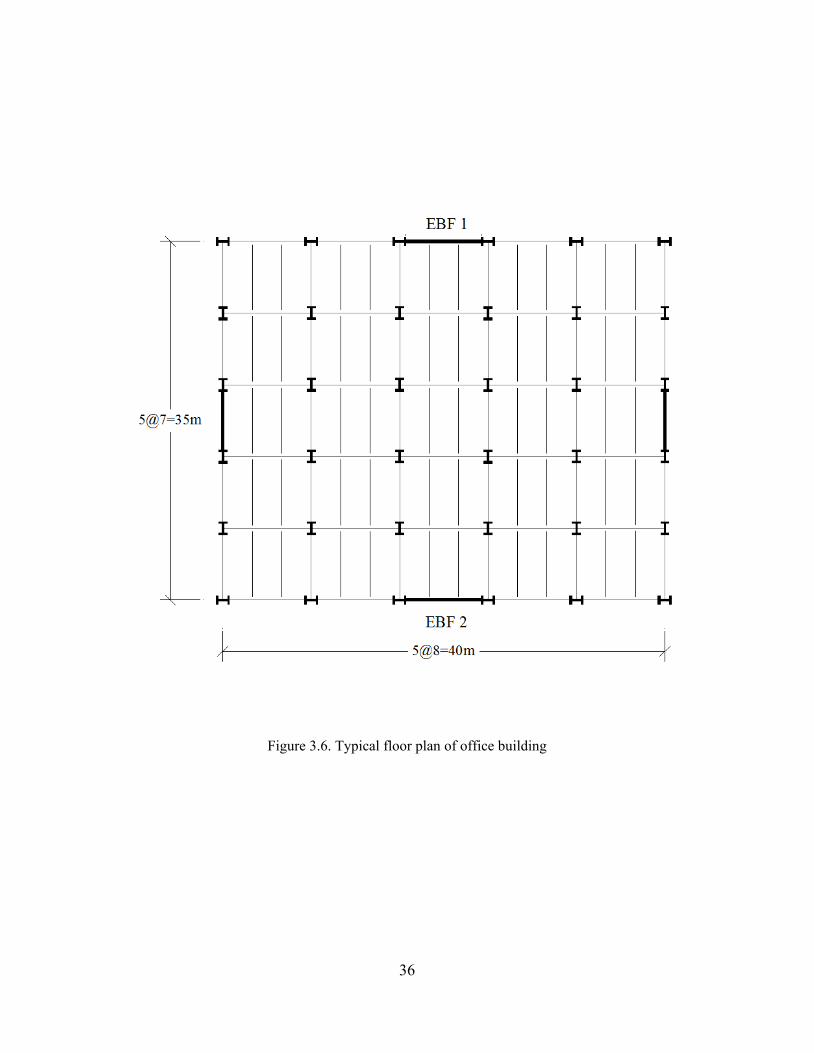
Figure 3.6. Typical floor plan of office building
36
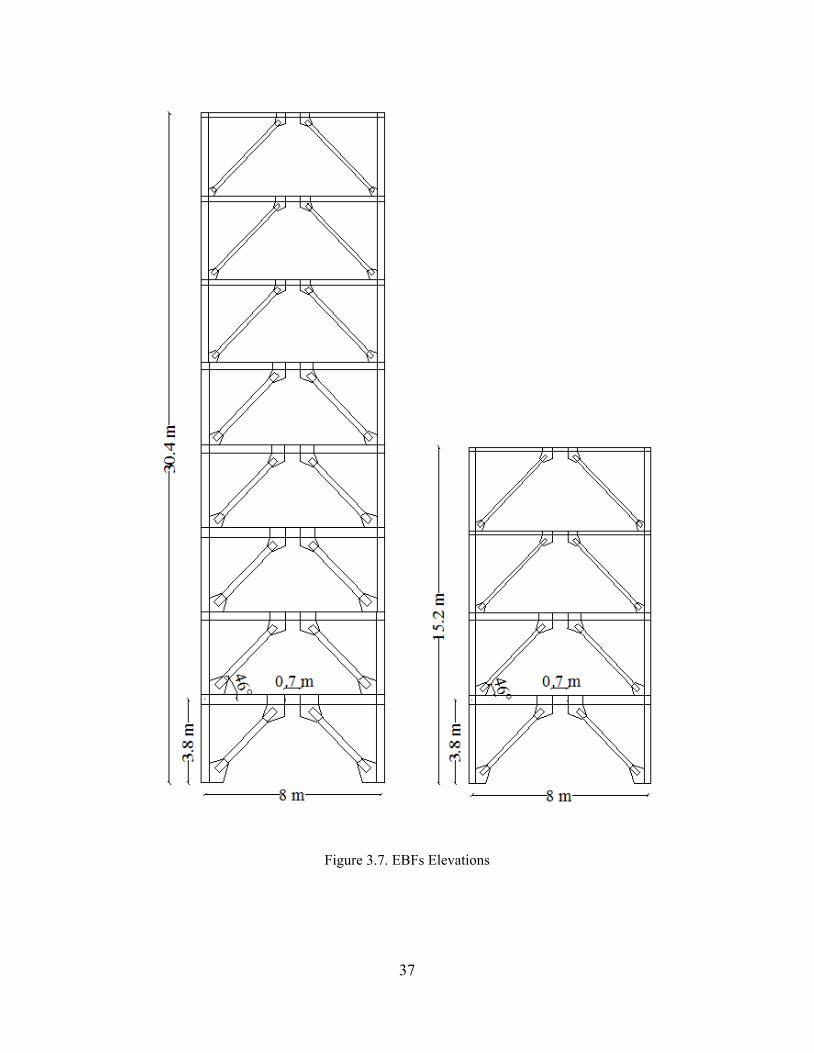
Figure 3.7. EBFs Elevations
37
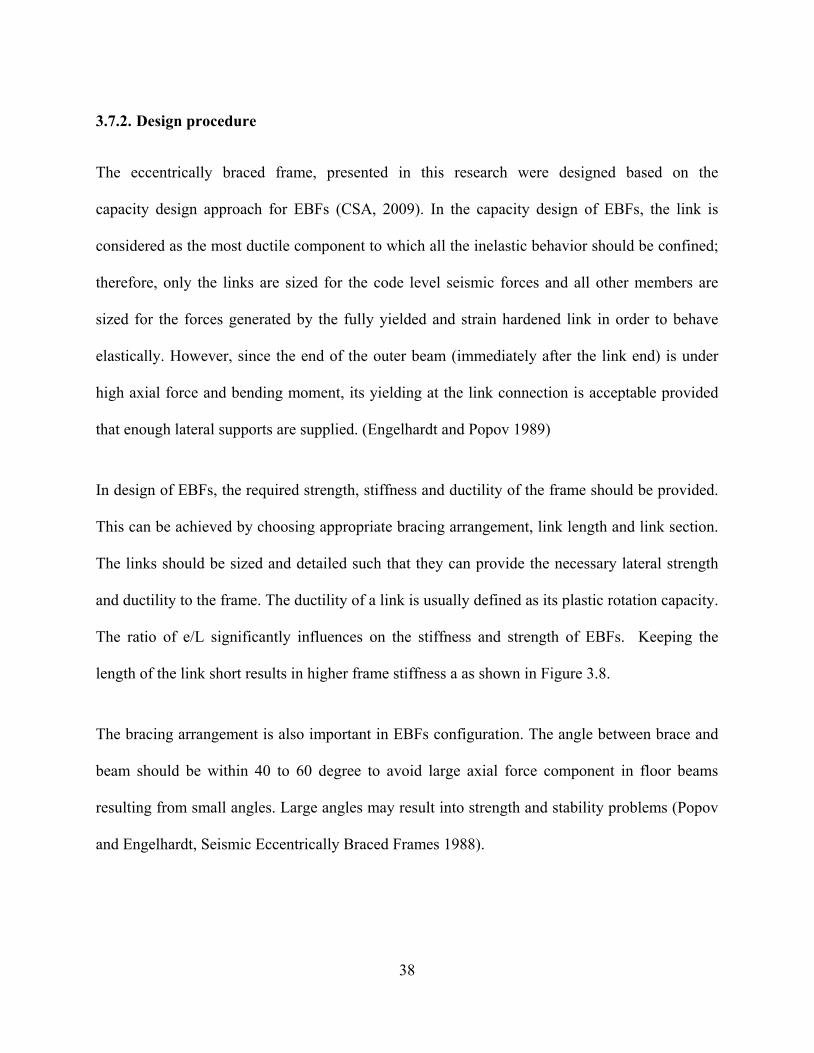
3.7.2. Design procedure
The eccentrically braced frame, presented in this research were designed based on the
capacity design approach for EBFs (CSA, 2009). In the capacity design of EBFs, the link is
considered as the most ductile component to which all the inelastic behavior should be confined;
therefore, only the links are sized for the code level seismic forces and all other members are
sized for the forces generated by the fully yielded and strain hardened link in order to behave
elastically. However, since the end of the outer beam (immediately after the link end) is under
high axial force and bending moment, its yielding at the link connection is acceptable provided
that enough lateral supports are supplied. (Engelhardt and Popov 1989)
In design of EBFs, the required strength, stiffness and ductility of the frame should be provided.
This can be achieved by choosing appropriate bracing arrangement, link length and link section.
The links should be sized and detailed such that they can provide the necessary lateral strength
and ductility to the frame. The ductility of a link is usually defined as its plastic rotation capacity.
The ratio of e/L significantly influences on the stiffness and strength of EBFs. Keeping the
length of the link short results in higher frame stiffness a as shown in Figure 3.8.
The bracing arrangement is also important in EBFs configuration. The angle between brace and
beam should be within 40 to 60 degree to avoid large axial force component in floor beams
resulting from small angles. Large angles may result into strength and stability problems (Popov
and Engelhardt, Seismic Eccentrically Braced Frames 1988).
38
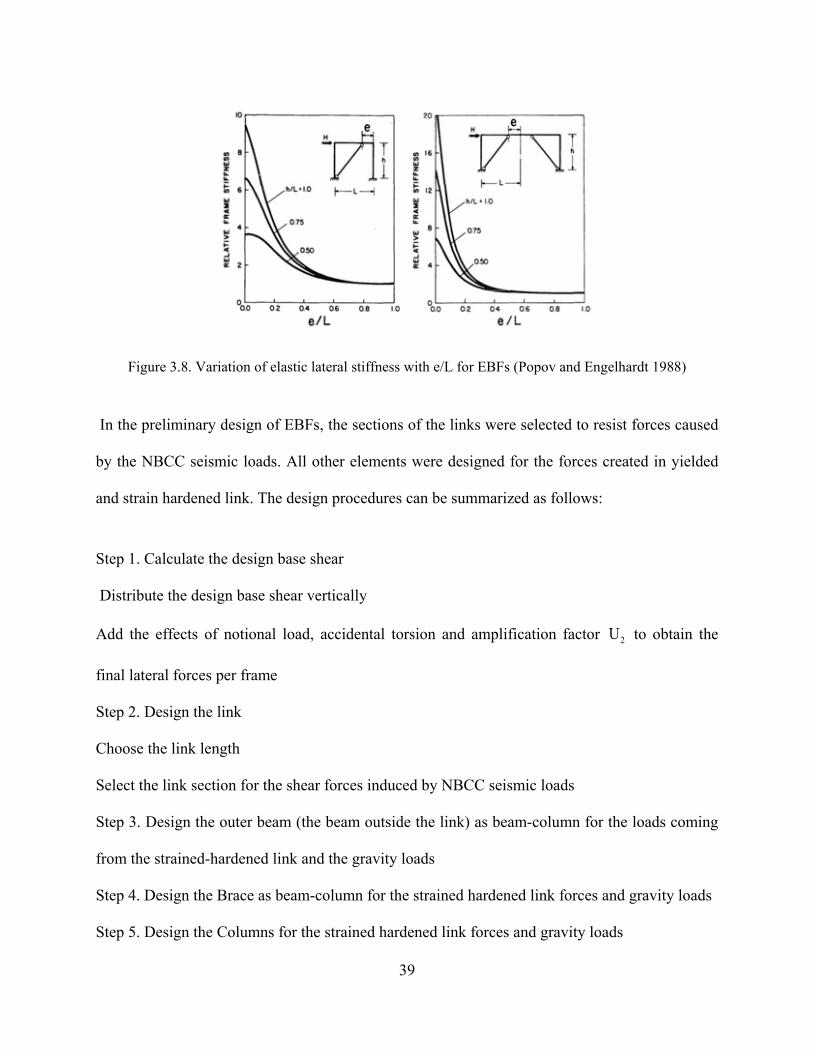
Figure 3.8. Variation of elastic lateral stiffness with e/L for EBFs (Popov and Engelhardt 1988)
In the preliminary design of EBFs, the sections of the links were selected to resist forces caused
by the NBCC seismic loads. All other elements were designed for the forces created in yielded
and strain hardened link. The design procedures can be summarized as follows:
Step 1. Calculate the design base shear
Distribute the design base shear vertically
Add the effects of notional load, accidental torsion and amplification factor 2U to obtain the
final lateral forces per frame
Step 2. Design the link
Choose the link length
Select the link section for the shear forces induced by NBCC seismic loads
Step 3. Design the outer beam (the beam outside the link) as beam-column for the loads coming
from the strained-hardened link and the gravity loads
Step 4. Design the Brace as beam-column for the strained hardened link forces and gravity loads
Step 5. Design the Columns for the strained hardened link forces and gravity loads
39
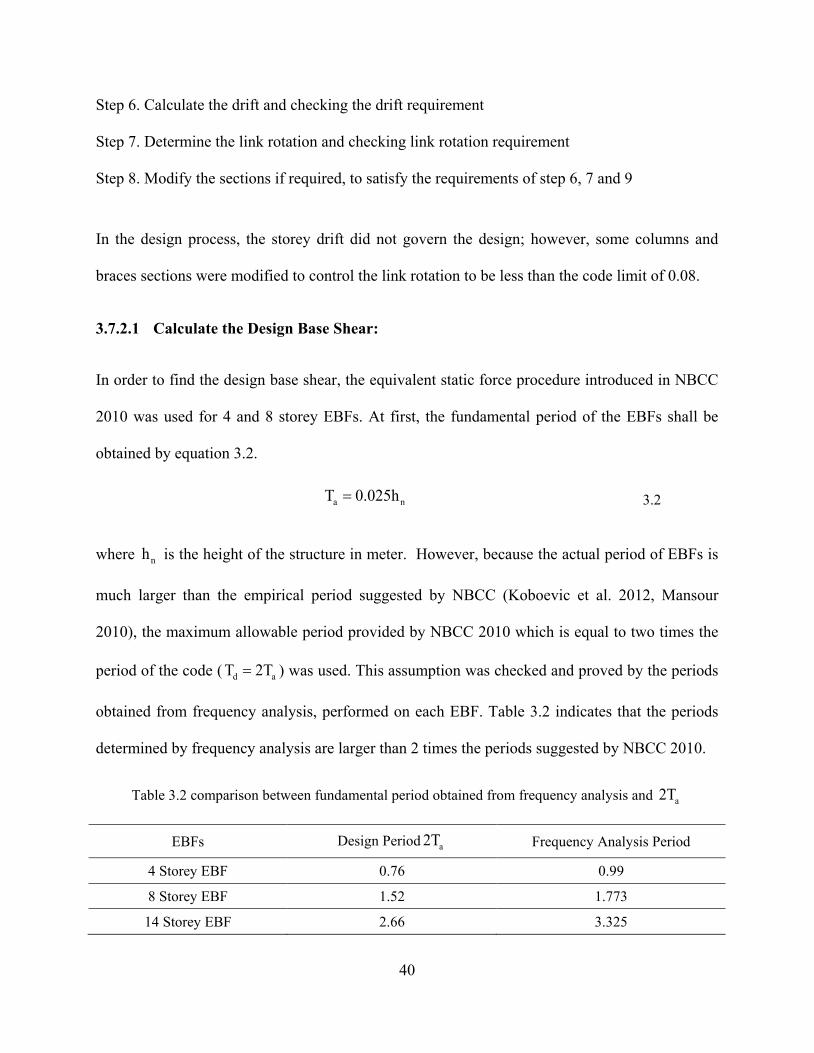
Step 6. Calculate the drift and checking the drift requirement
Step 7. Determine the link rotation and checking link rotation requirement
Step 8. Modify the sections if required, to satisfy the requirements of step 6, 7 and 9
In the design process, the storey drift did not govern the design; however, some columns and
braces sections were modified to control the link rotation to be less than the code limit of 0.08.
3.7.2.1 Calculate the Design Base Shear:
In order to find the design base shear, the equivalent static force procedure introduced in NBCC
2010 was used for 4 and 8 storey EBFs. At first, the fundamental period of the EBFs shall be
obtained by equation 3.2.
a nT 0.025h= 3.2
where nh is the height of the structure in meter. However, because the actual period of EBFs is
much larger than the empirical period suggested by NBCC (Koboevic et al. 2012, Mansour
2010), the maximum allowable period provided by NBCC 2010 which is equal to two times the
period of the code ( d aT 2T= ) was used. This assumption was checked and proved by the periods
obtained from frequency analysis, performed on each EBF. Table 3.2 indicates that the periods
determined by frequency analysis are larger than 2 times the periods suggested by NBCC 2010.
Table 3.2 comparison between fundamental period obtained from frequency analysis and a2T
EBFs Design Period a2T Frequency Analysis Period
4 Storey EBF 0.76 0.99
8 Storey EBF 1.52 1.773
14 Storey EBF 2.66 3.325
40
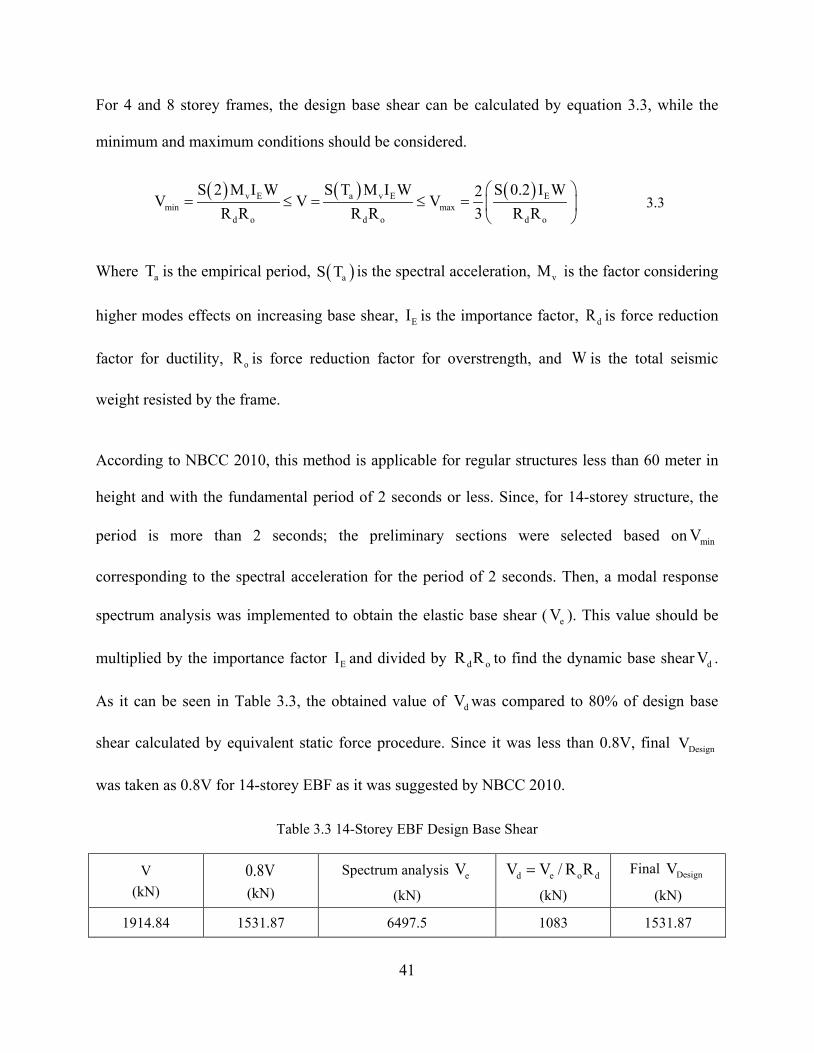
For 4 and 8 storey frames, the design base shear can be calculated by equation 3.3, while the
minimum and maximum conditions should be considered.
( ) ( ) ( )v E a v E E
min maxd o d o d o
S 2 M I W S T M I W S 0.2 I W2V V VR R R R 3 R R
= ≤ = ≤ =
3.3
Where aT is the empirical period, ( )aS T is the spectral acceleration, vM is the factor considering
higher modes effects on increasing base shear, EI is the importance factor, dR is force reduction
factor for ductility, oR is force reduction factor for overstrength, and W is the total seismic
weight resisted by the frame.
According to NBCC 2010, this method is applicable for regular structures less than 60 meter in
height and with the fundamental period of 2 seconds or less. Since, for 14-storey structure, the
period is more than 2 seconds; the preliminary sections were selected based on minV
corresponding to the spectral acceleration for the period of 2 seconds. Then, a modal response
spectrum analysis was implemented to obtain the elastic base shear ( eV ). This value should be
multiplied by the importance factor EI and divided by d oR R to find the dynamic base shear dV .
As it can be seen in Table 3.3, the obtained value of dV was compared to 80% of design base
shear calculated by equivalent static force procedure. Since it was less than 0.8V, final DesignV
was taken as 0.8V for 14-storey EBF as it was suggested by NBCC 2010.
Table 3.3 14-Storey EBF Design Base Shear
V (kN)
0.8V (kN)
Spectrum analysis eV
(kN) d e o dV V / R R=
(kN)
Final DesignV
(kN)
1914.84 1531.87 6497.5 1083 1531.87
41
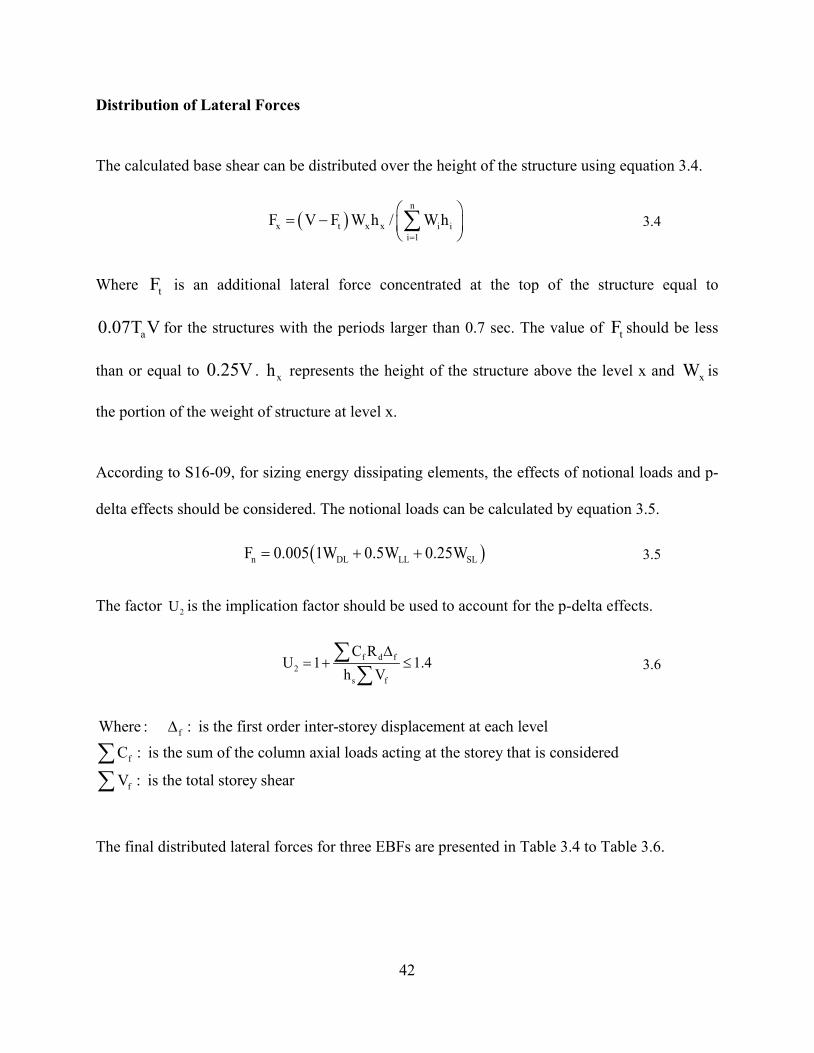
Distribution of Lateral Forces
The calculated base shear can be distributed over the height of the structure using equation 3.4.
( )
n
x t x x i ii 1
F V F W h / W h=
= − ∑ 3.4
Where tF is an additional lateral force concentrated at the top of the structure equal to
a0.07T V for the structures with the periods larger than 0.7 sec. The value of tF should be less
than or equal to 0.25V . xh represents the height of the structure above the level x and xW is
the portion of the weight of structure at level x.
According to S16-09, for sizing energy dissipating elements, the effects of notional loads and p-
delta effects should be considered. The notional loads can be calculated by equation 3.5.
( )n DL LL SLF 0.005 1W 0.5W 0.25W= + + 3.5
The factor 2U is the implication factor should be used to account for the p-delta effects.
f d f
2s f
C RU 1 1.4
h V∆
= + ≤∑∑
3.6
f
f
f
Where : : is the first order inter-storey displacement at each levelC : is the sum of the column axial loads acting at the storey that is considered
V : is the total storey shear
∆
∑∑
The final distributed lateral forces for three EBFs are presented in Table 3.4 to Table 3.6.
42
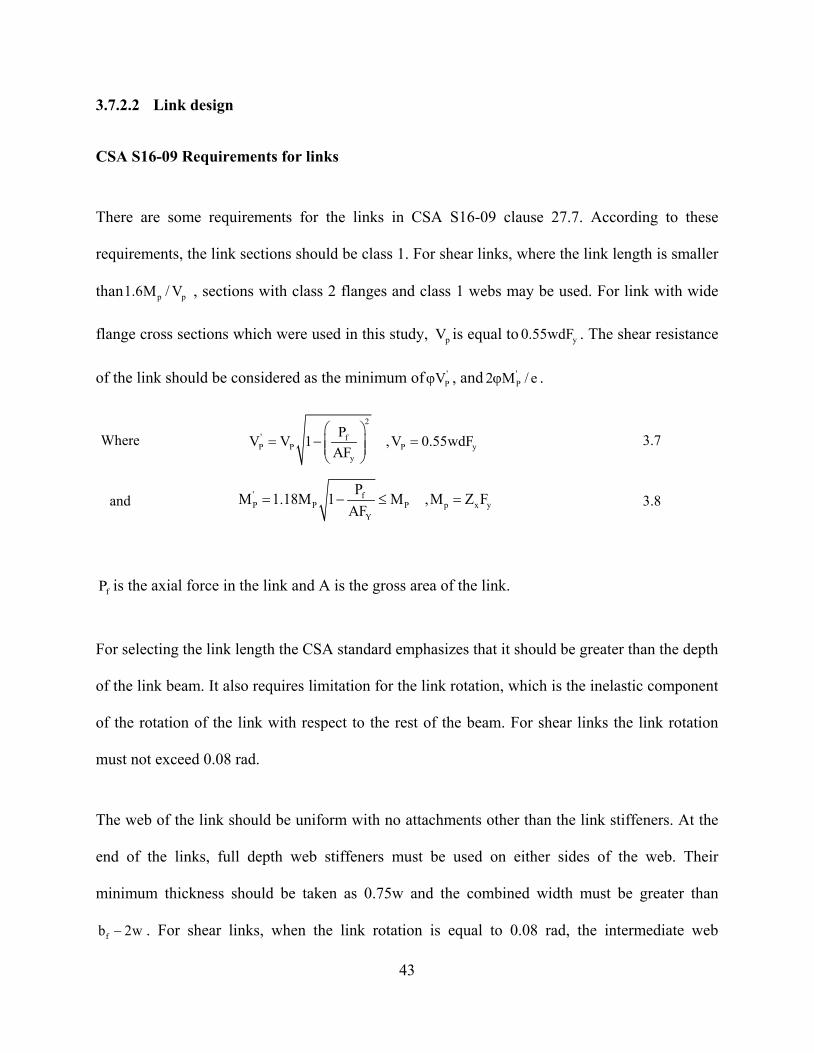
3.7.2.2 Link design
CSA S16-09 Requirements for links
There are some requirements for the links in CSA S16-09 clause 27.7. According to these
requirements, the link sections should be class 1. For shear links, where the link length is smaller
than p p1.6M / V , sections with class 2 flanges and class 1 webs may be used. For link with wide
flange cross sections which were used in this study, pV is equal to y0.55wdF . The shear resistance
of the link should be considered as the minimum of 'PVϕ , and '
P2 M / eϕ .
Where 2
' fP P P y
y
PV V 1 ,V 0.55wdFAF
= − =
3.7
and ' fP P P p x y
Y
PM 1.18M 1 M ,M Z FAF
= − ≤ = 3.8
fP is the axial force in the link and A is the gross area of the link.
For selecting the link length the CSA standard emphasizes that it should be greater than the depth
of the link beam. It also requires limitation for the link rotation, which is the inelastic component
of the rotation of the link with respect to the rest of the beam. For shear links the link rotation
must not exceed 0.08 rad.
The web of the link should be uniform with no attachments other than the link stiffeners. At the
end of the links, full depth web stiffeners must be used on either sides of the web. Their
minimum thickness should be taken as 0.75w and the combined width must be greater than
fb 2w− . For shear links, when the link rotation is equal to 0.08 rad, the intermediate web
43
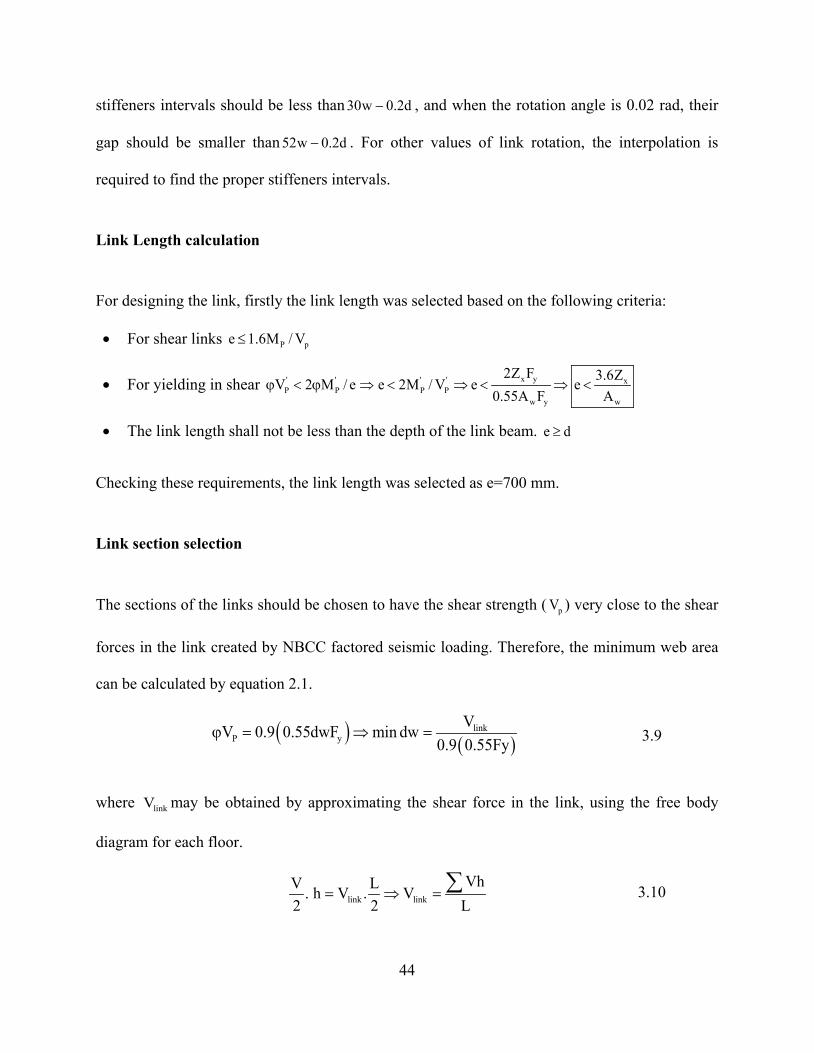
stiffeners intervals should be less than 30w 0.2d− , and when the rotation angle is 0.02 rad, their
gap should be smaller than 52w 0.2d− . For other values of link rotation, the interpolation is
required to find the proper stiffeners intervals.
Link Length calculation
For designing the link, firstly the link length was selected based on the following criteria:
• For shear links P pe 1.6M / V≤
• For yielding in shear x y' ' ' ' xP P P P
w y w
2Z F 3.6ZV 2 M / e e 2M / V e e0.55A F A
ϕ < ϕ ⇒ < ⇒ < ⇒ <
• The link length shall not be less than the depth of the link beam. e d≥
Checking these requirements, the link length was selected as e=700 mm.
Link section selection
The sections of the links should be chosen to have the shear strength ( pV ) very close to the shear
forces in the link created by NBCC factored seismic loading. Therefore, the minimum web area
can be calculated by equation 2.1.
( ) ( )link
P yVV 0.9 0.55dwF min dw
0.9 0.55Fyϕ = ⇒ =
3.9
where linkV may be obtained by approximating the shear force in the link, using the free body
diagram for each floor.
link link
VhV L. h V . V2 2 L
= ⇒ = ∑
3.10
44
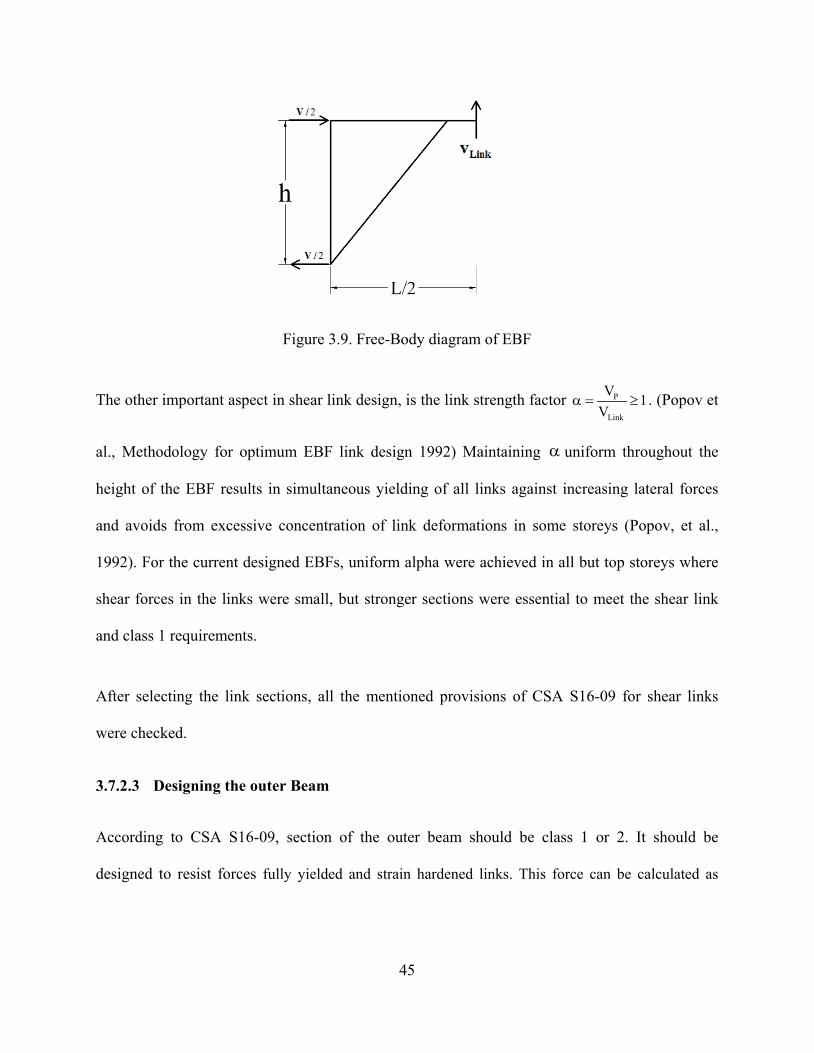
Figure 3.9. Free-Body diagram of EBF
The other important aspect in shear link design, is the link strength factor P
Link
V 1V
α = ≥ . (Popov et
al., Methodology for optimum EBF link design 1992) Maintaining α uniform throughout the
height of the EBF results in simultaneous yielding of all links against increasing lateral forces
and avoids from excessive concentration of link deformations in some storeys (Popov, et al.,
1992). For the current designed EBFs, uniform alpha were achieved in all but top storeys where
shear forces in the links were small, but stronger sections were essential to meet the shear link
and class 1 requirements.
After selecting the link sections, all the mentioned provisions of CSA S16-09 for shear links
were checked.
3.7.2.3 Designing the outer Beam
According to CSA S16-09, section of the outer beam should be class 1 or 2. It should be
designed to resist forces fully yielded and strain hardened links. This force can be calculated as
45
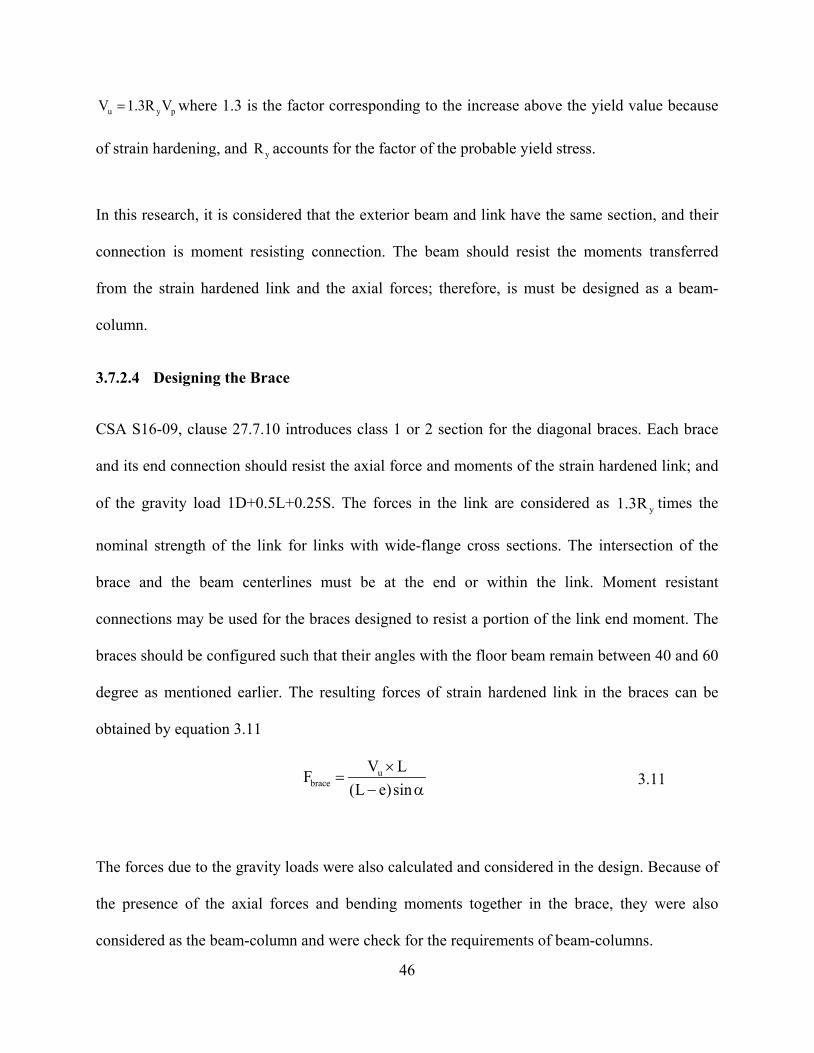
u y pV 1.3R V= where 1.3 is the factor corresponding to the increase above the yield value because
of strain hardening, and yR accounts for the factor of the probable yield stress.
In this research, it is considered that the exterior beam and link have the same section, and their
connection is moment resisting connection. The beam should resist the moments transferred
from the strain hardened link and the axial forces; therefore, is must be designed as a beam-
column.
3.7.2.4 Designing the Brace
CSA S16-09, clause 27.7.10 introduces class 1 or 2 section for the diagonal braces. Each brace
and its end connection should resist the axial force and moments of the strain hardened link; and
of the gravity load 1D+0.5L+0.25S. The forces in the link are considered as y1.3R times the
nominal strength of the link for links with wide-flange cross sections. The intersection of the
brace and the beam centerlines must be at the end or within the link. Moment resistant
connections may be used for the braces designed to resist a portion of the link end moment. The
braces should be configured such that their angles with the floor beam remain between 40 and 60
degree as mentioned earlier. The resulting forces of strain hardened link in the braces can be
obtained by equation 3.11
ubrace
V LF(L e)sin
×=
− α 3.11
The forces due to the gravity loads were also calculated and considered in the design. Because of
the presence of the axial forces and bending moments together in the brace, they were also
considered as the beam-column and were check for the requirements of beam-columns.
46
3.7.2.5 Designing the Column
According to CSA S16-09, the column section should be class 1 or 2. The columns should be
designed to resist the cumulative effect of yielding links and gravity loads. The amplification
factor accounting for strain hardening shall be taken as y1.15 R for all the floors except for the
top two storeys where y1.3R must be used. They should meet the requirements of clause 13.8
considering axial compression and bending together. The additional bending moment due to
column continuity and relative storey drift should be considered in the interaction equation as
y0.4ZF for the top two storeys and y0.2ZF for the other levels. Z is plastic section modulus of
steel sections.
In the design process, the column axial forces due to yielded link were calculated by finding
( )rlink y y PV 1.15or1.3 R F V= , then the forces in the braces were calculated and finally the column
axial forces were obtained by equation 3.12.
i i 1 i 1Col Col brace BeamF F F sin V+ += + β± 3.12
where i 1ColF + and i 1
braceF + are the axial forces immediately above the column and brace; and BeamV is
the shear force in the beam.
The results were combined with the axial forces due to gravity load obtained from load
combination 1D+0.5L+0.25S. Since the moments are minimal in the columns, the priliminary
design was done for the calculated axial forces. The selected column sections were checked for
interaction equation to ensure the capacity of the columns, considering the additional mentioned
47
bending moments specified in CSA S16-09 combined with the bending moments under gravity
and lateral loads.
3.7.2.6 Drift Requirement
The largest storey drift allowed by the code for eccentrically braced frame is 0.025h where h is
the storey height of the frame (NBCC, 2010). In the design phase, the lateral displacement can be
determined from a linear analysis on EBFs subjected to seismic design forces. Clause 4.1.8.13 of
NBCC 2010 states that the elastic displacement values should be multiplied by d o ER R / I to obtain
inelastic displacements for the lateral load resisting system.
d oel
E
R RI
∆ = ∆
3.13
3.7.2.7 Link Rotation Requirement
According to CSA S16-09, the shear link rotation must not be more than 0.08 rad. To calculate
the inelastic link rotation in the design phase, the elastic drift corresponding to factored seismic
load should be calculated. Then the inelastic rotation angle can be determined by equation 2.4.
el
s
3 Lh e∆ θ = ⇒ γ = θ
3.14
After selecting all the member sections, the maximum top storey drift and the maximum link
rotations should be calculated and compared with the code limit, if they don’t meet the
requirements of the code, the sections should be modified. Table 3.4 to Table 3.6 present the
summary of selected sections and inelastic link rotations for three EBFs.
48
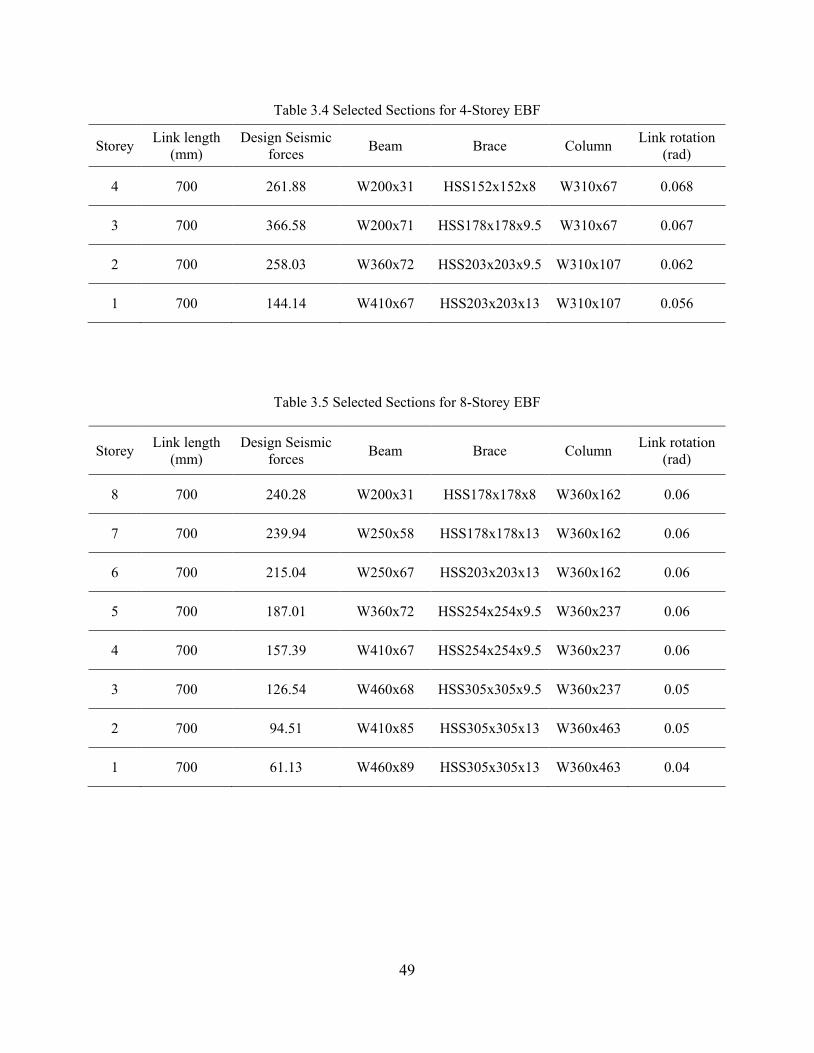
Table 3.4 Selected Sections for 4-Storey EBF
Storey Link length (mm)
Design Seismic forces Beam Brace Column Link rotation
(rad)
4 700 261.88 W200x31 HSS152x152x8 W310x67 0.068
3 700 366.58 W200x71 HSS178x178x9.5 W310x67 0.067
2 700 258.03 W360x72 HSS203x203x9.5 W310x107 0.062
1 700 144.14 W410x67 HSS203x203x13 W310x107 0.056
Table 3.5 Selected Sections for 8-Storey EBF
Storey Link length (mm)
Design Seismic forces Beam Brace Column Link rotation
(rad)
8 700 240.28 W200x31 HSS178x178x8 W360x162 0.06
7 700 239.94 W250x58 HSS178x178x13 W360x162 0.06
6 700 215.04 W250x67 HSS203x203x13 W360x162 0.06
5 700 187.01 W360x72 HSS254x254x9.5 W360x237 0.06
4 700 157.39 W410x67 HSS254x254x9.5 W360x237 0.06
3 700 126.54 W460x68 HSS305x305x9.5 W360x237 0.05
2 700 94.51 W410x85 HSS305x305x13 W360x463 0.05
1 700 61.13 W460x89 HSS305x305x13 W360x463 0.04
49
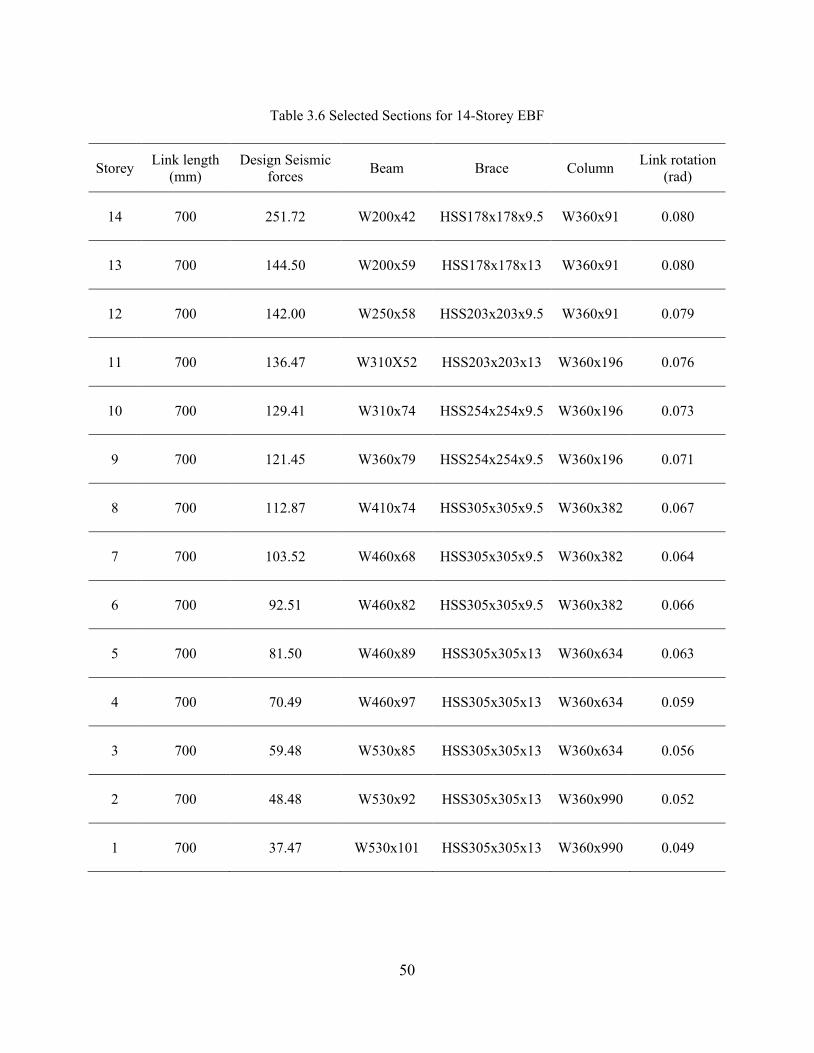
Table 3.6 Selected Sections for 14-Storey EBF
Storey Link length (mm)
Design Seismic forces Beam Brace Column Link rotation
(rad)
14 700 251.72 W200x42 HSS178x178x9.5 W360x91 0.080
13 700 144.50 W200x59 HSS178x178x13 W360x91 0.080
12 700 142.00 W250x58 HSS203x203x9.5 W360x91 0.079
11 700 136.47 W310X52 HSS203x203x13 W360x196 0.076
10 700 129.41 W310x74 HSS254x254x9.5 W360x196 0.073
9 700 121.45 W360x79 HSS254x254x9.5 W360x196 0.071
8 700 112.87 W410x74 HSS305x305x9.5 W360x382 0.067
7 700 103.52 W460x68 HSS305x305x9.5 W360x382 0.064
6 700 92.51 W460x82 HSS305x305x9.5 W360x382 0.066
5 700 81.50 W460x89 HSS305x305x13 W360x634 0.063
4 700 70.49 W460x97 HSS305x305x13 W360x634 0.059
3 700 59.48 W530x85 HSS305x305x13 W360x634 0.056
2 700 48.48 W530x92 HSS305x305x13 W360x990 0.052
1 700 37.47 W530x101 HSS305x305x13 W360x990 0.049
50
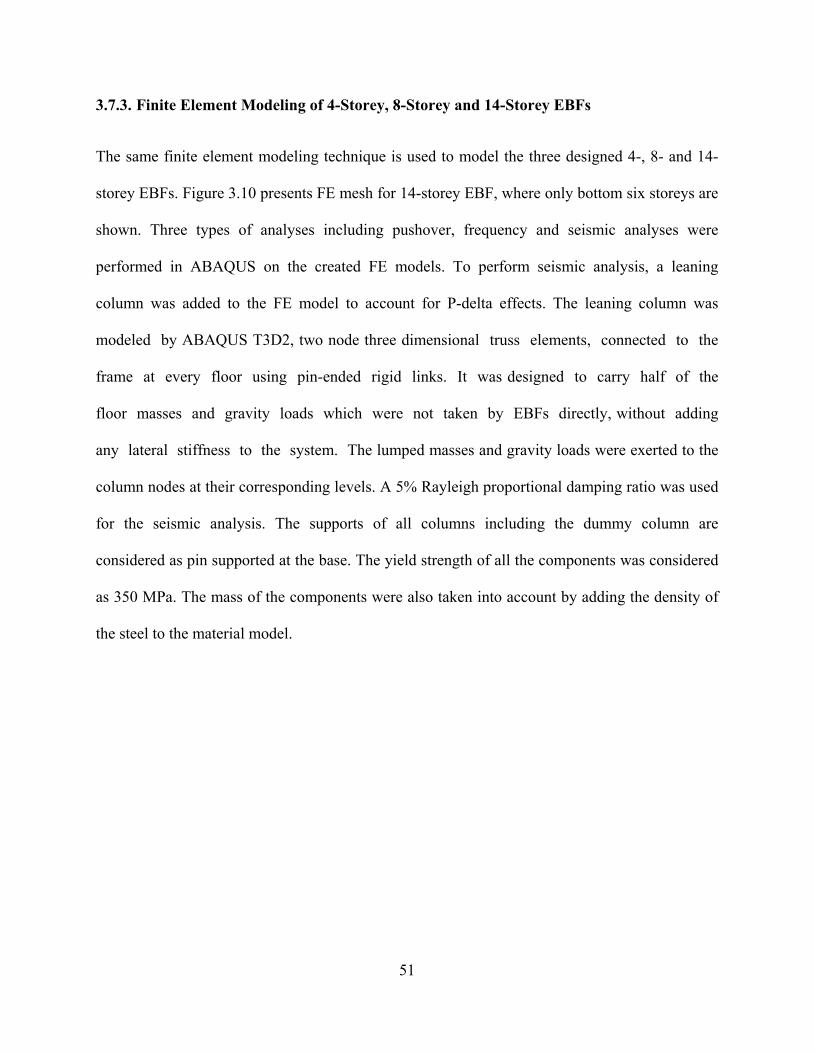
3.7.3. Finite Element Modeling of 4-Storey, 8-Storey and 14-Storey EBFs
The same finite element modeling technique is used to model the three designed 4-, 8- and 14-
storey EBFs. Figure 3.10 presents FE mesh for 14-storey EBF, where only bottom six storeys are
shown. Three types of analyses including pushover, frequency and seismic analyses were
performed in ABAQUS on the created FE models. To perform seismic analysis, a leaning
column was added to the FE model to account for P-delta effects. The leaning column was
modeled by ABAQUS T3D2, two node three dimensional truss elements, connected to the
frame at every floor using pin-ended rigid links. It was designed to carry half of the
floor masses and gravity loads which were not taken by EBFs directly, without adding
any lateral stiffness to the system. The lumped masses and gravity loads were exerted to the
column nodes at their corresponding levels. A 5% Rayleigh proportional damping ratio was used
for the seismic analysis. The supports of all columns including the dummy column are
considered as pin supported at the base. The yield strength of all the components was considered
as 350 MPa. The mass of the components were also taken into account by adding the density of
the steel to the material model.
51
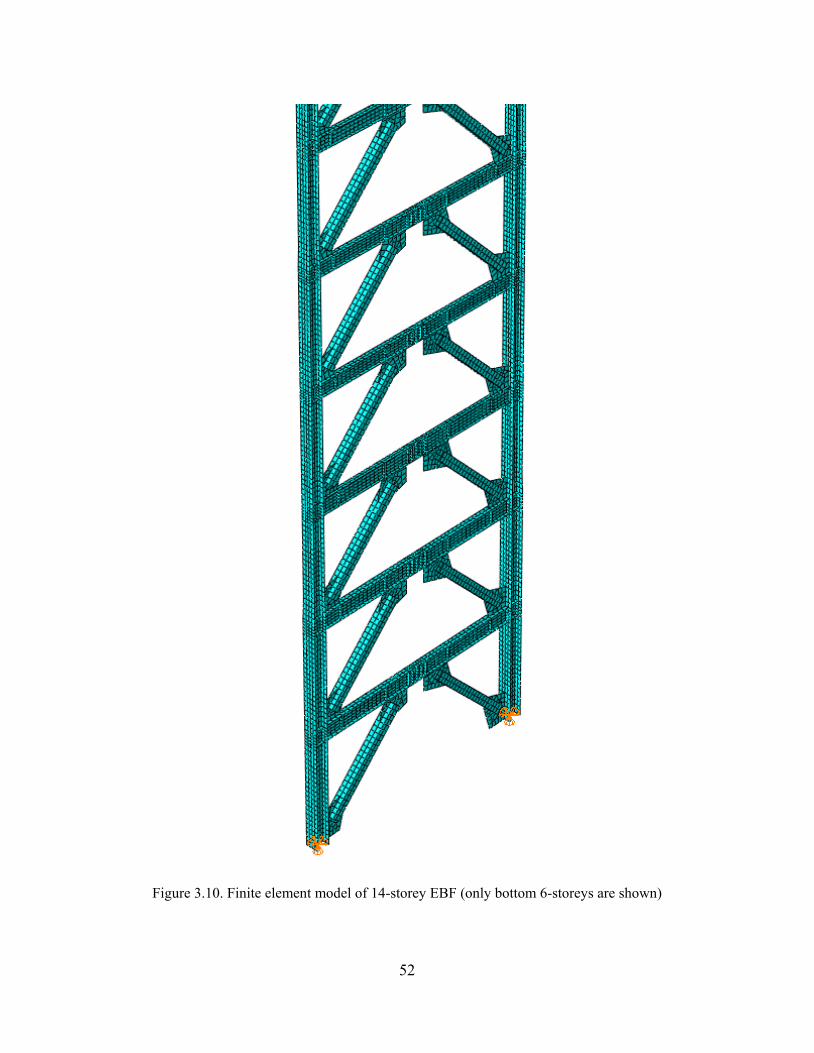
Figure 3.10. Finite element model of 14-storey EBF (only bottom 6-storeys are shown)
52
3.8. Summary
In this research, non-linear finite element models were used to study the behavior of
eccentrically braced frames. This chapter explained the details and considerations for developing
the finite element models for EBFs. In order to have reliable FE models, the first model was built
using an available test specimen data. The results obtained from finite element simulation were
compared to the corresponding experimental responses. The validation curve showed a good
agreement between the FE model and the selected test specimen in terms of the initial stiffness
and post-yield responses with a small difference of 3%. The validated modeling technique was
then used to develop finite element models for three designed EBFs with 4, 8 and 14 storeys to
study the seismic performance of the eccentric braced frames. These three EBFs were designed
based on the capacity design approach presented by CAN/CSA S16-09. The design procedure for
designing EBFs was also explained in detail in this chapter.
53
Chapter 4. Seismic Performance of Eccentric Braced Frames
4.1. Introduction
In this chapter, the three designed 4-, 8- and 14-storey EBFs, explained in the chapter 3, were
employed to study the seismic performance of eccentrically braced frames using nonlinear
dynamic analysis. For seismic analysis, the FE models of the designed EBFs were subjected to
eight selected ground motion records. The response spectra of the selected ground motions were
scaled to match the design spectra of Vancouver. The criteria for selecting the ground motion
records are explained in this chapter. Then, non-linear dynamic analyses results are compared
against the criteria suggested by NBCC (2010) and CAN/CSA S16-09 (2009).
4.2. Nonlinear Dynamic Analysis of EBFs
4.2.1. Frequency Analysis
Prior to the seismic analysis, frequency analyses were performed on EBF models to determine
the fundamental periods and mode shapes corresponding to each eccentrically braced frame. The
finite element model used for frequency analysis consists of the gravity column. Finding the
fundamental period is useful for scaling the ground motion records to make it suitable for
seismic analysis of the designed EBFs. Also, the material model which was used for seismic
analysis required the Raleigh proportional damping coefficients α and β . Knowing the
fundamental frequencies of EBFs, these damping coefficients can be calculated using equation
4.1. The Raleigh proportional damping ratio (ξ ) was considered as 5%.
54
i j
i j i j
2 2ωωα = ξ β = ξ
ω +ω ω +ω 4.1
where iω and jω are the circular frequencies corresponding to ith and jth fundamental periods.
The fundamental periods and mode shapes were also used for modal pushover analysis which is
discussed in chapter 5. Comparing the fundamental period determined from frequency analyses
with the period that suggested by NBCC 2010 for EBFs shows that the code estimation of the
periods of EBFs is very conservative.
4.2.2. Ground Motion Records
According to NBCC 2010, the ground motion histories used in the dynamic analysis should be
spectrum compatible. The uniform hazard spectrum for each region is provided by NBCC 2010.
For this study, the design spectrum of Vancouver was used as it is the location of the office
buildings considered in this research. As per ASCE7-10, when peak maximum responses are
considered to investigate seismic response of structure, at least three ground motions must be
utilized; and when the median value of maximum responses are used, a minimum of seven
earthquakes are required.
For this research, eight earthquake records were employed, five of which were selected from the
strong ground motion database of Pacific Earthquake Engineering Research Center (PEER
2010), and the other three records were chosen from Engineering Seismology toolbox website
(Atkinson et al. 2009). All the records, including five real ground motion and three synthesized
are presented in Table 4.1 and Table 4.2.
55
Since the magnitudes of most recorded seismic activities in British Columbia were measured
between 6 and 7, for a range of 400 years (Lamontagne et al. 2008), the real earthquake records
were selected to have a magnitude in this range. The simulated ground motions were chosen for
site class C with the magnitude of 6.5 and 7.5, including both near fault and far fault records. To
select the real ground motion records, the ratio of the peak acceleration (PGA) to the peak
velocity (PGV) was taken into account. This ratio should be close to 1 for Vancouver (between
0.8 and 1.2) (Naumoski et al. 2004)
The response spectrum of unscaled ground motions and the design spectrum of Vancouver;
corresponding to 5% of critically damped SDOF system in soil class C, were employed for
scaling the earthquake records, using the partial area method of scaling. In this method, the area
under the response spectrum of the selected ground motion must be determined for a range
between 10.2T and 11.5T , where 1T is the fundamental period of the structure. The area under the
design spectrum of Vancouver must be also obtained for the same range of period. The ratio of
the first and second areas gives the scaling factor, using which the accelerograms were scaled to
have the same area under the design and earthquake response spectrum within the specified
period range. The lower bound 10.2T was selected to account for the effects of higher modes on
seismic response; the upper bound 11.5T was chosen to consider the increase of fundamental
period of structure in the plastic range. Figure 4.1, Figure 4.2, and Figure 4.3 present acceleration
spectra for selected ground motions and Vancouver design spectra for 4-, 8-, and 14 storey EBFs
respectively. The scaled accelerograms are also presented in Figure 4.4 to Figure 4.6.
56
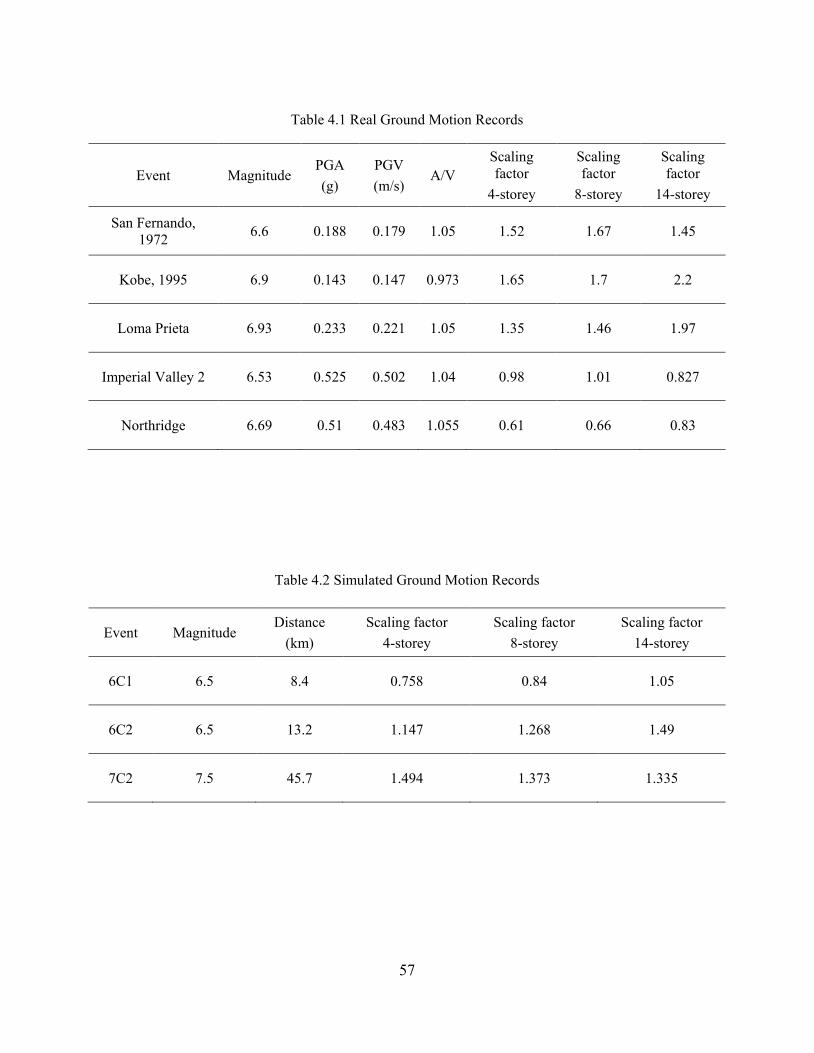
Table 4.1 Real Ground Motion Records
Event Magnitude PGA (g)
PGV (m/s)
A/V Scaling factor
4-storey
Scaling factor
8-storey
Scaling factor
14-storey
San Fernando, 1972 6.6 0.188 0.179 1.05 1.52 1.67 1.45
Kobe, 1995 6.9 0.143 0.147 0.973 1.65 1.7 2.2
Loma Prieta 6.93 0.233 0.221 1.05 1.35 1.46 1.97
Imperial Valley 2 6.53 0.525 0.502 1.04 0.98 1.01 0.827
Northridge 6.69 0.51 0.483 1.055 0.61 0.66 0.83
Table 4.2 Simulated Ground Motion Records
Event Magnitude Distance
(km) Scaling factor
4-storey Scaling factor
8-storey Scaling factor
14-storey
6C1 6.5 8.4 0.758 0.84 1.05
6C2 6.5 13.2 1.147 1.268 1.49
7C2 7.5 45.7 1.494 1.373 1.335
57
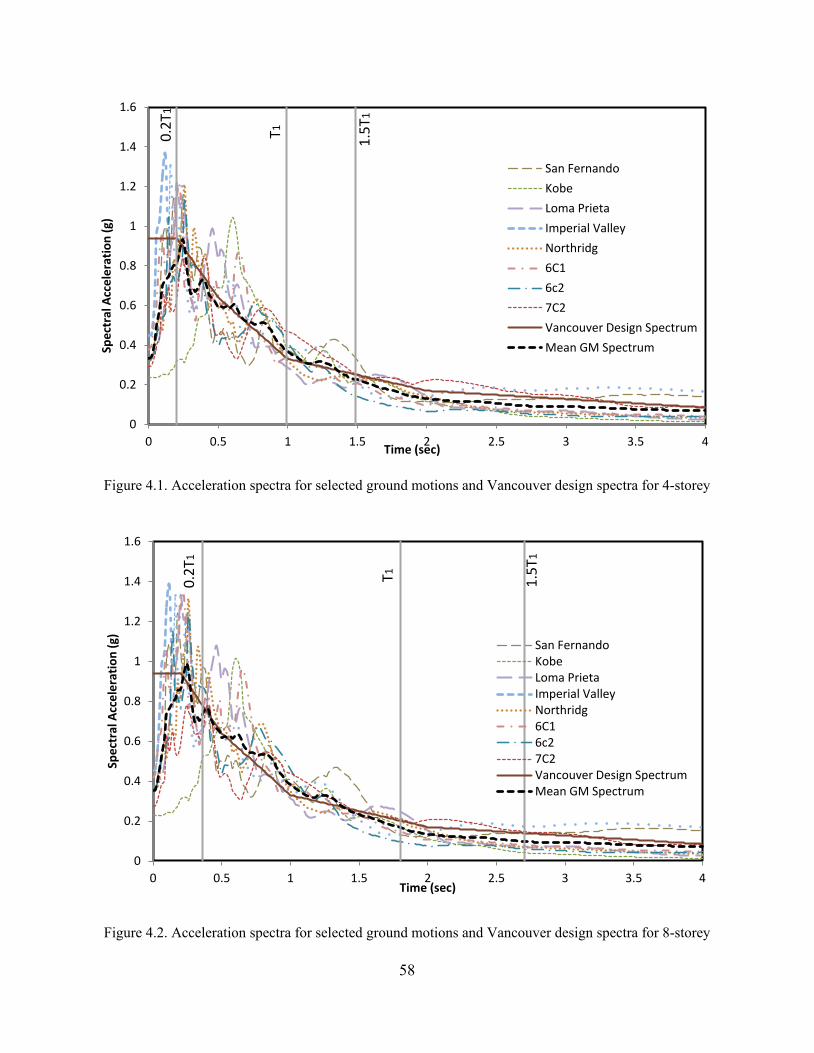
Figure 4.1. Acceleration spectra for selected ground motions and Vancouver design spectra for 4-storey
Figure 4.2. Acceleration spectra for selected ground motions and Vancouver design spectra for 8-storey
0
0.2
0.4
0.6
0.8
1
1.2
1.4
1.6
0 0.5 1 1.5 2 2.5 3 3.5 4
Spec
tral
Acc
eler
atio
n (g
)
Time (sec)
San Fernando
Kobe
Loma Prieta
Imperial Valley
Northridg
6C1
6c2
7C2
Vancouver Design Spectrum
Mean GM Spectrum
0.2T
1
1.5T
1
T1
0
0.2
0.4
0.6
0.8
1
1.2
1.4
1.6
0 0.5 1 1.5 2 2.5 3 3.5 4
Spec
tral
Acc
eler
atio
n (g
)
Time (sec)
San Fernando Kobe Loma Prieta Imperial Valley Northridg 6C1 6c2 7C2 Vancouver Design Spectrum Mean GM Spectrum
0.2T
1
1.5T
1
T1
58
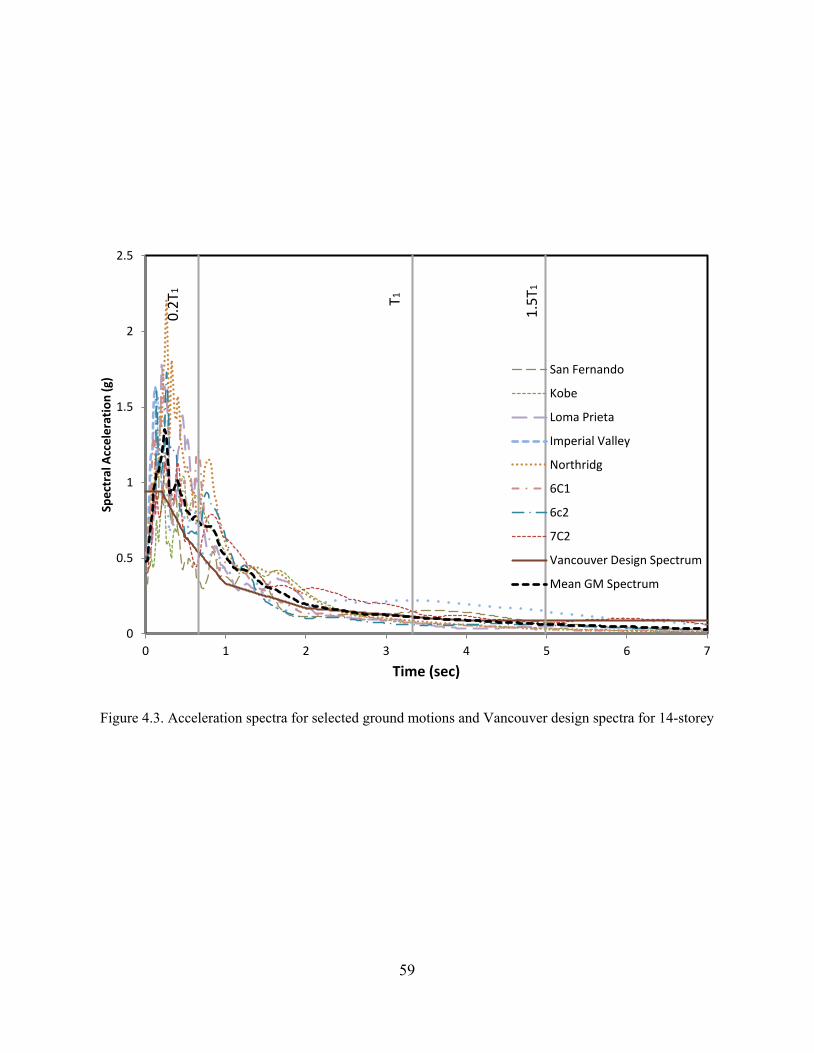
Figure 4.3. Acceleration spectra for selected ground motions and Vancouver design spectra for 14-storey
0
0.5
1
1.5
2
2.5
0 1 2 3 4 5 6 7
Spec
tral
Acc
eler
atio
n (g
)
Time (sec)
San Fernando
Kobe
Loma Prieta
Imperial Valley
Northridg
6C1
6c2
7C2
Vancouver Design Spectrum
Mean GM Spectrum
0.2T
1
1.5T
1
T1
59
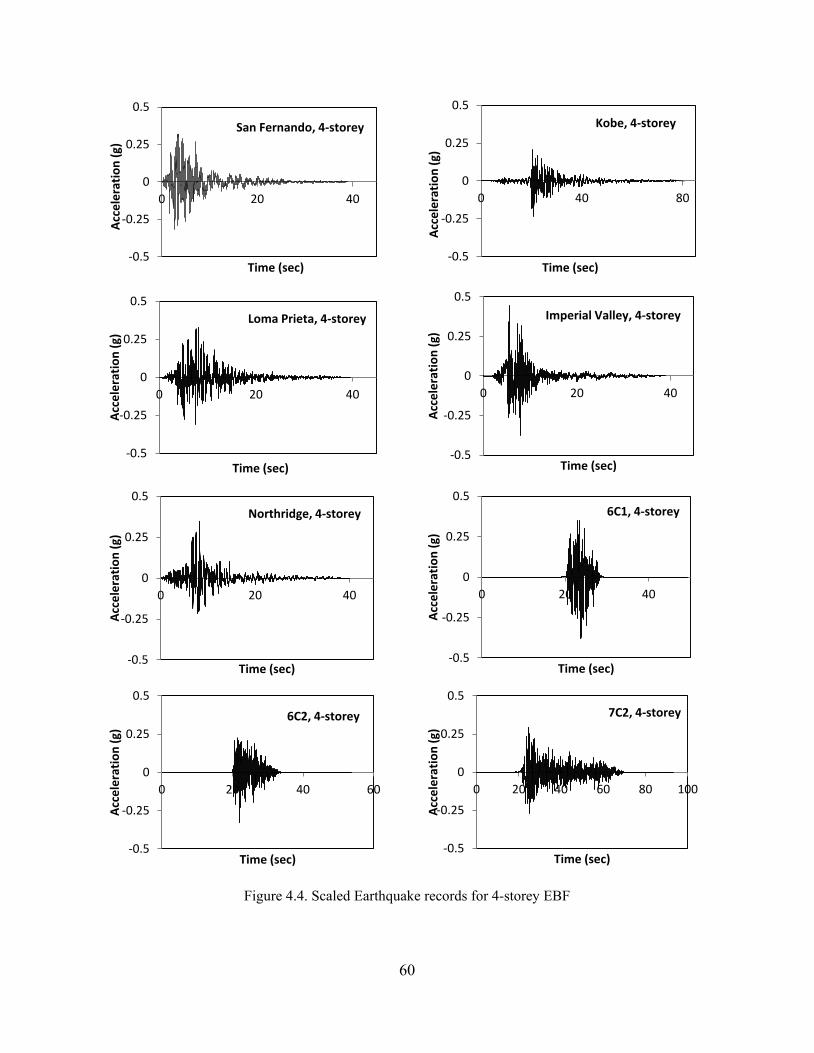
Figure 4.4. Scaled Earthquake records for 4-storey EBF
-0.5
-0.25
0
0.25
0.5
0 20 40
Acc
eler
atio
n (g
)
Time (sec)
San Fernando, 4-storey
-0.5
-0.25
0
0.25
0.5
0 40 80
Acc
eler
atio
n (g
)
Time (sec)
Kobe, 4-storey
-0.5
-0.25
0
0.25
0.5
0 20 40
Acc
eler
atio
n (g
)
Time (sec)
Loma Prieta, 4-storey
-0.5
-0.25
0
0.25
0.5
0 20 40
Acc
eler
atio
n (g
)
Time (sec)
Imperial Valley, 4-storey
-0.5
-0.25
0
0.25
0.5
0 20 40
Acc
eler
atio
n (g
)
Time (sec)
Northridge, 4-storey
-0.5
-0.25
0
0.25
0.5
0 20 40
Acc
eler
atio
n (g
)
Time (sec)
6C1, 4-storey
-0.5
-0.25
0
0.25
0.5
0 20 40 60
Acc
eler
atio
n (g
)
Time (sec)
6C2, 4-storey
-0.5
-0.25
0
0.25
0.5
0 20 40 60 80 100
Acc
eler
atio
n (g
)
Time (sec)
7C2, 4-storey
60
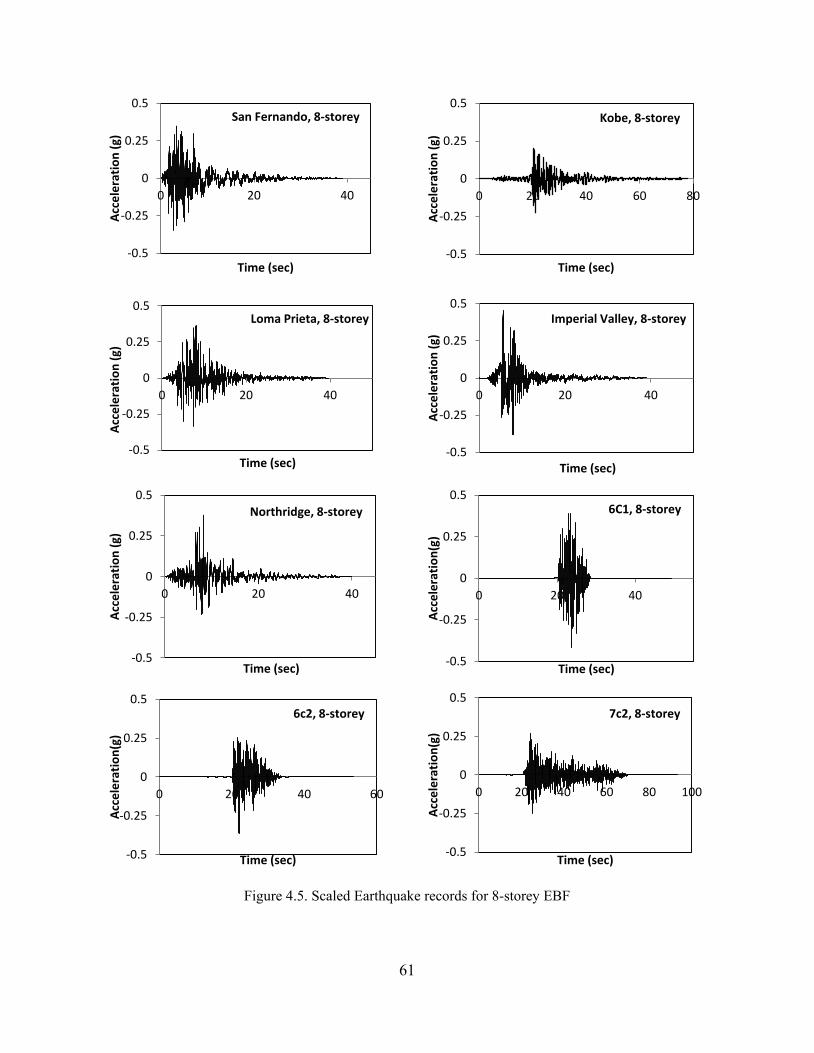
Figure 4.5. Scaled Earthquake records for 8-storey EBF
-0.5
-0.25
0
0.25
0.5
0 20 40
Acc
eler
atio
n (g
)
Time (sec)
San Fernando, 8-storey
-0.5
-0.25
0
0.25
0.5
0 20 40 60 80
Acc
eler
atio
n (g
)
Time (sec)
Kobe, 8-storey
-0.5
-0.25
0
0.25
0.5
0 20 40
Acc
eler
atio
n (g
)
Time (sec)
Loma Prieta, 8-storey
-0.5
-0.25
0
0.25
0.5
0 20 40
Acc
eler
atio
n (g
)
Time (sec)
Imperial Valley, 8-storey
-0.5
-0.25
0
0.25
0.5
0 20 40
Acc
eler
atio
n (g
)
Time (sec)
Northridge, 8-storey
-0.5
-0.25
0
0.25
0.5
0 20 40
Acc
eler
atio
n(g)
Time (sec)
6C1, 8-storey
-0.5
-0.25
0
0.25
0.5
0 20 40 60
Acc
eler
atio
n(g)
Time (sec)
6c2, 8-storey
-0.5
-0.25
0
0.25
0.5
0 20 40 60 80 100
Acc
eler
atio
n(g)
Time (sec)
7c2, 8-storey
61
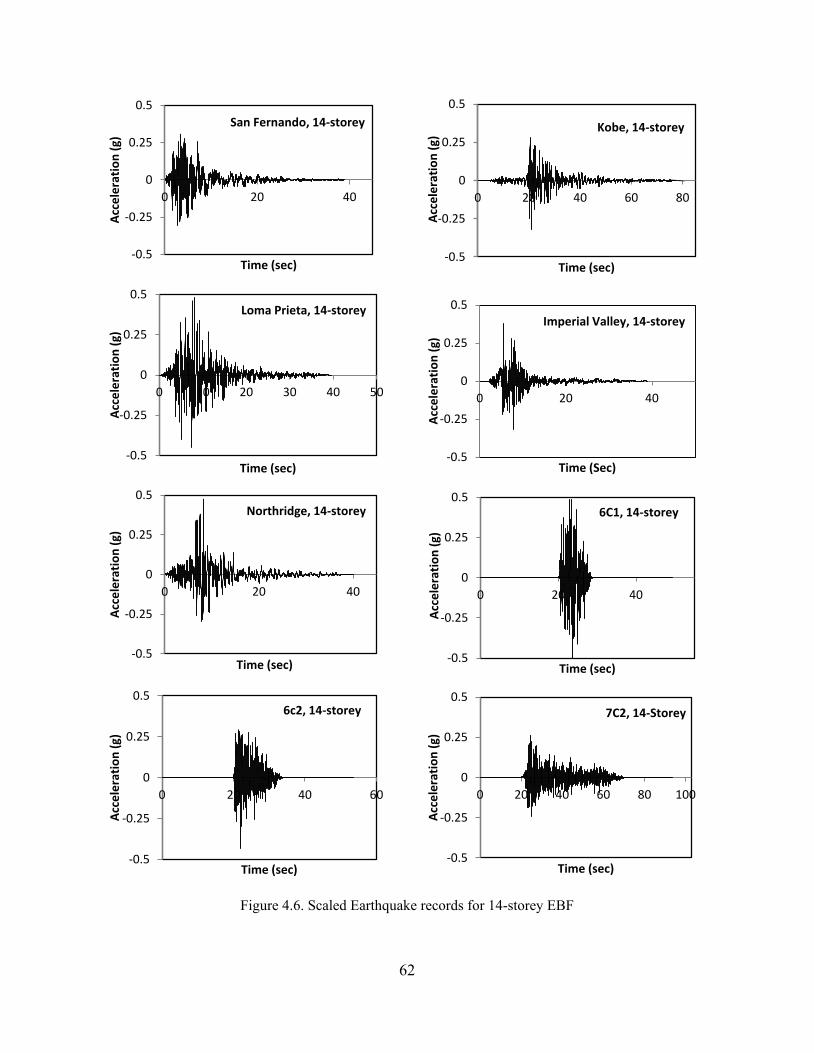
Figure 4.6. Scaled Earthquake records for 14-storey EBF
-0.5
-0.25
0
0.25
0.5
0 20 40
Acc
eler
atio
n (g
)
Time (sec)
San Fernando, 14-storey
-0.5
-0.25
0
0.25
0.5
0 20 40 60 80
Acc
eler
atio
n (g
)
Time (sec)
Kobe, 14-storey
-0.5
-0.25
0
0.25
0.5
0 10 20 30 40 50
Acc
eler
atio
n (g
)
Time (sec)
Loma Prieta, 14-storey
-0.5
-0.25
0
0.25
0.5
0 20 40
Acc
eler
atio
n (g
)
Time (Sec)
Imperial Valley, 14-storey
-0.5
-0.25
0
0.25
0.5
0 20 40
Acc
eler
atio
n (g
)
Time (sec)
Northridge, 14-storey
-0.5
-0.25
0
0.25
0.5
0 20 40
Acc
eler
atio
n (g
)
Time (sec)
6C1, 14-storey
-0.5
-0.25
0
0.25
0.5
0 20 40 60
Acc
eler
atio
n (g
)
Time (sec)
6c2, 14-storey
-0.5
-0.25
0
0.25
0.5
0 20 40 60 80 100
Acc
eler
atio
n (g
)
Time (sec)
7C2, 14-Storey
62
4.3. EBF Seismic Response
Nonlinear dynamic analyses were performed on 4-, 8- and 14-storey EBFs using the ground
motions introduced in the previous section. Since the link is the most important element in EBFs,
the responses of the link are the main concentration of this study. The critical response
parameters for the links are the inelastic link rotations and the maximum normalized shear forces
in the link. The maximum inelastic link rotations extracted from ABAQUS were compared with
the code limit of 0.08 rad. To normalize the shear forces in the link, the obtained values from
ABAQUS were divided by the probable shear resistance y PR V and were checked with 1.3, the
amplification factor provided by S16-09 (CSA 2009). The inter-storey drifts were also
determined and evaluated with 2.5% of the storey height. The results provided in this research
are the peak values of responses obtained for each earthquake. Then, the average was taken
between the peak responses of 8 earthquake records to present the EBF seismic behavior.
According to ASCE7-10, taking average of the maximum responses is allowed if at least seven
earthquake records are used for time history analyses.
4.3.1. Link Responses
Link Rotation
The results of maximum link rotations and its median values between 8 earthquakes are
presented in Figure 4.7, Figure 4.9, and Figure 4.11 for three EBFs under study.
For 4-storey EBF, for all the records, the link rotations were less than the limit of 0.08 specified
in CSA S16-09. For most records, the largest deformation occurred at the first and third stories,
63
the same level as the highest link shear forces were observed. Figure 4.7 shows that the average
values of link rotations are about 0.05 rad.
For 8-storey structure, as shown in Figure 4.9, most ground motions indicated the maximum link
rotation at first and sixth level, where the maximum link shear forces were also developed. The
link rotations varied from 0.02 to 0.05, which were lower than the limit.
For 14-storey structure, as shown in Figure 4.11, the average link rotations were between 0.02
and 0.06 for all the floors, except for the eleven and twelve levels where link rotations exceeded
the 0.08 limit. These values were 0.085 and 0.09 for 11th and 12th floor respectively. A
concentration of link rotation was also observed at the first floor; however, the median value for
the first floor was well below the limit.
Link Normalized Shear Force
The results of normalized shear forces in the links are illustrated in Figure 4.7, Figure 4.9, and
Figure 4.11. The limit of strain hardening factor suggested by CSA S16-09 is 1.3. As the results
show this limit was exceeded for all EBFs; however, these values are still within the range of
experimental results which showed the average overstrength factor of 1.5 for the short links
(OkazakiArce et al. 2005) (Arce 2002). Past tests also showed the link overstrength factor of
more than 1.5 (Hjelmstad and Popov 1983, Engelhardt and Popov, behavior of long links in
eccentrically braced frames 1989). There are also some recent tests that reported the overstrength
factor close to 2 for built-up shear links used in bridge (McDaniel et al. 2002). The limit of 1.3
presented by CSA S16-09 accounts for strain hardening developed in the links; however, the
reported experimental results and also the observations made in this study showed that the link
64
overstrength factor can also be due to the participation of the flanges in resisting shears. Based
on these observations, the suggested overstrength factor of the link provided by current Canadian
seismic provision may be un-conservative.
For 4-storey EBF, all the floors; except for the 4th level, slightly exceeded (maximum of 7%) the
code limit of 1.3. For 8-storey structure, the second, third and the last floors exhibited
overstrength values lower than 1.3. All other floors went beyond the code bound. For 14-storey
EBF, the links over-strength was below 1.3 for most floors. Only the first and top floors (11-13th)
showed higher magnitudes. The maximum strain hardening factor of 1.48 occurred at 11th floor
which was 14% higher than CSA S16-09 requirement.
4.3.2. Other Responses
Inter-Storey Drift
Figure 4.8, Figure 4.10, and Figure 4.12 present the inter-storey drifts for the three designed
EBFs. As shown in Figure 4.8, the inter-storey drifts for 4-storey EBF vary between 0.68 to
0.79%. Comparing the obtained values from ABAQUS with NBCC 2010 drift limit, it was
observed that inelastic inter-storey drifts in all the floors were within the NBCC drift limit.
Similar findings were also observed for 8-storey EBF, where the magnitudes of inter-storey drifts
were reported between 0.4 to 0.8% of the storey height, which are 67% to 80% lower than the
s0.025h limit suggested by NBCC 2010.
65
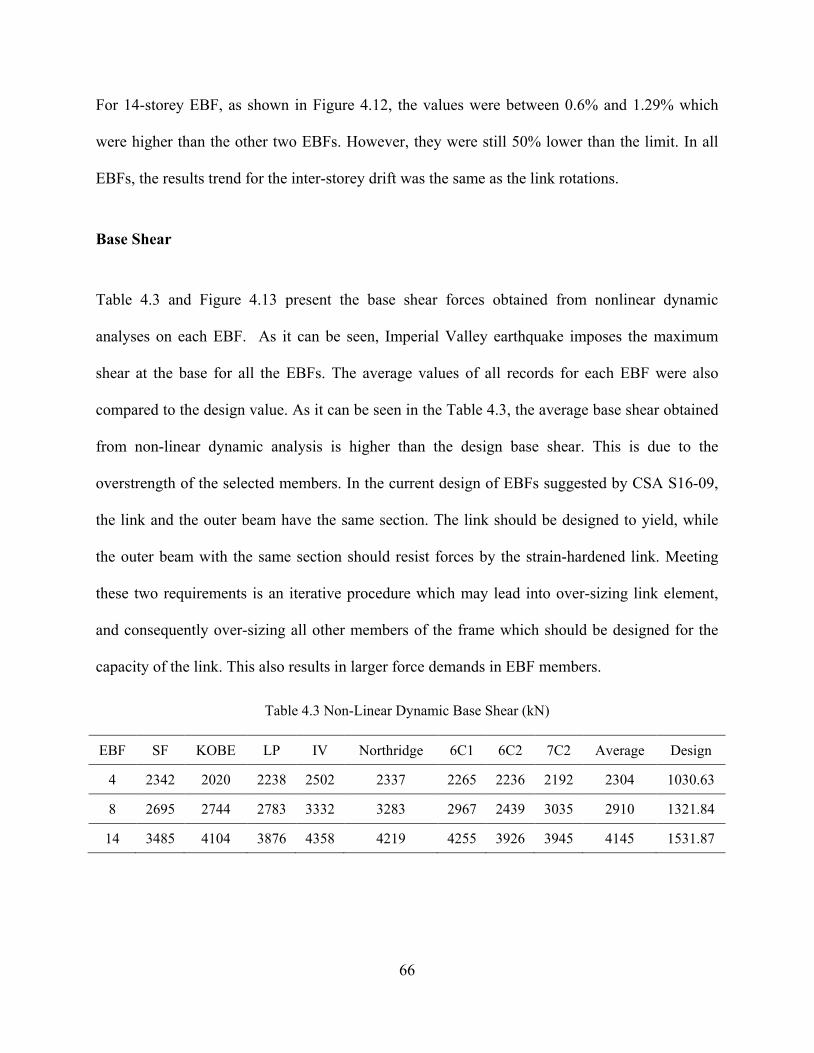
For 14-storey EBF, as shown in Figure 4.12, the values were between 0.6% and 1.29% which
were higher than the other two EBFs. However, they were still 50% lower than the limit. In all
EBFs, the results trend for the inter-storey drift was the same as the link rotations.
Base Shear
Table 4.3 and Figure 4.13 present the base shear forces obtained from nonlinear dynamic
analyses on each EBF. As it can be seen, Imperial Valley earthquake imposes the maximum
shear at the base for all the EBFs. The average values of all records for each EBF were also
compared to the design value. As it can be seen in the Table 4.3, the average base shear obtained
from non-linear dynamic analysis is higher than the design base shear. This is due to the
overstrength of the selected members. In the current design of EBFs suggested by CSA S16-09,
the link and the outer beam have the same section. The link should be designed to yield, while
the outer beam with the same section should resist forces by the strain-hardened link. Meeting
these two requirements is an iterative procedure which may lead into over-sizing link element,
and consequently over-sizing all other members of the frame which should be designed for the
capacity of the link. This also results in larger force demands in EBF members.
Table 4.3 Non-Linear Dynamic Base Shear (kN)
EBF SF KOBE LP IV Northridge 6C1 6C2 7C2 Average Design
4 2342 2020 2238 2502 2337 2265 2236 2192 2304 1030.63
8 2695 2744 2783 3332 3283 2967 2439 3035 2910 1321.84
14 3485 4104 3876 4358 4219 4255 3926 3945 4145 1531.87
66
Yielding Pattern
To study the yielding pattern of 4-, 8- and 14 storey EBFs, the results obtained for the Imperial
Valley were utilized. This earthquake was chosen because it had the maximum PGA and also the
maximum base shear was found for this earthquake record.
For 4-storey EBF, the first yielding was observed at the link web of the first floor, then it
continued to the second to forth floor. The simultaneous yielding of all links was observed
during the ground motion. At the time that maximum base shear occurred, the links of all storeys
were yielded. Some minor yielding was also observed at the end of some outer beams where tehy
connected to the links. This yielding took place because of high axial forces in the beam and high
moments at the end of the link which transferred to the beam. It is acceptable provided that
enough lateral supports are supplied (Engelhardt and Popov, behavior of long links in
eccentrically braced frames 1989). All other members behaved elastically during the analysis.
For 8-storey frame, the initial yielding was reported at the first to sixth floor, then it continued to
the 7th and 8th floor. The simultaneous yielding of the links of all the floors was observed at the
time 7.7 sec where the peak acceleration occurs. At the instance of maximum base shear, only
the links at first to fourth floors were yielded. In all cases no inelastic activity was reported by
the other members except for at the outer beam immediately after link ends.
For 14-storey EBF, the first yielding occurred at the link web of 11th to 13th storeys. Then it
continued to the first floor, middle floors 5 and 6 and upper floors 12 and 13. Although the links
at all floors were yielded, but their yielding did not happen at the same time in spite of selecting
67
the links of all floor to have the same link strength factor α at design phase. The most
simultaneous yielding was observed when 2-7 and 10-14 floors were yielded at the same time.
For all frames, all the links were fully yielded. Also some yielding was observed at the flanges of
the outer beam where it was connected to the link. No yielding was detected in other members
meaning that they remained elastic during nonlinear dynamic analyses. Figure 4.14 to Figure
4.16 present yielding pattern for 4-, 8- and 14-storey EBFs when maximum simultaneous
yielding happened.
68
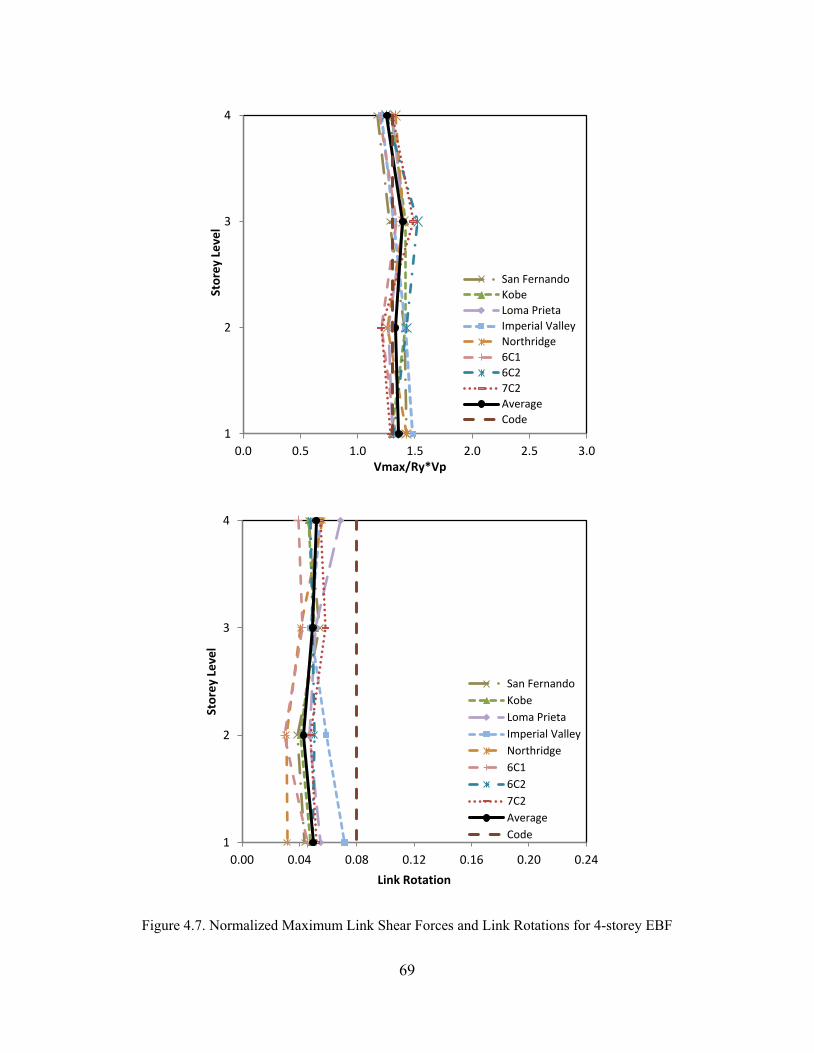
Figure 4.7. Normalized Maximum Link Shear Forces and Link Rotations for 4-storey EBF
1
2
3
4
0.0 0.5 1.0 1.5 2.0 2.5 3.0
Stor
ey L
evel
Vmax/Ry*Vp
San Fernando Kobe Loma Prieta Imperial Valley Northridge 6C1 6C2 7C2 Average Code
1
2
3
4
0.00 0.04 0.08 0.12 0.16 0.20 0.24
Stor
ey L
evel
Link Rotation
San Fernando Kobe Loma Prieta Imperial Valley Northridge 6C1 6C2 7C2 Average Code
69
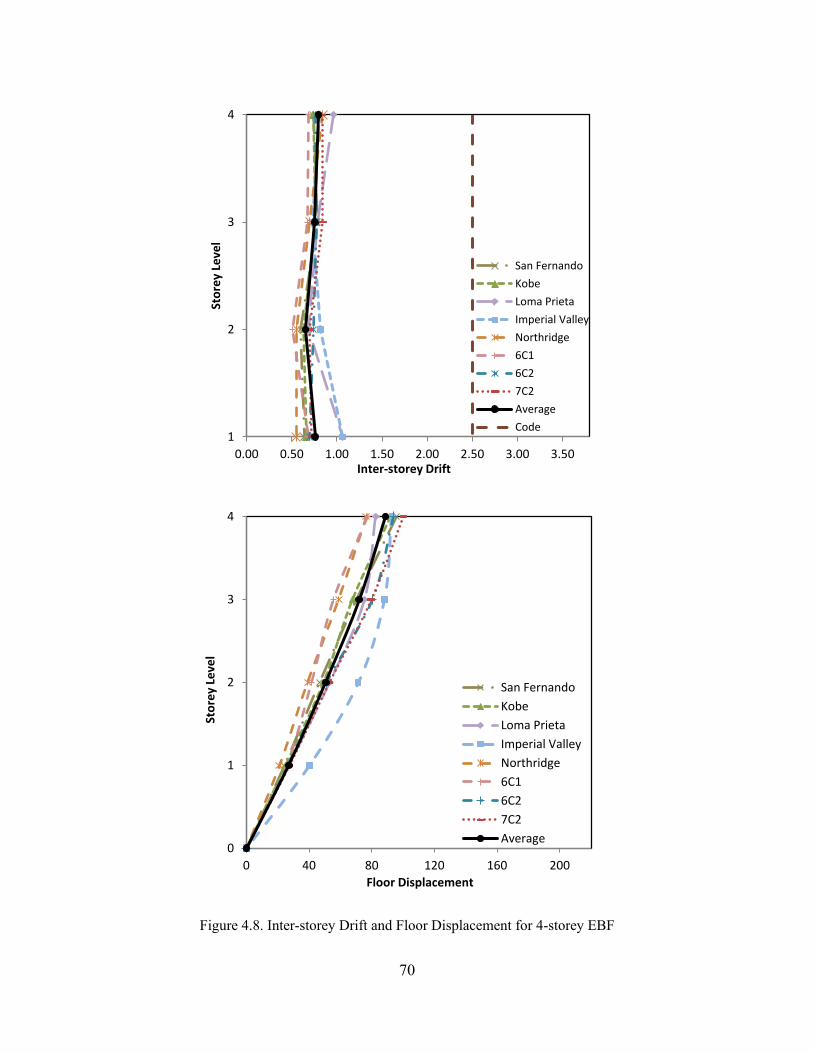
Figure 4.8. Inter-storey Drift and Floor Displacement for 4-storey EBF
1
2
3
4
0.00 0.50 1.00 1.50 2.00 2.50 3.00 3.50
Stor
ey L
evel
Inter-storey Drift
San Fernando
Kobe
Loma Prieta
Imperial Valley
Northridge
6C1
6C2
7C2
Average
Code
0
1
2
3
4
0 40 80 120 160 200
Stor
ey L
evel
Floor Displacement
San Fernando Kobe Loma Prieta Imperial Valley Northridge 6C1 6C2 7C2 Average
70
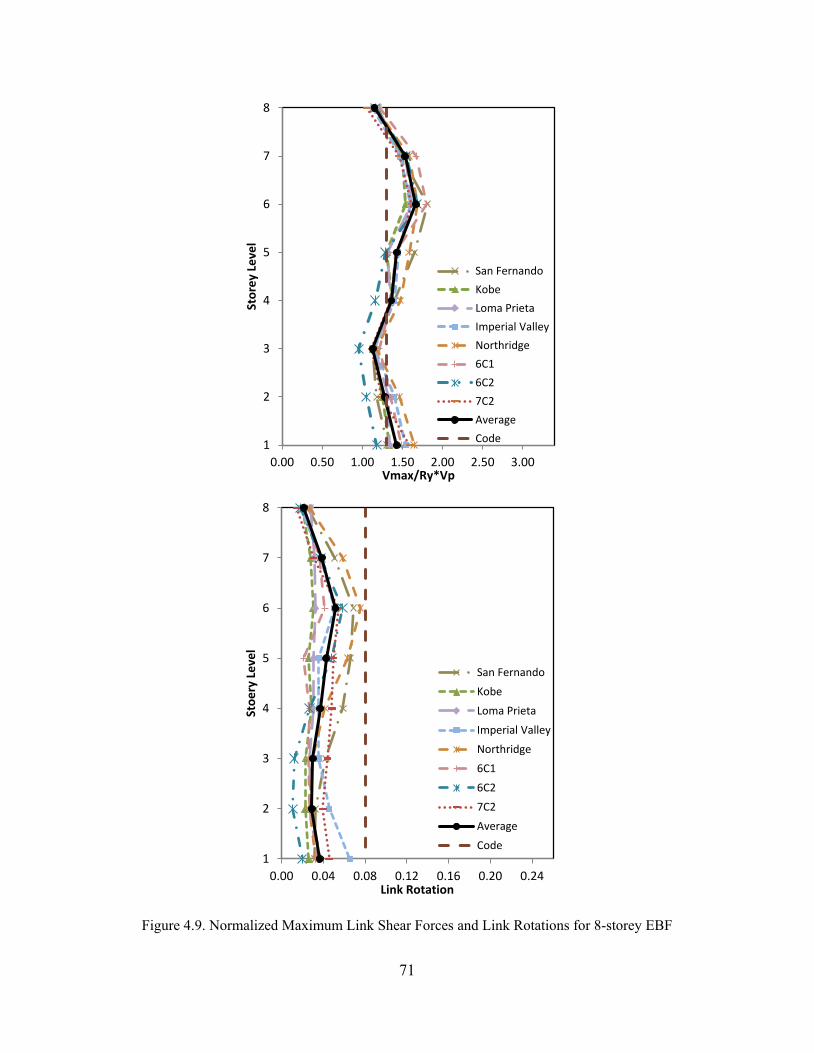
Figure 4.9. Normalized Maximum Link Shear Forces and Link Rotations for 8-storey EBF
1
2
3
4
5
6
7
8
0.00 0.50 1.00 1.50 2.00 2.50 3.00
Stor
ey L
evel
Vmax/Ry*Vp
San Fernando
Kobe
Loma Prieta
Imperial Valley
Northridge
6C1
6C2
7C2
Average
Code
1
2
3
4
5
6
7
8
0.00 0.04 0.08 0.12 0.16 0.20 0.24
Stoe
ry L
evel
Link Rotation
San Fernando
Kobe
Loma Prieta
Imperial Valley
Northridge
6C1
6C2
7C2
Average
Code
71
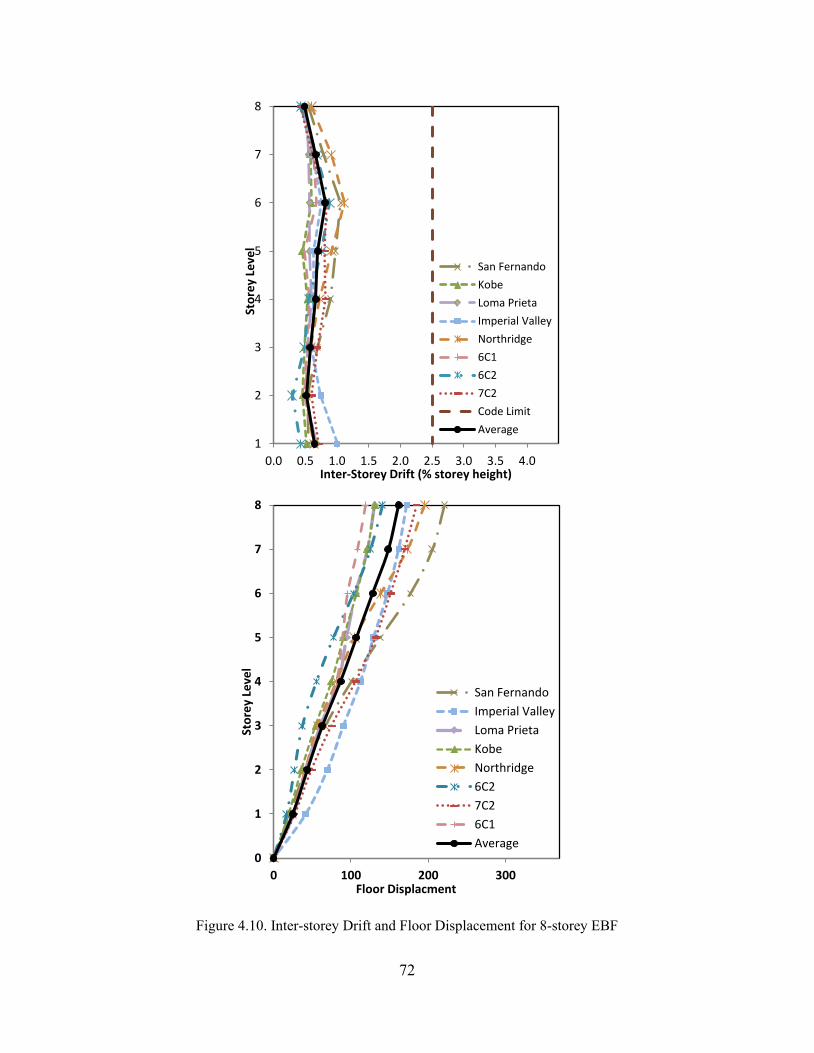
Figure 4.10. Inter-storey Drift and Floor Displacement for 8-storey EBF
1
2
3
4
5
6
7
8
0.0 0.5 1.0 1.5 2.0 2.5 3.0 3.5 4.0
Stor
ey L
evel
Inter-Storey Drift (% storey height)
San Fernando
Kobe
Loma Prieta
Imperial Valley
Northridge
6C1
6C2
7C2
Code Limit
Average
0
1
2
3
4
5
6
7
8
0 100 200 300
Stor
ey L
evel
Floor Displacment
San Fernando Imperial Valley Loma Prieta Kobe Northridge 6C2 7C2 6C1 Average
72
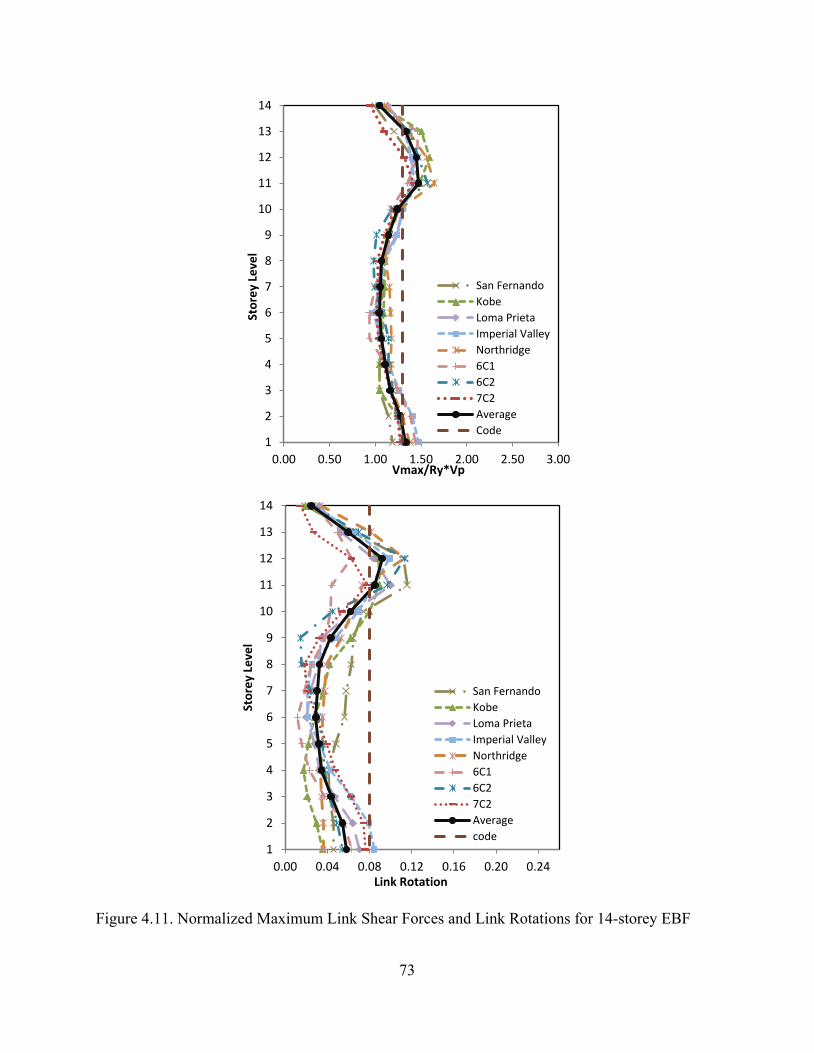
Figure 4.11. Normalized Maximum Link Shear Forces and Link Rotations for 14-storey EBF
1
2
3
4
5
6
7
8
9
10
11
12
13
14
0.00 0.50 1.00 1.50 2.00 2.50 3.00
Stor
ey L
evel
Vmax/Ry*Vp
San Fernando Kobe Loma Prieta Imperial Valley Northridge 6C1 6C2 7C2 Average Code
1
2
3
4
5
6
7
8
9
10
11
12
13
14
0.00 0.04 0.08 0.12 0.16 0.20 0.24
Stor
ey L
evel
Link Rotation
San Fernando Kobe Loma Prieta Imperial Valley Northridge 6C1 6C2 7C2 Average code
73
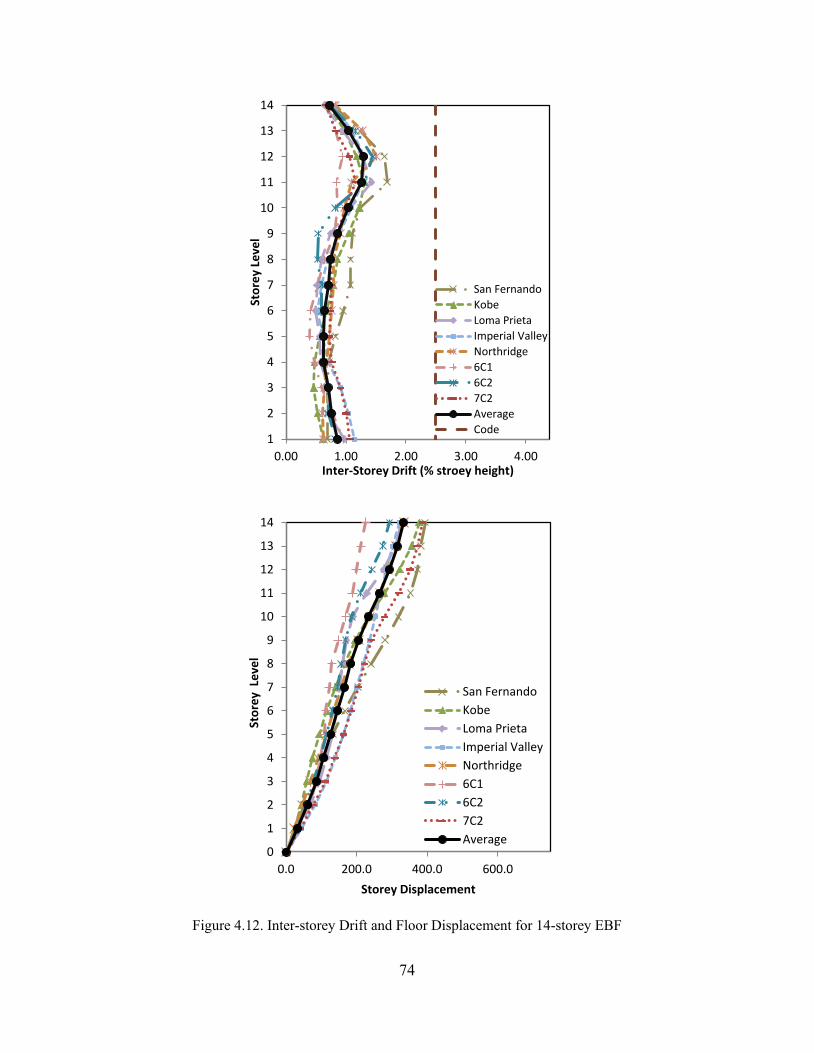
Figure 4.12. Inter-storey Drift and Floor Displacement for 14-storey EBF
1
2
3
4
5
6
7
8
9
10
11
12
13
14
0.00 1.00 2.00 3.00 4.00
Stor
ey L
evel
Inter-Storey Drift (% stroey height)
San Fernando Kobe Loma Prieta Imperial Valley Northridge 6C1 6C2 7C2 Average Code
0
1
2
3
4
5
6
7
8
9
10
11
12
13
14
0.0 200.0 400.0 600.0
Stor
ey L
evel
Storey Displacement
San Fernando Kobe Loma Prieta Imperial Valley Northridge 6C1 6C2 7C2 Average
74
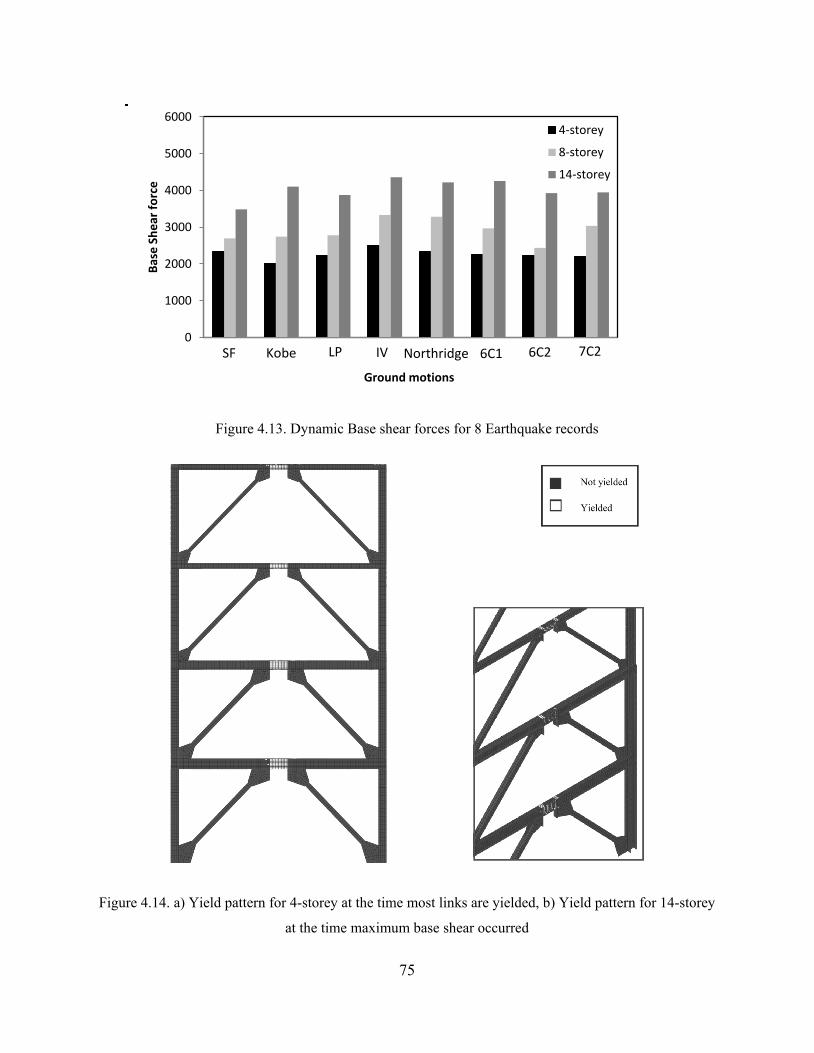
Figure 4.13. Dynamic Base shear forces for 8 Earthquake records
Figure 4.14. a) Yield pattern for 4-storey at the time most links are yielded, b) Yield pattern for 14-storey
at the time maximum base shear occurred
0
1000
2000
3000
4000
5000
6000
Base
She
ar fo
rce
Ground motions
4-storey
8-storey
14-storey
SF Kobe LP IV Northridge 6C1 6C2 7C2
75
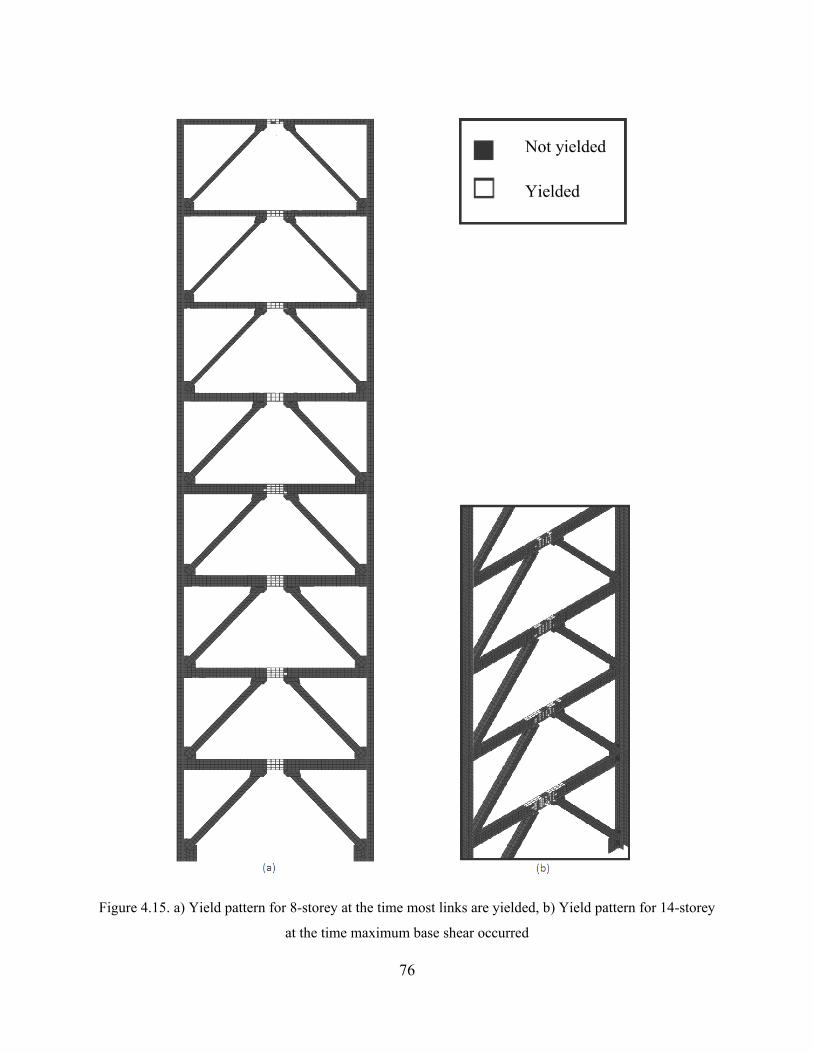
Figure 4.15. a) Yield pattern for 8-storey at the time most links are yielded, b) Yield pattern for 14-storey
at the time maximum base shear occurred
76
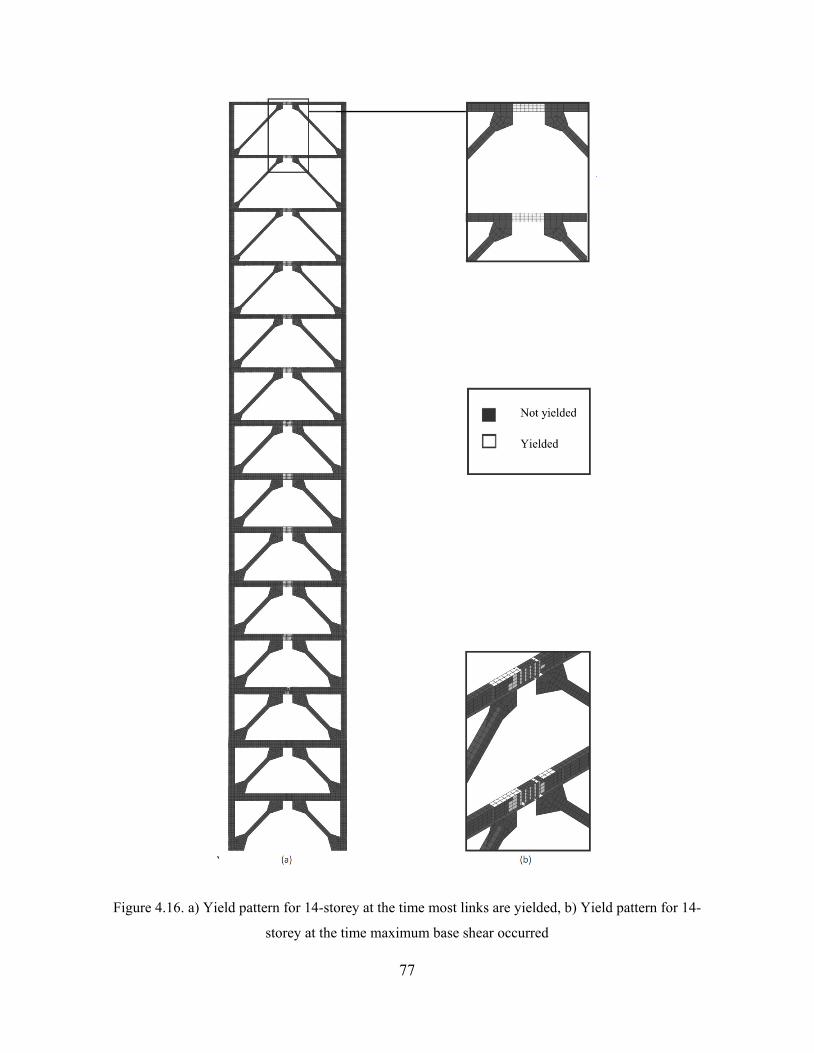
`
Figure 4.16. a) Yield pattern for 14-storey at the time most links are yielded, b) Yield pattern for 14-
storey at the time maximum base shear occurred
77
4.4. Summary
In this chapter, the results of nonlinear dynamic analyses of three EBFs with 4-, 8- and 14
storeys modeled in ABAQUS were presented. The seismic responses were demonstrated in terms
of link rotations, shear link overstrength and the inter-storey drifts. Also, the yielding sequence
of three designed EBFs was studied. It showed that the EBFs didn't lose their load carrying
capacity when all the links were yielded. After yielding of all the links, the outer beam
participated in carrying the load as it was considered in the design. In general, the EBF behavior
was found satisfactory. All the links showed the inelastic behavior and other member remained
in their elastic state as it was assumed in the design.
For the maximum link rotation, 4 and 8 storey EBFs showed the average rotations under the code
limit of 0.08 rad. However, for 14 storey structure, in the levels 11 and 12, the magnitude of
median link rotations went beyond the code limit. Also a concentration of link rotation was
observed at the first floor of 8 and 14 storeys but they are under the limit. For all EBFs, ratios of
shear forces in the links to probable shear strength were higher than the limit of 1.3 in some
floors, which is still under the values presented by some experimental studies. The limit of 1.3
presented by CSA S16-09 accounts for strain hardening developed in the links. The experimental
results showed that the link overstrength is mainly due to strain hardening; however, the shear
resistance of the flanges may also increase the link overstrength. The inter-storey drift results
show the values 50 to 70% lower than the limit of 0.025 sh presented by NBCC 2010. It was
observed that all the designed EBFs met the code inter-storey drift limit.
For all EBFs, maximum base reactions obtained from non-linear dynamic analysis were higher
than the design base shear. This primarily stems from the overstrength of the selected members
78

due to design considerations. The yielding pattern of EBFs under the Imperial Valley ground
motion, which has the maximum peak acceleration and induces the largest shear force at the base
of all frames, were also described. It showed most inelastic activities of the EBFS were confined
to the shear link while the other members behaved elastically. Some minor yielding was also
observed in the outer beam close to its connection to the link.
79
Chapter 5. Evaluation of Modal Pushover Method for Eccentrically Braced Frames
5.1. Introduction
The modal pushover analysis (MPA) is a pushover analysis procedure based on structural
dynamics theory and consistent with the response spectrum analysis (RSA). In this chapter, first
the structural dynamics theory underlying the modal pushover analysis is briefly discussed.
Then, the steps for implementing the modal pushover method are explained in detail. Finally, the
application of modal pushover analysis on EBFs is investigated by applying MPA on three
selected EBFs (low, medium and high-rise) through comparing the different response quantities
of MPA with the results of nonlinear time history analysis (NLTHA).
5.2. Modal Pushover Analysis
The governing equation of motion of a multi-storey structure subjected to horizontal ground
motion ( )gu t can be expressed by equation 5.1.
( ) ( )g effmu cu ku m u t P t+ + = − ι = 5.1
Where the vector u represents n lateral floor displacements relative to ground, the matrices m , c
, k are the mass, damping and lateral stiffness matrices of the system, the vector ι represents the
displacements of masses resulting from static application of a unit ground displacement, ( )effP t
is the effective lateral earthquake force. The spatial distribution of ( )effP t over the height of the
building is defined by the vector s m= ι which can be expanded as a summation of modal inertia
force distribution ns .
80
N N
n n nn 1 n 1
m s m= =
ι = = Γ φ∑ ∑
5.2
where nφ is the nth natural vibration mode of the structure and nΓ is modal participation factor
which can be calculated using equations below:
nn
n
LM
Γ = , Tn nL m= φ ι , T
n n nM m= φ φ ; 5.3
The free vibration of an undamped system in one of its natural vibration mode (rth mode) can be
expressed as:
r r ru (t) q (t)= φ 5.4
Considering equation 5.4 and5.2, equation 5.1 can be written for the rth mode as:
( )r r r r r r r r gm q (t) c q (t) k q (t) m u tφ + φ + φ = −Γ φ 5.5
Using the orthogonality of the modes presented in equation 5.6, it can be shown that only the nth
mode contributes to the response.
T T Tn r n r n rm 0, k 0, c 0φ φ = φ φ = φ φ =
T T Tn n n n n n n n nm M , k K , c Cφ φ = φ φ = φ φ =
5.6
To show this, both sides of the equation 5.5 are multiplied by Tnφ , resulting in the equation 5.7 in
which just the nth mode gives the non-zero terms.
( )n n n n n n n n gM q (t) C q (t) K q (t) M u t+ + = − Γ 5.7
Dividing both sides by nM gives:
81
( )2n n n n n n n gq (t) 2 q (t) q (t) u t+ ξ ω +ω = −Γ 5.8
where nω is the natural vibration frequency and nξ is the damping of nth mode.
The equation of motion of the nth-mode elastic SDOF system is:
2
n n n n n n gD 2 D D u (t)+ ξ ω +ω = −
5.9
Therefore, nq (t) can be formulated by comparing equations 5.8 and 5.9.
( ) ( )n n nq t D t= Γ 5.10
Utilizing equation 5.10, equation 5.4 can be rewritten for the nth mode as:
( ) ( )n n n nu t D t= Γ φ 5.11
For an inelastic multi-storey structure, the relations between lateral forces sf and lateral
displacements u depend on the history of the displacement. Thus, the equation of motion 5.1
changes into equation 5.12 for inelastic systems.
s g effmu cu f (u,signu) m u (t) P (t)+ + = ι =
5.12
Employing the modal orthogonality, equation 5.12 changes into equation 5.13.
( )snn n n n n g
n
Fq (t) 2 q (t) u tM
+ ξ ω + = −Γ
5.13
Also, the equation of motion of the nth-mode inelastic SDOF system is:
82
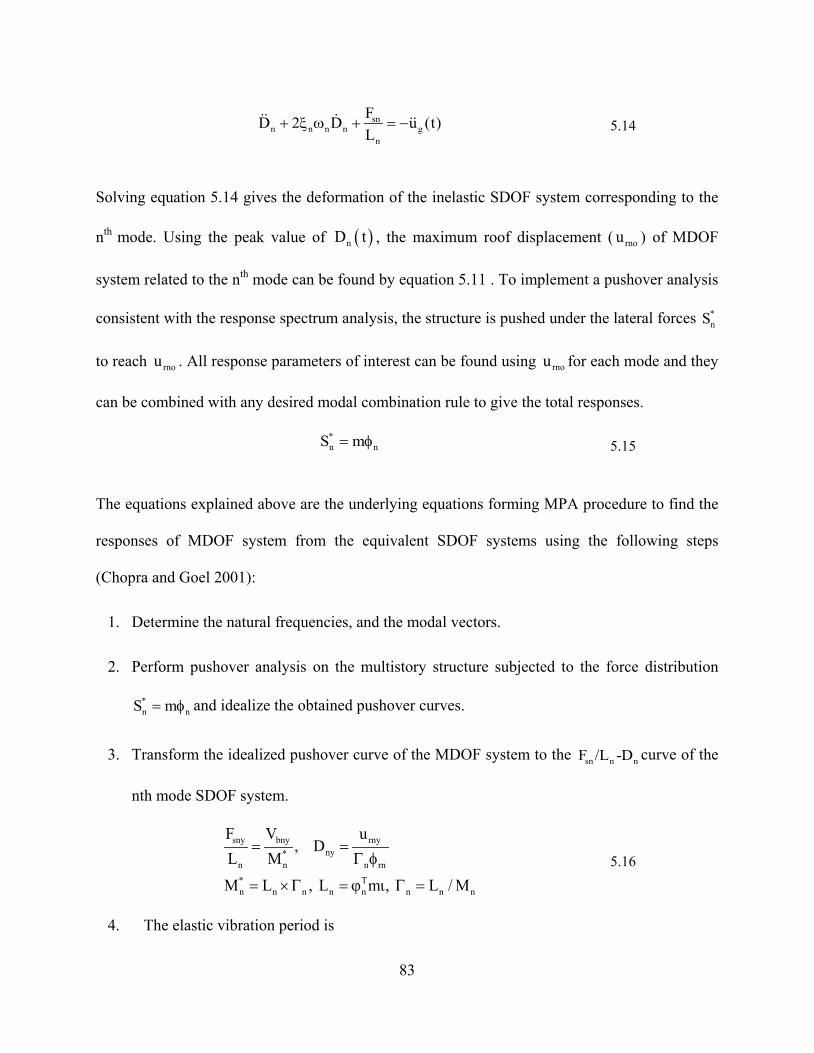
sn
n n n n gn
FD 2 D u (t)L
+ ξ ω + = −
5.14
Solving equation 5.14 gives the deformation of the inelastic SDOF system corresponding to the
nth mode. Using the peak value of ( )nD t , the maximum roof displacement ( rnou ) of MDOF
system related to the nth mode can be found by equation 5.11 . To implement a pushover analysis
consistent with the response spectrum analysis, the structure is pushed under the lateral forces *nS
to reach rnou . All response parameters of interest can be found using rnou for each mode and they
can be combined with any desired modal combination rule to give the total responses.
*n nS m= φ 5.15
The equations explained above are the underlying equations forming MPA procedure to find the
responses of MDOF system from the equivalent SDOF systems using the following steps
(Chopra and Goel 2001):
1. Determine the natural frequencies, and the modal vectors.
2. Perform pushover analysis on the multistory structure subjected to the force distribution
*n nS m= φ and idealize the obtained pushover curves.
3. Transform the idealized pushover curve of the MDOF system to the sn n nF /L -D curve of the
nth mode SDOF system.
sny bny rnyny*
n n n rn* Tn n n n n n n n
F V u, D
L MM L , L m , L / M
= =Γ φ
= ×Γ = ϕ ι Γ =
5.16
4. The elastic vibration period is
83
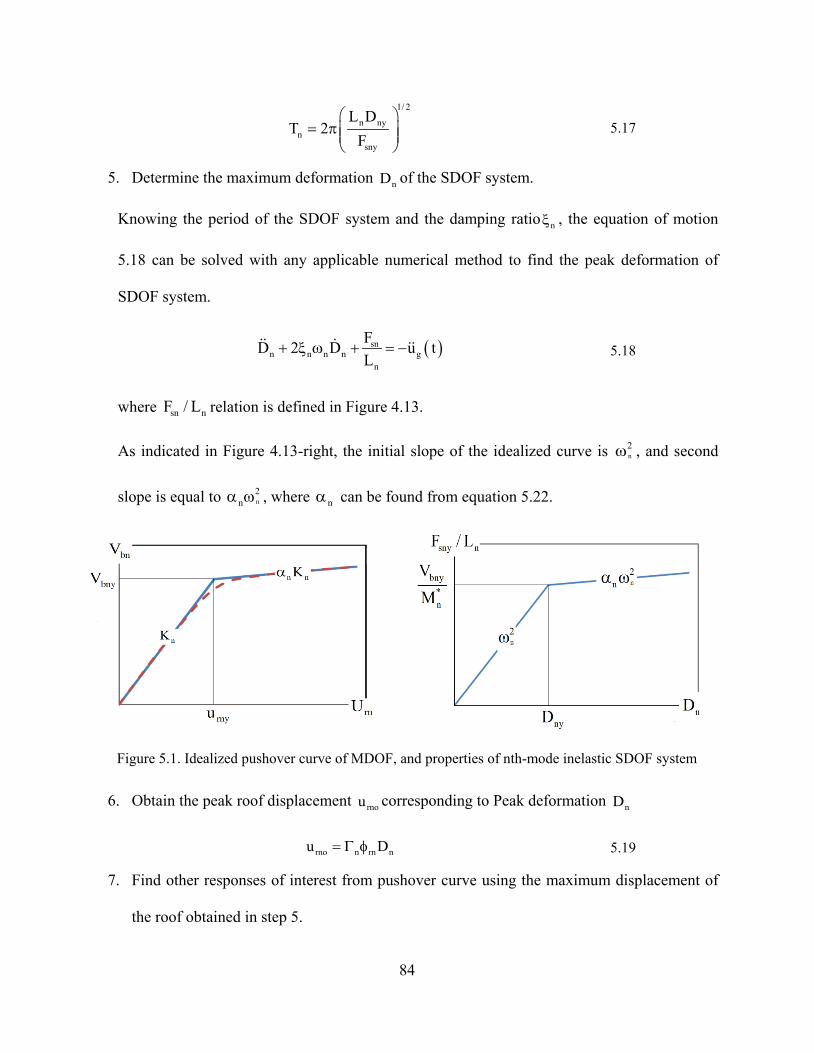
1/ 2
n nyn
sny
L DT 2
F
= π
5.17
5. Determine the maximum deformation nD of the SDOF system.
Knowing the period of the SDOF system and the damping ratio nξ , the equation of motion
5.18 can be solved with any applicable numerical method to find the peak deformation of
SDOF system.
( )sn
n n n n gn
FD 2 D u tL
+ ξ ω + = −
5.18
where sn nF / L relation is defined in Figure 4.13.
As indicated in Figure 4.13-right, the initial slope of the idealized curve is n2ω , and second
slope is equal to n2
nα ω , where nα can be found from equation 5.22.
Figure 5.1. Idealized pushover curve of MDOF, and properties of nth-mode inelastic SDOF system
6. Obtain the peak roof displacement rnou corresponding to Peak deformation nD
rno n rn nu D= Γ φ 5.19
7. Find other responses of interest from pushover curve using the maximum displacement of
the roof obtained in step 5.
84
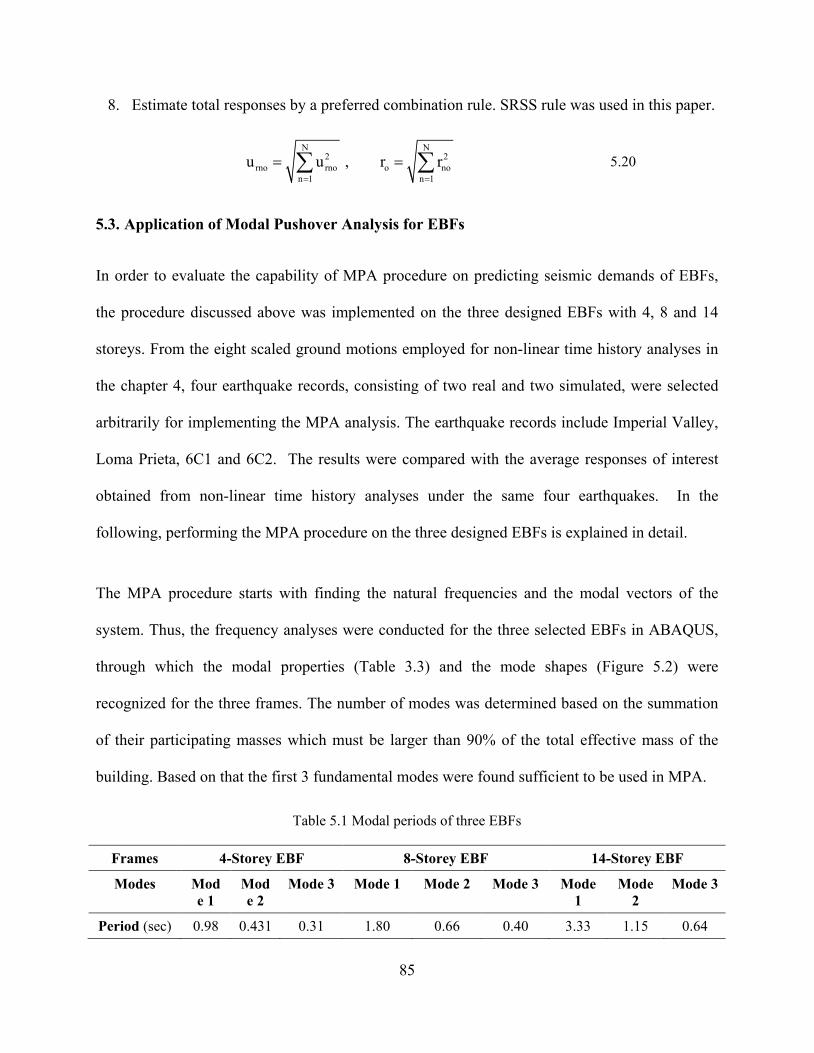
8. Estimate total responses by a preferred combination rule. SRSS rule was used in this paper.
N N2 2
rno rno o non 1 n 1
u u , r r= =
= =∑ ∑
5.20
5.3. Application of Modal Pushover Analysis for EBFs
In order to evaluate the capability of MPA procedure on predicting seismic demands of EBFs,
the procedure discussed above was implemented on the three designed EBFs with 4, 8 and 14
storeys. From the eight scaled ground motions employed for non-linear time history analyses in
the chapter 4, four earthquake records, consisting of two real and two simulated, were selected
arbitrarily for implementing the MPA analysis. The earthquake records include Imperial Valley,
Loma Prieta, 6C1 and 6C2. The results were compared with the average responses of interest
obtained from non-linear time history analyses under the same four earthquakes. In the
following, performing the MPA procedure on the three designed EBFs is explained in detail.
The MPA procedure starts with finding the natural frequencies and the modal vectors of the
system. Thus, the frequency analyses were conducted for the three selected EBFs in ABAQUS,
through which the modal properties (Table 3.3) and the mode shapes (Figure 5.2) were
recognized for the three frames. The number of modes was determined based on the summation
of their participating masses which must be larger than 90% of the total effective mass of the
building. Based on that the first 3 fundamental modes were found sufficient to be used in MPA.
Table 5.1 Modal periods of three EBFs
Frames 4-Storey EBF 8-Storey EBF 14-Storey EBF
Modes Mode 1
Mode 2
Mode 3 Mode 1 Mode 2 Mode 3 Mode 1
Mode 2
Mode 3
Period (sec) 0.98 0.431 0.31 1.80 0.66 0.40 3.33 1.15 0.64
85
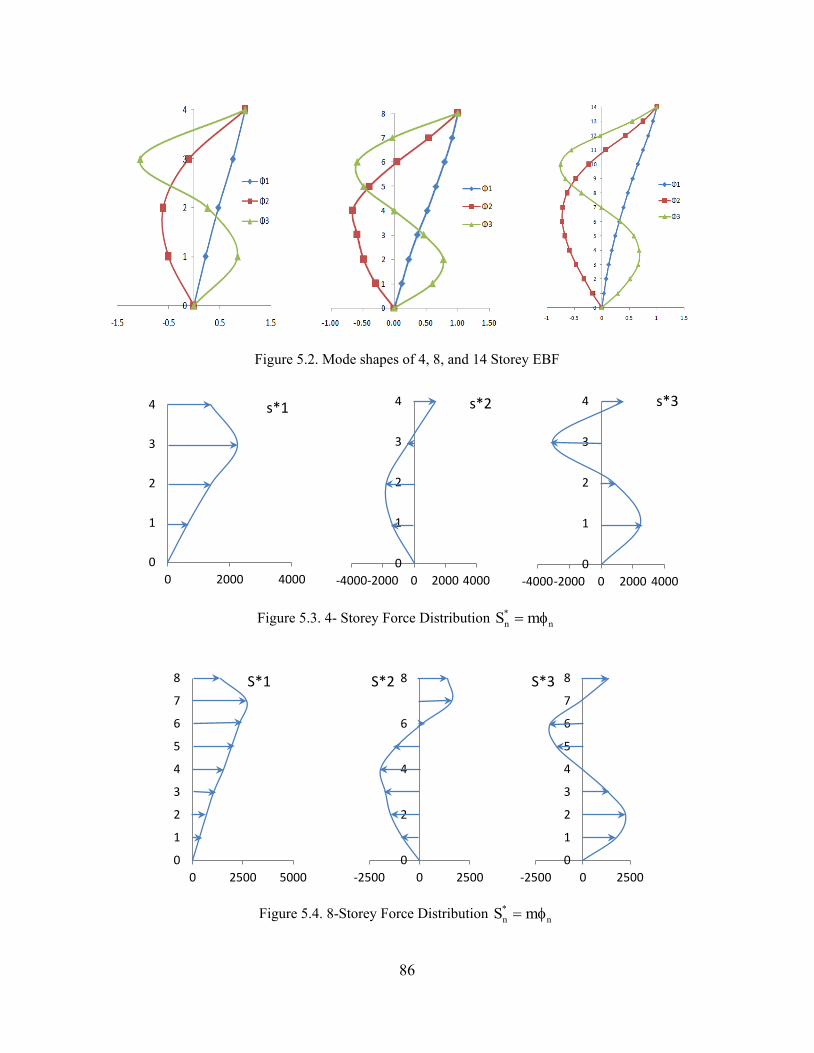
Figure 5.2. Mode shapes of 4, 8, and 14 Storey EBF
Figure 5.3. 4- Storey Force Distribution *n nS m= φ
Figure 5.4. 8-Storey Force Distribution *n nS m= φ
0
1
2
3
4
0 2000 4000
s*1
0
1
2
3
4
-4000 -2000 0 2000 4000
s*2
0
1
2
3
4
-4000 -2000 0 2000 4000
s*3
0
1
2
3
4
5
6
7
8
0 2500 5000
S*1
0
2
4
6
8
-2500 0 2500
S*2
0
1
2
3
4
5
6
7
8
-2500 0 2500
S*3
86
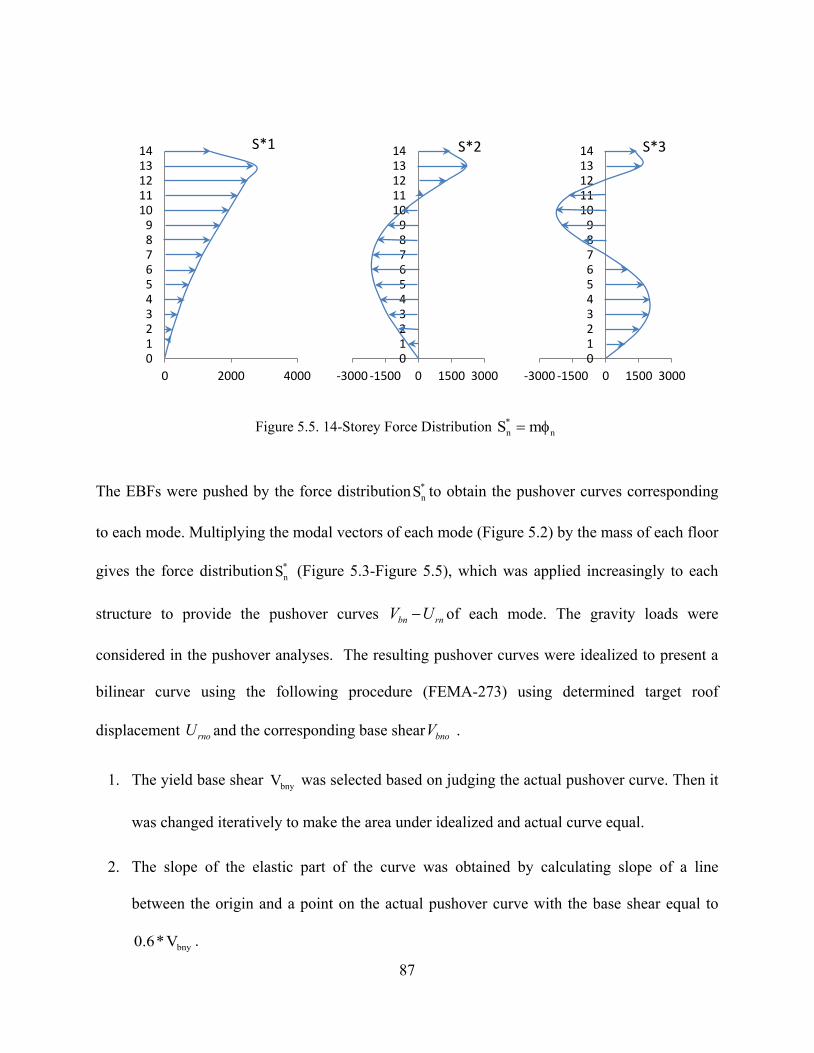
Figure 5.5. 14-Storey Force Distribution *n nS m= φ
The EBFs were pushed by the force distribution *nS to obtain the pushover curves corresponding
to each mode. Multiplying the modal vectors of each mode (Figure 5.2) by the mass of each floor
gives the force distribution *nS (Figure 5.3-Figure 5.5), which was applied increasingly to each
structure to provide the pushover curves bn rnV U− of each mode. The gravity loads were
considered in the pushover analyses. The resulting pushover curves were idealized to present a
bilinear curve using the following procedure (FEMA-273) using determined target roof
displacement rnoU and the corresponding base shear bnoV .
1. The yield base shear bnyV was selected based on judging the actual pushover curve. Then it
was changed iteratively to make the area under idealized and actual curve equal.
2. The slope of the elastic part of the curve was obtained by calculating slope of a line
between the origin and a point on the actual pushover curve with the base shear equal to
bny0.6*V .
0 1 2 3 4 5 6 7 8 9
10 11 12 13 14
0 2000 4000
S*1
0 1 2 3 4 5 6 7 8 9
10 11 12 13 14
-3000 -1500 0 1500 3000
S*2
0 1 2 3 4 5 6 7 8 9
10 11 12 13 14
-3000 -1500 0 1500 3000
S*3
87
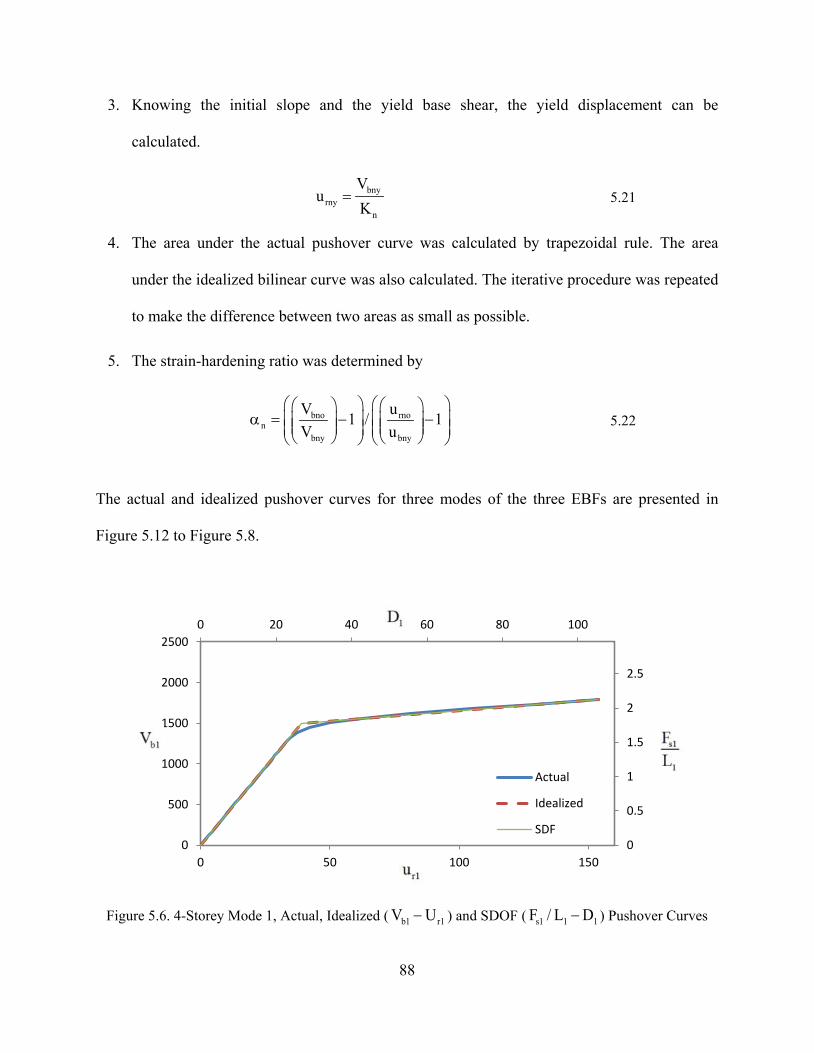
3. Knowing the initial slope and the yield base shear, the yield displacement can be
calculated.
bny
rnyn
Vu
K=
5.21
4. The area under the actual pushover curve was calculated by trapezoidal rule. The area
under the idealized bilinear curve was also calculated. The iterative procedure was repeated
to make the difference between two areas as small as possible.
5. The strain-hardening ratio was determined by
bno rno
nbny bny
V u1 / 1V u
α = − −
5.22
The actual and idealized pushover curves for three modes of the three EBFs are presented in
Figure 5.12 to Figure 5.8.
Figure 5.6. 4-Storey Mode 1, Actual, Idealized ( b1 r1V U− ) and SDOF ( s1 1 1F / L D− ) Pushover Curves
0
0.5
1
1.5
2
2.5
0 20 40 60 80 100
0
500
1000
1500
2000
2500
0 50 100 150
Actual
Idealized
SDF
88
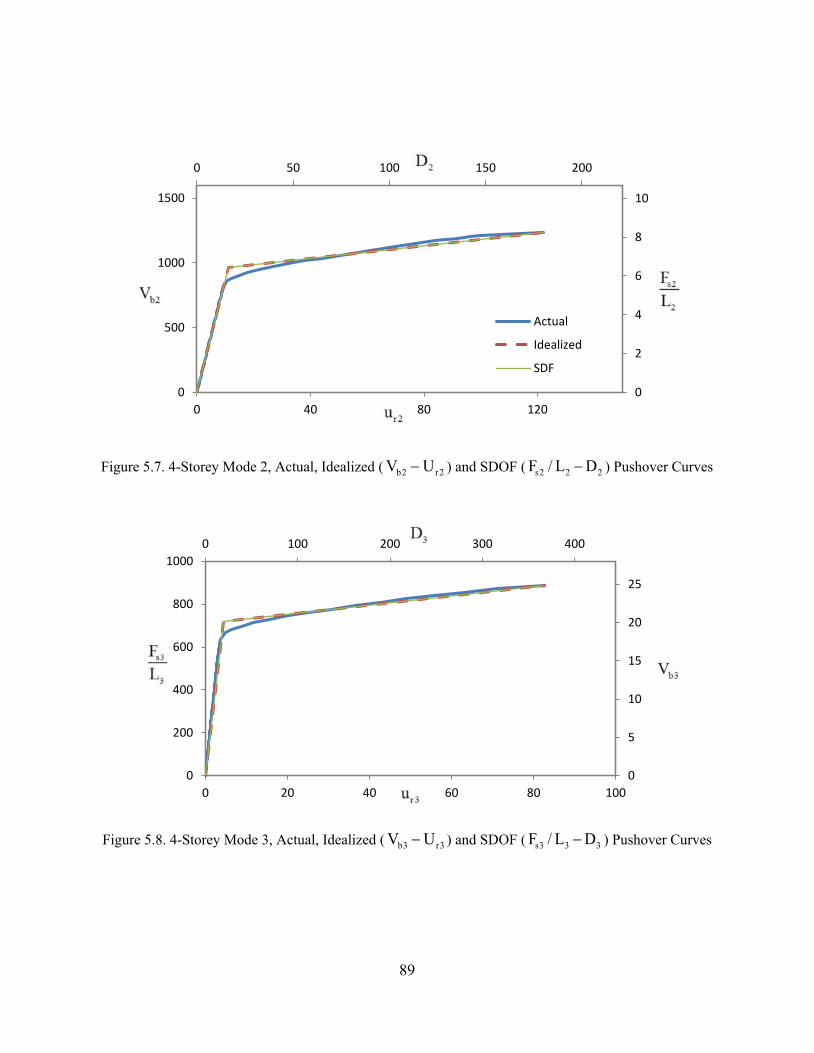
Figure 5.7. 4-Storey Mode 2, Actual, Idealized ( b2 r2V U− ) and SDOF ( s2 2 2F / L D− ) Pushover Curves
Figure 5.8. 4-Storey Mode 3, Actual, Idealized ( b3 r3V U− ) and SDOF ( s3 3 3F / L D− ) Pushover Curves
0
2
4
6
8
10
0 50 100 150 200
0
500
1000
1500
0 40 80 120
Actual
Idealized
SDF
0
5
10
15
20
25
0 100 200 300 400
0
200
400
600
800
1000
0 20 40 60 80 100
89
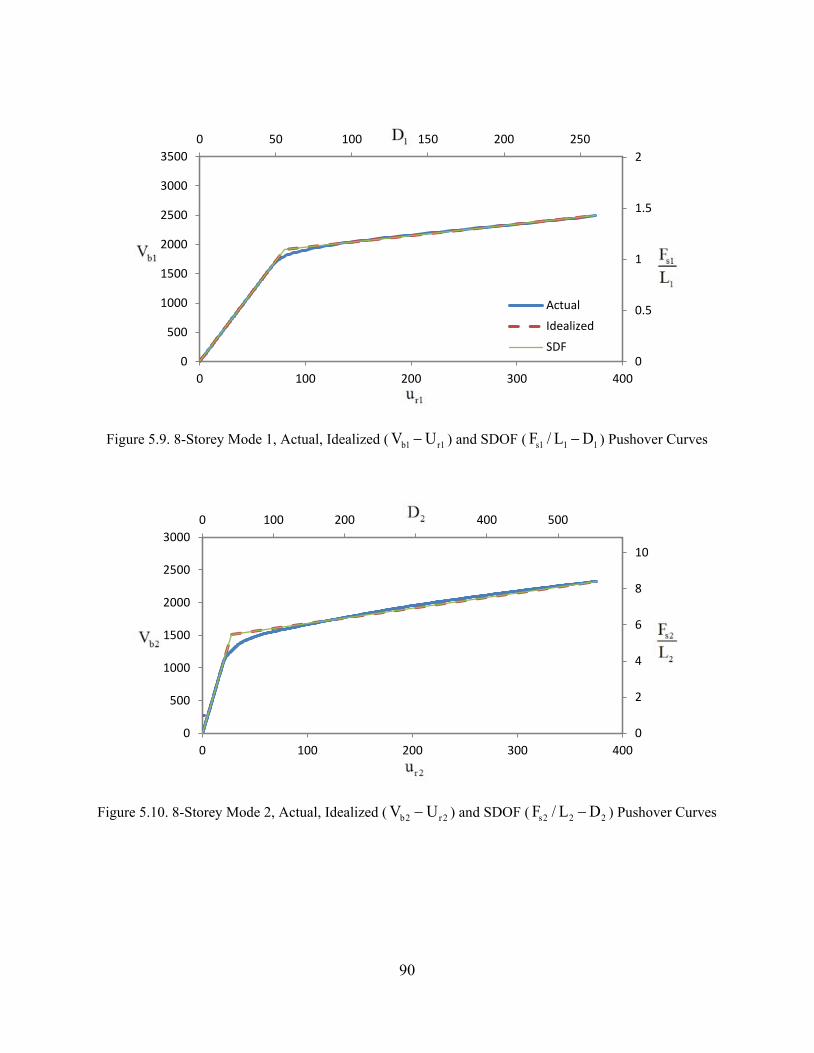
Figure 5.9. 8-Storey Mode 1, Actual, Idealized ( b1 r1V U− ) and SDOF ( s1 1 1F / L D− ) Pushover Curves
Figure 5.10. 8-Storey Mode 2, Actual, Idealized ( b2 r2V U− ) and SDOF ( s2 2 2F / L D− ) Pushover Curves
0
0.5
1
1.5
2 0 50 100 150 200 250
0
500
1000
1500
2000
2500
3000
3500
0 100 200 300 400
Actual
Idealized
SDF
0
2
4
6
8
10
0 100 200 300 400 500
0
500
1000
1500
2000
2500
3000
0 100 200 300 400
90
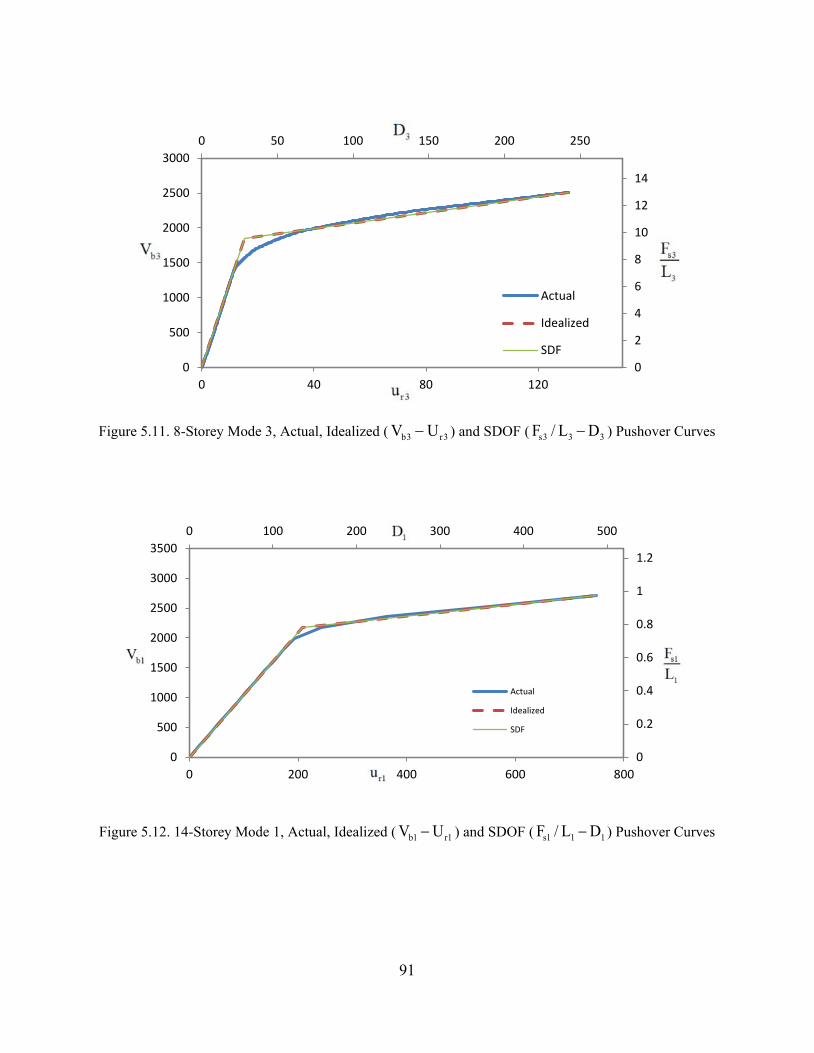
Figure 5.11. 8-Storey Mode 3, Actual, Idealized ( b3 r3V U− ) and SDOF ( s3 3 3F / L D− ) Pushover Curves
Figure 5.12. 14-Storey Mode 1, Actual, Idealized ( b1 r1V U− ) and SDOF ( s1 1 1F / L D− ) Pushover Curves
0
2
4
6
8
10
12
14
0 50 100 150 200 250
0
500
1000
1500
2000
2500
3000
0 40 80 120
Actual
Idealized
SDF
0
0.2
0.4
0.6
0.8
1
1.2
0 100 200 300 400 500
0
500
1000
1500
2000
2500
3000
3500
0 200 400 600 800
Actual
Idealized
SDF
91
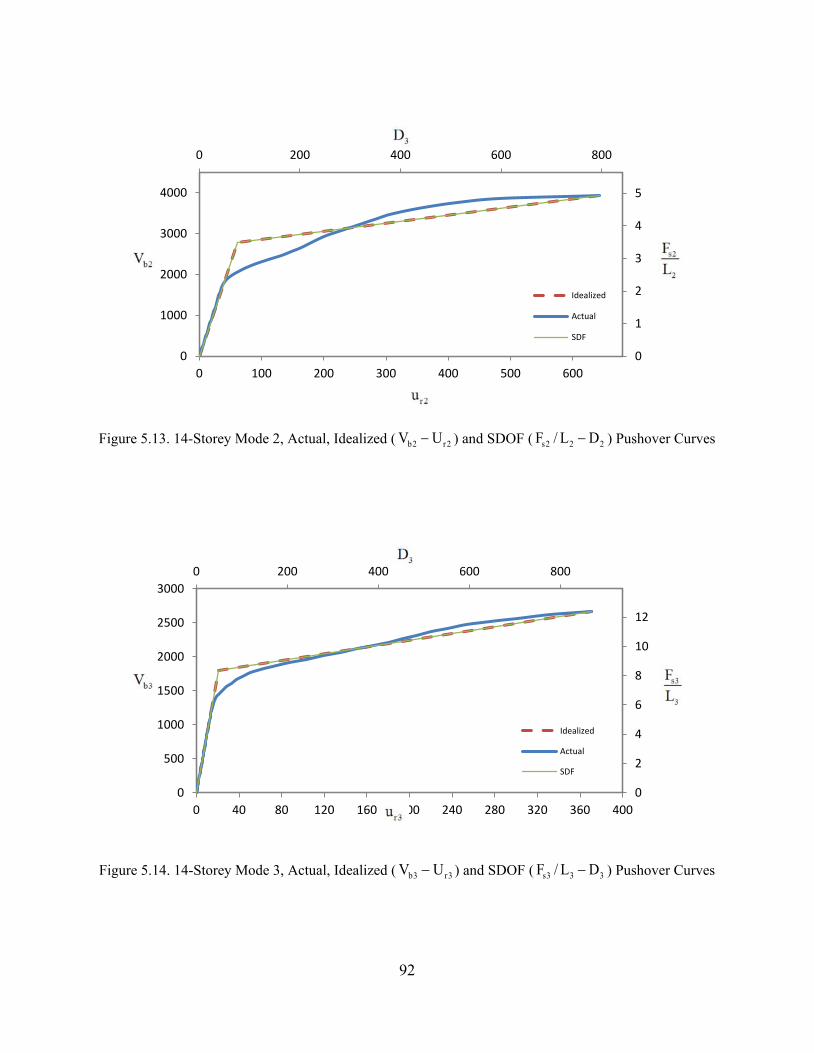
Figure 5.13. 14-Storey Mode 2, Actual, Idealized ( b2 r2V U− ) and SDOF ( s2 2 2F / L D− ) Pushover Curves
Figure 5.14. 14-Storey Mode 3, Actual, Idealized ( b3 r3V U− ) and SDOF ( s3 3 3F / L D− ) Pushover Curves
0
1
2
3
4
5
0 200 400 600 800
0
1000
2000
3000
4000
0 100 200 300 400 500 600
Idealized
Actual
SDF
0
2
4
6
8
10
12
0 200 400 600 800
0
500
1000
1500
2000
2500
3000
0 40 80 120 160 200 240 280 320 360 400
Idealized
Actual
SDF
92
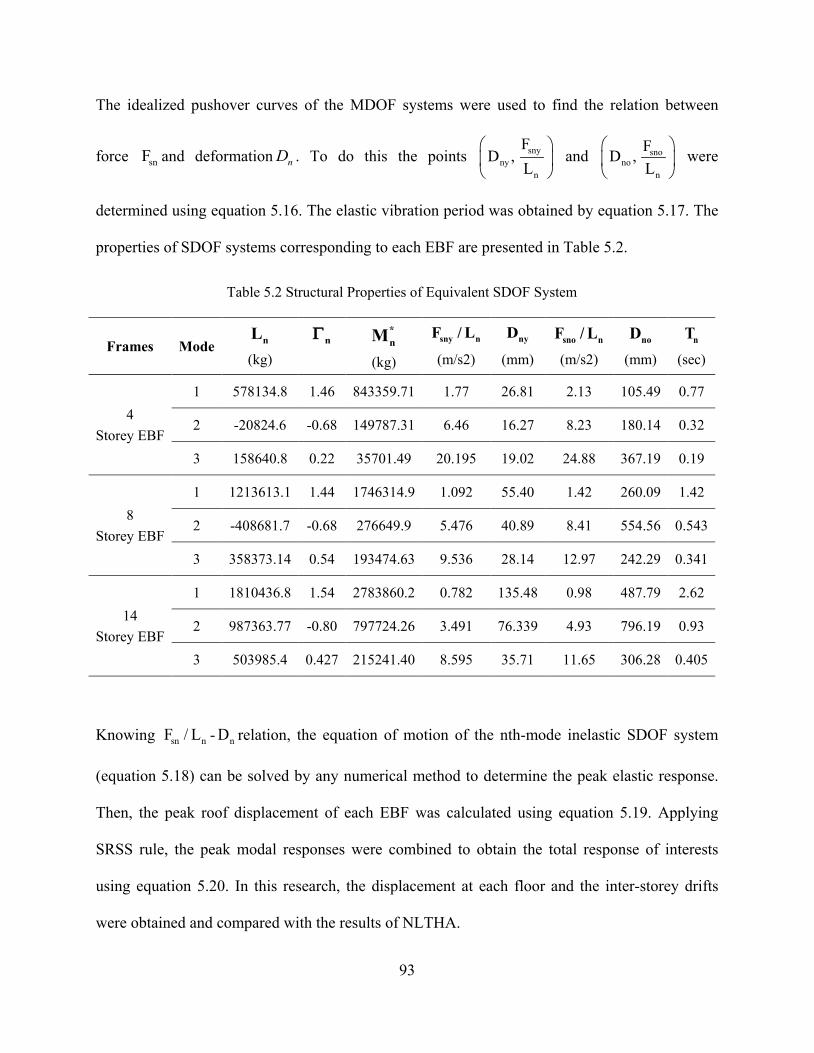
The idealized pushover curves of the MDOF systems were used to find the relation between
force snF and deformation nD . To do this the points snyny
n
FD ,
L
and snono
n
FD ,L
were
determined using equation 5.16. The elastic vibration period was obtained by equation 5.17. The
properties of SDOF systems corresponding to each EBF are presented in Table 5.2.
Table 5.2 Structural Properties of Equivalent SDOF System
Frames Mode nL (kg)
nΓ
*nM
(kg)
sny nF / L (m/s2)
nyD (mm)
sno nF / L (m/s2)
noD (mm)
nT (sec)
4 Storey EBF
1 578134.8 1.46 843359.71 1.77 26.81 2.13 105.49 0.77
2 -20824.6 -0.68 149787.31 6.46 16.27 8.23 180.14 0.32
3 158640.8 0.22 35701.49 20.195 19.02 24.88 367.19 0.19
8 Storey EBF
1 1213613.1 1.44 1746314.9 1.092 55.40 1.42 260.09 1.42
2 -408681.7 -0.68 276649.9 5.476 40.89 8.41 554.56 0.543
3 358373.14 0.54 193474.63 9.536 28.14 12.97 242.29 0.341
14 Storey EBF
1 1810436.8 1.54 2783860.2 0.782 135.48 0.98 487.79 2.62
2 987363.77 -0.80 797724.26 3.491 76.339 4.93 796.19 0.93
3 503985.4 0.427 215241.40 8.595 35.71 11.65 306.28 0.405
Knowing sn nF / L - nD relation, the equation of motion of the nth-mode inelastic SDOF system
(equation 5.18) can be solved by any numerical method to determine the peak elastic response.
Then, the peak roof displacement of each EBF was calculated using equation 5.19. Applying
SRSS rule, the peak modal responses were combined to obtain the total response of interests
using equation 5.20. In this research, the displacement at each floor and the inter-storey drifts
were obtained and compared with the results of NLTHA.
93
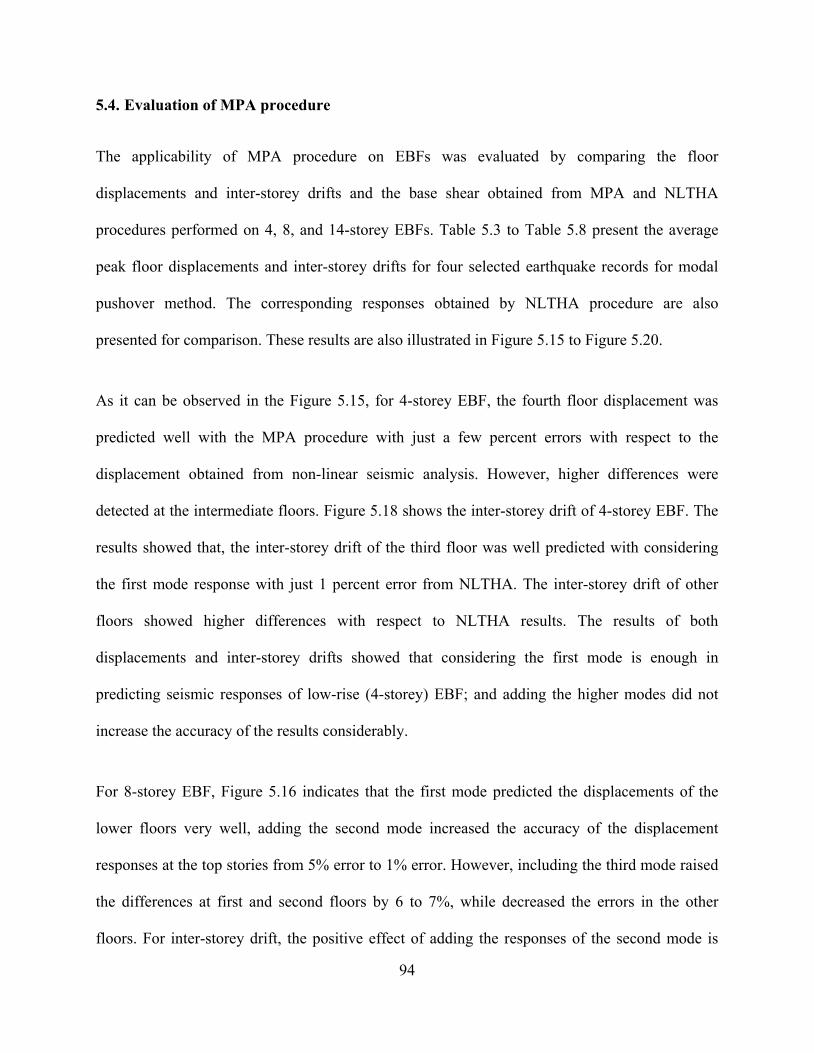
5.4. Evaluation of MPA procedure
The applicability of MPA procedure on EBFs was evaluated by comparing the floor
displacements and inter-storey drifts and the base shear obtained from MPA and NLTHA
procedures performed on 4, 8, and 14-storey EBFs. Table 5.3 to Table 5.8 present the average
peak floor displacements and inter-storey drifts for four selected earthquake records for modal
pushover method. The corresponding responses obtained by NLTHA procedure are also
presented for comparison. These results are also illustrated in Figure 5.15 to Figure 5.20.
As it can be observed in the Figure 5.15, for 4-storey EBF, the fourth floor displacement was
predicted well with the MPA procedure with just a few percent errors with respect to the
displacement obtained from non-linear seismic analysis. However, higher differences were
detected at the intermediate floors. Figure 5.18 shows the inter-storey drift of 4-storey EBF. The
results showed that, the inter-storey drift of the third floor was well predicted with considering
the first mode response with just 1 percent error from NLTHA. The inter-storey drift of other
floors showed higher differences with respect to NLTHA results. The results of both
displacements and inter-storey drifts showed that considering the first mode is enough in
predicting seismic responses of low-rise (4-storey) EBF; and adding the higher modes did not
increase the accuracy of the results considerably.
For 8-storey EBF, Figure 5.16 indicates that the first mode predicted the displacements of the
lower floors very well, adding the second mode increased the accuracy of the displacement
responses at the top stories from 5% error to 1% error. However, including the third mode raised
the differences at first and second floors by 6 to 7%, while decreased the errors in the other
floors. For inter-storey drift, the positive effect of adding the responses of the second mode is
94
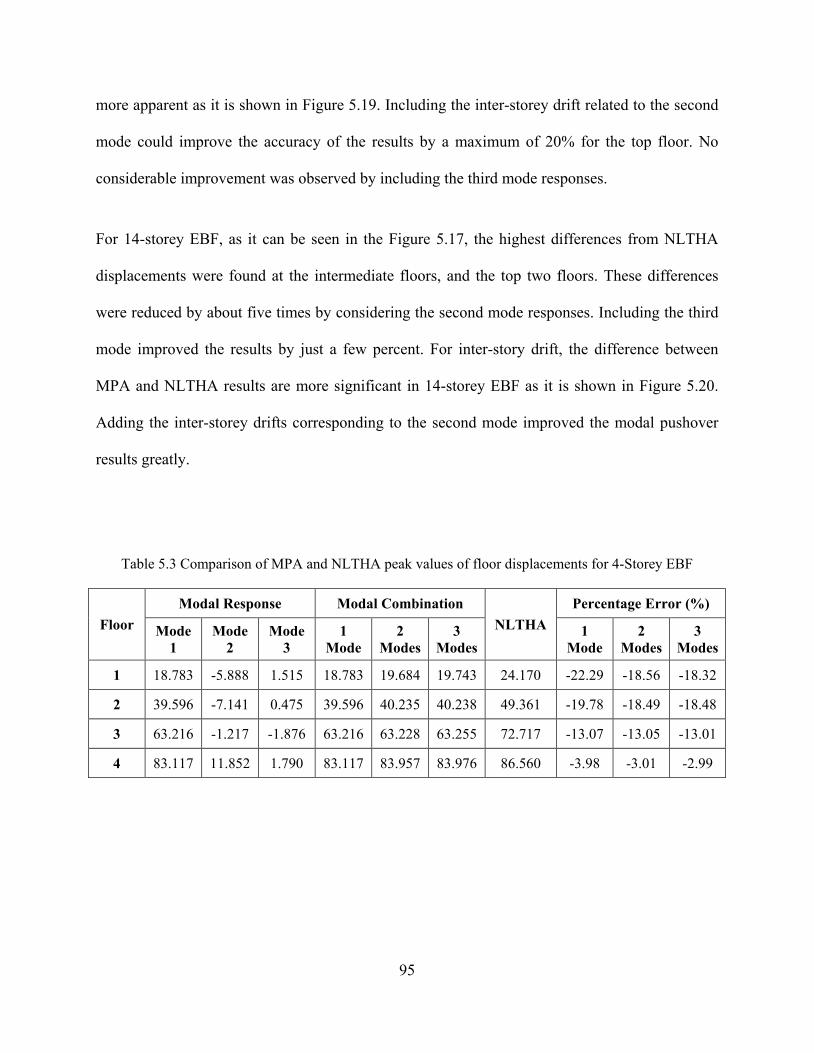
more apparent as it is shown in Figure 5.19. Including the inter-storey drift related to the second
mode could improve the accuracy of the results by a maximum of 20% for the top floor. No
considerable improvement was observed by including the third mode responses.
For 14-storey EBF, as it can be seen in the Figure 5.17, the highest differences from NLTHA
displacements were found at the intermediate floors, and the top two floors. These differences
were reduced by about five times by considering the second mode responses. Including the third
mode improved the results by just a few percent. For inter-story drift, the difference between
MPA and NLTHA results are more significant in 14-storey EBF as it is shown in Figure 5.20.
Adding the inter-storey drifts corresponding to the second mode improved the modal pushover
results greatly.
Table 5.3 Comparison of MPA and NLTHA peak values of floor displacements for 4-Storey EBF
Floor Modal Response Modal Combination
NLTHA Percentage Error (%)
Mode 1
Mode 2
Mode 3
1 Mode
2 Modes
3 Modes
1 Mode
2 Modes
3 Modes
1 18.783 -5.888 1.515 18.783 19.684 19.743 24.170 -22.29 -18.56 -18.32
2 39.596 -7.141 0.475 39.596 40.235 40.238 49.361 -19.78 -18.49 -18.48
3 63.216 -1.217 -1.876 63.216 63.228 63.255 72.717 -13.07 -13.05 -13.01
4 83.117 11.852 1.790 83.117 83.957 83.976 86.560 -3.98 -3.01 -2.99
95
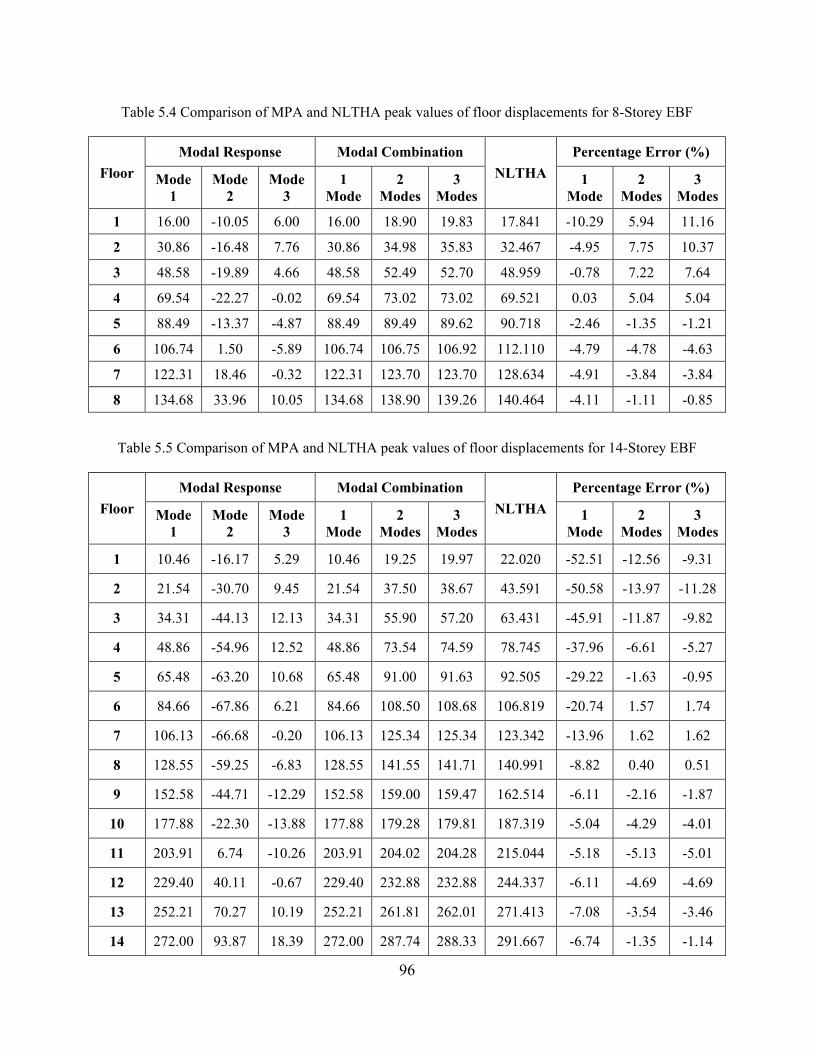
Table 5.4 Comparison of MPA and NLTHA peak values of floor displacements for 8-Storey EBF
Floor Modal Response Modal Combination
NLTHA Percentage Error (%)
Mode 1
Mode 2
Mode 3
1 Mode
2 Modes
3 Modes
1 Mode
2 Modes
3 Modes
1 16.00 -10.05 6.00 16.00 18.90 19.83 17.841 -10.29 5.94 11.16
2 30.86 -16.48 7.76 30.86 34.98 35.83 32.467 -4.95 7.75 10.37
3 48.58 -19.89 4.66 48.58 52.49 52.70 48.959 -0.78 7.22 7.64
4 69.54 -22.27 -0.02 69.54 73.02 73.02 69.521 0.03 5.04 5.04
5 88.49 -13.37 -4.87 88.49 89.49 89.62 90.718 -2.46 -1.35 -1.21
6 106.74 1.50 -5.89 106.74 106.75 106.92 112.110 -4.79 -4.78 -4.63
7 122.31 18.46 -0.32 122.31 123.70 123.70 128.634 -4.91 -3.84 -3.84
8 134.68 33.96 10.05 134.68 138.90 139.26 140.464 -4.11 -1.11 -0.85
Table 5.5 Comparison of MPA and NLTHA peak values of floor displacements for 14-Storey EBF
Floor Modal Response Modal Combination
NLTHA Percentage Error (%)
Mode 1
Mode 2
Mode 3
1 Mode
2 Modes
3 Modes
1 Mode
2 Modes
3 Modes
1 10.46 -16.17 5.29 10.46 19.25 19.97 22.020 -52.51 -12.56 -9.31
2 21.54 -30.70 9.45 21.54 37.50 38.67 43.591 -50.58 -13.97 -11.28
3 34.31 -44.13 12.13 34.31 55.90 57.20 63.431 -45.91 -11.87 -9.82
4 48.86 -54.96 12.52 48.86 73.54 74.59 78.745 -37.96 -6.61 -5.27
5 65.48 -63.20 10.68 65.48 91.00 91.63 92.505 -29.22 -1.63 -0.95
6 84.66 -67.86 6.21 84.66 108.50 108.68 106.819 -20.74 1.57 1.74
7 106.13 -66.68 -0.20 106.13 125.34 125.34 123.342 -13.96 1.62 1.62
8 128.55 -59.25 -6.83 128.55 141.55 141.71 140.991 -8.82 0.40 0.51
9 152.58 -44.71 -12.29 152.58 159.00 159.47 162.514 -6.11 -2.16 -1.87
10 177.88 -22.30 -13.88 177.88 179.28 179.81 187.319 -5.04 -4.29 -4.01
11 203.91 6.74 -10.26 203.91 204.02 204.28 215.044 -5.18 -5.13 -5.01
12 229.40 40.11 -0.67 229.40 232.88 232.88 244.337 -6.11 -4.69 -4.69
13 252.21 70.27 10.19 252.21 261.81 262.01 271.413 -7.08 -3.54 -3.46
14 272.00 93.87 18.39 272.00 287.74 288.33 291.667 -6.74 -1.35 -1.14
96
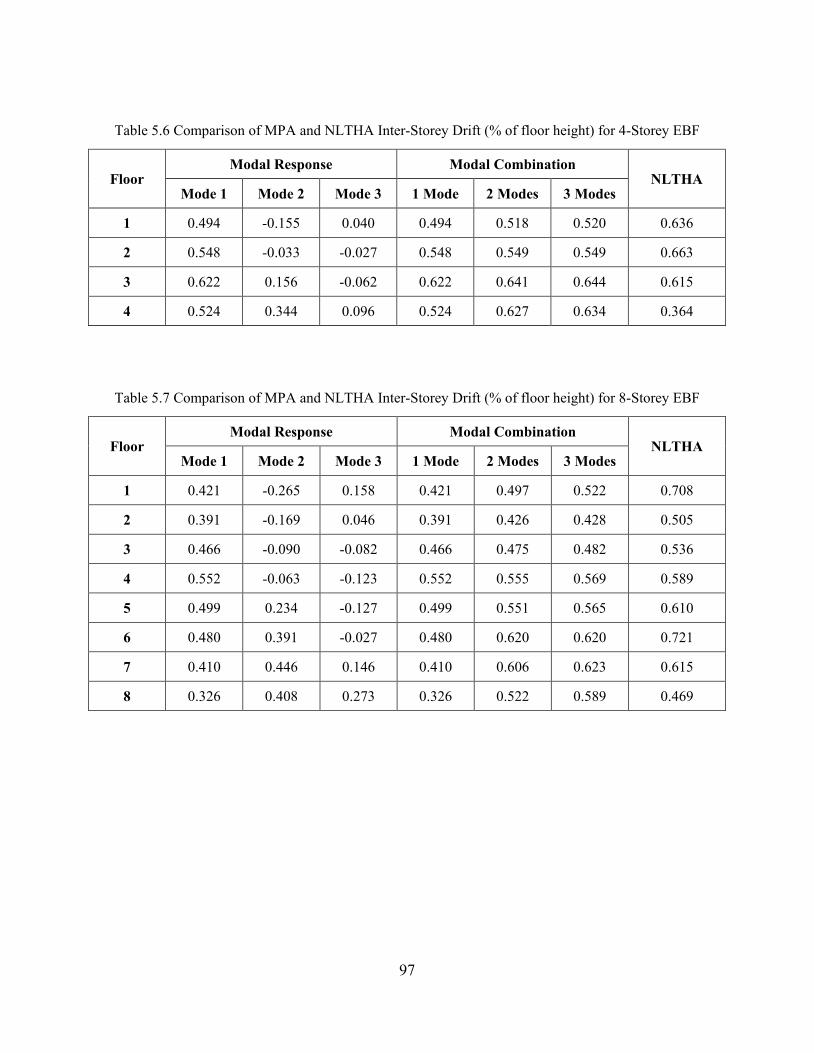
Table 5.6 Comparison of MPA and NLTHA Inter-Storey Drift (% of floor height) for 4-Storey EBF
Floor Modal Response Modal Combination
NLTHA Mode 1 Mode 2 Mode 3 1 Mode 2 Modes 3 Modes
1 0.494 -0.155 0.040 0.494 0.518 0.520 0.636
2 0.548 -0.033 -0.027 0.548 0.549 0.549 0.663
3 0.622 0.156 -0.062 0.622 0.641 0.644 0.615
4 0.524 0.344 0.096 0.524 0.627 0.634 0.364
Table 5.7 Comparison of MPA and NLTHA Inter-Storey Drift (% of floor height) for 8-Storey EBF
Floor Modal Response Modal Combination
NLTHA Mode 1 Mode 2 Mode 3 1 Mode 2 Modes 3 Modes
1 0.421 -0.265 0.158 0.421 0.497 0.522 0.708
2 0.391 -0.169 0.046 0.391 0.426 0.428 0.505
3 0.466 -0.090 -0.082 0.466 0.475 0.482 0.536
4 0.552 -0.063 -0.123 0.552 0.555 0.569 0.589
5 0.499 0.234 -0.127 0.499 0.551 0.565 0.610
6 0.480 0.391 -0.027 0.480 0.620 0.620 0.721
7 0.410 0.446 0.146 0.410 0.606 0.623 0.615
8 0.326 0.408 0.273 0.326 0.522 0.589 0.469
97
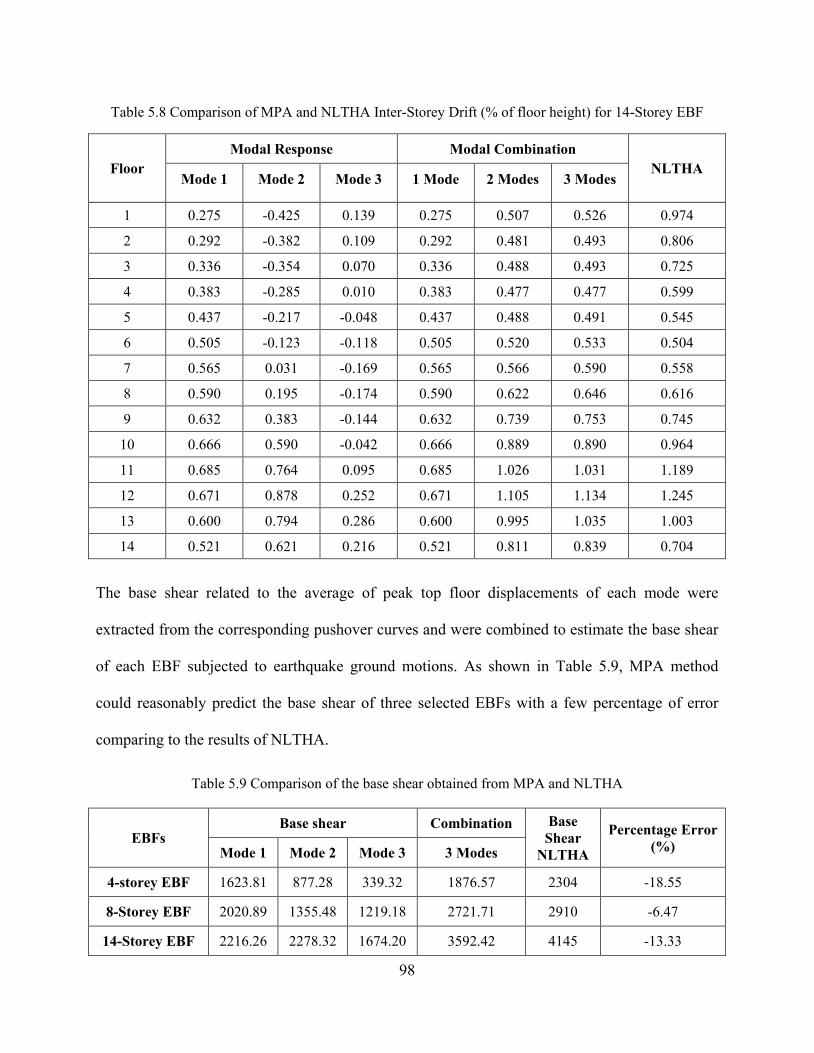
Table 5.8 Comparison of MPA and NLTHA Inter-Storey Drift (% of floor height) for 14-Storey EBF
Floor Modal Response Modal Combination
NLTHA Mode 1 Mode 2 Mode 3 1 Mode 2 Modes 3 Modes
1 0.275 -0.425 0.139 0.275 0.507 0.526 0.974
2 0.292 -0.382 0.109 0.292 0.481 0.493 0.806
3 0.336 -0.354 0.070 0.336 0.488 0.493 0.725
4 0.383 -0.285 0.010 0.383 0.477 0.477 0.599
5 0.437 -0.217 -0.048 0.437 0.488 0.491 0.545
6 0.505 -0.123 -0.118 0.505 0.520 0.533 0.504
7 0.565 0.031 -0.169 0.565 0.566 0.590 0.558
8 0.590 0.195 -0.174 0.590 0.622 0.646 0.616
9 0.632 0.383 -0.144 0.632 0.739 0.753 0.745
10 0.666 0.590 -0.042 0.666 0.889 0.890 0.964
11 0.685 0.764 0.095 0.685 1.026 1.031 1.189
12 0.671 0.878 0.252 0.671 1.105 1.134 1.245
13 0.600 0.794 0.286 0.600 0.995 1.035 1.003
14 0.521 0.621 0.216 0.521 0.811 0.839 0.704
The base shear related to the average of peak top floor displacements of each mode were
extracted from the corresponding pushover curves and were combined to estimate the base shear
of each EBF subjected to earthquake ground motions. As shown in Table 5.9, MPA method
could reasonably predict the base shear of three selected EBFs with a few percentage of error
comparing to the results of NLTHA.
Table 5.9 Comparison of the base shear obtained from MPA and NLTHA
EBFs Base shear Combination Base
Shear NLTHA
Percentage Error (%) Mode 1 Mode 2 Mode 3 3 Modes
4-storey EBF 1623.81 877.28 339.32 1876.57 2304 -18.55
8-Storey EBF 2020.89 1355.48 1219.18 2721.71 2910 -6.47
14-Storey EBF 2216.26 2278.32 1674.20 3592.42 4145 -13.33
98
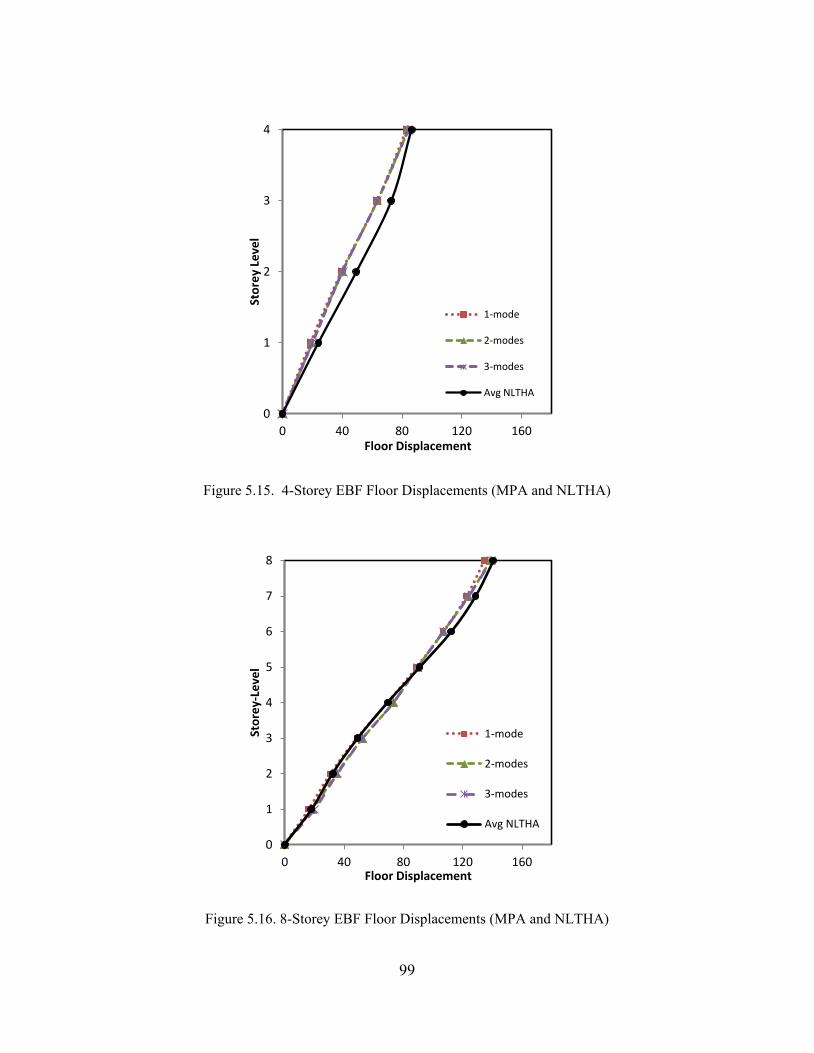
Figure 5.15. 4-Storey EBF Floor Displacements (MPA and NLTHA)
Figure 5.16. 8-Storey EBF Floor Displacements (MPA and NLTHA)
0
1
2
3
4
0 40 80 120 160
Stor
ey L
evel
Floor Displacement
1-mode
2-modes
3-modes
Avg NLTHA
0
1
2
3
4
5
6
7
8
0 40 80 120 160
Stor
ey-L
evel
Floor Displacement
1-mode
2-modes
3-modes
Avg NLTHA
99
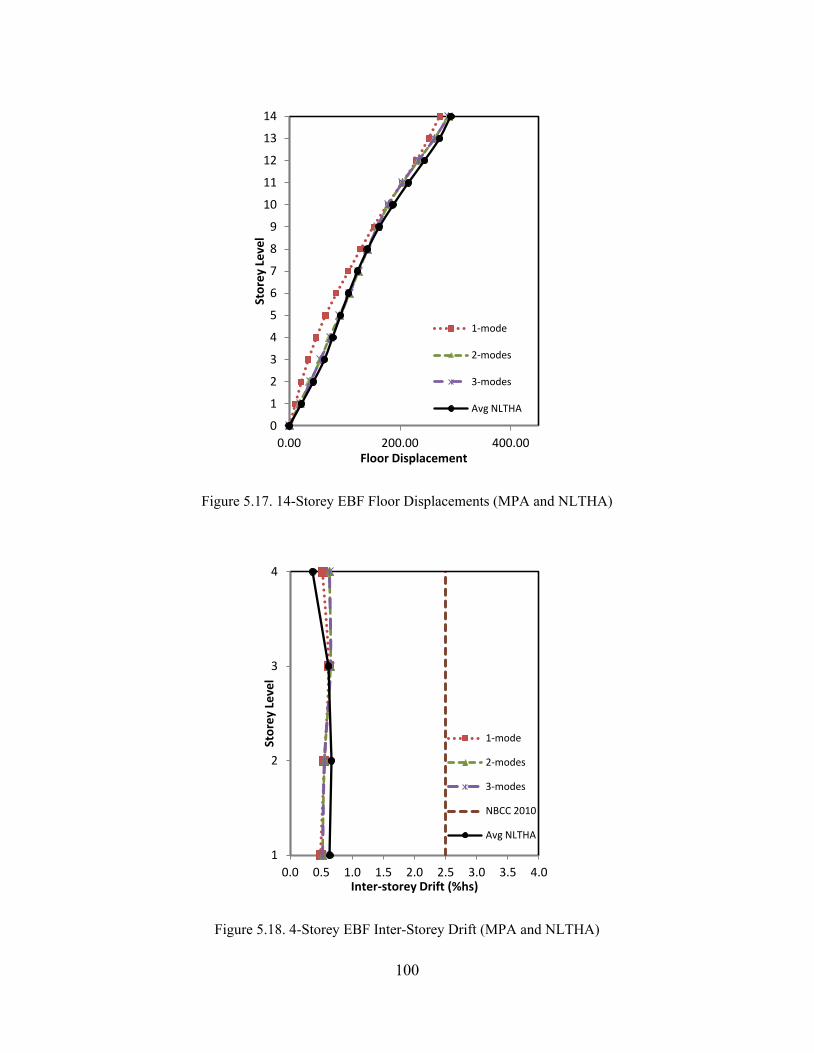
Figure 5.17. 14-Storey EBF Floor Displacements (MPA and NLTHA)
Figure 5.18. 4-Storey EBF Inter-Storey Drift (MPA and NLTHA)
0
1
2
3
4
5
6
7
8
9
10
11
12
13
14
0.00 200.00 400.00
Stor
ey L
evel
Floor Displacement
1-mode
2-modes
3-modes
Avg NLTHA
1
2
3
4
0.0 0.5 1.0 1.5 2.0 2.5 3.0 3.5 4.0
Stor
ey L
evel
Inter-storey Drift (%hs)
1-mode
2-modes
3-modes
NBCC 2010
Avg NLTHA
100
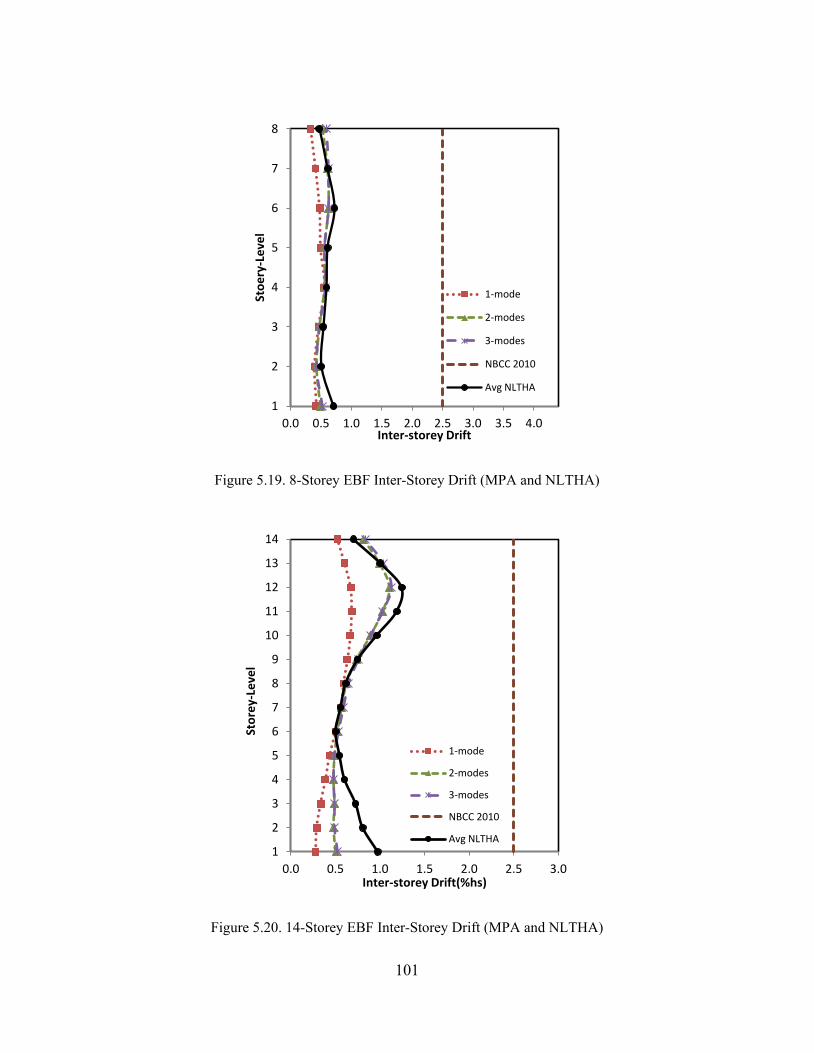
Figure 5.19. 8-Storey EBF Inter-Storey Drift (MPA and NLTHA)
Figure 5.20. 14-Storey EBF Inter-Storey Drift (MPA and NLTHA)
1
2
3
4
5
6
7
8
0.0 0.5 1.0 1.5 2.0 2.5 3.0 3.5 4.0
Stoe
ry-L
evel
Inter-storey Drift
1-mode
2-modes
3-modes
NBCC 2010
Avg NLTHA
1
2
3
4
5
6
7
8
9
10
11
12
13
14
0.0 0.5 1.0 1.5 2.0 2.5 3.0
Stor
ey-L
evel
Inter-storey Drift(%hs)
1-mode
2-modes
3-modes
NBCC 2010
Avg NLTHA
101
5.5. Summary
This chapter evaluated the accuracy of modal pushover analysis in predicting seismic demands
for eccentrically braced frames. The results of modal pushover analysis were compared with the
results of non-linear time history analysis for 4-, 8- and 14-storey EBFs for four selected
earthquake records. The major findings of this study are summarized as follows:
For 4-storey EBF, which is representing low-rise EBFs, the roof displacement was well predicted
by considering the first mode. Adding the higher mode effects did not improve the displacement
and inter-storey drift responses considerably.
For 8-storey EBF, which is considered as a medium-rise EBF, the first mode was able to predict
the displacements of lower floors accurately; however, adding the contribution of the 2nd mode
improved the displacements of upper floors. The contribution of the 2nd mode in the inter-storey
drift was found more significant. Thus, for this EBF, including the effect of second mode was
found helpful in improving MPA responses. The effect of the 3rd mode was not considerable.
For 14-storey EBF, which represents a high-rise EBF, considering just the first mode could not
lead to very accurate displacement and inter-storey drift responses. Adding the 2nd mode had
more considerable influence on the improvement of both responses comparing to the 8-storey
EBF. The third mode could also improve the responses by a few percent but that improvement
was not found significant. For the three EBFs, the displacements of the roof were precisely
predicted by MPA.
102
The base shear related to the average of peak top floor displacements of each mode were
obtained from the associated pushover curve and were combined and compared with the non-
linear dynamic base shear. The results showed that MPA method could reasonably predict the
base shear of three selected EBFs. In conclusion, based on the study on 4-, 8- and 14-storey
EBFs, adding the higher mode effects in MPA method was found un-required for low-rise,
helpful for medium-rise and necessary for high-rise EBFs.
103
Chapter 6. Evaluation of Capacity Spectrum Method for Eccentrically Braced
Frames
6.1. Introduction
The Capacity Spectrum Method (CSM) is a nonlinear static analysis procedure which can be
used to estimate seismic demands of buildings. The capacity curve is described by roof
displacement and base shear. The demand curve is obtained from the selected design response
spectrum. The initial stiffness, yield strength and ductility demands of structures are calculated
from the superposition of the capacity curves and demand curves. To account for inelastic
behavior of the buildings, CSM uses inelastic response spectra or equivalent damped spectra.
Appropriateness of both response spectra have been evaluated for framed structures in previous
studies (Chopra and Goel 1999). Fajfar (1999) introduced a relatively simple and easy to use
CSM procedure with a constant ductility demand spectra developed by Vidic et al. (1994). This
capacity spectrum method is known as N2 method (P. Fajfar 1999) and has been implemented in
Eurocode 8. This chapter evaluates the capacity spectrum method proposed by Fajfar (1999) for
EBFs. Critical seismic response parameters roof displacement, ductility demand of 4-, 8- and 14-
storey EBFs are estimated by CSM. Design acceleration response spectrum of Vancouver has
been transformed into the constant ductility demand spectra. The pushover (base shear versus
roof displacement) curves of the EBFs are converted into the capacity spectrum of the equivalent
single-degree-of-freedom (equivalent SDOF) systems. Finally, the applicability of CSM in
estimating seismic demands of low-rise, medium-rise and high-rise EBF is investigated by
comparing the results from CSM with the results from more accurate non-linear seismic analysis.
104
6.2. Capacity Spectrum Method by Fajfar (1999)
The steps of capacity spectrum method proposed by Fajfar (1999) are as follows:
Development of Seismic Demand Curve:
Seismic demand is usually defined as the elastic (pseudo)-acceleration spectrum where spectral
accelerations ( aeS ) are given as a function of the natural period of the structure T. Site specific
design spectrum can be used to develop of a seismic demand curve. The first step for developing
a seismic demand curve is to convert a traditional response spectrum in acceleration-
displacement format.
Step 1. Seismic Demand in Acceleration Displacement Response Spectrum format (ADRS):
Acceleration response spectrum can be converted in to acceleration-displacement response
spectrum (ADRS) by utilizing following relation between Pseudo-acceleration and displacement
for the Single-Degree-of-Freedom (SDOF) system,
2
de ae2TS S4
=π
6.1
where deS and aeS are the spectral displacement and pseudo acceleration of elastic response
spectrum respectively corresponding to the period T and a fixed viscous damping ratio.
Inelastic ADRS can be obtained indirectly from elastic ADRS. The acceleration spectra aS and
displacement spectra dS for an inelastic SDOF system can be obtained by using strength
reduction factor Rµ proposed by Vidic et al. (1994). As given in equation 6.2, force reduction
factor is the ratio of elastic strength demand to inelastic strength demand of an SDOF system for
105
a specified ductility ratio. Reduction factor ( Rµ ) mainly depends on the ductility and on the
period of the system.
ae
aSSRµ
= 6.2
From Equation 5.2and 6.2
d a2
TS S4
= µπ
6.3
where µ is the ductility factor defined as the ratio between the maximum displacement and the
yield displacement.
Several studies (Miranda and Bertero 1994, Vidic et al. 1994) have been done to determine force
reduction factor. In this research, the formulae proposed by Vidic et al. (1994) in slightly
modified form will be used.
( ) o
o
TR 1 1 when T TTµ = µ − + ≤ 6.4
oR when T Tµ = µ ≥ 6.5
0.3o c cT 0.65 T T= µ ≤ 6.6
where cT is the characteristics period which refers the transition period where constant
acceleration region intersect the constant velocity region and this is the period when largest
forces are applied to the structure; oT is the transition period which depends on structural
ductility and it should not be greater than cT .
106
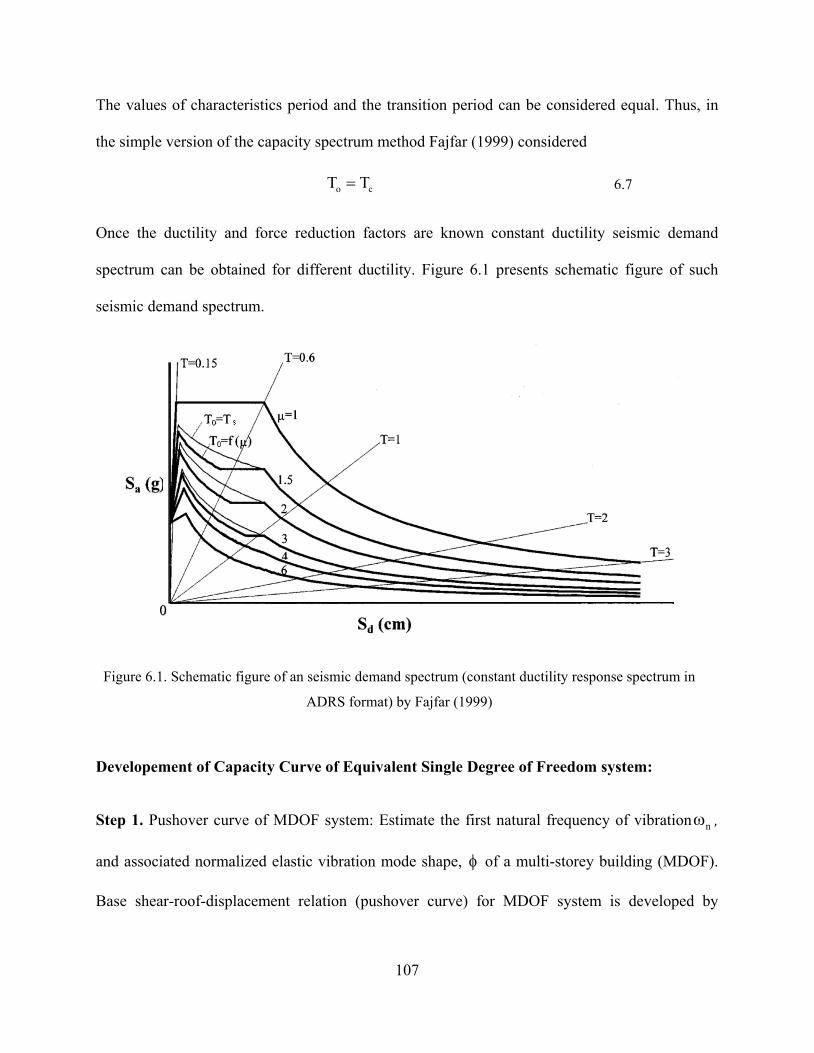
The values of characteristics period and the transition period can be considered equal. Thus, in
the simple version of the capacity spectrum method Fajfar (1999) considered
o cT T= 6.7
Once the ductility and force reduction factors are known constant ductility seismic demand
spectrum can be obtained for different ductility. Figure 6.1 presents schematic figure of such
seismic demand spectrum.
Figure 6.1. Schematic figure of an seismic demand spectrum (constant ductility response spectrum in
ADRS format) by Fajfar (1999)
Developement of Capacity Curve of Equivalent Single Degree of Freedom system:
Step 1. Pushover curve of MDOF system: Estimate the first natural frequency of vibration nω ,
and associated normalized elastic vibration mode shape, φ of a multi-storey building (MDOF).
Base shear-roof-displacement relation (pushover curve) for MDOF system is developed by
107
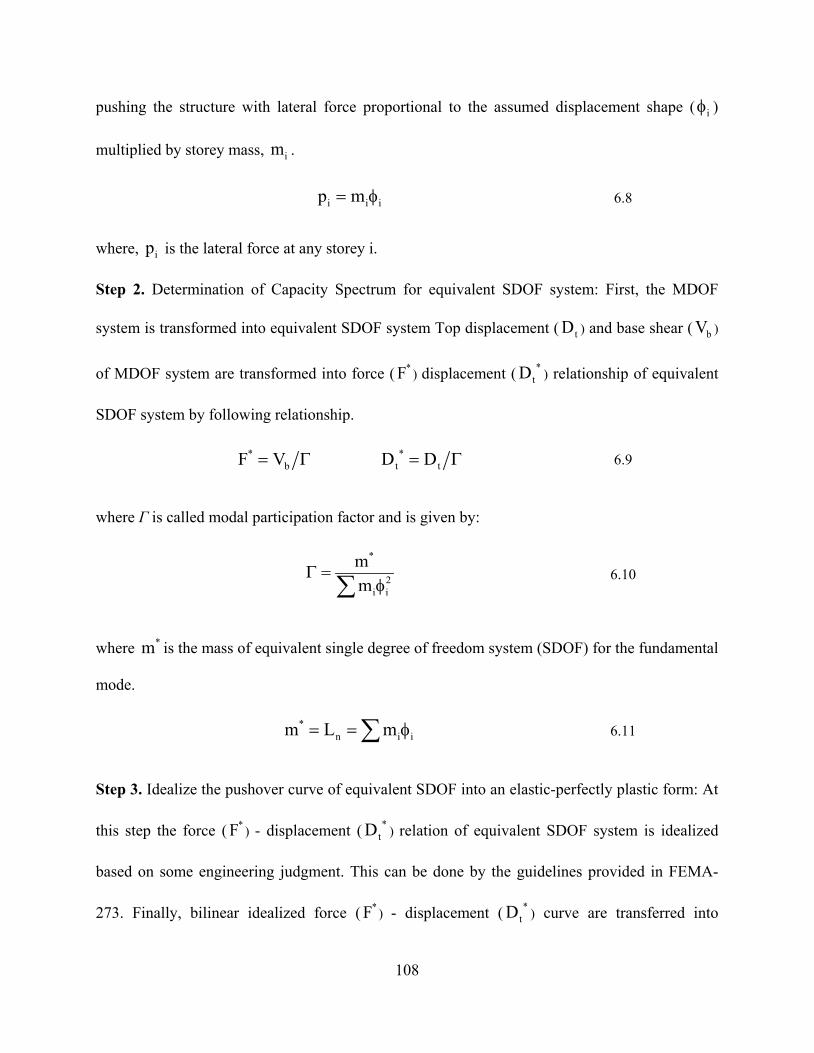
pushing the structure with lateral force proportional to the assumed displacement shape ( iφ )
multiplied by storey mass, im .
i i ip m= φ 6.8
where, ip is the lateral force at any storey i.
Step 2. Determination of Capacity Spectrum for equivalent SDOF system: First, the MDOF
system is transformed into equivalent SDOF system Top displacement ( tD ) and base shear ( bV )
of MDOF system are transformed into force ( *F ) displacement ( *tD ) relationship of equivalent
SDOF system by following relationship.
* *b t tF V D D= Γ = Γ 6.9
where Γ is called modal participation factor and is given by:
*
2i i
mm
Γ =φ∑
6.10
where *m is the mass of equivalent single degree of freedom system (SDOF) for the fundamental
mode.
*n i im L m= = φ∑ 6.11
Step 3. Idealize the pushover curve of equivalent SDOF into an elastic-perfectly plastic form: At
this step the force ( *F ) - displacement ( *tD ) relation of equivalent SDOF system is idealized
based on some engineering judgment. This can be done by the guidelines provided in FEMA-
273. Finally, bilinear idealized force ( *F ) - displacement ( *tD ) curve are transferred into
108
capacity curve by representing spectral acceleration to spectral displacement curve of equivalent
SDOF system. Spectral acceleration at the yielding point is *y
ay *
FS
m= . Elastic period of the
idealized bilinear system *F can be determined by:
* *y*
*y
m DT 2
F= π 6.12
where *yD and *
yF are the yield displacement and yield strength of the equivalent SDOF system.
Schematic figure of the development of capacity curve from pushover curve of MDOF to force-
displacement curve for equivalent SDOF system is presented in Figure 6.2. In this figure, the
bilinear force-displacement curve is the capacity curve for equivalent SDOF system.
Figure 6.2. Development of the capacity spectrum of an equivalent SDOF system by Fajfar (1999)
109
Determination of Seismic Demand and Performance of Equivalent SDOF system:
Once the demand spectra and capacity spectra for equivalent SDOF system are established, they
are superimposed in the same plot. Intersection point of the redial line of the capacity curve
corresponding to the elastic stiffness of the equivalent SDOF system and the elastic demand
spectrum, gives the strength demand ( aeS ) if the structure remains elastic. The yield spectral
acceleration ayS for the equivalent SDOF system refers to the acceleration where the inelastic
behavior begins. Ratio of the elastic acceleration demand and yield spectral acceleration is the
reduction factor Rµ . After that, ductility demand can be calculated from equations 6.4 and 6.5.
Equations 6.4 and 6.5 suggest that, in the medium- and long-period ranges, the equal
displacement rule applies. This means that the displacement of the inelastic system is equal to the
displacement of the corresponding elastic system with the same period. Finally, the
displacement demand for the structure is determined from the intersection point of the capacity
curve and the demand curve corresponding to the ductility demand.
6.3. Application of Capacity Spectrum Method (CSM) for EBFs
The three selected eccentrically braced frames (4-, 8- and 14-storey EBFs) designed according to
capacity design approach of CAN/CSA S16-09 and presented in Chapter 3 are considered in this
chapter to evaluate the applicability of capacity spectrum method for EBFs.
Capacity curves for EBFs:
Frequency analysis was performed for the selected EBFs to estimate fundamental periods and
associated mode shapes of the EBFs. With the load pattern associated with the fundamental
mode shapes, as given by equation 6.8, the EBFs were pushed and pushover curves (Base shear -
110
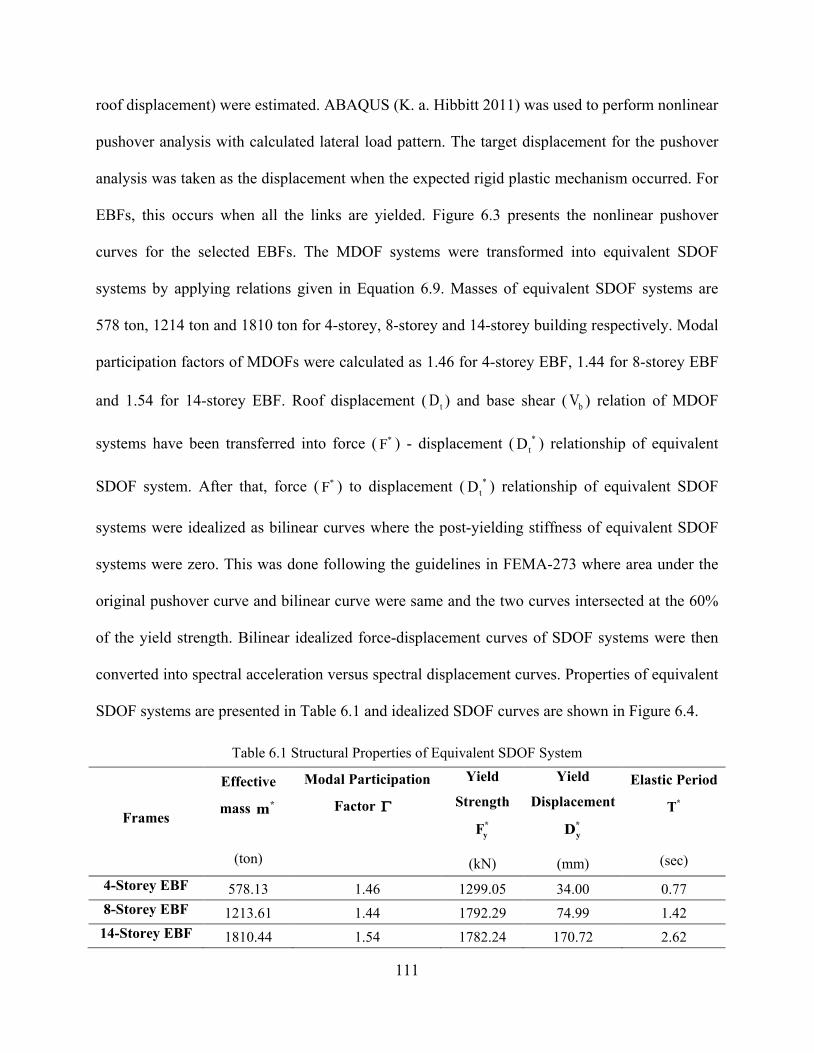
roof displacement) were estimated. ABAQUS (K. a. Hibbitt 2011) was used to perform nonlinear
pushover analysis with calculated lateral load pattern. The target displacement for the pushover
analysis was taken as the displacement when the expected rigid plastic mechanism occurred. For
EBFs, this occurs when all the links are yielded. Figure 6.3 presents the nonlinear pushover
curves for the selected EBFs. The MDOF systems were transformed into equivalent SDOF
systems by applying relations given in Equation 6.9. Masses of equivalent SDOF systems are
578 ton, 1214 ton and 1810 ton for 4-storey, 8-storey and 14-storey building respectively. Modal
participation factors of MDOFs were calculated as 1.46 for 4-storey EBF, 1.44 for 8-storey EBF
and 1.54 for 14-storey EBF. Roof displacement ( tD ) and base shear ( bV ) relation of MDOF
systems have been transferred into force ( *F ) - displacement ( *tD ) relationship of equivalent
SDOF system. After that, force ( *F ) to displacement ( *tD ) relationship of equivalent SDOF
systems were idealized as bilinear curves where the post-yielding stiffness of equivalent SDOF
systems were zero. This was done following the guidelines in FEMA-273 where area under the
original pushover curve and bilinear curve were same and the two curves intersected at the 60%
of the yield strength. Bilinear idealized force-displacement curves of SDOF systems were then
converted into spectral acceleration versus spectral displacement curves. Properties of equivalent
SDOF systems are presented in Table 6.1 and idealized SDOF curves are shown in Figure 6.4.
Table 6.1 Structural Properties of Equivalent SDOF System
Frames
Effective
mass *m
(ton)
Modal Participation
Factor Γ
Yield
Strength*yF
(kN)
Yield
Displacement*yD
(mm)
Elastic Period *T
(sec)
4-Storey EBF 578.13 1.46 1299.05 34.00 0.77 8-Storey EBF 1213.61 1.44 1792.29 74.99 1.42
14-Storey EBF 1810.44 1.54 1782.24 170.72 2.62
111
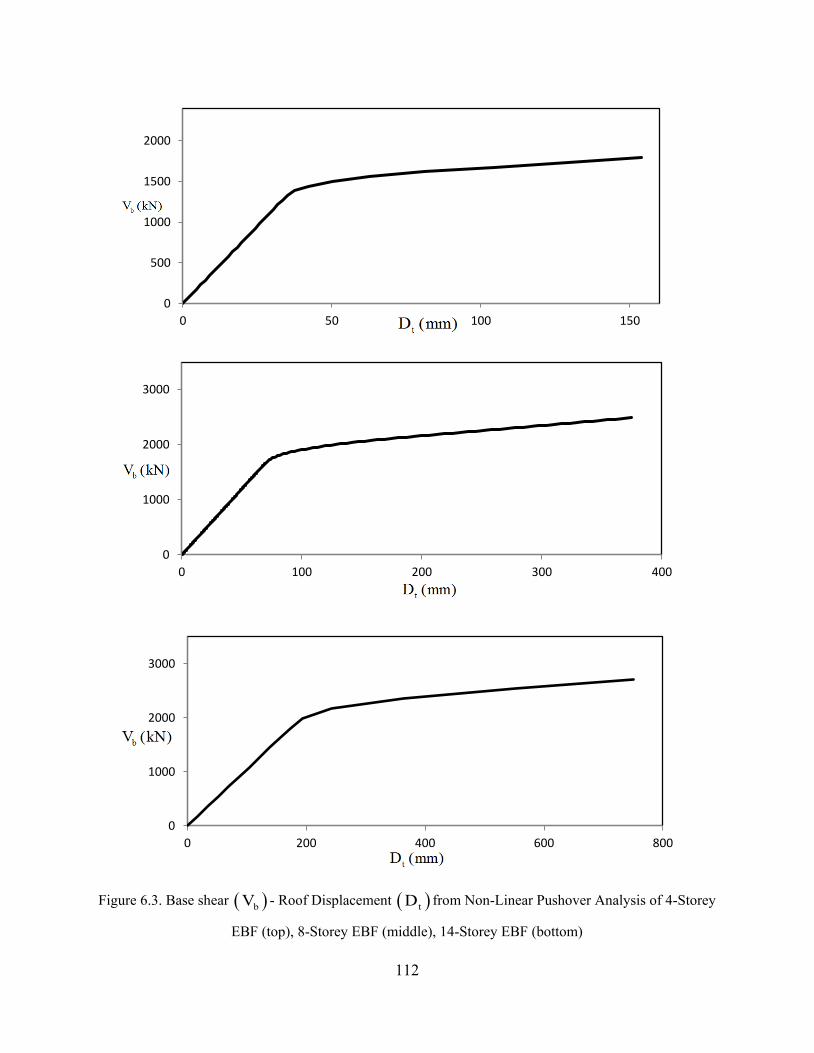
Figure 6.3. Base shear ( )bV - Roof Displacement ( )tD from Non-Linear Pushover Analysis of 4-Storey
EBF (top), 8-Storey EBF (middle), 14-Storey EBF (bottom)
0
500
1000
1500
2000
0 50 100 150
0
1000
2000
3000
0 100 200 300 400
0
1000
2000
3000
0 200 400 600 800
112
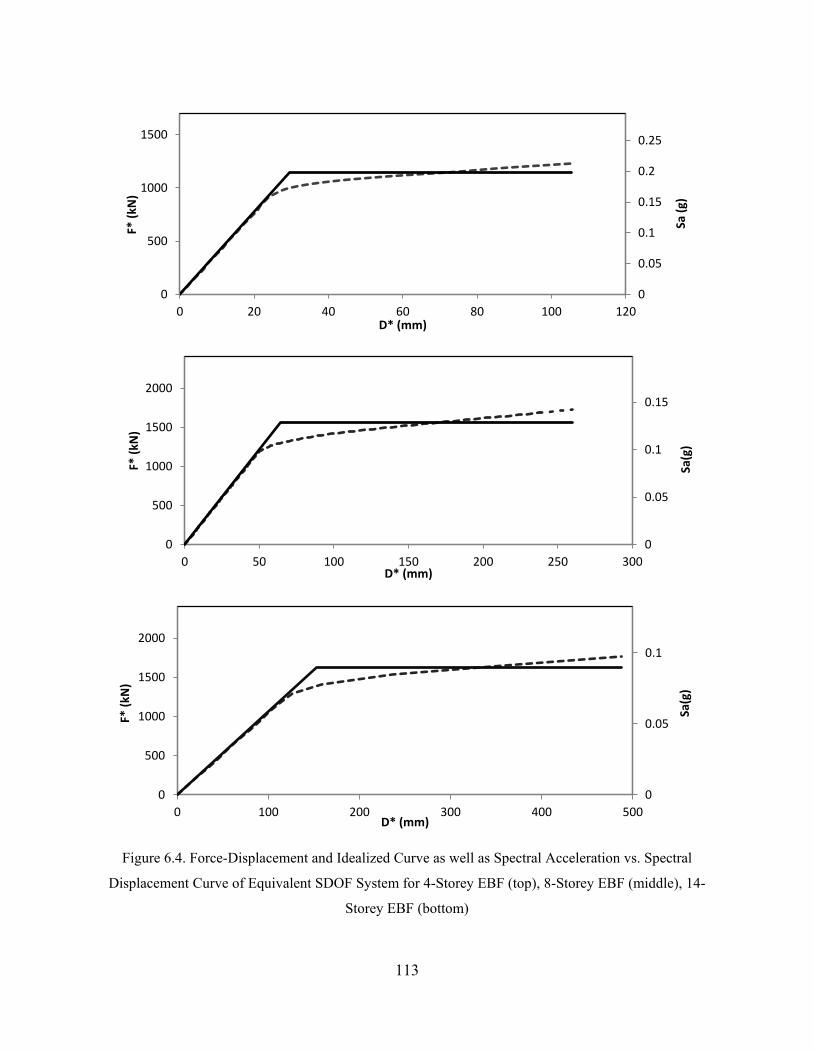
Figure 6.4. Force-Displacement and Idealized Curve as well as Spectral Acceleration vs. Spectral
Displacement Curve of Equivalent SDOF System for 4-Storey EBF (top), 8-Storey EBF (middle), 14-
Storey EBF (bottom)
0
0.05
0.1
0.15
0.2
0.25
0
500
1000
1500
0 20 40 60 80 100 120
Sa (g
)
F* (k
N)
D* (mm)
0
0.05
0.1
0.15
0
500
1000
1500
2000
0 50 100 150 200 250 300
Sa(g
)
F* (k
N)
D* (mm)
0
0.05
0.1
0
500
1000
1500
2000
0 100 200 300 400 500
Sa(g
)
F* (k
N)
D* (mm)
113
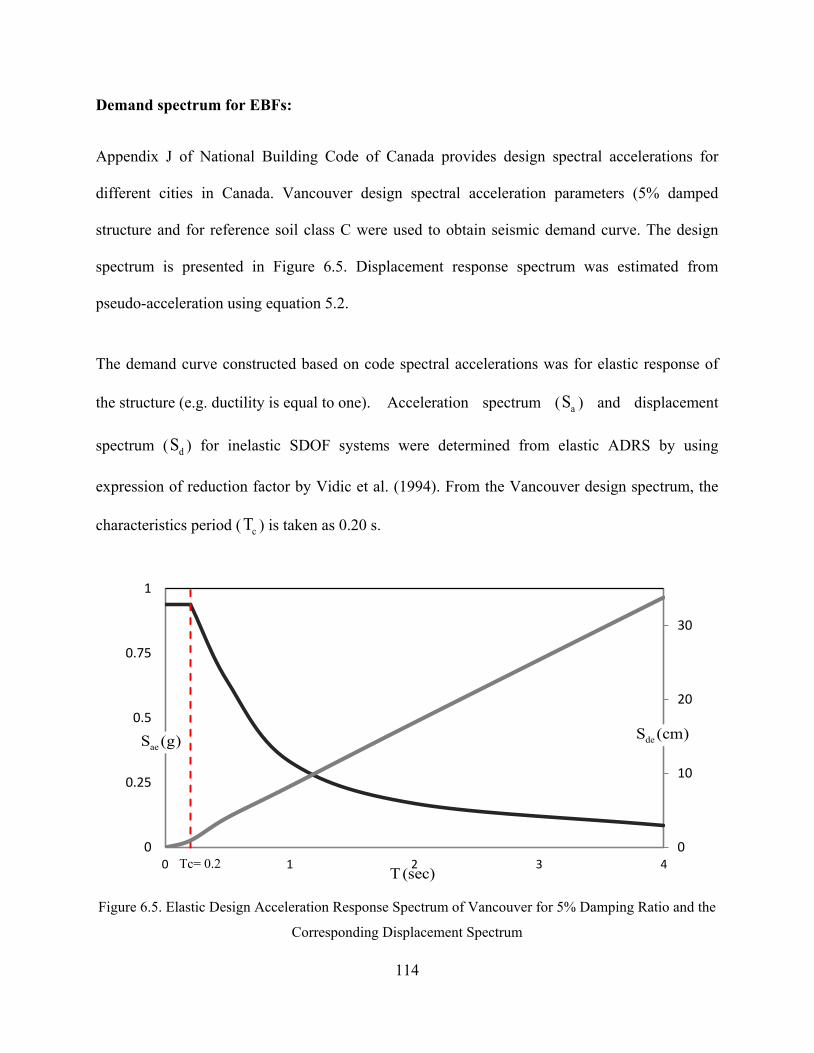
Demand spectrum for EBFs:
Appendix J of National Building Code of Canada provides design spectral accelerations for
different cities in Canada. Vancouver design spectral acceleration parameters (5% damped
structure and for reference soil class C were used to obtain seismic demand curve. The design
spectrum is presented in Figure 6.5. Displacement response spectrum was estimated from
pseudo-acceleration using equation 5.2.
The demand curve constructed based on code spectral accelerations was for elastic response of
the structure (e.g. ductility is equal to one). Acceleration spectrum ( aS ) and displacement
spectrum ( dS ) for inelastic SDOF systems were determined from elastic ADRS by using
expression of reduction factor by Vidic et al. (1994). From the Vancouver design spectrum, the
characteristics period ( cT ) is taken as 0.20 s.
Figure 6.5. Elastic Design Acceleration Response Spectrum of Vancouver for 5% Damping Ratio and the
Corresponding Displacement Spectrum
Tc= 0.2 0
10
20
30
0
0.25
0.5
0.75
1
0 1 2 3 4
deS (cm)aeS (g)
T(sec)
114
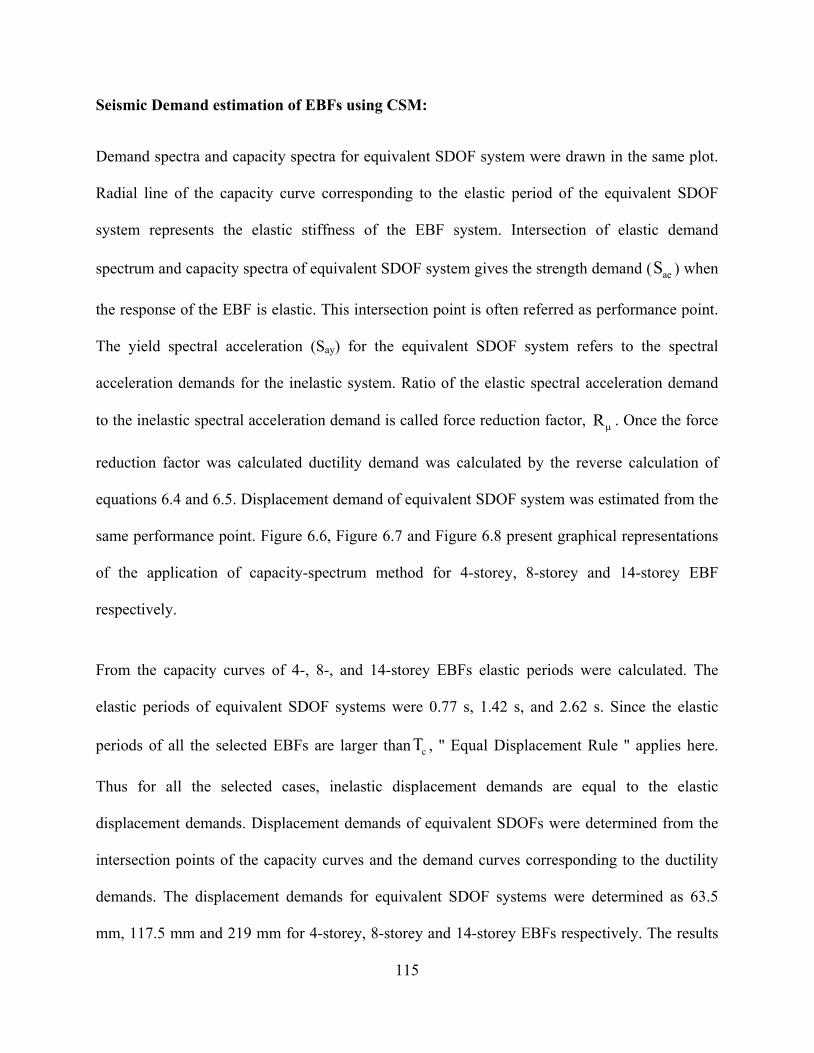
Seismic Demand estimation of EBFs using CSM:
Demand spectra and capacity spectra for equivalent SDOF system were drawn in the same plot.
Radial line of the capacity curve corresponding to the elastic period of the equivalent SDOF
system represents the elastic stiffness of the EBF system. Intersection of elastic demand
spectrum and capacity spectra of equivalent SDOF system gives the strength demand ( aeS ) when
the response of the EBF is elastic. This intersection point is often referred as performance point.
The yield spectral acceleration (Say) for the equivalent SDOF system refers to the spectral
acceleration demands for the inelastic system. Ratio of the elastic spectral acceleration demand
to the inelastic spectral acceleration demand is called force reduction factor, Rµ . Once the force
reduction factor was calculated ductility demand was calculated by the reverse calculation of
equations 6.4 and 6.5. Displacement demand of equivalent SDOF system was estimated from the
same performance point. Figure 6.6, Figure 6.7 and Figure 6.8 present graphical representations
of the application of capacity-spectrum method for 4-storey, 8-storey and 14-storey EBF
respectively.
From the capacity curves of 4-, 8-, and 14-storey EBFs elastic periods were calculated. The
elastic periods of equivalent SDOF systems were 0.77 s, 1.42 s, and 2.62 s. Since the elastic
periods of all the selected EBFs are larger than cT , '' Equal Displacement Rule '' applies here.
Thus for all the selected cases, inelastic displacement demands are equal to the elastic
displacement demands. Displacement demands of equivalent SDOFs were determined from the
intersection points of the capacity curves and the demand curves corresponding to the ductility
demands. The displacement demands for equivalent SDOF systems were determined as 63.5
mm, 117.5 mm and 219 mm for 4-storey, 8-storey and 14-storey EBFs respectively. The results
115
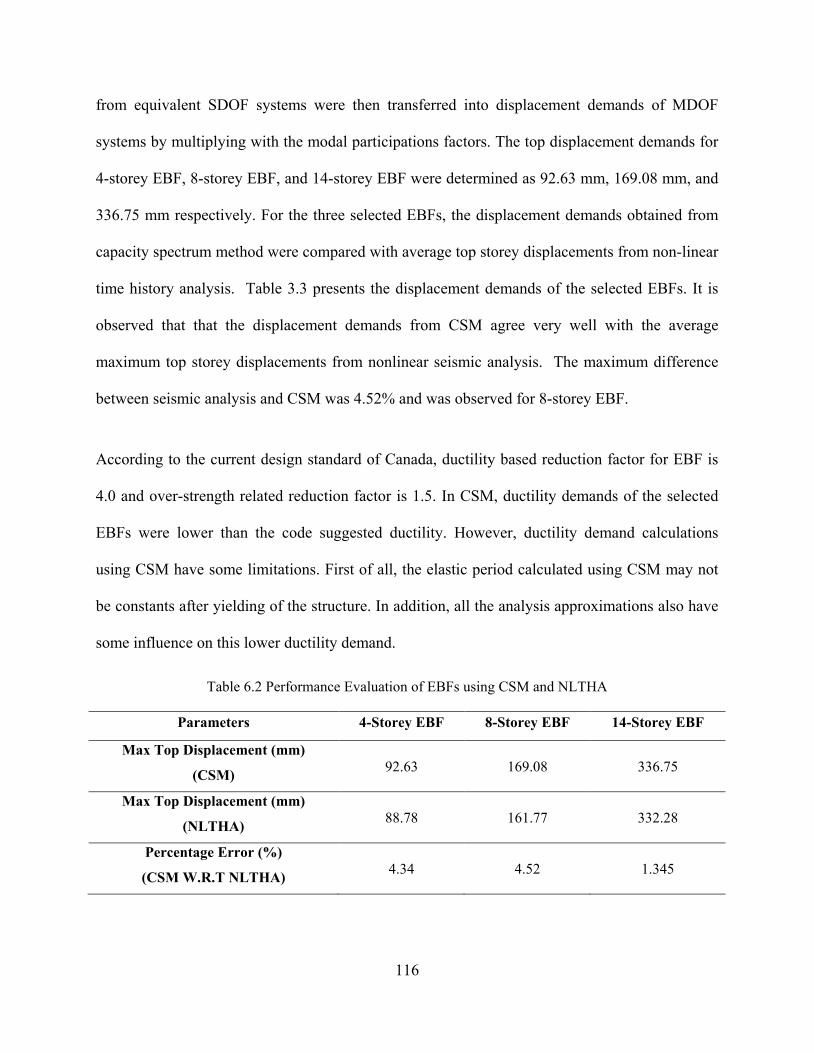
from equivalent SDOF systems were then transferred into displacement demands of MDOF
systems by multiplying with the modal participations factors. The top displacement demands for
4-storey EBF, 8-storey EBF, and 14-storey EBF were determined as 92.63 mm, 169.08 mm, and
336.75 mm respectively. For the three selected EBFs, the displacement demands obtained from
capacity spectrum method were compared with average top storey displacements from non-linear
time history analysis. Table 3.3 presents the displacement demands of the selected EBFs. It is
observed that that the displacement demands from CSM agree very well with the average
maximum top storey displacements from nonlinear seismic analysis. The maximum difference
between seismic analysis and CSM was 4.52% and was observed for 8-storey EBF.
According to the current design standard of Canada, ductility based reduction factor for EBF is
4.0 and over-strength related reduction factor is 1.5. In CSM, ductility demands of the selected
EBFs were lower than the code suggested ductility. However, ductility demand calculations
using CSM have some limitations. First of all, the elastic period calculated using CSM may not
be constants after yielding of the structure. In addition, all the analysis approximations also have
some influence on this lower ductility demand.
Table 6.2 Performance Evaluation of EBFs using CSM and NLTHA
Parameters 4-Storey EBF 8-Storey EBF 14-Storey EBF
Max Top Displacement (mm)
(CSM) 92.63 169.08 336.75
Max Top Displacement (mm)
(NLTHA) 88.78 161.77 332.28
Percentage Error (%)
(CSM W.R.T NLTHA) 4.34 4.52 1.345
116
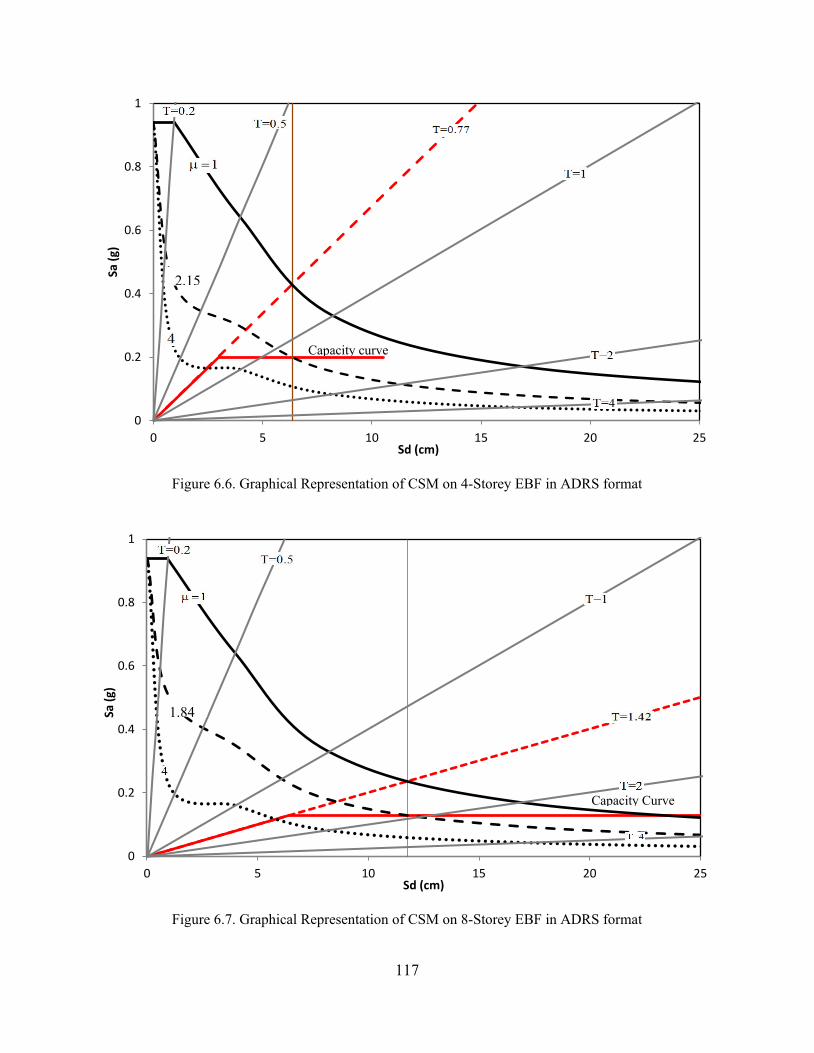
Figure 6.6. Graphical Representation of CSM on 4-Storey EBF in ADRS format
Figure 6.7. Graphical Representation of CSM on 8-Storey EBF in ADRS format
0
0.2
0.4
0.6
0.8
1
0 5 10 15 20 25
Sa (g
)
Sd (cm)
Capacity curve
2.15
0
0.2
0.4
0.6
0.8
1
0 5 10 15 20 25
Sa (g
)
Sd (cm)
Capacity Curve
1.84
117
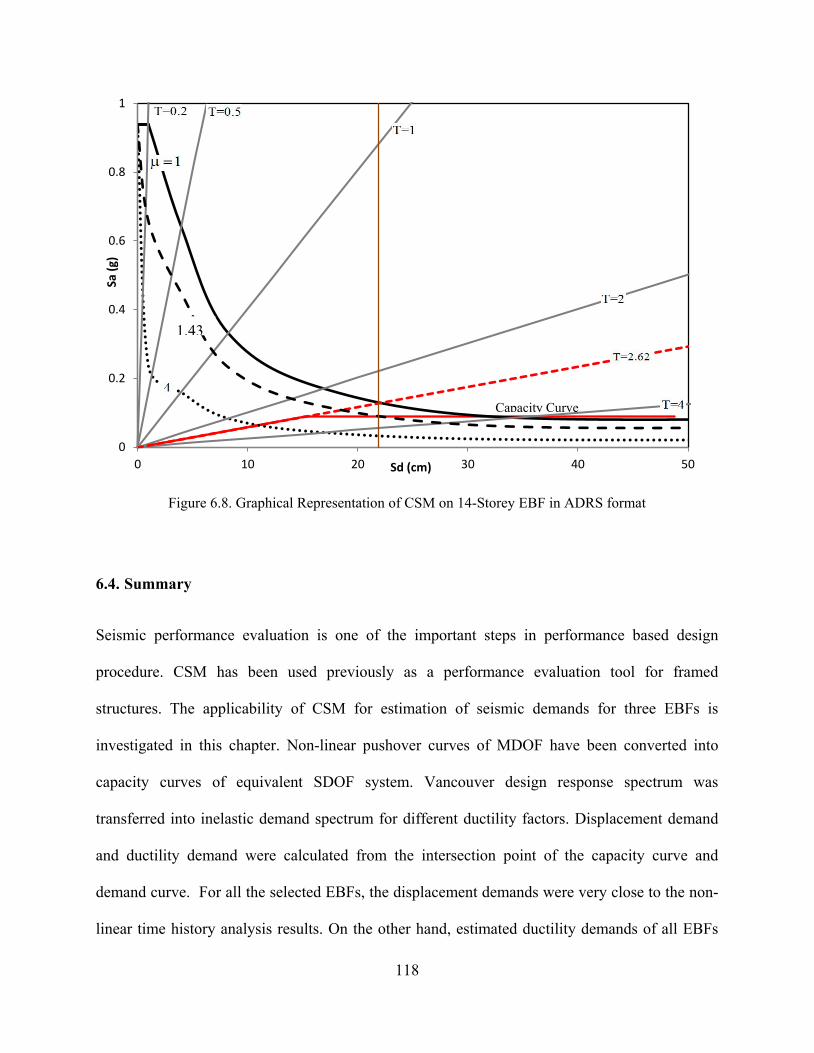
Figure 6.8. Graphical Representation of CSM on 14-Storey EBF in ADRS format
6.4. Summary
Seismic performance evaluation is one of the important steps in performance based design
procedure. CSM has been used previously as a performance evaluation tool for framed
structures. The applicability of CSM for estimation of seismic demands for three EBFs is
investigated in this chapter. Non-linear pushover curves of MDOF have been converted into
capacity curves of equivalent SDOF system. Vancouver design response spectrum was
transferred into inelastic demand spectrum for different ductility factors. Displacement demand
and ductility demand were calculated from the intersection point of the capacity curve and
demand curve. For all the selected EBFs, the displacement demands were very close to the non-
linear time history analysis results. On the other hand, estimated ductility demands of all EBFs
0
0.2
0.4
0.6
0.8
1
0 10 20 30 40 50
Sa (g
)
Sd (cm)
Capacity Curve
1.43
118
by CSM were lower than the designed ductility of EBF, which represents the satisfactory
performance of these systems.
Finally, capacity-spectrum method can be used for estimation of performance parameters of
EBFs. Capacity-spectrum method needs an assumed displacement shape and a lateral load
pattern for nonlinear pushover analysis. In this method, first elastic vibration mode shape was
used as an assumed mode shape. Therefore, this method cannot include higher mode contribution
in the overall building performance. Therefore, this method is suitable for structure which is
mainly dominated by its fundamental mode of vibration. For different hazard level, CSM can be
performed with different response spectrum for corresponding hazard level. So the expected
performance level for different level of ground motion can be analyzed by CSM as well.
119
Chapter 7. Summary and Conclusions
7.1. Summary
In this research, seismic performance of eccentrically braced frames designed according to
NBCC 2010 and CSA S16-09 provisions was evaluated. A detailed finite element model with
material and geometrical non-linearities was developed. The finite element model was validated
using the results from one quasi-static experimental program. The same finite element modeling
technique was then used to model a set of three eccentrically chevron braced frames with 4-, 8-
and 14-storey designed according to current Canadian provisions. To determine the seismic
responses of EBFs, non-linear time history analyses were conducted. A set of eight ground
motions including real and simulated records compatible with design spectrum of Vancouver
was selected for seismic analysis. The critical response parameters including inelastic link
rotations and maximum shear forces in the links were investigated. Also, storey displacement
and inter-storey drift results were provided. It is well accepted that the non-linear time history
analysis provides very accurate results; however, seismic performance evaluation using NLTHA
is very complex and time consuming and most importantly require expertise. Therefore, simple
methods with enough accuracy in estimating seismic demands of EBFs are required by
practicing engineers. Two such simple methods are modal pushover analysis and capacity
spectrum method. MPA and CSM procedures are non-linear static methods that have been used
previously for moment resisting frames. In this research, these two methods were evaluated for
estimating seismic performance parameters of EBFs. The modal pushover method was selected
because it incorporates the contributions of higher modes into the responses. This method was
applied on the three EBFs to estimate the displacements and inter-storey drifts demands of all
120
floors as well as the base shear demands. The capacity spectrum method which graphically
compares the capacity of the structure with seismic demands was employed as another non-linear
static method. Critical seismic response parameters, such as top storey displacements and inter-
storey drifts, from MPA and CSM were compared with the results obtained from non-linear
seismic analysis.
7.2. Conclusions
The following observations were made from non-linear time history analysis of EBFs:
• The finite element model developed in this study was able to provide reasonably accurate
predictions of the behavior of EBF. Excellent agreement was observed between results
from FE analysis and results from experiment. The finite element model was capable to
capture all essential features of the test specimens, such as initial stiffness, ultimate
strength.
• Based on the results of non-linear time history analyses, it was observed that all EBFs
behaved in compliance with the capacity design approach provided by Canadian seismic
provisions. For all ground motions, all the links were yielded at all floors. Though some
partial yielding of adjacent beams was observed for some ground motions, all other
members remained elastic.
• During the design process, it was attempted to keep the ratio of the link shear resistance
to the link shear forces uniform along the height of EBFs in order to avoid the
concentration of link rotations at some specific floors as it was recommended in the
121
literature. However, the analysis results showed that the link rotations at all floor were
not uniform especially in medium and high-rise EBFs.
• The average link rotation of all EBFs remained below the design limit of 0.08 rad, except
for the two upper floors in 14-storey EBFs where the link rotation slightly exceeded the
limit. The larger link rotation demands might be due to participation of higher modes.
The modal pushover analysis also showed significant contribution of the second mode
into the responses of 14-storey EBF. Thus, for design of taller EBF buildings higher
mode contributions are important and shall be considered at the design phase.
• The link overstrength factors in all EBFs also follow the same trend as the link rotations
with average values of 1.5, which exceeds the code limit of 1.3, but it is below of the
available experimental results. The amount of overstrength developed by the link is
because of strain hardening of the link and also due to development of shear resistance in
the link flanges. Therefore, based on the results of this study, the current link
overstrength factor of 1.3 suggested by CSA S16-09 underestimates the actual link
overstrength factor. However, more analysis should be done on EBFs of different
geometry before suggesting modifications of link overstrength factor.
The accuracy of MPA and CSM methods was also evaluated on the three EBFs. The following
conclusions were made:
• In general, modal pushover analysis results showed sufficient accuracy in predicting
seismic demands of all eccentric braced frames. For low-rise EBF, the top storey
122
displacement was accurately predicted by the first mode. Considering higher mode
effects didn't improve the accuracy of the results considerably. For medium-rise EBF, the
accuracy of the displacement and inter-storey drift results were improved by including
higher modes contribution. For high-rise EBF, the most significant contributions of
higher modes on both displacements and inter-storey drifts were observed leading into
sufficiently precise results. For all EBFs, the results of storey displacements were more
precise than inter-storey drifts. Also, the modal pushover method was able to predict the
base shear demand with reasonable accuracy.
• The capacity spectrum method showed excellent accuracy in predicting the displacement
demands and ductility demands of all EBFs. Based on the results of this study, CSM can
be accepted as a simplified method for preliminary design of low to medium-rise EBFs.
Although both CSM and MPA method was found precise in predicting top floor
displacements of all EBFs, MPA is superior in providing more realistic measure of other
floors displacements and inter-storey drifts.
123
7.3. Future Work
The non-linear time history analysis results provided in this thesis is limited to three eccentrically
chevron braced frames. More research works are required on EBFs of different types, geometry
and height to verify achievement of the desired frame behavior of EBFs designed according to
current Canadian provisions. Also, based on the results of this study, the link overstrength factor
suggested by CSA S16-09 is lower than the actual link overstrength. More studies are required
on EBFs of different type and height before making more general conclusions and suggestions in
this regard.
The applicability of modal pushover analysis method in this study was evaluated for
eccentrically chevron braced frames with symmetrical plan. More studies are required for
unsymmetrical plan with torsional effects.
The post-yielding behavior of the structure is neglected in capacity spectrum method. It is well-
known that after yielding, stiffness of any lateral load resisting system changes. Thus, future
research is required to incorporate post-yielding hardening in the capacity spectrum method.
124
References
ANSI/AISC. 2005. Seismic Provisions for Structural Steel Buildings. American Institute
of Steel Construction Inc, Chicago, Illinois.
Arce, G. 2002. Impact Of Higher Strength Steels On Local Buckling And Overstrength Of Links
In Eccentrically Braced Frames. Doctoral Dissertation, University Of Texas At Austin.
Atkinson, Gail, Karen Assatourians, and Bernie Dunn. 2009. Engineering Seismology Toolbox.
http://www.seismotoolbox.ca/GMDatabases.html.
Balendra, T., Lam, K. Y., Liaw, C. Y., and Lee, S. L. 1987. Behavior of Eccentrically Braced
Frame by Pseudo-Dynamic Test. Journal of Structural Engineering 113 (4): 673-688.
Chintanapakdee, C., and Chopra, A.K. 2003. Evaluation Of Modal Pushover Analysis Using
Generic Frames. Earthquake Engineering and Structural Dynamics 32.
Chopra, A.K., and Goel, R.K. 2001. A Modal Pushover Analysis Procedure to Estimate Seismic
Demans for Buildings: Theory and Preliminary Evaluation. Pacific Earthquake Engineering
Research Center, California.
Chopra, A.K., and Goel, R.K. 1999. Capacity-Demand-Diagram Methods for Estimating Seismic
Deformation of Inelastic Structures: SDOF Systems. Urban Earthquake Disaster Mitigation,
University of California, Pacific Earthquake Engineering Research Center, California.
CSA. 2009. Limit states design of steel structures. Canadian Standards Association. Toronto,
Ontario.
125
David, S.O. 2009. Seismic Analysis Design Of Taller Eccentrically Braced Frames. École
Polytechnique de Montréal.
Della Corte, G., D'Aniello, M., and Landolfo, R. 2013. Analytical And Numerical Study Of
Plastic Overstrength Of Shear Links. Journal of Constructional Steel Research 82: 19-32.
Dubina, D. 2014. Full-Scale Experimental Validation Of Dual Eccentrically Braced Frame With
Removable Links (Duarem). Research Report, Politehnica University of Timisoara.
Engelhardt, M. D, and Popov, E. P. 1989. Behavior Of Long Links In Eccentrically Braced
Frames. University of California, Berkeley 89 (1).
Fajfar, P., and Fischinger, M. 1988. N2—A Method For Nonlinear Seismic Analysis Of Regular
Structures. In Proceedings of the Ninth World Conference in Earthquake Engineering: 111-116.
Fajfar, P. 1999. Capacity Spectrum Method Based on Inelastic Demand Spectra. Earthquake
Engineering and Structural Dynamics 28 (9): 979-993.
FEMA. 1997. NEHRP Guidlines for the Seismic Rehabilitation of Buildings, FEMA-273.
Applied Technology Council for the Building Seismic Safety Council, the Federal
Emergency Management Agency, Washinton,D.C., USA.
FEMA. 2000. Prestandard and Commentary for the Seismic Rehabilitation of Buildings,
FEMA-356. American Society of Civil Engineers. Federal Emergecy Management Agency,
Washington, D.C., USA.
Ghobarah, A., and Ramadan, T. 1990. Effect Of Axial Forces On The Performance Of Links In
Eccentrically Braced Frames. Engineering Structures 12 (2): 106-113.
126
Ghobarah, A., and Ramadan, T. 1991. Seismic Analysis Of Links Of Various Lengths In
Eccentrically Braced Frames. Canadian Jounal of Civil Engineering.
Goel, R. K., and Chopra, A. K. 2004. Evaluation Of Modal And FEMA Pushover Analysis: SAC
Buildings. Earthquake Spectra, 20 (1): 225-254.
Hibbitt, Karlsson, and Sorensen. 2011. ABAQUS/Standard User’s Manual. Pawtucket: HKS Inc.
Hjelmstad, K. D., and Popov, E. P. 1983. Cyclic Behavior And Design Of Link Beams. Journal
of Structural Engineering 109 (10): 2387-2403.
Jacob, C. C. 2010. Creating an Eccentrically Braced Frame Model for Application in Seismic
Performance Assessments. Department of Civil Engineering, Tufts University.
Karr, A. 2002. RUAUMOKO Users Manual. University of Canterbury. New Zealand.
Kasai, K, and Popov, E. 1986. General Behavior of WF Steel Shear link Beams. Journal of
Structural Engineering 112 (2): 362-382.
Koboevic. S. 2000. An Approach To Seismic Design Of Eccentrically Braced Frames. McGill
University. Montreal, Canada
Koboevic, S., Rozon, J. and Tremblay, R. 2012. Seismic Performance Of Low-To-Moderate
Height Eccentrically Braced Steel Frames Designed For North American Seismic Conditions.
Journal of Structural Engineering, ASCE.
Korzekwa, A, and Tremblay, R. 2009, Numerical Simulation Of The Cyclic Inelastic Behavior
Of Buckling Restrained Braces. Proceedings Of The Conference On Behavior Of Steel
Structures In Seismic Areas, STESSA. Philadephia, Pennsylvania, USA, 635-658. 127
Krawinkler, H., and Seneviratna, G. D. P. K. 1998. Pros And Cons Of A Pushover Analysis Of
Seismic Performance Evaluation. Engineering Structures 20 (4): 452-464.
Lamontagne, M., Halchuk, S., Cassidy, J. F., and Rogers, G. C. 2008. Significant Canadian
Earthquakes Of The Period 1600–2006. Seismological Research Letters 79 (2): 211-223.
Mago, N.M. 2013. Finite Element Analysis of Eccentrically Braced Frames with Replaceable
Link. HERA, Report R4-145, Heavy Engineering Research Association, Manukau.
Malley, J. O., and Popov. E. P. 1984. Shear Links In Eccentrically Braced Frames. Journal Of
Structural Engineering 110 (9): 2275-2295.
Manheim, E.N. 1982. On The Design Of Eccentrically Braced Frames. Ph.D Thesis, Department
of Civil Engineering,University of California, Berkeley.
Mansour, Nabil. 2010. Developement Of The Design Of Eccentrically Braced Frames With
Replaceable Shear Links. Department Of Civil Engineering, University of Toronto.
Martini, K., Amin, N., Lee, P.L., and Bonowitz, D. 1990. The Potential Role Of Non-Linear
Analysis In The Seismic Design Of Building Structures. In Proceedings of Fourth US National
Conference on Earthquake Engineering, Palm Springs, Cal.
McDaniel, C. C. , Uang, C. M., and Seible, F. 2002. Cyclic Testing Of Suspension Tower Shear
Links Of The San Francisco-Oakland Bay Bridge. Department of Structural Engineering,
University of California, San Diego.
Miranda, E., and Bertero, V. V. 1994. Evaluation Of Strength Reduction Factors For Earthquake-
Resistant Design. Earthquake spectra 10(2): 357-379.
128
Mondkar, D.P., and Powell, G.H. 1975. ANSR-I General Pwpose Computer Progrnm For
Analysis Of Non-Linear Structural Response. Report No. UCB/EERC-75/37, University of
California:, Berkeley.
Naumoski, N., Saatcioglu, M., and Amiri-Hormozaki, K. 2004. Effects Of Scaling Of
Earthquake Excitations On The Dynamic Response Of Reinforced Concrete Frame Buildings.
13th World Conference on Earthquake Engineering 2917, no.15.
NBCC. 2010. National Building Code of Canada. Canadian Commission on Building and
Fire Codes. National Research Council of Canada (NRCC), Ottawa, Onterio.
Ohsaki, M., and Nakajima, T. 2012. Optimization Of Link Member Of Eccentrically Braced
Frames For Maximum Energy Dissipation. Journal of Constructional Steel Research 75(2):38-
44.
Okazaki, T, and Engelhardt, M.D. 2007. Cyclic Loading Behavior Of EBF Links Constructed Of
ASTM A992 Steel. Jornal Of Constructional Steel Research 63: 751–765.
Okazaki, T., Arce, G., Ryu, H. and Engelhardt, M. 2005. Experimental Study Of Local Buckling,
Overstrength, And Fracture Of Links In Eccentrically Braced Frames. ASCE Journal Of
Structural Engineering 131 (10): 1526-1535.
Parkash, V., Powell, G.H., and Filippou, F.C. 1992. Drain-2DX: Base Program User Guide.
Report No. UCB/SEMM-1992/29, University of California, Berkeley.
129
PEER. 2010. Next Generation Attenuation of Ground Motions Project (NGA) Database.
Pacific Earthquake Engineering Research Center, Berkely, California.
http://ngawest2.berkeley.edu/.
Popov, E. P., and Engelhardt, M. D. 1988. Seismic Eccentrically Braced Frames. Journal of
Constructional Steel Research 10: 321-354.
Popov, E. P., Ricles, J. M. and Kasai, K. 1992. "Methodology for optimum EBF link design."
Tenth World Conference Of Earthquake Engineering 7: 3983-3988.
Popov, E. P., Ricles J. M., and Kasai. K. 1992. Methodology For Optimum EBF Link Design. In
Proceedings, Tenth World Conference of Earthquake Engineering 7: 3983-3988.
Popov, E. P., Kasai, K. and Engelhardt, M. D. 1987. Advances In Design Of Eccentrically
Braced Frames. Earthquake spectra 3(1).
Ramadan, T., and Ghobarah, A. 1995. Analytical Model For Shear Link Behavior. Journal Of
Structural Engineering 121: 1574-1580.
Richards, P. W. Cyclic Stability and Capacity Design of Steel Eccentrically Braced Frames.
Doctoral dissertation, University of California: San Diego, 2004.
Ricles, J.M, and Popov, E.P. 1994. Inelastic Link Element For Ebf Seismic Analysis. Journal Of
Structural Engineering, ASCE 120 (2): 441-463.
Ricles, J.M., and Popov, E.P. 1987. Dynamic Analysis Of Seimically Resistant Eccentrically
Braced Frames. University of California Berkeley, California.
130
Ricles, J. M., and Popov, E.P. 1994. Inelastic Link Element For EBF Seismic Analysis. Journal
Of Structural Engineering 120 (2): 441-463.
Roder, C.W., and Popov, E.P. 1977. Inelastic Behavior of Eccentrically Braced Steel Frame
under Cyclic Loadings. University of California, Berkely.
Roeder, C.W., Foutch, D.A. and Goel, S. C., 1987. Seismic Testing Of Full-Scale Steel Building-
Part II. Journal Of Structural Engineering 113(11): 2130-2145.
Saiidi, M., and Sozen, M.A. 1981. Simple Nonlinear Seismic Analysis Of R/C Structures.
Journal Of The Structural Division 107 (5): 937-953.
Skokan, M.J. and Hart, G.C. 2000. Reliability Of Nonlinear Static Methods For The Seismic
Performance Prediction Of Steel Frame Buildings. In Proceedings Of The 12th World
Conference On Earthquake Engineering, Paper No. 1972.
Vidic, T., Fajfar, P., and Fischinger, M. 1994. Consistent Inelastic Design Spectra: Strength
and Displacement. Earthquake Engineering and Structurea Dynamics 23 (5): 507-521.
Whittaker, A.S., Uang, C.M. and Bertero, V.V. 1987. Earthquake Simulation Tests And
Associated Studies Of A 0.3-Scale Model Of A Six-Story Eccentrically Braced Steel Structure.
Earthquake Engineering Research Center, College of Engineering, University of California.,.
Yang, M.S. 1982. Seismic Behavior Of An Eccentrically X-Braced Steel Structure. University of
California, Earthquake Engineering Research Center.
131


![[POPOV] Advances in Design of Eccentrically Braced Frames](https://img.pdfslide.net/doc/110x75/577ccd521a28ab9e788bfddd/popov-advances-in-design-of-eccentrically-braced-frames.jpg)