Embed Size (px)
Citation preview

1
SEISMIC PERFORMANCE OF LOW STRENGTH CONCRETE
COLUMNS WITH CARBON FIBER REINFORCED PLASTIC OF
EXISTING BUILDINGS IN JAPAN
Momoyo NEGUCHI1, Hideo TSUKAGOSHI
2 and Koichi MINAMI
3
ABSTRACT
The seismic diagnosis revealed that there were many buildings of the low strength concrete (LSC) less
than 13.5 N/mm2. The current seismic diagnosis and retrofit standards have no application in the
buildings of LSC and it is essentially to confirm the seismic performance by experiments (The Japan
Building Disaster Prevention Association, 2001).
This study reports on the effect of carbon fiber reinforced plastic (CFRP) to LSC by
fundamental tests and experimental results of 14 columns with LSC, and propose evaluation method
of shear strength by plastic method.
In conclusion, even columns with LSC have the performance as columns and can be retrofitted
and shear strength of members with low strength concrete can be calculated by plastic theory. Though
the confined effect by CFRP should not be given to the arch mechanism in plastic theory because of
the size effect, seismic retrofit by CFRP is recognized as effective against improvement in the shear
strength of column with LSC in particular under high axial load or using deformed bars as main
reinforcements.
1. INTRODUCTION
Seismic diagnosis and seismic retrofit of existing buildings are performed nationwide in Japan. The
seismic diagnosis revealed that there were many buildings of low compressive strength less than 13.5
N/mm2, that is defined as low strength concrete and LSC stands for low strength concrete, were found.
That becomes the social problem how seismic performances for the buildings were secured with
seismic retrofit. It is necessary to retrofit for the buildings of LSC so that no administration has
financial surplus energy to rebuild the school buildings of LSC in the situation tight economically.
Furthermore the current seismic diagnosis and retrofit standards have no application in the buildings of
LSC and it is essentially to confirm the seismic performance by experiments (The Japan Building
Disaster Prevension Association, 2001). However, each the evaluation organization racks its brains
about the correspondence because there are few studies about LSC. Seismic diagnosis method and the
seismic reinforcement technique for LSC are demanded socially by such present conditions.
The Special Research Committee on the Low Strength Concrete was organized to solve above
problems, and experimental studies have been made on LSC material and members (Japan Concrete
Institute, 2013). We experimented 36 columns with LSC in the committee and made a statement on
some results (NEGUCHI and MINAMI, 2008).
1 Dr. Eng., Teacher, Kochi Technical High School, Kochi, [email protected]
2 Dr. Eng., Visiting Professor, Chiba University, Chiba, [email protected]
3 Dr. Eng., Emeritus Professor, Fukuyama University, Hiroshima, [email protected]

2
This paper reports on 2 experimental studies, the first study is the fundamental performance of
test pieces with LSC retrofitted by carbon fiber reinforced plastic (CFRP), and the second study is the
seismic performance of 14 experimented columns with LSC and the possibility and the effects of
retrofit of columns with LSC by CFRP, furthermore an evaluation method of shear strength of
columns is proposed by the plastic theory.
2. CONFINED EFFECT AND SIZE EFFECT
The first study is the experiments of the confined effect and the size effect of test pieces with LSC
retrofitted by CFRP shown in Photo 1. Table 1 shows the outline of tests consisted of 8 series in 3
groups.
Table 1. Outline and Result of Tests
Group Series Shape of Section
and Size Layer of CF Sheet
pw(CF)
[%]
Amount of Reinforcement
pw(CF)・σw(CF) [N/mm2]
Compressive
Strength
σB [N/mm2]
A I Round Section
200φ100
0 0.00 0.00 9.72 (σB01)
0.5 0.11 1.79 20.93
2.0 0.44 7.15 48.65
B
II Round Section
200φ100
0 0.00 0.00 8.81 (σB02)
0.5 0.11 1.79 20.18
1.0 0.22 3.57 30.19
2.0 0.44 7.15 49.38
III Round Section
300φ150
0 0.00 0.00 8.01
0.5 0.07 1.19 16.04
1.0 0.15 2.38 25.66
2.0 0.30 4.77 38.53
IV Round Section
300150150
0 0.00 0.00 7.47
0.5 0.07 1.19 11.82
1.0 0.15 2.38 14.87
2.0 0.30 4.77 18.14
C
V Round Section
200φ100
0 0.00 0.00 13.36 (σB03)
1.0 0.22 3.57 33.32
2.0 0.44 7.15 41.24
3.0 0.67 10.72 60.88
4.0 0.89 14.30 82.22
VI Round Section
300φ150
0 0.00 0.00 13.69
1.0 0.15 2.38 29.32
2.0 0.30 4.77 46.31
3.0 0.44 7.15 32.52
4.0 0.59 9.53 38.08
VII Square Section
300150150
0 0.00 0.00 13.37
1.0 0.15 2.38 17.55
2.0 0.30 4.77 22.38
3.0 0.44 7.15 32.70
4.0 0.59 9.53 33.96
VIII Square Section
600300300
0 0.00 0.00 10.85
2.0 0.15 2.38 13.16
4.0 0.30 4.77 16.28
6.0 0.44 7.15 18.81
炭素繊維シート(0.5層巻用)Photo 1. Carbon Fiber Sheet (CF Sheet)

M. Neguchi, H. Tsukagoshi and K. Minami 3
Test parameters are shape of section, size of test pieces, layers of CF sheet and compressive
strength of LSC of normal non-reinforced test piece. Test pieces were casted LSC of 10N/mm2 grade.
Test results are shown in the row of the right-side end of table 1. Photo 2 shows some cases of
the failure situation. The horizontal axis represents area of section, the vertical axis represents ratio of
σB for σB0 shown in Fig. 1. σB0 is the basic compressive strength of normal test piece, σB1, σB2 and σB3,
each group. Regardless of shape of section and size, the more compressive strength increases, the
more quantity of reinforcement by CFRP increases. Compare the value of 150φx300 with the value of
150x150x300, this has about the same area of section, the effect of CFRP for round sectional test
pieces are hither than square sectional ones.
The compressive strength of 300x300x600 test piece is 0.73 times as the compressive strength
of 100φx200 test piece. Compared with the results of round section, the confined effect of CFRP on
inside concrete of 100φx200 test piece becomes as same as 150φx300 test piece. Compared with the
results of square section, the compressive strength of 300x300x600 becomes 1/3.5-1/2 as strong as
150x150x300, and it is found the effect of reinforcement by CFRP becomes relatively small as the
cross section area is large. This characteristic is known a size effect. Compared with round section
and square section, the confined effect on the square section becomes 1/3 as large as round section.
Series Shape of Section
and Size
Layer of CF Sheet
0 (none) 1.0 2.0 3.0 4.0
V Round Section
200φ100
VI Round Section
300φ150
VII Square Section
300150150
(a) Series V - VII
Series Shape of Section
and Size
Layer of CF Sheet
0 (none) 2.0 4.0 6.0
VIII Square Section
600300300
(b) Series VIII
Photo 2. Examples of Failure Mode at Ultimate Compressive Strength

4
Figure 1. Relationship between Cross Section and Ratio of σB for σB0i
Figure 2. Relationship between Nondimensional Amount of Reinforcement and Nondimensional
Compressive Strength
Table 2. Value of σB0i, A and B in Eq. (1)
Shape of Section Size Series σB0i A B
Round Section 200φ100
I 9.72 (σB01) 1.00 5.50
II 8.81 (σB02) 1.00 5.78
V 13.36 (σB03) 1.00 4.60
Round Section 300φ150 III 8.81 (σB02) 0.91 6.61
VI 13.36 (σB03) 1.02 3.29
Square Section 300150150 IV 8.81 (σB02) 0.85 2.47
VII 13.36 (σB03) 1.00 2.27
Square Section 600300300 VIII 13.36 (σB03) 0.81 1.12
○ : Round Section Test Piece
□ : Square Section Test Piece
Right side number of symbol:
Layer of CF Sheet
0 0 00
1
1
1
2
2
2
2
3
3 3
4
4 4
46
100○ 150○150□
300□
0
1
2
3
4
5
6
7
0 1 2 3 4 5 6 7 8 9 10
Rat
io o
f σ
Bfo
r σ
B0i
Cross Section [104 mm2]
0
1
2
3
4
6
100 φ
150 φ
150 □
300 □
150 □
300 □
Right side number of symbol: Number of the CFRP
0
2
4
6
8
0 0.4 0.8 1.2
σB/σ
B0i
(Y)[
N/m
m2 ]
pw(CF)・σ w(CF)/σ B0i (X) [N/mm2]
I II V
I :Y=5.4951X+1II :Y=5.7778X+1V :Y=4.6043X+1
0
2
4
6
8
0 0.4 0.8 1.2
σB/σ
B0i
(Y)[
N/m
m2]
pw(CF)・σ w(CF)/σ B0i (X) [N/mm2]
III VI
III:Y=6.6095X+0.91VI:Y=3.2947X+1.02
0
2
4
6
8
0 0.4 0.8 1.2
σB/σ
B0i
(Y)[
N/m
m2]
pw(CF)・σ w(CF)/σ B0i (X) [N/mm2]
VIII
VIII:Y=1.1154X+0.81
0
2
4
6
8
0 0.4 0.8 1.2
σB/σ
B0i
(Y)[
N/m
m2]
pw(CF)・σ w(CF)/σ B0i (X) [N/mm2]
IV VII
IV :Y=2.4664X+0.85VII:Y=2.2745X+1.00
(a) Series I, II and V (b) Series III and VI
(c) Series IV and VII (d) Series VIII

M. Neguchi, H. Tsukagoshi and K. Minami 5
The X-axis represents i0B)CF(w)CF(w σσp , and the Y-axis represents i0BB σσ in Fig. 2, their
values are in a linear relation with the following Eq. (1). The Y value in Eq. (1) is the value of the
confined effect on inside concrete.
XBAY (1)
where, A and B are shown in Table 3.
Compared with round section shown in Fig. 2 (a) and (b), the slope of square section is gentle
shown in Fig. 2 (c), further the slope of square section and larger area is gentler shown in Fig. 2 (d).
These tendency tell that the effective of reinforcement by CFRP
Meanwhile, the equation of the confined effect on inside concrete is represented in the
following Eq. (2).
BB σλσ (2)
where, B
wyw
σ
σp1.41λ
: round section (3)
B
wyw
σ
σp05.21λ
: square section (4)
pw : shear reinforcement ratio
σwy : yield strength of shear reinforcement
σB : compressive strength of concrete
Eq. (2) is widely known as the equation, and λ in Eq. (3) represents the coefficient of the
confined effect on round section (Richart, 1929). Chan (1955) suggested the coefficient of the
confined effect on square section is half value of round section in Eq. (4). Although these equations
represent the confined effect of the shear reinforcement on inside concrete, assuming that the confined
effect of CFRP on inside concrete, this λ value represents the following Eq. (5) and (6).
B
)CF(wy)CF(w
σ
σp1.41λ
: round section (5)
B
)CF(wy)CF(w
σ
σp05.21λ
: square section (6)
where, pw(CF) : reinforcement ratio of CF sheet
σwy(CF) : yield strength of CF sheet
σB : compressive strength of concrete
Although the λ value in Eq. (5) and (6) corresponds to Y value in Eq. (1), in the case of larger
area of section, the λ value in Eq. (5) and (6) overestimate the confined effect. In spite of the shape of
section, the larger size of section, the less the confined effect becomes. Therefore the
3. SEISMIC PERFORMANCE OF COLUMNS WITH LSC
3.1 Outline of Tests
The second study is the possibility of retrofit for columns with LSC and the effect of reinforcement by
CFRP. Table 3 shows the outline of tests consisted 4 series.
Test valuables are compressive strength of concrete, 5 and 10 N/mm2 grade, axial force ratio,
tension reinforcement ratio and layer of carbon fiber sheet (CF sheet), shown as Table 1. 4 of 10 test
specimens were non-reinforced by CFRP and the others 6 test specimens were reinforced by CFRP.
The shear reinforcements in all test specimens were arranged with 2-D6 and 100mm of each shear

6
reinforcements interval in Table 3, and shear reinforcement ratio was pw = 0.21%. All test specimens
were planned to break by shear failure.
One of the notable characteristics on this study is that the test specimens of series III and IV
were experimented under higher axial load than usual axial load. The reason why such high axial
force ratio is chosen is that even though same axial force, as the compressive strength of concrete
becomes lower, the axial force ratio relatively becomes higher. Other notable characteristic is test
specimens of series I, III, and IV are arranged with round steel bars as main reinforcements because
the existing school buildings before 1965 were built with round steel bars as main reinforcements.
The loading rule experimented on by 0.2×10⁻²
rad. by the same displacement amplitude to
3.2×10⁻²
rad. twice. The axial force on test specimens was worked before working the horizontal load.
Test specimens were always worked constant axial force while testing.
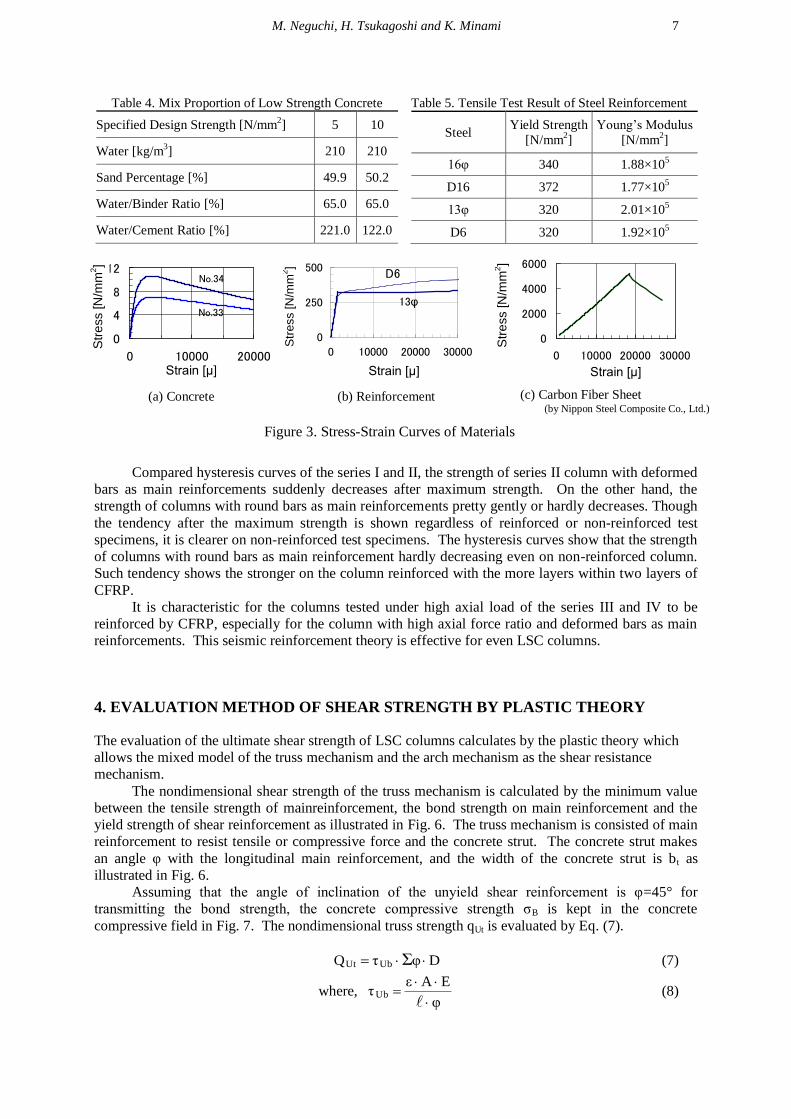
Table 4 presents the mix proportion of LSC, stress-strain curves of concrete appears in Figure 3.
The notable feature of LSC is it has very ductile. Table 5 shows the characteristics of main
reinforcement (φ13 and φ16) and shear reinforcement (D6). Figure 3 appears the stress-strain curves
of main and shear reinforcement and CF sheet.
3.2 TEST RESULTS
The hysteresis curves are illustrated in Fig. 4 and 5, the dashed lines on curves show the calculated
overturning moment value.
The hysteresis curves of columns with LSC tend to show more ductile behavior than columns
with normal strength concrete, regardless of experimental variables. To put it more concretely, a few
characteristics are shown on kind of main reinforcements, differences of layers of CF sheet or axial
force ratio.
Table 3. Outline of Tests
Series No. Name of
Specimens
σB
[N/mm2]
n Layer of
CF Sheet
pt
[%]
Cross Section
[mm]
Vertical Section
[mm]
I
8 L10240 13.50
0.4
none
1.12
D16
D6
12030 120 30300
60
60
60
60
30
30
300
30 120 30120300
16φ
D6
60
60
60
60
30
30
300
135°フック
135°フック
135° Hook
600
900
600
PL9
せん
断補
強筋
@100
PL9
600150150
150 150
CL
She
ar
Rein
forc
em
ent
@100
600
900
600
PL9
せん
断補
強筋
@10
0
PL9
600150150
150 150
CL
Anchor Plate
600900
600
PL9
せん断補
強筋 @1
00
PL9
600150150
150 150
CL
Anchor Plate
13 L1024C1 9.55 0.5
14 L1024C2 9.60 2
II
12 DL10240 13.89
none
1.11
12030 120 30300
60
60
60
60
30
30
300
135°フック
13φ
D6
300
300
135°フック
D6
13φ
30
120
120
30
60 60606030 30
135° Hook
15 DL1024C1 9.67 0.5
16 DL1024C2 9.74 2
III
30 L05280S 4.69
0.8
none
0.74
D16
D6
12030 120 30300
60
60
60
60
30
30
300
30 120 30120300
16φ
D6
60
60
60
60
30
30
300
135°フック
135°フック135° Hook
33 L0528C2S 4.62 2
IV
32 L10280S 10.56 none
34 L1028C2S 10.56 2
σB; Compressive Strength of Concrete, n; Axial Force Ratio BDbNn σ , N; Axial Force [N], , CF Sheet;
200 [g/m2]
M. Neguchi, H. Tsukagoshi and K. Minami 7
Compared hysteresis curves of the series I and II, the strength of series II column with deformed
bars as main reinforcements suddenly decreases after maximum strength. On the other hand, the
strength of columns with round bars as main reinforcements pretty gently or hardly decreases. Though
the tendency after the maximum strength is shown regardless of reinforced or non-reinforced test
specimens, it is clearer on non-reinforced test specimens. The hysteresis curves show that the strength
of columns with round bars as main reinforcement hardly decreasing even on non-reinforced column.
Such tendency shows the stronger on the column reinforced with the more layers within two layers of
CFRP.
It is characteristic for the columns tested under high axial load of the series III and IV to be
reinforced by CFRP, especially for the column with high axial force ratio and deformed bars as main
reinforcements. This seismic reinforcement theory is effective for even LSC columns.
4. EVALUATION METHOD OF SHEAR STRENGTH BY PLASTIC THEORY
The evaluation of the ultimate shear strength of LSC columns calculates by the plastic theory which
allows the mixed model of the truss mechanism and the arch mechanism as the shear resistance
mechanism.
The nondimensional shear strength of the truss mechanism is calculated by the minimum value
between the tensile strength of mainreinforcement, the bond strength on main reinforcement and the
yield strength of shear reinforcement as illustrated in Fig. 6. The truss mechanism is consisted of main
reinforcement to resist tensile or compressive force and the concrete strut. The concrete strut makes
an angle φ with the longitudinal main reinforcement, and the width of the concrete strut is bt as
illustrated in Fig. 6.
Assuming that the angle of inclination of the unyield shear reinforcement is φ=45° for
transmitting the bond strength, the concrete compressive strength σB is kept in the concrete
compressive field in Fig. 7. The nondimensional truss strength qUt is evaluated by Eq. (7).
DφτQ ΣUbUt (7)
where, φ
EAετUb
(8)
Table 4. Mix Proportion of Low Strength Concrete
Specified Design Strength [N/mm2] 5 10
Water [kg/m3] 210 210
Sand Percentage [%] 49.9 50.2
Water/Binder Ratio [%] 65.0 65.0
Water/Cement Ratio [%] 221.0 122.0
Table 5. Tensile Test Result of Steel Reinforcement
Steel Yield Strength
[N/mm2]
Young’s Modulus
[N/mm2]
16φ 340 1.88×10⁵
D16 372 1.77×10⁵
13φ 320 2.01×10⁵
D6 320 1.92×10⁵
Figure 3. Stress-Strain Curves of Materials
(a) Concrete (b) Reinforcement (c) Carbon Fiber Sheet (by Nippon Steel Composite Co., Ltd.)
No.33
No.34
0
4
8
12
0 10000 20000ひずみ度ε [μ ]
応力度
σ[N
/m
m2]
L05(W)-13 L10(F)-25
Str
ess [N
/mm
2]
Strain [μ]
13φ
0
250
500
0 10000 20000 30000ひずみ度ε [μ ]
応力度
σ [
N/m
m2]
D6-aφ 13-6
D6S
tre
ss [N
/mm
2]
Strain [μ]
0
2000
4000
6000
0 10000 20000 30000
ひずみ度ε [μ ]
応力度
σ [
N/m
m2]
日鉄コンポジット株式会社提供資料より作成
Str
ess [N
/mm
2]
Strain [μ]

8
Series I II
Main
Reinforcement Round Bar (φ16) Deformed Bar (D16)
None of CF
Sheet (Non-Retrofit
by CFRP)
-250
0
250
-3.2 -1.6 0 1.6 3.2
Q[kN]
R [10-2rad]
No.8 L10240
-250
0
250
-3.2 -1.6 0 1.6 3.2
Q[kN]
R [10-2rad]
No.12 DL10240
0.5 Layer of CF
Sheet
-250
0
250
-3.2 -1.6 0 1.6 3.2
Q[kN]
R [10-2rad]
No.13 L1024C1
-250
0
250
-3.2 -1.6 0 1.6 3.2
Q [kN]
R [10-2rad]
No.15 DL1024C1
2 Layers of CF
Sheet
-250
0
250
-3.2 -1.6 0 1.6 3.2
Q[kN]
R [10-2rad]
No.14 L1024C2
-250
0
250
-3.2 -1.6 0 1.6 3.2
Q[kN]
R [10-2rad]
No.16 DL1024C2
Figure 4. Hysteresis Curves and Failure Mode at Ultimate Strength
Series III IV
None of CF
Sheet (Non-Retrofit
by CFRP)
-250
0
250
-3.2 -1.6 0 1.6 3.2
Q[kN]
R [10-2rad]
No.30 L05280S
-250
0
250
-3.2 -1.6 0 1.6 3.2
Q[kN]
R [10-2rad]
No.32 L10280S
2 Layers of CF
Sheet
-250
0
250
-3.2 -1.6 0 1.6 3.2
Q[kN]
R [10-2rad]
No.33 L0528C2S
-250
0
250
-3.2 -1.6 0 1.6 3.2
Q[kN]
R [10-2rad]
No.34 L1028C2S
Figure 5. Hysteresis Curves and Failure Mode at Ultimate Strength

M. Neguchi, H. Tsukagoshi and K. Minami 9
ε: strain of main reinforcement, A: area of main reinforcement [mm2],
E: Young’s modulus [N/mm2], : bond splitting length [mm],
φ: perimeter of longitudinal reinforcement [mm]
in addition, for establishing the mechanism, the width bt of concrete compressive field is given
by Eq. (9).
φΣB
Ubt
σ
τ2b (9)
It is assumed that the arch mechanism as illustrated in Fig. 7 is constituted when the resultant
uniaxial compressive stress, σo, of the normal stress, σp, both uniformly distributed over the
compression region at both ends of the reinforcement-less concrete with the width ba, which is the
remaining width used for the arch mechanism and given by Eq. (10), are produced in the direction that
is off from the member axis by the angle of θ. Further, the maximum shear resistance of the arch
mechanism is assumed to take place when the above-mentioned resultant stress, σo, reaches σB, when
the shear strength, QUa1, can be expressed by Eq. (11).
ta bbb (10)
2
σDb
n
ηn4
n
η4Q
Ba
0c
20c
2
0c
1Ua
(11)
where, Dhη (12)
2
η1ηη
2
η1ηηn
3 2223 222
0c
(13)
The QsU2 is given by superposition of QUt and QUa1 by Eq. (14).
1UaUt2sU QQQ (14)
Furthermore, the confined effect for concrete is evaluated by Eq. (15). Chan (1955) suggests
2.05 as the coefficient of column with square cross section in Eq. (16), this coefficient is half of the
coefficient for circular cross section by the research of Richart (1929). The result of our experiment
shows that it is reasonable to apply these coefficients to LSC.
BB σλσ (15)
where, B
wyw
σ
σp05.21λ
(16)
Let 'σB be σB in Eq. (11), the strength of the arch mechanism considered the confined effective
for concrete is given by Eq. (17).
1Ua2Ua QλQ (17)
Then, the ultimate shear strength QsU3 is given by superposition QUt and QUa2 by Eq. (18).
2UaUt3sU QQQ (18)

10
Fig. 9 illustrates the relationship between calculate shear strengthb by Eq.(18) and experimental
shear strength. The continuous line in figure is an approximately straight line, and shows calculated
ultimate shear strength by Eq. (18) agrees the experimental results.
0
50
100
150
200
250
0 50 100 150 200 250
Cal
cula
ted S
hear
Str
engt
h [
kN]
Experimental Shear
Strength [kN] Figure 9. Relationship between Calculate Shear strength and Experimental Shear Strength
D
kD
2
b t
2
b t
b
ba
Qa
Qa
cN
cN cM
cM
θ
Supported Area: A0 Bearing Area: Ap
h
0σ
pσ
Figure 7. Arch Mechanism
Figure 6. Truss Mechanism
rQ’
rN’
rN’
rC rT
rQ’
rT rC
R
R
D rD
φσ 2tc sinhb
φφσ cossinhbtc
hbp ww σ
φφσ cossinhbtc
φσ 2tc sinhb hbp ww σ
h
φ
φσ 2tc sinhb hbp ww σ
hbp ww σ 2
b t
2
b t
b
ba φσ 2tc sinhb
Figure 8. Bearing Strength
Bearing Area : Ap
Supported Area : AD
σD
σp (Bearing Strength)
BB
p
Dp
BD
0
p
Dp
2σσA
Aσ
σσ
σA
Aσ
y = 0.9371x + 3.554
R² = 0.8376

M. Neguchi, H. Tsukagoshi and K. Minami 11
5. CONCLUSIONS
The following results were obtained in this paper:
(1) Even if the column with LSC of 5 N/mm2 grade and round bars as main reinforcements, it was
able to perform cyclic load to the displacement amplitude of 3.2×10⁻²
rad., did not finally occur
the decreased strength.
(2) The confined effect of CFRP on inside concrete of large square column is uncalculated.
(3) The ultimate shear strength is able to evaluate by the plastic theory.
(4) Even columns with LSC have the performance as columns and can be retrofitted by CFRP.
REFERENCES
Architectural Institute of Japan (1990). Design Guideline for Earthquake Resistant Reinforced Concrete
Buildings Based on Ultimate Strength Concept, (in Japanese)
Chan, W. W. L. (1955) “The Ultimate Strength and Deformation of Plastic Hinges in Reinforced Concrete
Frameworks”, Magazine of Concrete Research, Vol. 7, No. 21, 121 -132
Japan Concrete Institute (2013), The Research Report on Special Research Committee on the Low Strength
Concrete, (in Japanese)
NEGUCHI, Momoyo and MINAMI, Koichi (2008) “Some Considerations on Strength and Ductility of RC
Members with Low Strength Concrete”, 14th World Conference on Earthquake Engineering, 05-03- 0236,
Beijing, China, 8 pages
Neguchi, M. and Minami, K. (2009) “Some Considerations on Strength and Ductility of RC Members with Low
Strength Concrete”, Proceeding of the 2009 ANCER Workshop, University of Illinois, 8 pages, Urbana,
Illinois, United States
NEGUCHI, Momoyo and MINAMI, Koichi (2010) “Seismic Evaluation of Low Strength Concrete Members of
Existing Buildings in Japan”, 14th European Conference On Earthquake Engineering, 782, 8 pages,
Ohrid, Republic of Macedonia
The Japan Building Disaster Prevension Association (2001) Seismic Evaluation Standard for Existing
Reinforced Concrete Structure, Japan, (in Japanese)
Richart, F. E., Brandtzaeg, A. and Brown, R. L. (1929) “The Failure of Plain and Spirally Reinforced Concrete
in Compression”, Engineering Experiment Station, Bulletin No. 190, University of Illinois