Embed Size (px)
Citation preview
The 14th
World Conference on Earthquake Engineering October 12-17, 2008, Beijing, China
Seismic Response Analysis of Pile Foundation using Finite Element Method
T. Maki1, S. Tsuchiya
2, T. Watanabe
3 and K. Maekawa
4
1 Associate Professor, Dept. of Civil and Environmental Engineering, Saitama University, Saitama. Japan
Email: [email protected] 2 Engineer, COMS Engineering Co, Ltd., Tokyo. Japan
3 Engineer, Hokubu Consultant Co, Ltd., Hokkaido. Japan
4 Professor, Dept. of Civil Engineering, The University of Tokyo, Tokyo. Japan
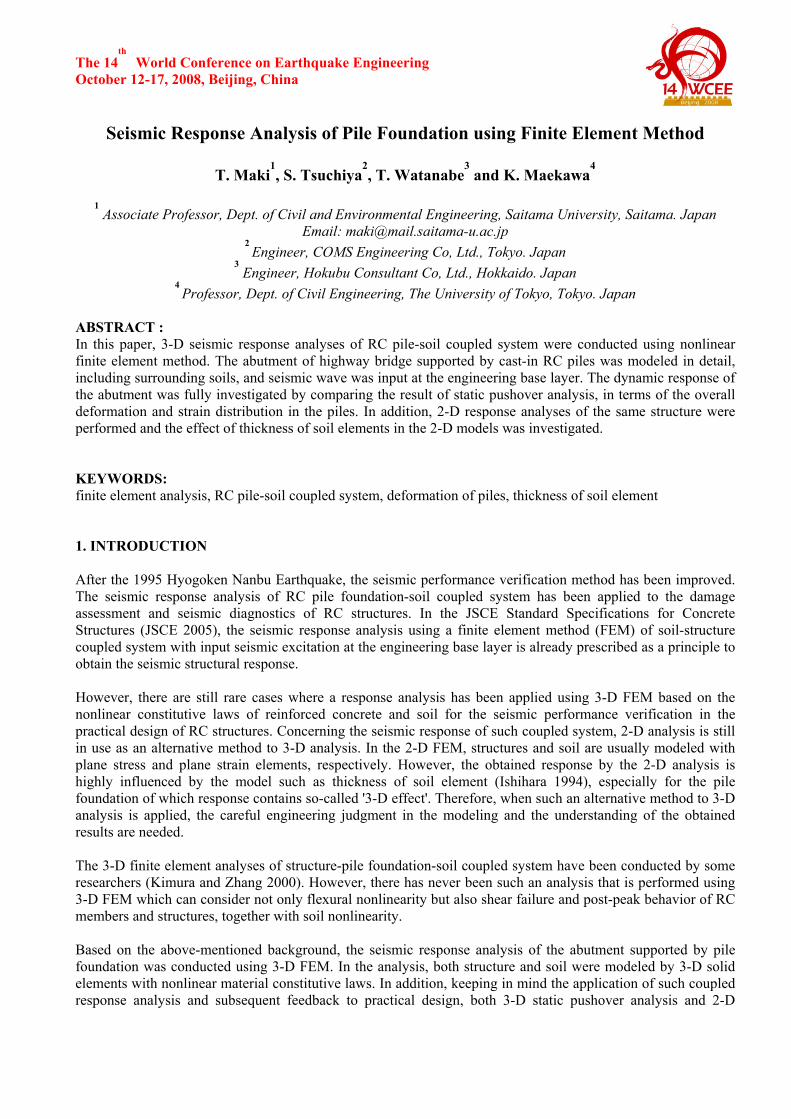
ABSTRACT : In this paper, 3-D seismic response analyses of RC pile-soil coupled system were conducted using nonlinear finite element method. The abutment of highway bridge supported by cast-in RC piles was modeled in detail, including surrounding soils, and seismic wave was input at the engineering base layer. The dynamic response of the abutment was fully investigated by comparing the result of static pushover analysis, in terms of the overall deformation and strain distribution in the piles. In addition, 2-D response analyses of the same structure were performed and the effect of thickness of soil elements in the 2-D models was investigated. KEYWORDS: finite element analysis, RC pile-soil coupled system, deformation of piles, thickness of soil element 1. INTRODUCTION After the 1995 Hyogoken Nanbu Earthquake, the seismic performance verification method has been improved. The seismic response analysis of RC pile foundation-soil coupled system has been applied to the damage assessment and seismic diagnostics of RC structures. In the JSCE Standard Specifications for Concrete Structures (JSCE 2005), the seismic response analysis using a finite element method (FEM) of soil-structure coupled system with input seismic excitation at the engineering base layer is already prescribed as a principle to obtain the seismic structural response. However, there are still rare cases where a response analysis has been applied using 3-D FEM based on the nonlinear constitutive laws of reinforced concrete and soil for the seismic performance verification in the practical design of RC structures. Concerning the seismic response of such coupled system, 2-D analysis is still in use as an alternative method to 3-D analysis. In the 2-D FEM, structures and soil are usually modeled with plane stress and plane strain elements, respectively. However, the obtained response by the 2-D analysis is highly influenced by the model such as thickness of soil element (Ishihara 1994), especially for the pile foundation of which response contains so-called '3-D effect'. Therefore, when such an alternative method to 3-D analysis is applied, the careful engineering judgment in the modeling and the understanding of the obtained results are needed. The 3-D finite element analyses of structure-pile foundation-soil coupled system have been conducted by some researchers (Kimura and Zhang 2000). However, there has never been such an analysis that is performed using 3-D FEM which can consider not only flexural nonlinearity but also shear failure and post-peak behavior of RC members and structures, together with soil nonlinearity. Based on the above-mentioned background, the seismic response analysis of the abutment supported by pile foundation was conducted using 3-D FEM. In the analysis, both structure and soil were modeled by 3-D solid elements with nonlinear material constitutive laws. In addition, keeping in mind the application of such coupled response analysis and subsequent feedback to practical design, both 3-D static pushover analysis and 2-D
The 14th
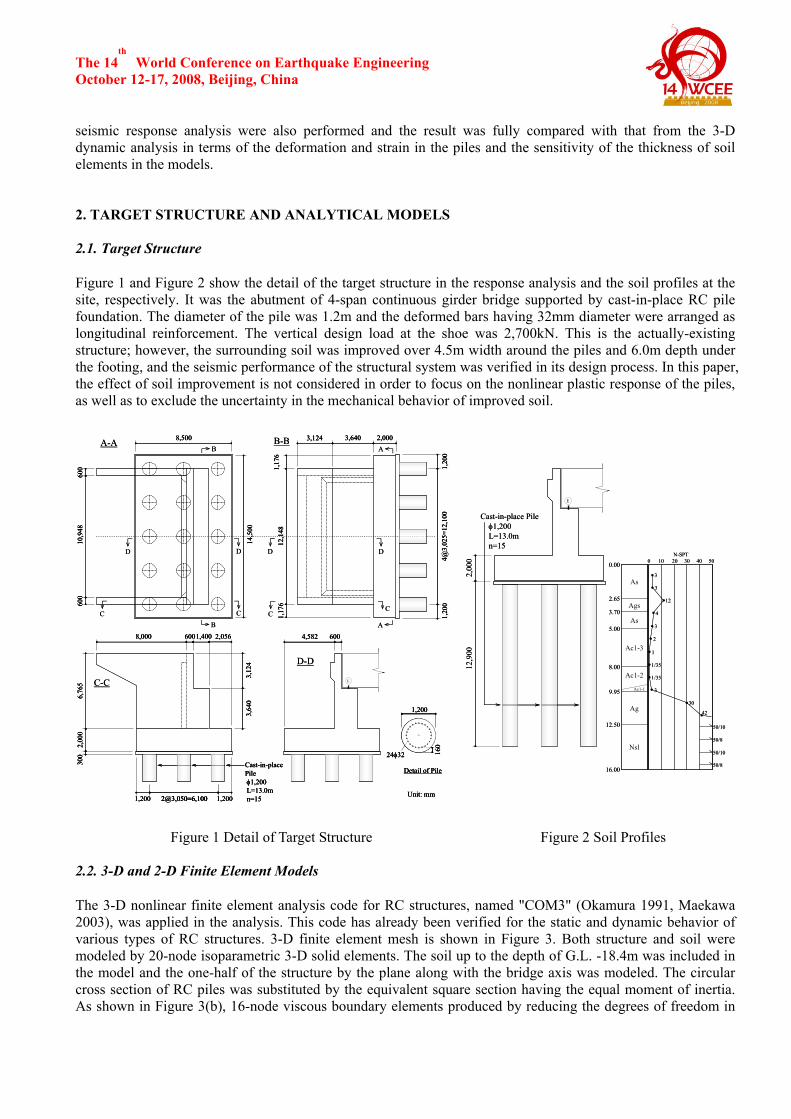
World Conference on Earthquake Engineering October 12-17, 2008, Beijing, China seismic response analysis were also performed and the result was fully compared with that from the 3-D dynamic analysis in terms of the deformation and strain in the piles and the sensitivity of the thickness of soil elements in the models. 2. TARGET STRUCTURE AND ANALYTICAL MODELS 2.1. Target Structure Figure 1 and Figure 2 show the detail of the target structure in the response analysis and the soil profiles at the site, respectively. It was the abutment of 4-span continuous girder bridge supported by cast-in-place RC pile foundation. The diameter of the pile was 1.2m and the deformed bars having 32mm diameter were arranged as longitudinal reinforcement. The vertical design load at the shoe was 2,700kN. This is the actually-existing structure; however, the surrounding soil was improved over 4.5m width around the piles and 6.0m depth under the footing, and the seismic performance of the structural system was verified in its design process. In this paper, the effect of soil improvement is not considered in order to focus on the nonlinear plastic response of the piles, as well as to exclude the uncertainty in the mechanical behavior of improved soil.
24φ32
8,500
12,1
48
10,9
48
14,5
00
E
8,000 600
6,76
52,
000
300
600
4@3,
025=
12,1
00
4,582
600
600
3,124 3,640 2,000
1,17
61,
176
1,20
01,
200
2@3,050=6,1001,200 1,200
3,64
0
1,400
3,12
4
2,056
Cast-in-placePileφ1,200L=13.0mn=15
1,200
160
Detail of Pile
Unit: mm
B
B
B-BA-A
CC
C-C
D-D
DD
CC
DD
A
A
24φ32
8,500
12,1
48
10,9
48
14,5
00
E
8,000 600
6,76
52,
000
300
600
4@3,
025=
12,1
00
4,582
600
600
3,124 3,640 2,000
1,17
61,
176
1,20
01,
200
2@3,050=6,1001,200 1,200
3,64
0
1,400
3,12
4
2,056
Cast-in-placePileφ1,200L=13.0mn=15
1,200
160
Detail of Pile
Unit: mm
24φ32
8,500
12,1
48
10,9
48
14,5
00
E
8,000 600
6,76
52,
000
300
600
4@3,
025=
12,1
00
4,582
600
600
3,124 3,640 2,000
1,17
61,
176
1,20
01,
200
2@3,050=6,1002@3,050=6,1001,200 1,200
3,64
0
1,400
3,12
4
2,056
Cast-in-placePileφ1,200L=13.0mn=15
1,200
160
Detail of Pile
Unit: mm
B
B
B-BA-A
CC
C-C
D-D
DD
CC
DD
A
A
2,00
012
,900
2.65
Cast-in-place Pileφ1,200L=13.0mn=15
E
Nsl
As
Ags
As
Ac1-3
Ac1-2
Ag
Ac1-1
3.70
5.00
8.00
9.95
12.50
16.00
0.003
3
12
4
3
2
1
1/35
1/35
3
30
42
50/10
50/8
50/10
50/8
N-SPT0 10 20 30 40 50
2,00
012
,900
2.65
Cast-in-place Pileφ1,200L=13.0mn=15
E
Nsl
As
Ags
As
Ac1-3
Ac1-2
Ag
Ac1-1
Nsl
As
Ags
As
Ac1-3
Ac1-2
Ag
Ac1-1
3.70
5.00
8.00
9.95
12.50
16.00
0.003
3
12
4
3
2
1
1/35
1/35
3
30
42
50/10
50/8
50/10
50/8
N-SPT0 10 20 30 40 50
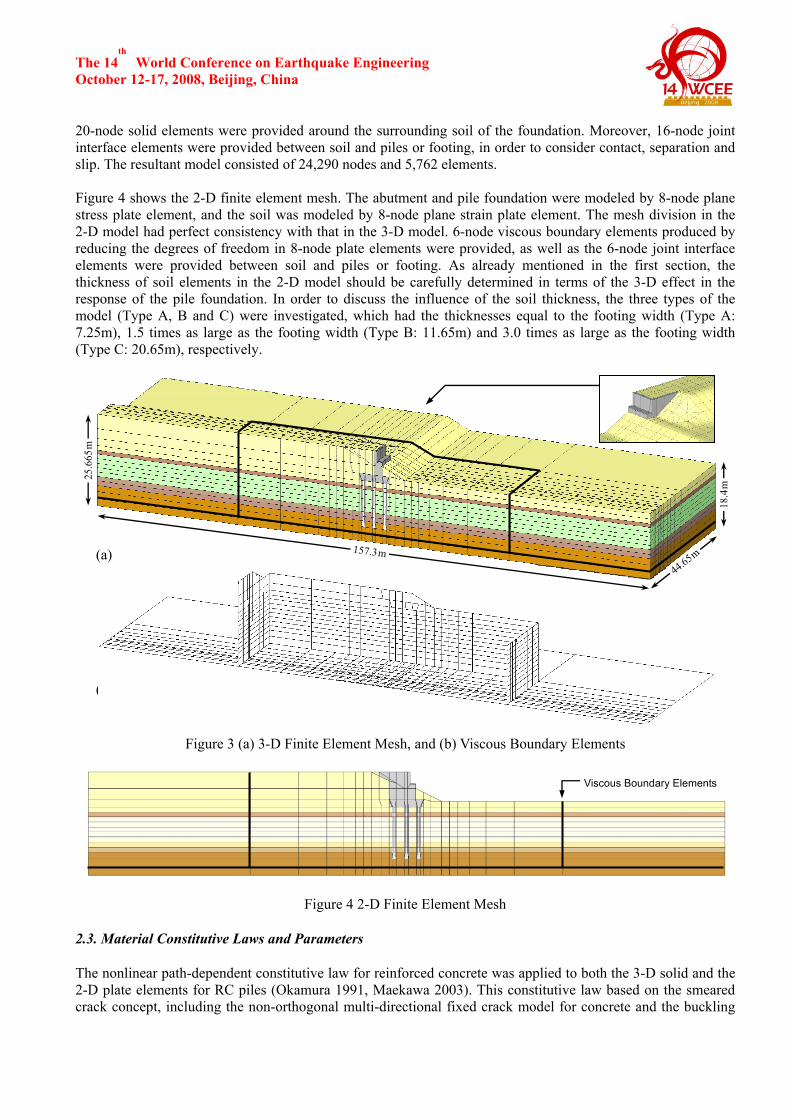
Figure 1 Detail of Target Structure Figure 2 Soil Profiles 2.2. 3-D and 2-D Finite Element Models The 3-D nonlinear finite element analysis code for RC structures, named "COM3" (Okamura 1991, Maekawa 2003), was applied in the analysis. This code has already been verified for the static and dynamic behavior of various types of RC structures. 3-D finite element mesh is shown in Figure 3. Both structure and soil were modeled by 20-node isoparametric 3-D solid elements. The soil up to the depth of G.L. -18.4m was included in the model and the one-half of the structure by the plane along with the bridge axis was modeled. The circular cross section of RC piles was substituted by the equivalent square section having the equal moment of inertia. As shown in Figure 3(b), 16-node viscous boundary elements produced by reducing the degrees of freedom in
The 14th
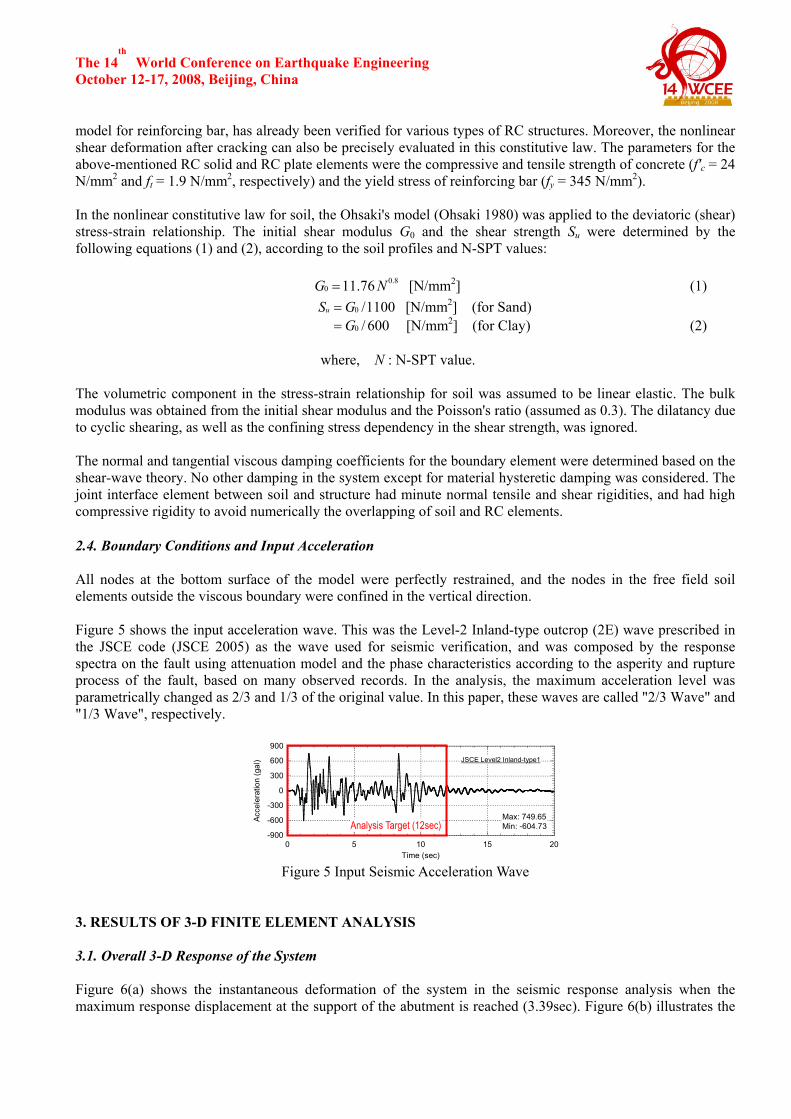
World Conference on Earthquake Engineering October 12-17, 2008, Beijing, China 20-node solid elements were provided around the surrounding soil of the foundation. Moreover, 16-node joint interface elements were provided between soil and piles or footing, in order to consider contact, separation and slip. The resultant model consisted of 24,290 nodes and 5,762 elements. Figure 4 shows the 2-D finite element mesh. The abutment and pile foundation were modeled by 8-node plane stress plate element, and the soil was modeled by 8-node plane strain plate element. The mesh division in the 2-D model had perfect consistency with that in the 3-D model. 6-node viscous boundary elements produced by reducing the degrees of freedom in 8-node plate elements were provided, as well as the 6-node joint interface elements were provided between soil and piles or footing. As already mentioned in the first section, the thickness of soil elements in the 2-D model should be carefully determined in terms of the 3-D effect in the response of the pile foundation. In order to discuss the influence of the soil thickness, the three types of the model (Type A, B and C) were investigated, which had the thicknesses equal to the footing width (Type A: 7.25m), 1.5 times as large as the footing width (Type B: 11.65m) and 3.0 times as large as the footing width (Type C: 20.65m), respectively.
Figure 3 (a) 3-D Finite Element Mesh, and (b) Viscous Boundary Elements
Viscous Boundary Elements
Figure 4 2-D Finite Element Mesh 2.3. Material Constitutive Laws and Parameters The nonlinear path-dependent constitutive law for reinforced concrete was applied to both the 3-D solid and the 2-D plate elements for RC piles (Okamura 1991, Maekawa 2003). This constitutive law based on the smeared crack concept, including the non-orthogonal multi-directional fixed crack model for concrete and the buckling
(a)
(b)
25.6
65m
157.3m
44.65m
18.4
m
The 14th
World Conference on Earthquake Engineering October 12-17, 2008, Beijing, China model for reinforcing bar, has already been verified for various types of RC structures. Moreover, the nonlinear shear deformation after cracking can also be precisely evaluated in this constitutive law. The parameters for the above-mentioned RC solid and RC plate elements were the compressive and tensile strength of concrete (f'c = 24 N/mm2 and ft = 1.9 N/mm2, respectively) and the yield stress of reinforcing bar (fy = 345 N/mm2). In the nonlinear constitutive law for soil, the Ohsaki's model (Ohsaki 1980) was applied to the deviatoric (shear) stress-strain relationship. The initial shear modulus G0 and the shear strength Su were determined by the following equations (1) and (2), according to the soil profiles and N-SPT values: 8.0
0 76.11 NG = [N/mm2] (1) 1100/0GSu = [N/mm2] (for Sand) 600/0G= [N/mm2] (for Clay) (2) where, N : N-SPT value. The volumetric component in the stress-strain relationship for soil was assumed to be linear elastic. The bulk modulus was obtained from the initial shear modulus and the Poisson's ratio (assumed as 0.3). The dilatancy due to cyclic shearing, as well as the confining stress dependency in the shear strength, was ignored. The normal and tangential viscous damping coefficients for the boundary element were determined based on the shear-wave theory. No other damping in the system except for material hysteretic damping was considered. The joint interface element between soil and structure had minute normal tensile and shear rigidities, and had high compressive rigidity to avoid numerically the overlapping of soil and RC elements. 2.4. Boundary Conditions and Input Acceleration All nodes at the bottom surface of the model were perfectly restrained, and the nodes in the free field soil elements outside the viscous boundary were confined in the vertical direction. Figure 5 shows the input acceleration wave. This was the Level-2 Inland-type outcrop (2E) wave prescribed in the JSCE code (JSCE 2005) as the wave used for seismic verification, and was composed by the response spectra on the fault using attenuation model and the phase characteristics according to the asperity and rupture process of the fault, based on many observed records. In the analysis, the maximum acceleration level was parametrically changed as 2/3 and 1/3 of the original value. In this paper, these waves are called "2/3 Wave" and "1/3 Wave", respectively.
-900
-600
-300
0
300
600
900
0 5 10 15 20
Acce
lera
tion
(gal
)
Time (sec)
Max: 749.65Min: -604.73
JSCE Level2 Inland-type1
Analysis Target (12sec)
Figure 5 Input Seismic Acceleration Wave
3. RESULTS OF 3-D FINITE ELEMENT ANALYSIS 3.1. Overall 3-D Response of the System Figure 6(a) shows the instantaneous deformation of the system in the seismic response analysis when the maximum response displacement at the support of the abutment is reached (3.39sec). Figure 6(b) illustrates the
The 14th
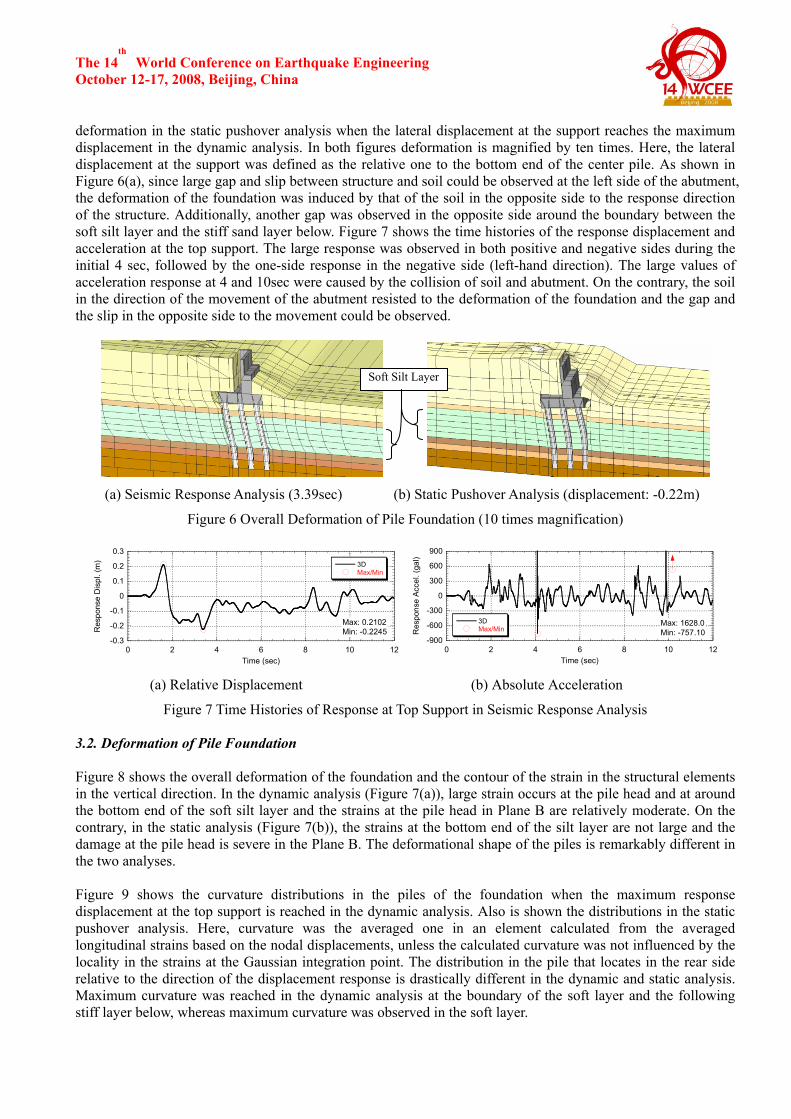
World Conference on Earthquake Engineering October 12-17, 2008, Beijing, China deformation in the static pushover analysis when the lateral displacement at the support reaches the maximum displacement in the dynamic analysis. In both figures deformation is magnified by ten times. Here, the lateral displacement at the support was defined as the relative one to the bottom end of the center pile. As shown in Figure 6(a), since large gap and slip between structure and soil could be observed at the left side of the abutment, the deformation of the foundation was induced by that of the soil in the opposite side to the response direction of the structure. Additionally, another gap was observed in the opposite side around the boundary between the soft silt layer and the stiff sand layer below. Figure 7 shows the time histories of the response displacement and acceleration at the top support. The large response was observed in both positive and negative sides during the initial 4 sec, followed by the one-side response in the negative side (left-hand direction). The large values of acceleration response at 4 and 10sec were caused by the collision of soil and abutment. On the contrary, the soil in the direction of the movement of the abutment resisted to the deformation of the foundation and the gap and the slip in the opposite side to the movement could be observed.
(a) Seismic Response Analysis (3.39sec) (b) Static Pushover Analysis (displacement: -0.22m)
Figure 6 Overall Deformation of Pile Foundation (10 times magnification)
-0.3
-0.2
-0.1
0
0.1
0.2
0.33DMax/Min
0 2 4 6 8 10 12
Res
pons
e D
ispl
. (m
)
Time (sec)
Max: 0.2102Min: -0.2245
-900
-600
-300
0
300
600
900
3DMax/Min
0 2 4 6 8 10 12
Res
pons
e Ac
cel.
(gal
)
Time (sec)
Max: 1628.0Min: -757.10
(a) Relative Displacement (b) Absolute Acceleration
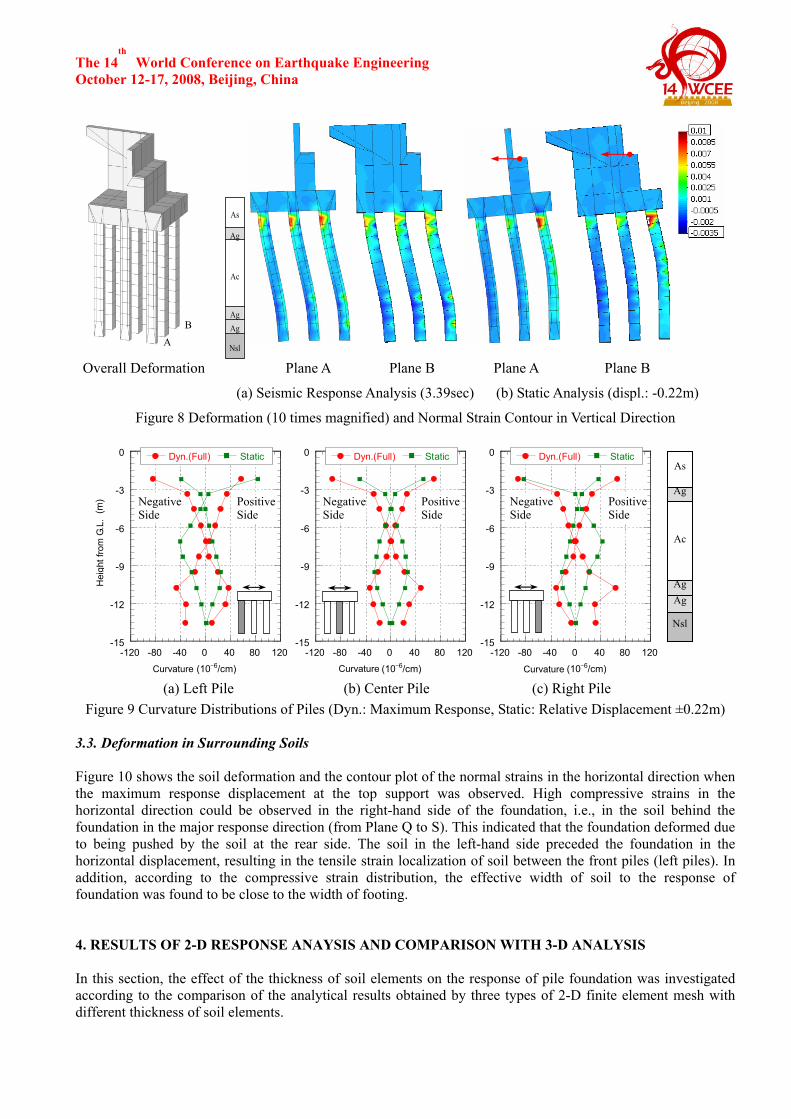
Figure 7 Time Histories of Response at Top Support in Seismic Response Analysis 3.2. Deformation of Pile Foundation Figure 8 shows the overall deformation of the foundation and the contour of the strain in the structural elements in the vertical direction. In the dynamic analysis (Figure 7(a)), large strain occurs at the pile head and at around the bottom end of the soft silt layer and the strains at the pile head in Plane B are relatively moderate. On the contrary, in the static analysis (Figure 7(b)), the strains at the bottom end of the silt layer are not large and the damage at the pile head is severe in the Plane B. The deformational shape of the piles is remarkably different in the two analyses. Figure 9 shows the curvature distributions in the piles of the foundation when the maximum response displacement at the top support is reached in the dynamic analysis. Also is shown the distributions in the static pushover analysis. Here, curvature was the averaged one in an element calculated from the averaged longitudinal strains based on the nodal displacements, unless the calculated curvature was not influenced by the locality in the strains at the Gaussian integration point. The distribution in the pile that locates in the rear side relative to the direction of the displacement response is drastically different in the dynamic and static analysis. Maximum curvature was reached in the dynamic analysis at the boundary of the soft layer and the following stiff layer below, whereas maximum curvature was observed in the soft layer.
Soft Silt Layer
The 14th
World Conference on Earthquake Engineering October 12-17, 2008, Beijing, China
Overall Deformation Plane A Plane B Plane A Plane B
(a) Seismic Response Analysis (3.39sec) (b) Static Analysis (displ.: -0.22m)
Figure 8 Deformation (10 times magnified) and Normal Strain Contour in Vertical Direction
-15
-12
-9
-6
-3
0
-120 -80 -40 0 40 80 120
地表面からの
深さ (m
)
曲率 (10-6/cm)
StaticDyn.(Full)
-15
-12
-9
-6
-3
0
-120 -80 -40 0 40 80 120
曲率 (10-6/cm)
StaticDyn.(Full)
-15
-12
-9
-6
-3
0
-120 -80 -40 0 40 80 120
曲率 (10-6/cm)
StaticDyn.(Full)
(a) Left Pile (b) Center Pile (c) Right Pile
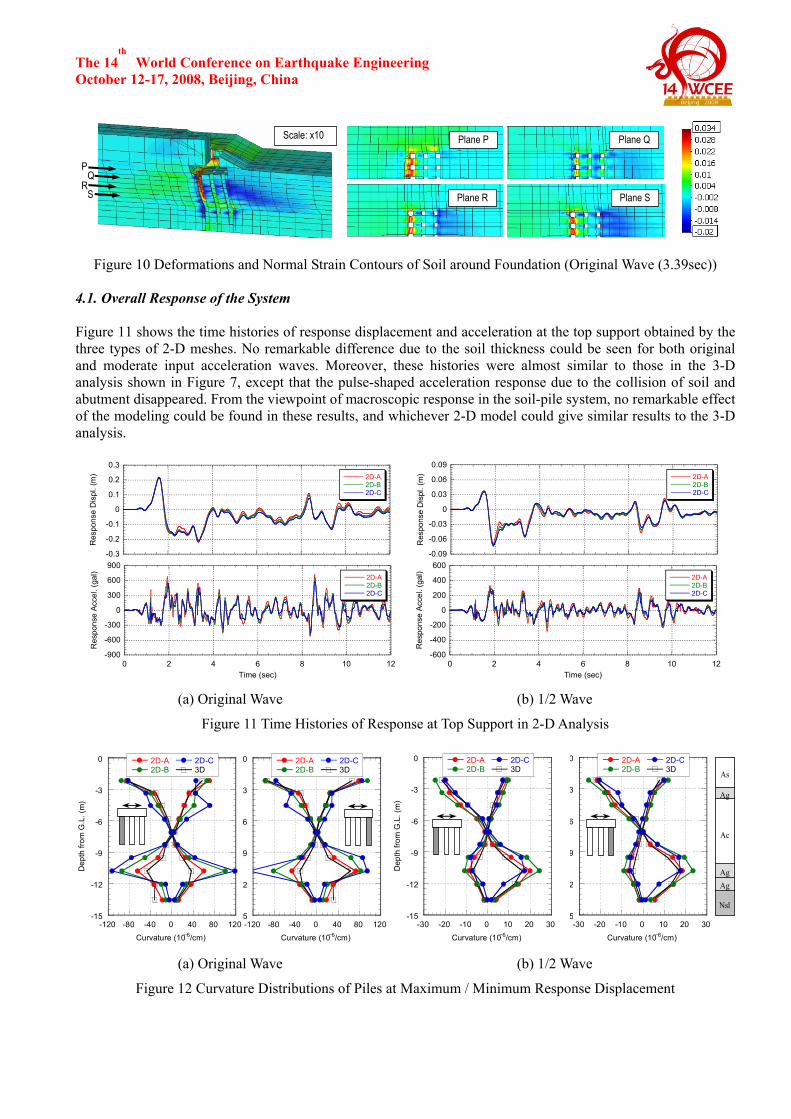
Figure 9 Curvature Distributions of Piles (Dyn.: Maximum Response, Static: Relative Displacement ±0.22m) 3.3. Deformation in Surrounding Soils Figure 10 shows the soil deformation and the contour plot of the normal strains in the horizontal direction when the maximum response displacement at the top support was observed. High compressive strains in the horizontal direction could be observed in the right-hand side of the foundation, i.e., in the soil behind the foundation in the major response direction (from Plane Q to S). This indicated that the foundation deformed due to being pushed by the soil at the rear side. The soil in the left-hand side preceded the foundation in the horizontal displacement, resulting in the tensile strain localization of soil between the front piles (left piles). In addition, according to the compressive strain distribution, the effective width of soil to the response of foundation was found to be close to the width of footing. 4. RESULTS OF 2-D RESPONSE ANAYSIS AND COMPARISON WITH 3-D ANALYSIS In this section, the effect of the thickness of soil elements on the response of pile foundation was investigated according to the comparison of the analytical results obtained by three types of 2-D finite element mesh with different thickness of soil elements.
Ag
As
Nsl
AgAg
Ac
B
A
Ag
As
Nsl
AgAg
Ac
PositiveSide
NegativeSide
Positive Side
NegativeSide
PositiveSide
NegativeSide
Curvature Curvature Curvature
Hei
ght f
rom
G.L
.
The 14th
World Conference on Earthquake Engineering October 12-17, 2008, Beijing, China
面 A 面 B
面 C 面 D
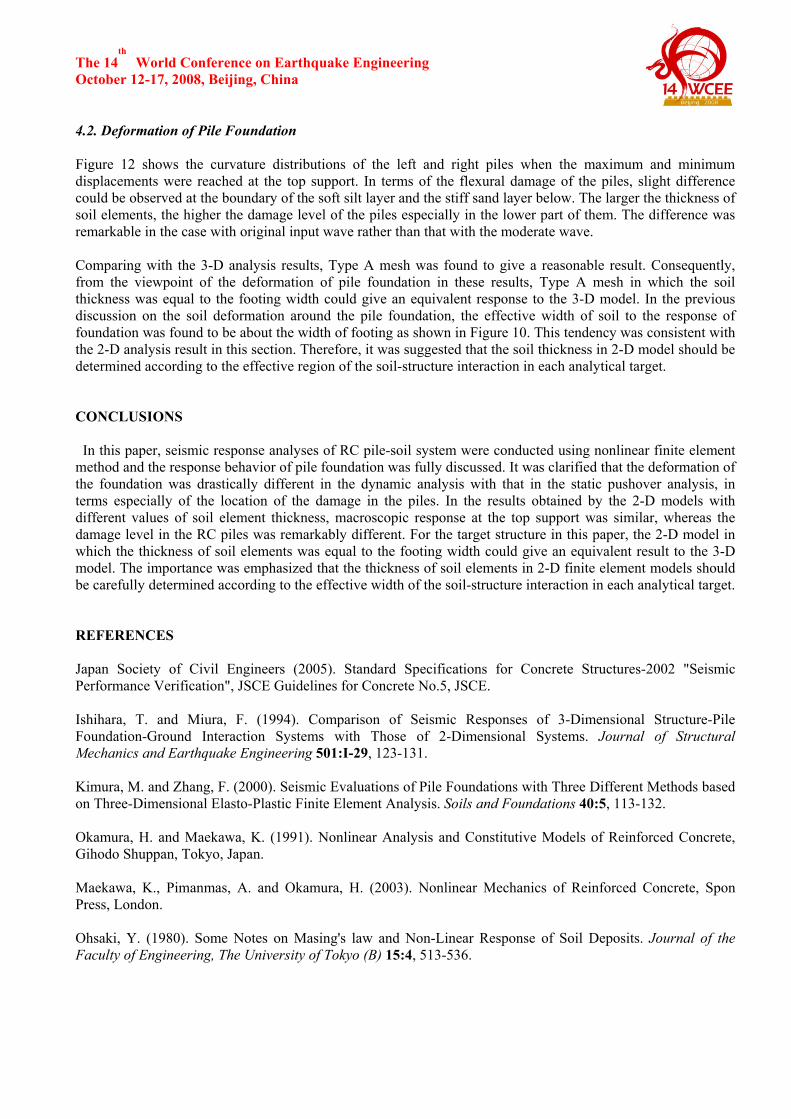
Figure 10 Deformations and Normal Strain Contours of Soil around Foundation (Original Wave (3.39sec)) 4.1. Overall Response of the System Figure 11 shows the time histories of response displacement and acceleration at the top support obtained by the three types of 2-D meshes. No remarkable difference due to the soil thickness could be seen for both original and moderate input acceleration waves. Moreover, these histories were almost similar to those in the 3-D analysis shown in Figure 7, except that the pulse-shaped acceleration response due to the collision of soil and abutment disappeared. From the viewpoint of macroscopic response in the soil-pile system, no remarkable effect of the modeling could be found in these results, and whichever 2-D model could give similar results to the 3-D analysis.
-0.3
-0.2
-0.1
0
0.1
0.2
0.32D-A2D-B2D-C
Res
pons
e D
ispl
. (m
)
-0.09
-0.06
-0.03
0
0.03
0.06
0.092D-A2D-B2D-C
Res
pons
e D
ispl
. (m
)
-900
-600
-300
0
300
600
9002D-A2D-B2D-C
0 2 4 6 8 10 12
Res
pons
e Ac
cel.
(gal
)
Time (sec)
-600
-400
-200
0
200
400
6002D-A2D-B2D-C
0 2 4 6 8 10 12
Res
pons
e Ac
cel.
(gal
)
Time (sec) (a) Original Wave (b) 1/2 Wave
Figure 11 Time Histories of Response at Top Support in 2-D Analysis
-15
-12
-9
-6
-3
0
-120 -80 -40 0 40 80 120
Dep
th fr
om G
.L. (
m)
Curvature (10-6/cm)
2D-C3D
2D-A2D-B
5
2
9
6
3
0
-120 -80 -40 0 40 80 120
Curvature (10-6/cm)
2D-C3D
2D-A2D-B
-15
-12
-9
-6
-3
0
-30 -20 -10 0 10 20 30
Dep
th fr
om G
.L. (
m)
Curvature (10-6/cm)
2D-C3D
2D-A2D-B
5
2
9
6
3
0
-30 -20 -10 0 10 20 30
Curvature (10-6/cm)
2D-C3D
2D-A2D-B
Ag
As
Nsl
AgAg
Ac
(a) Original Wave (b) 1/2 Wave
Figure 12 Curvature Distributions of Piles at Maximum / Minimum Response Displacement
PQ
RS
Plane P Plane Q
Plane R Plane S
Scale: x10
The 14th
World Conference on Earthquake Engineering October 12-17, 2008, Beijing, China 4.2. Deformation of Pile Foundation Figure 12 shows the curvature distributions of the left and right piles when the maximum and minimum displacements were reached at the top support. In terms of the flexural damage of the piles, slight difference could be observed at the boundary of the soft silt layer and the stiff sand layer below. The larger the thickness of soil elements, the higher the damage level of the piles especially in the lower part of them. The difference was remarkable in the case with original input wave rather than that with the moderate wave. Comparing with the 3-D analysis results, Type A mesh was found to give a reasonable result. Consequently, from the viewpoint of the deformation of pile foundation in these results, Type A mesh in which the soil thickness was equal to the footing width could give an equivalent response to the 3-D model. In the previous discussion on the soil deformation around the pile foundation, the effective width of soil to the response of foundation was found to be about the width of footing as shown in Figure 10. This tendency was consistent with the 2-D analysis result in this section. Therefore, it was suggested that the soil thickness in 2-D model should be determined according to the effective region of the soil-structure interaction in each analytical target. CONCLUSIONS
In this paper, seismic response analyses of RC pile-soil system were conducted using nonlinear finite element method and the response behavior of pile foundation was fully discussed. It was clarified that the deformation of the foundation was drastically different in the dynamic analysis with that in the static pushover analysis, in terms especially of the location of the damage in the piles. In the results obtained by the 2-D models with different values of soil element thickness, macroscopic response at the top support was similar, whereas the damage level in the RC piles was remarkably different. For the target structure in this paper, the 2-D model in which the thickness of soil elements was equal to the footing width could give an equivalent result to the 3-D model. The importance was emphasized that the thickness of soil elements in 2-D finite element models should be carefully determined according to the effective width of the soil-structure interaction in each analytical target. REFERENCES Japan Society of Civil Engineers (2005). Standard Specifications for Concrete Structures-2002 "Seismic Performance Verification", JSCE Guidelines for Concrete No.5, JSCE. Ishihara, T. and Miura, F. (1994). Comparison of Seismic Responses of 3-Dimensional Structure-Pile Foundation-Ground Interaction Systems with Those of 2-Dimensional Systems. Journal of Structural Mechanics and Earthquake Engineering 501:I-29, 123-131. Kimura, M. and Zhang, F. (2000). Seismic Evaluations of Pile Foundations with Three Different Methods based on Three-Dimensional Elasto-Plastic Finite Element Analysis. Soils and Foundations 40:5, 113-132. Okamura, H. and Maekawa, K. (1991). Nonlinear Analysis and Constitutive Models of Reinforced Concrete, Gihodo Shuppan, Tokyo, Japan. Maekawa, K., Pimanmas, A. and Okamura, H. (2003). Nonlinear Mechanics of Reinforced Concrete, Spon Press, London. Ohsaki, Y. (1980). Some Notes on Masing's law and Non-Linear Response of Soil Deposits. Journal of the Faculty of Engineering, The University of Tokyo (B) 15:4, 513-536.