Embed Size (px)
Citation preview
SEISMIC SEQUENCE STRATIGRAPHY OF PLIOCENE-
PLEISTOCENE TURBIDITE SYSTEMS, SHIP SHOAL SOUTH
ADDITION, NORTHWESTERN GULF OF MEXICO
A Thesis
by
BOOYONG KIM
Submitted to the Office of Graduate Studies of Texas A&M University
in partial fulfillment of the requirements for the degree of
MASTER OF SCIENCE
August 2002
Major Subject: Geophysics

SEISMIC SEQUENCE STRATIGRAPHY OF PLIOCENE-
PLEISTOCENE TURBIDITE SYSTEMS, SHIP SHOAL SOUTH
ADDITION, NORTHWESTERN GULF OF MEXICO
A Thesis
by
BOOYONG KIM
Submitted to Texas A&M University in partial fulfillment of the requirements
for the degree of
MASTER OF SCIENCE
Approved as to style and content by: ___________________________ _________________________ Joel S. Watkins Luc T. Ikelle (Chair of Committee) (Member) ___________________________ _________________________ W. John Lee Andrew W. Hajash (Member) (Head of Department)
August 2002
Major Subject: Geophysics
iii
ABSTRACT
Seismic Sequence Stratigraphy of Pliocene-Pleistocene Turbidite Systems,
Ship Shoal South Addition, Northwestern Gulf of Mexico. (August 2002)
Booyong Kim, B.S., Kyungpook National University
Chair of Advisory Committee: Dr. Joel S. Watkins
During the Late Pliocene to Middle Pleistocene Ages, sediments of the study area
were deposited in the intra-slope salt withdrawal basin where sand-prone sediments
deposited as turbidite lobes and channel fills are the main reservoirs of the Northern Gulf
of Mexico. The main purpose of this study was to identify and characterize these sand-
prone sediments. Sequence stratigraphic analysis of well logs, biostratigraphic data, and
3-D seismic data provided a chronostratigraphic framework of the study area, within
which seismic facies analysis was carried out. Each sequence was subdivided into
separate seismic bodies characterized by specific amplitude, coherence of reflectors, and
shape of reflectors. The descriptions of each seismic facies combined with well logs
were compared with turbidite facies models to infer their geological information. Five
turbidite elements were identified: depositional channel fills and overbank deposits,
erosional channel fills, turbidite lobes, mud turbidite fills and sheets and hemipelagic
and pelagic drapes. Depositional channel fills are usually deposited in lower parts of
interpreted sequences, surrounded by shale-prone overbank deposits. The lateral
variation of these turbidite elements was revealed by horizon slices, in which
depositional channels are generally trending NE-SW or NNE-SSW with elongated
sinuous forms. Well logs indicate that depositional channel fills usually consist of bell or
cylinder type sand-prone sediments. Turbidite lobe was found only in the 1.1-0.8 Ma
sequence, in which it laps out onto the underlying sequence boundary and shows high-
amplitude and a high-coherence of mound shape. This facies is interpreted as sand-prone,
but wells available penetrated only the marginal parts of this facies and showed poor
reservoir qualities. Horizon slices could partly reveal its lapout boundary due to the

iv
limitation of vertical seismic resolution. Mud turbidite fills and sheets are the most
dominant turbidite facies, which usually occurred in the upper parts of sequences and
overlain by hemipelagic and pelagic drapes. Hemipelagic and pelagic drapes were
deposited very widely, wrapping down the previous topography with consistent
thickness throughout the basin. Erosional channel was observed only in the 0.8-0.7 Ma
sequence where it cut into the underlying sequence and was filled by shale-prone
sediments. Depositional channel fills and turbidite lobes are the main reservoir facies in
the study area. Seismic facies analysis using vertical seismic sections and horizon slices
combined with lithology data made it possible to identify and systematically describe
these sand prone turbidite elements in intra-slope salt withdrawal basin.

v
DEDICATION
To my wife, Myungok Kim, for her love, support, and patience.

vi
ACKNOWLEDGMENTS
I sincerely acknowledge:
Dr. Joel S. Watkins, the chairman of my advisory committee, for his helpful
advice and comments throughout my studies at Texas A&M and for the review of this
thesis.
Dr. Luc T. Ikelle and Dr. John Lee for filling out the advisory committee and for
their helpful advice and comments for this project.
Dr. Steven L. Dorobek for his excellent courses in basin architecture and
stratigraphy.
Korea National Oil Corporation for providing financial support as I pursued a
master’s degree at Texas A&M University.
Dr. Inchang Rhyu, German Molina and Changsu Ryu for helpful discussions and
suggestions throughout the development of this project.
My wife for her support and assistance throughout my study.

vii
TABLE OF CONTENTS
Page
ABSTRACT ..................................................................................................................... iii
DEDICATION ...................................................................................................................v
ACKNOWLEDGMENTS................................................................................................ vi
TABLE OF CONTENTS ................................................................................................ vii
LIST OF FIGURES.......................................................................................................... ix
LIST OF TABLES ......................................................................................................... xiii
1. INTRODUCTION ......................................................................................................1
1.1 Objectives ..........................................................................................................2 1.2 Study Area .........................................................................................................2 1.3 Data Base...........................................................................................................2 1.4 Methodology......................................................................................................5
2. STRUCTURAL INTERPRETATION .......................................................................7
2.1 Fault Interpretation ............................................................................................7 2.2 Salt Interpretation ............................................................................................14 2.3 Basin Geometry and Its Evolution...................................................................17
3. SEQUENCE STRATIGRAPHY ..............................................................................21
3.1 Previous Works................................................................................................21 3.1.1 Basic Concepts of Sequence Stratigraphy .............................................21 3.1.2 Depositional Sequence in deep water setting ........................................22
3.2 Sequence Stratigraphic Analysis .....................................................................25 3.2.1 Identification of Sequence Boundaries and Condensed Sections..........25 3.2.2 High-resolution biostratigraphy and cycle charts ..................................33 3.2.3 Sequence Stratigraphic Analysis ...........................................................36
4. SEISMIC FACIES ANALYSIS ...............................................................................39
4.1 Vertical Seismic Facies ...................................................................................42 4.2 Horizon Slices..................................................................................................42 4.3 Seismic Facies Descriptions ............................................................................44 4.4 Facies Models and Depositional Environments ..............................................51
4.4.1 Depositional Channel and Overbank Deposits ......................................54
viii
Page
4.4.2 Erosional Channel Fills .........................................................................57 4.4.3 Mud Turbidite Fills and Sheets .............................................................60 4.4.4 Pelagic and Hemipelagic Drapes...........................................................60 4.4.5 Turbidite Lobes......................................................................................61
4.5 Facies Descriptions of Sequences....................................................................63 4.5.1 2.4-1.9 Ma Sequence .............................................................................63 4.5.2 1.9-1.4 Ma Sequence .............................................................................64 4.5.3 1.4-1.1 Ma Sequence .............................................................................65 4.5.4 1.1-0.8 Ma Sequence .............................................................................66 4.5.5 0.8-0.7 Ma Sequence .............................................................................67 4.5.6 0.7-0.6 Ma Sequence .............................................................................67
5. CONCLUSION.........................................................................................................69
REFERENCES CITED ....................................................................................................72
VITA ................................................................................................................................78
ix
LIST OF FIGURES
Figure Page
1. Location of study area and well locations. ................................................................ 3
2. Seismic section showing extensional faults developed on tops of salt bodies.
See Figure 4 for the location of section..................................................................... 9
3. Time slice at 1260 msec showing extensional faults in plan view. A:
amplitude display B: instantaneous frequency display.. ......................................... 10
4. Time structure map of sequence boundary 1.1 Ma showing general fault
patterns in the study area ......................................................................................... 11
5. Depositional strike-oriented seismic section showing break-thrust faults
developed by salt upwelling. See Figure 4 for the location of seismic section.
................................................................................................................................. 12
6. NE-SW trending seismic section flattened by 0.7 Ma sequence boundary.
Notice significant thickening of sediment against salt body in 1.4-1.1 Ma
sequence. See Figure 4 for location of seismic section. ......................................... 13
7. NW-SE trending seismic section showing extensional faults on top of the
salt (yellow) and toe-thrust faults dying out onto the salt welded surface
(red). See Figure 4 for the location of seismic section. .......................................... 15
8. 3-D view of the time structure of the top of salt surfaces and their equivalent
salt welded surface. Yellow to red colors indicate salt high areas and cyan to
blue colors indicate salt-evacuated area. ................................................................ 16
9. Unstable progradational shelf margin (modified from Winker, 1984).
Labeled is the inferred basional position for the study area during Late
Pliocene to Early Pleistocene. ................................................................................ 19
10. Isochron maps of the interpreted sequences. .......................................................... 20
11. Depositional model in salt withdrawal mini-basin, Gulf of Mexico (after
Weimer et al., 1998). cs: condensed section; cls: channel levee system; bff:
basin floor fan. ........................................................................................................ 23

x
Figure Page
12. Schematic diagram showing the typical well-log expression of the
deepwater depositional sequence in Gulf of Mexico (after Yielding and
Apps, 1994). ........................................................................................................... 24
13. Characteristic log response for condensed interval (After Reider, 1995). ............. 27
14. Cross-plot of GR, SP, and resistivity logs for Well 358-1. Purple square
indicates the area of condensed section; green square indicate the area of
low SP and high GR interpreted as radioactive sand; red square indicate the
area of high resistivity, low SP, and low GR interpreted as possible
hydrocarbon-bearing interval. ................................................................................ 28
15. Cross plot of GR, density, and neutron logs for Well 351-1. The areas of
purple are interpreted as possible condensed intervals with low density, high
neutron and high GR. ............................................................................................. 29
16. Condensed section (hatched interval) and sequence boundary (dashed line)
interpretation for Well 350-1. SB: sequence boundary; LAD: last appearance
datum; Nan Ab.: calcareous nannoplankton abundance. ....................................... 30
17. Condensed section (hatched interval) and sequence boundary (dashed line)
interpretation for Well 350-2. SB: sequence boundary; LAD: last appearance
datum; Nan Ab.: calcareous nannoplankton abundance. ....................................... 31
18. Condensed section (hatched interval) and sequence boundary (dashed line)
interpretation for Well 358-1. SB: sequence boundary; LAD: last appearance
datum; Nan Ab.: calcareous nannoplankton abundance. ....................................... 32
19. Well log correlation flattened by 0.5 Ma - sequence boundary. ............................ 34
20. Seismic section crossing six wells showing sequence boundaries interpreted
from well logs and biostratigraphic data. For each well paleo-tops and well
logs including GR (left) and resistivity (right) are displayed. Paleo tops
generally occur near the sequence boundaries. See Figure 1 for well
locations. ................................................................................................................ 35

xi
Figure Page
21. Plio-Pleistocene biostratigraphic zonation and coastal onlap curves,
Northern Gulf of Mexico (after Paleo-Data Inc., 1993). ........................................ 37
22. Seismic facies analysis from strike-oriented seismic section. See Figure 4
for location of seismic section. SF: seismic facies. ................................................ 40
23. NE-SW trending seismic section showing the six seismic facies identified
from the vertical seismic sections. See Figure 4 for location of seismic
section. SF: seismic facies. ..................................................................................... 41
24. A: seismic section flattened by 0.7 Ma sequence boundary. Yellow line
indicates sliced surface. B: horizon slice showing high amplitude area
interpreted as depositional channel fills and surrounding low-amplitude area
interpreted as overbank deposits in 0.7-0.6 Ma sequence. Shades of white
indicate intensity of negative impedance and shades of black indicate
intensity of positive impedance. ............................................................................. 43
25. The correlation of seismic facies and their well-log responses. SF: seismic
facies. ...................................................................................................................... 45
26. A: horizon slice showing depositional channel fills and overbank facies in
2.4-1.9 Ma sequence. B: RMS amplitude display. Purple indicates high-
amplitude area interpreted as depositional channel fills and green indicates
low-amplitude area interpreted as overbank area. .................................................. 46
27. Horizon slice showing depositional channel fills and overbank facies
developed in 1.4-1.1 Ma sequence. Shades of white indicate intensity of
negative impedance and shades of black indicate intensity of positive
impedance. .............................................................................................................. 47
28. A: seismic section flattened by 1.1 Ma sequence boundary showing
erosional channel (seismic facies C). B: horizon slice showing N-S trending
linear feature with low amplitude interpreted as an erosional channel fill.
Shades of white indicate intensity of negative impedance and shades of
black indicate intensity of positive impedance. ..................................................... 49
xii
Figure Page
29. Horizon slice showing mud turbidite fills and sheets developed in 1.9-1.4
Ma sequence. Shades of white indicate intensity of negative impedance and
shades of black indicate intensity of positive impedance. ..................................... 50
30. Horizon slice showing hemipelagic and pelagic fills from 0.8-0.7 Ma
sequence. Shades of white indicate intensity of negative impedance and
shades of black indicate intensity of positive impedance. ..................................... 52
31. A: seismic section showing turbidite lobe sediment downlapping onto
underlying sequence boundary. B: horizon slice showing turbidite lobe
developed in 1.1-0.8 Ma sequence. Red dotted line indicates the edge of the
turbidite lobe interpreted from vertical seismic section and horizon slice.
Shades of white indicate intensity of negative impedance and shades of
black indicate intensity of positive impedance. ..................................................... 53
32. Vertical stacking patterns of turbidite elements and their well log responses,
and the nature of sequence boundaries. .................................................................. 56
33. Series of horizontal seismic slices showing depositional channel and
overbank facies of 0.7-0.6 Ma sequence. Every slice was cut parallel with
underlying 0.7 Ma sequence boundary. A: 76 msec above; B: 80 msec
above; C: 84 msec above; D: 90 msec above; E: 94 msec above; F: 98 msec
above. Shades of white indicate intensity of negative impedance and shades
of black indicate intensity of positive impedance. ................................................. 58
34. Series of horizontal slices as same as Figure 33 with channel interpretation. ....... 59
35. Vertical stacking patterns of turbidite elements from 2.4 Ma to 0.6 Ma
sequence boundaries. A: depositional strike-oriented seismic section. B:
turbidite element interpretation based on well logs and seismic facies. See
Figure 4 for the location of section. ....................................................................... 62

xiii
LIST OF TABLES
Table Page
1. Well database. ........................................................................................................... 4
2. Seismic facies and characteristics of turbidite elements. ........................................ 55

1
1. INTRODUCTION
Numerous intraslope basins developed by salt and fault evolutions can characterize
the slope of the Gulf of Mexico. These basins are severely deformed by salt upwelling
and fault deformations and are usually filled by Neogene turbidite sediments. This
Neogene turbidite system commonly contains sand-prone turbidite sediment deposited as
lobes or channels. These sand prone turbidite deposits are the main reservoirs in the
northern Gulf of Mexico (Weimer et al., 1998 and Varnai, 1998). Many attempts to
understand the spatial and temporal distribution of these sand prone turbidite deposits in
intraslope basins have been made because of their significance in hydrocarbon
exploration activities in the Northern Gulf of Mexico.
This study focuses on describing and characterizing the Neogene turbidite strata
deposited in an intra-slope basin in the northern Gulf of Mexico. Sequence stratigraphic
analysis was carried out using high-resolution three-dimensional seismic data. The
interpretation of well logs and biostratigraphic data provide key information to locate
sequence boundaries and condensed sections in the study area where erosional surfaces
or lap-out patterns are not commonly observed from the seismic data. The integrated
results of sequence analysis from different kinds of data sources were especially useful
to build a reasonable chronostratigraphic framework in the study area. Seismic facies
analysis with high-resolution, 3-dimensional seismic data within a time-constrained
framework clearly showed the depositions of channel or lobe-shaped turbidite sediments.
A series of horizon slices created by sequence boundaries or condensed sections
successfully revealed the variation of these sand-prone turbidite facies in space and time. 1
This thesis follows the style and format of the American Association of Petroleum Geologists Bulletin.
2
1.1 Objectives
The objectives of this study are (1) to describe the structural patterns of the
Pliocene and Pleistocene turbidite systems with high-resolution 3-D seismic data, (2) to
build a chronostratigraphic framework of Late Pliocene and Pleistocene deposits in a
sloped mini-basin with sequence stratigraphic concepts, (3) to carry out seismic facies
analysis within a chronostratigraphic framework, and (4) to integrate seismic facies with
well data and biostratigraphic information to infer paleo-depositional environments and
lithofacies.
1.2 Study Area
The study area is located over the near the present shelf edge and the upper slope
in offshore Louisiana, Northern Gulf of Mexico (Figure 1). It includes the southern part
of Ship Shoal South Addition, the eastern part of Ewing Bank, and the northern edges of
Green Canyon covering the area of 152 square kilometers (the red-colored rectangle in
Figure 1). The present shelf-slope break is located in the southern part of the study area
where an intraslope mini-basin is buried by prograding shelf sediments.
1.3 Data Base
Sub-regional 3-D seismic data and six well data were used for this study. 3-D
seismic data used for this study are the subset of the 300 square kilometers of migrated
3-D seismic data set acquired by BHP Petroleum. The seismic data were acquired in an
east-west direction. The line and trace intervals are 65 ft and 41 ft respectively. Well
data available include wireline logs, biostratigraphic data, time-depth information, and
well cutting descriptions (Table 1), the qualities of which are variable from good to poor.
Biostratigraphic data consist of benthic foraminifer datum, calcareous nannoplancton

SH
IP S
HO
AL
SO
UTH
AD
DIT
ION
EW
ING
BA
NK
GR
EE
N C
AN
YO
N
SU
RVE
Y A
RE
AS
TU
DY A
RE
A
35
0-
1
35
0-
2 35
1-
1
35
8-
1
35
7-
1
36
8-
1
L O
U I S
I A
N A
EA
ST
CA
ME
RO
NVE
RM
ILIO
N
SO
UTH
MA
RSH
ISLA
ND
NO
RTH
SO
UTH
MA
RSH
ISLA
ND
SO
UTH
MA
RSH
ISLA
ND
SO
UTH
EA
ST
CA
ME
RO
NSO
UTH
VE
RM
ILIO
NSO
UTH
EU
GE
NE ISLA
ND
EU
GE
NE ISLA
ND
SO
UTH
GR
AN
DIS
LE
GR
AN
DIS
LE
SO
UTH
SO
UTH
PE
LTO
SH
IP S
HO
AL
SH
IP S
HO
AL
SO
UTH
SO
UTH
TIM
BA
LIE
R
SO
UTH
TIM
BA
LIE
RSO
UTH E
WIN
G B
AN
K
NEW
O
RLEA
NS
GR
EE
N C
AN
YO
NG
AR
DE
N B
AN
KS
STU
DY
AR
EA
Figu
re 1
. Loc
atio
n of
stud
y ar
ea a
nd w
ell l
ocat
ions
.
3

Tab
le 1
. W
ell d
atab
ase.
Wel
l G
amm
a Ra
y Lo
g SP
Lo
g Re
sist
ivity
Lo
g
Neu
tron
-D
ensi
ty
Log
Soni
c Lo
g
Cal
care
ous
Nan
no-
Plan
kton
s D
atum
Bent
hic
Fora
min
ifer
Dat
um
Foss
il Ab
unda
nce
and
dive
rsity
cu
rves
Tim
e-de
pth
info
rmat
ion
350-
1 X
X
X
X
X
X
X
X
350-
2 X
X
X
X
X
X
X
X
351-
1 X
X
X
X
X
X
357-
3 X
X
X
X
X
X
358-
1 X
X
X
X
X
X
X
368-
1 X
X
X
X
X
X
4
5
datum, and fossil abundance and diversity curves. Time-depth information was obtained
from the Website of the Minerals Management Service, Gulf of Mexico OCS Region.
Geographics, well log interpretation software, was used to digitize and interpret well
data. LandMark 3-D seismic interpretation package and StratWorks were exclusively
used for interactive 3-D seismic data interpretation, and well-to-seismic correlation.
1.4 Methodology
This study was performed according to the following procedures:
The first step was structural interpretation, for which the top salt and equivalent
salt surfaces were mapped throughout the study area and a time-structural map was
created. Faults were also interpreted from both the vertical seismic sections and
horizontal time slices. The structure of the study area can be characterized by severe
deformation caused by salt and fault evolutions. However, 3-D seismic data provide a
high-resolution subsurface image, with which high-quality fault and salt mapping was
possible.
The second step was to build a sequence-stratigraphic framework for the study area.
The general procedure of sequence stratigraphic analysis was adapted from Vail and
Wornardt (1991). Key surfaces including condensed sections and sequence boundaries
were identified from fossil abundance data, paleo-top information, and well logs. All
sequence boundaries and condensed sections were correlated with a global cycle chart to
date and tied with seismic data using time-depth information. Each reflector correlated
with a sequence boundary was interpreted throughout the study area, and the time-
structural maps and isochron maps were generated for the interpreted sequences.
The final step was seismic facies analysis, which was performed within the
chronostratigraphic framework provided by sequence stratigraphic analysis. Seismic
parameters including reflection configuration, amplitude, and coherency were examined
from the vertical seismic sections to describe seismic parameter variations that may be

6
caused by geologic changes within seismic sequences and systems tracts. Horizon slices
created by 3-D seismic volume flattened by sequence boundaries or condensed sections
were used to describe the lateral variations of the seismic facies. Seismic facies
combined with well logs were correlated with facies models and interpreted into
geological facies associations or turbidite elements.

7
2. STRUCTURAL INTERPRETATION
The study area can be characterized by highly complex structural patterns
consisting of allochthonous salt bodies, extensional faults and contraction folds and
faults. The deformations of salts and associated faults are closely related with the
sedimentations in the study area. Most faults are related to the deformation of the
allochthonous salt bodies. During the Cenozoic Ages, the evolution of the basin was
dominated by the influx of large clastic sediments, which caused the basinward
evacuation of autochthonous Jurassic salt (McBride, 1998). The allochthonous salt
bodies in the study area were deformed again as sediment prograded and generated a
small-scale intraslope salt-withdrawal basin.
Stratigraphic interpretation without understanding of salt and fault deformations
may result in significant miscorrelations in this area because of its structural complexity.
Thus, the detailed interpretation of salt and faults is an essential step prior to any
stratigraphic interpretations in the Gulf of Mexico (Weimer et al., 1998). Faults were
interpreted using high-resolution three-dimensional seismic data, which made it possible
to map and correlate the fault systems in this highly deformed area. The top surface of
scattered salt bodies and their equivalent welded surfaces were also interpreted using
high-resolution 3-D seismic data, which made it possible to understand the geometry and
distribution of salt bodies. The geometry of the salt withdrawal basin of the study area
was very also well explained by the salt interpretation.
2.1 Fault Interpretation
Fault activities are closely related with salt deformation in the northern Gulf of
Mexico, where extensional faults, contractional faults and strike-slip faults developed as
effects of salt mobilization. This diversity is caused by the characteristics of the salt
deformation driven by sediment loading (Jackson and Galloway, 1984; Worrall and
8
Snelson, 1989; Wu et al., 1990; Diegel et al., 1995; Peel et al., 1995; Rowan, 1977). As
the sedimentary overburden increases, gravity-driven deformation occurs resulting in
listric normal faults dipping to basinward. These fault surfaces usually attach onto the
salt detachment surfaces. Extensional faults characterize the landward and middle part of
the linked systems, contraction usually occurs near the basinward limits, and strike-slip
deformation may connect these two domains (Rowan, 1997).
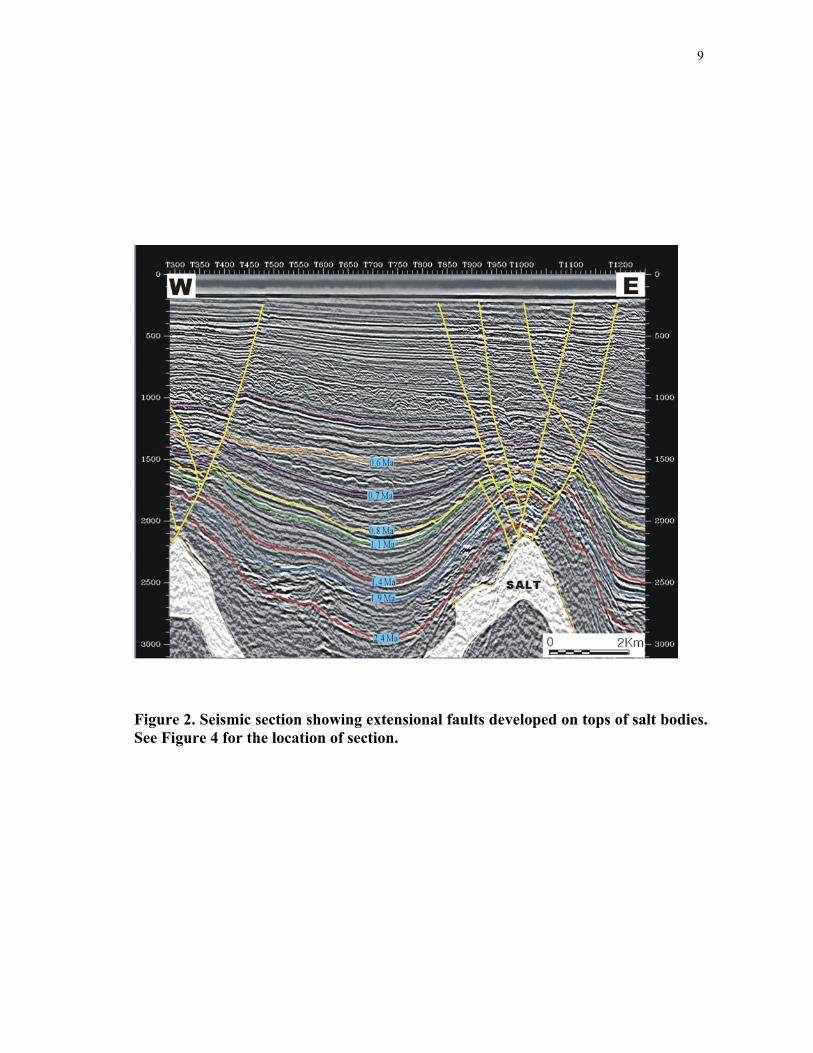
In the study area, normal faults commonly developed in the north, east and west
boundaries of the mini-basin. These extensional faults are developed above the shallow
salt sheets forming a curve linear trend in plan view (Figure 2 and 3). In vertical section
these faults show normal movement. These faults developed on top of salt highs located
in eastern and western boundaries of this basin and trending generally in NNE-SSW
directions. These fault systems consist of numerous fault surfaces (Figure 3). Thus, only
the limited number of distinguished fault surfaces could be correlated from this study
using vertical seismic sections and horizontal time slices. In Figure 3, the time slice cut
at 1260 msec, we can see that instantaneous frequency data provide a better picture for
fault interpretation than normal amplitude data, so several instantaneous frequency data
were used to find out general trends of faults.
To the south, two types of reverse faults trending east to west and dipping
landward developed (Figure 4). These are interpreted as break-thrust fault and tow-thrust
fault (after Rowan, 1997). Break-thrust faults developed in the southern part of the study
area bounding the basin (Figure 4) dipping to the north. Break-thrust fault are usually
symmetric, steep, reverse faults dipping both landward and basinward, cutting the salt-
cored fold (Rowan et al., 1999). However, the break-thrust faults interpreted in this study
developed around salt-cored folds dipping only landward (Figure 4, 5 and 6). The
maximum fault throws are observed in the southeastern part of the basin and decreased
significantly to the west (Figure 4 and 6). It is believed that these faults were activated in
the late stage of folding and continued until about 0.6 Ma. After 0.6 Ma the fault
activities decreased because of salt evacuation from the central part of the basin. The
other contractional fault, a toe-thrust fault, shows a pattern in plan view similar to
9
Figure 2. Seismic section showing extensional faults developed on tops of salt bodies. See Figure 4 for the location of section.

10
Figure 3. Time slice at 1260 msec showing extensional faults in plan view. A: amplitude display B: instantaneous frequency display.

11
Figure 4. Time structure map of sequence boundary 1.1 Ma showing general fault patterns in the study area.
12
Figure 5. Depositional strike-oriented seismic section showing break-thrust faults developed by salt upwelling. See Figure 4 for the location of seismic section.
Figu
re 6
. N
E-S
W t
rend
ing
seis
mic
sec
tion
flatt
ened
by
0.7
Ma
sequ
ence
bou
ndar
y. N
otic
e si
gnifi
cant
thi
cken
ing
of
sedi
men
t aga
inst
salt
body
in 1
.4-1
.1 M
a se
quen
ce. S
ee F
igur
e 4
for
loca
tion
of se
ism
ic se
ctio
n.
13

14
the break-thrust fault’s (Figure 4). This fault is also a reverse fault, dipping landward,
and mainly developed by sediment translation deposited on the allochthonous salt body
(Figure 7). This fault usually develops at the toes of the allochthonous salt body or its
evacuated equivalents (Rowan et al., 1999). Only one toe thrust fault was mapped in the
southwestern part of the study area where it is dipping northwest and attached onto the
salt welded surface (Figure 4 and 7). It developed without salt-cored folds and is
differentiated by less steepness of the fault surface from the break-thrust faults.
2.2 Salt Interpretation
The top salt surface is characterized as continuous, strong, positive-amplitude
reflectors because salt has a much higher velocity than other clastic sediments in the
Gulf of Mexico. Therefore, these reflectors can be easily defined from the most of the
study area; but where salt bodies are located under severely faulted structures, they are
not easily interpreted, even with the high-resolution 3-D seismic data. The geometry of
the salt-withdrawal basin of the study area was very well explained from the salt
interpretation (Figure 8). Shallow salt bodies are distributed in the north, east and west
parts of the basin where its depth in two-way time ranges from 1.5 to 2.5 seconds. In the
central part of the basin, most of the salt was evacuated, probably at around 0.6 Ma, as
indicated by the series of isochron maps generated with interpreted sequence boundaries.
Sequences below the 0.6 Ma sequence boundary show that the depocenters are located in
the central part of the basin. However, the depocenters of the sequence above the 0.6 Ma
sequence boundary moved to the north; that is caused by the growth fault dipping
basinward and by salt deformation (Figure 6). The salt-welded surface is extended to the
south and might be connected to the deep salt body in the downdip area by a ramp-type
welded surface.

Fi
gure
7. N
W-S
E t
rend
ing
seis
mic
sec
tion
show
ing
exte
nsio
nal f
aults
on
top
of t
he s
alt
(yel
low
) an
d to
e-th
rust
fau
lts
dyin
g ou
t ont
o th
e sa
lt w
elde
d su
rfac
e (r
ed).
See
Figu
re 4
for
the
loca
tion
of se
ism
ic se
ctio
n.
15
16
Figure 8. 3-D view of the time structure of the top of salt surfaces and their equivalent salt welded surface. Yellow to red colors indicate salt high areas and cyan to blue colors indicate salt-evacuated area.

17
2.3 Basin Geometry and Its Evolution
The study area lies in the outer shelf, shelf-slope break and the most upper slope of
the unstable progradational shelf-slope system, offshore Louisiana (Figure 9). During the
Late Pliocene to Early Pleistocene Ages, however, it is interpreted that it was located in
the middle to upper slope, where sediments were deposited in a deepwater setting
intraslope basin formed by salt-withdrawal activities. According to Geitgey’s work
(1988), the paleo-shelf break of 0.6 Ma was located about 10 miles north of the study
area. In the northern Gulf of Mexico, salt mobilization and associated growth faults
supplied a considerable amount of accommodation space and severely modified
sedimentation patterns (Simmons, et al., 1996). Depocenters were usually formed by salt
mobilization and displacement of pre- and syn-depositional sediment (Watkins, et al.,
1996). Growth faulting was active along the landward boundary of the salt-withdrawal
basin, which provided additional accommodation space and enlarged these depocenters
(Watkins, et al., 1996).
This basin is an elliptical shape, elongated to the NNE-SSW direction (Figure 8).
The north, east and west sides of the basin are bounded by extensional faults and
topographic highs caused by salt upwellings. Downdip margins are bordered by salt-
cored folds and reverse faults. These topographic highs caused by salt deformation
functioned as partial downdip barriers to sedimentation, trapping more sediment within
the basin. The faulting and salt upwelling interactively affected the sedimentation pattern
in this area, which can be easily explained by the series of isochron maps generated by
the interpreted sequence boundaries (Figure 10). From 2.4 Ma to 0.6 Ma, sedimentation
was mostly controlled by salt withdrawal and depocenters located in the central part of
the basin where salt evacuation dominantly occurred. After 0.6 Ma, salt evacuation was
ceased from the central part of the basin and no further significant accommodation space
was provided by the salt deformation. Sedimentation was also controlled by the fault
activities. In the northern part of the basin, another depocenter was created during 1.4-
1.1 Ma sequence where sediments show significant expansion against the basinward-

18
dipping growth fault (Figure 6 and 10). According to Weimer et al. (1998), the study
area was under a lower bathyal environment (biofacies Zone 5) during the Late Pliocene
to Early Pleistocene periods. After 0.6 Ma, it can be interpreted from isochron maps and
the results of seismic facies analysis that salt evacuation was ceased from the central part
of the basin and shelf/slope break prograded near the study area, so that bypass, slide and
slump sediments are commonly recognized in the younger sequences.
Fi
gure
9. U
nsta
ble
prog
rada
tiona
l she
lf m
argi
n (m
odifi
ed fr
om W
inke
r, 1
984)
. Lab
eled
is th
e in
ferr
ed b
asio
nal p
ositi
on
for
the
stud
y ar
ea d
urin
g L
ate
Plio
cene
to E
arly
Ple
isto
cene
.
19

20
Figure 10. Isochron maps of the interpreted sequences.

21
3. SEQUENCE STRATIGRAPHY
3.1 Previous Works
3.1.1 Basic Concepts of Sequence Stratigraphy
Sequence stratigraphy is the study of genetic relationships of sediment bodies
within a chronostratigraphic framework (Van Wagoner, et. al, 1990). The depositional
sequence, which is the basic stratigraphic unit in sequence stratigraphy, is composed of
genetically related sediment packages bounded by unconformities or their correlative
conformities (Mitchum et al., 1977). Each depositional sequence is considered to have
been deposited during one cycle of relative sea level change, and its boundaries usually
form during the relative sea level fall (Mitchum and Van Wagoner, 1991). Depositional
sequences consist of systems tracts. Brown and Fisher (1977) defined systems tracts as
“the linkage of contemporaneous depositional systems.” Each systems tracts is deposited
during a specific phase of sea-level cycle and can be defined and characterized by its
bounding surfaces, stratal geometry, position within the sequence, and stacking patterns
of parasequences and parasequence sets (Haq, 1991). There are four types of system
tracts: lowstand, transgressive, highstand, and shelf-margin systems tracts. Through
sequence stratigraphic analysis, a chronostratigraphic framework can be built, upon
which the prediction of lithologies and depositional environments of systems tracts are
more or less possible (Vail, 1987). Therefore, sequence stratigraphic analysis should be
performed prior to undertaking seismic facies analysis, and its applications with seismic
facies analysis are especially useful to locate reservoir, source and seal rocks in any
hydrocarbon explorations (Van Wagoner, et al., 1991).

22
3.1.2 Depositional Sequence in deep water setting
Figure 11 shows a schematic cross section with the stratal geometry and sequence
stratigraphic relations in shelf-break and deepwater setting from the northern Gulf of
Mexico (after Wagner et al., 1994). As the rate of eustatic sea level fall outpaces the rate
of subsidence, the relative sea level starts to fall, accommodation space decreases, and
shoreline retrogrades to basinward. When the relative sea level falls below or near shelf
break, most of the shelf area is sub-aerially exposed and more terrigenous sediments are
transported down to slope and basin floor as gravitational deposits. As the relative sea
level rises again, the shoreline retreats to landward again, most sediments are confined in
the shelf area and only pelagic and hemipelagic sediments can be deposited in the slope
area. These pelagic and hemipelagic sediments are deposited very widely, draping the
outer shelf, slope and basin floor with consistent thickness and resulting in a condensed
interval.
The complete depositional sequence in deepwater environments has been
described as a fining-upward succession of depositional strata, which is composed of
basin floor fan, slope fan, prograding complex, and condensed section (Vail and
Wornardt, 1990; Mitchum et al., 1990; Pacht et al., 1990; Yielding and Apps 1994;
Villamil et al., 1998). Figure 12 shows the critical well-log pattern for the deepwater
depositional sequence, in which the sequence boundary usually coincides with the first
occurrence of the sand-prone sediment above the underlying shale-prone condensed
section (Yielding and Apps, 1994). According to Mitchum et al. (1991), the prograding
complex can be deposited from the shelf break to the distal part of the basin, in which it
is thinning basinward. In the distal part of the basin, it might be difficult to differentiate
the prograding complex from the underlying slope fan sediments due to the slow
sedimentation rate in deepwater settings. Walker (1992) emphasized that the condensed
sections usually directly overlie a basin floor fan and slope fan in the Mississippi fan
area. Weimer et al. (1998) also reported that prograding complex, transgressive and
highstand systems tracts are usually represented by condensed sections in slope basins

23
Figure 11. Depositional model in salt withdrawal mini-basin, Gulf of Mexico (after Weimer et al., 1998). cs: condensed section; cls: channel levee system; bff: basin floor fan.

24
Figure 12. Schematic diagram showing the typical well-log expression of the deepwater depositional sequence in Gulf of Mexico (after Yielding and Apps, 1994).

25
in the Gulf of Mexico (Weimer et al., 1998). Therefore, basin floor fan, slope fan, and
condensed sections commonly represent depositional sequences in deep-water
environment.
3.2 Sequence Stratigraphic Analysis
3.2.1 Identification of Sequence Boundaries and Condensed Sections
As stated earlier, the depositional sequence in deep water setting usually consists
of lowstand systems tracts and condensed sections deposited during the late stage of
lowstand, transgressive and highstand systems tracts. Sequence boundaries in deepwater
setting are not usually represented as erosional unconformities, but rather form parallel
conformities to the underlying condensed intervals. They may be regarded as contact
surfaces between the upper limit of condensed intervals and the base of the overlying
lowstand systems tract. Therefore, it is valuable to identify condensed intervals prior to
identifying sequence boundaries. For this study, well logs and biostratigraphic data were
mainly used to identify condensed sections and sequence boundaries.
During the deposition of condensed sections, the starvations of terrigenous
sediments occur in the deepwater environment. As a result, terrigenous sediments are
very limited in deep water environment, and faunal abundance and diversity increase
abruptly. Thus, fossil abundance and diversity curves are the most reliable sources in
defining the condensed interval (Shaffer, 1990). Paleo-top information is the first
downhole occurrence depth of a particular species in a borehole, which may not be its
true extinction time (Vail and Wornardt, 1991). But empirical, paleo-top data occur in or
near condensed sections, especially in the Gulf of Mexico (Shaffer, 1990). In this study,
paleo-tops were widely used locating condensed intervals.
In well logs, condensed sections may be characterized by high radioactivity, high
neutron porosity, low density, low sonic velocity, and low resistivity, because condensed
sections mainly composed by hemipelagic or pelagic sediments that contain significant
26
amount of organic matter, and exotic elements such as sulphides, glauconite, phosphate,
and iridium (Rider, 1995). The marine organic matter has usually very high uranium
content, which is one of the radioactive elements measured by the gamma ray tool, so
that condensed sections can be characterized by higher radioactivity than other mud
dominant sediments (Figure 13). Figure 14 shows the cross-plot of gamma ray (GR),
spontaneous potential (SP), and resistivity (ILD) logs of Well 358-1, where the magenta
rectangle covering the area of high GR, high SP and low resistivity indicates possible
condensed sections. However, the green rectangle covering the area of high GR, low
resistivity and low SP value is interpreted as sand zones containing some radioactive
materials. If only the GR log was used, this interval showing high GR but low SP values
cannot be differentiated from the condensed intervals. In Well 358-1, the selected
condensed intervals have high GR and SP, and low resistivity. In Well 351-1, the
intervals having high neutron, high GR and low density are selected as condensed
sections (Figure 15). Therefore, it is preferable to use whole suites of log data to identify
condensed sections. Whole suites of logs were not available for all wells used in this
study, so that only the well-log data available were used instead to define possible
condensed intervals.
The locations of possible condensed sections identified using the cross-plot
method were marked with biostratigraphic data including fossil abundance and diversity
curves and paleo-tops for each well (Figures 16, 17 and 18). If these intervals selected
from the well logs are well correlated with biostratigraphic data, they can be interpreted
as condensed sections. In some intervals these two data are not well matched because of
the difference between the resolutions of data sets used. The vertical resolution of the
fossil data used for this study is no less than 90 ft as they were sampled every 90 ft,
while the vertical resolution of the gamma ray tool is about 3 ft. Therefore, if the depth
differences between well logs and paleo-top information are less than 90 ft, they can be
accepted as the allowable margin of errors.
Sequence boundaries were interpreted based on the locations of condensed
intervals and well log shapes. Condensed intervals located through the integrated
27
Figure 13. Characteristic log response for condensed interval (After Reider, 1995).

Figu
re 1
4. C
ross
-plo
t of
GR
, SP,
and
res
istiv
ity l
ogs
for
Wel
l 35
8-1.
Pur
ple
squa
re i
ndic
ates
the
are
a of
con
dens
ed
sect
ion;
gre
en s
quar
e in
dica
te th
e ar
ea o
f low
SP
and
high
GR
inte
rpre
ted
as r
adio
activ
e sa
nd; r
ed s
quar
e in
dica
te th
e ar
ea o
f hig
h re
sist
ivity
, low
SP,
and
low
GR
inte
rpre
ted
as p
ossi
ble
hydr
ocar
bon-
bear
ing
inte
rval
.
28
Figu
re 1
5. C
ross
plo
t of G
R, d
ensi
ty, a
nd n
eutr
on lo
gs fo
r W
ell 3
51-1
. The
are
as o
f pur
ple
are
inte
rpre
ted
as p
ossi
ble
cond
ense
d in
terv
als w
ith lo
w d
ensi
ty, h
igh
neut
ron
and
high
GR
.
29
30
Figure 16. Condensed section (hatched interval) and sequence boundary (dashed line) interpretation for Well 350-1. SB: sequence boundary; LAD: last appearance datum; Nan Ab.: calcareous nannoplankton abundance.

31
Figure 17. Condensed section (hatched interval) and sequence boundary (dashed line) interpretation for Well 350-2. SB: sequence boundary; LAD: last appearance datum; Nan Ab.: calcareous nannoplankton abundance.

32
Figure 18. Condensed section (hatched interval) and sequence boundary (dashed line) interpretation for Well 358-1. SB: sequence boundary; LAD: last appearance datum; Nan Ab.: calcareous nannoplankton abundance.

33
approach using well logs and biostratigraphic data provided essential information to
define sequence boundaries from the study area. The bases of sandy sediments occurring
above condensed sections were interpreted as sequence boundaries (Figure 19). Some
condensed sections occurring in the middle of shale-prone sediments are not related with
sequence boundaries. In those cases, they are interpreted as internal condensed sections
deposited on the slope fans. Internal condensed sections were observed in two sequences
(1.9-1.4 Ma and 1.4-1.1 Ma sequences). Interpreted sequence boundaries from well logs
and biostratigraphic data were correlated with 3-D seismic data using time-depth
information (Figure 20). The interpreted sequence boundaries were usually matched with
the reflectors with high amplitude and high coherency, which might be interpreted as
condensed sections. On the seismic sections it is difficult to differentiate sequence
boundaries from condensed sections because of the limited seismic resolution. The tops
of the seismic reflectors corresponding to condensed sections were accepted as sequence
boundaries and used to interpret 3-D seismic volume.
3.2.2 High-resolution Biostratigraphy and Cycle Charts
The recognized sequences can be correlated with the globally recognized cycle
charts of the eustatic sea-level curves (Haq et al., 1988). The planktonic foraminifera and
calcareous nannofossils are very important as the standard of reference for dating Late
Cenozoic sediments on a global scale. However, the benthic foraminifera, whose habitat
is largely controlled by facies and depositional environment, are much less reliable
(Mitchum et al., 1990). Thus, they are used only when the other fauna information are
not available. For this study calcareous nannofossils were preferentially used to define
condensed sections and date the age of sequence boundaries. However, calcareous
nannofossil data are available only for three wells (Table 1), so that for the wells for
which nannofossils are not available, benthic foraminifera were used instead.

Figu
re 1
9. W
ell l
og c
orre
latio
n fla
tten
ed b
y 0.
5 M
a se
quen
ce b
ound
ary.
34

Fi
gure
20
. Se
ism
ic
sect
ion
cros
sing
si
x w
ells
sh
owin
g se
quen
ce
boun
dari
es
inte
rpre
ted
from
w
ell
logs
an
d bi
ostr
atig
raph
ic d
ata.
For
eac
h w
ell p
aleo
-top
s an
d w
ell l
ogs
incl
udin
g G
R (
left
) an
d re
sist
ivity
(ri
ght)
are
dis
play
ed.
Pale
o to
ps g
ener
ally
occ
ur n
ear
the
sequ
ence
bou
ndar
ies.
See
Figu
re 1
for
wel
l loc
atio
ns.
35
36
Interpreted sequence boundaries were correlated with the Neogene biostratigraphic
zonation and coastal onlap chart of the Gulf of Mexico (Figure 21: Paleo-Data, Inc.,
1993). The periods of Plio-Pleistocene cycles from 5.5 Ma to 0.8 Ma are about 0.4 m.y.
to 0.5 m.y.(third-order) and Late Pleistocene sediments younger than 0.8 Ma are
characterized by very rapid glacio-eustatic cycles with periods of about 100,000 years
(fourth-order). Four 3rd-order and two 4th-order sequences were interpreted from this
study.
3.2.3 Sequence Stratigraphic Analysis
Regional sequence stratigraphic analysis including the study area has been
performed and published by Weimer et al. (1998). However, no detailed stratigraphic
study using 3-D seismic data was published. Seven sequence boundaries (2.4 Ma
through 0.6 Ma) were interpreted mostly from paleo-tops, fossil abundance curves and
well log data. Sediments older than the 2.4 Ma sequence boundary are not differentiable
from seismic data, so they were excluded from this study. Also, the sequences above the
0.6 Ma, sequence boundaries could not be interpreted with confidence, because only
limited well data and biostratigraphic data (only one well has paleo-top information for
this age) were available (Table 1).
Most seismic sequences are convergent, thinning toward salt highs in the east-west
direction and wedge-shape and thickening to basinward in the north-south direction
(Figures 4 and 6). Overall, most sequences show a fining-upward pattern, in which
coarse sediments tend to be deposited in the lower part of the sequence, and the upper
parts of them are dominated by shale-prone sediment topped by hemipelagic and pelagic
sediments (Figure 19). Sequences formed after 1.4 Ma sequence boundary consist of
mud-prone sediments and condensed sections, for which the sedimentation of sand-
prone deposits significantly decreased. Sea level change does not significantly affect
deepwater environments where sediments are not subaerially exposed, even in low-sea

Figu
re 2
1. P
lio-P
leis
toce
ne b
iost
ratig
raph
ic z
onat
ion
and
coas
tal o
nlap
cur
ves,
Nor
ther
n G
ulf o
f Mex
ico
(aft
er P
aleo
-D
ata
Inc.
, 199
3).
37
38
level stages. Overall, sequence boundaries are conformable with underlying and
overlying sediments. However, some sequence boundaries were partly or fully eroded by
overlying channel features (ex: 1.9 and 0.8 Ma sequence boundaries) or by bypass
sediments or submarine canyons in the upper slope (ex: 0.6 Ma sequence boundary;
Figure 20). The erosional surfaces caused by channel, slide, slump and debris flows are
not stratigraphic unconformities in deepwater slope settings (Morton, 1993). Therefore,
they should not be used as sequence boundaries without additional evidences.
After 0.6 Ma, salt evacuation from the central part of the basin resulted in infilling
the salt-withdrawal basin, and the prograding shelf edge approached the study area.
After 0.6 Ma, slump and slide sediments caused by shelf and slope failure were
plentifully supplied and erosional surfaces caused by sediment bypass are commonly
observed in upper slope area.

39
4. SEISMIC FACIES ANALYSIS
The definition of facies analysis is given by Anderton (1985) as the description
and characterization of sediment bodies, which can be interpreted in terms of
depositional process and depositional environment. For this purpose, sedimentary rocks
can be classified by their specific characteristics such as lithology, composition, color,
geometry, sedimentary structures, and fossil contents (Pirrie, 1998). Thus, seismic facies
analysis can be defined as the study of the description and classification of seismic data
into different seismic packages, which are distinguished by specified characteristics from
adjacent reflectors. In seismic data, parameters like reflection configurations and various
seismic parameters including amplitude, continuity, phase, frequency, and interval
velocity are frequently used to describe and characterize these seismic units (Vail et al.,
1997). These parameters can be used to infer the geological information on lithology and
depositional process and environment, which is one of the main purposes of seismic
facies analysis. Even though there is no unique relationship between specific seismic
parameters and litho-facies, reasonable geological information such as depositional
environment and lithology can be extracted from seismic facies analysis when combined
with well logs, cuttings descriptions and paleo-data (Whittaker, 1998). In this study,
seismic reflection characteristics including amplitude, coherency, and reflection
configuration were examined for each sequence interpreted on vertical seismic sections,
through which five distinctive seismic facies were identified (Figure 22 and 23).
In the conventional method, every seismic facies should be mapped in plan view to
see its lateral variations and relationships each other. However, 3-D seismic volumes
provide an easier and more effective method, called the horizon-slice technique, with
which the lateral variations of the interpreted seismic facies in a certain time interval can
be traced and described systematically. Seismic volume flattened by reference horizons
including sequence boundaries or condensed sections is used for this purpose. These
kinds of horizon slices are time equivalent surfaces and show the lateral
Figu
re 2
2. S
eism
ic fa
cies
ana
lysi
s fro
m st
rike
-ori
ente
d se
ism
ic se
ctio
n. S
ee F
igur
e 4
for
loca
tion
of se
ism
ic se
ctio
n.
SF:
se
ism
ic fa
cies
.
40
Figu
re 2
3. N
E-S
W t
rend
ing
seis
mic
sec
tion
show
ing
the
six
seis
mic
fac
ies
iden
tifie
d fr
om t
he v
ertic
al s
eism
ic s
ectio
ns.
See
Figu
re 4
for
loca
tion
of se
ism
ic se
ctio
n. S
F: se
ism
ic fa
cies
.
41

42
variations of seismic facies. When sequence boundaries were erosional surfaces,
condensed sections were used as reference horizons to make slices parallel with the
stratigraphic surfaces.
4.1 Vertical Seismic Facies
Seismic facies analysis was carried out for 6 sequences (2.4-1.9, 1.9-1.4, 1.4-1.1,
1.1-0.8, 0.8-0.7, and 0.7-0.6 Ma) using vertical seismic sections to cluster seismic data
into different seismic facies that could be characterized by specific seismic parameters.
The overall geometries of seismic facies were controlled by the paleo-geography. Six
different seismic facies were defined based on amplitude, coherency, and reflection
configuration and their seismic characteristics were described on the basis of vertical
seismic sections (Figure 22 and 23).
4.2 Horizon Slices
Horizon slices were used to examine the lateral variation of the seismic facies.
They are very effective to describe stratigraphic features, especially laterally confined
sediments. Horizon slices were made using the interpreted sequence boundaries or
condensed sections. The 3D seismic volume was flattened by reference horizons and
then this flattened seismic volume was sliced parallel with reference horizons (Figure
24). As the thickness of each sequence changes significantly in the vertical section,
horizon slices can be generated in the limited time interval from the reference horizons.
The effective intervals are different for each sequence, but the interval decreases with
the depth of sequences. If the horizon slices were cut obliquely to the seismic reflectors,
the oblique cut might look like the real stratigraphic features. Therefore, the stratigraphic
features interpreted from the horizon slices should be confirmed with the vertical seismic
sections. Sequence boundaries showing erosional features cannot be used as reference
horizons, because these surfaces are not parallel with the ancient stratigraphic surfaces,
43
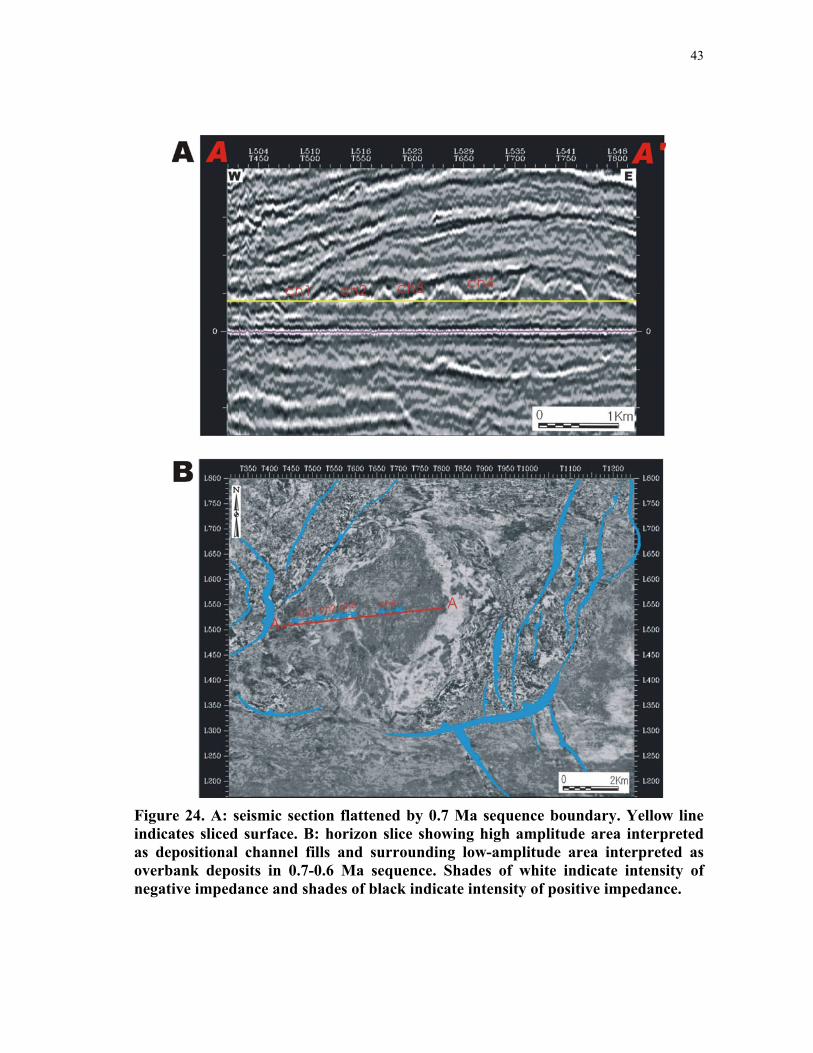
Figure 24. A: seismic section flattened by 0.7 Ma sequence boundary. Yellow line indicates sliced surface. B: horizon slice showing high amplitude area interpreted as depositional channel fills and surrounding low-amplitude area interpreted as overbank deposits in 0.7-0.6 Ma sequence. Shades of white indicate intensity of negative impedance and shades of black indicate intensity of positive impedance.

44
and horizon slices created by these surfaces cannot reveal the real stratigraphic features.
Therefore, when sequence boundaries were erosional surfaces, condensed intervals were
used as reference horizons instead to make horizon slice parallel with stratigraphic
surfaces.
4.3 Seismic Facies Descriptions
Seismic Facies A
Seismic facies A is characterized by subparallel, high amplitude and poor
coherence of reflectors containing concave upward pattern (Figures 22 and 23). This
seismic facies commonly occurs in the lower part of the sequences (including 1.9 - 2.4
Ma, 1.4 - 1.9 Ma, 0.8 - 0.7 Ma, and 0.7 - 0.6 Ma) and especially well developed in the
2.4 -1.9 Ma sequence, which is interpreted as one of the most sand-dominant facies in
the study area. The well logs for this facies usually show a bell or cylinder shape. On
vertical seismic sections, this facies changes laterally to seismic facies B, which is
characterized by subparallel, low-amplitude, moderate-coherence of seismic reflections.
In plan view, they area represented by sinuously elongated high-amplitude areas
trending NE-SW or NW-SE and usually surrounded by a low-amplitude area (Figures 24,
26, and 27).
Seismic Facies B
Facies B occurs in the 1.9 - 2.4 Ma, 1.4 - 1.9 Ma, 0.8 - 0.7 Ma, and 0.7 - 0.6 Ma
sequences, located laterally near or adjacent to seismic facies A and characterized by
subparallel, low-amplitude, moderate coherence of seismic reflection patterns (Figure 22
and 23). Well logs show mud-prone sediments deposited for these intervals, but serrated
patterns were also observed when thin sands were intercalated (Figure 25). In horizon
slices, this facies is represented as a broad, low-amplitude area without significant
variation. Seismic facies A usually developed within this seismic facies (Figure 26 and
27).
45
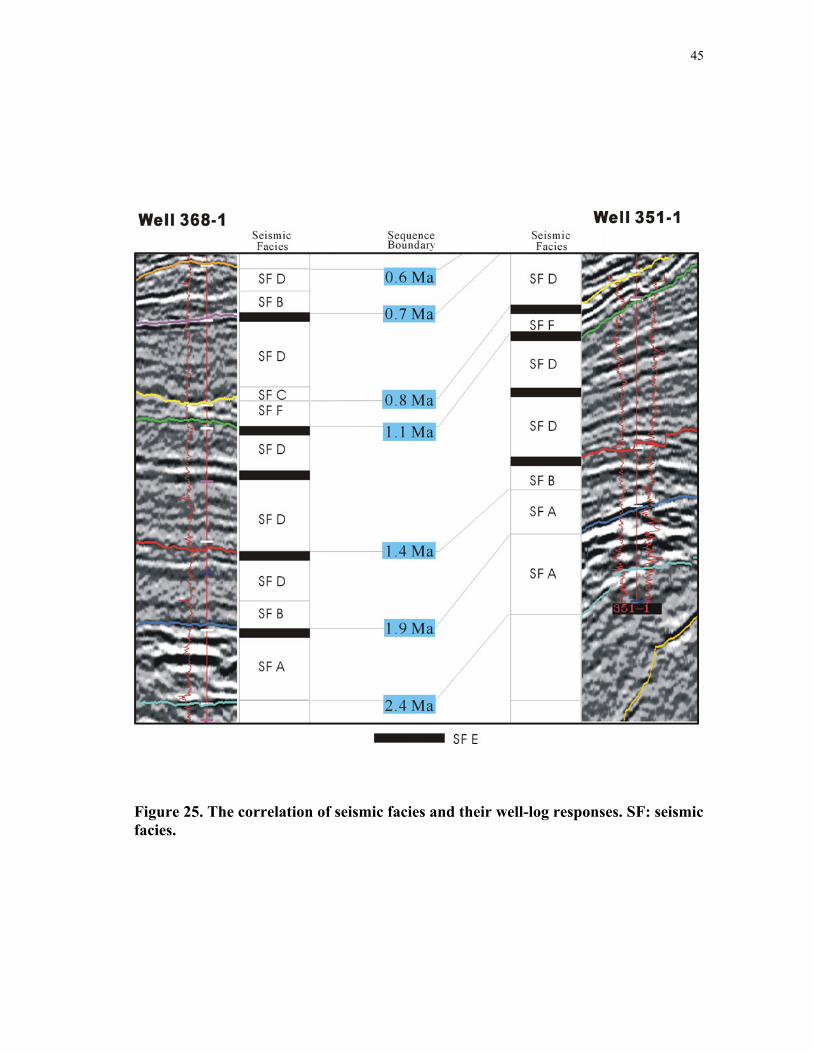
Figure 25. The correlation of seismic facies and their well-log responses. SF: seismic facies.

46
Figure 26. A: horizon slice showing depositional channel fills and overbank facies in 2.4-1.9 Ma sequence. B: RMS amplitude display. Purple indicates high-amplitude area interpreted as depositional channel fills and green indicates low-amplitude area interpreted as overbank area.

47
Figure 27. Horizon slice showing depositional channel fills and overbank facies developed in 1.4-1.1 Ma sequence. Shades of white indicate intensity of negative impedance and shades of black indicate intensity of positive impedance.

48
Seismic Facies C
Facies C is observed only in the 0.8 - 0.7 Ma sequence, where it is a concave-up
erosional feature cut into the lower sequence boundary (Figures 22 and 23). The upper
part of the underlying sequence was eroded and then was filled by a seismic unit
characterized by a low amplitude, low coherency and subparallel pattern, interpreted as a
mud-dominant facies. This seismic facies was formed in the early stage of lowstand in
relative sea level and is much bigger in scale than seismic facies A. A horizon slices cut
through this facies show that this facies trends from north to south and is filled by a low-
amplitude area (Figure 28). It is less clear on horizon slice than seismic facies A and
defined as low amplitude area with linear features surrounded by a high-amplitude area.
Well 368-1 only penetrated this facies where well log responses indicate a mud-
dominant sedimentation (Figure 25).
Seismic Facies D
Seismic facies D is characterized by parallel-to-subparallel, low amplitude, high
coherency patterns that are commonly deposited above seismic facies A and B and
underlain by seismic facies E (1.9 - 1.4 Ma and 1.4 - 1.1 Ma sequence). This facies is
deposited widely over the basin and filled the basin with mud-dominant sediments. The
typical shape of well logs from this facies is similar with the well log patterns from
seismic facies B, which is represented as a thick shale interval; but when thin channel
sands are intercalated, serrated pattern will occur. In plan view, facies B is characterized
by a broad, low-amplitude area without significant amplitude variations (Figure 29).
Seismic Facies E
Facies E is described by parallel, high-amplitude, high-coherency of seismic
characteristics (Figures 23 and 24). It shows very continuous thickness throughout the
study area, indicating that its external shapes were not controlled by paleo-geometries.
These seismic patterns are mainly observed in the uppermost part of each sequence and
underlain directly by sequence boundaries. In horizon slices, this facies is represented
49
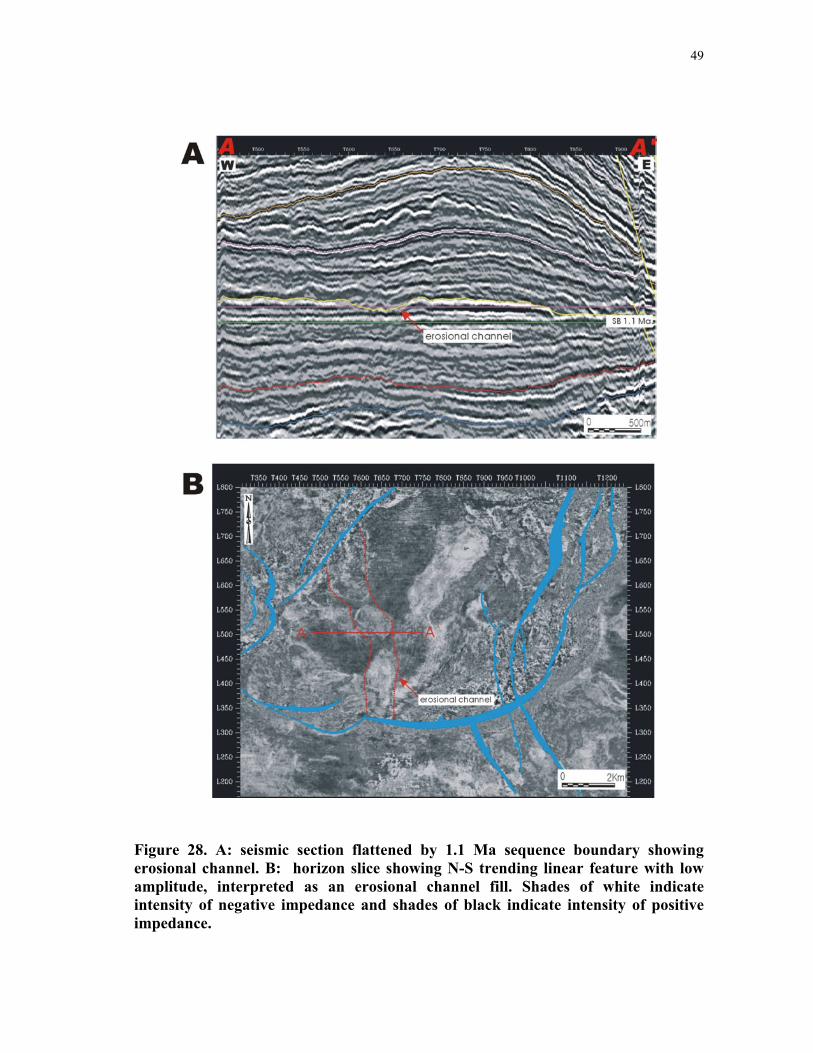
Figure 28. A: seismic section flattened by 1.1 Ma sequence boundary showing erosional channel. B: horizon slice showing N-S trending linear feature with low amplitude, interpreted as an erosional channel fill. Shades of white indicate intensity of negative impedance and shades of black indicate intensity of positive impedance.
50
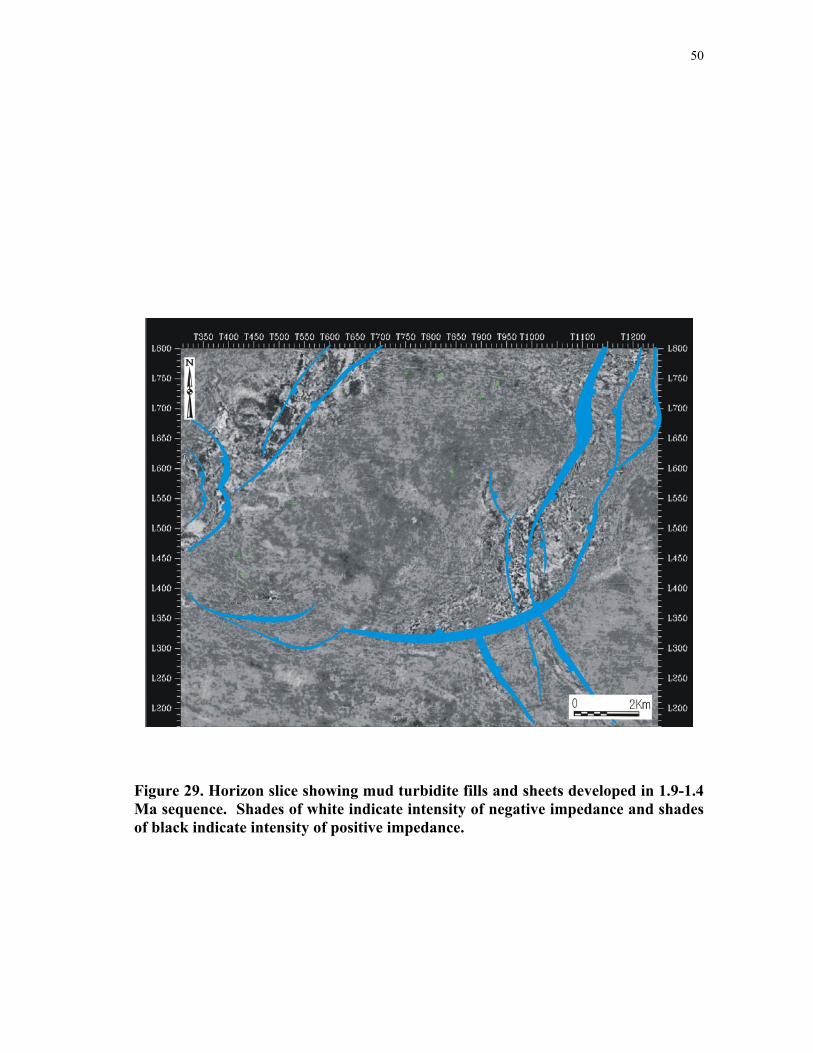
Figure 29. Horizon slice showing mud turbidite fills and sheets developed in 1.9-1.4 Ma sequence. Shades of white indicate intensity of negative impedance and shades of black indicate intensity of positive impedance.

51
as widespread, high-amplitude area (Figure 30). In well data, it is represented as high
gamma ray and high fossil contents and diversities interpreted as condensed section
(Figures 25 and 16-18).
Seismic Facies F
Seismic facies F is observed only in the lower part of 1.1-0.8 Ma sequence, where
it is overlain by seismic facies E. It shows the seismic reflection characteristics of high
amplitude and high coherency with mound-shape features. This mound-shaped feature
downlaps onto the underlying sequence boundary (Figure 31). In the horizon slices, it is
represented by a limited high-amplitude area. In the southern and eastern parts of the
basin, its boundary was interpreted, but to the north and west it was not clear. In Figure
31, its amplitude value changes from peak to trough because its thickness becomes
thinner to the westward. Its termination boundary is interpreted using both vertical
seismic sections and horizon slices. This facies is expected to be composed of sand
prone sediment represented by blocky well logs, but all wells available penetrated the
marginal parts of this facies and their log responses show no distinct sand packages.
4.4 Facies Models and Depositional Environments
The intraslope basin in the Gulf of Mexico was mainly filled by sand and mud
turbidites and pelagic and hemipelagic sediments (Bouma et al., 1990). Mutti and
Normark (1991) described turbidite systems deposited in slope basins by five different
turbidite elements that are basic building blocks of turbidite systems and can be
recognized and mapped in marine, outcrop, and subsurface studies (Mutti and Normark,
1991). Turbidite elements can be explained as the genetic facies or facies associations
that can be distinguished from adjacent strata and are commonly found from ancient and
modern turbidite systems (Mutti and Normark, 1991). Their turbidite elements include
(1) major erosional features, (2) channels, (3) overbank deposits, (4) lobes, and (5)
channel-lobe-transition deposits. In 1998, Galloway defined slope basin turbidite

52
Figure 30. Horizon slice showing hemipelagic and pelagic fills from 0.8-0.7 Ma sequence. Shades of white indicate intensity of negative impedance and shades of black indicate intensity of positive impedance.

53
Figure 31. A: seismic section showing turbidite lobe sediment downlapping onto underlying sequence boundary. B: horizon slice showing turbidite lobe developed in 1.1-0.8 Ma sequence. Red dotted line indicates the edge of the turbidite lobe interpreted from vertical seismic section and horizon slice. Shades of white indicate intensity of negative impedance and shades of black indicate intensity of positive impedance.

54
systems into seven basic turbidite facies: (1) turbidite channel fills, (2) turbidite lobes,
(3) sheet turbidite, (4) slide, slump, and debris-flow sheets, lobes and tongues, (5) fine-
grained turbidite fills and sheets, (6) contourite drifts, and (7) hemipelagic drapes and
fills. Though Galloway did not use the term “turbidite element” in his paper, the
meaning of his turbidite facies can be regarded as same one as Mutti and Normark’s.
This study used the term “turbidite element”, but Galloway's classification was
generally accepted with some modifications that were added to describe the turbidite
system more efficiently. Seismic facies interpreted with the seismic sections and horizon
slices were integrated with lithologic information to correlate with turbidite elements
(Table 2). During 2.4 - 0.6 Ma, six different seismic facies were identified from seismic
facies analysis and these seismic facies were interpreted into five types of turbidite
elements: (1) depositional channel fills and overbank deposits, (2) erosional channel fills,
(3) mud-turbidite fills and sheets, (4) turbidite lobes, and (5) pelagic and hemipelagic
drapes (Table 2).
4.4.1 Depositional Channel and Overbank Deposits
Depositional channel and overbank deposits are the most common sand-prone turbidite
elements in the study area. Depositional channels are dominantly developed in the lower
slope and base of slope, where gravity flows decelerate (Galloway, 1998). Three
depositional channels and overbank deposits were identified from the study (Figure 32).
During the 0.7-0.6 Ma sequence, the study area is inferred to have been located in the
mud-dominant upper slope environment, in which a typical levee channel overbank
system could be deposited. These levee channels are highly sinuous, characteristics of a
very low gradient and mud-dominant depositional slope (Clark et al., 1992).
Their lateral variations are very well defined by a series of horizon slices (Figure
33), which proves that the horizon-slice method is invaluable to define the geometries of
channels. Two depositional channels trending NNE-SSW and NW-SE directions were
described by Figure 33. The other depositional channels are deposited in 2,4-1.9 and 1.9-

Tab
le 2
. Sei
smic
faci
es a
nd c
hara
cter
istic
s of t
urbi
dite
ele
men
ts.
Seis
mic
fa
cies
Se
ism
ic fa
cies
from
ve
rtic
al se
ism
ic se
ctio
ns
Seis
mic
faci
es fr
om
hori
zon
slic
es
Wel
l log
pat
tern
s an
d lit
holo
gy
Turb
idite
Ele
men
t
A
Hig
h am
plitu
de, l
ow c
oher
ency
an
d co
ncav
e up
war
d
Elon
gate
d si
nuou
s, hi
gh
ampl
itude
are
a su
rrou
nded
by
broa
d lo
w a
mpl
itude
are
a B
ell o
r blo
cky
shap
e D
epos
ition
al c
hann
el
fills
B
Low
am
plitu
de, m
oder
ate
cohe
renc
y, a
nd su
b pa
ralle
l
Bro
ad lo
w a
mpl
itude
are
a oc
curr
ing
with
sinu
ous h
igh
ampl
itude
are
a
Mud
dom
inan
t or s
erra
te
patte
rn
Ove
rban
k
C
Low
am
plitu
de, l
ow c
oher
ency
an
d su
b pa
ralle
l with
con
cave
up
war
d sh
pae
Line
ar lo
w a
mpl
itude
are
a su
rrou
nded
by
high
am
plitu
de
area
Mud
dom
inan
t or s
erra
te
patte
rn
Eros
iona
l cha
nnel
fil
ls
D
Para
llel,
low
am
plitu
de, a
nd
mod
erat
e co
here
ncy
Bro
ad fa
ir to
low
am
plitu
de
area
with
out s
igni
fican
t va
riatio
ns
Mud
dom
inan
t or s
erra
te
patte
rn
Mud
turb
idite
fills
an
d sh
eets
E Pa
ralle
l, hi
gh a
mpl
itude
, hig
h co
here
ncy
Wid
e sp
read
hig
h am
plitu
de
area
“Hot
shal
e”
(hem
ipel
agic
and
pel
agic
sh
ale)
Hem
ipel
agic
and
pe
lagi
c dr
apes
F M
ound
shap
e, h
igh
ampl
itude
, h
igh
cohe
renc
y Li
mite
d hi
gh a
mpl
itude
are
a C
ylin
der t
ypes
exp
ecte
d bu
t no
wel
ls p
enet
rate
d in
this
ar
ea (s
and
pron
e)
Turb
idite
lobe
s
55
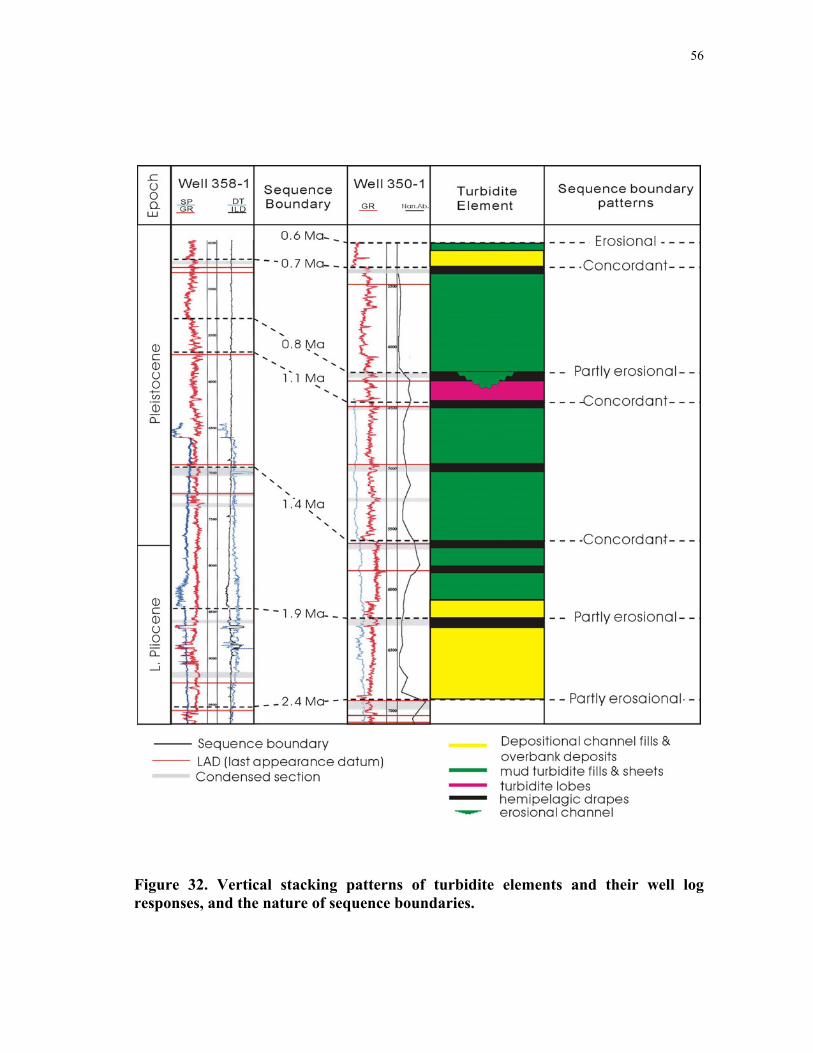
56
Figure 32. Vertical stacking patterns of turbidite elements and their well log responses, and the nature of sequence boundaries.

57
1.4 sequences (Figures 26 and 27). The geometries of these channel fills are not clear on
the horizon slices, because of low seismic resolution and the complicated structures of
these sequences. However, their general trends can be defined by high-amplitude
anomalies, which trend the NE-SW direction (Figure 27). A root mean square (RMS)
amplitude map of 1.9-2.4 Ma sequence shows a high-amplitude area (blue and pink
color) trending NE-SW, which is consistent with the high amplitude distribution on the
horizon slice and can be interpreted as a sand-prone depositional channel system. The
coarse-grained channel fills incased in shale-prone overbank sediments are probably
represented by the relatively high amplitude, because of their big impedance difference.
Stelting et al. (1985) reported a similar example from the modern channel system. Well
log responses of these channels show fining upward or blocky sand bodies. The coarsest
sediment supplied into modern fans is generally located in channels themselves (Stelting
et al., 1985).
Overbank deposits are generally fine-grained and thin-bedded turbidite sediments
that can be laterally extensive and are adjacent to the main channels in a turbidite system.
On seismic sections they show the seismic patterns consisted of low-amplitude,
subparallel and moderate-to-fair coherence of reflectors. Well-log curves measured in
overbank intervals are interpreted as shale-dominant sediments interbeded with thin
sands or silt sediments. Figure 33 shows that a series of horizon slices of seismic facies
A and B, in which overbank sediments were represented as low-amplitude areas
deposited as unconfined flows filling the interchannel area. This channel, levee and
overbank system is very well developed and well defined from both seismic section and
horizon slices (Figure 27).
4.4.2 Erosional Channel Fills
Erosional channels are usually common in the upper slope, where the high
downward slope accelerates the gravity flows (Galloway, 1998). In this study, only one
erosional channel system (seismic facies E) was defined in the 0.8-0.7 Ma sequence
where an erosional channel cut into the underlying sequence (Figure 28). During the
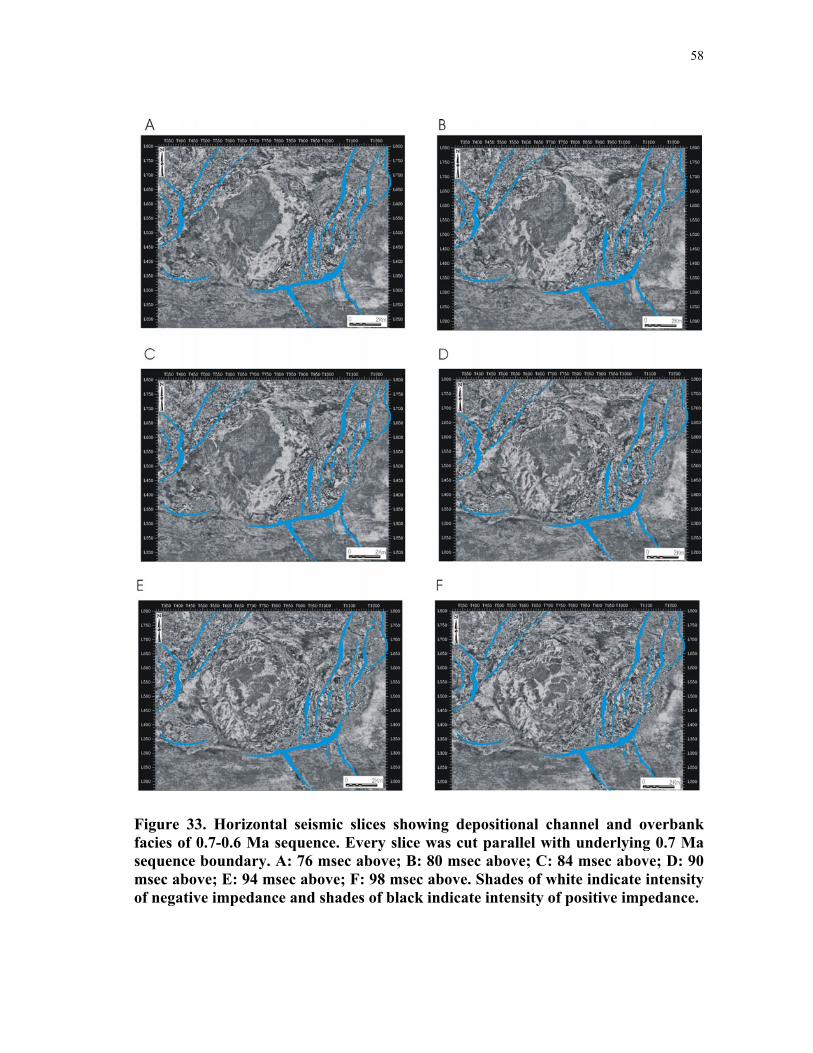
58
Figure 33. Horizontal seismic slices showing depositional channel and overbank facies of 0.7-0.6 Ma sequence. Every slice was cut parallel with underlying 0.7 Ma sequence boundary. A: 76 msec above; B: 80 msec above; C: 84 msec above; D: 90 msec above; E: 94 msec above; F: 98 msec above. Shades of white indicate intensity of negative impedance and shades of black indicate intensity of positive impedance.
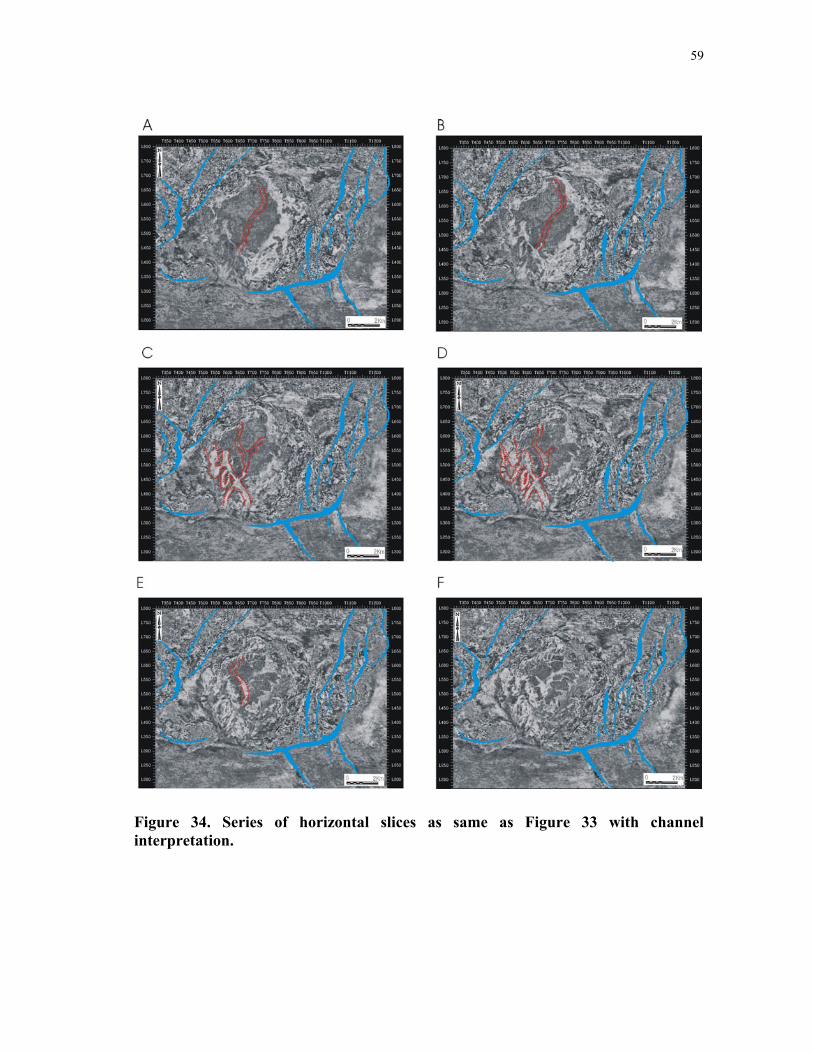
59
Figure 34. Series of horizontal slices as same as Figure 33 with channel interpretation.
60
early time of the lowstand stage, these channels might have been used as conduits to the
downdip slope basin. The erosional channel is easily defined on the vertical seismic
sections by its erosional features, but the horizon slice of these channels could not reveal
the clear feature of these erosional channel fills (Figure 28), because the erosional
channel was thought to be filled by shale dominant sediments and those shale-prone
channel bodies could not be easily differentiated from the adjacent shale prone
condensed sections. This facies trends a north-south direction with less sinuosity and
greater width than depositional channels.
4.4.3 Mud Turbidite Fills and Sheets
This turbidite element is interpreted to fill and deposits in slope depressions, and it
frequently laps out against bathymetric highs. Well-log responses for this element show
that it is mud-dominant facies, but may be serrated if interbedded by silt/sand. Figure 29
shows the horizon slice that was cut parallel to the 1.4 Ma sequence boundary at 56 msec
above the 1.4 Ma sequence boundary. It cut seismic facies D (Figure 23 and 24) and
shows widely deposited, low-amplitude, high-coherency seismic characteristics without
significant variation.
4.4.4 Pelagic and Hemipelagic Drapes
Hemipelagic and pelagic sediments typically drape the slope and adjacent basin
floor. On the slope, suspended sediments play a major role during transgression and
highstand in relative sea level. Where sediment accumulation rates are low, hemipelagic
and pelagic sediments will be deposited (Stanley, 1985). Hemipelagic deposits thus form
condensed sections with high radioactivity and high organic content. Seismic facies E is
interpreted as hemipelagic and pelagic drapes. The characteristics of seismic facies E,
characterized by high amplitude reflectors without significant amplitude variation
covering all of the study area, indicate that this facies is deposited very widely, covering
the previous topography with consistent thickness throughout the basin (Figures 22 and

61
23). In horizon slices, this facies shows a very widely deposited high-amplitude area
with good coherency (Figure 30). Most of the sequences were topped by hemipelagic
facies that were deposited during the late stage of the lowstand, transgression and
highstand systems tracts (Figure 32 and 34). This sediment was deposited during most of
the time span of one sea-level cycle, but is represented as thin and mud-dominant
sediments. These sediments are well identified from seismic data that are characterized
by strong, continuous reflectors with consistent thickness. From the well logs, this facies
is well-distinguished by higher gamma ray values from the other mud dominant facies,
and its thickness was usually less than 100 ft in the study area.
4.4.5 Turbidite Lobes
In deep-water settings, turbidite lobes are the most frequently drilled reservoir
facies (Sangree et al., 1990) that are usually deposited directly on the lower sequence
boundary. Turbidite lobes are spatially localized accumulations of sandy dominant
sediments. Stacked deposits of coarse-grained turbidite form mounded lobes that have
relatively restricted aerial distribution. In this study, one-turbidite lobe was interpreted in
the 1.1 – 0.8 Ma sequence. In seismic data the turbidite lobe was shown as the mound
shape seismic reflections with high amplitude and high coherency of seismic reflectors,
downlapping onto the underlying sequence boundary (Seismic facies F). In terms of
seismic patterns, this lobe is similar to hemipelagic drapes. However, hemipelagic
drapes show almost constant thickness throughout the basin and show no lapout features,
while turbidite lobes show mound-shape geometry, downlapping onto the underlying
sequence boundaries. In horizon slices, this lapout feature might be observed as a
changing amplitude and coherency. However, to the north and west, its lapout patterns
are not clear. This lobe also shows a phase change in the horizon slice because it thins
toward eastward. No wells were penetrated in the thick part of this facies where sand-
prone sediments are expected. Several wells were drilled only in the marginal parts of
this facies where the shapes of the logs show mud-prone sediment or serrated log
patterns.
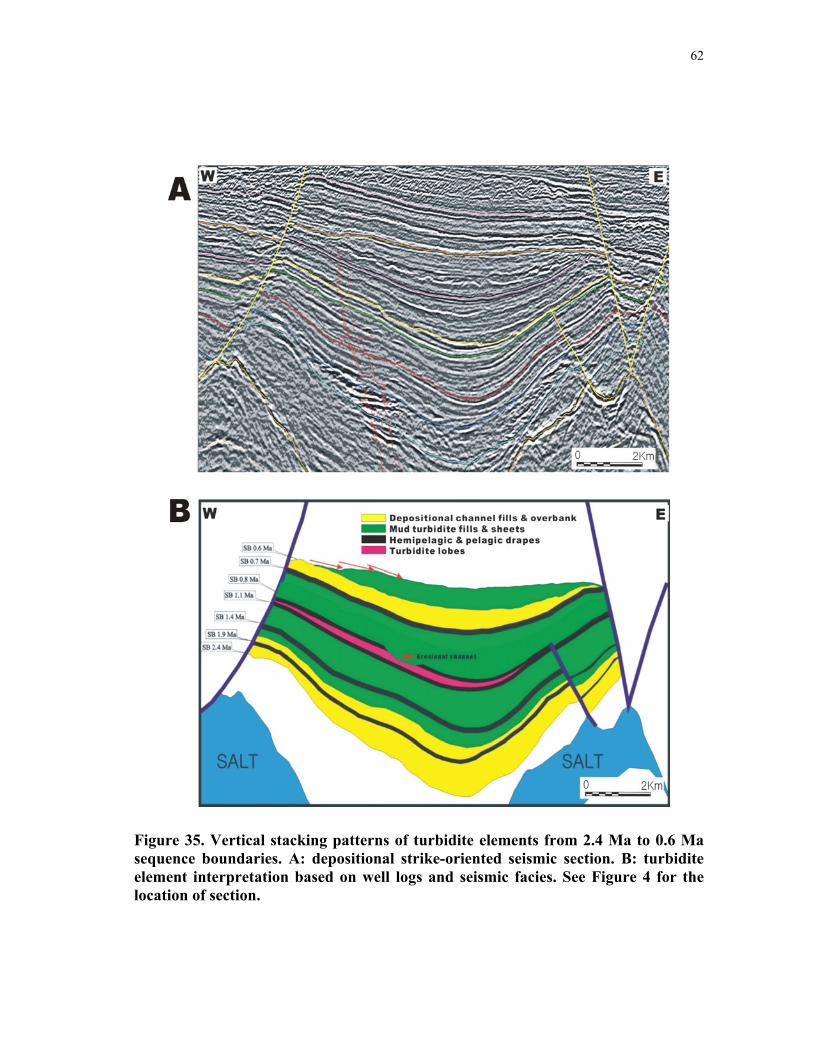
62
Figure 35. Vertical stacking patterns of turbidite elements from 2.4 Ma to 0.6 Ma sequence boundaries. A: depositional strike-oriented seismic section. B: turbidite element interpretation based on well logs and seismic facies. See Figure 4 for the location of section.
63
4.5 Facies Descriptions of Sequences
A depositional sequence in deep water is usually composed of basin floor fans
(turbidite lobes), slope fans and condensed sections (Yielding, 1994). However, no
sequences interpreted from this study show the complete succession of these three
systems tracts. Especially, the turbidite lobe was very rare and was identified for only
one sequence (1.1-0.8 Ma). According to Weimer et al. (1998), basin floor fans
(turbidite lobes) tend to occur more commonly in lower slopes and older sequences
(Weimer et al., 1998). Therefore, it is inferred that the study area located in the middle-
to-upper slope during the deposition of these sequences was not a favorable condition for
turbidite-lobe deposition. Slope fans are the dominant systems tracts in the study area,
which can be subdivided into three turbidite elements: depositional channel fills and
overbank, mud turbidite fills and sheets, and erosional channel fill. Sand-prone
depositional channel fills and turbidite lobes mainly occurred in the lower parts of
sequences, while mud-turbidite fills and sheets and hemipelagic and pelagic drapes were
dominantly deposited in the upper parts of sequences. Overall, each sequence shows
fining-upward patterns and the older sequences are more sand-prone than the younger
ones (Figures 33 and 34).
4.5.1 2.4-1.9 Ma Sequence
The 2.4-1.9 Ma sequence consists of channel fill and overbank deposits and
overlying condensed intervals. Well logs indicate that this is one of the most sand-prone
sequences in the study area (Figure 19). In seismic, this channel system is represented as
a bi-directional-downlapping mound shape with high amplitude and low coherency.
Well logs are represented as fining upward (bell shape) or blocky patterns indicating a
complex amalgamated channels with thickness measured up to about 30 ft in Well 358-1
(Figure 18). These sand-prone channel-fill sediments are adjacent to overbank
sediments that are characterized by low amplitude, high coherency and parallel to
subparallel seismic reflections. Horizon slices generated by sequence boundary 1.9 Ma

64
show the general trend of this channel system, in which the depositional channel facies
are located in northwestern part of the basin trending northeast to southwest (Figure 25).
However, the exact channel geometry was not defined from the horizon slices because of
the limited seismic resolution and structural complexity caused by fault and salt
deformation. The general external shape of this sequence is interpreted as trough fills
thinning to the east and west of salt highs. The depocenter of the sequence is located in
the central part of the basin trending northeast to southwest, which is generally
compatible with depositional channel systems interpreted from the horizon slices (Figure
10 and 26). The thickest sedimentation occurred in the downdip area of this basin. The
abnormal isochron area located line 350, trace between 300 and 600 in Figure 10-A is
not real, great thickness of which was caused by sediment overlap in reverse faults. The
upper and lower sequence boundaries were partly eroded by overlying channels. Where
erosion occurred, no condensed sections were observed (as in Wells 350-2 and 351-1:
Figure 32 and 35).
4.5.2 1.9-1.4 Ma Sequence
The 1.9-1.4 Ma sequence is composed of depositional channel fills and overbank
deposits, mud turbidite fills and sheets, and condensed intervals (Figure 32 and 35). The
depositional channel fills are thin and the channels are small comparing with the
depositional channels in underlying sequence. In Well 358-1, well data shows about a
200-ft fining-upward sand, which is interpreted as an amalgamated channel-fill deposit.
However, the gamma ray curve shows no difference from the shale strata underlying.
This suggests that this sand body contains some radioactive minerals resulting its high
gamma ray values. From the horizon slice, one channel system trending in NNE-SSW
direction was defined. This channel system is characterized by negative high amplitude,
which is interpreted as a channel sands incased in overbank shale.
Mud turbidite fills and sheets overlying depositional channels are represented by
thick shale interval, interbedded occasionally with hemipelagic shale and thin sand
bodies. This sediment can be differentiated from condensed sections consisting of

65
hemipelagic and pelagic drapes, because condensed intervals have higher gamma ray
values and higher amplitude and coherency than this facies. A couple hemipelagic and
pelagic intervals are defined for this sequence based on well data and biostratigraphic
information (Figure 32 and 35). However, only one condensed interval was defined in
the updip area of the basin (Well 350-1, 350-2). A condensed interval occurring between
two mud turbidite fill sediments is not a major condensed section. It is interpreted that it
was deposited during lowstand in relative sea level by sediment starvation probably
caused by channel avulsion. The isochron map shows the depocenter of this sequence
was located in the central part of the basin trending northeast to southwest (figure 10 B),
which is very conformable with the depositional channel system developed in this
sequence (Figure 10 and 27). The upper sequence boundary is in general conformable
with the overlying mud turbidite fills and sheets, and the condensed interval underlying
the sequence boundary is well preserved for this sequence.
4.5.3 1.4-1.1 Ma Sequence
The 1.4-1.1 Ma sequence is characterized by the highest sedimentation rate in the
study area. All the sediment deposited during this time is mud-prone: mud turbidite fills
and condensed intervals. Well data show very thick mud-dominant sediment intercalated
with thin sand and silt intervals. In the seismic sections, mud turbidite fills are parallel-
to-subparallel, fair-to-low amplitude seismic reflectors. Horizon slices show laterally
homogenous low amplitude patterns without abrupt changes throughout the study area.
This facies is very broadly deposited and filled the basin with mud-dominant sediment as
unconfined flows.
The sediment bodies are commonly thinning against salt-high areas. Some
reflectors onlap underlying reflectors. According to the isochron map of this sequence,
there are two depocenters; one is located in the northern part of the basin and the other is
in the southeastern part of the basin. The one in the northern part of the basin was
developed by listric normal fault that provided additional accommodation during the
deposition of this sequence (Figure 7). Well-log responses measured in this interval

66
indicate mud prone sedimentation with thin sand or silt intercalations. Two hemipelagic
and pelagic facies were defined from this sequence. These condensed intervals are well
represented in seismic and well data. In seismic data, they are characterized by strong
continuous reflectors with consistent thickness throughout the basin, indicating that they
were mainly composed of pelagic and hemipelagic suspended sediments. In well data
these facies were distinguished from mud turbidite fill sediments by their gamma ray
values that are higher than those of mud-turbidite fills. The sequence boundaries on top
and bottom are conformable with other sequences.
4.5.4 1.1-0.8 Ma Sequence
This sequence is characterized by very slow sedimentation indicated by its
isochron map, in which the maximum thickness is less than 120 msec in two-way times,
which might be explained by sediment starvation in this area caused by channel avulsion.
However, no further information was available for this study. This sequence consists of
turbidite lobes and hemipelagic and pelagic sediments. A turbidite lobe is characterized
by high-amplitude, high-coherency, mound-shape reflectors that can be interpreted as
sand-prone turbidite lobe, deposited in the early stage of lowstand systems tracts and
hemipelagic and pelagic sediments were deposited until the next lowstand in sea level.
No significant Mud turbidite fills and sheets and depositional channel fills and overbank
deposits were deposited for this sequence. The isochron map shows that the thickness of
this sequence decreases toward east, which can be explained by the thickness change of
turbidite lobe. In plan view turbidite lobe is an elliptical shape, thinning to the east,
which caused the amplitude phase change from west to east on horizon slice (Figure 28).
The sedimentation of this sequence was also controlled by listric faults in the northern
part of the basin where a small scale depocenter was formed. The upper sequence
boundary was partly eroded by erosional channel that was developed in the early stage
of lowstand systems tract and eroded out the underlain hemipelagic and pelagic drapes.

67
4.5.5 0.8-0.7 Ma Sequence
The 0.8-0.7 Ma sequence is composed of erosional channel fills, mud turbidite fills
and sheets, and an overlying condensed interval. These channels, down-cutting the
underlying sequence, are elongated in the north-south direction and filled by mud-
dominant channel abandonment sediments. These channels are very wide compared with
other depositional channels observed in the study area. This erosional channel developed
in the early stage of the lowstand in relative sea level that transported sediment to
downslope area and then was filled by mud-dominant sediments. This channel is not
clearly defined on the horizon slices even though it is clear in vertical sections. It is
because it was filled by mud-prone sediment, of which acoustic impedance is similar
with the underlying sediments. Using vertical seismic sections, these channels were
mapped on the horizon slices, by which they are represented as a relatively low-
amplitude area surrounded by a high-amplitude area of the condensed sections. An
isochron map shows an elliptical shape depocenter in the central part of the basin,
indicating that sedimentation was mainly controlled by salt withdrawal activity. The
time thickness of this sequence ranges from 350–120 msec in the basin area. The upper
sequence boundary is conformable with the sequence above.
4.5.6 0.7-0.6 Ma Sequence
The 0.7-0.6 Ma sequence consists of depositional channel fills, overbank deposits
and mud turbidite fills. No condensed sections were observed from this sequence
(Figures 33 and 34). It is interpreted that the condensed section that had deposited in the
upper part of this sequence was eroded out by the bypass sediment during the early stage
of next sequence. The 0.6 Ma sequence boundary is the most predominant erosional
surface in this area. Less sediment was eroded in the central part of the basin because of
the accelerated subsidence by salt withdrawal in this area, in which part of mud-turbidite
sediments were preserved, but in the northern and southern parts, only channel levee
systems were preserved.

68
The depositional channel fills and overbank deposits are very well preserved and
easily defined from vertical seismic sections and horizon slices. A series of horizon
slices show that there were two channel systems trending northeast to southwest and
northwest to southeast (Figure 33 and 34). These channels are highly sinuous with good
levee systems, which are characteristic of a low-gradient, mud-dominant depositional
slope (Clark et al., 1992). No well data were available for these channel-fill sediments.
However, their seismic characters represented by sinuous high-amplitude areas are
interpreted as sand-prone deposits. The time thickness of this sequence ranges from 320
msec at the central part of the basin to less than 100 msec near the salt-high areas that
was mainly controlled by salt withdrawal from the basin.
69
5. CONCLUSION
During the Late Pliocene to Early Pleistocene, sediments deposited in the study
area were mainly transported by gravity flows and deposited in an intraslope salt-
withdrawal basin. This basin is an elliptical shape, trending to the NNE-SSW direction.
To the north, east and west the basin is bounded by extensional faults and shallow salt
highs and to the south by salt-cored folds and reverse faults. These topographic highs
functioned as partial downdip barriers to sedimentation, trapping more sediments within
the basin. After 0.6 Ma, salt evacuated from the central part of the basin, which was
observed by a series of isochron maps, and resulted in infilling the salt-withdrawal basin.
Even though this basin was severely deformed by salt and fault evolution, 3-D high-
resolution seismic data could reveal the structural patterns of the study area.
Crossplot method of wireline logs combined with biostratigraphical data proves to
be beneficial tool to define condensed intervals. Sequence boundaries were mainly lying
above the condensed sections. Sequence stratigraphic analysis of well logs,
biostratigraphic data and 3-D seismic data provided a chronostratigraphic framework of
the study area, through which seven sequence boundaries were identified. Most sequence
boundaries are in general conformaties, but 1.9 Ma, 0.8 Ma and 0.6 Ma sequence
boundaries were interpreted as partially or fully eroded surfaces caused by submarine
channels or bypass sediments such like debris flows, slump and slide.
Seismic reflection characteristics including amplitude, coherency of reflectors, and
reflection configuration were examined and each sequence was subdivided into separate
seismic facies. Seismic volumes flattened by reference horizons revealed the lateral
variations of these facies. They are useful in describing the spatially confined facies,
especially for channel-like features. Seismic facies descriptions from vertical seismic
sections and horizon slices were combined with well data and interpreted into turbidite
elements. Five turbidite elements were defined: (1) depositional channel fills and
70
overbank deposits, (2) erosional channel fills, (3) mud turbidite fills and sheets, (4)
turbidite lobes, and (5) hemipelagic and pelagic drapes.
Depositional channel fills are the most common sand-prone facies in the study area.
They are usually deposited in the lower part of depositional sequence. Well logs
measured for these facies show bell-type or cylinder-type log patterns indicating sand-
prone facies. The lateral variations of these sand-prone channels were revealed by
horizon slices, in which they are characterized by elongated sinuous, high amplitude area
surrounded by broad low amplitude area. Overbank deposits are generally fine-grained
turbidite sediments that can be laterally extensive and are adjacent to the depositional
channels. Turbidite lobe is interpreted as the sand-dominant facies in slope basin. Only
one turbidite lobe was interpreted in the 1.1 – 0.8 Ma sequence, which shows high
amplitude and continuous reflections with the mound shape, downlapping onto the
underlying sequence boundary. In horizon slices, this lapout feature might be observed
as a changing amplitude and coherency. No wells were penetrated in the thick part of
this facies where sand-prone sediments are expected. Erosional channel fills were
defined only in the 0.8-0.7 Ma sequence where erosional channel cut into the underlying
sequence, functioned as conduits to the downdip slope basin. This erosional channel was
filled by low amplitude, moderate coherence of subparallel reflections, interpreted as
mud-prone sediments. Mud turbidite fills and sheets are interpreted to have filled in
slope depressions mainly as unconfined flows. Well-log responses for these intervals
show that they are mud-dominant facies, but may be serrated if interstratified by
silt/sand. In plan view, they show low-amplitude, high-coherency seismic characteristics
without significant variation. Hemipelagic and pelagic sediments typically drape widely
the slope and adjacent basin floor and represented by strong continuous reflections in
vertical sections and horizon slices. It can be distinguished by its consistent thickness
from turbidite lobes.
Depositional sequences in the study area usually consist of depositional channel
fills and overbank deposits, mud turbidite fills and sheets, and hemipelagic and pelagic
drapes. Sand-prone depositional channel fills and turbidite lobes mainly occurred in the
71
lower parts of sequences, while mud-turbidite fills and sheets and hemipelagic and
pelagic sediments were dominantly deposited in the upper parts of sequences. Overall,
each sequence shows fining-upward patterns topped by hemipelagic and pelagic drapes.
It is also clear the older sequences are more sand-prone than the younger sequences.
The geometries of sand-prone turbidite facies were described by seismic facies
analysis with high-resolution 3-D seismic data, which was performed within a sequence
stratigraphic framework. Horizon slices cut parallel with sequence boundaries or
condensed sections could reveal the lateral variations of the spatially confined reservoir
facies, but their applications were limited by the seismic qualities, structural
complexities and the vertical seismic resolutions. Seismic facies analysis with 3-D
seismic combined with horizon slices made it possible to describe the geometries of
turbidite elements in three dimensions, which will be used to predict the distributions of
reservoir, seal, and source facies in intra-slope basins and to locate stratigraphical traps
in deep water basins.
72
REFERENCES CITED
Bouma, A. H., H. H. Roberts, and J. M. Coleman, 1990, Acoustical and geological
characteristics of near-surface sediments, upper continental slope of northern gulf
of Mexico: Geo-Marine Letters, v. 10, p. 200-208.
Brown, L. F., and W. L. Fisher, 1977, Seismic-stratigraphic interpretation of
depositional systems: examples from Brazil rift and pull-apart basins, in C. E.
Payton, ed., Seismic stratigraphy: applications to hydrocarbon exploration: AAPG
Memoir 26, p. 213-248.
Clark, J. D., N. H. Kenyon, and K.T. Pickering, 1992, Quantitative analysis of the
geometry of submarine fans: Geology, v. 20, p. 633-636.
Galloway, W. E., 1998, Siliciclastic slope and base-of-slope depositional systems:
Component facies, stratigraphic architecture, and classification: AAPG Bulletin, v.
82, no. 4, p. 569-595.
Geitgey, J. E., 1998, Plio-Pleistocene evolution of central offshore Louisiana: Gulf Coast
Association of Geological Societies Transactions, v. 38, p. 151-156.
Haq, B. U., 1991, Sequence stratigraphy, sea-level change, and significance for the deep
sea, in D. I. M. Macdonald, ed., Sedimentation, tectonics and eustacy: sea-level
changes at active margins: Society of Economic Paleontologists and Mineralogists
Special Publication 12, p. 3-39.
Haq, B. U., J. Hardenbol, and P. R. Vail, 1988, Mesozoic and Cenozoic
chronostratigraphy and cycles of sea-level change, in C. K. Wilgus, B. S. Hastings,
C. G. St. C. Kendall, H. W. Posamentier, C. A. Ross, J. C. Van Wagoner, eds.,
Sea-level changes: an integrated approach: Society of Economic Paleontologists
and Mineralogists Special Publication 42, p. 71-108.
Mitchum, R.M., and J. C. Van Wagoner, 1991, High-frequency sequences and their
stacking patterns: sequence-stratigraphic evidences of high-frequency eustatic
cycles: Sedimentary Geology, v. 70, p. 131-160.
73
Mitchum, R. M., Jr., P. R. Vail, and S. Thompson, 1977, Seismic stratigraphy and global
changes of sea level, part 2: the depositional sequence as a basic unit for
stratigraphic analysis, in C. W. Payton, ed., Seismic stratigraphic applications to
hydrocarbon exploration: AAPG Memoir 26, p. 53-62.
Mitchum, R. M., J. B. Sangree, P. R. Vail, and W. W. Wornardt, 1990, Sequence
stratigraphy in Late Cenozoic expanded sections, Gulf of Mexico, in J. M.
Armentrout and B. F. Perkins, eds., Sequence stratigraphy as an exploration tool,
concepts and practices in the Gulf Coast: Gulf Coast Section, SEPM Foundation,
Eleventh Annual Research Conference, Houston, Texas, p. 237-256.
Morton, R. A., 1993, Attributes and origins of ancient submarine slides and filled
embayments: examples from the Gulf Coast Basin: AAPG Bulletin, v. 77, no. 6, p.
1064-1081.
Mutti, E., and W. R. Normark, 1991, An integrated approach to the study of turbidite
systems, in P. Weimer and M. H. Link, eds., Seismic facies and sedimentary
processes of submarine fans and turbidite systems: New York, Springer-Verlag, p.
75-106.
Normark, W. R., 1978, Fan valleys, channels, and depositional lobes on modern
submarine fans: characters for recognition of sandy turbidite environments: AAPG
Bulletin v. 62, n. 6, p. 912-931.
Pacht, J. A., B. E. Bowen, B. L. Shaffer, and B. R. Pottorf, 1990, Sequence stratigraphy
of Plio-Pleistocene strata in the offshore Louisiana Gulf Coast: applications to
hydrocarbon exploration, in J. M. Armentrout and B. F. Perkins, eds., Sequence
stratigraphy as an exploration tool, concepts and practices in the Gulf Coast: Gulf
Coast Section, SEPM Foundation, Eleventh Annual Research Conference,
Houston, Texas, p. 269-285.
Pirrie, D., 1998, Interpreting the record: facies analysis: in P. Doyle, and M. R. Bennett,
eds., Unlocking the stratigraphic record: School of earth and environmental
sciences, University of Greenwich, UK, p. 395-420.
74
Rider, M., 1995, The Geologic Interpretation of Well Logs, Gulf Publishing Company,
London, 280 p.
Rowan, G. M., and P. Weimer, 1998, Salt-sediment interaction, Northern Green Canyon
and Ewing Bank (Offshore Louisiana), Northern Gulf of Mexico: AAPG Bulletin,
v. 82, no. 5B, p. 1055-1082.
Rowan, M. G., M. P. A. Jackson, and B. D. Trudgill, 1999, Salt-related fault families
and fault welds in the Northern Gulf of Mexico: AAPG Bulletin, v. 83, no. 9, p.
1454-1484.
Sangree, J. B., P. R. Vail, and R. M. Mitchum, Jr., 1990, A summary of exploration
applications of sequence stratigraphy, in J. M. Armentrout and B. F. Perkins, eds.,
Sequence stratigraphy as an exploration tool, concepts and practices in the Gulf
Coast: Gulf Coast Section, SEPM Foundation, Eleventh Annual Research
Conference, Houston, Texas, p.321-327.
Shaffer, B. L., 1990, The nature and significance of condensed sections in Gulf Coast
late Neogene sequence stratigraphy: Gulf Coast Association of Geological
Societies Transactions, v. 40, p. 767-776
Simmons, G. R., W. R. Bryant, R. Buffler, G. Lee, and C Fiduk, 1996, Regional
distribution of salt and basin architecture in the northwestern Gulf of Mexico: in J.
O. Jones and T. L. Freed, eds., A structural framework of the Northern Gulf of
Mexico: A special publication of Gulf Coast Association of Geological Societies, p.
93-94
Stanley, D. J., 1985, Mud redepositional processes as a major influence on
Mediterranean margin-basin sedimentation, in D. J. Stanley and F. C. Wezel, eds.,
Geological evolution of the Mediterranean Basin: New York, Springer-Verlag, p.
377-412.
Stelting, C. E., and DSDP Leg 96 Shipboad Scientist, 1985, Migratory characteristics of
a mid-fan meander belt, Mississippi Fan, in A. H. Bouma, W. R. Normark, and N.
E. Barnes, eds., Submarine fans and related turbidite systems: New York,
Springer-Verlag, p. 283-290.

75
Vail, P. R., 1987, Seismic stratigraphy interpretation using sequence stratigraphy, Part I:
seismic stratigraphy interpretation procedure in A. W. Bally, ed., Atlas of seismic
stratigraphy: AAPG studies in Geology 27, p. 1-10.
Vail, P. R. and W. W. Wornardt, 1990, Well log-seismic sequence stratigraphy: an
integrated tool for the 90s: in J. M. Armentrout and B. F. Perkins, eds., Sequence
stratigraphy as an exploration tool, concepts and practices in the Gulf Coast: Gulf
Coast Section, SEPM Foundation, Eleventh Annual Research Conference,
Houston, Texas, p. 379-388.
Vail, P. R. and W. W. Wornardt, 1991, An integrated approach to exploration and
development in the 90 sequence: well log-seismic sequence stratigraphy analysis:
Gulf Coast Association of Geological Societies Transactions, v. 41, p. 630-650.
Van Wagoner, J. C., H. W. Posamentier, R. M. Mitchum, Jr., P. R. Vail, J. F. Sarg, T. S.
Loutit, and J. Hardenbol, 1988, An overview of the fundamentals of sequence
stratigraphy and key definitions, in C. K. Wilgus, B. S. Hastings, C. G. St. C.
Kendall, H. W. Posamentier, C. A. Ross, J. C. Van Wagoner, eds., Sea-level
changes: an integrated approach: Society of Economic Paleontologists and
Mineralogists Special Publication 42, p. 39-46.
Van Wagoner, J. C., R. M. Mitchum, Jr., K. M. Campion, and V. D. Rahmanian, 1990,
Siliciclastics sequence stratigraphy in well logs, cores, and outcrops: concepts for
high-resolution correlation of time and facies: AAPG Methods in Exploration
Series, no. 7, 55 p.
Varnai, P., 1998, Three-dimensional seismic stratigraphic expression of Pliocene-
Pleistocene turbidite systems, northern Green Canyon, offshore Louisiana,
northern Gulf of Mexico: AAPG Bulletin, v. 82, no. 5B, p. 986-1012.
Villamil, T., C. Arango, P. Weimer, A. Waterman, M. G. Rowan, P. Varnai, A. J.
Pulham, and J. R. Crews, 1998, Biostratigraphic condensation, and key surface
identification, Pliocene and Pleistocene sediments, northern Green Canyon and
Ewing Bank (offshore Louisiana), northern Gulf of Mexico: AAPG Bulletin, v. 82,
no. 5B, p. 961-985.
76
Wagner, J. B., Morin, R. W., Ford, D. W., Mathur, V. R., and Mauro, R. T., 1994, A
sequence stratigraphic analysis of the Lower Miocene, West and East Cameron
areas, Gulf of Mexico: preliminary results, in P. Weimer, A. H. Bouma, and B. F.
Perkins, eds., Submarine fans and turbidite systems: Gulf Coast Section, SEPM
Foundation, Fifteenth Annual Research Conference, Houston, Texas, p. 357-372.
Walker, R. G., 1992, Turbidites and submarine fans, in R. G. Walkers and N. P. James
eds., Facies models: response to sea level change: Geological Association of
Canada, p. 239-263.
Watkins, J. S., J. Xi, R. Li, S. Huh, J. Zhang, and F. Xue, 1996, Depocenter formation
and distribution on the Texas and Louisiana Shelves, Gulf of Mexico: in J. O.
Jones and T. L. Freed, eds., A structural framework of the Northern Gulf of
Mexico: A special publication of Gulf Coast Association of Geological Societies, p.
99-101
Weimer, P., P. Varnai, A. Navarro, Z. Acosta, F. Budhijanto, R. Martinez, M. G. Rowan,
B. McBride, and T. Villamil, 1994, Sequence stratigraphy of Neogene turbidite
systems, Green Canyon and Ewing Bank, northern Gulf of Mexico: preliminary
results, in P. Weimer, A. H. Bouma, and B. F. Perkins, eds., Submarine fans and
turbidite systems: Gulf Coast Section, SEPM Foundation, Fifteenth Annual
Research Conference, Houston, Texas, p. 383-399.
Weimer, P., P. Varnai, F. M. Budhijanto, Z. M. Acosta, R. E. Martinez, A. F. Navarro,
M. G. rowan, B. C. McBride, T. Villamil, C. Arango, J. R. Crews, and A. J.
Pulham, 1998, Sequence stratigraphy of Pliocene and Pleistocene turbidite systems,
northern Green Canyon and Ewing Bank (offshore Louisiana), northern Gulf of
Mexico: AAPG Bulletin, v. 82, no. 5B, p. 918-960.
Winker, C. D., 1984, Clastic shelf margins of the Post-Comanchean Gulf of Mexico:
Implications for deep-water sedimentation, in D. G. Bebout, and E. A. Mancini,
eds., Characteristics of Gulf Basin deep-water sediments and their exploration
potential: Gulf Coast Section, SEPM Foundation, Fifth Annual Research
Conference, Dallas, Texas, p. 109-117.
77
Whittaker, A., 1998, Principles of seismic stratigraphy, in P. Doyle and M. R. Bennett,
eds., Unlocking the stratigraphical record: Advances in modern stratigraphy:
Chichester, UK, John Wiley and Sons, p. 275-298.
Yeilding, C. A., and G. M. Apps, 1994, Spatial and temporal variations in the facies
associations of depositional sequences on the slope: Examples from the Miocene-
Pleistocene of the Gulf of Mexico: preliminary results, in P. Weimer, A. H. Bouma,
and B. F. Perkins, eds., Submarine fans and turbidite systems: SEPM Gulf Coast
Section Fifteenth Annual Research Foundation Conference, p. 425-437.

78
VITA
Booyong Kim
1588-14 Kwanyang-Dong, Dongan-Gu,
Kyungki-Do, 431-711
South Korea
E-mail: [email protected]
Booyong Kim received his B.S. in geology from Kyungpook National University
in February 1992. After graduation, he joined the Korea National Oil Corporation
(KNOC) on May 1, 1993 and worked as an exploration geologist in the Domestic
exploration area. In August, 1997 he entered Texas A&M University pursuing a M.S. in
Geophysics. After two years, he returned to KNOC and has been working on Korean
offshore projects. He received his M.S. in geophysics in August 2002.

![[PPT]Introduction to Sequence Stratigraphy - Jackson … · Web viewStratigraphic Principles Types of Stratigraphy Focus on Modern Stratigraphy is Sequence-based History of Sequence](https://img.pdfslide.net/doc/110x75/5b0163197f8b9a0c028e2f8c/pptintroduction-to-sequence-stratigraphy-jackson-viewstratigraphic-principles.jpg)