Embed Size (px)
Citation preview

Ž .Global and Planetary Change 27 2000 245–262www.elsevier.comrlocatergloplacha
Seismic volume attribute analysis of the Cenozoic succession inž /the L08 block Southern North Sea
Philippe Steeghsa, Irina Overeemb,), Sevgi Tigrekb
a Consortium for Computational Seismic Interpretation, Department of Electrical and Computer Engineering, Rice UniÕersity,Houston, TX, USA
b Faculty of Applied Geosciences, Delft UniÕersity of Technology, P.O. Box 5028, 2600 GA Delft, Netherlands
Abstract
Three-dimensional volume attribute extraction techniques have been applied to the Cenozoic succession, in a 3-D seismicdata volume from the L08 block in the Dutch sector of the North Sea. Volume attribute analysis aims at the extraction of3-D signal characteristics that are relevant to the geological interpretation of the data. For instance, the spatial discontinuitiesthat are associated with faults or abrupt stratigraphic changes are very well brought forward by the volume attributes.
The attributes are computed by means of a 3-D sliding-volume spectrum analysis. The slope of the signal is determinedas the mean dip of a local 3-D dip-frequency spectrum. The volume dip and azimuth of the signal have been obtained bycombining the average slopes in two directions
The Cenozoic succession in the L08 block can be subdivided into two main packages, which are separated by theŽ .Mid-Miocene Unconformity MMU . In the lower package, a complicated fault pattern was observed, which could be
mapped in detail using the volume attribute slices. The package above the MMU consists of Neogene sedimentary units thatconstitute of delta deposits. Using only volume dip and reflection strength attribute slices, we obtained more insight in thedelta sequences in a short time. Subsurface objects that may remain unnoticed when using only traditional interpretationtechniques can often be easily detected on the attribute maps. Several interesting features could be identified on the volumeattribute images, such as slumps, a large submarine fan and channels.q2000 Elsevier Science B.V. All rights reserved.
Keywords: seismic volume attribute; Cenozoic; L08 block
1. Introduction
In recent years, a number of new 3-D imageprocessing techniques have been developed specifi-cally for seismic interpretation in the petroleum in-dustry. In the early days of 3-D seismic interpreta-tion, the 3-D data volume was interpreted on cross-
) Corresponding author. Fax:q31-15-278-1189.Ž .E-mail addresses: [email protected] P. Steeghs ,
Ž [email protected] I. Overeem .
sections. The interpretation on these cross-sectionsresulted, then, in a horizon map of the seismicreflector under analysis. Through this horizon map,one obtained the 3-D view of the subsurface. Im-proved quality of 3-D seismic data, in combinationwith greatly increased computational resources, haveenabled the application of fully three-dimensionalimage enhancement and attribute extraction tech-niques in seismic interpretation. With seismic vol-
Žume attribute analysis techniques Bahorich andFarmer, 1995; Steeghs and Drijkoningen, 1996;
0921-8181r00r$ - see front matterq2000 Elsevier Science B.V. All rights reserved.Ž .PII: S0921-8181 01 00069-8

( )P. Steeghs et al.rGlobal and Planetary Change 27 2000 245–262246
.Hoogenboom et al., 1996 , three-dimensional seis-mic interpretation can be greatly enhanced.
The use of three-dimensional seismic data outsidethe field of petroleum geology has been relatively
sparse. This is mainly due to the limited availabilityof 3-D seismic data sets for research purposes andlarge costs of handling and interpreting 3-D seismicsurveys. However, more and more 3-D seismic sur-
Fig. 1. Location map of the L08 block.

( )P. Steeghs et al.rGlobal and Planetary Change 27 2000 245–262 247
Ž .Fig. 2. Synthetic seismic data set in 3-D perspective view a , timeŽ .slice from the data volume b , volume dip along the time slice inŽ .the direction of they-axis c , volume dip in the direction of the
Ž . Ž . Ž .x-axis d , volume dip e , volume azimuth f .
veys become publicly available, and at the sametime, high-end visualization software can be obtainedat low cost. For most 3-D data sets, little interpreta-tion beyond the exploration targets of petroleumcompanies has taken place. As a result, a secondlook at these data sets often reveals that seismic datacontains a wealth of additional information that is ofinterest to the study of earth system dynamics.
The main purpose of this paper is to demonstratethe application of 3-D image processing techniquesas an aid for geological interpretation of large 3-Dseismic surveys. Recently developed 3-D attributeextraction techniques volume have been applied tothe Cenozoic succession of a 3-D seismic data vol-ume from the L08 block in the Dutch sector of the
Ž .North Sea Fig. 1 . The enhanced geometrical viewthat is provided by the volume attribute imagesgreatly facilitates the interpretation of tectonic andsedimentary structures in the study area.
2. Seismic volume attribute extraction
In three-dimensional seismic imaging, subsurfaceobjects are depicted with images of the seismicwaves that are back-scattered by the object. The
Fig. 3. Volume dip of field data in perspective cube display. The upper surface is the volume dip along the time slice, the sides of the cubeare seismic amplitude cross-sections.

( )P. Steeghs et al.rGlobal and Planetary Change 27 2000 245–262248
Fig. 4. Basemap of the seismic survey.

( )P. Steeghs et al.rGlobal and Planetary Change 27 2000 245–262 249
local characteristics of a seismic image hold impor-tant clues as to which geological feature producedthe seismic events that are observed. These imagecharacteristics are known as seismic attributes.AAm-plitude attributesB, such as reflection strength, giveinformation on material properties. For instance,coarse-grained sandbodies, embedded in a moreshale-prone environment, are associated with highreflection amplitudes.AGeometrical attributesB arerelated to the distribution of seismic events over thevolume. An example is the dip of a seismic timehorizon, which highlights the flexure of the eventand brings forward subtle faults and discontinuities.
In 3-D seismic interpretation, seismic attributesare usually extracted along or near an interpretedhorizon. Either a property of the signal at the horizon
Ž .pick is extracted e.g. amplitude or a property of thehorizon surface itself is computed, such as the dip orazimuth angle of the horizon surface. A more recentdevelopment is the extraction of 3-D geometricalsignal characteristics directly from the data. An ad-vantage of the signal-based attribute over the horizonattribute is that horizon definition and picking, whichis a time-consuming task, does not need to be done.Moreover, in many cases, horizons can be ill-de-fined; then, it is very difficult to consistently pick or
Fig. 5. Cross-line section with horizon and fault interpretation.

( )P. Steeghs et al.rGlobal and Planetary Change 27 2000 245–262250
track horizon surfaces. The extraction of geometricalproperties directly from the signal will be discussedin the following.
The quality of the attribute images can be greatlyimproved by using more robust estimation methodsŽ .Steeghs, 1997; Steeghs et al., 1998 . Many seismicattributes can be associated with some spectral prop-erty of the data. For instance, the instantaneousfrequency is a local measure for the average fre-quency of the signal. The average or mean frequencyis a property of the Fourier spectrum of the data. Toestimate thelocal mean frequency, a local frequencyspectrum is computed in the neighborhood of asample location. The locally dominant frequency ofthe local spectrum provides a measure for the domi-nant frequency of the signal at the sample location.
A straightforward way to devise such a local fre-quency representation is to divide the data into smallsegments and take the Fourier transformation of eachof the segments. The correspondingtime–frequencyrepresentation is the sliding-window Fourier trans-form. The sliding-window Fourier transform of a
Ž .signal u t is defined as:
`X X X XS t ; f s exp yj2p ft u t w t y t dt ,Ž . Ž . Ž . Ž .H
y`
1Ž .
Ž .wherew t is a window function. The squared mag-< Ž . < 2nitude is S t; f known as the spectrogram. The
local frequency of the signal can now be defined as
Fig. 6. Summary of the main seismic sequence boundaries and seismic sequences in the data volume.
( )P. Steeghs et al.rGlobal and Planetary Change 27 2000 245–262 251
the average frequency of the spectrogram as a func-tion of time, i.e.:
`2< <f S t ; f d fŽ .H
0² :f t s . 2Ž . Ž .`
2< <S t ; f d fŽ .H0
The concepts of time–frequency analysis can bereadily extended to higher dimensions. In order toextract the local dip angle in 3-D of the data, wedefine a localdip spectrum. This dip spectrum canbe obtained through a local Radon transform of the
Ž .data Steeghs, 1997 . The global Radon transform ofŽ .a 3-D signalu x, y, t is defined as:
u p ,q ,t s u x , y ,tqpx ,tqqy d xd y ,Ž . Ž .˘ HH2Ž .x , y gR
3Ž .
Ž .where p is the dip or slope in thex-direction, q isthe dip in they-direction andt is the intercept time.
In order to obtain alocal Radon representation ofŽ .the data, we slide a 3-Dx, y, t -window over the
data and compute the Radon transform for each ofthe windowed volumes. The result is the sliding-
Ž .window Radon transformP x, y, t; p, q, t . Theactual algorithm that is used for the attribute extrac-
Ž .tion computes a sliding-windowp, q, f -represen-tation by combining the local temporal Fourier trans-
Ž .form of Eq. 2 with the local Radon transform in theŽ .Fourier domain Steeghs, 1999 . This sliding-window
dip-frequency representation is given by:
P x , y ,t ; p ,q , fŽ .
s exp j2p f pxXqqyXŽ .Ž .HH2Ž .x , y gR
=S xX , yX ,t ; f w xXyx , yXyy d xXd yX ,Ž . Ž .f)0. 4Ž .Ž .Eq. 4 is a 2-D spatial sliding window Fourier
Ž .transformation ofS t; f . A fast algorithm for the
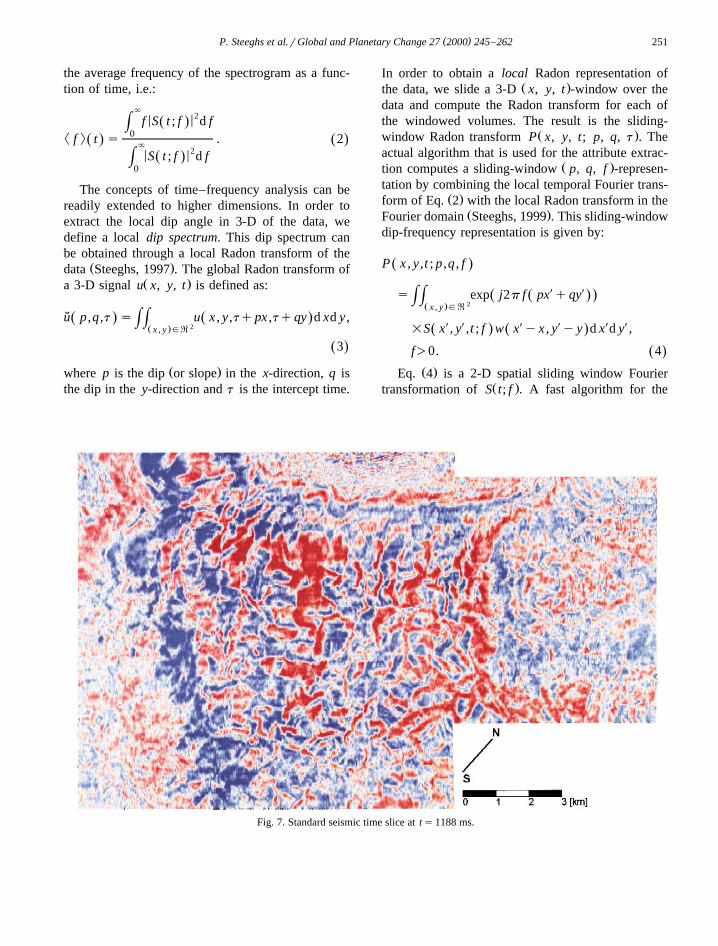
Fig. 7. Standard seismic time slice atts1188 ms.

( )P. Steeghs et al.rGlobal and Planetary Change 27 2000 245–262252
Fig. 8. Volume-dip slice atts188 ms. Steep dips are coloured black, highlighting signal discontinuities associated with the faults.
computation of the 3-D sliding-window Radon trans-Ž .form is given in Steeghs 1999 .
By choosing the appropriate averages, severalŽvolume attributes can be obtained fromP x, y, t;
Fig. 9. Combined volume diprazimuth display atts188 ms. Volume dip is represented by shades of grey. Shades of blue indicate theŽ .azimuth the direction of dip with to the cross-line direction .

( )P. Steeghs et al.rGlobal and Planetary Change 27 2000 245–262 253
.p, q, f . For instance, the average dip in thex-direc-tion is given by:
² :p x , y ,tŽ .` ` `
2< <p P x , y ,t ; p ,q , f d pdqd fŽ .H H H0 y` y`s .` ` `
2< <P x , y ,t ; p ,q , f d pdqd fŽ .H H H0 y` y`
5Ž .
In the same way, the average dip is computed in the² :y-direction q . The volume dip p can now be
defined as the norm of the dip vector, i.e.:
2 2² : ² :(p x , y ,t s p q q . 6Ž . Ž .
The azimutha is defined as the angle between theaverage dips, i.e.:
² :py1a x , y ,t s tan . 7Ž . Ž .² :q
The definition of volume dip and azimuth doesnot differ much from the definition that is commonlyused in geology. The dip is the angle with which aplanar surface is inclined with respect to the horizon-tal. The volume-dip attribute, obtained through Eq.Ž . Ž6 , measures the slope with which the signalu x, y,.t is inclined with respect to a constant time surfaceŽ .x, y, t . The azimuth is the direction of dip. The0
Ž .azimuth attribute of Eq. 7 is the direction of dipwith respect to thex-axis. In addition, we define thereflection strength R as the power of the localspectrum, i.e.:
` ` `2< <R x , y ,t s P x , y ,t ; p ,q , f d pdqd f .Ž . Ž .H H H
0 y` y`
8Ž .
The attribute extraction procedure is illustrated inŽ .Fig. 2. A small synthetic data volumeu x , y , t ofi j k
Ž .64=64=64 samples Fig. 2A was created. Thedata volume is a complex sinusoid with a constantvolume dip p. We computed the local dip-frequency
Ž . Žrepresentation along a time slicex , y , t Fig.i j 32.2b . The average slopes in thex- and y-directions
are shown in Fig. 2c and d. The volume-dip attribute
Žis shown in Fig. 2e, which is constant for eachx ,i.y , except for the center, where the different direc-i
tions are averaged and the volume dip is zero. TheŽ .azimuth image Fig. 2f shows the direction of dip,
which is, in this case, equal to the direction of theŽ .location vector x , y .i i
Fig. 3 illustrates the attribute extraction on a fielddata set. The top of the cube is the volume-dipattribute extracted along the time slice. The slope isrepresented by progressively darker shading. Thetwo sides of the cube are cross-sections of the origi-nal data volume. The dip attribute enhances thediscontinuities in the 3-D signal. In this case, themajority of these discontinuities are associated withfaults, which are much better visible on the attributedisplay than in the original data.
3. Geological setting
The L08 block is located in the Southern NorthŽ .Sea basin Fig. 1 . The entire North Sea region in the
Cenozoic era is characterized by a thermally subsid-ing epicontinental basin that was confined by land-masses, apart from a narrow seaway connecting the
ŽNorwegian Greenland Sea in the North Ziegler,.1988; Rundberg, 1989 . The focus of this study is on
the southern embayment, which comprises the NorthGerman Basin and the southern part of the CentralGraben area, and is bordered by the Ringkøbing–Fyn
ŽHigh and Mid-North Sea High. Michelsen et al.,.1995; Sørensen et al., 1997 . In the south, the Lon-
don–Brabant High separates the basin from the At-lantic Ocean.
Until the end of the Early Palaeocene, mainlychalky sediments were deposited in the region. In theEarly Palaeocene, a sudden increase in supply ofsiliciclastics occurred because of thermal uplift ofthe British Isles and the compression of the central
Ž .European Alpine foreland Laramide tectonic phase .Hence, the deposition of chalky sediments ceasedŽ .Ziegler, 1990 .
The Paleogene in the North Sea Basin reflects adeep-water stage, resulting from crustal subsidencecombined with a general rise in the eustatic sea levelŽ .Haq et al., 1988; Ziegler, 1990 . However, thesouthern embayment was only little influenced by

( )P. Steeghs et al.rGlobal and Planetary Change 27 2000 245–262254
regional subsidence. During the Late Eocene andOligocene, the North Sea Basin was cut off from theTethys ocean by the uplift of the British Isles. Thisactivity resulted in further regional uplift and relativesea level fall, resulting in a local break in sedimenta-tion. The lowstand continued until the Mid-Miocene.The Mid-Oligocene and Mid-Miocene sea level low-stands are reflected by truncations and onlap sur-faces.
During the Neogene, sedimentation rates ex-ceeded the subsidence rate and consequently, shal-
Ž .lowing of the basin occurred Boogaert et al., 1993 .An enormous fluvio-deltaic system dominated thebasin; it drained the entire Fennoscandian High andBaltic Shield. The system, with a reconstructed deltaflood plain of 45 000 km2, a drainage area of3 000 000 km2 and a total sediment volume of 62 000km3 was active over 9.5 million years. Twenty-sixseismic sequences were distinguished from the Mid-Miocene Unconformity onwards for the entire south-
Ž .ern North Sea Basin Kay, 1993 . Three of these
Žsequences are recognized in the L08 block Overeem.et al., 1998 . In the lowermost sequences, a straight
steep delta front was found to prograde, in whichseveral widespread slumping features occurred. Pale-osurface maps showed westward to southwestwardmigration of the delta from the Danish and German
Ž .sectors into the Central North Sea Kay, 1993 . Untilthe Early Quaternary, the main transport agent wasthe Baltic river system that eroded the Fennoscan-dian High and transported coarser sediments throughthe present Baltic Sea. In the Quaternary period, the
Ž .first glacial stage Praetiglian has caused a low-stand, and consequently, an important sedimentaryhiatus has occurred at about the Plio–Pleistoceneboundary. Thereafter, German rivers became themain transport agents in the southern North Sea andthe migration direction changed to northwest. Thedeltaic deposition continued into the Pleistocene as amore fluvial dominated system, with shifting de-pocentres that were influenced by the sea level fluc-tuations, due to repeated glaciation and de-glaciation
Fig. 10. Seismic cross-sections through the delta sequence above the MMU.
( )P. Steeghs et al.rGlobal and Planetary Change 27 2000 245–262 255
cycles during the Quaternary. These deposits areŽfound in the L08 block as well Kay, 1993;.Gregersen, 1997; Overeem et al., 1998 .
The structural development of the region wascontrolled mainly by the inversion tectonics in thePaleogene due to compression exerted from the colli-sion of the Apulia and European Platform. Timing ofsubsidence rates over the Cenozoic is difficult, dueto a lack of datings. General trends are reconstructed,while the average rate for the entire Cenozoic wasabout 5 mrMa, the curves showed a dramatic in-crease in rate up to 100 mrMa from the Pliocene
Ž .onwards Kooi et al., 1989, 1991 . This trend corre-sponds with the architecture of the seismic units;progradation is seen as a dominance of sedimentsupply over subsidence, whereas aggradation resultsfrom a dominance of subsidence over sediment sup-ply. The lowermost delta units, Late Miocene toEarly Pliocene showed progradation, coinciding withthe gentle slope of the subsidence curve. The rapidsubsidence in the Pliocene is confirmed becausePliocene units show only slow progradation. For the
margins of the subsiding basins, still significantprogradation is found, like in this study for the L08block.
Local structural features are mainly gravity-driven,which caused syn-depositional halokinetic move-ments of the Zechstein evaporates and salt inducing
Ž .faulting Clausen and Korstgard, 1993 .˚
4. Data
Fig. 4 shows a basemap of the 3-D seismic surveyover the L08 block. The survey covers an area ofapproximately 10=15 km. The seismic data volumewas acquired and processed by GSI in 1985 forPennzoil. Since 1995, these data have become pub-licly available and were provided by NITG–TNO forthis study. The data volume is consists of 285 lineswith each 1415 traces. The line-spacing is 37.5 m forin-lines and 12.5 m for cross-lines. The original dataset has a 1251 samples per trace with a sample rateof 4 ms. The Cenozoic interval has a time-thickness
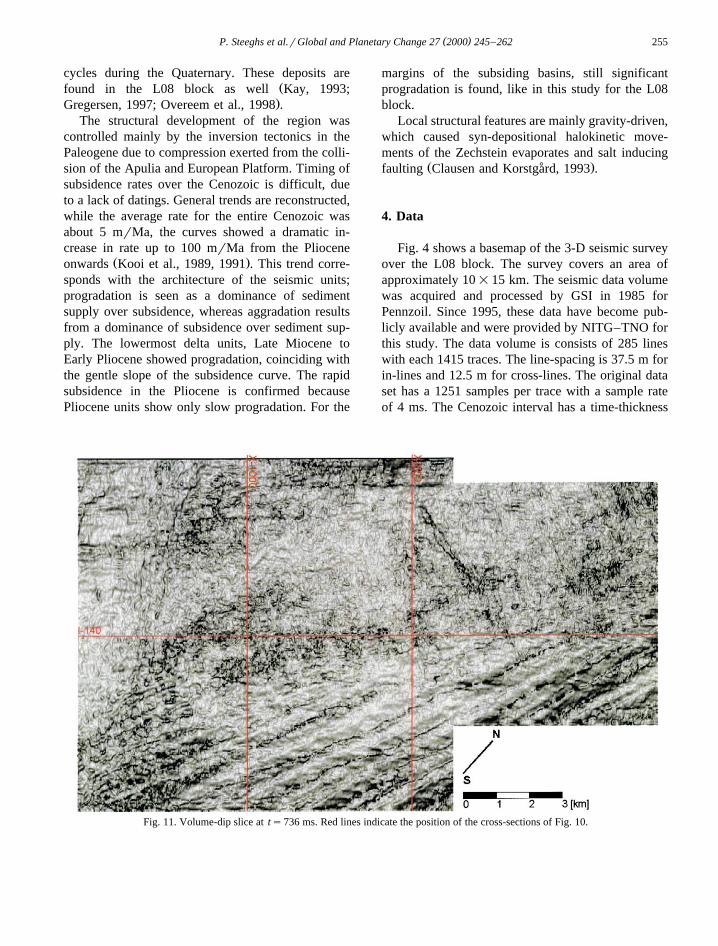
Fig. 11. Volume-dip slice atts736 ms. Red lines indicate the position of the cross-sections of Fig. 10.

( )P. Steeghs et al.rGlobal and Planetary Change 27 2000 245–262256
of about 1700 ms, which corresponds to 425 sam-plesrtrace. A standard seismic data processing se-quence was applied to the data including a 2-D by2-D post-stack time migration.
The interpretation was hampered by areas of lowdata quality. Especially in the upper part of thesection, insufficient corrections for acquisition geom-etry and low stack fold have resulted in low dataquality. Coherent noise events that are associatedwith the ‘acquisition footprint’ have a detrimental
Žeffect on the attribute images Marfurt et al., 1998;.Hesthammer and Fossen, 1997 .
This acquisition footprint results in a discontinuityin the cross-line dip. In the dip attribute images, thisdiscontinuity shows up as a series of linear eventsrunning parallel to the in-lines. In order to suppressthese coherent noise events, a 3-D running dip-filterwas applied prior to volume attribute extraction. Thepre-processing greatly improved the quality of theattribute images. However, in the attribute slices, theacquisition footprint is still strongly present in the
shallower part of the data volume. Areas of lowsignal-to-noise ratio are expressed in the dip maps asconcentrations of curvilinear features, with a typical
Žlength of a few traces Hesthammer and Fossen,.1997 . These areas are interpreted as the expression
in the dip map of a chaotic reflection facies and donot directly represent the actual subsurface geometry.
In addition to the dip filter for acquisition foot-print suppression, interpolation in the in-line direc-tion was carried out to a line spacing of 18.75 m.The sliding-volume dip-frequency spectra were com-puted using an analysis volume of four by four traces
Ž .and four time samples 75=50=16 ms . Threeattributes were extracted from the spectra: the vol-ume dip, the azimuth and the reflection strengthŽ Ž . Ž ..Eqs. 6 – 8 .
5. Results
Detailed horizon and seismo-stratigraphic inter-pretation of the L08 data set is reported in Tigrek
Ž .Fig. 12. Combined volume-diprreflection-strength slice atts724 ms. Reflection strength scaled is given in colour, shading representsvolume dip.

( )P. Steeghs et al.rGlobal and Planetary Change 27 2000 245–262 257
Ž .1998 . The available well logs have been used fortime–depth conversion and to validate the generalseismic interpretation. An interpreted cross-line sec-tion is shown in Fig. 5. The results of the interpreta-tion are summarized in Fig. 6. The Cenozoic succes-sion can be subdivided into two main packages,which are separated by the Mid-Miocene Uncon-
Ž .formity MMU . The first package consists mainly ofthe Paleogene sedimentary units of the Lower Ceno-zoic Succession, which had a fine-grained signaturein the gamma-logs. The reflections of the LowerCenozoic succession have no lateral terminations,and show originally concordant relations. A saltdome structure in the western edge of the data blockhas disturbed this concordant relationship betweenthe reflections and caused a slight convergence to-wards the dome. In the middle part of this package,intense faulting can be observed on the seismic
Žcross-sections between 1000 and 1250 ms Figs. 5.and 6 . A time slice at 1188 ms and its associated
volume-dip attribute slice are shown in Figs. 7 and 8.The polygonal fault pattern is very well highlighted
in the volume-dip slice. In this case, traditionaltechniques may not be adequate to map the faultpattern. The faults are very numerous and many ofthem are too small to permit detection on cross-sec-tions and are not clearly bounded on conventional3D seismic amplitude time slices. Comparable faultpatterns have been observed for the Cenzoic of the
ŽCentral North Sea Lonergan et al., 1998; Haskell et.al., 1999 . The faulting has been interpreted as syn-
sedimentary deformation, resulting from the load ofthe overlying sediments. Pressure release contributedto fault initiation and subsequent fluid escape phe-nomena caused the polygonal nature of the fault
Ž .pattern Lonergan et al., 1998 . The combineddiprazimuth display of Fig. 9 further elicits thedetailed structure, facilitating the interpretation of thelow-angle oblique or strike cuts through the faults. Itbrings forward the effect of the salt diapirism on theoverlying strata as well.
The second package, above the MMU, consists ofNeogene sedimentary units and consist of generallymore coarse sediments. The geometry of the reflec-
Fig. 13. Volume-dip slice atts644 ms.

( )P. Steeghs et al.rGlobal and Planetary Change 27 2000 245–262258
tions in this package is much more complicated thanin the Lower Cenozoic succession. This package is adelta sequence, which can be subdivided into threeunits, Units 1, 2 and 3, corresponding to three se-quences of delta evolution. The dominant directionof progradation is towards the west-southwest, whichis expressed in the evident sharp lineaments in thedip slices due to discontinuities caused by prograd-ing clinoforms.
Three seismic cross-sections through the deltasequence are displayed in Fig. 10. Figs. 11–15 showattribute time slices from the delta sequence above
Žthe MMU. The volume-dip time slice at 736 ms Fig..11 cuts through the MMU and the delta sequence
Ž .Units 1 and 2 see Figs. 5 and 6 . Unit 1 belongs tothe early delta evolution above the unconformity thathas been described in the larger seismo-stratigraphicframework for the entire southern North Sea embay-
Ž .ment Kay, 1993; Sørensen et al., 1997 . The lowerpart of Unit 1 onlaps on the MMU in the eastern partand downlaps towards the west. The source of sedi-
ment supply is in the east. In the direction of down-lap, there is an increasing non-depositional hiatusabove the unconformity surface. In the eastern partof Fig. 11, the time slice cuts through the middle partof Unit 1. Here, we observe sharp high-dip disconti-nuities, which perfectly line up with shingled clino-forms interpreted in the cross-sections. The shingledclinoforms are evidence of progradation into shallowwater. A large feeder channel, trending E–W, cutsthrough Unit 2 and the top of Unit 1. Towards thenorth of the large feeder channel, several smaller,less pronounced, channels can be observed. TheirE–W direction lines up with the progradational di-rection of the delta. The small channels are locatedon the top of Unit 1, which has a more discontinuousseismic signature, characteristic of deposits withchannel features.
Fig. 12 shows a combined reflection strengthrdipdisplay of the data at 12 ms above the previous slice.The colours represent the reflection strength, whichhas been scaled to the maximum reflection strength
Fig. 14. Volume-dip slice atts600 ms.

( )P. Steeghs et al.rGlobal and Planetary Change 27 2000 245–262 259
of the slice. The dip is depicted by the shading,where progressively steeper dips are darker. Thedepression caused by the salt dome uplift has beenfilled in with sediments deposited in a large subma-rine fan. The combination of geometrical information—dip—and the reflection strength results in a verypronounced image of the facies characteristics of thefan. The reflection intensity can be interpreted asindicating relatively coarse-grained, sand-prone, sed-iments. This relation between reflection strength andrelative coarseness of the deposits has also been
Ž .observed by Gregersen 1998 for a comparable sub-marine fan in the northern North Sea Basin. Unfortu-nately, the well-logs available for the L08 block donot penetrate this specific slump, so that the sugges-tion of grainsize trends could not be validated withindependent information.
The volume-dip slice at 644 ms cuts through themiddle part of the Unit 2 and in the upper part of the
Ž .image through the middle part of Unit 3 Fig. 13 .The inclination of the events is steep and decreasestowards the north. The clinoforms are more gently
curving and obviously more widespread, which isprobably caused by their more sigmoidal shape ascompared to the clinoforms of Unit 1. A slumpstructure can be observed in the N–E corner of theslice. This slump changes towards the west into thefeeder channel that was recognized in the lowerslices. In the dip image atts600 ms, we also
Ž .encounter Units 2 and 3 Fig. 14 . The boundarybetween Units 2 and 3 shows small lineaments in theprogradation direction, which are interpreted as smallchannels perpendicular to the prograding delta front.Within Unit 3, structures were observed that have thecharacteristics of delta front slumps. On the com-bined reflection strengthrdip display, they stand outbecause of their high reflectivity, indicating coarser
Ž .sediments Fig. 15 . In the dip images of Figs. 13and 14, the effect of the ‘acquisition footprint’ on theattribute maps is visible as a series of relativelysteeply dipping events running parallel to the in-linedirection.
The regional seismo–stratigraphic framework in-dicated shallowing of the basin and fluvial domi-
Fig. 15. Combine volume-diprreflection-strength slice atts600 ms.

( )P. Steeghs et al.rGlobal and Planetary Change 27 2000 245–262260
Fig. 16. Volume-dip slice atts92 ms.
nated delta development for the last phase present inŽ .the L08 block Kay, 1993; Overeem et al., 1998 . In
these fluvial dominated topsets of the delta, a largechannel system is observed, which continues to existthroughout the Late Quaternary. In the volume-dipslice at ts92 ms, a large meandering channel can
Ž .be clearly seen Fig. 16 . The channel sides form adiscontinuity in the strata, which is reflected in thevolume dip attribute. However, gas or peat in thechannel body might cause the sharp acoustic contrastas well, comparable to observations of Haskell et al.Ž .1999 in the Niger delta.
6. Conclusions
Through the application of seismic volume at-tributes, it is possible to obtain detailed and easilyinterpretable images of subsurface geometry in veryshort time. Generation of the attribute data volumestakes only a few hours and can be performed off-line.
For the computation of the attributes, identificationand tracking of horizons are not required. Moreover,interpretational bias that may be introduced by thehorizon picking process is avoided.
The volume-dip attribute brings forward changesin reflection geometry. These discontinuities indicatestructural features such as faults, channels or slumps.Many of these structural and stratigraphic objects aremore easily recognized and classified on volume-diptime slices than in the original data. Colour displayof the reflection strength in combination with thegrey-scale dip map provides useful additional infor-mation. High values of reflection strengths wereobserved in structures that were identified in thevolume-dip maps as resulting from deposition in a
Ž .fan and delta front slumps Figs. 12 and 15 . Sincethese relatively strong reflections can be associatedwith a relatively sand-prone depositional environ-ment, the combined reflection strengthrdip map pro-vided a further validation of our interpretation of thevolume-dip slice.

( )P. Steeghs et al.rGlobal and Planetary Change 27 2000 245–262 261
In complex geometries, such as the zone of strongŽ .deformation in the Dongen Clay Formation Fig. 9 ,
horizon-based interpretation methods may either failto deliver the complete structural picture, or arelabour-intensive if line by line interpretation is done.In these cases, one could resort to volume-attributeanalysis to replace traditional methods for structuralseismic interpretation. The volume-dip attribute mapsprovide accurate location maps of the faults, whilecombined diprazimuth maps facilitate the interpreta-tion of the 3-D geometries. Moreover, in certaindepositional environments, such as the delta succes-sion in the L08 block, it is difficult to consistentlydefine and track horizons through the data volume.In these units, many events have a limited arealextent or highly variable reflection character. In thispaper, we demonstrated that using only the attributeimages, a fairly comprehensive interpretation of thedepositional facies can be obtained.
Acknowledgements
PS gratefully acknowledges the support of theindustrial sponsors of the Rice Consortium for Com-putational Seismic Interpretation. This is a contribu-tion to the Netherlands Environmental Earth System
Ž .Dynamics Initiative NEESDI . The seismic datavolume was made available by NITG–TNO. Theircommitment, and especially the contribution of EdDuin to this research, are gratefully acknowledged.The earlier version of this paper greatly benefitedfrom reviews by W. Ashcroft and U. Gregersen.
References
Bahorich, M., Farmer, S., 1995. 3-D seismic discontinuity forfaults and stratigraphic features: the coherence cube. LeadingEdge 14, 1053–1058.
Boogaert, A., van, H.A., Kouwe, W.F.P., 1993. Nomenclature ofthe Tertiary of the Netherlands. RGD & NOGEPA. 50, TheNetherlands.
Clausen, O.R., Korstgard, J.A., 1993. Small-scale faulting as an˚indicator of deformation mechanism in the Tertiary sediments
Ž .of the northern Danish Central Trough. J. Struct. Geol. 15 2 ,1343–1357.
Gregersen, U., 1997. Sequence stratigraphic analysis of Upper
Cenozoic deposits in the North Sea, based on conventional and3-D seismic data and well-logs, PhD Thesis, University ofAarhus, Aarhus.
Gregersen, U., 1998. Upper Cainozoic channels and fans on 3Dseismic data in the northern Norwegian North Sea. Pet. Geosci.4, 67–81.
Haskell, N. et al., 1999. Delineation of geological drilling hazardsŽ .using 3-D seismic attributes. Leading Edge 18 3 , 373–382.
Haq, B.U., Hardenbol, J., Vail, P.R., 1988. Mesozoic and Ceno-zoic chronostratigraphy and cycles of sea level change. In:
Ž .Wilgus, C.K., Posamentier, H., Roos, C.A., Kendall, C. Eds. ,Sea Level Changes—An Integrated Approach. SEPM Spec.Publ., vol. 42, pp. 71–108.
Hesthammer, J., Fossen, H., 1997. The influence of seismic noisein structural interpretation of seismic attribute maps. FirstBreak 15, 209–219.
Hoogenboom, R.C., Dalley, R.M., Poelen, H.J., 1996. Volumeinterpretation, a new approach to 3D seismic interpretation.58th Mtg. Eur. Assoc. of Expl. Geosc. and Eng., ExtendedAbstracts X001.
Kay, C.J., 1993. The growth and gross morphology of Quaternarydeltas in the southern North Sea PhD Thesis, University ofEdinborough.
Kooi, H., Cloetingh, S., Remmelts, G., 1989. Intraplate stressesand the stratigraphic evolution of the North Sea Central Graben.Geol. Mijnbouw 68, 49–72.
Kooi, H., Hettema, M., Cloetingh, S., 1991. Lithosperic dynamicsand the rapid Pliocene–Quaternary subsidence phase in thesouthern North Sea Basin. Tectonophysics 192, 245–259.
Lonergan, L., 1998. Polygonal faulting in the Tertiary of thecentral North Sea: implications for reservoir geology. In:
Ž .Coward, M.P., Daltaban, T.S., Johnson, H. Eds. , StructuralGeology in Reservoir Characterisation. Geological Society,London, Special Publications, vol. 127, pp. 191–207.
Marfurt, K.J., Scheet, R.M., Sharp, J.A., Harper, M.G., 1998.Suppression of the acquisition footprint for seismic sequenceattribute mapping. Geophysics 63, 1024–1035.
Michelsen, O., Danielsen, M., Heilmann-Clausen, C., Jordt, H.,Laursen, G., Thomsen, E., 1995. Occurrence of major se-quence stratigraphic boundaries in relation to basin develop-ment in Cenozoic deposits of the southeastern North Sea. In:
Ž .Steel, R.J., Felt, W.L., Johannessen, E.P., Mathieu, C. Eds. ,Sequence Stratigraphy: Advances and Applications for Explo-ration and Producing in Northwest Europe. Elsevier, Amster-dam, pp. 415–427. Petroleum Society.
Overeem, I., Weltje, G.J., Drijkoningen, G.G., van Spaendonck,R.L.C., Kaper, R., 1998. Geological reconstruction of a Ceno-zoic delta using 2Dr3D seismic data. NAC IV, Dutch EarthSciences Congress, Veldhoven, Abstract.
Rundberg, Y., 1989. Tertiary sedimentary history and basin evolu-tion of Norwegian North Sea between 608N–628N, an inte-grated approach, PhD Thesis, University of Trondheim, Nor-way.
Sørensen, J.C., Gregersen, U., Breiner, M., Michelsen, O., 1997.High-frequency sequence stratigraphy of Upper Cenozoic de-posits in the central and southeastern North Sea areas. Mar.
Ž .Pet. Geol. 14 2 , 99–123.

( )P. Steeghs et al.rGlobal and Planetary Change 27 2000 245–262262
Steeghs, P., 1997. Local power spectra and seismic interpretation,PhD Thesis, Delft University of Technology, Delft.
Steeghs, P., 1999. Fast computation of the sliding-window Radontransform applied to 3-D seismic attribute extraction. 69thAnnual Internat Mtg. Soc. Expl. Geophys., Expanded Ab-stracts submitted for publication.
Steeghs, P., Drijkoningen, G.G., 1996. Extraction of attributesfrom 3-D seismic data. 58th Meeting Eur. Assoc. Expl. Geo-phys. Extended Abstracts, X032.P.
Steeghs, P., Fokkema, J.T., Diephuis, G., 1998. Local Radon
power spectra for 3-D seismic attribute extraction. 68th An-nual Internat. Mtg., Soc. Expl. Geophys., Expanded Abstracts,INT 3.6.
Tigrek, S., 1998. 3D seismic interpretation and attribute analysisof the L08 block, Southern North Sea Basin, MS Thesis, DelftUniversity of Technology.
Ziegler, P.A., 1988. Evolution of the Arctic–North Atlantic andWestern Tethys. AAPG Memoir, vol. 43, Tulsa, Oklahoma.
Ziegler, P.A., 1990. Geological Atlas of Western and CentralEurope. 2nd edn. Shell Int. Petrol. Mij.