Embed Size (px)
Citation preview
Vincenzo Arcidiacono, Serkan Girgin, Elisabeth Krausmann
Seismic Vulnerability of Chemical Racks in the Cross-Aisle Direction
2 0 1 4
Report EUR 26953 EN

European Commission
Joint Research Centre Institute for the Protection and Security of the Citizen Contact information
Elisabeth Krausmann Address: Joint Research Centre, Via E. Fermi 2749, 21027 Ispra (VA), Italy E-mail: [email protected] https://ec.europa.eu/jrc Legal Notice
This publication is a Science and Policy Report by the Joint Research Centre, the European Commission’s in-house science service. It aims to provide evidence-based scientific support to the European policy-making process. The scientific output expressed does not imply a policy position of the European Commission. Neither the European Commission nor any person acting on behalf of the Commission is responsible for the use which might be made of this publication. Image credits: Barrel storage in an industrial warehouse: ©Christian D Elbert – Fotolia.com JRC92620 EUR 26953 EN ISBN 978-92-79-44410-4 ISSN 1831-9424 doi:10.2788/65727 Luxembourg: Publications Office of the European Union, 2014 © European Union, 2014 Reproduction is authorised provided the source is acknowledged.
Abstract
Information on the seismic response of chemical containers located in storage racks is very limited. Unfortunately,no clearly established data and statistics exist related to potential damage of chemical racking systems duringearthquakes. Hence, this work presents an approach for developing fragility curves for chemical racking systems inthe cross-aisle direction through dynamic non-linear analysis. It aims to simulate the structural behaviour ofvarious racking systems in the cross-aisle direction for the worst-case scenario, in order to quantify thevulnerability of chemical racks in seismic areas and to better understand the associated natech risk. Analyticalfragility curves and a fault tree model were derived and used to evaluate the probabilities of chemical containersfalling from racks. The damage state limits were considered as four levels of intensity of loss of containment. Threedamage modes (overturning, sliding, and buckling), 2 types of chemical containers (205 l metal drums and 1000 lIBCs), 3 types of rack base anchoring (unanchored, anchored-brittle, and anchored-plastic), and four rack heights(3, 4.5, 6, 7.5, 9 m) were considered in the analysis. Overall, 24 fragility curves were developed based on 26 strongmotion records from the PEER Strong Motion database. However, the analytical method employed in this studycan also be used for deriving fragility curves for other merchandise types of racking structures. In order to assessthe natech risk of a chemical rack containing a flammable substance, to test the developed fragility curves, and toillustrate the natech risk assessment and mapping capabilities of RAPID-N, a case study based on the 1786 Olivieriearthquake scenario was conducted. The findings demonstrate that chemical racks loaded with IBCs are morevulnerable than those loaded with drums and although a very robust anchorage reduces the probability ofcollapse of the rack, it increases the probability of chemical containers falling.

Seismic vulnerability of chemical racks in the cross-aisle direction
Vincenzo Arcidiacono, Serkan Girgin, Elisabeth Krausmann

Abstract Information on the seismic response of chemical containers located in storage racks is very limited. Unfortunately, no clearly established data and statistics exist related to potential damage of chemical racking systems during earthquakes. Hence, this work presents an approach for developing fragility curves for chemical racking systems in the cross-aisle direction through dynamic non-linear analysis. It aims to simulate the structural behaviour of various racking systems in the cross-aisle direction for the worst-case scenario, in order to quantify the vulnerability of chemical racks in seismic areas and to better understand the associated natech risk. Analytical fragility curves and a fault tree model were derived and used to evaluate the probabilities of chemical containers falling from racks. The damage state limits were considered as four levels of intensity of loss of containment. Three damage modes (overturning, sliding, and buckling), two types of chemical containers (205 l metal drums and 1000 l IBCs), three types of rack base anchoring (unanchored, anchored-brittle, and anchored-plastic), and four rack heights (3, 4.5, 6, 7.5, 9 m) were considered in the analysis. Overall, twenty-four fragility curves were developed based on twenty-six strong motion records from the PEER Strong Motion database. However, the analytical method employed in this study can also be used for deriving fragility curves for other merchandise types of racking structures. In order to assess the natech risk of a chemical rack containing a flammable substance, to test the developed fragility curves, and to illustrate the natech risk assessment and mapping capabilities of RAPID-N, a case study based on the 1786 Olivieri earthquake scenario was conducted. The findings demonstrate that chemical racks loaded with IBCs are more vulnerable than those loaded with drums. Moreover, although a very robust anchorage reduces the probability of collapse of the rack, it increases the probability of chemical containers falling.

Table of Contents
1 INTRODUCTION 1
2 VULNERABILITY OF RACKING SYSTEMS 2
3 MODEL DEVELOPMENT FOR CROSS-AISLE FRAMES AND CONTAINERS 4
3.1 ROCKING MODEL 6 3.2 SLIDING MODEL 9 3.3 BUCKLING MODEL 9
4 NUMERICAL RESULTS 10
4.1 GROUND MOTION RECORDS 12 4.2 FRAGILITY CURVES 12
5 CASE STUDY 19
6 CONCLUSIONS 20
7 BIBLIOGRAPHY 22
8 LIST OF SYMBOLS 24

1
1 Introduction A number of hazards can be created when storing packaged dangerous substances. These hazards can affect people working within the storage site, the emergency services in the event of an accident, the general public off site and the environment. In a chemical warehouse (Figure 1), fire is generally considered to be the greatest hazard (HSE, 2009). In rare cases, certain stored substances can undergo violent decomposition when engulfed in flame, and result in an explosion. Either event can be trigged by natural hazards or disasters. These accidents are commonly referred to as natech accidents (Showalter & Myers, 1994; Krausmann et al., 2011). For example, in the 1970 Tarnava flood, the chemical platform Tarnaveni was affected (Boca et al., 2010). Water entered the warehouse where 800 tons of carbide was stored in wooden barrels. The exothermic reaction caused a powerful explosion, which destroyed all buildings within a radius of 200 m around the warehouse. During the 1999 Kocaeli earthquake, a fire of limited size in a chemical warehouse was reported shortly after the earthquake (Girgin, 2011). Dangerous substances stored in glass containers fell down because of the strong ground motion and the contents were spread onto the ground, causing the fire. In 11 March 2011, some warehouses in Japan – because of the earthquake and the tsunami – suffered major releases of hazardous materials, because packed products fell from racks and were ripped open (Krausmann & Cruz, 2013). During a natural event, safety in a chemical warehouse depends both on the structural performance of the building and on the dynamic performance of the storage racks and their contents (Castiglioni, 2008). In particular, earthquake ground motions can cause storage racks to collapse or overturn if they are not properly designed, installed, maintained, and loaded. In addition, individual packages or containers may spill or topple off, potentially causing releases of material.
Figure 1. Intermediate Bulk Containers stored in warehouse racking (HSE, 2009). Information on the seismic response of chemical containers located in storage racks is very limited. Unfortunately, no clearly established data and statistics exist on potential damage of chemical racking systems during earthquakes. Frequently, after an earthquake event, loss of dangerous substances has been reported, with or without contemporary failure of the steel rack structural system (Castiglioni, 2008). Most probably, the structural failures were a consequence of the falling pallets and of the impact of the goods on the beams at the lower levels, creating a progressive dynamic collapse (Ng et al., 2009; Bajoria, 1986). Generally, failures of racks in earthquakes are most commonly reported in the cross-aisle direction (Castiglioni, 2008). This study aims to simulate the structural behaviour of various racking systems in the cross-aisle direction for the worst-case scenario in order to quantify the vulnerability of chemical racks in seismic areas and to better understand the associated natech risk. A set of analytical fragility curves based on numerical simulation considering both structural parameters and the variation of motion intensity was developed. The damage state limits were considered as four levels of

2
intensity of loss of containment. A fault tree model was used to evaluate the overall loss probability of chemical racks with respect to the peak ground acceleration (PGA). A simple case study to assess the natech risk of chemical racks containing flammable substances based on the 1786 Olivieri’s earthquake scenario was conducted using the JRC’s RAPID-N tool for rapid natech risk assessment and mapping (Girgin and Krausmann, 2013). The next section starts with a brief description of the typical seismic vulnerabilities of racking systems and a summary of the common layout and structural characteristics of chemical racks. Then, the proposed dynamic models used to describe the losses of dangerous substances, and the fault tree model are described. The numerical results, the case study, and the conclusions of the proposed methodology and presented fragility curves are treated in the last two sections of this report. 2 Vulnerability of Racking Systems The rack industry calls the longitudinal direction of racking systems the down-aisle direction and the transverse direction, the cross-aisle direction. The cross-aisle frame dominates the dynamic behaviour in the cross-aisle direction of racking system when subjected to earthquake forces (Castiglioni, 2008). Despite their lightness, racking systems carry a very high live load (many times larger than the designed dead load) and can reach a considerable height. These systems – if installed in a seismic zone – are vulnerable to the dynamic forces generated by the earthquake motion. The most recent seismic design standards for steel storage racks set specific tests to evaluate the performance of the key components (R.M.I., 2002a; R.M.I., 2002b; FEM, 2001; RAL, 1990; A.S., 1993; FEM, 2005). A convenient and widely adopted way to define the typical seismic vulnerability is the use of the seismic fragility concept. A seismic fragility curve is defined as the “conditional probability of an infrastructure type reaching or exceeding a specific level of damage” (Sasani et al., 2002). Empirical fragility curves are the most reliable, but due to the scarcity and ambiguities of damage observations, their derivation is not always possible. Therefore, in our case, analytical curves are the most appropriate, because it is possible to increase the observational data set by performing numerical analyses. These are evaluated from the statistical study of the numerical dynamic analysis results based often on simplified structural models (Calvi, 1999; Crowley et al., 2004). The loss of dangerous substances during an earthquake can endanger the life of the employees as well as of the population near the chemical warehouse. These losses can occur with the collapse of the entire rack as well as the falling of its containers due to the sliding and/or overturning of pallets or of containers. The sliding or overturning of chemical containers, due to the action of peak floor acceleration on the racks, and their consequent fall represents a limit state that might occur during a seismic event also in the case of a well-designed storage rack. These phenomena depend only on the dynamic friction coefficient between the pallet and the steel beam of the rack, and on the geometry of the containers. Therefore, in determining the likelihood of losses for racking systems, it is possible to identify four damage modes that could be sources for overall system losses. These modes are: 1. overturning of the racking system due to the rocking motion and the failure of the anchorage, 2. failure of the racking system due to the buckling of the bracing system, 3. falling of chemical containers from the rack due to the sliding motion, and 4. overturning of the containers with the subsequent fall from the rack. Their individual contributions can be combined with a fault tree analysis to evaluate the overall losses. The lognormal cumulative distribution was selected to model the seismic vulnerability of each of the above damage modes j, since it has been very frequently used for representing fragility relationships (FEMA, 1999; Pinto et al., 2004; Singhal & Kiremidjian, 1996). The probability for the jth damage mode Pj[DS|MIi,j] to exceed a certain damage state, given a specific value of Motion Intensity at the rack’s ith floor (MIi,j), depends hence on the two parameters μj and σj of the lognormal distribution. These parameters have to be inferred by fitting the results of the analytical models with a lognormal curve. For each damage phenomenon, the model corresponding to the best fitting with empirical data is assumed as fragility curve:

3
Pj DS MIi, j⎡⎣ ⎤⎦ = Φln MIi, j( ) − μ j
σ j
⎛
⎝⎜
⎞
⎠⎟ (1) where MIi,j is the motion intensity at the ith rack floor for the jth damage mode; and Φ is the lognormal cumulative distribution function. There are a lot of studies in the literature that explain the structural properties of representative steel industrial storage racks (Blume, J. A. & Associates, 1973; Krawinkler et al., 1979; Chen et al., 1980a; 1980b; 1981). In these studies, the fundamental periods of vibration – measured over a range of actual merchandise loading conditions – ranged from 0.2-1.0 s in the cross-aisle direction and from 0.7-3.0 s in the down-aisle direction. The first mode damping ratios ranged from 0.5-3.0% in the cross-aisle direction and 3-9% in the down-aisle direction. An experimental study of Filiatrault and Wanitkorkul (2004) observed that the racking systems are significantly more flexible and ductile, and have more dissipative capacity, in the down-aisle direction than in the cross-aisle direction. Since we are interested in worst-case situations, this study focuses on the cross-aisle direction. The standard chemical containers used in chemical warehouses (Figure 2) are individual packages stored on pallets for solid and powdery substances and 205-litre metal drums and Intermediate Bulk Containers (IBC; 450-3000 litre) for liquid substances. The quantity limits are regulated according to their class (i.e., the groupings, numbered from 1 to 9, into which dangerous goods are assigned on the basis of a common single or most significant hazard), packing group (i.e., one of three groups into which dangerous goods are divided for packaging purposes according to their degree of danger, and that are ranked in a decreasing order of danger: 1=high, 2=medium, and 3=low.), and physical state (ADR, 2012).
Figure 2. Standard chemical containers used in chemical warehouses (HSE, 2009). Storage racks are normally configured as two rows of racks that are interconnected. Storage rack bays are typically 1.0-1.1 m deep and 1.8-2.7 m wide and can accommodate two or three pallets. The overall height of pallet rack structural frames found in retail warehouse stores varies between 5 and 6 m while in industrial warehouse facilities it ranges from 12 to 15 m or more (Castiglioni et al., 2008). Generally, the height for combustible storage is limited by general fire-protection and life safety requirements (OFC, 2006; HSE, 2009). For example, the Oregon Fire Code (OFC, 2006) limits the storage height to 9.1 m for high-hazard commodities. Storages with greater heights are classified as extra-high-rack combustible storage and require special fire protection provisions. The main factors that influence the stability of the racking installation are the height-to-depth ratio and whether it is fixed to the floor or other suitable parts of the building structure (HSE, 2007). The UK Health and Safety Executive (HSE) requires that freestanding racks (i.e., not fixed to the floor) should not be used in areas where lift trucks, order pickers or other mechanical handling devices are used. Otherwise, it requires that when the height/depth ratio does not exceed 6:1 all uprights adjacent to aisles and gangways have to be fastened down with bolts (to reduce the risk of damage from accidental impact). If the height/depth ratio is higher than 6:1 but does not exceed 10:1, all uprights have to be fastened down. In any case, it is

4
important to note that in this regulation the bolts are designed to withstand the lateral impact of a mechanical device. Braced frames are typically used in the structural system in the cross-aisle direction. A recent study of Castiglioni et al. (2008) focuses on the seismic structural behaviour of steel selective pallet storage racks. In their study, typical structural elements in pallet storage racks were tested and characterized. Besides, friction coefficients (static μS and dynamic μd) between pallets and beams (i.e. wood or plastic vs. painted steel) were studied; the findings are used in the present study. The details of steel racking system dimensions, of mathematical structural models, and chosen seismic records are described in the following sections. 3 Model Development for Cross-aisle Frames and Containers Typical natech consequence scenarios (explosion, fire, toxic dispersion) depend on the type and total amount of released dangerous substances and their storage conditions (Tugnoli et al., 2007). Many difficulties arise in the prediction of a rack’s structural behaviour like buckling of the bracing or the failure of the anchoring, as it is affected by the particular geometry of their structural elements (Baldassino & Zandonini, 2001). Therefore, we split the dynamic failure of the cross-aisle frame and of chemical containers into three macro-models that consider the three different failure mechanisms, i.e., overturning, sliding, and buckling. In this report, for reasons of simplicity, only pure sliding and pure rocking were investigated, neglecting the slide-rock mode (Shenton, 1996). Sometimes, the pallet can get stuck and thus it cannot slide. Since the worst case was investigated, it was assumed that the peak floor acceleration for the rocking motion is not affected by the sliding of the pallet. In case of liquid chemical substances, the sloshing motion was neglected considering that the containers were treated as rigid blocks. In order to simplify the models, the length of the rack in the downward direction in the corridor was considered to be infinite. This assumption is reasonable and should not affect the results, because generally the length of the structure is much greater than its depth. In this study, the damage states (Xj<1=no fall; Xj≥1=fall) of chemical containers (i.e., local failures) and of the upright frame (i.e., global failure) were related to the vulnerability (i.e., damage state) of the racking system (Figure 3a) to losing its containment (i.e., when chemical containers are dropped from the frame). The damage states (DS) were defined with four levels of intensity of loss of rack containment (in other words, the percentage of containers that fall from the frame): DS0=no losses, DS1=moderate losses (≥30% of containers fall), DS2=extensive losses (≥60% containers fall), and DS3=complete loss of containment (100% containers fall). It is assumed that once the containers fall, the complete amount of substance contained therein will be released. As mentioned above, fault tree analysis was used to determine the likelihood of losses from racking systems due to the four damage modes introduced in Section 2 and discussed in more detail in the following sections. The fault tree model for earthquake-generated losses from chemical racks adopted in this study is presented in Figure 3b. The probability P of being in or exceeding a given DS, i.e. the vulnerability of a racking system to lose its containment, is analytically given by:
P DS PGA⎡⎣ ⎤⎦ =1 if DS = DS0
max maxj=1,2
Pj X j ≥ 1 MI0, j⎡⎣ ⎤⎦( ), PL,kk=0
nFF DS( )−1
∏⎧⎨⎪
⎩⎪
⎫⎬⎪
⎭⎪otherwise
⎧
⎨⎪⎪
⎩⎪⎪
(2) where nFF is the number of simultaneous floor failures – i.e., when all containers of a given floor fall – required to cause an amount of loss that is defined by a given DS; Xj are parameters that describe the failure of the system for the jth damage mode (i.e., the system falls if Xj≥1); MI0,j is the motion intensity at the ground floor; P1[X1≥1|MI0,1] and P2[X2≥1|MI0,2] are the rack collapse probabilities due to overturning and buckling (defined by Eq. (1)); and PL,k is the vector sorted in descending order of the floor’s failure probabilities Pl,i. The latter Pl,i – i.e., the falling probability of containers from the ith floor – and the number of simultaneous floor failures nFF are given by:

5
nFF DS( ) = HΔhF
+1⎛⎝⎜
⎞⎠⎟
⋅YDS
⎡
⎢⎢
⎤
⎥⎥ Pl ,i =
P4 X4 ≥ 1 MI0,4⎡⎣ ⎤⎦ i = 0
maxj=3,4
Pj X j ≥ 1 MIi, j⎡⎣ ⎤⎦( ) i > 0
⎧
⎨⎪
⎩⎪ (3) where H is the rack height; ΔhF is the inter-floor height; and YDS is a percentage that describes the loss intensity of rack containment (i.e., limit percentage of containers that fall from the frame:
DS0=0%, DS1=30%, DS2=60%, and DS3=100%). The notation⎾x⏋indicates the smallest integer not less than x. P3[X3≥1|MIi,3] and P4[X4≥1|MIi,4] are the container falling probabilities due to sliding and overturning and MIi,j is the motion intensity at the ith floor. Hence, the failure probability distribution Pj[Xj≥1|MIi,j] at the ith floor and for the jth damage mode is computed using Eq. (1). The ground motion intensity (MIi,j) is measured with a dimensionless parameter, in order to increase the number of samples needed to fit the lognormal distributions and it is defined as follows: MIi, j = PFAi
acr , j (4) where PFAi is the median Peak Floor Acceleration; and acr,j is defined as “critical horizontal acceleration” related to the jth failure mechanism. In this study, the PFAi is evaluated with a simplified procedure like that used in FEMA P-58 (FEMA, 2012). Analytically it is evaluated with a polynomial prediction equation given by:
ln PFAi
PGA⎛⎝⎜
⎞⎠⎟
= a0 + a1 ⋅hi + a2 ⋅acr,1
g+ a3 ⋅
acr,2
g with hi = ΔhF ⋅ i (5) where hi is the height of the ith floor; acr,1 and acr,2 are the critical horizontal accelerations for rack overturning (j=1) and the buckling (j=2) of the bracing system; and ak are the regression coefficients. The critical horizontal accelerations will be discussed and explained in the following sections.
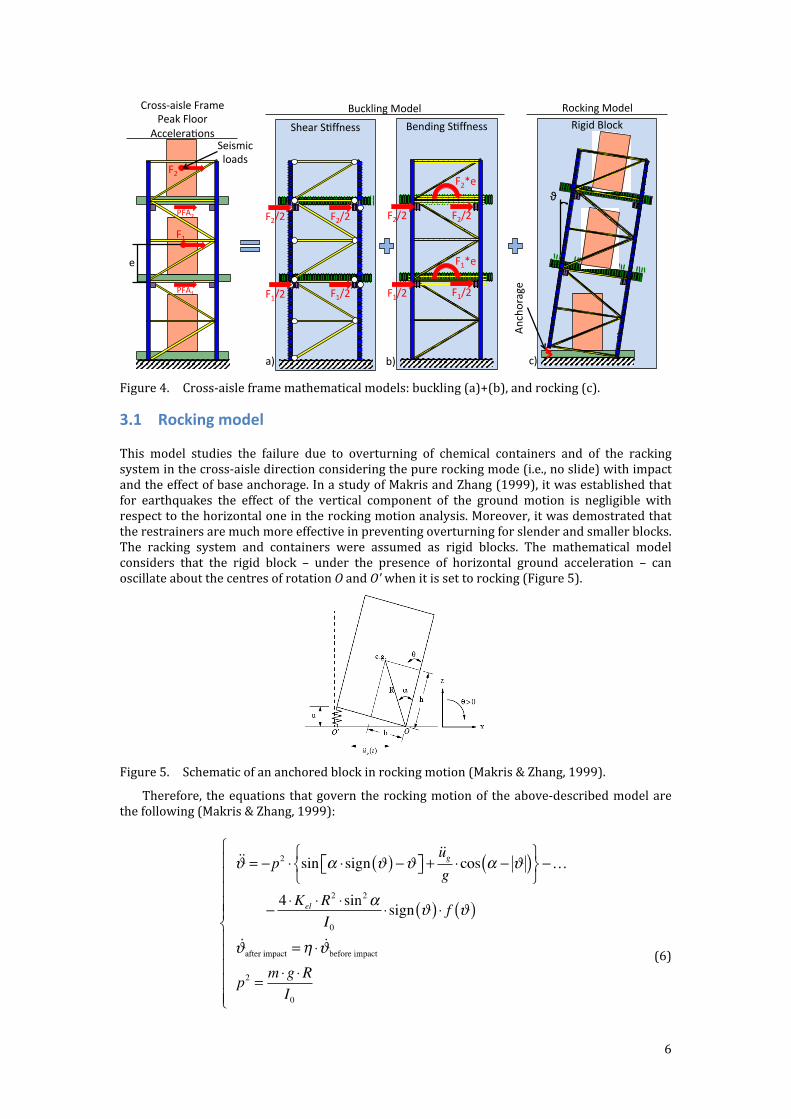
Figure 3. Cross-aisle frame configuration (a) and Fault tree model (b) adopted in this study. The dataset of peak floor accelerations was evaluated summing the effects of the buckling and of the rocking models (Figure 4), under the presence of horizontal ground acceleration. The superposition of effects is valid if the cross-aisle frame does not slide, the rocking model has small rotation, and the cantilever has small elastic deformation. The details of the racking systems, the mathematical structural models, and the chosen seismic record are described in the following sections.
Rack Vulnerability
Local
Cross-aisle Frame
Buckling
Global Failures
Overturning Sliding Overturning
MAX Columns
Pallets
Containers
Beams
Bracing
Local Failures
MAX
MAX
PL
a) b)
hi
H
MAX
ΔhB
b
ΔhF
Shelf
ϕ
Pl,2
Pl,0
Pl,1
P 4[X
4≥1|MI 2]
PFA2 PFA2
P 3[X
3≥1|MI 2]
PFA1
P 4[X
4≥1|MI 1]
PFA1
P 3[X
3≥1|MI 1]
PGA
P 4[X
4≥1|MI 0]
PGA
P 1[X
1≥1|MI 0]
PGA
P 2[X
2≥1|MI 0]
P [DS|PGA]
6
Figure 4. Cross-aisle frame mathematical models: buckling (a)+(b), and rocking (c). 3.1 Rocking model This model studies the failure due to overturning of chemical containers and of the racking system in the cross-aisle direction considering the pure rocking mode (i.e., no slide) with impact and the effect of base anchorage. In a study of Makris and Zhang (1999), it was established that for earthquakes the effect of the vertical component of the ground motion is negligible with respect to the horizontal one in the rocking motion analysis. Moreover, it was demostrated that the restrainers are much more effective in preventing overturning for slender and smaller blocks. The racking system and containers were assumed as rigid blocks. The mathematical model considers that the rigid block – under the presence of horizontal ground acceleration – can oscillate about the centres of rotation O and O' when it is set to rocking (Figure 5).
Figure 5. Schematic of an anchored block in rocking motion (Makris & Zhang, 1999). Therefore, the equations that govern the rocking motion of the above-described model are the following (Makris & Zhang, 1999):
(6)
PFA1
PFA2
Rocking Model
F2/2
F1/2
Buckling Model
Shear S ffness
Cross-aisle Frame Peak Floor
Accelera ons
F2/2
F1/2
Bending S ffness
F2/2 F2/2
F1/2 F1/2
F2*e
F1*e
Rigid Block
F2
F1
e
Anch
orag
e
ϑ
a) b) c)
Seismic loads

7
where ϑ is the rotation that describes the motion of the rigid block; I0 and m is the moment of inertia about pivot point O or O' and the mass of the block, respectively; R is the distance between the centre of gravity and the centre of rotation; g is the gravity acceleration; α is the angle defined in Figure 5; üg is the ground acceleration; Kel is the elastic stiffness of the anchorage; f(ϑ) is a function that models the nonlinear hysteretic behaviour of the anchorage; after impact and are the rotational velocity after and before the impact; η is the restitution coefficient; and p is the frequency parameter of the block. Note that the oscillation frequency of a rigid block under free vibration is not constant since it strongly depends on the vibration amplitude (Housner, 1963). Nevertheless, the quantity p is a measure of the dynamic characteristics and the limit capacity of the block. Figure 6 illustrates the force-rotation relation of an anchorage with ductile behaviour. In general, the anchorage can exhibit a post-yielding stiffness and maintain its strength until it reaches the ultimate rotation. As mentioned above, the nonlinear hysteretic behaviour of the anchorage is analytically defined by the function f(ϑ) that was defined as follows:
f ϑ( ) =
k* ⋅ ϑ 0 ≤ ϑ < ϑχ
ϑ + k* ⋅ϑχ ϑχ ≤ ϑ ≤ ϑχ + ϑY
k* ⋅ ϑ − ϑY( ) + ϑY ϑχ + ϑY < ϑ < ϑU ⋅ H ϑχ( )0 ϑ ≥ ϑU ⋅ H ϑχ( )
⎧
⎨
⎪⎪⎪
⎩
⎪⎪⎪
with χ = sign ϑ( )
k* =K pl
Kel
⎧
⎨⎪
⎩⎪ (7)
where Kpl is the plastic stiffness of the anchorage; ϑY is the elastic rotation; ϑU is the ultimate rotation; H is the Heaviside function; and ϑχ is a variable (see Figure 6) that changes on each integration step and it is analytically defined as follows:
(8) where ϑχ− and ϑχ+ are the values of the variable before and after the integration step.
Figure 6. Anchorage plastic behaviour.

8
In this study, in order to consider model and integration errors, the failure (i.e., overturning) of the rigid block occurs when the rotation reaches 90% of the angle α, or in other words, when the gravity load, i.e. the “stiffness” that returns the system to the initial state, becomes close to zero. Thus, the parameter that describes the overturning (X1 and X4), i.e. the failure of the rigid block, is defined as: X j =
max ϑ t( )α ⋅0.9
with j = 1 or 4 (9) where ϑ(t) is the rotation of the rigid block at time t evaluated integrating Eq. (6). In order to compare the anchorage types, the static horizontal acceleration ast,j needed to break the anchorage was evaluated as follows: ast, j =
2 ⋅sin α( ) ⋅ Fcr ϑcr( )m ⋅cos α −ϑcr( ) + g ⋅ tan α −ϑcr( ) with
j = 1 or 40 ≤ ϑcr ≤ ϑU
⎧⎨⎩ (10) where ϑcr is defined as the “critical rotation” that maximises the value of ast,j; and Fcr(ϑcr) is defined as the “equivalent anchorage strength”. The latter, in case of elastic-plastic behaviour, implicitly defines an equivalent model with brittle behaviour that has the same strain energy of the elastic-plastic model at ϑcr and it is given by:
Fcr ϑcr( ) =
Kel ⋅ϑcr ϑcr ≤ ϑY
FY
ϑcr
⋅ ϑcr + 1+Kpl
FY
⋅ ϑcr −ϑY( )⎡
⎣⎢
⎤
⎦⎥ ⋅ ϑcr −ϑY( )⎧
⎨⎪
⎩⎪
⎫⎬⎪
⎭⎪ϑcr > ϑY
⎧
⎨⎪⎪
⎩⎪⎪
(11) In order to compare the results of anchored with unanchored blocks, an equivalent model was defined. This model consists of an equivalent unanchored rectangular block that has the same mass and dissipates the same amount of energy when the block reaches the critical rotation (ϑ = ϑcr) and the verge of overturning (ϑ = α) with respect to the anchored model with elastic-brittle behaviour. The energy is evaluated assuming that at the verge of overturning and at the critical rotation, the kinetic energy of the block is zero, i.e. it is assumed that the earthquake excitation is terminated. The parameters that describe the equivalent model are given by:
Req = R ⋅ 1+
Fcr ϑcr( ) ⋅ϑcr ⋅sinαm ⋅ g ⋅ 1− cosϑcr( )
⎡
⎣⎢
⎤
⎦⎥
α eq = acos 1− 1− cosα( ) ⋅1+
Fcr ϑcr( ) ⋅ϑcr ⋅sinαm ⋅ g ⋅ 1− cosα( )
⎡
⎣⎢
⎤
⎦⎥
1+Fcr ϑcr( ) ⋅ϑcr ⋅sinαm ⋅ g ⋅ 1− cosϑcr( )
⎡
⎣⎢
⎤
⎦⎥
⎧
⎨
⎪⎪
⎩
⎪⎪
⎫
⎬
⎪⎪
⎭
⎪⎪
⎧
⎨
⎪⎪⎪⎪
⎩
⎪⎪⎪⎪
(12) As indicated before, the frequency parameter p is a measure of the dynamic characteristics and the limit capacity of the block. For rectangular blocks, p2 = 3g/4R, i.e. the larger the block (larger R), the smaller is p and the smaller is the probability of failure Pj[Xj≥1|MIi,j]. Hence, to consider geometrical and scale effects, the minimum static acceleration needed to initiate the rocking of the equivalent unanchored rectangular block is divided by its frequency parameter p as follows: acr , j =
g ⋅ tanα eq
3⋅ g4 ⋅ Req
(13)

9
3.2 Sliding model This model studies the falling of chemical containers from the rack floors considering the pure sliding mode. The system is modelled as the SDOF sliding system described by Denoël and Degee (2005) and is defined as follows: (14) where μS and μd are the static and dynamic friction coefficients; u is the mass displacement;
acr,3, Δu and Δv are, respectively, the critical horizontal acceleration needed to initiate sliding, and the relative displacement and velocity between the mass and the support that are given by: (15) The failure of the rigid block (i.e., when a container drops from its rack floor) occurs when the rigid block reaches the limit of relative displacement. Thus, the parameter that describes the failure for sliding (X3) is defined as: X3 =
max Δu t( )ΔuLim
(16) where ΔuLim is the relative displacement limit. 3.3 Buckling model This model studies the failure of the first floor of racking system in the cross-aisle direction due to the buckling of the diagonal bracing at the ground floor. The system is modelled as a cantilever with lumped masses superposing the effects of bending and shear flexibility as shown in Figure 4. The equations that govern the dynamic motion are the following (Chopra, 1995):
(17) where mi are the floor masses; {u} is the vector of the floor horizontal displacements; [C] is the damping matrix; and [KS] and [KB] are the stiffness matrices of the racking system considering the shear and the bending flexibilities. The bending stiffness matrix is evaluated assuming the structural model shown in Figure 4b and the inertia I of the cantilever beam: I = AC
2⋅b2 + 2 ⋅ IC
⎛⎝⎜
⎞⎠⎟ (18) where b is the inter-column distance in the cross-aisle direction (Figure 3a); and AC and IC are the area and the inertia of the upright columns. The shear stiffness matrix is evaluated assuming the structural model shown in Figure 4a and is analytically defined as follows:
(19)

10
where AB and EB are the area and the elastic modulus of the bracing trusses; ϕ is the angle defined in Figure 3a; and kS is the floor bracing stiffness. The maximum axial load NMAX due to the seismic ground motion, and the critical buckling load Ncr – assuming a buckling length factor equal to 0.5 – acting on the diagonal bracing truss of the first floor are given by: NMAX = EB ⋅ AB − EB ⋅ AB ⋅cosϕ
cos atan tanϕ −F1,MAX ⋅ cos−1ϕ ⋅sin−2 ϕ
EB ⋅ AB
⎛⎝⎜
⎞⎠⎟
⎡
⎣⎢
⎤
⎦⎥
Ncr = EB ⋅ IB ⋅ π ⋅cosϕ0.5 ⋅ ΔhB
⎛⎝⎜
⎞⎠⎟
2 (20) where IB is the inertia of the diagonal truss; F1,MAX is the maximum absolute elastic force at the first floor evaluated with Eq. (17); and ΔhB is the “span” of the bracing system assuming a K-form. Besides, the critical acceleration needed to initiate the buckling at the first floor was defined as follows: acr ,2 = EB ⋅ AB ⋅ ΔhB
mi ⋅ ΔhF ⋅ ii∑
⋅sin2 ϕ ⋅ sinϕ − cosϕ ⋅ tanϕcr( ) with cosϕcr = cosϕ
1− Ncr
EB ⋅ AB
(21) In this study, in order to consider the non-linear behaviour of the bracing system, the racking system’s failure due to the buckling of the diagonal bracing at the ground floor is defined when the maximum axial load NMAX (reduced by 10% to consider model and integration errors) exceeds the critical buckling load Ncr. Thus, the parameter that describes the buckling failure (X2) is defined as: X2 = NMAX ⋅0.90Ncr
(22) 4 Numerical Results As indicated in the previous sections, the typical containers used in chemical warehouses are IBCs and metal drums. In this study, drums are assumed stacked to no more than four on a wooden pallet, which is located over a shelf (i.e., a surface that is the load level of the rack floor that, in this study, is composed of steel panels pinned on the beams of the rack, see Figure 3a). The IBCs have a plastic basement and are placed directly on the beams of the rack. The presence or absence of the shelf affects the limit states (i.e., the relative displacement limits ΔuLim) for the sliding of the containers (Table 1).
μS μd ΔuLim
[-] [-] [m]4 Drums on Wooden Pallet 0.5 0.14 0.4
IBC 0.2 0.1 0.2
Rigid Block Type
Table 1. Friction properties (Castiglioni et al., 2008) and displacement limits used for the study for chemical containers. The characteristics of standard containers used in the present study are shown in Table 2. V Self weight H B W
[L] [kg] [mm] [mm] [mm]Steel Drum 200 20.2 876 587 587
IBC (with plastic pallet) 1000 59 1160 1000 1200"Philips" Wooden Pallet - 18.5 144 1000 1200
Container Type
Table 2. Dimensions and weights of standard containers (ANSI, 1997; D'Hollander, 1993; NWPCA, 1996).

11
In the present study, racking systems with constant bays (1 m deep and 2.2 m wide; i.e. two pallets per bay) and different heights (H= 3, 4.5, 6, 7.5, 9 m) with a constant inter-floor height ΔhF of 1.5 m were studied. More than 23,000 random combinations changing the density of chemical substance and the strength of the anchorage were considered. The set of combinations used had an average density of chemical substance of about 710 kg/m3 with a standard deviation (s.d.) of about 30%. To consider the spatial distribution of the containers and the worst-case scenario, it is assumed that during the earthquake the racking systems are 80% loaded with containers. For the braced frame we assumed a K-form and a “span” ΔhB of 0.65 m (see Figure 3a). The bracing system’s elements were assumed with cross-sections of 41 x 20.6 x 1.9mm (i.e., half solid channel), while the upright columns have a section 100/20b (Castiglioni, 2008). The latter can support loads of up to 95 kN, using a safety coefficient of 1.92. The base plate is connected to the foundation surface (when anchoring configuration is assumed) by means of two M16 (grade 8.8) bolts. The ultimate strength is evaluated using a safety coefficient of 1.2 (Eurocode 3). Geometrical properties and material characteristics of frame elements are reported in Table 3. Element Type A I E Fy Fu εu
[-] [mm2] [mm4] [GPa] [MPa] [MPa] [-]Column 525.7 406100 210 348 493 25.5%
Bracing Truss 187.1 45000 210 348 493 25.5%M16 (grade 8.8) bolts 157.0 - - - 667 - Table 3. Geometrical properties and material characteristics of rack elements (Castiglioni, 2008). The reliability of the simplified structural model (i.e., buckling model) is confirmed by fundamental periods of vibration in the cross-aisle direction of the analysed racking systems that range from 0.17-0.72 s like those found in the literature (Castiglioni, 2008).
3Rack Height [m] 97.54.5 6Mean Period [s] 0.170 0.296 0.432 0.538 0.722
Standard deviation [-] 19% 18% 12% 19% 17% Table 4. Fundamental periods in the cross-aisle direction of the analysed racking systems. In accordance with the literature, a damping ratio of 2% and a restitution coefficient η equal to 0.9 were assumed for the dynamic analysis of the buckling and rocking models (Makris & Zhang, 1999). The properties of rigid blocks analysed with the rocking and sliding models are given in the Table 5. The chemical containers were assumed as unanchored, while the racking systems were studied under the assumption of three different anchorage types. When the racking system is free to rotate into the cross-aisle direction the anchorage type is “unanchored”, while it is “anchored” if the base is fastened to the floor with bolts. mean s.d. mean s.d. mean s.d. mean s.d.[rad] [-] [kg] [-] [kg*m2] [-] [m] [-]
IBC 0.725 0% 804.67 33% 678 33% 0.754 0%Drum 0.627 0% 168.59 32% 53 32% 0.503 0%
Rack (H=3) 0.283 27% 2594.09 35% 22551 35% 2.883 1%Rack (H=4.5) 0.227 27% 3670.79 35% 52879 35% 3.619 1%Rack (H=6) 0.189 28% 5100.54 27% 110244 27% 4.359 0%
Rack (H=7.5) 0.162 28% 5634.40 31% 170801 31% 5.102 0%Rack (H=9) 0.142 28% 6755.18 28% 273867 28% 5.848 0%
Rigid Block Type α m I0 R
Table 5. Properties of the analysed rigid blocks. The anchorage’s behaviour is considered “brittle” when the strength of the bolts is lower than that of the upright column; vice versa it is considered “plastic”. The characteristics of the anchorage types analysed are given in Table 6 (these are derived from the geometrical properties and material characteristics of racking system in Table 3).

12
mean s.d. mean s.d. mean s.d. mean s.d.[kN] [-] [kN] [-] [rad] [-] [rad] [-]
Anchored-Plastic 201 34% 279 34% 0.0027 0% 0.3825 0%Anchored-Brittle 287 25% - - 0.0025 - - -
Unanchored - - - - - - - -
Anchorage TypeFY FU ϑY ϑU
Table 6. Properties of the analysed anchorage type blocks. 4.1 Ground motion records Details of a set of ground motion records, which were used as the general set for the collapse fragility assessment of rack elements, are presented in Table 7. This general set, which includes 26 records, was obtained from the PEER Strong Motion database (http://peer.berkeley.edu/smcat/search.html). The records are from a variety of different geological sites including rock and soft soil conditions. The peak ground acceleration ranges from 0.45-1.78 g with a mean value of 0.89 g and a s.d. of 38%.
M D[-] [km]
P0806 Cape Mendocino 1992/04/25 CAPEMEND/CPM000 7.1 8.5P1455 Chi-Chi, Taiwan 1999/09/20 CHICHI/TCU084-W 7.6 10.4P1169 Chi-Chi, Taiwan 1999/09/20 CHICHI/CHY080-W 7.6 7.0P1532 Chi-Chi, Taiwan 1999/09/20 CHICHI/WNT-E 7.6 1.2P0409 Coalinga 1983/07/22 COALINGA/D-OLC270 5.8 8.2P0414 Coalinga 1983/07/22 COALINGA/D-TSM360 5.8 9.2P1547 Duzce, Turkey 1999/11/12 DUZCE/BOL090 7.1 17.6P0127 Gazli, USSR 1976/05/17 GAZLI/GAZ090 6.8 3.0P0178 Imperial Valley 1979/10/15 IMPVALL/H-E06230 6.5 1.0P1056 Kobe 1995/01/16 KOBE/TAZ090 6.9 1.2P0873 Landers 1992/06/28 LANDERS/LCN275 7.3 1.1P0760 Loma Prieta 1989/10/18 LOMAP/BRN090 6.9 10.3P0770 Loma Prieta 1989/10/18 LOMAP/LGP000 6.9 6.1P0449 Morgan Hill 1984/04/24 MORGAN/CYC285 6.2 0.1P0496 Nahanni, Canada 1985/12/23 NAHANNI/S1280 6.8 6.0P0935 Northridge 1994/01/17 NORTHR/TAR090 6.7 17.5P0996 Northridge 1994/01/17 NORTHR/PUL194 6.7 8.0P0530 N. Palm Springs 1986/07/08 PALMSPR/NPS210 6.0 8.2P0144 Tabas, Iran 1978/09/16 TABAS/TAB-TR 7.4 3.0P0266 Victoria, Mexico 1980/06/09 VICT/CPE045 6.4 34.8P0319 Westmorland 1981/04/26 WESTMORL/WSM180 5.8 13.3P0701 Whittier Narrows 1987/10/01 WHITTIER/A-TAR090 6.0 43.0P0082 San Fernando 1971/02/09 SFERN/PCD164 6.6 2.8P0248 Mammoth Lakes 1980/05/27 MAMMOTH/L-LUL000 6.0 20.0P0802 Erzincan, Turkey 1992/03/13 ERZIKAN/ERZ-NS 6.9 2.0P0161 Imperial Valley 1979/10/15 IMPVALL/H-BCR230 6.5 2.5
Record/ComponentRecord ID Earthquake PGA PGV PGD[g] [cm/s] [cm]
1.50 127 41.01.16 115 31.40.97 108 18.60.96 69 31.10.87 42 6.11.08 40 5.40.82 62 13.60.72 72 23.70.44 110 65.90.69 85 16.80.72 98 70.30.45 51 8.40.56 95 41.21.30 81 9.61.10 46 14.61.78 114 33.21.29 104 23.80.59 73 11.50.85 121 94.60.62 32 13.20.50 34 10.90.64 23 1.71.23 113 35.50.92 29 3.20.52 84 27.40.78 46 14.9 Table 7. Details of a set of ground motion records (where M is the magnitude; D is the distance between the station and the earthquake source; PGV and PGD are the peak ground velocities and displacements).
4.2 Fragility curves Utilizing the results of nonlinear dynamic analyses with the models presented above under the selected ground-motion forces, the polynomial regression coefficients of Eq. (5) and the lognormal fragility curve parameters (see Eq. (1)) were estimated by using the least squares method. Table 8 shows the regression coefficients for the analysed racks and the coefficient of determination R2. Height Range a0 a1 a2 a3 R2 N°
[m] [-] [-] [-] [-] [-] [-]3 - 9 -0.091 0.189 0.065 0.655 51% 32254 Table 8. Regression coefficients of the PFA prediction equation(5).

13
The four fragility curves (blue lines) fitted to the analytical datasets (red triangles) are depicted in Figure 7 with the weight coefficients of the bins (green bars) adopted to fit cumulative lognormal models. Table 9 shows the lognormal distribution parameters for overturning, sliding, and buckling failures, the coefficient of determination R2, the number of simulations N°, and the application domain of the proposed formulas. The parameters were estimated with a generalized linear regression with a Probit link function to predict the probability of collapse as a function of ln(MI) (Agresti, 2012). Generalized linear regression uses maximum likelihood for estimation and the Probit link function is equivalent to using the normal cumulative distribution function as the fragility function. σ μ R2 N° MI Domain[-] [-] [-] [-] [-]
Overturning 0.75 15.51 96% 51454 0.5-70Buckling 0.60 4.91 92% 7800 0.077-18
Sliding - ΔuLim = 0.2 m 1.01 3.02 96% 31252 0.729-45Sliding - ΔuLim = 0.4 m 1.03 6.72 97% 31252 0.729-45
Failure Mode
Table 9. Fragility curve parameters for overturning, buckling, and sliding modes. It is worth noting that the simulations for chemical containers were performed with ground and floor accelerations, derived from the buckling model, while those of the racking system were carried out only with ground accelerations. Table 10 shows the number nFF of simultaneous floor failures defined for the selected rack heights. YDS [-] H [m] 30% 60% 100%3 1 2 34.5 2 3 46 2 3 57.5 2 4 69 3 5 7 Table 10. Number nFF of simultaneous floor failures. Table 11, Table 12, Figure 8, and Figure 9 show the probabilities of being in or exceeding a given damage state (DS) – evaluated with Eq. (2) – for eighteen types of racking systems loaded with drums and IBCs. The chemical containers are assumed to be filled with a chemical substance that has a density of about 710 kg/m3 (e.g., gasoline). The eighteen types of racking systems differ in height (H = 3, 4.5, 6, 7.5, and 9 m) and anchorage type (unanchored, anchored-brittle, and anchored-plastic). The structural characteristics of the racking system (i.e., sections, inertias, bolts, etc.) have been assumed according to mechanical features described in Table 1, Table 2 and Table 3. The obtained analytical fragility curves exhibit a higher level of total falling probability (i.e.,
DS3) with increasing rack height and the decreasing of the robustness of the anchorage. At the same time, the falling probability of containers (i.e., DS1 and DS2) decreases with respect to the decreasing of the robustness of the anchorage. This effect is due to the reduction of the PFA intensity. Racks loaded with IBCs showed a higher level of falling probability of containers compared with those loaded with drums, due to the lower friction coefficient and the higher weight.

14 Figure 7. Failure probabilities for overturning, buckling, and sliding modes (Du,lim indicates the relative displacement limit).

15
Anchored-Brittle & H=3m-DS1 0% 0% 2% 5% 9% 12% 16% 20% 24% 28% 32% 36% 41% 45% 49% 52%Anchored-Brittle & H=3m-DS2 0% 0% 0% 1% 2% 4% 6% 9% 12% 15% 19% 22% 26% 29% 33% 36%Anchored-Brittle & H=3m-DS3 0% 0% 0% 1% 2% 4% 6% 9% 12% 15% 19% 22% 26% 29% 33% 36%
Anchored-Brittle & H=4.5m-DS1 0% 0% 0% 1% 3% 5% 8% 12% 16% 20% 24% 28% 32% 36% 40% 43%Anchored-Brittle & H=4.5m-DS2 0% 0% 0% 1% 3% 5% 8% 12% 16% 20% 24% 28% 32% 36% 40% 43%Anchored-Brittle & H=4.5m-DS3 0% 0% 0% 1% 3% 5% 8% 12% 16% 20% 24% 28% 32% 36% 40% 43%Anchored-Brittle & H=6m-DS1 0% 0% 0% 2% 4% 7% 11% 15% 19% 24% 28% 33% 37% 41% 45% 49%Anchored-Brittle & H=6m-DS2 0% 0% 0% 2% 4% 7% 11% 15% 19% 24% 28% 33% 37% 41% 45% 49%Anchored-Brittle & H=6m-DS3 0% 0% 0% 2% 4% 7% 11% 15% 19% 24% 28% 33% 37% 41% 45% 49%
Anchored-Brittle & H=7.5m-DS1 0% 0% 0% 2% 5% 8% 13% 18% 23% 30% 36% 42% 47% 52% 57% 61%Anchored-Brittle & H=7.5m-DS2 0% 0% 0% 2% 5% 8% 13% 18% 23% 28% 32% 37% 42% 46% 50% 53%Anchored-Brittle & H=7.5m-DS3 0% 0% 0% 2% 5% 8% 13% 18% 23% 28% 32% 37% 42% 46% 50% 53%Anchored-Brittle & H=9m-DS1 0% 0% 1% 3% 6% 10% 15% 20% 26% 31% 36% 41% 45% 50% 54% 57%Anchored-Brittle & H=9m-DS2 0% 0% 1% 3% 6% 10% 15% 20% 26% 31% 36% 41% 45% 50% 54% 57%Anchored-Brittle & H=9m-DS3 0% 0% 1% 3% 6% 10% 15% 20% 26% 31% 36% 41% 45% 50% 54% 57%Anchored-Plastic & H=3m-DS1 0% 2% 8% 15% 23% 30% 38% 46% 53% 59% 65% 69% 73% 77% 79% 82%Anchored-Plastic & H=3m-DS2 0% 0% 0% 1% 4% 6% 10% 15% 20% 26% 32% 38% 44% 49% 53% 58%Anchored-Plastic & H=3m-DS3 0% 0% 0% 0% 0% 0% 0% 0% 1% 2% 2% 4% 5% 7% 9% 11%
Anchored-Plastic & H=4.5m-DS1 0% 0% 0% 2% 4% 8% 12% 18% 24% 30% 37% 43% 48% 53% 58% 62%Anchored-Plastic & H=4.5m-DS2 0% 0% 0% 0% 0% 1% 2% 4% 7% 10% 14% 19% 23% 28% 33% 37%Anchored-Plastic & H=4.5m-DS3 0% 0% 0% 0% 0% 0% 0% 0% 0% 1% 1% 2% 3% 4% 5% 7%Anchored-Plastic & H=6m-DS1 0% 0% 1% 3% 7% 12% 18% 26% 34% 41% 48% 54% 59% 64% 68% 72%Anchored-Plastic & H=6m-DS2 0% 0% 0% 0% 1% 2% 5% 8% 12% 17% 23% 28% 34% 39% 45% 49%Anchored-Plastic & H=6m-DS3 0% 0% 0% 0% 0% 0% 0% 0% 0% 1% 1% 2% 3% 3% 4% 6%
Anchored-Plastic & H=7.5m-DS1 0% 0% 1% 3% 6% 10% 16% 23% 30% 37% 44% 50% 55% 60% 65% 69%Anchored-Plastic & H=7.5m-DS2 0% 0% 0% 0% 0% 0% 1% 1% 2% 4% 6% 9% 12% 15% 19% 23%Anchored-Plastic & H=7.5m-DS3 0% 0% 0% 0% 0% 0% 1% 1% 2% 4% 5% 7% 9% 12% 14% 17%Anchored-Plastic & H=9m-DS1 0% 0% 0% 1% 2% 4% 8% 14% 20% 26% 33% 40% 46% 51% 56% 61%Anchored-Plastic & H=9m-DS2 0% 0% 0% 0% 0% 1% 3% 5% 7% 10% 14% 18% 22% 26% 30% 34%Anchored-Plastic & H=9m-DS3 0% 0% 0% 0% 0% 1% 3% 5% 7% 10% 14% 18% 22% 26% 30% 34%
Unanchored & H=3m-DS1 0% 0% 2% 5% 8% 12% 16% 20% 24% 28% 31% 36% 40% 44% 48% 52%Unanchored & H=3m-DS2 0% 0% 0% 1% 3% 5% 8% 12% 15% 19% 24% 28% 32% 35% 39% 43%Unanchored & H=3m-DS3 0% 0% 0% 1% 3% 5% 8% 12% 15% 19% 24% 28% 32% 35% 39% 43%
Unanchored & H=4.5m-DS1 0% 0% 0% 2% 4% 7% 11% 15% 20% 24% 29% 33% 38% 42% 45% 49%Unanchored & H=4.5m-DS2 0% 0% 0% 2% 4% 7% 11% 15% 20% 24% 29% 33% 38% 42% 45% 49%Unanchored & H=4.5m-DS3 0% 0% 0% 2% 4% 7% 11% 15% 20% 24% 29% 33% 38% 42% 45% 49%Unanchored & H=6m-DS1 0% 0% 1% 2% 5% 9% 13% 18% 23% 28% 33% 38% 42% 47% 51% 54%Unanchored & H=6m-DS2 0% 0% 1% 2% 5% 9% 13% 18% 23% 28% 33% 38% 42% 47% 51% 54%Unanchored & H=6m-DS3 0% 0% 1% 2% 5% 9% 13% 18% 23% 28% 33% 38% 42% 47% 51% 54%
Unanchored & H=7.5m-DS1 0% 0% 1% 3% 6% 11% 16% 21% 27% 32% 37% 42% 47% 52% 57% 61%Unanchored & H=7.5m-DS2 0% 0% 1% 3% 6% 11% 16% 21% 27% 32% 37% 42% 47% 51% 55% 59%Unanchored & H=7.5m-DS3 0% 0% 1% 3% 6% 11% 16% 21% 27% 32% 37% 42% 47% 51% 55% 59%Unanchored & H=9m-DS1 0% 0% 1% 3% 7% 12% 18% 24% 30% 36% 41% 46% 50% 55% 59% 62%Unanchored & H=9m-DS2 0% 0% 1% 3% 7% 12% 18% 24% 30% 36% 41% 46% 50% 55% 59% 62%Unanchored & H=9m-DS3 0% 0% 1% 3% 7% 12% 18% 24% 30% 36% 41% 46% 50% 55% 59% 62%
1 1.1 1.2 1.50.6 P GA [g] Rack Type
0 0.1 0.2 0.3 0.4 0.5 1.3 1.40.7 0.8 0.9
Table 11. Numerical values of probabilities of being in or exceeding a given DS for racking systems loaded with drums.

16
Anchored-Brittle & H=3m-DS1 0% 14% 34% 50% 61% 69% 75% 80% 83% 86% 88% 90% 91% 92% 93% 94%Anchored-Brittle & H=3m-DS2 0% 1% 8% 19% 30% 40% 49% 56% 62% 68% 72% 75% 78% 81% 83% 85%Anchored-Brittle & H=3m-DS3 0% 0% 0% 1% 2% 4% 6% 9% 12% 16% 20% 23% 27% 31% 34% 37%
Anchored-Brittle & H=4.5m-DS1 0% 2% 13% 27% 40% 50% 59% 66% 71% 76% 79% 82% 85% 87% 89% 90%Anchored-Brittle & H=4.5m-DS2 0% 0% 3% 10% 19% 28% 37% 45% 52% 58% 63% 68% 71% 75% 78% 80%Anchored-Brittle & H=4.5m-DS3 0% 0% 0% 1% 3% 5% 9% 12% 16% 21% 25% 29% 33% 37% 41% 44%Anchored-Brittle & H=6m-DS1 0% 5% 21% 38% 52% 62% 70% 76% 80% 84% 87% 89% 90% 92% 93% 94%Anchored-Brittle & H=6m-DS2 0% 1% 6% 17% 29% 40% 50% 58% 64% 70% 74% 78% 81% 83% 86% 87%Anchored-Brittle & H=6m-DS3 0% 0% 0% 2% 4% 7% 11% 15% 20% 25% 29% 34% 38% 42% 46% 50%
Anchored-Brittle & H=7.5m-DS1 0% 9% 32% 51% 64% 73% 79% 84% 87% 90% 92% 93% 95% 95% 96% 97%Anchored-Brittle & H=7.5m-DS2 0% 0% 4% 13% 24% 35% 45% 53% 61% 66% 71% 75% 79% 82% 84% 86%Anchored-Brittle & H=7.5m-DS3 0% 0% 1% 2% 5% 9% 13% 18% 23% 28% 33% 38% 42% 47% 50% 54%Anchored-Brittle & H=9m-DS1 0% 4% 22% 42% 57% 67% 75% 81% 85% 88% 90% 92% 93% 95% 95% 96%Anchored-Brittle & H=9m-DS2 0% 0% 3% 10% 21% 32% 42% 51% 58% 65% 70% 74% 78% 81% 83% 85%Anchored-Brittle & H=9m-DS3 0% 0% 1% 3% 6% 10% 15% 21% 26% 32% 37% 42% 46% 50% 54% 58%Anchored-Plastic & H=3m-DS1 0% 31% 57% 72% 81% 86% 90% 92% 94% 95% 96% 97% 97% 98% 98% 98%Anchored-Plastic & H=3m-DS2 0% 7% 26% 45% 58% 68% 75% 80% 84% 87% 90% 91% 93% 94% 95% 96%Anchored-Plastic & H=3m-DS3 0% 0% 0% 0% 0% 0% 0% 1% 1% 2% 2% 3% 4% 5% 6% 7%
Anchored-Plastic & H=4.5m-DS1 0% 8% 30% 49% 63% 72% 79% 83% 87% 89% 91% 93% 94% 95% 96% 96%Anchored-Plastic & H=4.5m-DS2 0% 1% 12% 27% 41% 53% 62% 69% 75% 79% 83% 85% 88% 89% 91% 92%Anchored-Plastic & H=4.5m-DS3 0% 0% 0% 0% 0% 0% 0% 1% 1% 1% 2% 3% 4% 5% 6% 7%Anchored-Plastic & H=6m-DS1 0% 13% 38% 58% 70% 78% 84% 88% 91% 93% 94% 95% 96% 97% 97% 98%Anchored-Plastic & H=6m-DS2 0% 3% 18% 36% 50% 62% 70% 77% 81% 85% 88% 90% 91% 93% 94% 95%Anchored-Plastic & H=6m-DS3 0% 0% 0% 0% 0% 0% 0% 0% 1% 1% 2% 3% 4% 6% 7% 9%
Anchored-Plastic & H=7.5m-DS1 0% 11% 36% 55% 68% 77% 83% 87% 90% 92% 93% 95% 96% 96% 97% 97%Anchored-Plastic & H=7.5m-DS2 0% 0% 5% 16% 28% 40% 50% 59% 65% 71% 75% 79% 82% 85% 87% 88%Anchored-Plastic & H=7.5m-DS3 0% 0% 0% 0% 0% 1% 1% 2% 4% 6% 8% 11% 14% 17% 21% 24%Anchored-Plastic & H=9m-DS1 0% 5% 25% 45% 60% 71% 78% 83% 87% 90% 92% 93% 94% 95% 96% 97%Anchored-Plastic & H=9m-DS2 0% 0% 3% 12% 24% 36% 46% 55% 62% 68% 73% 77% 80% 83% 85% 87%Anchored-Plastic & H=9m-DS3 0% 0% 0% 0% 1% 2% 4% 7% 11% 15% 20% 25% 29% 34% 39% 43%
Unanchored & H=3m-DS1 0% 14% 34% 49% 61% 69% 75% 79% 83% 86% 88% 90% 91% 92% 93% 94%Unanchored & H=3m-DS2 0% 1% 8% 19% 30% 40% 49% 56% 62% 67% 72% 75% 78% 81% 83% 85%Unanchored & H=3m-DS3 0% 0% 0% 1% 3% 5% 8% 12% 16% 20% 24% 28% 32% 36% 40% 43%
Unanchored & H=4.5m-DS1 0% 2% 13% 27% 39% 50% 59% 66% 71% 76% 79% 82% 85% 87% 88% 90%Unanchored & H=4.5m-DS2 0% 0% 3% 10% 18% 28% 37% 45% 52% 58% 63% 67% 71% 74% 77% 80%Unanchored & H=4.5m-DS3 0% 0% 0% 2% 4% 7% 11% 15% 20% 25% 29% 34% 38% 42% 46% 50%Unanchored & H=6m-DS1 0% 5% 21% 38% 51% 62% 70% 76% 80% 84% 86% 89% 90% 92% 93% 94%Unanchored & H=6m-DS2 0% 1% 6% 17% 29% 40% 50% 58% 64% 70% 74% 78% 81% 83% 85% 87%Unanchored & H=6m-DS3 0% 0% 1% 2% 5% 9% 14% 18% 24% 29% 34% 38% 43% 47% 51% 55%
Unanchored & H=7.5m-DS1 0% 9% 31% 50% 64% 73% 79% 84% 87% 90% 92% 93% 94% 95% 96% 97%Unanchored & H=7.5m-DS2 0% 0% 4% 12% 24% 35% 45% 53% 60% 66% 71% 75% 79% 81% 84% 86%Unanchored & H=7.5m-DS3 0% 0% 1% 3% 6% 11% 16% 21% 27% 32% 38% 42% 47% 51% 55% 59%Unanchored & H=9m-DS1 0% 4% 22% 41% 56% 67% 75% 81% 85% 88% 90% 92% 93% 94% 95% 96%Unanchored & H=9m-DS2 0% 0% 3% 10% 21% 32% 42% 51% 58% 64% 69% 74% 77% 80% 83% 85%Unanchored & H=9m-DS3 0% 0% 1% 3% 7% 13% 18% 24% 30% 36% 41% 46% 51% 55% 59% 62%
0.4 0.5 1.3 1.40.7 0.8 0.9 P GA [g] Rack Type
0 0.1 0.2 0.3 1 1.1 1.2 1.50.6
Table 12. Numerical values of probabilities of being in or exceeding a given DS for racking systems loaded with IBCs.

17
Figure 8. Probabilities of being in or exceeding a given DS for racking systems loaded with drums.

18
Figure 9. Probabilities of being in or exceeding a given DS for racking systems loaded with IBCs.

19
5 Case Study This section provides a numerical example to assess the natech risk using the above fragility curves on chemical racks situated inside a warehouse. The RAPID-N (rapid natech risk assessment and mapping framework) was used to perform a simplified case study to assess the natech risk due to the 1786 Oliveri earthquake scenario. The framework assesses the risk of hazardous-material release, fire or explosion due to natural hazard impact (Girgin & Krausmann, 2013). This case study does not aim to assess the true risk level of the warehouse, but it aims to provide a demonstration of the potential impact of an earthquake on chemical racks. The 1786 Oliveri earthquake scenario was selected because it is well documented and a shake map calculated by the Instituto Nazionale di Geofisica e Vulcanologia (INGV) is available. The Oliveri territory is located in one of the areas with the highest seismic potential of Sicily (Meletti and Valensise, 2004). The seismic activity recorded in the last 20 years is characterized by about 3500 events with local magnitude greater than 2 and hypocentres (89% of 3500) concentrated around an average depth of about 10 km (Giunta et al., 2004). Because of its high seismic hazard the urban area of Oliveri has been the subject of first level seismic micro-zonation. The first earthquake with a destructive effect in the Oliveri area, reported in the catalogue of historical Italian seismicity, occurred on 10 March 1786. This seismic event was characterized by MW = 6.1, an epicentre with a depth of 10 km at Oliveri and an MCS intensity equal to IX in the urban area. This earthquake severely damaged all the cities of the Gulf of Patti in northern Sicily and almost destroyed the town of Oliveri (Guidoboni et al., 2007). Since the industrial area of Milazzo is the closest industrial area to the epicentre of the 1786 Olivieri earthquake, eight types of chemical racks were assumed to be located inside a hypothetical chemical warehouse within the industrial area. Figure 10 shows the PGA distribution, provided by INGV for the 1786 earthquake that ranges from 0.01 to 0.4 g.
Figure 10. Distribution of on-site PGA for the 1786 Olivieri earthquake scenario (INGV, 2014).

20
In order to assess the natech risk of chemical racks containing a flammable substance, it is assumed that the chemical containers are filled with gasoline. The TNO Single Point model was used to calculate the end-point distances. The end-point radiation intensity was assumed to be 5003 W/m2, which corresponds to 2nd degree burns (EPA, 1999). For liquid spills, the minimum pool depth that can be formed by the substance was assumed to be 1 cm as in the EPA methodology. Table 13 summarizes the characteristics of the chemical racks hypothesized for the case study. Lenght Height
[m] [m]R01 9 3 Unanchored IBC 24 GasolineR02 9 4.5 Unanchored IBC 32 GasolineR03 9 4.5 Anchored-Brittle IBC 32 GasolineR04 9 9 Anchored-Plastic IBC 56 GasolineR05 9 3 Unanchored Drum 24 GasolineR06 9 4.5 Unanchored Drum 32 GasolineR07 9 4.5 Anchored-Brittle Drum 32 GasolineR08 9 9 Anchored-Plastic Drum 56 Gasoline
Unit Anchorage Type Containers'Type
N°Containers
Substance Qstored
[kg]80% 1420880% 1894480% 1894480% 3315280% 1136680% 1515580% 1515580% 26522
Filling Level
Table 13. Characteristics of the chemical racks. Based on the input information of chemical racks discussed above and the ShakeMap provided by INGV for the 1786 Olivieri earthquake scenario, the results of the case study– as provided as RAPID-N outputs – are shown in Table 14. RAPID-N automatically determined that the industrial site is about 25 km away from the epicentre and that it was subjected to an on-site PGA of about 0.11 g. Depending on rack type and the on-site hazard parameters, RAPID-N selects the appropriate fragility curve and estimates the damage states and the consequence scenarios. In this case study, the released substance quantity (i.e., the so called QReleased) is assumed to be the same as the percentage of containers that fall from the racking system.
[m/s2]R01 1.068R02 1.068R03 1.068R04 1.068R05 1.068R06 1.068R07 1.068R08 1.068PDS = Probability
Unit PGA PDS QReleased PDS QReleased dEP PN PDS QReleased dEP PN PDS QReleased dEP PN[-] [kg] [-] [kg] [m] [-] [-] [kg] [m] [-] [-] [kg] [m] [-]84.5% 0 13.98% 4689 119 2.80% 1.50% 9519 170 0.30% 0.01% 14208 207 0.003%97.1% 0 2.66% 9472 169 0.53% 0.23% 14208 207 0.05% 0.02% 18944 239 0.005%97.0% 0 2.71% 9472 169 0.54% 0.24% 14208 207 0.05% 0.01% 18944 239 0.003%93.6% 0 6.17% 16576 224 1.23% 0.19% 24864 274 0.04% 0.00% - - - 99.6% 0 0.39% 5683 131 0.08% 0.00% - - - 0.01% 11366 185 0.002%100.0% 0 0.00% - - - 0.00% - - - 0.02% 15155 214 0.005%100.0% 0 0.00% - - - 0.00% - - - 0.01% 15155 214 0.003%100.0% 0 0.00% - - - 0.00% - - - 0.00% - - - y to be in a certain DS; PN = Natech Probability related to a DS; dEP = Pool fire's end-point distance
DS0 DS1 DS2 DS3
Table 14. Summary of the natech risk assessment results for chemical racks. According to the results of this RAPID-N test case, the minimum end-point distance for receiving 2nd degree burns is found to be 119 m with an occurrence probability of 2.8%, whereas the maximum is 239 m with a probability of 0.005%. Potential domino effects should also be considered for a more accurate assessment of the natech risk. The current version of RAPID-N does not yet support these features. Moreover, the results indicate that possibly major natech accidents are to be expected in chemical racks loaded with IBCs, because they have a lower friction coefficient and a higher weight. Although the racks R02 and R03 have the same load and height, the falling probabilities DS1 and DS2 of R03 are higher than those of R02, because the robustness of the anchorage increases the PFA intensity. 6 Conclusions This work presented an approach for developing fragility curves for chemical racking systems in the cross-aisle direction through dynamic non-linear analyses. The damage state limits of the

21
overall racking system were defined as four levels of intensity of loss of rack containment, i.e. the percentage of containers that fall from the steel storage rack. These are: DS0 = no losses, DS1 = moderate losses (≥30% of falls), DS2 = extensive losses (≥60% of falls), and DS3 = complete losses of containment (100% of falls). In order to evaluate the structural vulnerability of the chemical containers and of the overall racking system, three damage modes (i.e., overturning, sliding, and buckling) were identified. Analytical fragility curves – as a function of the PFA – were constructed for each damage mode. A fault tree model was used to evaluate the falling probabilities of chemical containers from racks as a function of the PGA combining the fragility curves of the three damage modes. In order to assess the seismic vulnerability of a suite of chemical racking systems that respect the height limits for fire protection, to evaluate the effect of the anchorage on the seismic performance, and to study the influence of the friction coefficient between chemical containers and the rack’s beams, two types of chemical containers (205 l metal drums and 1000 l IBCs), three types of rack base anchoring (unanchored, anchored-brittle, and anchored-plastic), and four rack heights (3, 4.5, 6, 7.5, 9 m) were studied. Overall twenty-four fragility curves were developed. As an input motion to the three damage models, twenty-six strong motion records were selected from the PEER Strong Motion database. In order to assess the natech risk of a chemical rack containing a flammable substance, to test the developed fragility curves, and to illustrate the natech risk assessment and mapping capabilities of RAPID-N, a case study based on the 1786 Olivieri earthquake scenario was conducted. The findings demonstrate that chemical racks loaded with IBCs are more vulnerable than those loaded with drums, because they have a lower friction coefficient and a higher weight. Moreover, although a robust anchorage reduces the probability of collapse of the rack, it increases the PFA intensity and therefore the probabilities of falling DS1 and DS2. Further studies using different layouts and types of merchandise chemical containers and of storage racks representing current construction practices and innovative systems are necessary to refine the fragility curve development for chemical racking structures. Moreover, the rack behaviour in the down-aisle direction and the structural interaction between neighbouring racks were not considered for constructing the analytical fragility curves in this study. Inclusion of these aspects in future studies is necessary. However, the analytical method employed in this study can be used for deriving fragility curves for others merchandise types of racking structures.

22
7 Bibliography ADR (2012). Applicable as from 1 January 2013: European Agreement Concerning the International Carriage of Dangerous Goods by Road. New York: United Nations. ANSI (1997). American National Standard for Steel Drums and Pails, ANSI MH2-1997: American National Standards Institution. A.S. 4084 (1993). Steel Storage Racking, Australian Standards. Agresti, A. (2012). Categorical data analysis. Wiley, New York. Bajoria, K. M. (1986). Three dimensional progressive collapse of warehouse racking (Doctoral dissertation, University of Cambridge). Baldassino, N., & Zandonini, R. (2001). Numerical and Experimental Analysis of Base-plate Connections of Steel Storage Pallet Racks. Proc. of XVIII Conference C.T.A., (pp. 127-136). Venezia. Blume, J. A. & Associates (1973). Seismic Investigation of Steel Industrial Storage Racks. Rack Manufacturer’s Institute, San Francisco, CA. Boca, G., Ozunu, A., & Vlad, Ş. (2010). Natech Risk And Management: An Assessment Of The Tarnavelor Plateau’s Specific Hazards. Present Environment And Sustainable Development, 4, 269-276. Calvi, G. (1999). A displacement based approach for vulnerability evaluation of classes of buildings. Earthquake Eng, 3 (3), 411–38. Castiglioni, C. (2008). Seismic behaviour of steel storage pallet racking systems. Milano: Politecnico di Milano – Dipartimento di Ingegneria Strutturale. Chen, C., Scholl, R., & Blume, J. (1980a). Seismic Study of Industrial Storage Racks. National Science Foundation and for the Rack Manufacturers Institute and Automated Storage and Retrieval Systems (sections of the Material Handling Institute). San Francisco, CA: John A. Blume & Associates. Chen, C., Scholl, R., & Blume, J. (1980b). Earthquake Simulation Tests of Industrial Steel Storage Racks. Seventh World Conference on Earthquake Engineering, (pp. 379-386). Istanbul, Turkey. Chen, C., Scholl, R., & Blume, J. (1981). Seismic-Resistant Design of Industrial Storage Racks. Second Specialty Conference on Dynamic Response of Structures: Experimentation, Observation and Control, (pp. 745-759). Atlanta, GA . Chopra, A. K. (1995). Dynamics of structures: Theory and applications to earthquake engineering. Englewood Cliffs, N.J: Prentice Hall. Crowley, H., Pinho, R., & Bommer, J. (2004). A probabilistic displacement-based vulnerability assessment procedure for earthquake loss estimation. Bull. Earthquake Eng., 2, 173–219. D'Hollander, O.J.L. (1993). U.S. Patent No. 5,269,414. Washington, DC: U.S. Patent and Trademark Office. Di Stefano, P., Luzio, D., Renda, P., Martorana, R., Capizzi, P., D’Alessandro, A., & Zarcone, G. (2014). Integration of HVSR measures and stratigraphic constraints for seismic microzonation studies: the case of Oliveri (ME). Nat. Hazards Earth Syst. Sci. Discuss., 2(4), 2597–2637. doi:10.5194/nhessd-2-2597-2014. Denoël, V., & Degée, H. (2005). Cas particulier d’étude analytique de l’élément à frottement. Internal report 2005-1, University of Liege, Department M&S. EPA (1999). Risk Management Program Guidance for Offsite Consequence Analysis. Eurocode 3, Design of steel structures, ENV 1993. FEM 10.2.02 (2001). The Design of Static Steel Pallet Racks, Federation Europeen de la Manutention, Vers. 1.02. FEM 10.2.08 (2005). The Seismic Design of Static Steel Pallet Racks, Federation Europeen de la Manutention, final draft, December 2005. FEMA (1999). HAZUS earthquakes loss estimation methodology. Washington: US Federal Emergency Management Agency. FEMA (2012). Seismic Performance Assessment of Buildings (FEMA P-58). Washington, D.C.: ATC-58, Applied Technology Council. Filiatrault, A., & Wanitkorkul, A. (2004). Shake Table Testing of Frazier Industrial Storage Pallet Racks. Report No. CSEE-SEESL-2004-02, University at Buffalo, State University of New York, Buffalo, NY.
23
Girgin, S. (2011). The natech events during the 17 August 1999 Kocaeli earthquake: aftermath and lessons learned. Natural Hazards and Earth System Sciences, 11, 1129–1140. Girgin, S., & Krausmann, E. (2013). RAPID-N: Rapid natech risk assessment and mapping framework. Journal of Loss Prevention in the Process Industries, 26(6), 949–960. doi:10.1016/j.jlp.2013.10.004; http://rapidn.jrc.ec.europa.eu Giunta, G., Luzio, D., Tondi, E., De Luca, L., Giorgianni, A., D’Anna, G., Renda, P., Cello, G., Nigro, F., & Vitale, M. (2004). The Palermo (Sicily) seismic cluster of September 2002, in the seismotectonic framework of the Tyrrhenian Sea-Sicily border area, Ann. Geophys.-Italy, 47, 1755–1770. Guidoboni, E., Ferrari, G., Mariotti, D., Comastri, A., Tarabusi, G., & Valensise, G. (2007). Catalogue of Strong Earthquakes in Italy (CFTI), 461BC–1997 and Mediterranean Area 760BC–1500, available at: http://storing.ingv.it/cfti4med/. Housner, G. W. (1963). The behaviour of inverted pendulum structures during earthquakes. Bull. Seismological Soc. of America 53: 404-17. HSE (2009). Chemical warehousing-The storage of packaged dangerous substances. Sudbury, Suffolk: HSE Books. HSE (2007). Warehousing and storage: a guide to health and safety. Sudbury, Suffolk: HSE Books. INGV (2014). Earthquake Planning Scenarios. Retrieved October 21, 2014, from http://shakemap.rm.ingv.it/shake/archive/scenario.html Krausmann, E., Cozzani, V., Salzano, E., Renni, E. (2011). Industrial accidents triggered by natural hazards: an emerging risk issue, Natural Hazards and Earth System Sciences, 11(3), 921-929. Krausmann, E., & Cruz, A. (2013). Impact of the 11 March 2011, Great East Japan earthquake and tsunami on the chemical industry. Natural Hazards, 67, 811–828. Krausmann, E., Cruz, A., & Affeltranger, B. (2010). The impact of the 12 May 2008 Wenchuan earthquake on industrial facilities. Journal of Loss Prevention in the Process Industries, 23 (2), 242–248. Krawinkler, H., Cofie, N., Astiz, M., & Kircher, C. (1979). Experimental Study on the Seismic Behavior of Industrial Storage Racks. The John A. Blume Earthquake Engineering Center, Department of Civil Engineering. Stanford, CA: Stanford University. Makris, N., & Zhang, J. (1999). Rocking Response and Overturning of Anchored Equipment under Seismic Excitations. PEER Report 1999/06, Pacific Earthquake Engineering Research Center, University of California, Berkeley, California. Meletti, C., & Valensise, G. (2004). Zonazione sismo genetica ZS9 – A 2 pp. al Rapporto Conclusivo, available at: http://zonesismiche.mi.ingv.it/documenti/A2pp.pdf. Ng, A. L. Y., Beale, R. G., & Godley, M. H. R. (2009). Methods of restraining progressive collapse in rack structures. Engineering Structures, 31(7), 1460-1468. NWPCA (1996). Uniform standard for wood pallets. Arlington, VA: National Wooden Pallet and Container Association. OFC (2006). 2007 Oregon fire code. County Club Hills, Il. International Code Council Beaverton, OR: distributed by Building Tech Bookstore. Pinto, P., Giannini, R., & Franchin, P. (2004). Methods for seismic reliability analysis of structures. Pavia, Italy: IUSS Press. RAL (1990). Storage and Associated Equipment, Deutsches Institut fur Gutersichcherung und Kennzeichnung (German Institute for Quality Assurance and Marketing). RMI (2002a). Specification for the design testing and utilization of industrial steel storage racks, Rack Manufacturers Institute, Charlotte, NC. 2002 edition. RMI (2002b). Commentary to Specification for the design testing and utilization of industrial steel storage racks, Rack Manufacturers Institute, Charlotte NC. Sasani, M., Der Kiureghian, A., & Bertero, V. (2002). Seismic fragility of short period reinforced concrete structural walls under near-source ground motions. Structural Safety . Shenton, H. W. (1996). Criteria for initiation of slide, rock, and slide-rock rigid-body modes. J. of Engrg. Mech. Div., 122, 690-693. Showalter, P.S., & Myers, M.F. (1994). Natural disasters in the United States as release agents of oil, chemicals, or radiological materials between 1980-9: analysis and recommendations, Risk Analysis, 14(2), 169-181. Singhal, A., & Kiremidjian, A. (1996). Method for probabilistic evaluation of seismic structural damage. Journal of Structural Engineering, 122, 1459–1467. Tugnoli, A., Cozzani, V., & Landucci G. (2007). A consequence-based approach to the quantitative assessment of inherent safety, AIChE J. 53, 3171-3182.

24
8 List of symbols
PGA Peak ground acceleration; MIi,j Motion intensity at the ith rack’s floor for the jth damage mode; μj Mean of the lognormal distribution for the jth damage mode; σj Standard deviation of the lognormal distribution for the jth damage mode; DS Damage state; Pj[DS|MIi,j] Probability for a jth damage mode that a certain damage state is exceeded, given a specific value of motion intensity at the ith rack’s floor; Φ Lognormal cumulative distribution function; P[DS|PGA] Probability of being in or exceeding a given DS, i.e. the vulnerability of racking system to lose its containment; nFF Number of simultaneous “floor’s failures” – i.e., when all containers of a given floor fall – needed to have the loss intensity defined by a given DS; Xj Parameters that describe the failure of the system for each jth damage mode (i.e., the system fall if Xj≥1); Pl,i Falling probability of containers from the ith floor; PL,k Vector sorted in descending order of the floor’s failures probabilities Pl,I; H Height; ΔhF Inter-floor height; YDS Percentage that describes the loss intensity of rack containment (i.e., limit percentage of containers that fall from the frame: DS0=0%, DS1=30%, DS2=60%, and DS3=100%); PFAi Median peak floor acceleration acr,j “Critical horizontal accelerations” related to the jth failure mechanism; hi Height of the ith floor; ak Regression coefficients of the polynomial prediction equation to determinate the
PFAi is the median Peak Floor Acceleration ϑ Rotation that describe the motion of the rigid block; I0 Moment of inertia about pivot point O or O'; m Mass of the block; R Distance between the centre of gravity and the centre of rotation; g Gravity acceleration; α Angle defined in Figure 5; üg Ground acceleration; Kel Elastic stiffness of the anchorage; f(ϑ) A function that models the nonlinear hysteretic behaviour of the anchorage; Rotational velocity after the impact; Rotational velocity before the impact;

25
η Restitution coefficient; p Frequency parameter of the rigid block; Kpl Plastic stiffness of the anchorage; FY Yielding load of the anchoring; FU Ultimate load of the anchoring; ϑY Elastic range rotation; ϑU Ultimate rotation; H() Heaviside function; ϑχ A variable that changes on each integration step (see Figure 6); ϑχ− Value of the variable before the integration step; ϑχ+ Value of the variable after the integration step; ast,j Static horizontal acceleration needed to break the anchorage; ϑc� “Critical rotation” that maximise the value of ast,j; Fcr(ϑc�) “Equivalent anchorage strength”; αeq Equivalent angle α; Req Equivalent distance between the centre of gravity and the centre of rotation; μS Static friction coefficient; μd Dynamic friction coefficient; u Mass displacement; Δu Relative displacement between the mass and the support; Δv Relative velocity between the mass and the support; ΔuLim Relative displacement limit mi Floor’s masses; {u} Vector of floor horizontal displacements; [C] Damping matrix; [KS] Stiffness matrix of the racking system considering the shear flexibility; [KS] Stiffness matrix of the racking system considering the bending flexibility; I Inertia of the cantilever beam; b Inter-column distance in the cross-aisle direction; AC Area of the upright columns; IC Inertia of the upright columns; AB Area of the bracing trusses; EB Elastic modulus of the bracing trusses; ϕ Angle defined in Figure 3a; kS Floor bracing stiffness; NMAX Maximum axial load due to the seismic ground motion acting on the diagonal bracing truss of the first floor; Ncr Critical buckling load – assuming a buckling length factor equal to 0.5 – acting on the diagonal bracing truss of the first floor;

26
IB Inertia of the diagonal truss; F1,MAX Maximum absolute elastic force at the first floor; ΔhB “Span” of the bracing system assuming a K-form; QStored Substance stored; QReleased Substance released; PDS Probability to be in a certain DS; PN Natech Probability related to a DS; dEP Pool fire's end-point distance.

Europe Direct is a service to help you find answers to your questions about the European Union Freephone number (*): 00 800 6 7 8 9 10 11 (*) Certain mobile telephone operators do not allow access to 00 800 numbers or these calls may be billed.
A great deal of additional information on the European Union is available on the Internet. It can be accessed through the Europa server http://europa.eu. How to obtain EU publications
Our publications are available from EU Bookshop (http://bookshop.europa.eu), where you can place an order with the sales agent of your choice. The Publications Office has a worldwide network of sales agents. You can obtain their contact details by sending a fax to (352) 29 29-42758. European Commission EUR 26953 EN – Joint Research Centre – Institute for the Protection and Security of the Citizen
Title: Seismic Vulnerability of Chemical Racks in the Cross-Aisle Direction Authors: Vincenzo Arcidiacono, Serkan Girgin, Elisabeth Krausmann Luxembourg: Publications Office of the European Union 2014 – 33 pp. – 21.0 x 29.7 cm EUR – Scientific and Technical Research series – ISSN 1831-9424 ISBN 978-92-79-44410-4 doi:10.2788/65727

ISBN 978-92-79-44410-4
JRC Mission As the Commission’s in-house science service, the Joint Research Centre’s mission is to provide EU policies with independent, evidence-based scientific and technical support throughout the whole policy cycle. Working in close cooperation with policy Directorates-General, the JRC addresses key societal challenges while stimulating innovation through developing new methods, tools and standards, and sharing its know-how with the Member States, the scientific community and international partners. Serving society Stimulating innovation Supporting legislation
LB-NA
-26953-EN-N
doi:10.2788/65727