Embed Size (px)
Citation preview

Selected Acquisition Report (SAR)
RCS: DD-A&T(Q&A)823-582
Cooperative Engagement Capability (CEC)As of December 31, 2012
Defense Acquisition Management Information Retrieval
(DAMIR)
May 21, 2013 15:56:45 UNCLASSIFIED

CEC December 31, 2012 SAR
May 21, 2013 15:56:45 UNCLASSIFIED 2
Table of Contents
Program Information 3Responsible Office 3References 3Mission and Description 4Executive Summary 5Threshold Breaches 6Schedule 7Performance 10Track To Budget 11Cost and Funding 14Low Rate Initial Production 28Foreign Military Sales 30Nuclear Cost 30Unit Cost 31Cost Variance 34Contracts 38Deliveries and Expenditures 42Operating and Support Cost 43

Program Information
Responsible Office
References
Program Name Cooperative Engagement Capability (CEC)
DoD Component Navy
Joint Participants U.S. Air Force Airborne Early Warning and Control System (AWACS); U.S. Army (PATRIOT); Joint Land Attack Cruise Missile Defense Elevated Netted Sensor System (JLENS)
CEC configurations include: shipboard (AN/USG-2), airborne (AN/USG-3), United States Marine Corps (USMC) ground mobile (AN/USG-4), USA JLENS (AN/USG-5), and Foreign Military Sales (FMS) (AN/USG-6/7/8)
Responsible OfficeCAPT Joseph Reason Program Executive Office Integrated Warfare Systems 1333 Isaac Hull Avenue, S.E. Washington, DC 20376-4401
Phone Fax DSN Phone DSN Fax
202-781-2029 202-781-4752 326-2029 326-4752
[email protected] Date Assigned June 27, 2012
SAR Baseline (Production Estimate)Defense Acquisition Executive (DAE) Approved Acquisition Program Baseline (APB) dated April 3, 2002 Approved APBDefense Acquisition Executive (DAE) Approved Acquisition Program Baseline (APB) dated June 16, 2004
CEC December 31, 2012 SAR
May 21, 2013 15:56:45 UNCLASSIFIED 3

Mission and Description Mission The CEC increases overall Naval Air Defense capabilities by integrating sensors and weapon assets into a single, integrated, real-time network which expands the battlespace; enhances situational awareness; increases depth of fire and enables longer intercept ranges; and improves decision and reaction times. Description CEC is a real-time sensor netting system that enables high quality situational awareness and Integrated Fire Control (IFC) capability, which revolutionizes naval air defense by providing improved accuracy, continuity, and identification consistency. This sensor netting system significantly improves Naval Carrier and Expeditionary Strike Group's Area Air Defense capabilities by extracting and distributing sensor-derived information such that the superset of this data is available to all participating CEC Cooperating Units (CUs). CEC fuses the distributed data from shipboard, airborne, Composite Tracking Network (CTN) ground mobile units, Joint Land Attack Cruise Missile Defense Elevated Netted Sensor System (JLENS), and select coalition partners into a single fire control quality air track picture. Radar measurement data from individual CUs within a CEC equipped force are transmitted to other CUs using the Line-Of-Sight Data Distribution System. A variety of automated network configurations are possible since CEC terminals provide highly directional, point-to-point data exchanges. The CEC system distributes data between sensor and weapon assets to create a single, distributed, integrated air picture that supports and enables IFC. Individual sensors on all platforms in a CEC network are used in a cooperative manner as a distributed system to obtain track information to form a single, real-time composite track. This real time composite tracking enables CEC to support Theater Air and Missile Defense allowing coordination of Naval and Joint sensor system assets among CEC-equipped ships, aircraft, and land platforms and joint operational access to engage cruise missiles that threaten joint forces in a denied access environment. CEC consists of the following variants: AN/USG-2: Shipboard designation of CEC deployed aboard the Aegis Guided Missile Cruisers, Aegis Guided Missile Destroyers, Aircraft Carriers and Amphibious Transport Dock/Amphibious Assault ships AN/USG-3: Airborne designation of CEC deployed in E-2C and E-2D aircraft AN/USG-4: United States Marine Corps CTN platform AN/USG-5: US Army JLENS platform AN/USG-6/7/8: Foreign Military Sales
CEC December 31, 2012 SAR
May 21, 2013 15:56:45 UNCLASSIFIED 4

Executive Summary The CEC program is continuing development efforts to keep pace with the security threats and ensure producibility. Currently, the focus is on upgrading legacy configurations through modernization efforts. The program remains focused on ensuring compatibility, appropriate maintenance, and ultimate disposal. The Under Secretary of Defense for Acquisition, Technology and Logistics memorandum of May 25, 2012 re-designated CEC from an Acquisition Category (ACAT) ID to an ACAT IC program with the Navy as lead component and authorized the Navy to procure the third increment of Low Rate Initial Production (LRIP) units for the CEC airborne variant. This authorized the procurement of five additional AN/USG-3B systems for a total quantity of 15. An Operational Test Readiness Review was successfully conducted on September 13, 2012 certifying entry into Initial Operational Test and Evaluation. Operational Testing will continue through third quarter of 2013, associated analysis to follow with reports by Commander Operational Test & Evaluation Force and Director, Operational Test and Evaluation expected July 2013. The AN/USG-3 Full Rate Production (FRP) Decision Review is tentatively planned for late FY 2013. CEC continues to follow an evolutionary acquisition process, delivering capability in increments of hardware and/or software upgrades. This evolutionary approach acknowledges the need for future capability improvements to pace evolutionary trends. The CEC program achieved a Milestone III FRP decision in April 2002 for the shipboard variant. The program received incremental LRIP authority for the airborne system starting in FY 2002 with the Full Operational Capability planned for FY 2013. There are no significant software-related issues with this program at this time.
CEC December 31, 2012 SAR
May 21, 2013 15:56:45 UNCLASSIFIED 5

Threshold Breaches
APB Breaches Schedule Performance Cost RDT&E
Procurement MILCON Acq O&M
O&S CostUnit Cost PAUC
APUC Nunn-McCurdy Breaches
Current UCR Baseline PAUC NoneAPUC None
Original UCR Baseline PAUC NoneAPUC None
Explanation of Breach This breach was reported in the December 2011 SAR.
CEC December 31, 2012 SAR
May 21, 2013 15:56:45 UNCLASSIFIED 6

Schedule
CEC December 31, 2012 SAR
May 21, 2013 15:56:45 UNCLASSIFIED 7

Milestones SAR Baseline Prod Est
Current APB Production
Objective/Threshold
Current Estimate
Milestone II MAY 1995 MAY 1995 NOV 1995 MAY 1995Development Contract Modification MAY 1995 MAY 1995 NOV 1995 MAY 1995Preliminary Design Review Complete FEB 1996 FEB 1996 AUG 1996 JUL 1996Baseline System Initial Operational Capability
SEP 1996 SEP 1996 MAR 1997 SEP 1996
Critical Design Review Complete AUG 1996 AUG 1996 FEB 1997 DEC 1996IOT&E (DT-IIB/OT-IIA1)
Start MAY 1997 MAY 1997 NOV 1997 MAY 1997Complete AUG 1997 AUG 1997 FEB 1998 AUG 1997
LRIP Decision DEC 1997 DEC 1997 JUN 1998 FEB 1998Low Rate Production Contract Award APR 1998 APR 1998 OCT 1998 APR 1998Service Depot Support Date OCT 2000 OCT 2000 APR 2001 OCT 2000Service Final DT&E
Start JUL 2000 JUL 2000 JAN 2001 JAN 2001Complete NOV 2000 NOV 2000 MAY 2001 MAY 2001
IOT&E - OPEVAL (OT-IIA2) Start SEP 2000 SEP 2000 MAR 2001 MAR 2001Complete NOV 2000 NOV 2000 MAY 2001 MAY 2001
Organic Support Date OCT 2001 OCT 2001 APR 2002 OCT 2001FOT&E-1 (DTIIIA/OT-IIIA)E-2C
Start JAN 2002 JAN 2002 JUL 2002 JAN 2002Complete AUG 2002 NOV 2002 MAY 2003 NOV 2002
Milestone III APR 2002 APR 2002 OCT 2002 APR 2002Full Rate Production Contract Award MAY 2002 MAY 2002 NOV 2002 APR 2002FOT&E-2 (DTIIIB/OT-IIIB)E-2C
Start MAR 2003 MAR 2004 SEP 2004 MAR 2004Complete JUL 2003 APR 2004 OCT 2004 APR 2004
Full Operational Capability DEC 2003 NOV 2004 MAY 2005 MAY 2005AIR IOC DEC 2003 NOV 2004 MAY 2005 MAY 2005
CEC December 31, 2012 SAR
May 21, 2013 15:56:45 UNCLASSIFIED 8

Acronyms And Abbreviations AIR IOC - Airborne Initial Operational Capability DT - Developmental Test DT&E - Developmental Test and Evaluation FOT&E - Follow-on Test and Evaluation IOT&E - Initial Operational Test and Evaluation LRIP - Low Rate Initial Production OPEVAL - Operational Evaluation OT - Operational Test
Change Explanations None
CEC December 31, 2012 SAR
May 21, 2013 15:56:45 UNCLASSIFIED 9

Performance
Requirements Source: Operational Requirements Document (ORD) dated January 31, 2002 and ORD Change 1 dated January 31, 2011
Classified Performance information is provided in the classified annex to this submission.
Characteristics SAR Baseline Prod Est
Current APB Production
Objective/Threshold
Demonstrated Performance
Current Estimate
Operational Availability >=.95 >=.95 >=.90 >=.94 >=.95Interoperability
Information Exchange Requirements (IER)
100% of top-level IERs
100% of top-level IERs.
100% of top-level IERs designated critical
100% of top-level IERs designated critical
100% of top-level IERs designated critical
Track File Consistency Integration will improve track file consistency in each host system
CEC integration will improve track file consistency as measured in each host system
CEC integration must not degrade track file consistency (0% degradation)as measured in each host system
CEC integration will improve track file consistency as measured in each host system
CEC integration will improve track file consistency in each host system
Change Explanations None
CEC December 31, 2012 SAR
May 21, 2013 15:56:45 UNCLASSIFIED 10

Track To Budget General MemoAll Appropriations (APPNs) and Project Elements (PEs) have been updated to align with FY 2014 President Budget (PB) values. Updated PE 0604234N from Project 3501 to Project 3051. Project element ICN 464017 reported as sunk. Project element ICN 200100 reported as sunk. Project element ICN 090000 reported as sunk. Project element ICN 096000 reported as sunk. RDT&E APPN 1319 BA 07 PE 0206313M (Navy)
Project C2273 Marine Corps Communication
Systems/Marine Corps Communication Systems
(Shared)
APPN 1319 BA 04 PE 0603658N (Navy)
Project K2039 Cooperative Engagement Capability (CEC)
Project K2616A Cooperative Engagement
Capability (CEC)/Cooperative Engagement Capability (CEC)
(Sunk)
APPN 1319 BA 05 PE 0604234N (Navy) Project 3051 Advanced Hawkeye (Shared) Project Y5EJ Advanced Hawkeye (Shared) (Sunk) Sunk in FY 2012. APPN 2040 BA 07 PE 0102419A (Army) Project E55 Army Patriot JLENS (Shared)
PE number was listed as sunk in 2011 SAR since no funding was projected beyond FY 2012 in PB 2013. The PE was listed as shared in the 2012 SAR since additional funding was allocated for FY 2013 in PB 2014.
Procurement
CEC December 31, 2012 SAR
May 21, 2013 15:56:45 UNCLASSIFIED 11

APPN 1109 BA 01 PE 0206313M (Navy) ICN 464017 Procurement, Marine Corps (Shared) (Sunk) Sunk in FY 2014. APPN 1506 BA 01 PE 0204152N (Navy)
ICN 019500 E-2C (Early Warning) HAWKEYE (MYP)
(Shared)
APPN 1611 BA 02 PE 0204112N (Navy) ICN 200100 CVN Replacement Program (Shared) (Sunk) Sunk in FY 2014. ICN 208600 Refueling Complex Overhaul (Shared) APPN 1611 BA 05 PE 0204228N (Navy) ICN 211900 DDG 1000, 1001 (Shared) (Sunk) Sunk in FY 2008. APPN 1611 BA 02 PE 0204222N (Navy) ICN 211900 DDG 1002 (Shared) (Sunk) Sunk in FY 2010. ICN 212200 DDG-51 (Shared) APPN 1611 BA 03 PE 0204411N (Navy) ICN 303500 LHD-1 (Shared) (Sunk) ICN 303600 LPD-17 (Shared) ICN 304100 LHA 8 (Shared) APPN 1810 BA 01 PE 0204228N (Navy) ICN 090000 DDG Modernization (Shared) (Sunk) Sunk in FY 2014. APPN 1810 BA 01 PE 0204162N (Navy) ICN 096000 Cruiser Modernization (Shared) (Sunk) Sunk in FY 2013. APPN 1810 BA 02 PE 0204228N (Navy)
CEC December 31, 2012 SAR
May 21, 2013 15:56:45 UNCLASSIFIED 12

ICN 260600 Cooperative Engagement Capability (CEC)
APPN 1810 BA 02 PE 0204221N (Navy)
ICN 260600 Cooperative Engagement Capability (CEC)
(Sunk)
CEC December 31, 2012 SAR
May 21, 2013 15:56:45 UNCLASSIFIED 13

Cost and Funding Cost Summary
Total Acquisition Cost and Quantity
BY2002 $M BY2002 $M TY $M
Appropriation SAR Baseline Prod Est
Current APB Production
Objective/Threshold
Current Estimate
SAR Baseline Prod Est
Current APB Production Objective
Current Estimate
RDT&E 2028.1 2435.7 2679.3 2808.41
1946.5 2394.3 2927.3
Procurement 2095.2 2095.2 2304.7 1518.1 2364.2 2364.2 1769.3
Flyaway 1759.8 -- -- 1317.2 1985.6 -- 1517.6
Recurring 1759.8 -- -- 1317.2 1985.6 -- 1517.6
Non Recurring 0.0 -- -- 0.0 0.0 -- 0.0
Support 335.4 -- -- 200.9 378.6 -- 251.7
Other Support 335.4 -- -- 200.9 378.6 -- 251.7
Initial Spares 0.0 -- -- 0.0 0.0 -- 0.0
MILCON 0.0 0.0 -- 0.0 0.0 0.0 0.0
Acq O&M 0.0 0.0 -- 0.0 0.0 0.0 0.0
Total 4123.3 4530.9 N/A 4326.5 4310.7 4758.5 4696.6 1 APB Breach
QuantitySAR Baseline
Prod EstCurrent APB Production Current Estimate
RDT&E 16 27 30Procurement 256 256 222Total 272 283 252
CEC December 31, 2012 SAR
May 21, 2013 15:56:45 UNCLASSIFIED 14

Cost and Funding Funding Summary
Appropriation and Quantity Summary FY2014 President's Budget / December 2012 SAR (TY$ M)
Program funding and production quantities listed in this SAR are consistent with the FY 2014 President's Budget (PB). The FY 2014 PB did not reflect the enacted DoD appropriation for FY 2013, nor sequestration; it reflected the President's requested amounts for FY 2013.
Appropriation Prior FY2013 FY2014 FY2015 FY2016 FY2017 FY2018To
Complete Total
RDT&E 2473.0 61.3 76.6 70.7 89.0 77.8 78.9 0.0 2927.3
Procurement 1279.6 78.7 57.2 65.8 68.3 80.6 74.9 64.2 1769.3
MILCON 0.0 0.0 0.0 0.0 0.0 0.0 0.0 0.0 0.0
Acq O&M 0.0 0.0 0.0 0.0 0.0 0.0 0.0 0.0 0.0
PB 2014 Total 3752.6 140.0 133.8 136.5 157.3 158.4 153.8 64.2 4696.6
PB 2013 Total 3764.3 146.1 150.4 167.7 166.6 172.4 44.1 162.7 4774.3
Delta -11.7 -6.1 -16.6 -31.2 -9.3 -14.0 109.7 -98.5 -77.7
Quantity Undistributed Prior FY2013 FY2014 FY2015 FY2016 FY2017 FY2018To
Complete Total
Development 30 0 0 0 0 0 0 0 0 30Production 0 145 11 7 8 10 12 11 18 222PB 2014 Total 30 145 11 7 8 10 12 11 18 252PB 2013 Total 30 142 12 9 14 10 12 10 30 269Delta 0 3 -1 -2 -6 0 0 1 -12 -17
CEC December 31, 2012 SAR
May 21, 2013 15:56:45 UNCLASSIFIED 15

Cost and Funding Annual Funding By Appropriation
Annual Funding TY$ 1319 | RDT&E | Research, Development, Test, and Evaluation, Navy
Fiscal Year
Quantity
End Item Recurring Flyaway
TY $M
Non End Item
Recurring Flyaway
TY $M
Non Recurring Flyaway TY $M
Total Flyaway TY $M
Total Support TY $M
Total Program
TY $M
1994 -- -- -- -- -- -- 203.2
1995 -- -- -- -- -- -- 154.1
1996 -- -- -- -- -- -- 256.4
1997 -- -- -- -- -- -- 224.7
1998 -- -- -- -- -- -- 200.8
1999 -- -- -- -- -- -- 189.8
2000 -- -- -- -- -- -- 179.8
2001 -- -- -- -- -- -- 173.4
2002 -- -- -- -- -- -- 106.7
2003 -- -- -- -- -- -- 107.1
2004 -- -- -- -- -- -- 91.1
2005 -- -- -- -- -- -- 114.0
2006 -- -- -- -- -- -- 99.8
2007 -- -- -- -- -- -- 55.0
2008 -- -- -- -- -- -- 53.4
2009 -- -- -- -- -- -- 44.2
2010 -- -- -- -- -- -- 65.8
2011 -- -- -- -- -- -- 59.6
2012 -- -- -- -- -- -- 60.0
2013 -- -- -- -- -- -- 58.9
2014 -- -- -- -- -- -- 76.6
2015 -- -- -- -- -- -- 70.7
2016 -- -- -- -- -- -- 89.0
2017 -- -- -- -- -- -- 77.8
2018 -- -- -- -- -- -- 78.9
Subtotal 22 -- -- -- -- -- 2890.8
CEC December 31, 2012 SAR
May 21, 2013 15:56:45 UNCLASSIFIED 16

Annual Funding BY$ 1319 | RDT&E | Research, Development, Test, and Evaluation, Navy
Fiscal Year
Quantity
End Item Recurring Flyaway
BY 2002 $M
Non End Item
Recurring Flyaway
BY 2002 $M
Non Recurring Flyaway
BY 2002 $M
Total Flyaway
BY 2002 $M
Total Support
BY 2002 $M
Total Program
BY 2002 $M
1994 -- -- -- -- -- -- 224.2
1995 -- -- -- -- -- -- 166.8
1996 -- -- -- -- -- -- 272.9
1997 -- -- -- -- -- -- 236.3
1998 -- -- -- -- -- -- 209.4
1999 -- -- -- -- -- -- 195.7
2000 -- -- -- -- -- -- 182.7
2001 -- -- -- -- -- -- 173.8
2002 -- -- -- -- -- -- 105.9
2003 -- -- -- -- -- -- 104.7
2004 -- -- -- -- -- -- 86.7
2005 -- -- -- -- -- -- 105.7
2006 -- -- -- -- -- -- 89.7
2007 -- -- -- -- -- -- 48.3
2008 -- -- -- -- -- -- 46.0
2009 -- -- -- -- -- -- 37.6
2010 -- -- -- -- -- -- 55.1
2011 -- -- -- -- -- -- 48.7
2012 -- -- -- -- -- -- 48.1
2013 -- -- -- -- -- -- 46.3
2014 -- -- -- -- -- -- 59.0
2015 -- -- -- -- -- -- 53.5
2016 -- -- -- -- -- -- 66.1
2017 -- -- -- -- -- -- 56.7
2018 -- -- -- -- -- -- 56.4
Subtotal 22 -- -- -- -- -- 2776.3
CEC December 31, 2012 SAR
May 21, 2013 15:56:45 UNCLASSIFIED 17
Annual Funding TY$ 2040 | RDT&E | Research, Development, Test, and Evaluation, Army
Fiscal Year
Quantity
End Item Recurring Flyaway
TY $M
Non End Item
Recurring Flyaway
TY $M
Non Recurring Flyaway TY $M
Total Flyaway TY $M
Total Support TY $M
Total Program
TY $M
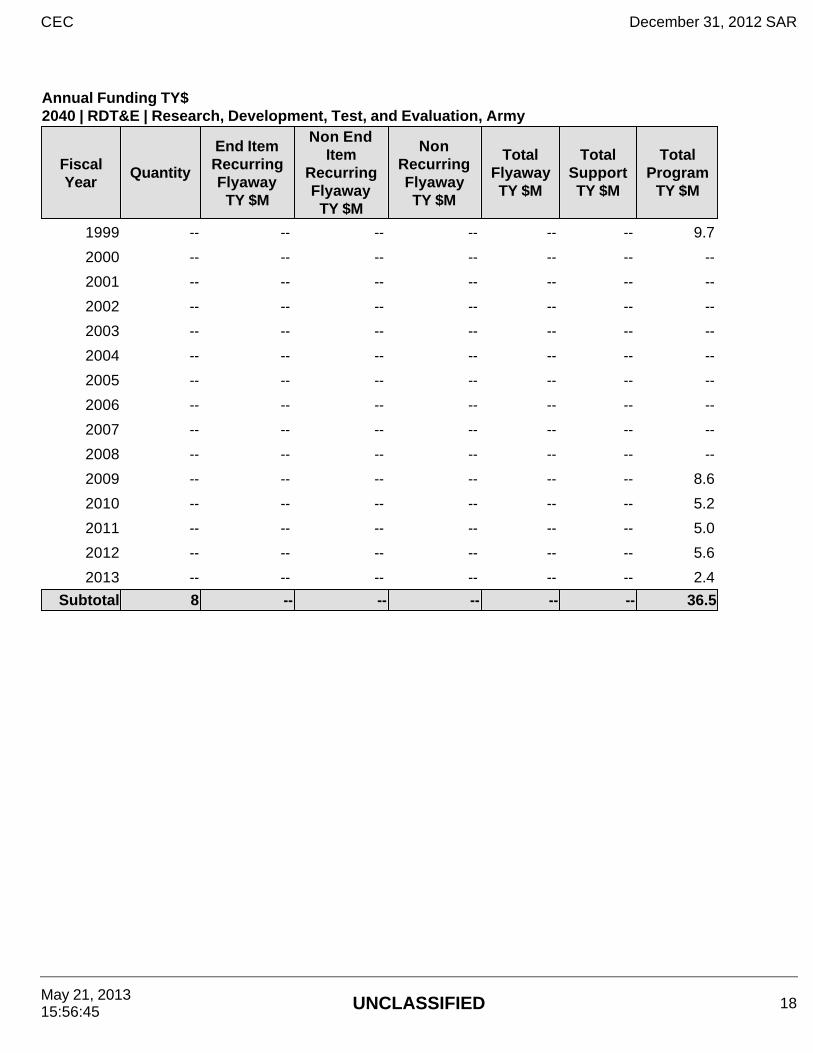
1999 -- -- -- -- -- -- 9.7
2000 -- -- -- -- -- -- --
2001 -- -- -- -- -- -- --
2002 -- -- -- -- -- -- --
2003 -- -- -- -- -- -- --
2004 -- -- -- -- -- -- --
2005 -- -- -- -- -- -- --
2006 -- -- -- -- -- -- --
2007 -- -- -- -- -- -- --
2008 -- -- -- -- -- -- --
2009 -- -- -- -- -- -- 8.6
2010 -- -- -- -- -- -- 5.2
2011 -- -- -- -- -- -- 5.0
2012 -- -- -- -- -- -- 5.6
2013 -- -- -- -- -- -- 2.4
Subtotal 8 -- -- -- -- -- 36.5
CEC December 31, 2012 SAR
May 21, 2013 15:56:45 UNCLASSIFIED 18

Annual Funding BY$ 2040 | RDT&E | Research, Development, Test, and Evaluation, Army
Fiscal Year
Quantity
End Item Recurring Flyaway
BY 2002 $M
Non End Item
Recurring Flyaway
BY 2002 $M
Non Recurring Flyaway
BY 2002 $M
Total Flyaway
BY 2002 $M
Total Support
BY 2002 $M
Total Program
BY 2002 $M
1999 -- -- -- -- -- -- 10.0
2000 -- -- -- -- -- -- --
2001 -- -- -- -- -- -- --
2002 -- -- -- -- -- -- --
2003 -- -- -- -- -- -- --
2004 -- -- -- -- -- -- --
2005 -- -- -- -- -- -- --
2006 -- -- -- -- -- -- --
2007 -- -- -- -- -- -- --
2008 -- -- -- -- -- -- --
2009 -- -- -- -- -- -- 7.3
2010 -- -- -- -- -- -- 4.3
2011 -- -- -- -- -- -- 4.1
2012 -- -- -- -- -- -- 4.5
2013 -- -- -- -- -- -- 1.9
Subtotal 8 -- -- -- -- -- 32.1
CEC December 31, 2012 SAR
May 21, 2013 15:56:45 UNCLASSIFIED 19

Annual Funding TY$ 1109 | Procurement | Procurement, Marine Corps
Fiscal Year
Quantity
End Item Recurring Flyaway
TY $M
Non End Item
Recurring Flyaway
TY $M
Non Recurring Flyaway TY $M
Total Flyaway TY $M
Total Support TY $M
Total Program
TY $M
2008 -- -- 3.0 -- 3.0 -- 3.0
2009 10 16.0 -- -- 16.0 -- 16.0
2010 -- -- -- -- -- -- --
2011 -- -- 11.3 -- 11.3 -- 11.3
2012 -- -- 3.8 -- 3.8 -- 3.8
Subtotal 10 16.0 18.1 -- 34.1 -- 34.1
CEC December 31, 2012 SAR
May 21, 2013 15:56:45 UNCLASSIFIED 20

Annual Funding BY$ 1109 | Procurement | Procurement, Marine Corps
Fiscal Year
Quantity
End Item Recurring Flyaway
BY 2002 $M
Non End Item
Recurring Flyaway
BY 2002 $M
Non Recurring Flyaway
BY 2002 $M
Total Flyaway
BY 2002 $M
Total Support
BY 2002 $M
Total Program
BY 2002 $M
2008 -- -- 2.6 -- 2.6 -- 2.6
2009 10 13.5 -- -- 13.5 -- 13.5
2010 -- -- -- -- -- -- --
2011 -- -- 9.1 -- 9.1 -- 9.1
2012 -- -- 3.0 -- 3.0 -- 3.0
Subtotal 10 13.5 14.7 -- 28.2 -- 28.2
CEC December 31, 2012 SAR
May 21, 2013 15:56:45 UNCLASSIFIED 21

Annual Funding TY$ 1506 | Procurement | Aircraft Procurement, Navy
Fiscal Year
Quantity
End Item Recurring Flyaway
TY $M
Non End Item
Recurring Flyaway
TY $M
Non Recurring Flyaway TY $M
Total Flyaway TY $M
Total Support TY $M
Total Program
TY $M
2000 6 35.0 -- -- 35.0 -- 35.0
2001 1 14.7 -- -- 14.7 -- 14.7
2002 5 27.6 -- -- 27.6 -- 27.6
2003 6 33.3 -- -- 33.3 -- 33.3
2004 6 27.9 -- -- 27.9 -- 27.9
2005 -- -- -- -- -- -- --
2006 -- -- -- -- -- -- --
2007 -- -- -- -- -- -- --
2008 -- -- -- -- -- -- --
2009 2 7.7 -- -- 7.7 -- 7.7
2010 3 12.6 -- -- 12.6 -- 12.6
2011 5 16.3 -- -- 16.3 -- 16.3
2012 5 15.6 -- -- 15.6 -- 15.6
2013 5 15.9 -- -- 15.9 -- 15.9
2014 5 16.1 -- -- 16.1 -- 16.1
2015 5 16.4 -- -- 16.4 -- 16.4
2016 6 20.1 -- -- 20.1 -- 20.1
2017 8 27.3 -- -- 27.3 -- 27.3
2018 8 27.7 -- -- 27.7 -- 27.7
2019 8 28.2 -- -- 28.2 -- 28.2
2020 8 28.7 -- -- 28.7 -- 28.7
2021 2 7.3 -- -- 7.3 -- 7.3
Subtotal 94 378.4 -- -- 378.4 -- 378.4
CEC December 31, 2012 SAR
May 21, 2013 15:56:45 UNCLASSIFIED 22

Annual Funding BY$ 1506 | Procurement | Aircraft Procurement, Navy
Fiscal Year
Quantity
End Item Recurring Flyaway
BY 2002 $M
Non End Item
Recurring Flyaway
BY 2002 $M
Non Recurring Flyaway
BY 2002 $M
Total Flyaway
BY 2002 $M
Total Support
BY 2002 $M
Total Program
BY 2002 $M
2000 6 35.1 -- -- 35.1 -- 35.1
2001 1 14.6 -- -- 14.6 -- 14.6
2002 5 27.0 -- -- 27.0 -- 27.0
2003 6 32.0 -- -- 32.0 -- 32.0
2004 6 26.1 -- -- 26.1 -- 26.1
2005 -- -- -- -- -- -- --
2006 -- -- -- -- -- -- --
2007 -- -- -- -- -- -- --
2008 -- -- -- -- -- -- --
2009 2 6.5 -- -- 6.5 -- 6.5
2010 3 10.4 -- -- 10.4 -- 10.4
2011 5 13.1 -- -- 13.1 -- 13.1
2012 5 12.3 -- -- 12.3 -- 12.3
2013 5 12.3 -- -- 12.3 -- 12.3
2014 5 12.2 -- -- 12.2 -- 12.2
2015 5 12.2 -- -- 12.2 -- 12.2
2016 6 14.7 -- -- 14.7 -- 14.7
2017 8 19.6 -- -- 19.6 -- 19.6
2018 8 19.5 -- -- 19.5 -- 19.5
2019 8 19.5 -- -- 19.5 -- 19.5
2020 8 19.4 -- -- 19.4 -- 19.4
2021 2 4.9 -- -- 4.9 -- 4.9
Subtotal 94 311.4 -- -- 311.4 -- 311.4
CEC December 31, 2012 SAR
May 21, 2013 15:56:45 UNCLASSIFIED 23

Annual Funding TY$ 1611 | Procurement | Shipbuilding and Conversion, Navy
Fiscal Year
Quantity
End Item Recurring Flyaway
TY $M
Non End Item
Recurring Flyaway
TY $M
Non Recurring Flyaway TY $M
Total Flyaway TY $M
Total Support TY $M
Total Program
TY $M
1995 1 13.9 -- -- 13.9 1.6 15.5
1996 1 11.3 -- -- 11.3 0.1 11.4
1997 -- -- -- -- -- -- --
1998 3 31.8 -- -- 31.8 3.2 35.0
1999 1 9.0 -- -- 9.0 0.9 9.9
2000 2 14.3 -- -- 14.3 1.7 16.0
2001 2 12.3 -- -- 12.3 1.1 13.4
2002 2 15.4 -- -- 15.4 1.7 17.1
2003 1 5.8 -- -- 5.8 0.8 6.6
2004 1 6.3 -- -- 6.3 0.6 6.9
2005 1 7.6 -- -- 7.6 0.6 8.2
2006 2 12.6 -- -- 12.6 1.3 13.9
2007 3 16.8 -- -- 16.8 5.9 22.7
2008 2 12.8 -- -- 12.8 3.3 16.1
2009 3 13.8 -- -- 13.8 6.4 20.2
2010 1 6.9 -- -- 6.9 0.7 7.6
2011 3 12.1 -- -- 12.1 4.9 17.0
2012 2 9.1 -- -- 9.1 2.8 11.9
2013 4 19.0 -- -- 19.0 4.8 23.8
2014 1 5.0 -- -- 5.0 1.4 6.4
2015 2 8.9 -- -- 8.9 2.4 11.3
2016 3 14.9 -- -- 14.9 3.9 18.8
2017 3 14.7 -- -- 14.7 3.9 18.6
2018 2 9.4 -- -- 9.4 2.5 11.9
Subtotal 46 283.7 -- -- 283.7 56.5 340.2
CEC December 31, 2012 SAR
May 21, 2013 15:56:45 UNCLASSIFIED 24

Annual Funding BY$ 1611 | Procurement | Shipbuilding and Conversion, Navy
Fiscal Year
Quantity
End Item Recurring Flyaway
BY 2002 $M
Non End Item
Recurring Flyaway
BY 2002 $M
Non Recurring Flyaway
BY 2002 $M
Total Flyaway
BY 2002 $M
Total Support
BY 2002 $M
Total Program
BY 2002 $M
1995 1 14.7 -- -- 14.7 1.7 16.4
1996 1 11.8 -- -- 11.8 0.1 11.9
1997 -- -- -- -- -- -- --
1998 3 32.0 -- -- 32.0 3.2 35.2
1999 1 8.9 -- -- 8.9 0.9 9.8
2000 2 13.8 -- -- 13.8 1.7 15.5
2001 2 11.5 -- -- 11.5 1.0 12.5
2002 2 14.3 -- -- 14.3 1.6 15.9
2003 1 5.1 -- -- 5.1 0.7 5.8
2004 1 5.3 -- -- 5.3 0.5 5.8
2005 1 6.2 -- -- 6.2 0.5 6.7
2006 2 9.9 -- -- 9.9 1.0 10.9
2007 3 12.6 -- -- 12.6 4.4 17.0
2008 2 9.3 -- -- 9.3 2.4 11.7
2009 3 9.7 -- -- 9.7 4.5 14.2
2010 1 4.7 -- -- 4.7 0.5 5.2
2011 3 8.0 -- -- 8.0 3.2 11.2
2012 2 5.9 -- -- 5.9 1.8 7.7
2013 4 12.1 -- -- 12.1 3.0 15.1
2014 1 3.1 -- -- 3.1 0.9 4.0
2015 2 5.5 -- -- 5.5 1.4 6.9
2016 3 9.0 -- -- 9.0 2.3 11.3
2017 3 8.7 -- -- 8.7 2.3 11.0
2018 2 5.4 -- -- 5.4 1.5 6.9
Subtotal 46 227.5 -- -- 227.5 41.1 268.6
CEC December 31, 2012 SAR
May 21, 2013 15:56:45 UNCLASSIFIED 25

Annual Funding TY$ 1810 | Procurement | Other Procurement, Navy
Fiscal Year
Quantity
End Item Recurring Flyaway
TY $M
Non End Item
Recurring Flyaway
TY $M
Non Recurring Flyaway TY $M
Total Flyaway TY $M
Total Support TY $M
Total Program
TY $M
1998 5 55.2 -- -- 55.2 12.1 67.3
1999 5 79.7 -- -- 79.7 1.7 81.4
2000 3 53.2 -- -- 53.2 6.0 59.2
2001 6 36.4 -- -- 36.4 -- 36.4
2002 4 77.6 -- -- 77.6 6.4 84.0
2003 6 64.9 -- -- 64.9 6.1 71.0
2004 4 60.4 -- -- 60.4 5.8 66.2
2005 3 60.9 -- -- 60.9 6.2 67.1
2006 3 21.2 -- -- 21.2 3.8 25.0
2007 5 34.4 -- -- 34.4 3.6 38.0
2008 4 33.1 -- -- 33.1 5.8 38.9
2009 4 29.3 -- -- 29.3 4.9 34.2
2010 5 42.4 -- -- 42.4 8.2 50.6
2011 5 42.8 -- -- 42.8 8.7 51.5
2012 3 24.3 -- -- 24.3 10.3 34.6
2013 2 25.8 -- -- 25.8 13.2 39.0
2014 1 19.7 -- -- 19.7 15.0 34.7
2015 1 15.3 -- -- 15.3 22.8 38.1
2016 1 11.9 -- -- 11.9 17.5 29.4
2017 1 16.3 -- -- 16.3 18.4 34.7
2018 1 16.6 -- -- 16.6 18.7 35.3
Subtotal 72 821.4 -- -- 821.4 195.2 1016.6
CEC December 31, 2012 SAR
May 21, 2013 15:56:45 UNCLASSIFIED 26

.
Annual Funding BY$ 1810 | Procurement | Other Procurement, Navy
Fiscal Year
Quantity
End Item Recurring Flyaway
BY 2002 $M
Non End Item
Recurring Flyaway
BY 2002 $M
Non Recurring Flyaway
BY 2002 $M
Total Flyaway
BY 2002 $M
Total Support
BY 2002 $M
Total Program
BY 2002 $M
1998 5 57.3 -- -- 57.3 12.5 69.8
1999 5 81.6 -- -- 81.6 1.8 83.4
2000 3 53.7 -- -- 53.7 6.1 59.8
2001 6 36.3 -- -- 36.3 -- 36.3
2002 4 76.3 -- -- 76.3 6.3 82.6
2003 6 62.6 -- -- 62.6 5.9 68.5
2004 4 56.9 -- -- 56.9 5.4 62.3
2005 3 55.8 -- -- 55.8 5.6 61.4
2006 3 18.8 -- -- 18.8 3.4 22.2
2007 5 29.8 -- -- 29.8 3.2 33.0
2008 4 28.2 -- -- 28.2 5.0 33.2
2009 4 24.7 -- -- 24.7 4.1 28.8
2010 5 35.0 -- -- 35.0 6.7 41.7
2011 5 34.7 -- -- 34.7 7.1 41.8
2012 3 19.3 -- -- 19.3 8.2 27.5
2013 2 20.1 -- -- 20.1 10.4 30.5
2014 1 15.1 -- -- 15.1 11.5 26.6
2015 1 11.5 -- -- 11.5 17.1 28.6
2016 1 8.8 -- -- 8.8 12.9 21.7
2017 1 11.8 -- -- 11.8 13.3 25.1
2018 1 11.8 -- -- 11.8 13.3 25.1
Subtotal 72 750.1 -- -- 750.1 159.8 909.9
CEC December 31, 2012 SAR
May 21, 2013 15:56:45 UNCLASSIFIED 27

Low Rate Initial Production
The Current Total LRIP Quantity is more than 10% of the total production quantity due to the requirements (1) to meet ship installation schedules, (2) to outfit Land Based Test Sites in preparation for completion of Operational Testing (OT), and (3) to maintain the Minimum Sustaining Rate for production of CEC systems pending completion of OT and entry into Full Rate Production (FRP). A total of 79 AN/USG-2 (shipboard) and AN/USG-3 (airborne) Low-Rate Initial Production (LRIP) systems have been authorized and procured as follows: LRIP-1 - The Office of the Assistant Secretary of the Navy (Research Development and Acquisition) (ASN(RD&A)) memorandum of March 2, 1998 to the Program Executive Office (PEO) for Theater Air Defense; and ASN (RD&A) memorandum of August 24, 1998 to the PEO for Theater Air Defense and Surface Combatants authorized the procurement of seven systems. These seven systems represented two percent of the total procurement quantity of 295 planned at that time. LRIP-2 - The ASN(RD&A) memorandum of May 14, 1999 to the PEO for Theater Surface Combatants authorized the procurement of seven systems. LRIP-3 - The ASN(RD&A) memorandum of April 7, 2000 to the PEO for Theater Surface Combatants authorized the procurement of twelve systems. LRIP-4 - The Under Secretary of Defense (Acquisition, Technology and Logistics) (USD (AT&L)) memorandum of May 4, 2001, to the Secretary of the Navy (SECNAV) authorized the procurement of seven systems and four foundations for E-2C aircraft. (Four backfit kits were later procured to complete four LRIP systems for E-2C.) LRIP-5/6 - The USD (AT&L) memorandum of April 3, 2002, to the SECNAV and the Chairman, Joint Chiefs of Staff authorized the procurement of five AN/USG-3 (airborne) systems in FY 2002 and six AN/USG-3 systems in FY 2003. LRIP-7/8 - The USD (AT&L) memorandum of September 4, 2003 to the SECNAV authorized two more years of LRIP for the airborne version (AN/USG-3), two in FY 2004 and two in FY 2005, with FRP pending successful completion of Follow-On Test and Evaluation. LRIP-9 - The USD (AT&L) memorandum of January 19, 2009 to the SECNAV authorized an increase in the total LRIP quantity for the CEC program of an additional 14 AN/USG-3A systems to support the production of E-2D Advanced Hawkeye (AHE) aircraft beginning in FY 2009.
LRIP-10 - The USD (AT&L) memorandum of February 12, 2010 to the SECNAV authorized the second LRIP of up to six complete AN/USG-3B systems and the procurement of up to two additional Single Data Processor with Sierra II
Initial LRIP Decision Current Total LRIP Approval Date 3/2/1998 5/25/2012 Approved Quantity 7 79 Reference LRIP-1 – ASN (RDA) ADM
LRIP-13 – USD (AT&L) ADM
Start Year 1998 1998 End Year 1998 2012
CEC December 31, 2012 SAR
May 21, 2013 15:56:45 UNCLASSIFIED 28

chip (SDP-S) components to support the E-2D AHE LRIP. SDP-S procurement authorizes partial system buy, and does not constitute an increase in total LRIP system quantities.
LRIP-11 - The USD (AT&L) memorandum of August 27, 2010 authorized the Navy to procure one additional LRIP Lot 2 (FY 2010 increment) CEC AN-USG 3B system to support one additional E-2D AHE aircraft as included in the DoD Appropriations Act 2010, Public Law 111-118. The authority to procure one additional unit increased the total authorized CEC LRIP Lot 2 quantity to seven. LRIP-12 - The USD (AT&L) memorandum of December 5, 2011 authorized the Navy to procure one additional CEC AN/USG-3B unit as part of the FY 2011 LRIP Lot 2. The authority to procure one additional unit increased the total authorized CEC LRIP Lot 2 quantity to eight. This decision also authorized an increase in the total CEC AN/USG-3A/B LRIP quantity to not more than 16 units. LRIP-13 - The USD (AT&L) memorandum of May 25, 2012 authorized the Navy to procure up to five complete AN/USG-3B systems as part of the LRIP Lot 3. In addition, the memorandum re-designated the CEC program from an Acquisition Category (ACAT) ID to an ACAT IC program with the Navy as the lead component.
CEC December 31, 2012 SAR
May 21, 2013 15:56:45 UNCLASSIFIED 29

Nuclear Cost
Foreign Military Sales
The CEC Program Office, in conjunction with the Integrated Warfare Systems International Program Office, has active Foreign Military Sales (FMS) cases with the United Kingdom, Australia and Canada towards integration of the CEC capability across their respective fleets in compliance with United States Government directives and FMS requirements. The FMS cases are not included in this SAR as they have been deemed sensitive by these individual countries.
None
CEC December 31, 2012 SAR
May 21, 2013 15:56:45 UNCLASSIFIED 30
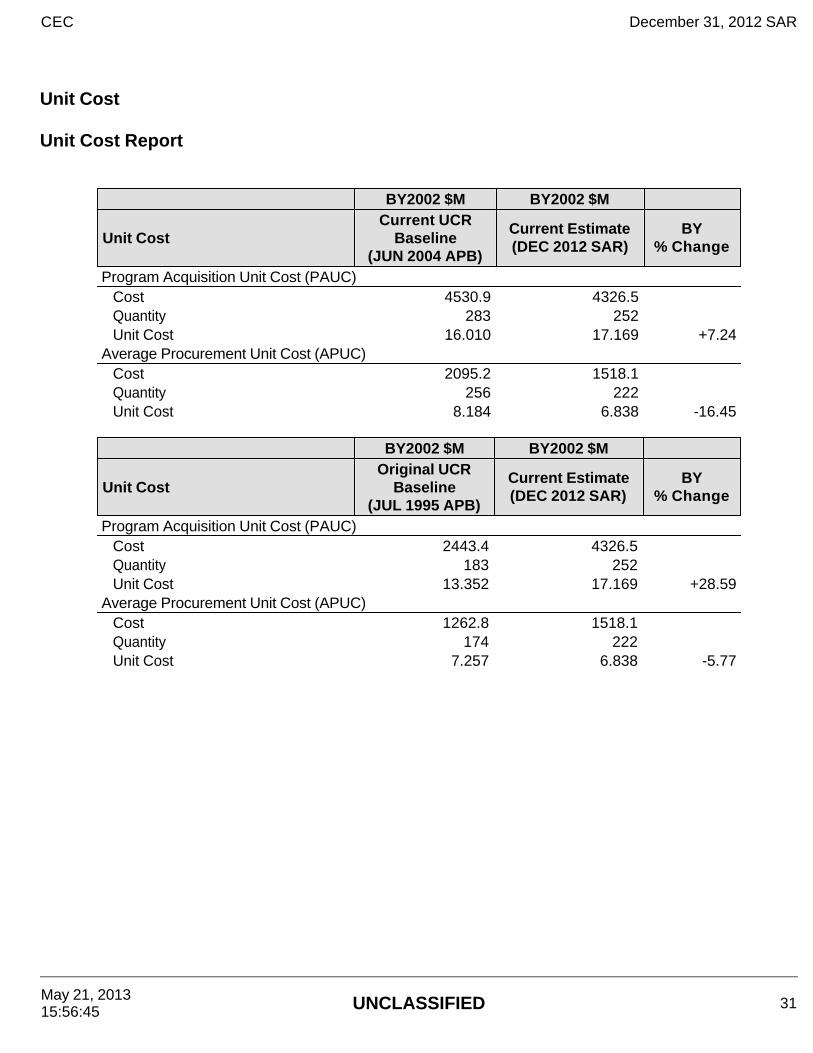
Unit Cost Unit Cost Report
BY2002 $M BY2002 $M
Unit Cost Current UCR
Baseline (JUN 2004 APB)
Current Estimate (DEC 2012 SAR)
BY % Change
Program Acquisition Unit Cost (PAUC) Cost 4530.9 4326.5Quantity 283 252Unit Cost 16.010 17.169 +7.24
Average Procurement Unit Cost (APUC) Cost 2095.2 1518.1Quantity 256 222Unit Cost 8.184 6.838 -16.45
BY2002 $M BY2002 $M
Unit Cost Original UCR
Baseline (JUL 1995 APB)
Current Estimate (DEC 2012 SAR)
BY % Change
Program Acquisition Unit Cost (PAUC) Cost 2443.4 4326.5Quantity 183 252Unit Cost 13.352 17.169 +28.59
Average Procurement Unit Cost (APUC) Cost 1262.8 1518.1Quantity 174 222Unit Cost 7.257 6.838 -5.77
CEC December 31, 2012 SAR
May 21, 2013 15:56:45 UNCLASSIFIED 31

Unit Cost History
BY2002 $M TY $MDate PAUC APUC PAUC APUC
Original APB JUL 1995 13.326 7.257 14.061 8.222APB as of January 2006 JUN 2004 16.010 8.184 16.814 9.235Revised Original APB N/A N/A N/A N/A N/APrior APB APR 2002 15.159 8.184 15.848 9.235Current APB JUN 2004 16.010 8.184 16.814 9.235Prior Annual SAR DEC 2011 16.333 6.924 17.748 8.155Current Estimate DEC 2012 17.169 6.838 18.637 7.970
SAR Unit Cost History
Initial SAR Baseline to Current SAR Baseline (TY $M)
Initial PAUC Dev Est
Changes PAUC Prod Est Econ Qty Sch Eng Est Oth Spt Total
14.060 -0.656 -2.840 0.590 0.420 5.010 0.000 -0.736 1.788 15.848
Current SAR Baseline to Current Estimate (TY $M)
PAUC Prod Est
Changes PAUC Current Est Econ Qty Sch Eng Est Oth Spt Total
15.848 0.371 -0.066 0.760 1.431 0.428 0.000 -0.135 2.789 18.637
CEC December 31, 2012 SAR
May 21, 2013 15:56:45 UNCLASSIFIED 32

Initial SAR Baseline to Current SAR Baseline (TY $M)
Initial APUC Dev Est
Changes APUC Prod Est Econ Qty Sch Eng Est Oth Spt Total
8.220 -0.532 -0.797 0.291 -0.439 1.761 0.000 0.731 1.015 9.235
Current SAR Baseline to Current Estimate (TY $M)
APUC Prod Est
Changes APUC Current Est Econ Qty Sch Eng Est Oth Spt Total
9.235 0.247 -0.321 0.140 -0.583 -0.595 0.000 -0.153 -1.265 7.970
SAR Baseline History
Item/Event SAR
Planning Estimate (PE)
SAR Development Estimate (DE)
SAR Production
Estimate (PdE)
Current Estimate
Milestone I N/A N/A N/A N/AMilestone II N/A MAY 1995 MAY 1995 MAY 1995Milestone III N/A OCT 1998 APR 2002 APR 2002IOC N/A SEP 1996 SEP 1996 SEP 1996Total Cost (TY $M) N/A 2573.1 4310.7 4696.6Total Quantity N/A 183 272 252Prog. Acq. Unit Cost (PAUC) N/A 14.061 15.848 18.637
Initial Operational Capability (IOC) identified above refers to the CEC Shipboard configuration, AN/USG-2. Full Operational Capability occurred in conjunction with Air IOC in May 2005.
CEC December 31, 2012 SAR
May 21, 2013 15:56:45 UNCLASSIFIED 33

Cost Variance
Summary Then Year $MRDT&E Proc MILCON Total
SAR Baseline (Prod Est) 1946.5 2364.2 -- 4310.7Previous Changes
Economic +32.5 +40.9 -- +73.4Quantity +51.6 -296.0 -- -244.4Schedule +81.7 +40.0 -- +121.7Engineering +490.2 -161.2 -- +329.0Estimating +222.7 -66.4 -- +156.3Other -- -- -- --Support -- +27.6 -- +27.6
Subtotal +878.7 -415.1 -- +463.6Current Changes
Economic +6.0 +14.0 -- +20.0Quantity -- -89.3 -- -89.3Schedule +78.9 -9.0 -- +69.9Engineering -- +31.7 -- +31.7Estimating +17.2 -65.6 -- -48.4Other -- -- -- --Support -- -61.6 -- -61.6
Subtotal +102.1 -179.8 -- -77.7Total Changes +980.8 -594.9 -- +385.9CE - Cost Variance 2927.3 1769.3 -- 4696.6CE - Cost & Funding 2927.3 1769.3 -- 4696.6
CEC December 31, 2012 SAR
May 21, 2013 15:56:45 UNCLASSIFIED 34

Summary Base Year 2002 $MRDT&E Proc MILCON Total
SAR Baseline (Prod Est) 2028.1 2095.2 -- 4123.3Previous Changes
Economic -- -- -- --Quantity +47.8 -237.9 -- -190.1Schedule +60.5 -37.2 -- +23.3Engineering +427.4 -124.0 -- +303.4Estimating +174.8 +50.1 -- +224.9Other -- -- -- --Support -- -91.3 -- -91.3
Subtotal +710.5 -440.3 -- +270.2Current Changes
Economic -- -- -- --Quantity -- -64.3 -- -64.3Schedule +56.4 -5.7 -- +50.7Engineering -- +22.6 -- +22.6Estimating +13.4 -46.2 -- -32.8Other -- -- -- --Support -- -43.2 -- -43.2
Subtotal +69.8 -136.8 -- -67.0Total Changes +780.3 -577.1 -- +203.2CE - Cost Variance 2808.4 1518.1 -- 4326.5CE - Cost & Funding 2808.4 1518.1 -- 4326.5
Previous Estimate: December 2011
CEC December 31, 2012 SAR
May 21, 2013 15:56:45 UNCLASSIFIED 35

RDT&E $M
Current Change ExplanationsBase Year
Then Year
Revised escalation indices. (Economic) N/A +6.0Stretch out of CEC Research, Development, Test and Evaluation (RDT&E) effort to FY
2018. (Schedule) +56.4 +78.9
Additional United States Marine Corps (USMC) RDT&E funding for integration with CEC. (Estimating) +13.2 +17.3
CEC RDT&E budget offset for Small Business Innovative Research (SIBR) and other miscellaneous budget reductions. (Estimating) -2.8 -3.7
Additional Joint Land Attack Cruise Missile Defense Elevated Netted Sensor System (JLENS) Army RDT&E funding to support JLENS integration. (Estimating) +4.2 +5.2
Adjustment for current and prior escalation. (Estimating) -1.2 -1.6RDT&E Subtotal +69.8 +102.1
Procurement $M
Current Change ExplanationsBase Year
Then Year
Revised escalation indices. (Economic) N/A +14.0Total Quantity variance resulting from an increase of three CEC systems from 43 to 46
(Navy). (Subtotal) +11.0 +18.9
Quantity variance resulting from an increase of three CEC systems from 43 to 46 (Navy). (Quantity) (QR) (+15.7) (+27.0)
Allocation to Schedule resulting from Quantity change. (Schedule) (QR) (+1.0) (+1.7)Allocation to Engineering resulting from Quantity change. (Engineering) (QR) (-4.1) (-7.1)Allocation to Estimating resulting from Quantity change. (Estimating) (QR) (-1.6) (-2.7)
Total Quantity variance due to a decrease of 20 CEC systems from 92 to 72 (Navy). (Subtotal) -71.2 -103.6
Quantity variance due to a decrease of 20 CEC systems from 92 to 72 (Navy). (Quantity) (QR) (-101.9) (-148.3)
Allocation to Schedule resulting from Quantity change. (Schedule) (QR) (-6.7) (-9.6)Allocation to Engineering resulting from Quantity change. (Engineering) (QR) (+26.7) (+38.8)Allocation to Estimating resulting from Quantity change. (Estimating) (QR) (+10.7) (+15.5)
20 CEC OPN systems removed. (Quantity) (QR) +21.9 +32.0Stretch-out of procurement buy profile to FY 2018 (Navy). (Schedule) 0.0 +0.4Stretch out of CEC Other Procurement, Navy (OPN) schedule to FY 2018. (Schedule) +24.0 +32.6Schedule stretch out due to OPN funding reduction. (Schedule) 0.0 -0.1APN schedule realignment. (Schedule) -24.0 -34.3APN procurement profile realigned. (Schedule) 0.0 +0.3Reduced CEC budget controls/program improvements. (Estimating) -8.2 -14.2Reduction to accommodate changes in Carrier, Fixed Wing Aircraft, Nuclear (CVN)
profile. (Estimating) -2.5 -4.0
Adjustment for current and prior escalation. (Estimating) -2.4 -3.2CEC OPN realignment for hardware installations. (Estimating) +0.5 +1.4Reconciliation of prior years funding. (Estimating) -12.1 -17.0
CEC December 31, 2012 SAR
May 21, 2013 15:56:45 UNCLASSIFIED 36

Realized unit cost savings Aircraft Procurement, Navy (APN). (Estimating) -26.6 -36.5Procurement Marine Corps (PMC) funding reduction due to realignment of PMC funds.
(Estimating) -4.0 -4.9
Adjustment for current and prior escalation. (Support) -0.5 -0.7Decrease CEC software integration support. (Support) -38.9 -56.2Decrease in technical integration and installation support services. (Subtotal) -3.8 -4.7
Decrease in Other Support due to Ship Construction, Navy (SCN) funding reductions (Support) (-0.5) (-0.3)
Decrease in Quantity related technical integration and installation support due to SCN funding reductions. (Support) (QR) (-3.3) (-4.4)
Procurement Subtotal -136.8 -179.8 (QR) Quantity Related
CEC December 31, 2012 SAR
May 21, 2013 15:56:45 UNCLASSIFIED 37

Contracts
Appropriation: RDT&E Contract Name Design Agent/Engineering Services Contractor Raytheon - Network Centric Systems Contractor Location 8333 Bryan Dairy Road
Largo, FL 33777-1444 Contract Number, Type N00024-08-C-5202, CPFF Award Date January 17, 2008 Definitization Date June 06, 2008
Initial Contract Price ($M) Current Contract Price ($M) Estimated Price At Completion ($M) Target Ceiling Qty Target Ceiling Qty Contractor Program Manager
9.7 N/A N/A 336.9 N/A N/A 336.9 336.9
Variance Cost Variance Schedule Variance Cumulative Variances To Date (9/28/2012) +0.4 0.0 Previous Cumulative Variances +0.3 0.0 Net Change +0.1 +0.0
Cost And Schedule Variance Explanations The favorable net change in the cost variance is due to realignment of tasks to lower labor categories for system and software lab maintenance efforts.
Contract Comments The difference between the Initial Contract Price Target and the Current Contract Price Target is due to increases in current target price for additional Design Agent /Engineering Services (DA/ES) efforts. This contract includes labor, facilities, engineering, and technical support services required for CEC System Design Agent Services, support equipment, and computer program installations as well as Engineering and Technical services in support of existing CEC assets, Common Equipment Sets, auxiliary equipment, and stand alone equipment. The Program Manager, Contractor, and Performance Estimated Price at Completion (EPAC) reflect the EPAC for the Design Agent Services portion of the contract only. This contract has been extended to September 30, 2013. Contract price data is current as of March 22, 2013.
CEC December 31, 2012 SAR
May 21, 2013 15:56:45 UNCLASSIFIED 38

Appropriation: Procurement Contract Name FY08 - FY11 CEC Production Contractor Raytheon - Network Centric Systems Contractor Location 8333 Bryan Dairy Road
Largo, FL 33777-1444 Contract Number, Type N00024-08-C-5203, FFP Award Date July 21, 2008 Definitization Date July 21, 2008
Initial Contract Price ($M) Current Contract Price ($M) Estimated Price At Completion ($M) Target Ceiling Qty Target Ceiling Qty Contractor Program Manager
29.4 N/A 13 191.5 N/A 54 183.6 183.6
Cost And Schedule Variance Explanations Cost and Schedule variance reporting is not required on this FFP contract.
Contract Comments The difference between the Initial Contract Price Target and the Current Contract Price Target is due to increases from the first increment of funding provided at the base year of the contract and the value of the total contract price at award, including incentive fees to be earned. This contract is more than 90% complete; therefore, this is the final report for this contract. This contract includes CEC production requirements for CEC systems. Requirements for associated Installation and Checkoutkits and Planar Array Antenna Assembliesbackfit are also included. Contract price data is current as of March 22, 2013.
CEC December 31, 2012 SAR
May 21, 2013 15:56:45 UNCLASSIFIED 39

Appropriation: Procurement Contract Name CEC SDP-S Production Contractor Sechan Electronics Inc Contractor Location 525 Furnace Hills Pike
Lititz, PA 17543-8902 Contract Number, Type N00024-12-D-5203/1, IDIQ/FFP Award Date December 20, 2011 Definitization Date December 20, 2011
Initial Contract Price ($M) Current Contract Price ($M) Estimated Price At Completion ($M) Target Ceiling Qty Target Ceiling Qty Contractor Program Manager
13.8 N/A N/A 18.7 N/A N/A 64.2 64.2
Cost And Schedule Variance Explanations Cost and Schedule variance reporting is not required on this IDIQ/FFP contract.
General Contract Variance Explanation This contract is a Firm Fixed Price (FFP) Indefinite Delivery Indefinite Quantity (IDIQ) contract and does not require Earned Value (EV) reporting.
Contract Comments The difference between the Initial Contract Price Target and the Current Contract Price Target is due to the award of Delivery Order (D.O.) 0002 on February 13, 2013. This is a D.O. contract to procure Signal Data Processor with Sierra Chip (SDP-S). Contract price data is current as of March 22, 2013.
CEC December 31, 2012 SAR
May 21, 2013 15:56:45 UNCLASSIFIED 40

Appropriation: Procurement Contract Name CEC Production UCA Contractor Raytheon - Network Centric Systems Contractor Location 8333 Bryan Dairy Road
Largo, FL 33777-1444 Contract Number, Type N00024-12-C-5231, FFP Award Date September 28, 2012 Definitization Date May 03, 2013
Initial Contract Price ($M) Current Contract Price ($M) Estimated Price At Completion ($M) Target Ceiling Qty Target Ceiling Qty Contractor Program Manager
16.4 N/A N/A 16.4 N/A N/A 99.2 99.2
Cost And Schedule Variance Explanations Cost and Schedule variance reporting is not required on this FFP contract.
Contract Comments This is the first time this contract is being reported. This is an Undefinitized Contract Action for CEC production systems. The $16.4 million value represents the first increment of funds at the base year of the contract. Contract price data is current of as of March 22, 2013.
CEC December 31, 2012 SAR
May 21, 2013 15:56:45 UNCLASSIFIED 41

Deliveries and Expenditures
The above data is current as of 3/31/2013.
Deliveries To Date Plan To Date Actual To Date Total Quantity Percent
Delivered Development 30 30 30 100.00% Production 120 120 222 54.05% Total Program Quantities Delivered 150 150 252 59.52%
Expenditures and Appropriations (TY $M) Total Acquisition Cost 4696.6 Years Appropriated 20 Expenditures To Date 3723.0 Percent Years Appropriated 71.43% Percent Expended 79.27% Appropriated to Date 3892.6 Total Funding Years 28 Percent Appropriated 82.88%
CEC December 31, 2012 SAR
May 21, 2013 15:56:45 UNCLASSIFIED 42

Operating and Support Cost
CEC Assumptions and Ground RulesCost Estimate Reference: The Operating and Support (O&S) cost estimate reflected in the Office of the Secretary of Defense Cost Analysis Improvement Group report dated February 19, 2002 supported the AN/USG-2 Milestone III Production and Deployment (formerly Full-Rate Production (FRP)) decision. Cost estimates will be updated prior to the AN/USG-3B FRP scheduled for late FY 2013. Sustainment Strategy: The O&S costs are based on 251 total systems with a service-life of 20 years. Costs include: costs for prime contractor in-service engineering support , costs of continuing engineering support for Navy in-house facilities and software maintenance costs, costs to operate and maintain CEC training and support equipment, and modification kit procurement and installation costs beyond FY 2010. Antecedent Information: There is no antecedent system.
Unitized O&S Costs BY2002 $K
Cost Element CEC Avg Annual Sys Cost
No Antecedent System (Antecedent)
No Antecedent SystemUnit-Level Manpower 3.4 0.0Unit Operations 274.0 0.0Maintenance 16.7 0.0Sustaining Support 127.0 0.0Continuing System Improvements 103.9 0.0Indirect Support 6.6 0.0Other 0.0 0.0Total 531.6 --
Unitized Cost Comments: Unitized costs reflect average annual system costs and do not include antecedent system values as there was no antecedent system.
CEC December 31, 2012 SAR
May 21, 2013 15:56:45 UNCLASSIFIED 43

Total O&S Cost $M
Current Production APB
Objective/ThresholdCurrent Estimate
CEC CEC No Antecedent System
(Antecedent)Base Year 0.0 0.0 2668.4 N/AThen Year 0.0 N/A 3749.6 N/A
Total O&S Costs Comments: The O&S cost values are based on the 2002 Program Life Cycle Cost Estimate (PLCCE). The PLCCE and other cost documents (Cost Analysis Requirements Document and Acquisition Program Baseline) are in development with plans to be completed in the fourth quarter of FY 2013 prior to FRP for AN/USG-3B. Disposal Costs Disposal costs are based on a 20-year service-life from initial deployment and are five percent (Base Year $75.905 million) of system procurement cost. The CEC Program Management Office is addressing demilitarization and disposal requirements with assistance from Naval Surface Warfare Center, Port Hueneme Division. Demilitarization and disposal planning follows the requirements of DOD 4160.21-M-1, Defense Demilitarization and Trade Security Control Manual.
CEC December 31, 2012 SAR
May 21, 2013 15:56:45 UNCLASSIFIED 44