Embed Size (px)
Citation preview
Selected Acquisition Report (SAR)
RCS: DD-A&T(Q&A)823-549
F/A-18E/F Super Hornet Aircraft (F/A-18E/F)As of December 31, 2012
Defense Acquisition Management Information Retrieval
(DAMIR)
May 21, 2013 16:04:14 UNCLASSIFIED
F/A-18E/F December 31, 2012 SAR
May 21, 2013 16:04:14 UNCLASSIFIED 2
Table of Contents
Program Information 3Responsible Office 3References 3Mission and Description 4Executive Summary 5Threshold Breaches 6Schedule 7Performance 10Track To Budget 13Cost and Funding 14Low Rate Initial Production 21Foreign Military Sales 22Nuclear Cost 22Unit Cost 23Cost Variance 26Contracts 29Deliveries and Expenditures 33Operating and Support Cost 34
Program Information
Responsible Office
References
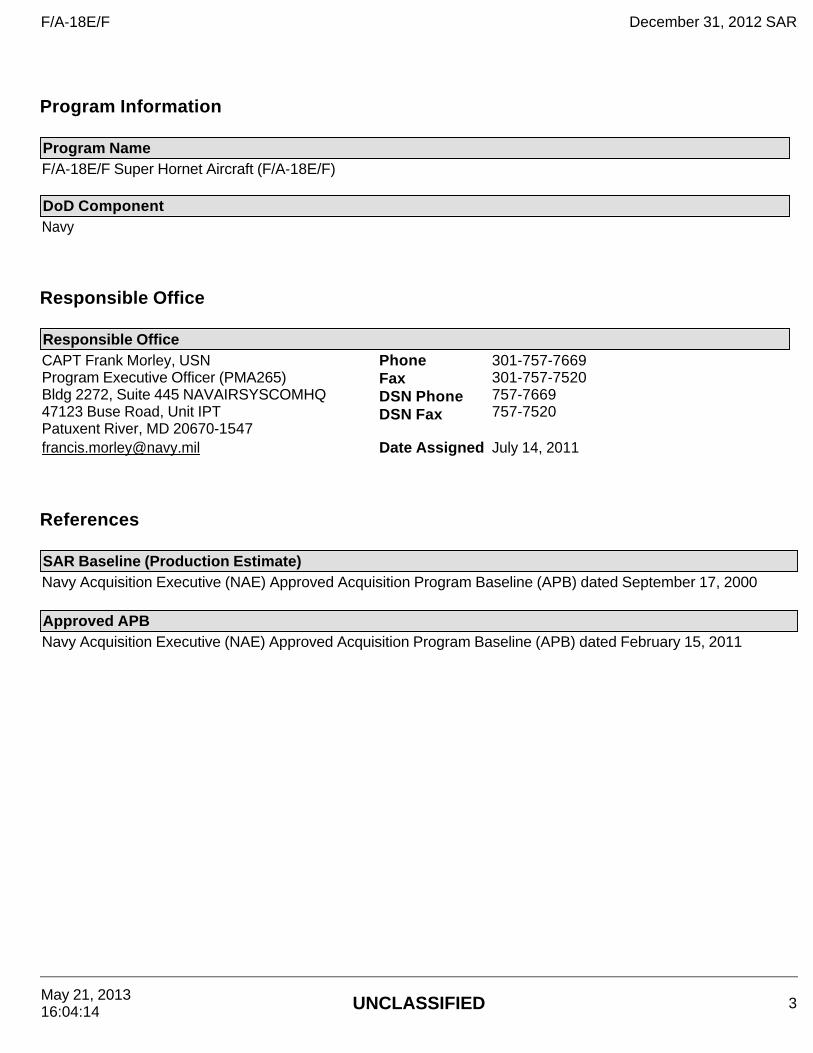
Program Name F/A-18E/F Super Hornet Aircraft (F/A-18E/F)
DoD Component Navy
Responsible OfficeCAPT Frank Morley, USN Program Executive Officer (PMA265) Bldg 2272, Suite 445 NAVAIRSYSCOMHQ 47123 Buse Road, Unit IPT Patuxent River, MD 20670-1547
Phone Fax DSN Phone DSN Fax
301-757-7669 301-757-7520 757-7669 757-7520
[email protected] Date Assigned July 14, 2011
SAR Baseline (Production Estimate)Navy Acquisition Executive (NAE) Approved Acquisition Program Baseline (APB) dated September 17, 2000 Approved APBNavy Acquisition Executive (NAE) Approved Acquisition Program Baseline (APB) dated February 15, 2011
F/A-18E/F December 31, 2012 SAR
May 21, 2013 16:04:14 UNCLASSIFIED 3
Mission and Description The F/A-18E/F Super Hornet is the second major model upgrade since the inception of the F/A-18 aircraft program. The single-seat F/A-18E and the two-seat F/A-18F are high performance, twin-engine, mid-wing, and multi-mission tactical aircraft designed to replace the F/A-18C (single-seat) and F/A-18D (two-seat) aircraft as they reach the end of their service lives and retire. The F/A-18E/F is designed to meet current Navy fighter escort and interdiction mission requirements, to maintain F/A-18 fleet air defense and close air support roles, as well as an increasing range of missions, including Forward Air Controller (Airborne) and Aerial Tanking, as the F/A-18E/F has proven capability to replace the S-3 as an aerial tanker. F/A-18E/F enhancements include increased range and improved carrier suitability required for the F/A-18 to continue its key strike fighter role against the advanced threats of the 21st century.
F/A-18E/F December 31, 2012 SAR
May 21, 2013 16:04:14 UNCLASSIFIED 4
Executive Summary The program continues to excel. Cost, schedule, and performance were superb during this reporting period, and the program continues to deliver aircraft ahead of schedule. As of March 27, 2013, the program has delivered 506 aircraft to the fleet (62 Low Rate Initial Production (LRIP) and 444 Full Rate Production (FRP)). This report solely reflects the domestic Program of Record (PoR) quantities.
As of January 30, 2013, Super Hornet aircraft have flown over 1,131,122 hours. The F/A-18E/F and EA-18G are software-intensive systems that share a common Operational Flight Program (OFP). The current OFP is the H6E System Configuration Set (SCS), which was released to the fleet in October 2011. The H8E SCS represents the latest software upgrade that will replace the H6E SCS following Operational Test (OT). The program office delayed H8E entry into OT by four months to correct weapon integration and interoperability issues. The issues were resolved, and OT began in June 2012. H8E fleet release is scheduled for July 2013. Therefore, there are no significant software-related issues with this program at this time. Because the program is more than 90 percent delivered, this is the final SAR submission for the F/A-18E/F Super Hornet Aircraft program (pursuant to section 2432 of title 10, United States Code).
F/A-18E/F December 31, 2012 SAR
May 21, 2013 16:04:14 UNCLASSIFIED 5
Threshold Breaches
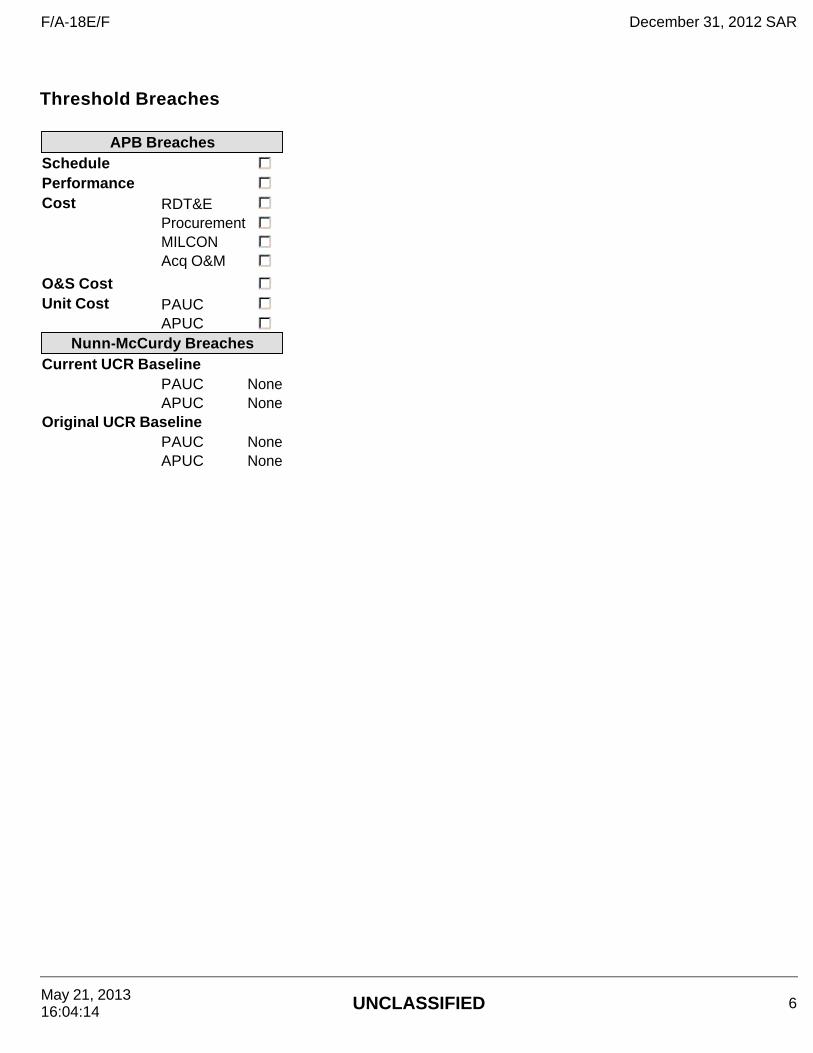
APB Breaches Schedule Performance Cost RDT&E
Procurement MILCON Acq O&M
O&S CostUnit Cost PAUC
APUC Nunn-McCurdy Breaches
Current UCR Baseline PAUC NoneAPUC None
Original UCR Baseline PAUC NoneAPUC None
F/A-18E/F December 31, 2012 SAR
May 21, 2013 16:04:14 UNCLASSIFIED 6
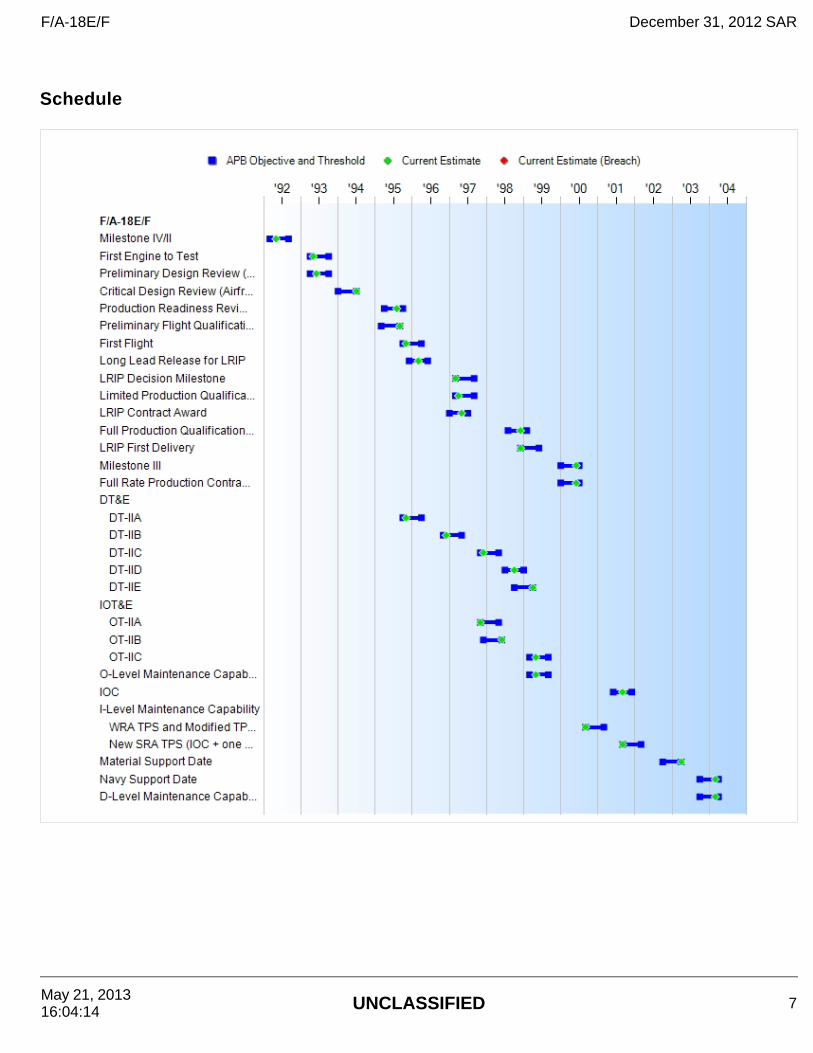
Schedule
F/A-18E/F December 31, 2012 SAR
May 21, 2013 16:04:14 UNCLASSIFIED 7
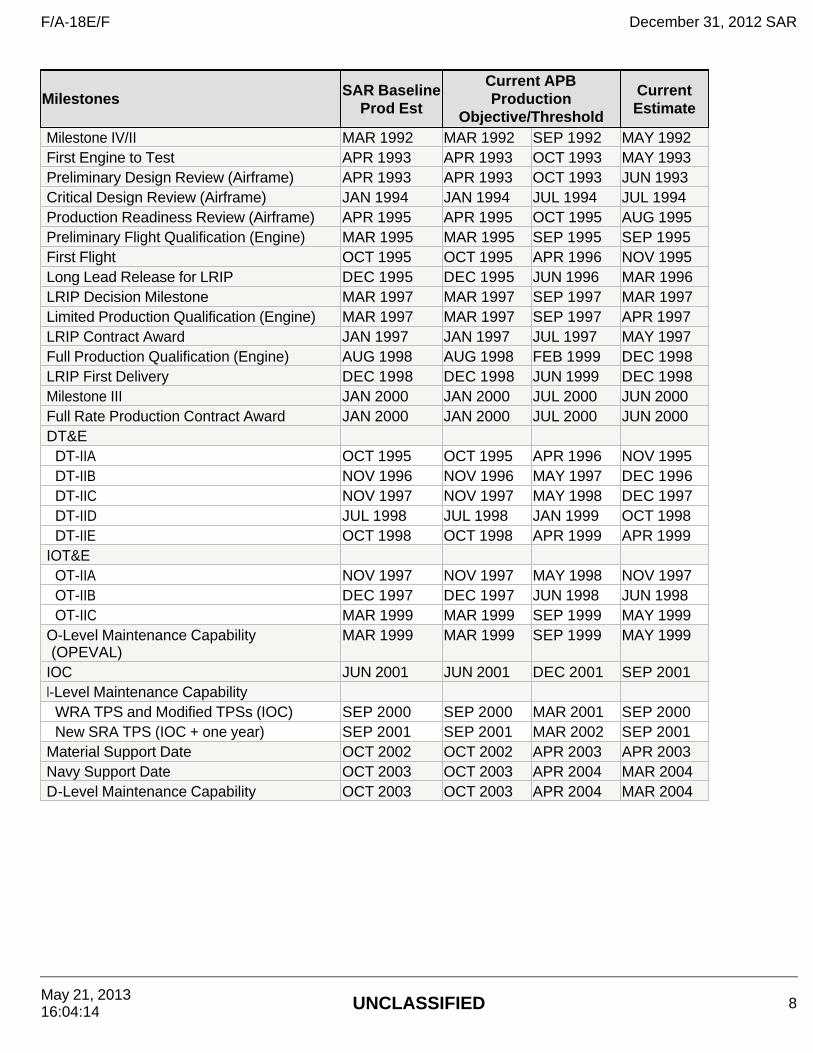
Milestones SAR Baseline Prod Est
Current APB Production
Objective/Threshold
Current Estimate
Milestone IV/II MAR 1992 MAR 1992 SEP 1992 MAY 1992First Engine to Test APR 1993 APR 1993 OCT 1993 MAY 1993Preliminary Design Review (Airframe) APR 1993 APR 1993 OCT 1993 JUN 1993Critical Design Review (Airframe) JAN 1994 JAN 1994 JUL 1994 JUL 1994Production Readiness Review (Airframe) APR 1995 APR 1995 OCT 1995 AUG 1995Preliminary Flight Qualification (Engine) MAR 1995 MAR 1995 SEP 1995 SEP 1995First Flight OCT 1995 OCT 1995 APR 1996 NOV 1995Long Lead Release for LRIP DEC 1995 DEC 1995 JUN 1996 MAR 1996LRIP Decision Milestone MAR 1997 MAR 1997 SEP 1997 MAR 1997Limited Production Qualification (Engine) MAR 1997 MAR 1997 SEP 1997 APR 1997LRIP Contract Award JAN 1997 JAN 1997 JUL 1997 MAY 1997Full Production Qualification (Engine) AUG 1998 AUG 1998 FEB 1999 DEC 1998LRIP First Delivery DEC 1998 DEC 1998 JUN 1999 DEC 1998Milestone III JAN 2000 JAN 2000 JUL 2000 JUN 2000Full Rate Production Contract Award JAN 2000 JAN 2000 JUL 2000 JUN 2000DT&E
DT-IIA OCT 1995 OCT 1995 APR 1996 NOV 1995DT-IIB NOV 1996 NOV 1996 MAY 1997 DEC 1996DT-IIC NOV 1997 NOV 1997 MAY 1998 DEC 1997DT-IID JUL 1998 JUL 1998 JAN 1999 OCT 1998DT-IIE OCT 1998 OCT 1998 APR 1999 APR 1999
IOT&E OT-IIA NOV 1997 NOV 1997 MAY 1998 NOV 1997OT-IIB DEC 1997 DEC 1997 JUN 1998 JUN 1998OT-IIC MAR 1999 MAR 1999 SEP 1999 MAY 1999
O-Level Maintenance Capability (OPEVAL)
MAR 1999 MAR 1999 SEP 1999 MAY 1999
IOC JUN 2001 JUN 2001 DEC 2001 SEP 2001I-Level Maintenance Capability
WRA TPS and Modified TPSs (IOC) SEP 2000 SEP 2000 MAR 2001 SEP 2000New SRA TPS (IOC + one year) SEP 2001 SEP 2001 MAR 2002 SEP 2001
Material Support Date OCT 2002 OCT 2002 APR 2003 APR 2003Navy Support Date OCT 2003 OCT 2003 APR 2004 MAR 2004D-Level Maintenance Capability OCT 2003 OCT 2003 APR 2004 MAR 2004
F/A-18E/F December 31, 2012 SAR
May 21, 2013 16:04:14 UNCLASSIFIED 8
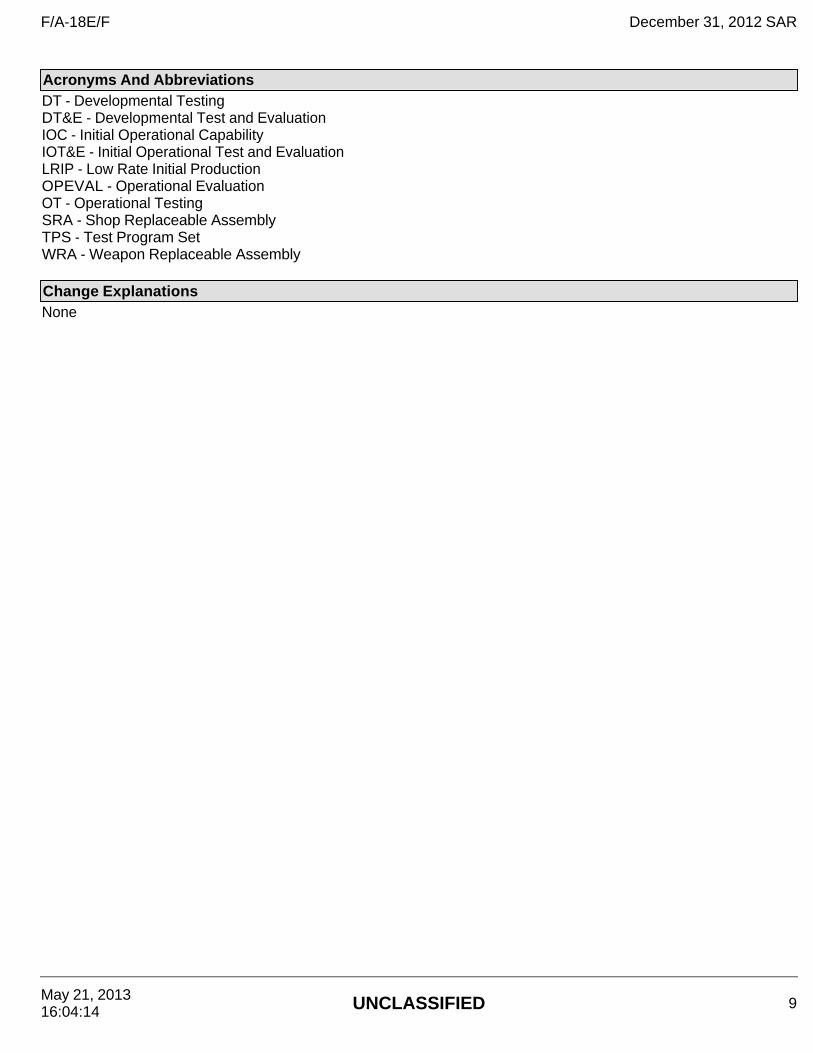
Acronyms And Abbreviations DT - Developmental Testing DT&E - Developmental Test and Evaluation IOC - Initial Operational Capability IOT&E - Initial Operational Test and Evaluation LRIP - Low Rate Initial Production OPEVAL - Operational Evaluation OT - Operational Testing SRA - Shop Replaceable Assembly TPS - Test Program Set WRA - Weapon Replaceable Assembly
Change Explanations None
F/A-18E/F December 31, 2012 SAR
May 21, 2013 16:04:14 UNCLASSIFIED 9
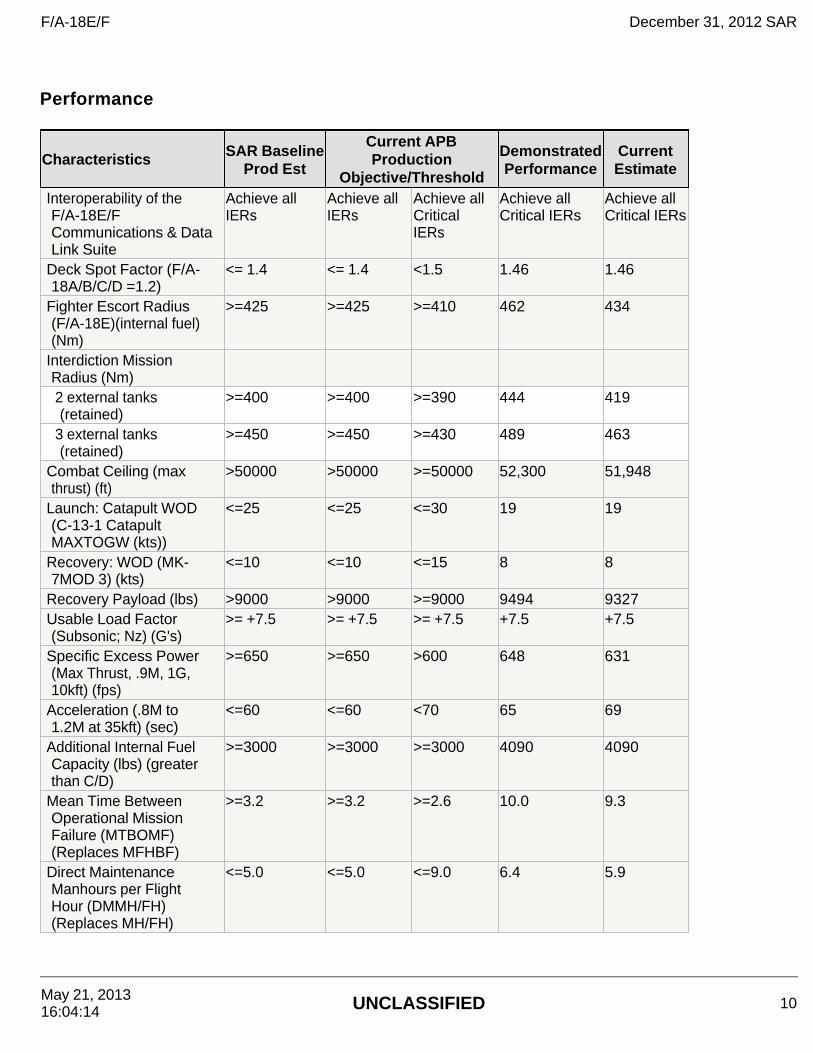
Performance
Characteristics SAR Baseline Prod Est
Current APB Production
Objective/Threshold
Demonstrated Performance
Current Estimate
Interoperability of the F/A-18E/F Communications & Data Link Suite
Achieve all IERs
Achieve all IERs
Achieve all Critical IERs
Achieve all Critical IERs
Achieve all Critical IERs
Deck Spot Factor (F/A-18A/B/C/D =1.2)
<= 1.4 <= 1.4 <1.5 1.46 1.46
Fighter Escort Radius (F/A-18E)(internal fuel)(Nm)
>=425 >=425 >=410 462 434
Interdiction Mission Radius (Nm) 2 external tanks (retained)
>=400 >=400 >=390 444 419
3 external tanks (retained)
>=450 >=450 >=430 489 463
Combat Ceiling (max thrust) (ft)
>50000 >50000 >=50000 52,300 51,948
Launch: Catapult WOD (C-13-1 Catapult MAXTOGW (kts))
<=25 <=25 <=30 19 19
Recovery: WOD (MK-7MOD 3) (kts)
<=10 <=10 <=15 8 8
Recovery Payload (lbs) >9000 >9000 >=9000 9494 9327Usable Load Factor (Subsonic; Nz) (G's)
>= +7.5 >= +7.5 >= +7.5 +7.5 +7.5
Specific Excess Power (Max Thrust, .9M, 1G, 10kft) (fps)
>=650 >=650 >600 648 631
Acceleration (.8M to 1.2M at 35kft) (sec)
<=60 <=60 <70 65 69
Additional Internal Fuel Capacity (lbs) (greater than C/D)
>=3000 >=3000 >=3000 4090 4090
Mean Time Between Operational Mission Failure (MTBOMF) (Replaces MFHBF)
>=3.2 >=3.2 >=2.6 10.0 9.3
Direct Maintenance Manhours per Flight Hour (DMMH/FH) (Replaces MH/FH)
<=5.0 <=5.0 <=9.0 6.4 5.9
F/A-18E/F December 31, 2012 SAR
May 21, 2013 16:04:14 UNCLASSIFIED 10
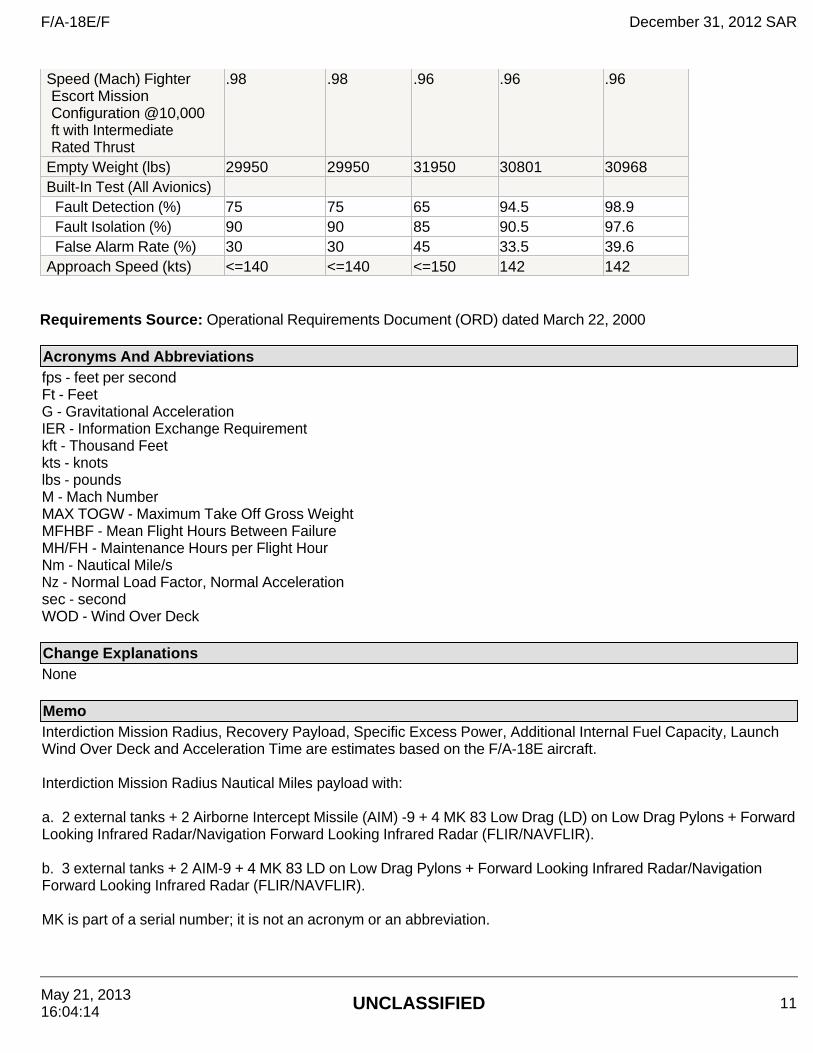
Requirements Source: Operational Requirements Document (ORD) dated March 22, 2000
Speed (Mach) Fighter Escort Mission Configuration @10,000 ft with Intermediate Rated Thrust
.98 .98 .96 .96 .96
Empty Weight (lbs) 29950 29950 31950 30801 30968Built-In Test (All Avionics)
Fault Detection (%) 75 75 65 94.5 98.9Fault Isolation (%) 90 90 85 90.5 97.6False Alarm Rate (%) 30 30 45 33.5 39.6
Approach Speed (kts) <=140 <=140 <=150 142 142
Acronyms And Abbreviations fps - feet per second Ft - Feet G - Gravitational Acceleration IER - Information Exchange Requirement kft - Thousand Feet kts - knots lbs - pounds M - Mach Number MAX TOGW - Maximum Take Off Gross Weight MFHBF - Mean Flight Hours Between Failure MH/FH - Maintenance Hours per Flight Hour Nm - Nautical Mile/s Nz - Normal Load Factor, Normal Acceleration sec - second WOD - Wind Over Deck
Change Explanations None Memo Interdiction Mission Radius, Recovery Payload, Specific Excess Power, Additional Internal Fuel Capacity, Launch Wind Over Deck and Acceleration Time are estimates based on the F/A-18E aircraft. Interdiction Mission Radius Nautical Miles payload with: a. 2 external tanks + 2 Airborne Intercept Missile (AIM) -9 + 4 MK 83 Low Drag (LD) on Low Drag Pylons + Forward Looking Infrared Radar/Navigation Forward Looking Infrared Radar (FLIR/NAVFLIR). b. 3 external tanks + 2 AIM-9 + 4 MK 83 LD on Low Drag Pylons + Forward Looking Infrared Radar/Navigation Forward Looking Infrared Radar (FLIR/NAVFLIR). MK is part of a serial number; it is not an acronym or an abbreviation.
F/A-18E/F December 31, 2012 SAR
May 21, 2013 16:04:14 UNCLASSIFIED 11
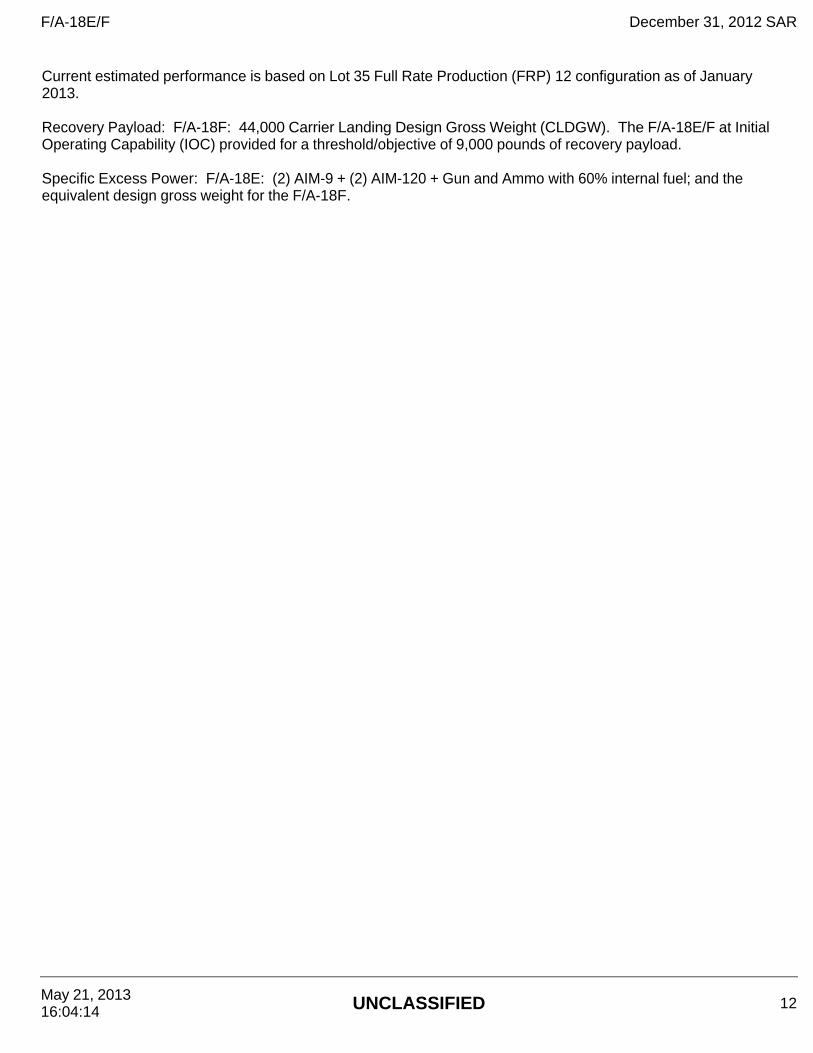
Current estimated performance is based on Lot 35 Full Rate Production (FRP) 12 configuration as of January 2013. Recovery Payload: F/A-18F: 44,000 Carrier Landing Design Gross Weight (CLDGW). The F/A-18E/F at Initial Operating Capability (IOC) provided for a threshold/objective of 9,000 pounds of recovery payload. Specific Excess Power: F/A-18E: (2) AIM-9 + (2) AIM-120 + Gun and Ammo with 60% internal fuel; and the equivalent design gross weight for the F/A-18F.
F/A-18E/F December 31, 2012 SAR
May 21, 2013 16:04:14 UNCLASSIFIED 12
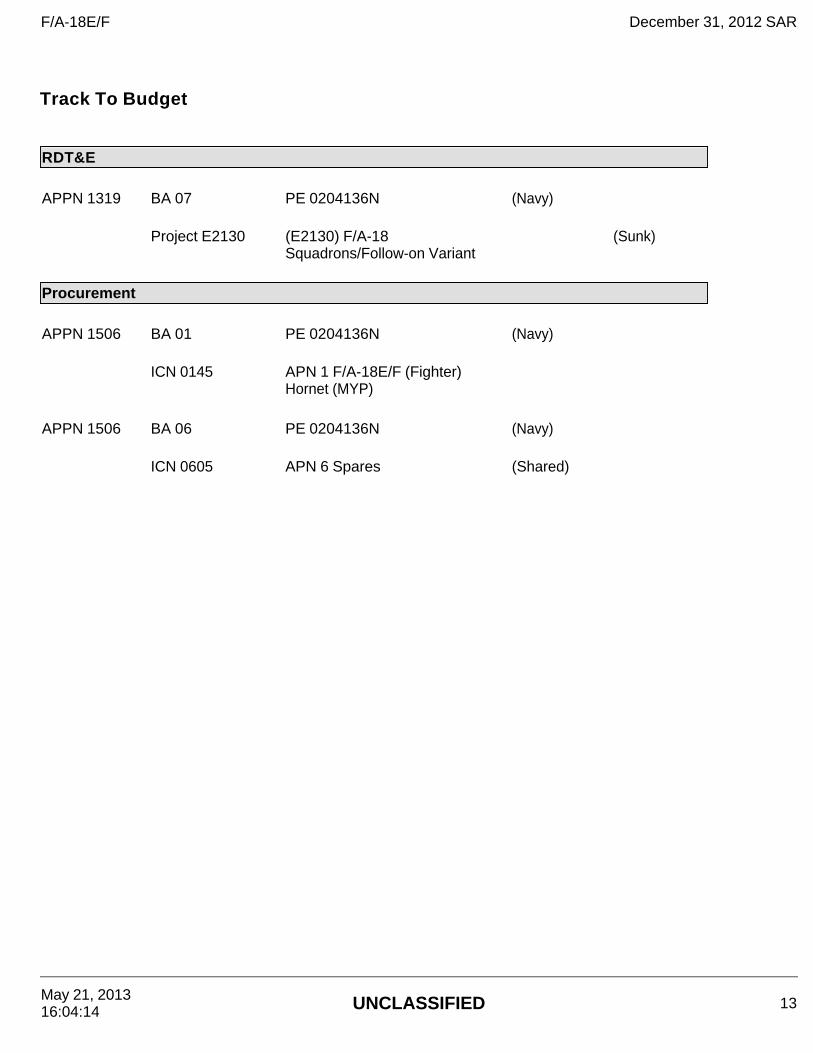
Track To Budget
RDT&E APPN 1319 BA 07 PE 0204136N (Navy)
Project E2130 (E2130) F/A-18 Squadrons/Follow-on Variant
(Sunk)
Procurement APPN 1506 BA 01 PE 0204136N (Navy)
ICN 0145 APN 1 F/A-18E/F (Fighter) Hornet (MYP)
APPN 1506 BA 06 PE 0204136N (Navy) ICN 0605 APN 6 Spares (Shared)
F/A-18E/F December 31, 2012 SAR
May 21, 2013 16:04:14 UNCLASSIFIED 13
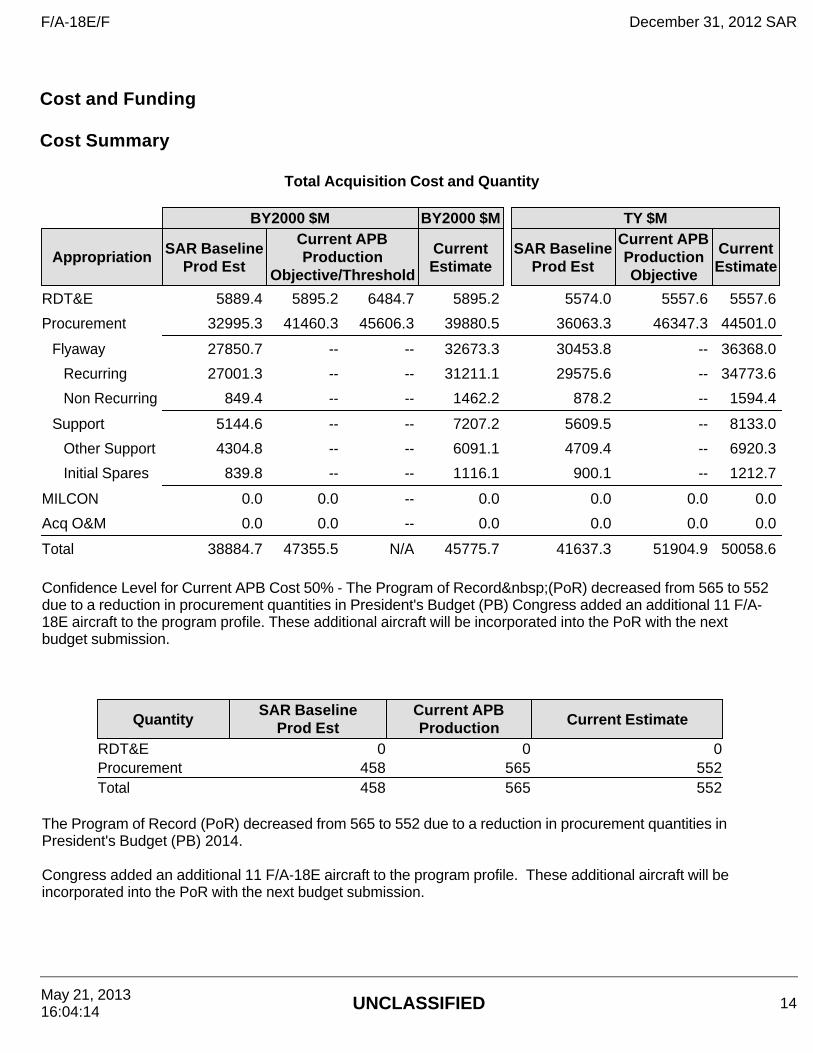
Cost and Funding Cost Summary
Total Acquisition Cost and Quantity
BY2000 $M BY2000 $M TY $M
Appropriation SAR Baseline Prod Est
Current APB Production
Objective/Threshold
Current Estimate
SAR Baseline Prod Est
Current APB Production Objective
Current Estimate
RDT&E 5889.4 5895.2 6484.7 5895.2 5574.0 5557.6 5557.6
Procurement 32995.3 41460.3 45606.3 39880.5 36063.3 46347.3 44501.0
Flyaway 27850.7 -- -- 32673.3 30453.8 -- 36368.0
Recurring 27001.3 -- -- 31211.1 29575.6 -- 34773.6
Non Recurring 849.4 -- -- 1462.2 878.2 -- 1594.4
Support 5144.6 -- -- 7207.2 5609.5 -- 8133.0
Other Support 4304.8 -- -- 6091.1 4709.4 -- 6920.3
Initial Spares 839.8 -- -- 1116.1 900.1 -- 1212.7
MILCON 0.0 0.0 -- 0.0 0.0 0.0 0.0
Acq O&M 0.0 0.0 -- 0.0 0.0 0.0 0.0
Total 38884.7 47355.5 N/A 45775.7 41637.3 51904.9 50058.6 Confidence Level for Current APB Cost 50% - The Program of Record (PoR) decreased from 565 to 552 due to a reduction in procurement quantities in President's Budget (PB) Congress added an additional 11 F/A-18E aircraft to the program profile. These additional aircraft will be incorporated into the PoR with the next budget submission.
QuantitySAR Baseline
Prod EstCurrent APB Production Current Estimate
RDT&E 0 0 0Procurement 458 565 552Total 458 565 552
The Program of Record (PoR) decreased from 565 to 552 due to a reduction in procurement quantities in President's Budget (PB) 2014. Congress added an additional 11 F/A-18E aircraft to the program profile. These additional aircraft will be incorporated into the PoR with the next budget submission.
F/A-18E/F December 31, 2012 SAR
May 21, 2013 16:04:14 UNCLASSIFIED 14
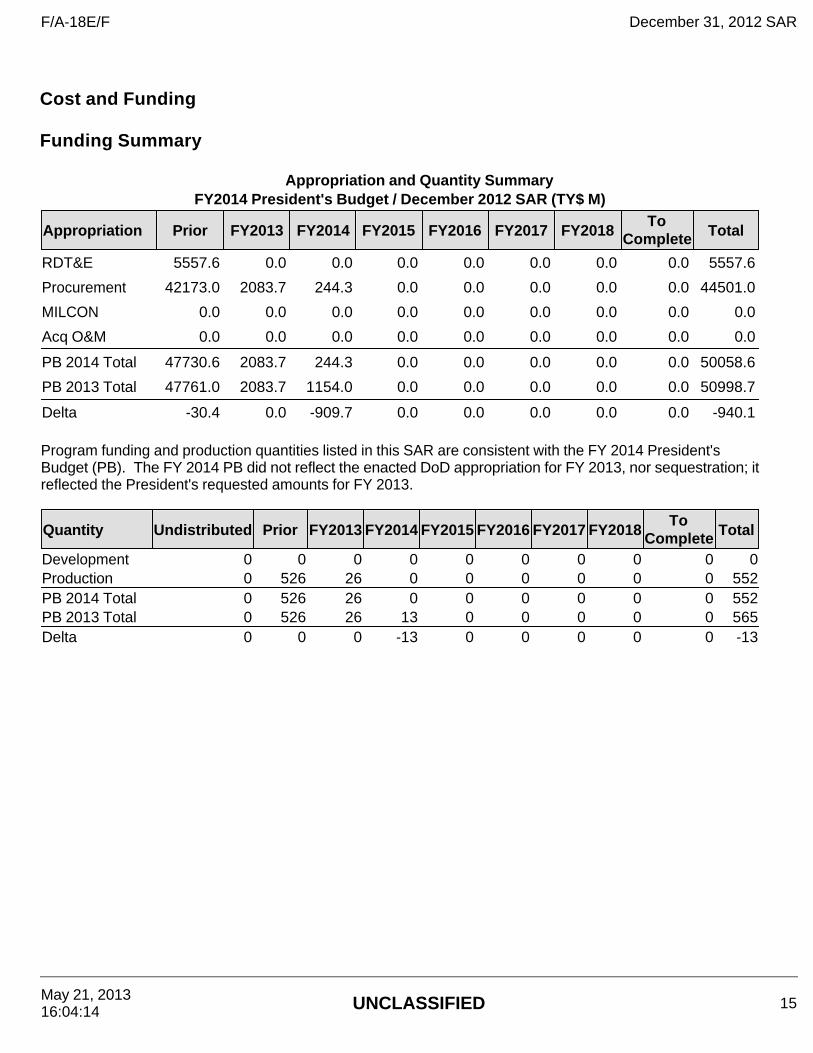
Cost and Funding Funding Summary
Appropriation and Quantity Summary FY2014 President's Budget / December 2012 SAR (TY$ M)
Program funding and production quantities listed in this SAR are consistent with the FY 2014 President's Budget (PB). The FY 2014 PB did not reflect the enacted DoD appropriation for FY 2013, nor sequestration; it reflected the President's requested amounts for FY 2013.
Appropriation Prior FY2013 FY2014 FY2015 FY2016 FY2017 FY2018To
Complete Total
RDT&E 5557.6 0.0 0.0 0.0 0.0 0.0 0.0 0.0 5557.6
Procurement 42173.0 2083.7 244.3 0.0 0.0 0.0 0.0 0.0 44501.0
MILCON 0.0 0.0 0.0 0.0 0.0 0.0 0.0 0.0 0.0
Acq O&M 0.0 0.0 0.0 0.0 0.0 0.0 0.0 0.0 0.0
PB 2014 Total 47730.6 2083.7 244.3 0.0 0.0 0.0 0.0 0.0 50058.6
PB 2013 Total 47761.0 2083.7 1154.0 0.0 0.0 0.0 0.0 0.0 50998.7
Delta -30.4 0.0 -909.7 0.0 0.0 0.0 0.0 0.0 -940.1
Quantity Undistributed Prior FY2013 FY2014 FY2015 FY2016 FY2017 FY2018To
Complete Total
Development 0 0 0 0 0 0 0 0 0 0Production 0 526 26 0 0 0 0 0 0 552PB 2014 Total 0 526 26 0 0 0 0 0 0 552PB 2013 Total 0 526 26 13 0 0 0 0 0 565Delta 0 0 0 -13 0 0 0 0 0 -13
F/A-18E/F December 31, 2012 SAR
May 21, 2013 16:04:14 UNCLASSIFIED 15
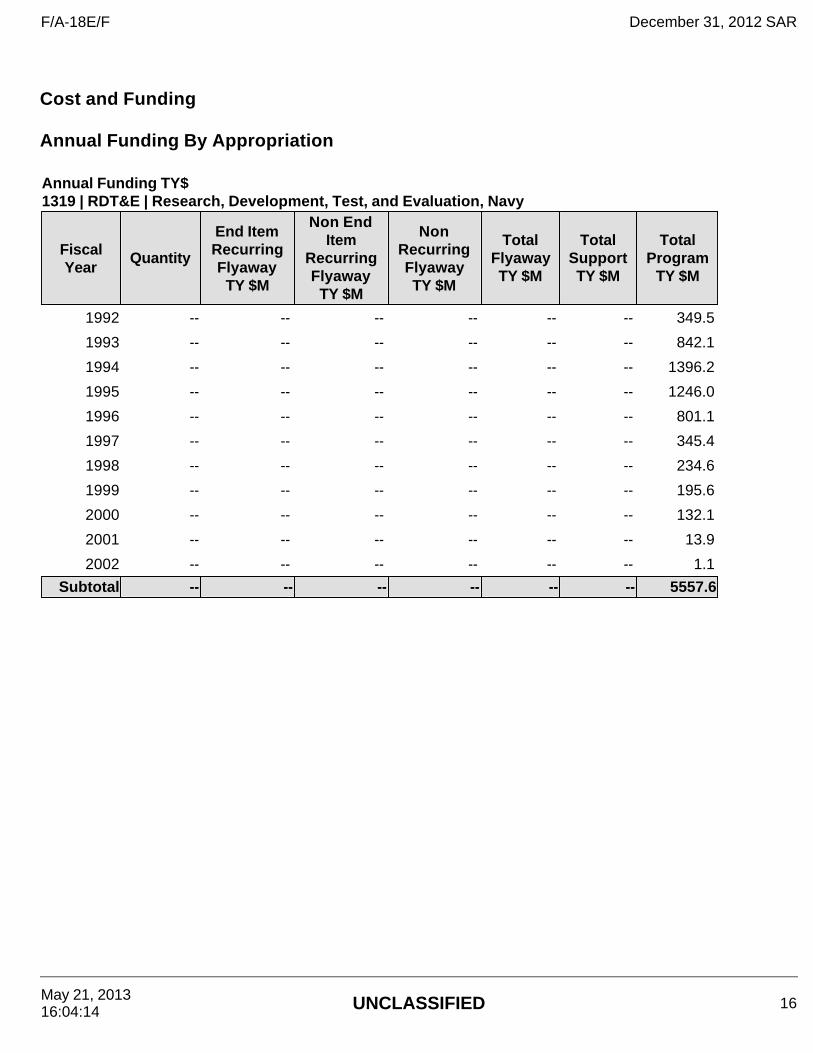
Cost and Funding Annual Funding By Appropriation
Annual Funding TY$ 1319 | RDT&E | Research, Development, Test, and Evaluation, Navy
Fiscal Year
Quantity
End Item Recurring Flyaway
TY $M
Non End Item
Recurring Flyaway
TY $M
Non Recurring Flyaway TY $M
Total Flyaway TY $M
Total Support TY $M
Total Program
TY $M
1992 -- -- -- -- -- -- 349.5
1993 -- -- -- -- -- -- 842.1
1994 -- -- -- -- -- -- 1396.2
1995 -- -- -- -- -- -- 1246.0
1996 -- -- -- -- -- -- 801.1
1997 -- -- -- -- -- -- 345.4
1998 -- -- -- -- -- -- 234.6
1999 -- -- -- -- -- -- 195.6
2000 -- -- -- -- -- -- 132.1
2001 -- -- -- -- -- -- 13.9
2002 -- -- -- -- -- -- 1.1
Subtotal -- -- -- -- -- -- 5557.6
F/A-18E/F December 31, 2012 SAR
May 21, 2013 16:04:14 UNCLASSIFIED 16
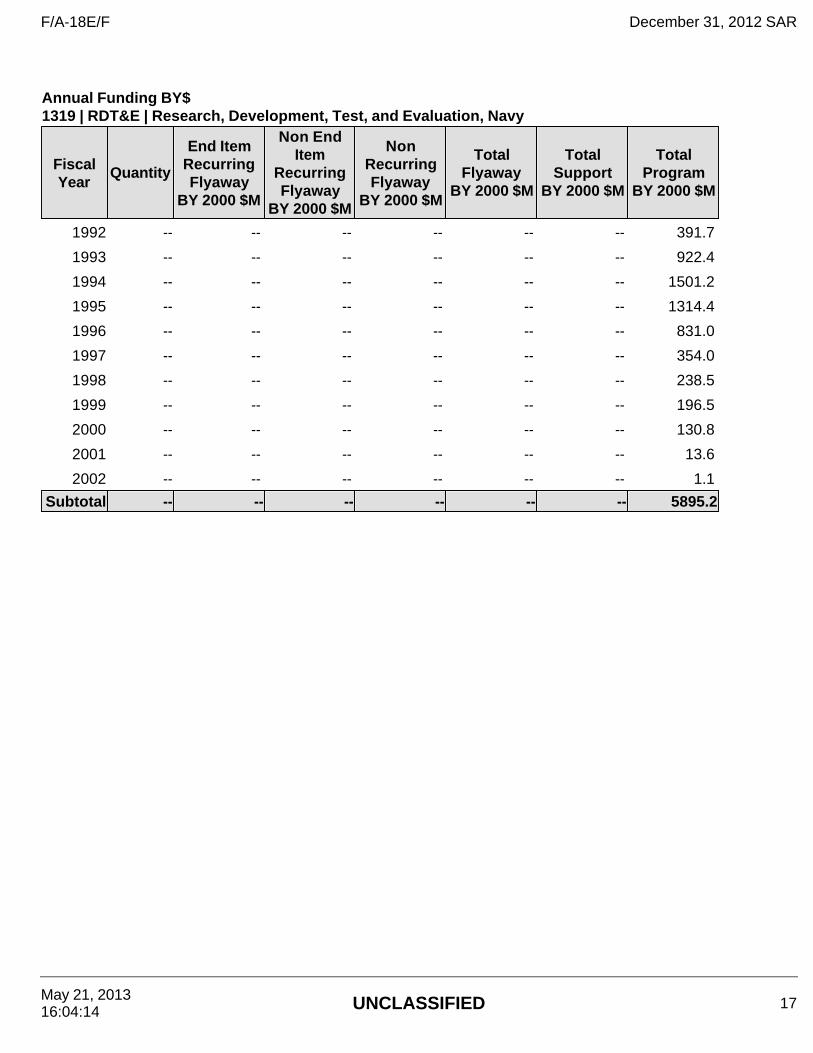
Annual Funding BY$ 1319 | RDT&E | Research, Development, Test, and Evaluation, Navy
Fiscal Year
Quantity
End Item Recurring Flyaway
BY 2000 $M
Non End Item
Recurring Flyaway
BY 2000 $M
Non Recurring Flyaway
BY 2000 $M
Total Flyaway
BY 2000 $M
Total Support
BY 2000 $M
Total Program
BY 2000 $M
1992 -- -- -- -- -- -- 391.7
1993 -- -- -- -- -- -- 922.4
1994 -- -- -- -- -- -- 1501.2
1995 -- -- -- -- -- -- 1314.4
1996 -- -- -- -- -- -- 831.0
1997 -- -- -- -- -- -- 354.0
1998 -- -- -- -- -- -- 238.5
1999 -- -- -- -- -- -- 196.5
2000 -- -- -- -- -- -- 130.8
2001 -- -- -- -- -- -- 13.6
2002 -- -- -- -- -- -- 1.1
Subtotal -- -- -- -- -- -- 5895.2
F/A-18E/F December 31, 2012 SAR
May 21, 2013 16:04:14 UNCLASSIFIED 17
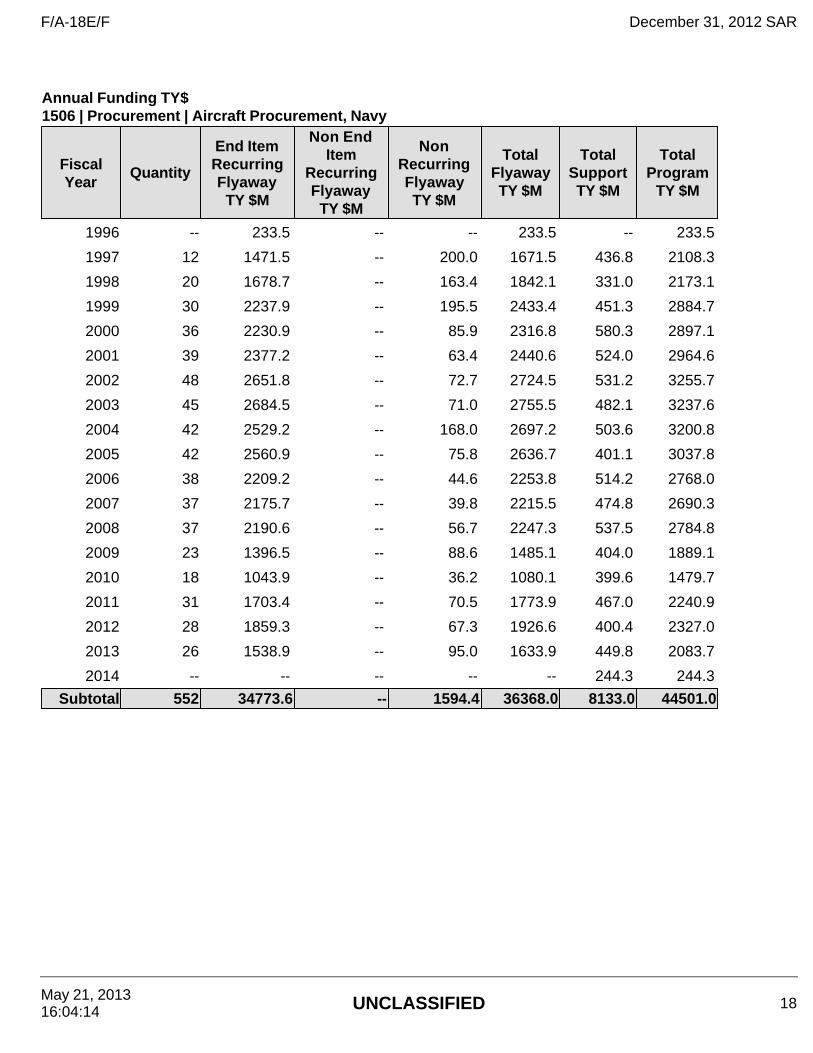
Annual Funding TY$ 1506 | Procurement | Aircraft Procurement, Navy
Fiscal Year
Quantity
End Item Recurring Flyaway
TY $M
Non End Item
Recurring Flyaway
TY $M
Non Recurring Flyaway TY $M
Total Flyaway TY $M
Total Support TY $M
Total Program
TY $M
1996 -- 233.5 -- -- 233.5 -- 233.5
1997 12 1471.5 -- 200.0 1671.5 436.8 2108.3
1998 20 1678.7 -- 163.4 1842.1 331.0 2173.1
1999 30 2237.9 -- 195.5 2433.4 451.3 2884.7
2000 36 2230.9 -- 85.9 2316.8 580.3 2897.1
2001 39 2377.2 -- 63.4 2440.6 524.0 2964.6
2002 48 2651.8 -- 72.7 2724.5 531.2 3255.7
2003 45 2684.5 -- 71.0 2755.5 482.1 3237.6
2004 42 2529.2 -- 168.0 2697.2 503.6 3200.8
2005 42 2560.9 -- 75.8 2636.7 401.1 3037.8
2006 38 2209.2 -- 44.6 2253.8 514.2 2768.0
2007 37 2175.7 -- 39.8 2215.5 474.8 2690.3
2008 37 2190.6 -- 56.7 2247.3 537.5 2784.8
2009 23 1396.5 -- 88.6 1485.1 404.0 1889.1
2010 18 1043.9 -- 36.2 1080.1 399.6 1479.7
2011 31 1703.4 -- 70.5 1773.9 467.0 2240.9
2012 28 1859.3 -- 67.3 1926.6 400.4 2327.0
2013 26 1538.9 -- 95.0 1633.9 449.8 2083.7
2014 -- -- -- -- -- 244.3 244.3
Subtotal 552 34773.6 -- 1594.4 36368.0 8133.0 44501.0
F/A-18E/F December 31, 2012 SAR
May 21, 2013 16:04:14 UNCLASSIFIED 18
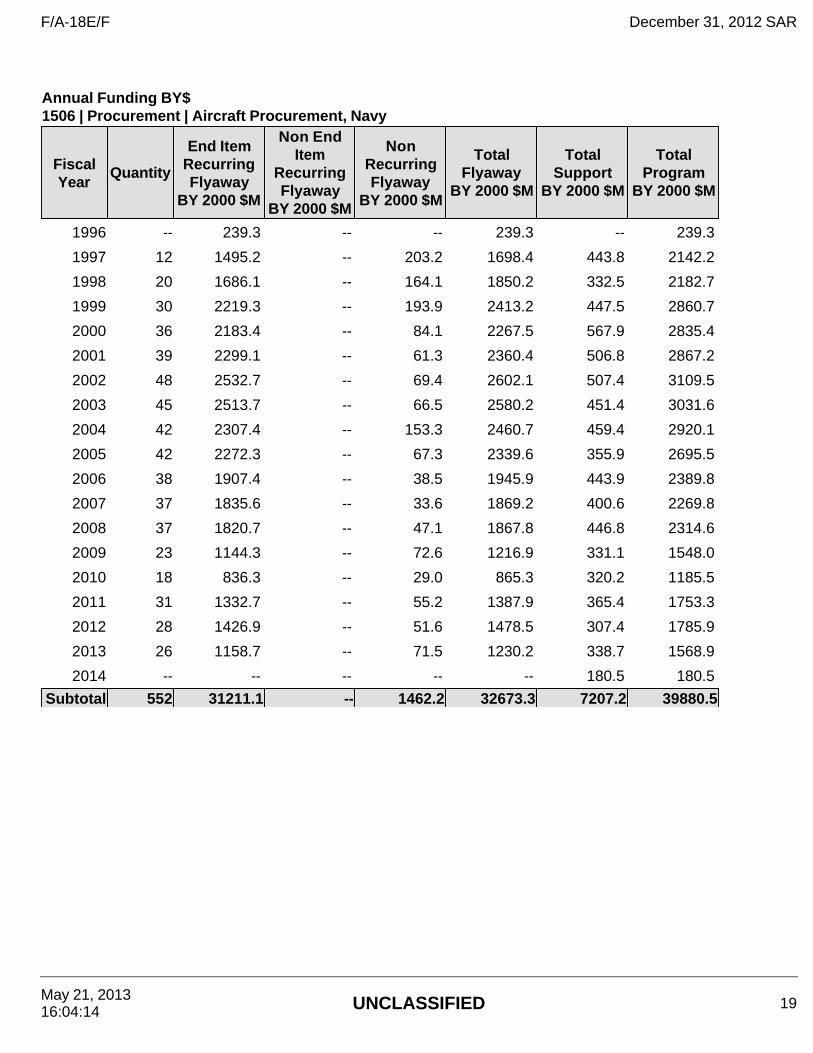
Annual Funding BY$ 1506 | Procurement | Aircraft Procurement, Navy
Fiscal Year
Quantity
End Item Recurring Flyaway
BY 2000 $M
Non End Item
Recurring Flyaway
BY 2000 $M
Non Recurring Flyaway
BY 2000 $M
Total Flyaway
BY 2000 $M
Total Support
BY 2000 $M
Total Program
BY 2000 $M
1996 -- 239.3 -- -- 239.3 -- 239.3
1997 12 1495.2 -- 203.2 1698.4 443.8 2142.2
1998 20 1686.1 -- 164.1 1850.2 332.5 2182.7
1999 30 2219.3 -- 193.9 2413.2 447.5 2860.7
2000 36 2183.4 -- 84.1 2267.5 567.9 2835.4
2001 39 2299.1 -- 61.3 2360.4 506.8 2867.2
2002 48 2532.7 -- 69.4 2602.1 507.4 3109.5
2003 45 2513.7 -- 66.5 2580.2 451.4 3031.6
2004 42 2307.4 -- 153.3 2460.7 459.4 2920.1
2005 42 2272.3 -- 67.3 2339.6 355.9 2695.5
2006 38 1907.4 -- 38.5 1945.9 443.9 2389.8
2007 37 1835.6 -- 33.6 1869.2 400.6 2269.8
2008 37 1820.7 -- 47.1 1867.8 446.8 2314.6
2009 23 1144.3 -- 72.6 1216.9 331.1 1548.0
2010 18 836.3 -- 29.0 865.3 320.2 1185.5
2011 31 1332.7 -- 55.2 1387.9 365.4 1753.3
2012 28 1426.9 -- 51.6 1478.5 307.4 1785.9
2013 26 1158.7 -- 71.5 1230.2 338.7 1568.9
2014 -- -- -- -- -- 180.5 180.5
Subtotal 552 31211.1 -- 1462.2 32673.3 7207.2 39880.5
F/A-18E/F December 31, 2012 SAR
May 21, 2013 16:04:14 UNCLASSIFIED 19
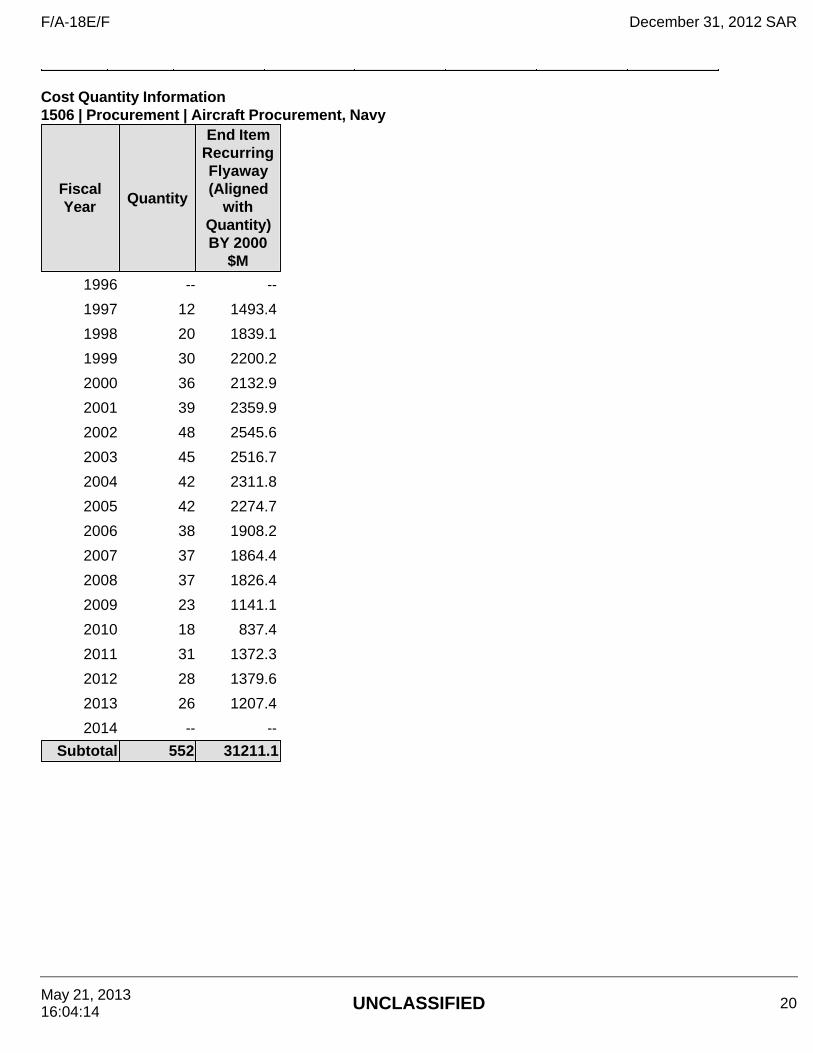
Cost Quantity Information 1506 | Procurement | Aircraft Procurement, Navy
Fiscal Year Quantity
End Item Recurring Flyaway (Aligned
with Quantity) BY 2000
$M
1996 -- --
1997 12 1493.4
1998 20 1839.1
1999 30 2200.2
2000 36 2132.9
2001 39 2359.9
2002 48 2545.6
2003 45 2516.7
2004 42 2311.8
2005 42 2274.7
2006 38 1908.2
2007 37 1864.4
2008 37 1826.4
2009 23 1141.1
2010 18 837.4
2011 31 1372.3
2012 28 1379.6
2013 26 1207.4
2014 -- --
Subtotal 552 31211.1
F/A-18E/F December 31, 2012 SAR
May 21, 2013 16:04:14 UNCLASSIFIED 20

Low Rate Initial Production
The Current Total LRIP Quantity is more than 10% of the total production quantity due to the Quadrennial Defense Review (QDR). As a result of the QDR, the total procurement quantity for the program was reduced to a range of 548 to 785 aircraft, but there was not a change to the LRIP quantity. The LRIP quantity was approved during the LRIP Defense Acquisition Board (DAB) in March 1997.
Initial LRIP Decision Current Total LRIP Approval Date 3/26/1997 3/26/1997 Approved Quantity 62 62 Reference Milestone II ADM Milestone II ADM Start Year 1997 1997 End Year 1999 1999
F/A-18E/F December 31, 2012 SAR
May 21, 2013 16:04:14 UNCLASSIFIED 21
Nuclear Cost
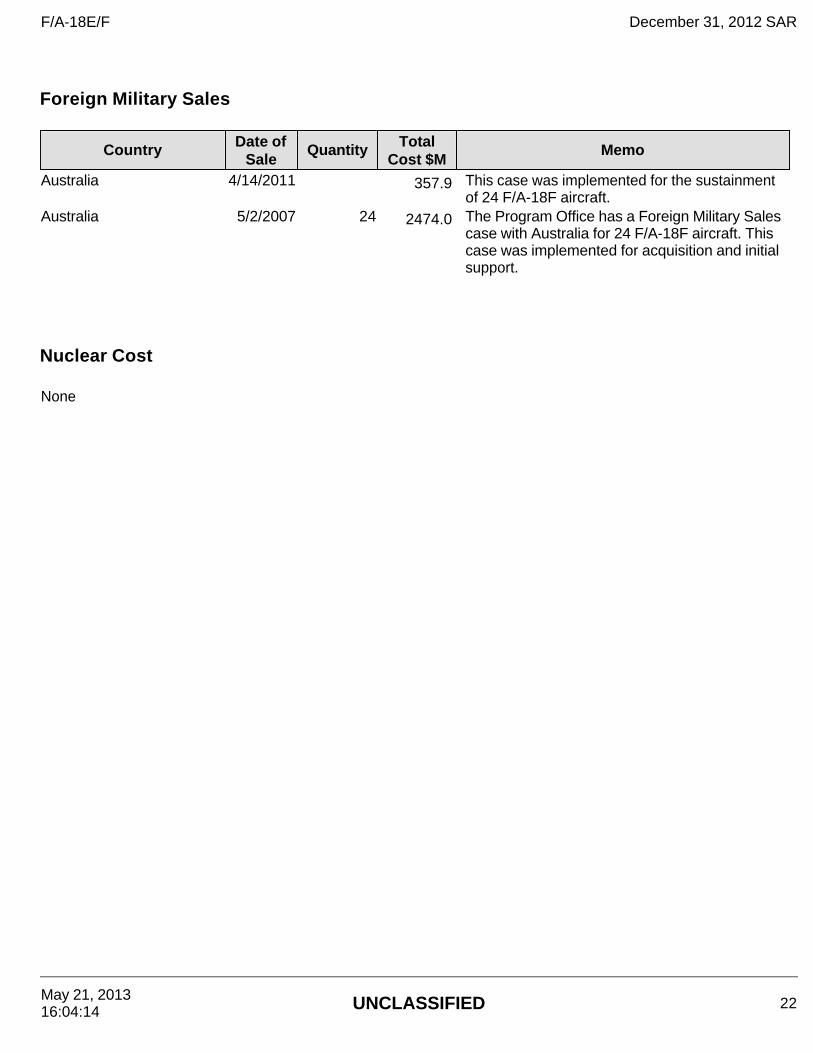
Foreign Military Sales
Country Date of Sale
Quantity Total Cost $M
Memo
Australia 4/14/2011 357.9 This case was implemented for the sustainment of 24 F/A-18F aircraft.
Australia 5/2/2007 24 2474.0 The Program Office has a Foreign Military Sales case with Australia for 24 F/A-18F aircraft. This case was implemented for acquisition and initial support.
None
F/A-18E/F December 31, 2012 SAR
May 21, 2013 16:04:14 UNCLASSIFIED 22
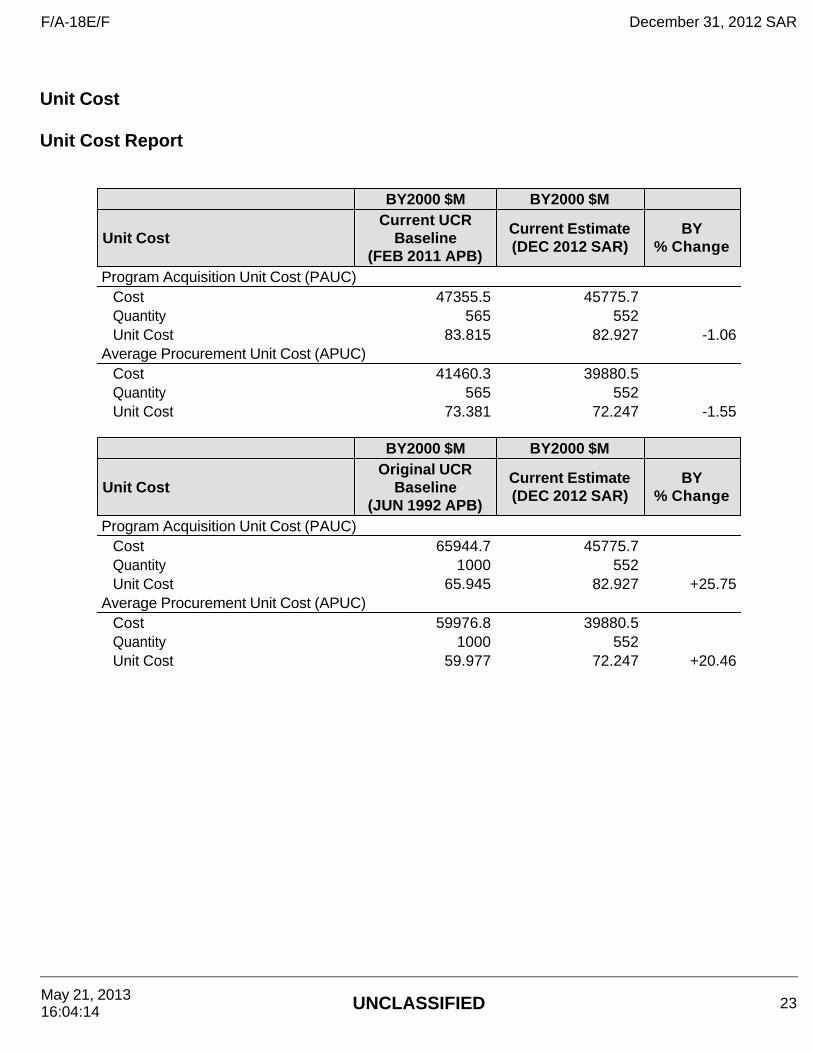
Unit Cost Unit Cost Report
BY2000 $M BY2000 $M
Unit Cost Current UCR
Baseline (FEB 2011 APB)
Current Estimate (DEC 2012 SAR)
BY % Change
Program Acquisition Unit Cost (PAUC) Cost 47355.5 45775.7Quantity 565 552Unit Cost 83.815 82.927 -1.06
Average Procurement Unit Cost (APUC) Cost 41460.3 39880.5Quantity 565 552Unit Cost 73.381 72.247 -1.55
BY2000 $M BY2000 $M
Unit Cost Original UCR
Baseline (JUN 1992 APB)
Current Estimate (DEC 2012 SAR)
BY % Change
Program Acquisition Unit Cost (PAUC) Cost 65944.7 45775.7Quantity 1000 552Unit Cost 65.945 82.927 +25.75
Average Procurement Unit Cost (APUC) Cost 59976.8 39880.5Quantity 1000 552Unit Cost 59.977 72.247 +20.46
F/A-18E/F December 31, 2012 SAR
May 21, 2013 16:04:14 UNCLASSIFIED 23
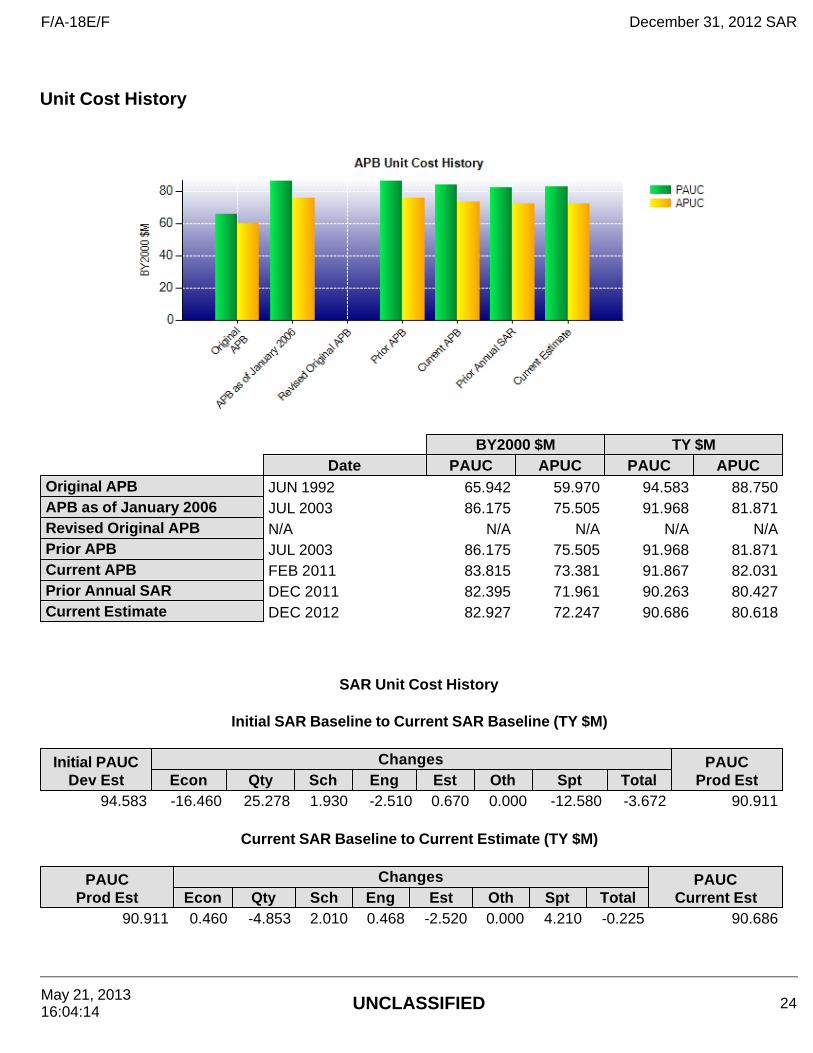
Unit Cost History
BY2000 $M TY $MDate PAUC APUC PAUC APUC
Original APB JUN 1992 65.942 59.970 94.583 88.750APB as of January 2006 JUL 2003 86.175 75.505 91.968 81.871Revised Original APB N/A N/A N/A N/A N/APrior APB JUL 2003 86.175 75.505 91.968 81.871Current APB FEB 2011 83.815 73.381 91.867 82.031Prior Annual SAR DEC 2011 82.395 71.961 90.263 80.427Current Estimate DEC 2012 82.927 72.247 90.686 80.618
SAR Unit Cost History
Initial SAR Baseline to Current SAR Baseline (TY $M)
Initial PAUC Dev Est
Changes PAUC Prod Est Econ Qty Sch Eng Est Oth Spt Total
94.583 -16.460 25.278 1.930 -2.510 0.670 0.000 -12.580 -3.672 90.911
Current SAR Baseline to Current Estimate (TY $M)
PAUC Prod Est
Changes PAUC Current Est Econ Qty Sch Eng Est Oth Spt Total
90.911 0.460 -4.853 2.010 0.468 -2.520 0.000 4.210 -0.225 90.686
F/A-18E/F December 31, 2012 SAR
May 21, 2013 16:04:14 UNCLASSIFIED 24
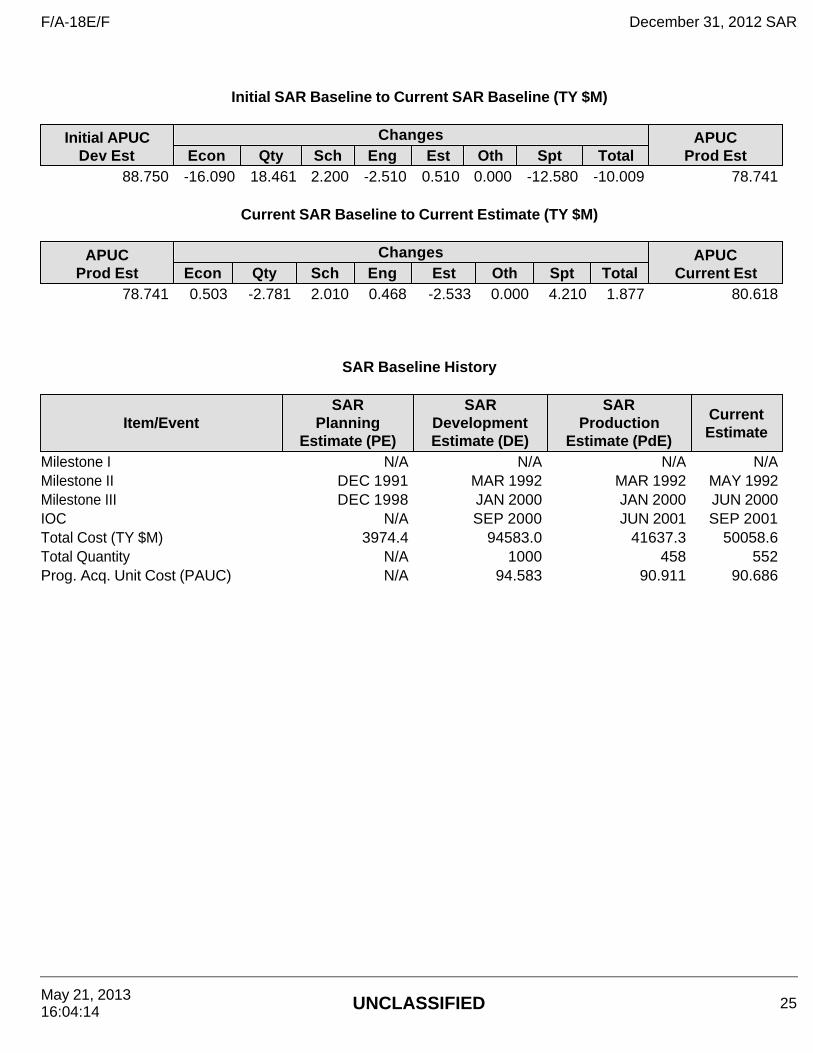
Initial SAR Baseline to Current SAR Baseline (TY $M)
Initial APUC Dev Est
Changes APUC Prod Est Econ Qty Sch Eng Est Oth Spt Total
88.750 -16.090 18.461 2.200 -2.510 0.510 0.000 -12.580 -10.009 78.741
Current SAR Baseline to Current Estimate (TY $M)
APUC Prod Est
Changes APUC Current Est Econ Qty Sch Eng Est Oth Spt Total
78.741 0.503 -2.781 2.010 0.468 -2.533 0.000 4.210 1.877 80.618
SAR Baseline History
Item/Event SAR
Planning Estimate (PE)
SAR Development Estimate (DE)
SAR Production
Estimate (PdE)
Current Estimate
Milestone I N/A N/A N/A N/AMilestone II DEC 1991 MAR 1992 MAR 1992 MAY 1992Milestone III DEC 1998 JAN 2000 JAN 2000 JUN 2000IOC N/A SEP 2000 JUN 2001 SEP 2001Total Cost (TY $M) 3974.4 94583.0 41637.3 50058.6Total Quantity N/A 1000 458 552Prog. Acq. Unit Cost (PAUC) N/A 94.583 90.911 90.686
F/A-18E/F December 31, 2012 SAR
May 21, 2013 16:04:14 UNCLASSIFIED 25
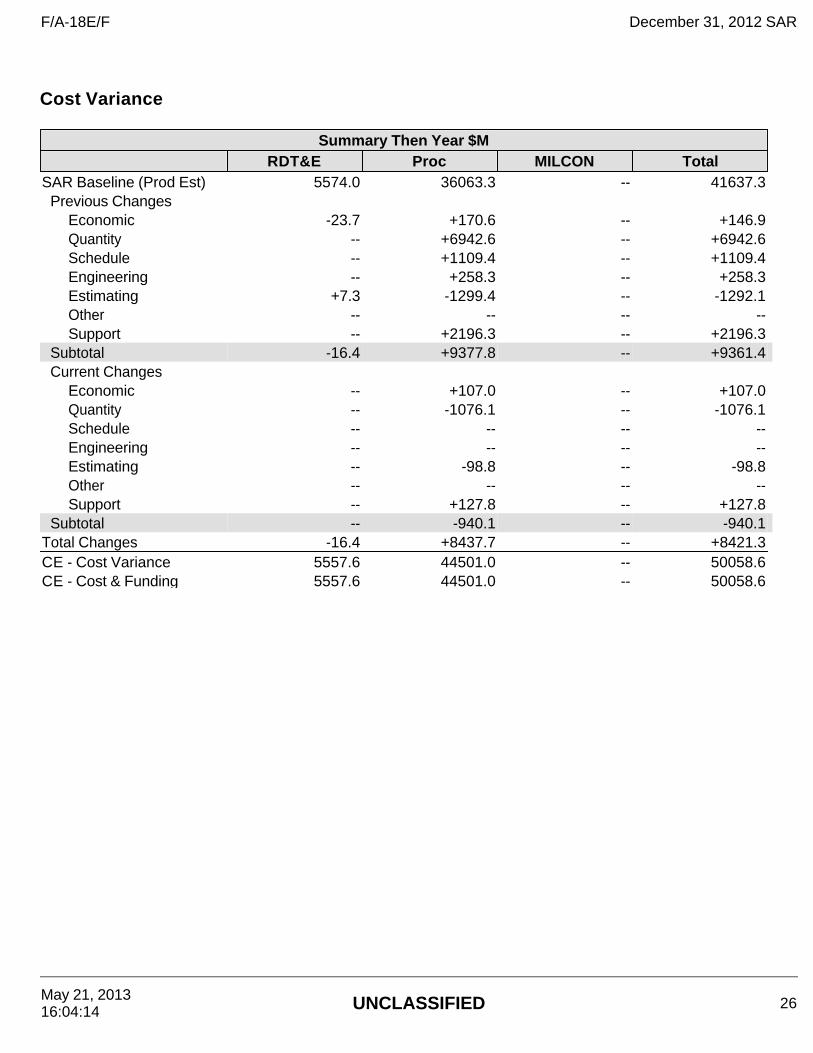
Cost Variance
Summary Then Year $MRDT&E Proc MILCON Total
SAR Baseline (Prod Est) 5574.0 36063.3 -- 41637.3Previous Changes
Economic -23.7 +170.6 -- +146.9Quantity -- +6942.6 -- +6942.6Schedule -- +1109.4 -- +1109.4Engineering -- +258.3 -- +258.3Estimating +7.3 -1299.4 -- -1292.1Other -- -- -- --Support -- +2196.3 -- +2196.3
Subtotal -16.4 +9377.8 -- +9361.4Current Changes
Economic -- +107.0 -- +107.0Quantity -- -1076.1 -- -1076.1Schedule -- -- -- --Engineering -- -- -- --Estimating -- -98.8 -- -98.8Other -- -- -- --Support -- +127.8 -- +127.8
Subtotal -- -940.1 -- -940.1Total Changes -16.4 +8437.7 -- +8421.3CE - Cost Variance 5557.6 44501.0 -- 50058.6CE - Cost & Funding 5557.6 44501.0 -- 50058.6
F/A-18E/F December 31, 2012 SAR
May 21, 2013 16:04:14 UNCLASSIFIED 26
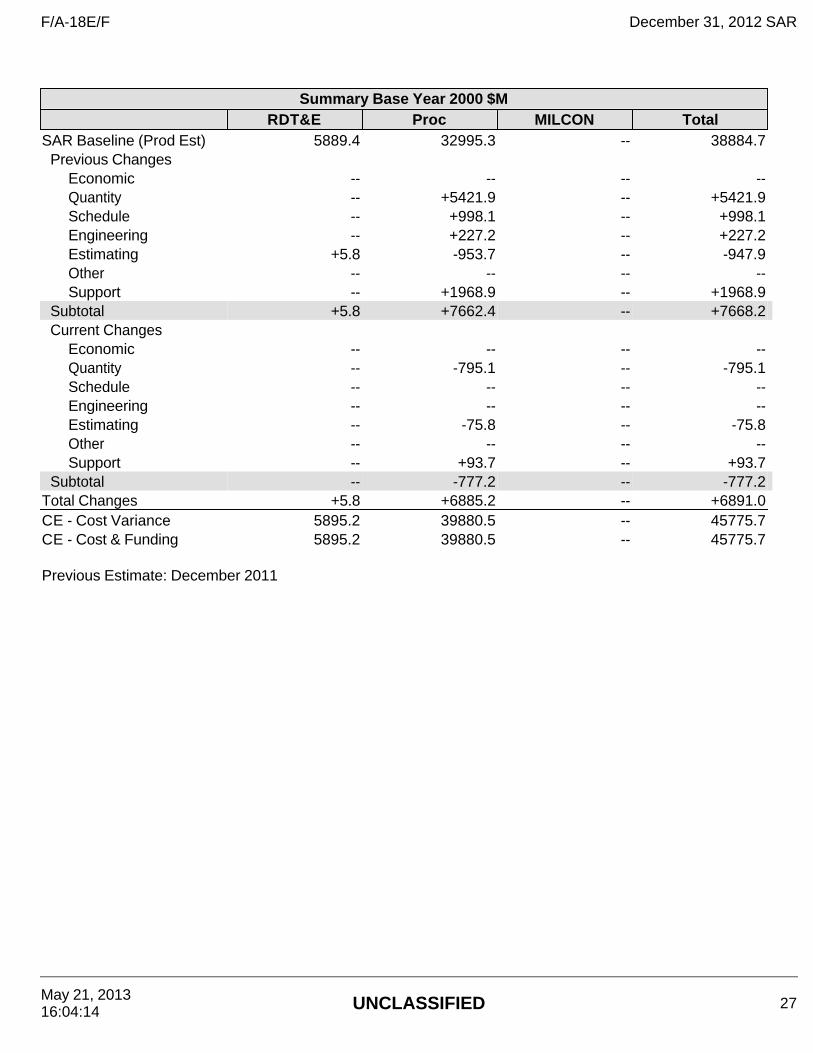
Summary Base Year 2000 $MRDT&E Proc MILCON Total
SAR Baseline (Prod Est) 5889.4 32995.3 -- 38884.7Previous Changes
Economic -- -- -- --Quantity -- +5421.9 -- +5421.9Schedule -- +998.1 -- +998.1Engineering -- +227.2 -- +227.2Estimating +5.8 -953.7 -- -947.9Other -- -- -- --Support -- +1968.9 -- +1968.9
Subtotal +5.8 +7662.4 -- +7668.2Current Changes
Economic -- -- -- --Quantity -- -795.1 -- -795.1Schedule -- -- -- --Engineering -- -- -- --Estimating -- -75.8 -- -75.8Other -- -- -- --Support -- +93.7 -- +93.7
Subtotal -- -777.2 -- -777.2Total Changes +5.8 +6885.2 -- +6891.0CE - Cost Variance 5895.2 39880.5 -- 45775.7CE - Cost & Funding 5895.2 39880.5 -- 45775.7
Previous Estimate: December 2011
F/A-18E/F December 31, 2012 SAR
May 21, 2013 16:04:14 UNCLASSIFIED 27
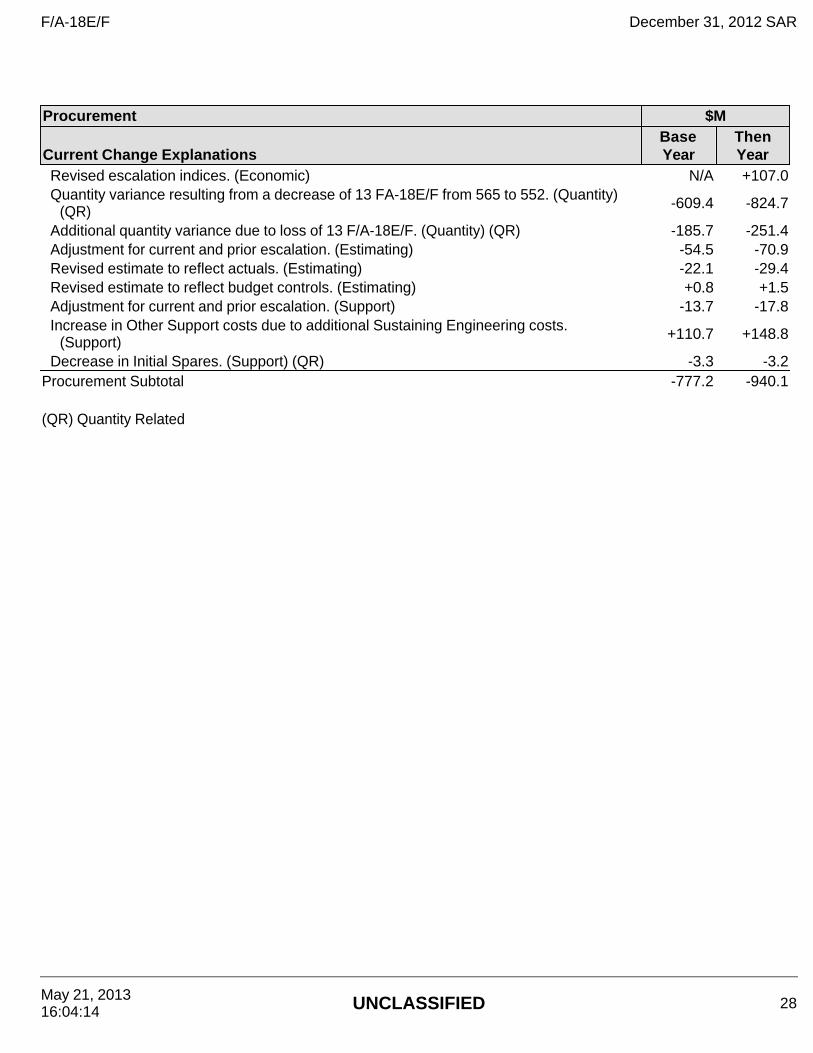
Procurement $M
Current Change ExplanationsBase Year
Then Year
Revised escalation indices. (Economic) N/A +107.0Quantity variance resulting from a decrease of 13 FA-18E/F from 565 to 552. (Quantity)
(QR) -609.4 -824.7
Additional quantity variance due to loss of 13 F/A-18E/F. (Quantity) (QR) -185.7 -251.4Adjustment for current and prior escalation. (Estimating) -54.5 -70.9Revised estimate to reflect actuals. (Estimating) -22.1 -29.4Revised estimate to reflect budget controls. (Estimating) +0.8 +1.5Adjustment for current and prior escalation. (Support) -13.7 -17.8Increase in Other Support costs due to additional Sustaining Engineering costs.
(Support) +110.7 +148.8
Decrease in Initial Spares. (Support) (QR) -3.3 -3.2Procurement Subtotal -777.2 -940.1 (QR) Quantity Related
F/A-18E/F December 31, 2012 SAR
May 21, 2013 16:04:14 UNCLASSIFIED 28
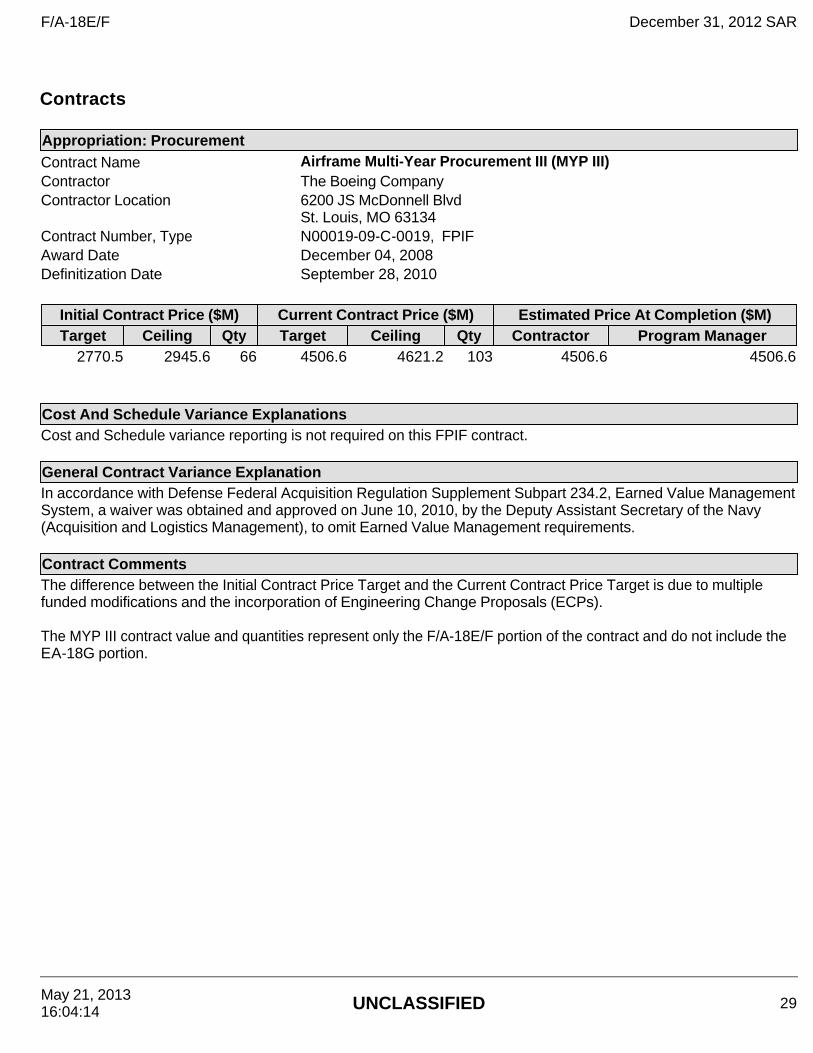
Contracts
Appropriation: Procurement Contract Name Airframe Multi-Year Procurement III (MYP III) Contractor The Boeing Company Contractor Location 6200 JS McDonnell Blvd
St. Louis, MO 63134 Contract Number, Type N00019-09-C-0019, FPIF Award Date December 04, 2008 Definitization Date September 28, 2010
Initial Contract Price ($M) Current Contract Price ($M) Estimated Price At Completion ($M) Target Ceiling Qty Target Ceiling Qty Contractor Program Manager
2770.5 2945.6 66 4506.6 4621.2 103 4506.6 4506.6
Cost And Schedule Variance Explanations Cost and Schedule variance reporting is not required on this FPIF contract.
General Contract Variance Explanation In accordance with Defense Federal Acquisition Regulation Supplement Subpart 234.2, Earned Value Management System, a waiver was obtained and approved on June 10, 2010, by the Deputy Assistant Secretary of the Navy (Acquisition and Logistics Management), to omit Earned Value Management requirements.
Contract Comments The difference between the Initial Contract Price Target and the Current Contract Price Target is due to multiple funded modifications and the incorporation of Engineering Change Proposals (ECPs). The MYP III contract value and quantities represent only the F/A-18E/F portion of the contract and do not include the EA-18G portion.
F/A-18E/F December 31, 2012 SAR
May 21, 2013 16:04:14 UNCLASSIFIED 29
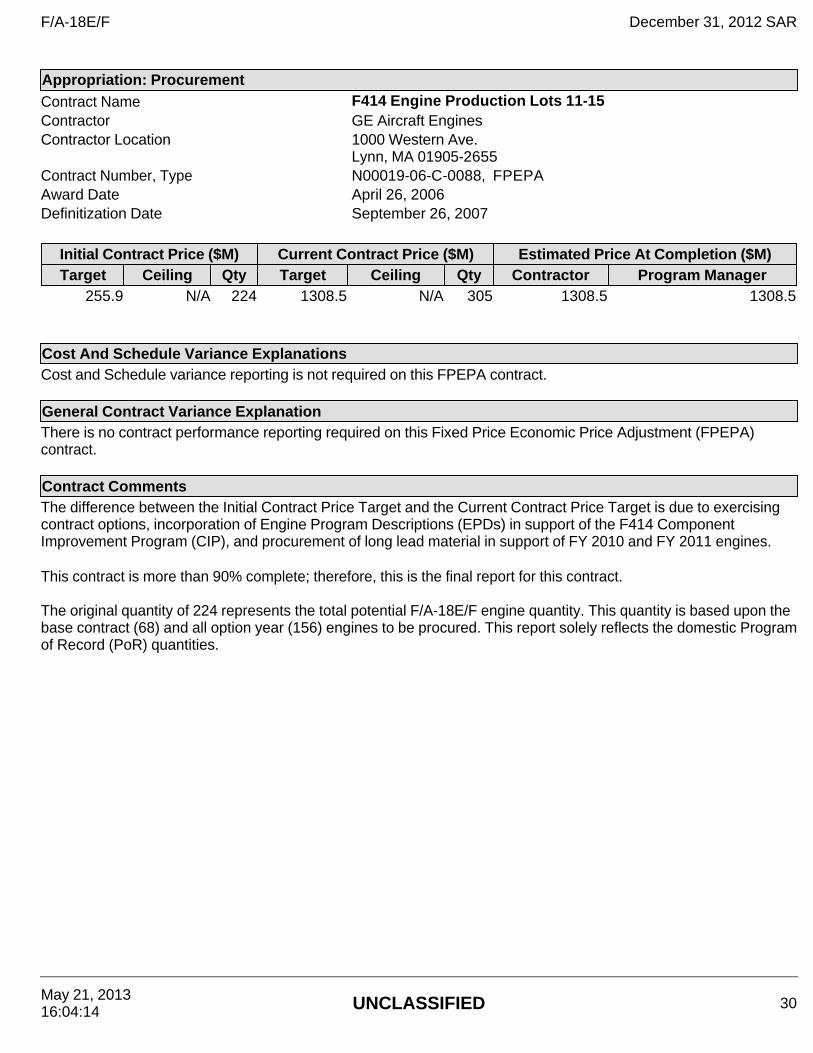
Appropriation: Procurement Contract Name F414 Engine Production Lots 11-15 Contractor GE Aircraft Engines Contractor Location 1000 Western Ave.
Lynn, MA 01905-2655 Contract Number, Type N00019-06-C-0088, FPEPA Award Date April 26, 2006 Definitization Date September 26, 2007
Initial Contract Price ($M) Current Contract Price ($M) Estimated Price At Completion ($M) Target Ceiling Qty Target Ceiling Qty Contractor Program Manager
255.9 N/A 224 1308.5 N/A 305 1308.5 1308.5
Cost And Schedule Variance Explanations Cost and Schedule variance reporting is not required on this FPEPA contract.
General Contract Variance Explanation There is no contract performance reporting required on this Fixed Price Economic Price Adjustment (FPEPA) contract.
Contract Comments The difference between the Initial Contract Price Target and the Current Contract Price Target is due to exercising contract options, incorporation of Engine Program Descriptions (EPDs) in support of the F414 Component Improvement Program (CIP), and procurement of long lead material in support of FY 2010 and FY 2011 engines. This contract is more than 90% complete; therefore, this is the final report for this contract. The original quantity of 224 represents the total potential F/A-18E/F engine quantity. This quantity is based upon the base contract (68) and all option year (156) engines to be procured. This report solely reflects the domestic Program of Record (PoR) quantities.
F/A-18E/F December 31, 2012 SAR
May 21, 2013 16:04:14 UNCLASSIFIED 30
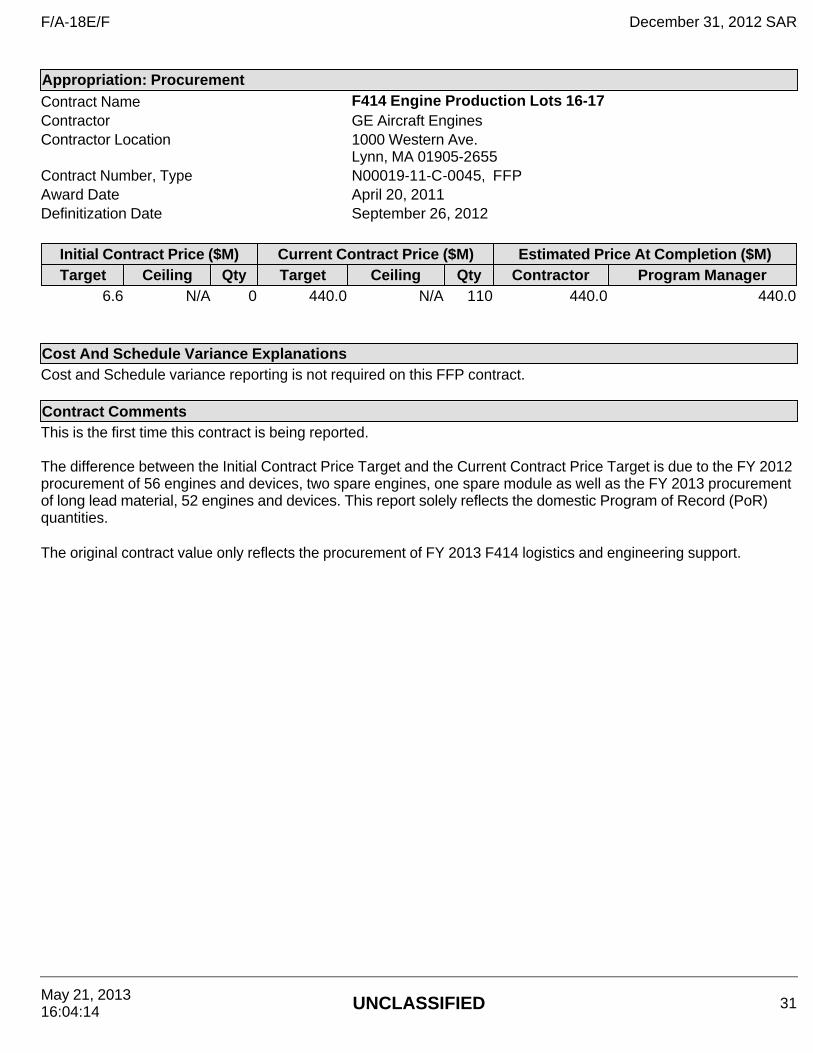
Appropriation: Procurement Contract Name F414 Engine Production Lots 16-17 Contractor GE Aircraft Engines Contractor Location 1000 Western Ave.
Lynn, MA 01905-2655 Contract Number, Type N00019-11-C-0045, FFP Award Date April 20, 2011 Definitization Date September 26, 2012
Initial Contract Price ($M) Current Contract Price ($M) Estimated Price At Completion ($M) Target Ceiling Qty Target Ceiling Qty Contractor Program Manager
6.6 N/A 0 440.0 N/A 110 440.0 440.0
Cost And Schedule Variance Explanations Cost and Schedule variance reporting is not required on this FFP contract.
Contract Comments This is the first time this contract is being reported. The difference between the Initial Contract Price Target and the Current Contract Price Target is due to the FY 2012 procurement of 56 engines and devices, two spare engines, one spare module as well as the FY 2013 procurement of long lead material, 52 engines and devices. This report solely reflects the domestic Program of Record (PoR) quantities. The original contract value only reflects the procurement of FY 2013 F414 logistics and engineering support.
F/A-18E/F December 31, 2012 SAR
May 21, 2013 16:04:14 UNCLASSIFIED 31
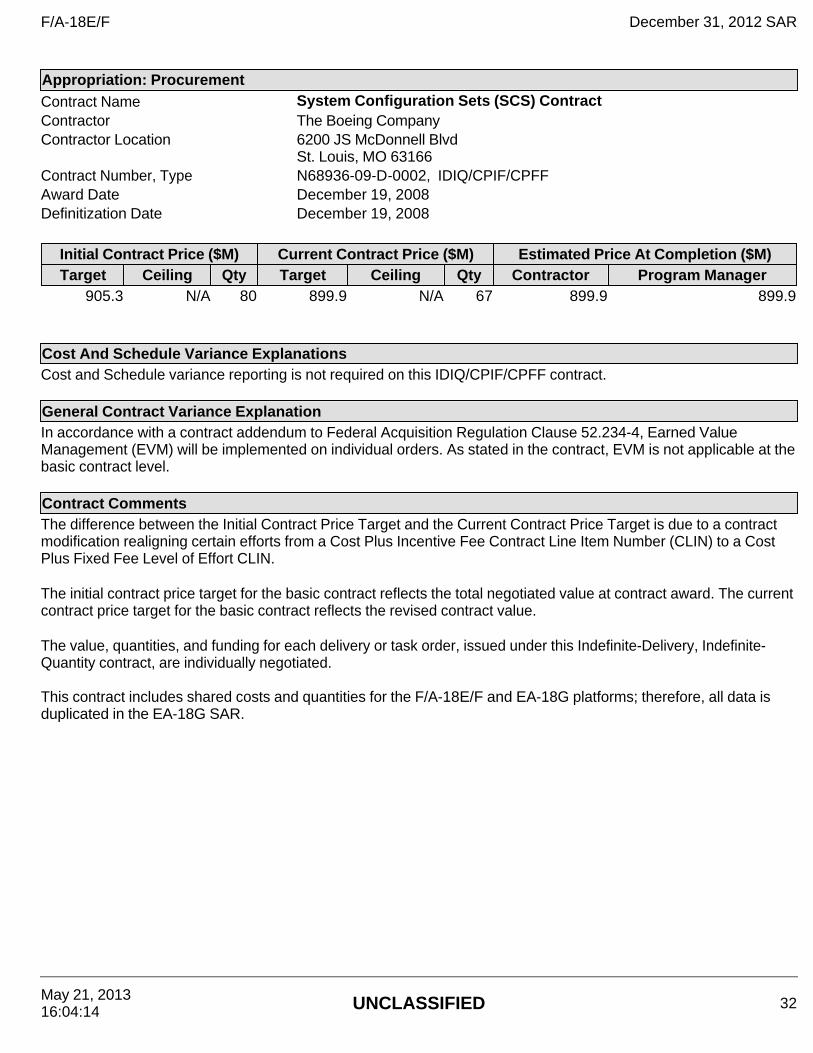
Appropriation: Procurement Contract Name System Configuration Sets (SCS) Contract Contractor The Boeing Company Contractor Location 6200 JS McDonnell Blvd
St. Louis, MO 63166 Contract Number, Type N68936-09-D-0002, IDIQ/CPIF/CPFF Award Date December 19, 2008 Definitization Date December 19, 2008
Initial Contract Price ($M) Current Contract Price ($M) Estimated Price At Completion ($M) Target Ceiling Qty Target Ceiling Qty Contractor Program Manager
905.3 N/A 80 899.9 N/A 67 899.9 899.9
Cost And Schedule Variance Explanations Cost and Schedule variance reporting is not required on this IDIQ/CPIF/CPFF contract.
General Contract Variance Explanation In accordance with a contract addendum to Federal Acquisition Regulation Clause 52.234-4, Earned Value Management (EVM) will be implemented on individual orders. As stated in the contract, EVM is not applicable at the basic contract level.
Contract Comments The difference between the Initial Contract Price Target and the Current Contract Price Target is due to a contract modification realigning certain efforts from a Cost Plus Incentive Fee Contract Line Item Number (CLIN) to a Cost Plus Fixed Fee Level of Effort CLIN. The initial contract price target for the basic contract reflects the total negotiated value at contract award. The current contract price target for the basic contract reflects the revised contract value.
The value, quantities, and funding for each delivery or task order, issued under this Indefinite-Delivery, Indefinite-Quantity contract, are individually negotiated. This contract includes shared costs and quantities for the F/A-18E/F and EA-18G platforms; therefore, all data is duplicated in the EA-18G SAR.
F/A-18E/F December 31, 2012 SAR
May 21, 2013 16:04:14 UNCLASSIFIED 32
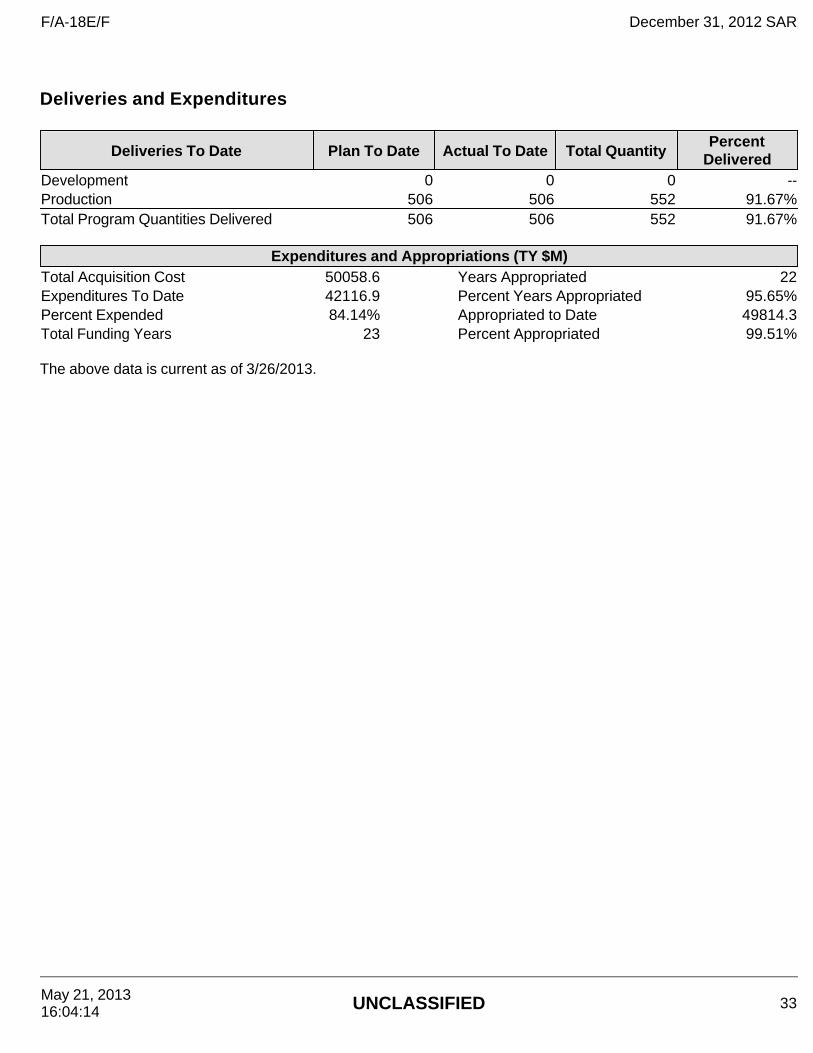
Deliveries and Expenditures
The above data is current as of 3/26/2013.
Deliveries To Date Plan To Date Actual To Date Total Quantity Percent
Delivered Development 0 0 0 -- Production 506 506 552 91.67% Total Program Quantities Delivered 506 506 552 91.67%
Expenditures and Appropriations (TY $M) Total Acquisition Cost 50058.6 Years Appropriated 22 Expenditures To Date 42116.9 Percent Years Appropriated 95.65% Percent Expended 84.14% Appropriated to Date 49814.3 Total Funding Years 23 Percent Appropriated 99.51%
F/A-18E/F December 31, 2012 SAR
May 21, 2013 16:04:14 UNCLASSIFIED 33
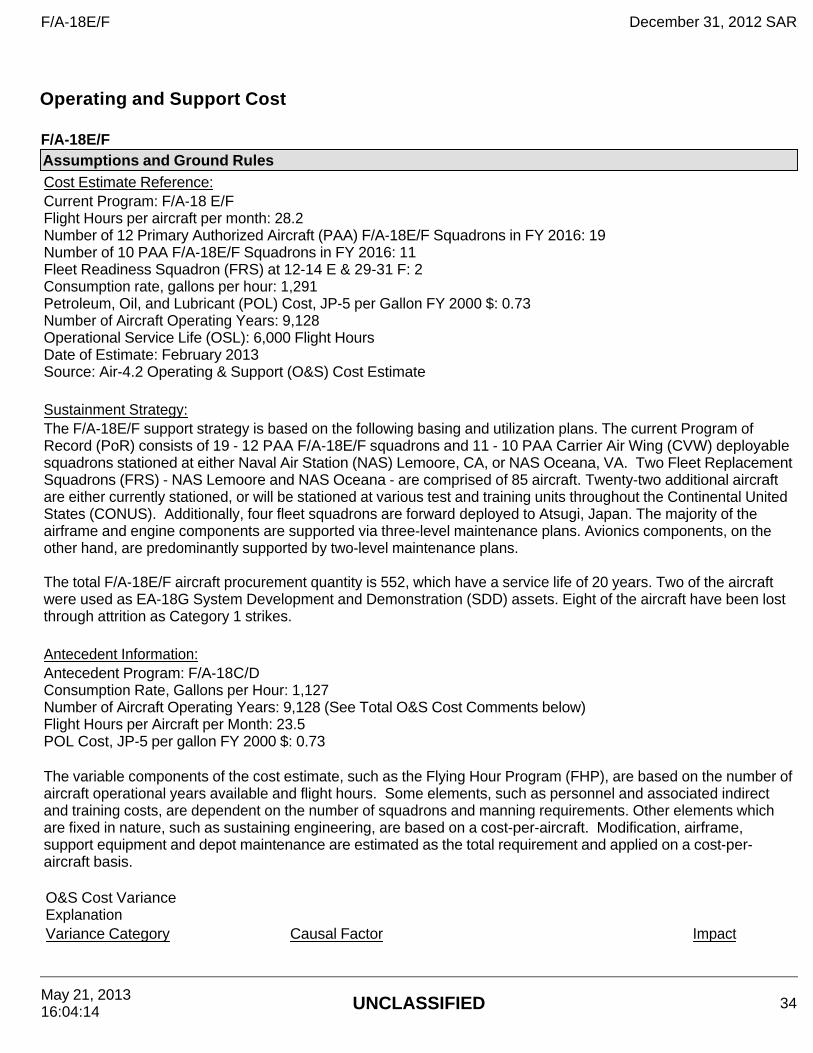
Operating and Support Cost F/A-18E/F Assumptions and Ground RulesCost Estimate Reference: Current Program: F/A-18 E/F Flight Hours per aircraft per month: 28.2 Number of 12 Primary Authorized Aircraft (PAA) F/A-18E/F Squadrons in FY 2016: 19 Number of 10 PAA F/A-18E/F Squadrons in FY 2016: 11 Fleet Readiness Squadron (FRS) at 12-14 E & 29-31 F: 2 Consumption rate, gallons per hour: 1,291 Petroleum, Oil, and Lubricant (POL) Cost, JP-5 per Gallon FY 2000 $: 0.73 Number of Aircraft Operating Years: 9,128 Operational Service Life (OSL): 6,000 Flight Hours Date of Estimate: February 2013 Source: Air-4.2 Operating & Support (O&S) Cost Estimate Sustainment Strategy: The F/A-18E/F support strategy is based on the following basing and utilization plans. The current Program of Record (PoR) consists of 19 - 12 PAA F/A-18E/F squadrons and 11 - 10 PAA Carrier Air Wing (CVW) deployable squadrons stationed at either Naval Air Station (NAS) Lemoore, CA, or NAS Oceana, VA. Two Fleet Replacement Squadrons (FRS) - NAS Lemoore and NAS Oceana - are comprised of 85 aircraft. Twenty-two additional aircraft are either currently stationed, or will be stationed at various test and training units throughout the Continental United States (CONUS). Additionally, four fleet squadrons are forward deployed to Atsugi, Japan. The majority of the airframe and engine components are supported via three-level maintenance plans. Avionics components, on the other hand, are predominantly supported by two-level maintenance plans. The total F/A-18E/F aircraft procurement quantity is 552, which have a service life of 20 years. Two of the aircraft were used as EA-18G System Development and Demonstration (SDD) assets. Eight of the aircraft have been lost through attrition as Category 1 strikes. Antecedent Information: Antecedent Program: F/A-18C/D Consumption Rate, Gallons per Hour: 1,127 Number of Aircraft Operating Years: 9,128 (See Total O&S Cost Comments below) Flight Hours per Aircraft per Month: 23.5 POL Cost, JP-5 per gallon FY 2000 $: 0.73 The variable components of the cost estimate, such as the Flying Hour Program (FHP), are based on the number of aircraft operational years available and flight hours. Some elements, such as personnel and associated indirect and training costs, are dependent on the number of squadrons and manning requirements. Other elements which are fixed in nature, such as sustaining engineering, are based on a cost-per-aircraft. Modification, airframe, support equipment and depot maintenance are estimated as the total requirement and applied on a cost-per-aircraft basis. O&S Cost Variance ExplanationVariance Category Causal Factor Impact
F/A-18E/F December 31, 2012 SAR
May 21, 2013 16:04:14 UNCLASSIFIED 34
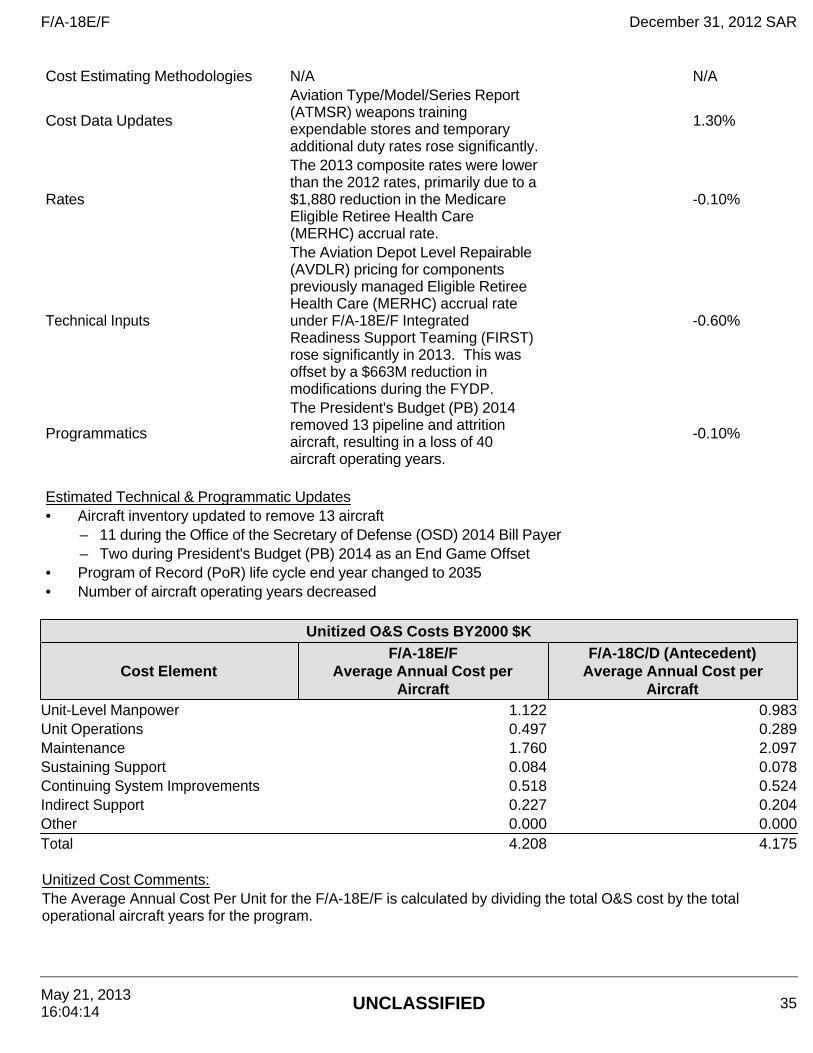
Cost Estimating Methodologies N/A N/A
Cost Data Updates
Aviation Type/Model/Series Report (ATMSR) weapons training expendable stores and temporary additional duty rates rose significantly.
1.30%
Rates
The 2013 composite rates were lower than the 2012 rates, primarily due to a $1,880 reduction in the Medicare Eligible Retiree Health Care (MERHC) accrual rate.
-0.10%
Technical Inputs
The Aviation Depot Level Repairable (AVDLR) pricing for components previously managed Eligible Retiree Health Care (MERHC) accrual rate under F/A-18E/F Integrated Readiness Support Teaming (FIRST) rose significantly in 2013. This was offset by a $663M reduction in modifications during the FYDP.
-0.60%
Programmatics
The President's Budget (PB) 2014 removed 13 pipeline and attrition aircraft, resulting in a loss of 40 aircraft operating years.
-0.10%
Estimated Technical & Programmatic Updates • Aircraft inventory updated to remove 13 aircraft – 11 during the Office of the Secretary of Defense (OSD) 2014 Bill Payer – Two during President's Budget (PB) 2014 as an End Game Offset• Program of Record (PoR) life cycle end year changed to 2035• Number of aircraft operating years decreased
Unitized O&S Costs BY2000 $K
Cost ElementF/A-18E/F
Average Annual Cost per Aircraft
F/A-18C/D (Antecedent) Average Annual Cost per
AircraftUnit-Level Manpower 1.122 0.983Unit Operations 0.497 0.289Maintenance 1.760 2.097Sustaining Support 0.084 0.078Continuing System Improvements 0.518 0.524Indirect Support 0.227 0.204Other 0.000 0.000Total 4.208 4.175
Unitized Cost Comments: The Average Annual Cost Per Unit for the F/A-18E/F is calculated by dividing the total O&S cost by the total operational aircraft years for the program.
F/A-18E/F December 31, 2012 SAR
May 21, 2013 16:04:14 UNCLASSIFIED 35
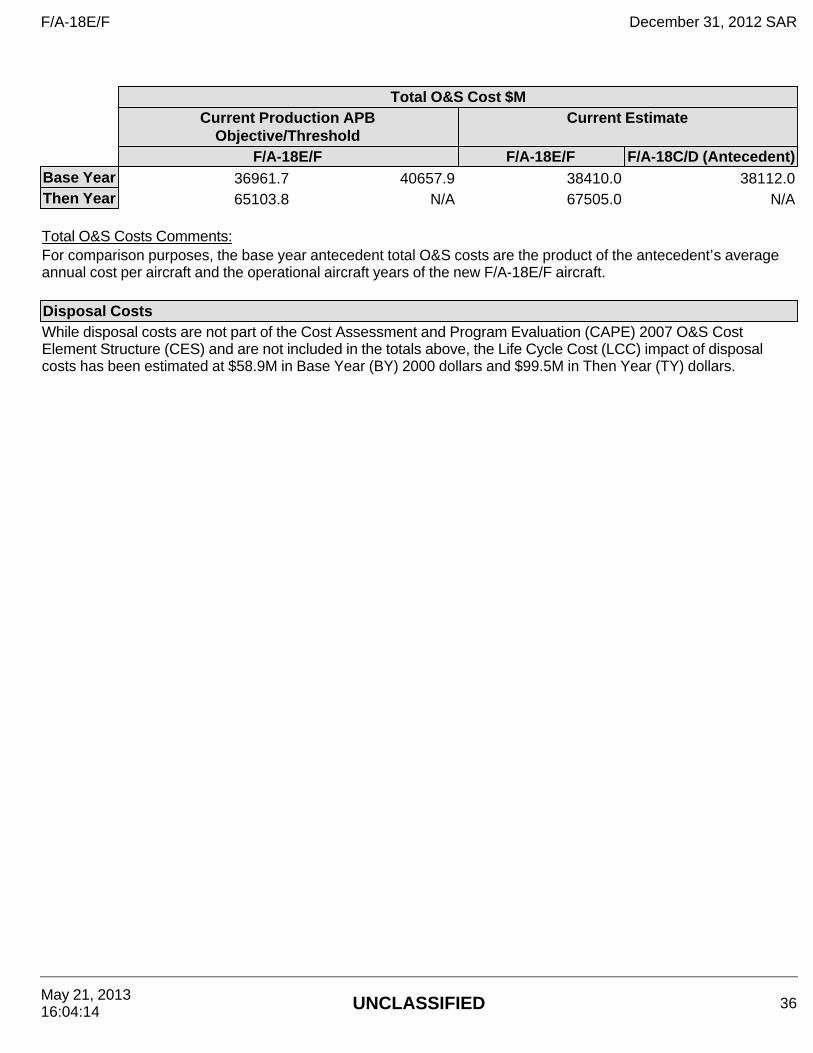
Total O&S Cost $M
Current Production APB
Objective/ThresholdCurrent Estimate
F/A-18E/F F/A-18E/F F/A-18C/D (Antecedent)Base Year 36961.7 40657.9 38410.0 38112.0Then Year 65103.8 N/A 67505.0 N/A
Total O&S Costs Comments: For comparison purposes, the base year antecedent total O&S costs are the product of the antecedent’s average annual cost per aircraft and the operational aircraft years of the new F/A-18E/F aircraft. Disposal Costs While disposal costs are not part of the Cost Assessment and Program Evaluation (CAPE) 2007 O&S Cost Element Structure (CES) and are not included in the totals above, the Life Cycle Cost (LCC) impact of disposal costs has been estimated at $58.9M in Base Year (BY) 2000 dollars and $99.5M in Then Year (TY) dollars.
F/A-18E/F December 31, 2012 SAR
May 21, 2013 16:04:14 UNCLASSIFIED 36