Embed Size (px)
Citation preview
June 29, 2006
Document of the World BankR
eport No. 36630-LK
Sri Lanka Selected Public Expenditure Issues, 2003/2004
Report No. 36630-LK
Sri LankaSelected Public Expenditure Issues, 2003/2004
South Asia Region Poverty Reduction and Economic Management Sector Unit
Pub
lic D
iscl
osur
e A
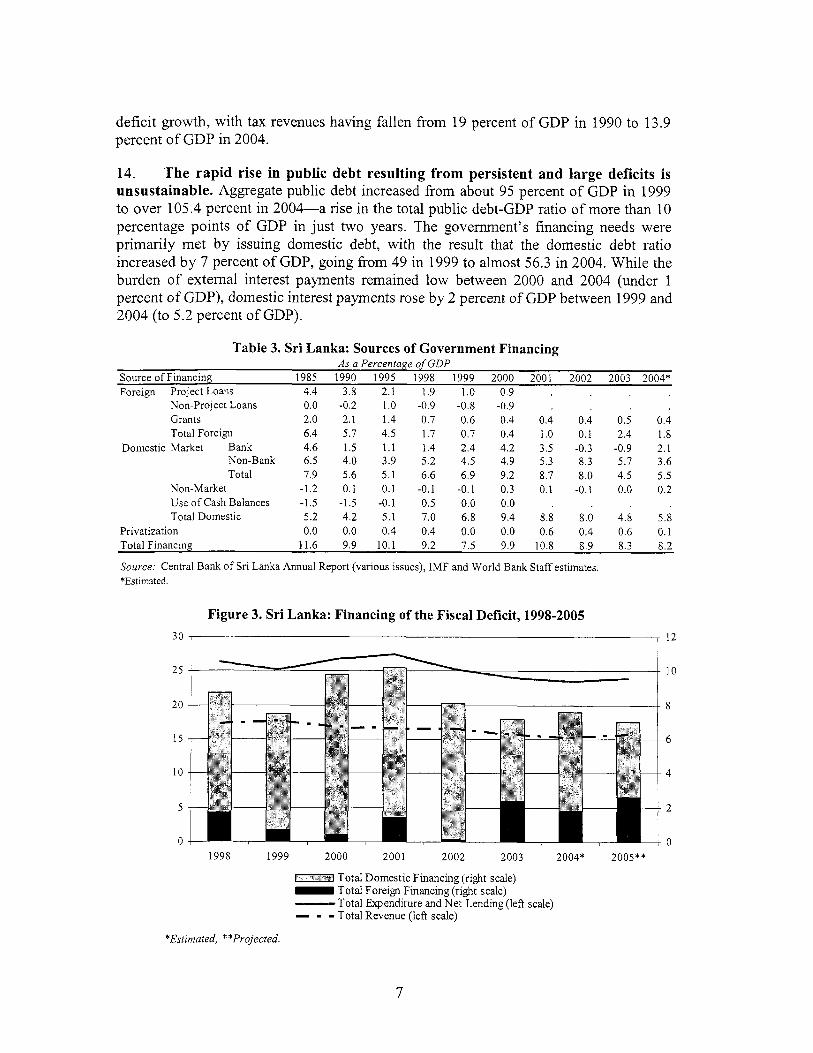
utho
rized
Pub
lic D
iscl
osur
e A
utho
rized
Pub
lic D
iscl
osur
e A
utho
rized
Pub
lic D
iscl
osur
e A
utho
rized
PREFACE
This report i s a summary o f the series o f background policy notes prepared under a process-based public expenditure review (PER) program managed by the World Bank and the Ministry o f Finance from September 2003 to March 2004. The PER process and the preparation o f these background notes involved close collaboration among staff from the World Bank, Ministry o f Finance; Ministry o f Health, Nutrition and Welfare; Ministry o f School Education; Ministry o f Samurdhi; Ministry o f Social Welfare; Ministry o f Irrigation and Water Management; Ministry o f Public Administration, Management and Reforms; the Institute o f Policy Studies (IPS); and the Center for Poverty Analysis (CEPA). The PER program was intempted due to the transition that followed the change o f Government in April 2004 and later the tsunami, but has resumed beginning in late 2005.
A key motivation for the publication o f this report i s to provide a written record of the analytical work carried out under the PER program during 2003/2004, and thereby preserving the institutional memory on this work. As such, the report i s intended to provide a ‘snapshot’ o f the state o f knowledge on the issues covered at that time.

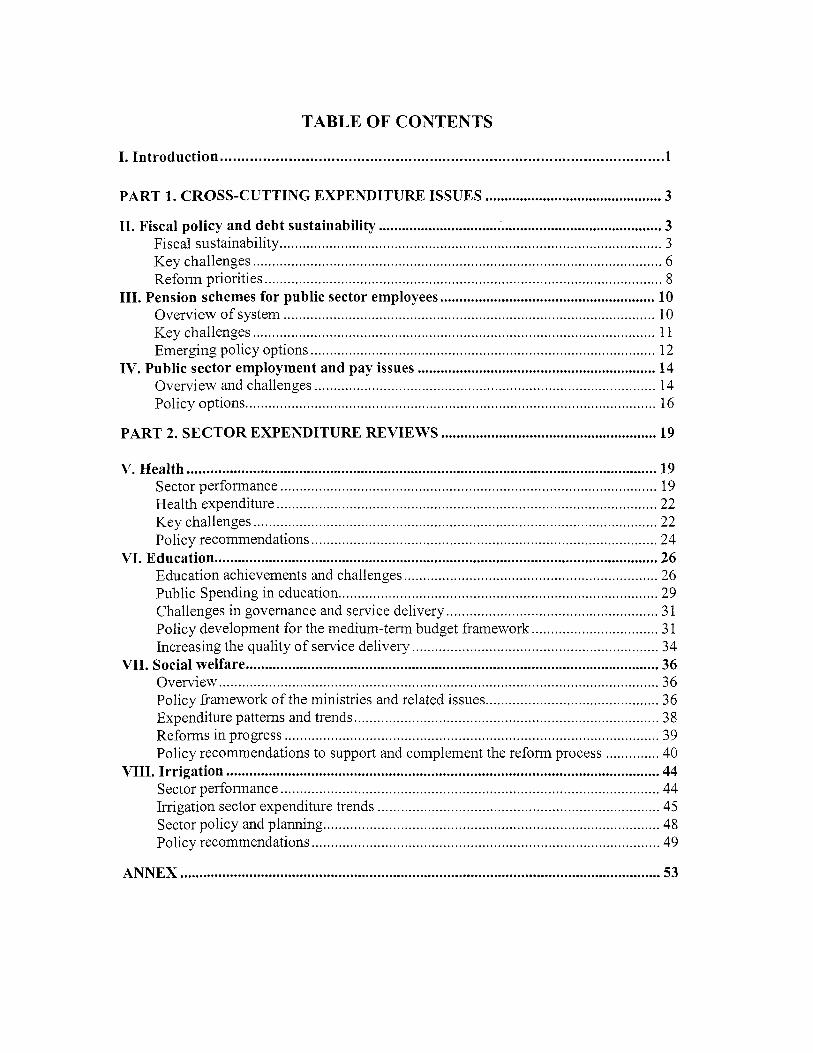
TABLE OF CONTENTS
I . Introduction ........................................................................................................ 1
PART 1 . CROSS-CUTTING EXPENDITURE ISSUES .............................................. 3
I1 . Fiscal policy and debt sustainability ........................................................................... 3 . . . Fiscal sustainability .................................................................................................... 3 K e y challenges ........................................................................................................... 6 Reform priorit ies ........................................................................................................ 8
Overv iew o f system ................................................................................................. 10 K e y challenges ......................................................................................................... 11 Emerging po l i cy options .......................................................................................... 12
Overv iew and challenges ......................................................................................... 14 Pol icy options ........................................................................................................... 16
PART 2 . SECTOR EXPENDITURE REVIEWS ........................................................ 19
I11 . Pension schemes for public sector employees ........................................................ 10
I V . Public sector employment and pay issues .............................................................. 14
V . Health .......................................................................................................................... 19 Sector performance .................................................................................................. 19 Heal th expenditure ................................................................................................... 22 K e y challenges ......................................................................................................... 22 Pol icy recommendations .......................................................................................... 24
V I . Education ................................................................................................................... 26 Education achievements and challenges .................................................................. 26 Public Spending in education ................................................................................... 29 Challenges in governance and service delivery ....................................................... 31 Pol icy development for the medium-term budget framework ................................. 31
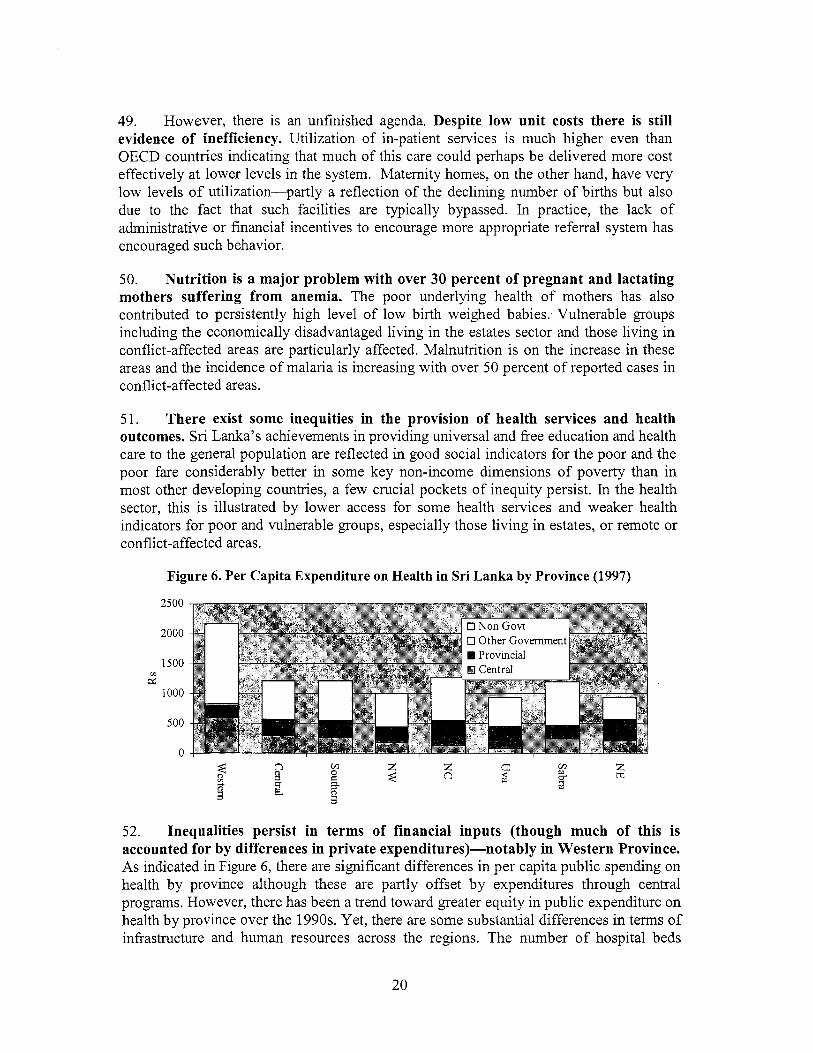
VI1 . Social welfare ........................................................................................................... 36 Overview .................................................................................................................. 36 Pol icy framework o f the ministries and related issues ............................................. 36 Expenditure patterns and trends ............................................................................... 38
Pol icy recommendations to support and complement the reform process .............. 40
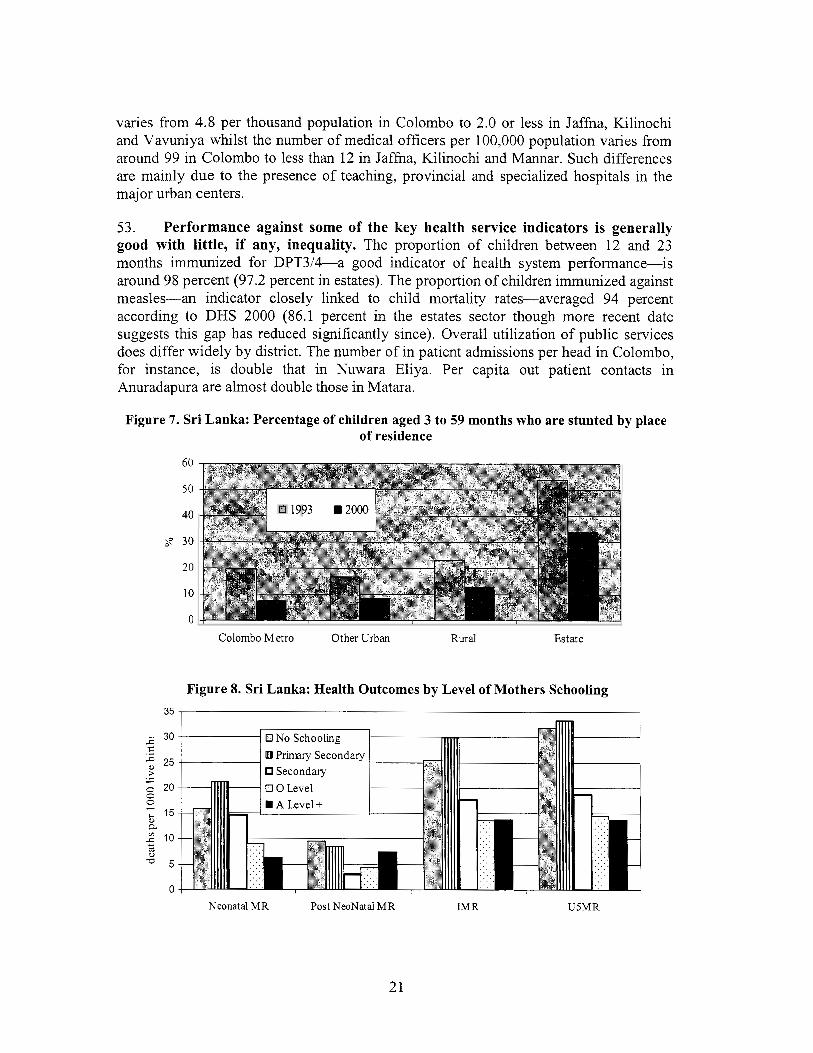
Sector performance .................................................................................................. 44
Sector po l i cy and planning ....................................................................................... 48
. .
Increasing the quality o f service delivery ................................................................ 34
Reforms in progress ................................................................................................. 39
VI11 . Irrigation ................................................................................................................ 44
Irr igation sector expenditure trends ......................................................................... 45
Pol icy recommendations .......................................................................................... 49
ANNEX ............................................................................................................................ 53
Tables
Table 1 . Sri Lanka: Summary o f Government Fiscal Operations ....................................... 3 Table 2 . Baseline Macroeconomic Assumptions ................................................................ 5 Table 3 . Sri Lanka: Sources o f Government Financing ...................................................... 7 Table 4 . Sri Lanka: Pension Expenditures, PSPS and Widows and Orphans Scheme, .... 10 Table 5 . Sri Lanka: Evolution o f Pensioners. 1998-2003 ................................................. 11 Table 6 . Sri Lanka: Number o f Autonomous Agencies and Their Employees ................ 14 Table 7 . Wages and Salaries o f Consolidated Central Government ................................. 16 Table 8 . Sri Lanka: Growth in Employment, Population. Labor Force. and Real GDP.
Table 9 . Education Expenditure as a Share o f National Income and Government Expenditures. Sri Lanka and Selected Other Countries ..................................... 30
Table 10 . Sri Lanka: N e t Enrolment Rates in Major Grade Cycles by Economic Groups31 Table 11 . Samurdhi Coverage and Benefits by Income Quintile ..................................... 38 Table 12 . Total expenditures o f the Ministry o f Samurdhi and Social Welfare ............... 39 Table 13 . Irrigation investments in Sr i Lanka by type o f investment and their shares.
Table 14 . Sri Lanka: Percentage Share o f Major Subsectors in Total Agricultural
1998-2002 .......................................................................................................... 17
1950-97 1/ .......................................................................................................... 46
Expenditure. 1981-2000 .................................................................................................... 46
Figures
Figure 1 . Sri Lanka: Components o f Government Expenditure. 2000.2004 ...................... 4 Figure 2 . Primary Balance and Interest Payments Consistent with Most FMRA Targets . 6 Figure 3 . Sri Lanka: Financing o f the Fiscal Deficit. 1998-2005 ....................................... 7 Figure 4 . PSPS expenditures. % o f GDP. 2003-2075 in the baseline scenario ................ 12 Figure 5 . Sri Lanka: Shares o f Total Public Employment. 2002 ...................................... 15 Figure 6 . Per Capita Expenditure on Health in Sri Lanka by Province (1997) ................ 20 Figure 7 . Sri Lanka: Percentage o f children aged 3 to 59 months who are stunted by place
o f residence ........................................................................................................ 21 Figure 8 . Sri Lanka: Health Outcomes by Leve l o f Mothers Schooling .......................... 21 Figure 9 . Sri Lanka: Poverty Incidence by Education Leve l o f Household Head. 1995/627 Figure 10 . Sri Lanka: Unemployment Rates and Job Search Durations by Education
Level. Men and Women. 2000 ........................................................................... 29 Figure 11 . Investments in Sri Lanka by type o f investment and their shares. 1950-97 .... 45 Figure 12 . Major Irrigation: Spread o f Investments in 2003 ............................................ 47
Acknowledgements
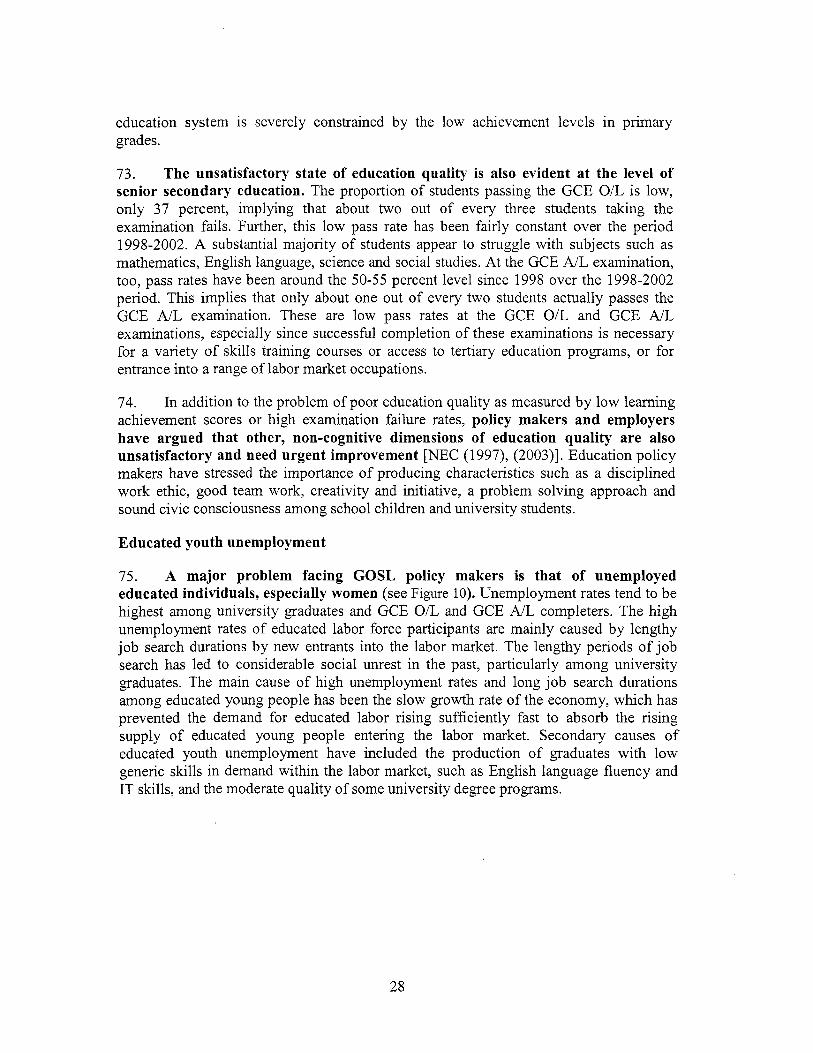
The report was prepared by Emily Sinnott under the guidance o f Rocio Castro and Ijaz Nabi. T h e task team leader o f the 2003/2004 PER program was A l m a Kanani. The original background po l i cy notes were prepared by Mar io A. Cuevas (Fiscal and Debt Sustainability), Ismai l Radwan (Contingent Liabil it ies o f State Owned Enterprises), Esperanza Lasagabaster (Pensions), N i c k Manning, Robert Beschel and Princess Ventura (Public Sector Employment and Pay Issues), Institute o f Pol icy Studies, Michele Gragnolati (Health), Harsha Aturupane (Education), Center o f Poverty Analysis (Social Welfare) and N iha l Fernando, Ranji th Ratnayake (Irrigation). An annex i s included with the Draf t Nat ional Budget Circular prepared by Malco lm Holmes (advisor on the budget formulation process). The PER process benefited f rom advice o f peer reviewers: Shanta Devarajan, A l l is ter Moon.

I. INTRODUCTION
1. This note contains a summary o f the background policy notes prepared in the context o f the public expenditure review (PER) work carried out for the Government o f Sri Lanka in 2003/2004. The PER work involved World Bank assistance at two levels: (i) the preparation o f background pol icy notes on selected cross-cutting issues (i.e. fiscal sustainability, pay and employment, and pensions) as well as sector-specific public expenditure issues (education, health, social welfare, and irrigation); and (ii) the design o f revised budget guidelines aimed at enhancing the strategic focus o f the budget formulation process and the elaboration o f the Medium Term Budget Framework for 2005-2007.
2. The main objective o f the background policy notes was to provide the Ministry o f Finance and selected l ine ministries with background pol icy analysis as an input to assist the government in improving the budget formulation to better link policies with resource allocation. Policy notes were prepared in a few selected sectors that were deemed most significant for the Government, either as major cost drivers or perceived as being inefficient. The summary given in this paper is based on the final draft pol icy notes prepared by March 2004. The draft budget circular drawn up by the PER team in March 2004 is also included as an annex.
3. The analysis in this report concentrates on the major expenditure issues facing the Government of S r i Lanka. The topic o f government revenues i s also, albeit briefly, touched on. The policy notes commence with a look at three overarching issues o f concern for fiscal policy. The f i rs t focus i s on the sustainability o f the rapidly rising public debt and persistent fiscal deficits. Next, a potential contingent liability, the public service pension scheme, i s examined. The note looks at the budgetary impact o f the pension scheme and i t s medium- to long-term financial viability. The final cross-cutting expenditure issue investigated-public sector pay and employment-is a critical subject for S r i Lanka, a country with one o f the highest per capita staffing rates in the developing world. The analysis reviews the ability o f the administration to deliver services effectively to i t s citizens, particularly in a setting marked by the proliferation o f various institutions with unclear mandates and overlapping functions.
4. The next part o f the policy notes deals with expenditure issues in four specific sectors. An assessment i s given o f the appropriateness o f expenditure patterns and policies to meet remaining and emerging challenges in the health and education sectors. For health, there is a need to consolidate the impressive gains made in health outcomes and respond to nascent trends associated with an aging population, such as a growth in non-communicable diseases, through greater focus on preventive. In education, the issues to be confronted are access beyond the primary level and the achievement o f higher quality educational outcomes. Another area investigated is social welfare spending by the Min is t r ies o f Samurdhi and Social Welfare. There are some key issues o f benefit incidence and emerging social protection that need to be addressed. The fourth sector turned to i s irrigation and water management. In light o f the diminishing amount o f
1
public spending going towards this sector, the budget allocation and water resource management pol icy is examined.
5. We fol low a similar pattern in summarizing the seven issues covered in these pol icy notes viz. fiscal sustainability, pensions, public sector employment, health, education, social welfare and irrigation. To begin, there i s a brief review o f performance, followed by an investigation o f the key issues and challenges, including any relevant equityhegional considerations. Next, expenditure trends in the major program areas are covered, including analysis on the consistency o f spending allocations with the stated objectives o f the sector. Finally, a range o f pol icy proposals are presented for each sector.
2
PART 1. CROSS-CUTTING EXPENDITURE ISSUES
11. FISCAL POLICY AND DEBT SUSTAINABILITY
The targets set out in the 2002 Fiscal Management Responsibility Act (FMRA) remain elusive, with the overall fiscal deficit and public debt in 2004 equal to 8.2 percent and 1 OS percent of GDP, respectively. Sri Lanka 's public debt resulting from persistent and large deficits is unsustainable. I n particular, the heavy reliance on domestic (non- concessional) borrowing for deficit financing has been detrimental to growth by crowding-out productive public spending and private credit. Given the heavy public debt burden-which absorbs over half of tax revenue-the public debt needs to be brought to manageable levels by eliminating the primary defcit and by limiting non-concessional borrowing.
FISCAL SUSTAINABILITY
6. Despite recent fiscal consolidation efforts, including the enactment of the FMRA in 2002, the fiscal situation remains strained. A period o f fiscal consolidation occurred during 2002-03 when the primary fiscal deficit was cut from 4.1 percent o f GDP to 1.2 percent. However, the fiscal situation worsened thereafter as the primary fiscal deficit increased to 2.2 percent o f GDP in 2004. The overall fiscal deficit in 2004 remained at 8.2 percent o f GDP, a similar level to 2003 (Table 1).
Table 1. Sri Lanka: Summary o f Government Fiscal Operations (as a percentage of GDP)
1985 1990 1995 1998 1999 2000 2001 2002 2003 2004* Total Revenue 22.3 21.1 20.4 17.2 17.7 16.8 16.6 16.5 15.7 15.3 Tax Revenue 18.7 19.0 17.8 14.5 15.0 14.5 14.6 14.0 13.2 13.9 Total Expenditure and Net Lending 34.0 31.0 30.5 26.3 25 2 26.1 27.5 25.4 24.0 23.5 Current Expenditure 20.1 22.3 23.1 19.6 18.7 20.2 21.6 20.9 19.0 19.2
Interest Payments 4.6 6.4 5.7 5.4 5.6 5.7 6.7 7.4 7.1 5.9 Foreign .. 0.8 0.8 0.7 0.7 0.7 0.7 Domestic .. 4.8 4.9 6.0 6.7 6.4 5.2
Subsidies and Transfers 5.5 6.5 6.1 4.6 4.2 4.2 4.6 4.7 4.0 5.2 Wages and Salaries 4.2 4.9 5.2 5.3 5.3 5.5 5.5 5.6 5.1 5.2
Civilian wages and salaries 3.6 3.9 3.4 3.0 3.0 3.2 3.4 3.4 3.2 3.2 Security .. 4.1 6.5 5.0 4.4 5.6 4.9 4.1 3.5 3.6
Capital Expenditure andNet Lending 14.0 8.7 7.4 6.7 6.5 6.5 5.9 4.6 S.0 4.3
Overall Fiscal Balance 1/ -11.7 -9.9 -10.1 -9.2 -7.5 -9.9 -10.8 -8.9 -8.3 -8.2 Primary Fiscal Balance 1/ -7.1 -3.5 -4.4 -3.8 -1.9 -4.2 -4.1 -1.6 -1.2 -2.2
Memorandum Items: Total public debt 80.2 96.6 95.2 90.8 95.1 96.9 103.2 105.6 105.8 105.4
Foreign 49.6 55.0 51.9 45.3 46.0 43.1 45.2 45.6 47.9 49.1 Domestic 30.6 41.6 43.3 45.5 49.1 53.8 58.0 60.0 57.9 56.3
Education and Health .. 4.5 4.5 4.0 4.0 4.1 3.3 3.9 3.9
Source: Central Bank of Sri Lanka Annual Report (various issues), IMF and World Bank Staff estimates. Notes: *Estimated. I/ Excluding grants
7. Just three expenditures, civil
components of public sector spending-security related service wages and salaries, and interest payments on public
3
debt-are equal to total tax receipts (Figure 1). The average combined expenditure on security related outlays, c i v i l service wages and salaries, and interest payments was 14 percent o f GDP over 2000-2004, wh i le taxation proceeds averaged 14.2 percent o f GDP in this per iod. Average expenditure on subsidies and transfers accounts fo r an addi t ional 4.5 percent o f GDP over 2000-2004. There i s then l i t t le r o o m fo r other discretionary spending. If t h e leve l o f spending on these constituents remains unchanged, then the only w a y to reduce the fiscal def ic i t wi l l b e to substantially increase revenues.
40
35 -
30
25 -
20 -
As a Percentage OfGDp 0 Security related eqmditures
Civil service wages and salaries
Total expenditure and net lending Interest payments +
Current expenditure .... -. ............. ............ .......... ..._................ . -_ .
15
10
5
0 2000 2001 2002 2003 2004*
Source: Central Bank o f Sri Lanka Annual Report (various issues), IMF and World Bank Staff estimates
8. Large fiscal imbalances and high public debt have beset the Sr i Lankan economy for the past three decades. Despite repeated attempts at reform, f iscal imbalances persisted and the pub l ic debt burden increased. The average fiscal def ic i t (before grants) in the 1991-2001 per iod exceeded 9 percent o f GDP. W h i l e high pub l ic debt levels contribute to fiscal diff iculties, persistent p r imary def ic i ts exacerbate the situation. A f t e r a decade o f running high primary f iscal def ic i ts (around 3-4 percent o f GDP), the pr imary account m o v e d closer to balance in 2002 and 2003, only fo r a further deterioration in 2004.
4
Box 1. The Fiscal Management (Responsibility) Act In v iew o f the importance o f strengthening fiscal management, Parliament approved the Fiscal
(Management) Responsibility A c t (FMRA) on December 10, 2002, effective f r o m fiscal year 2003. The purpose o f the A c t is t o provide a formal framework for fiscal discipline, and to increase transparency and accountability in government fiscal operations.
A k e y element o f the FMRA i s the introduction o f medium-term fiscal targets. Specifically, the fiscal deficit has to b e reduced to 5 percent o f GDP by 2006 and maintained under that level thereafter. The FMRA also sets ceilings on total government debt, which should not exceed 85 percent o f GDP by 2006, and 60 percent o f GDP by 2013. Another important characteristic o f the FMRA i s that it sets a limit on explicit government guarantees o f 4.5 percent o f GDP.
As the FMRA i s also designed to improve the credibil i ty o f fiscal policy, the A c t mandates the government to present a number o f reports, including: (a) a Fiscal Strategy Management report, with the Budget Speech; (b) Mid-Year Fiscal Position Reports; (c) Final Budget Position Report; (d) Pre-Election Budgetary Position Reports, within three weeks o f the announcement o f a general election; and (e) Statements o f Responsibility by the Finance Minister and Secretary, together with a Pre-Election Budgetary Position Report. Several o f these reports have been presented by the government.
I
9. The fiscaVdebt sustainability analysis for Sr i Lanka shows that achieving the FMRA medium and long term targets will be very challenging, especially given the recent increase in fiscal imbalances. The FMRA targets are: (a) f iscal deficit not to exceed 5 percent o f GDP by 2006; (b) total government debt at 85 percent o f GDP by 2006; and (c) government debt not to exceed 60 percent o f GDP by 2013 (see B o x 1). The fiscal/debt analysis was conducted using as a basis the estimated fiscal posit ion o f 2004 and projecting onwards the path for the pr imary deficit that wou ld be required to meet the FMRA targets. The baseline macroeconomic assumptions underlying the analysis are presented in Table 2.
10. Meeting the F M R A targets would require a zero primary balance between 2005-2013, resulting in a public debt to GDP ratio of 60 percent by 2013 (see Figure 2).* However, these projections are based on an estimated pr imary defici t o f 1.3 percent o f GDP in 2004, as envisaged in the pre-election report, as opposed to the currently estimated deficit o f 3.1 percent. This implies that a further adjustment w o u l d be needed to remain within the FMRA targets.
Table 2. Baseline Macroeconomic Assumptions 2004 2005 2006 2007 2008-2013
GDP growth (“YO) ’ 6.0 6.3 6.5 6.3 6.0
Nominal interest rate o n publ ic debt* (“A) 5.9 6.0 6.0 6.0 6.0 External financing (as % o f GDP)** 0.4 2.8 1.8 1.8 1.8
Notes: The real exchange rate i s assumed to appreciate mildly during 2004-2006 and t o remain constant thereafter. * Average interest rate that applies to total government debt, expressed in nominal terms. **Net External financing, including grants.
Change in GDP deflator (%) 7.0 6.0 5.0 5.0 5.0
L
Under this scenario, public debt is projected at 88 percent o f GDP in 2006, somewhat above the FMRA target.
5
11. An early convergence towards FMRA targets would bring substantial fiscal savings due to sharply reduced debt servicing costs. The baseline projections show that meeting the pr imary balance and debt ratios FMRA targets wou ld result in annual fiscal savings equivalent to 1 percent o f GDP by 2006, and 2.6 percent o f GDP by 2012- 2013. Total interest payments o n public debt would stabilize at around 3.5 percent o f GDP by 2012.
Figure 2. Primary Balance and Interest Pa! 2% ,. ..... .- _. . . . . . . . . . . . . . . . . . . ...
2004 2035 2006 2007 2M8 2009 2010 2011 2012 2013
Primary Balance
7 f f ~ ~ , . . . . . . . . . . . . . . . . .
I 0%
0 0% I
2 m 2W5 2 M 2037 2038 2009 2010 2011 2012 2013
Interest Payments
Note: In this scenario, the government sl ightly misses
ients Consistent with Most FMRA Targets
Public Debt
Overall deficit
e 2006 FMRA debt/GDP target o f 85 percent. However, the 2006 fiscal defici t target o f 5 percent o f GDP is met.
12. However, the magnitude of the fiscal adjustment i s highly sensitive to changes in key macroeconomic assumptions, such as real GDP growth, the nominal interest rate, and the exchange rate. For instance, the baseline scenario assumes that annual real GDP growth stabilizes at 6 percent in the long-run. But, if real GDP growth remained at i ts historical level o f 5 percent, ceteris paribus, a pr imary surplus closer to 0.5 percent o f GDP wou ld be required to reach a debt rat io o f 60 percent in 2013.
KEY CHALLENGES
13. Reversing the decline in tax revenue. Government revenues have declined over t ime in Sr i Lanka, fal l ing as a share o f GDP f rom 22.3 percent in 1985 to 20.4 percent in 1995 to 15.3 percent in 2004. At the same time, wh i le there has been a decline in total expenditures since 1995, government spending has remained high relative to revenues at 23.5 percent in 2004. In particular, tax revenue losses would seem to be driving the recent
6
deficit growth, with tax revenues having fallen from 19 percent o f GDP in 1990 to 13.9 percent o f GDP in 2004.
14. The rapid rise in public debt resulting from persistent and large deficits i s unsustainable. Aggregate public debt increased from about 95 percent o f GDP in 1999 to over 105.4 percent in 2004-a rise in the total public debt-GDP ratio o f more than 10 percentage points of GDP in just two years. The government’s financing needs were primari ly met by issuing domestic debt, with the result that the domestic debt ratio increased by 7 percent of GDP, going from 49 in 1999 to almost 56.3 in 2004. While the burden o f external interest payments remained low between 2000 and 2004 (under 1 percent o f GDP), domestic interest payments rose by 2 percent o f GDP between 1999 and 2004 (to 5.2 percent o f GDP).
Table 3. Sri Lanka: Sources o f Government Financing As a Percentage of GDP
Source o f Financing 1985 1990 1995 1998 1999 2000 2001 2002 2003 2004* Foreign Project Loans 4.4 3.8 2.1 1.9 1.0 0.9
Non-Project Loans 0.0 -0.2 1.0 -0.9 -0.8 -0.9 Grants 2.0 2.1 1.4 0.7 0.6 0.4 0.4 0.4 0.5 0.4 Total Foreign 6.4 5.7 4.5 1.7 0.7 0.4 1.0 0.1 2.4 1.8
Non-Bank 6.5 4.0 3.9 5.2 4.5 4.9 5.3 8.3 5.7 3.6 Total 7.9 5.6 5.1 6.6 6.9 9.2 8.7 8.0 4.5 5.5
Domestic Market Bank 4.6 1.5 1.1 1.4 2.4 4.2 3.5 -0.3 -0.9 2.1
Non-Market -1.2 0.1 0.1 -0.1 -0.1 0.3 0.1 -0.1 0.0 0.2 UseofCashBalances -1.5 -1.5 -0.1 0.5 0.0 0.0 Total Domestic 5.2 4.2 5.1 7.0 6.8 9.4 8.8 8.0 4.8 5.8
Privatization 0.0 0.0 0.4 0.4 0.0 0.0 0.6 0.4 0.6 0.1 Total Financing 11.6 9.9 10.1 9.2 7.5 9.9 10.8 8.9 8.3 8.2
Source: Central Bank of Sr i Lanka Annual Report (various issues), IMF and World Bank Staff estimates *Estimated.
Figure 3. Sri Lanka: Financing o f the Fiscal Deficit, 1998-2005
25 10
20 8
15 6
10 4
5 2
0 0 1998 1999 2000 2001 2002 2003 2004* 2005**
m i Total Domestic Fmancmg (nght scale) - Total Foreign Fmancmg (right scale) -Total Expenditure and Net Lending (left scale) - - - Total Revenue (left scale)
*Estimated, **Projected.
7
15. The heavy reliance on domestic financing of public sector deficits i s detrimental to growth. (Table 3 and Figure 3). A significant consequence o f the government’s reliance on domestic borrowing to finance the deficit has been the implicit taxation o f public pension funds and the domestic banking system. Sri Lanka finances domestic public debt through two sources. The first are rupee loans issued at below market rates. The use o f this type o f financing has declined from 62 percent (total rupee securities/total domestic debt) in 1997 to 14 percent in 2004. The main supply o f domestic financing i s now pensiodother social security funds, e.g. Employee’s Provident Fund (EPF). These funds are required to invest largely in government paper. For example, the EPF is restricted to mostly rupee securities and a small amount o f treasury bills. The result i s that an implicit tax i s imposed on non-civil service workers. One estimate puts the after tax real rate o f returns over the past three decades for rupee loans at 0.25 percent (IMF, 2002).2
REFORM PRIORITIES
16. Reducing public debt to manageable levels. Given the heavy public debt burden, which absorbs over hal f o f tax revenue, i t i s imperative to bring the public debt to manageable levels by at least eliminating the primary deficit and by limiting non- concessional borrowing.
17. Reforming wage and recruitment policies. Sri Lanka has one o f the largest bureaucracies in the region, with a ratio o f 3.9 c iv i l servants per 100 people. Although the size o f the (civilian) wage bill i s not unmanageable at present (around 3 percent o f GDP), the trends are worrisome. Between 1990 and 2001, public sector employment grew at 3.6 percent annually, outpacing growth in population and labor force. W h i l e keeping the wage bill in check, strong political commitment wi l l be needed to address well-known constraints to public service delivery. These include overstaffing (particularly at the lower grades); excessive salary compression (8: 1); administrative fragmentation, duplication, and wastage (partly exacerbated by the ineffective devolution of functions); and outdated processes and procedures.
18. Rationalizing public spending and linking it to the poverty reduction strategy. The scope for expenditure rationalization i s significant, not least because o f the need to address the duplication and overstaffing problems o f the public administration. In addition, there i s a serious imbalance in public spending, with the bulk o f the budget being directed to fbnd recurrent costs (i.e., interest payments, wages, and subsidies) and very little to investment. The Ministry o f Finance i s developing a medium term budget framework (MTBF) which could potentially combine macro (i.e., attaining fiscal sustainability) and micro objectives (such as enhancing the development impact o f public spending). Following the recent introduction o f budget ceilings and o f a three-year planning horizon, there i s a need to strengthen the l i n k s between priorities, resources, and outputs/outcomes. This wil l require a more strategic and consultative budget formulation process and the identification o f trade-offs within and across sectors.
L
The implici t tax i s measured as the gap between interest rates o n rupee securities and market-based instruments.
8
19. Improving the performance o f state-owned enterprises (SOEs). The financial burden o f SOEs i s high and service delivery i s poor. Most are overstaffed, incur operating loses, and have large debts (mostly to the state-owned banks). Direct subsidies alone absorb 3 percent of GDP annually, which is greater than the entire education budget. These companies should be substantially restructured (through privatization or other methods), be allowed to operate on a commercial basis with no political interference, and be subject to a hard budget constraint.
20. Reversing the decline in revenue by strengthening tax administration and expanding the tax base for major taxes (VAT and income tax). The challenge in designing tax policies i s to reverse the massive decline in the tax-to-GDP in a manner that i s supportive o f growth and efficiency. The task i s daunting given the sharp drop in trade taxes (from 6 to 2 percent o f GDP since 1990); the stagnation o f income taxes at about 2 percent o f GDP, which i s very weak by international standards; and the incomplete transition from a complex system o f turnover taxes and special levies to a Value Added Tax (VAT). Increased revenue in the order o f 2-3 percent o f GDP may be achievable through:
0 Strengthening VAT. W h i l e the 2004 unification o f the two VAT rates into a single rate o f 15 percent facilitated administration and reduced leakages, i t s immediate impact was revenue-reducing. Going forward, additional revenue wil l be possible if the VAT coverage is extended to retail trade and exemptions are reduced.
0 Raising the income tax yield. Underlying reasons for l o w collection include: the provision o f long term tax holidays for the rapidly growing Board o f Investment (BOI) sector, a long history o f investment allowances, concessionary rates, generous depreciation, and exclusion o f most public sector employees from personal income tax. The scope for substantially raising the income tax yield i s limited in the short term, but significant gains could be made if a moratorium on tax holidays were to be gradually phased in and existing exclusions and concessions pared down.
0 Improving tax administration. For several reasons, including the coexistence o f parallel systems (for customs and BO1 firms), Sri Lanka’s tax administration has limited experience in administering modem taxes (e.g., VAT and income tax) that require verification, audit and risk monitoring. A well-integrated revenue administration, along the l ines o f the originally envisaged Revenue Authority, needs to be established as soon as possible. Complementary measures include the establishment o f a separate tax audit unit and making the large tax payer unit more proactive.
9
111. PENSION SCHEMES FOR PUBLIC SECTOR EMPLOYEES
While the rat io of retirees to active civil servants is high, expenditures on the Public Sewice Pension Scheme (PSPS) are not estimated to grow substantially in future years, following the introduction of a Contributory Pension Fund scheme. A major problem with the PSPS benefits design is that the f low ofpension payments to an individual retiree is heavily skewed towards early years of retirement, in part due to the ad-hoc indexation of benefits at rates below inflation. International experience suggests that, optimally, real benefit value should remain constant over time. However, a full indexation of benejh could be quite costly if other parameters of benefits design are not changed. Another critical issue is the need to increase the investment return on pension assets by diversi j j ing away from low-return government bonds.
OVERVIEW OF SYSTEM
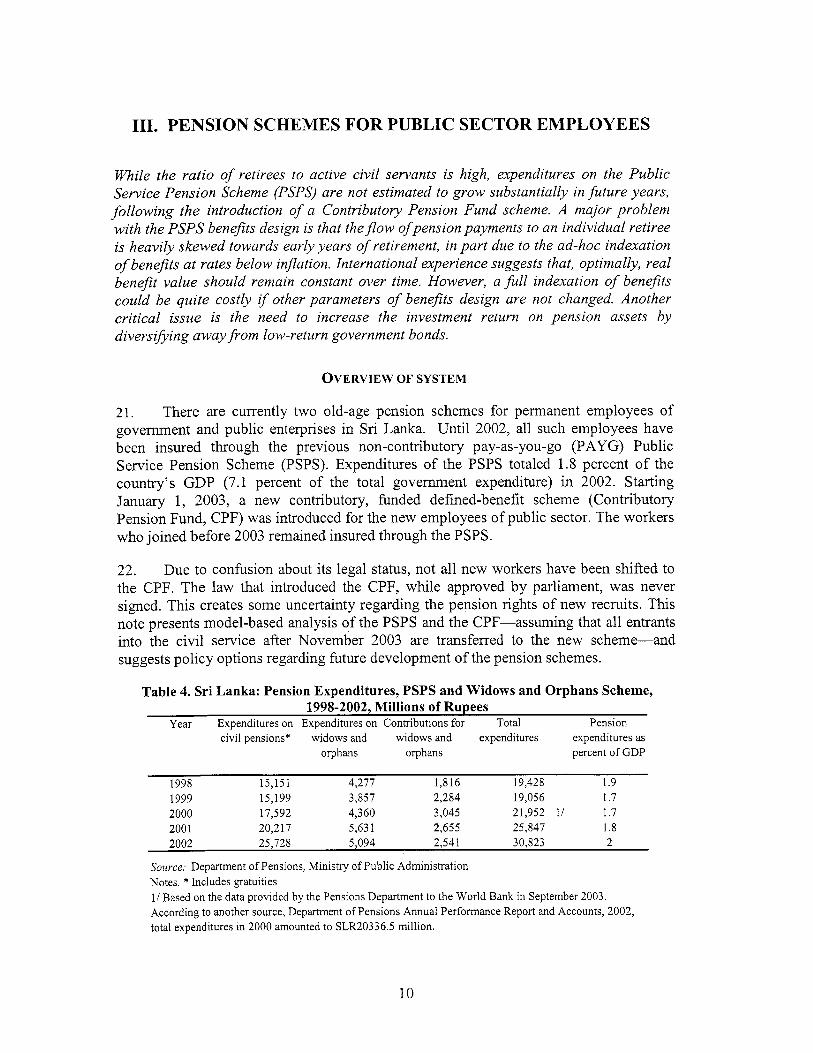
21. There are currently two old-age pension schemes for permanent employees o f government and public enterprises in Sr i Lanka. Until 2002, a l l such employees have been insured through the previous non-contributory pay-as-you-go (PAYG) Public Service Pension Scheme (PSPS). Expenditures o f the PSPS totaled 1.8 percent o f the country’s GDP (7.1 percent o f the total government expenditure) in 2002. Starting January 1 , 2003, a new contributory, funded defined-benefit scheme (Contributory Pension Fund, CPF) was introduced for the new employees o f publ ic sector. The workers who jo ined before 2003 remained insured through the PSPS.
22. D u e to confusion about i t s legal status, no t a l l new workers have been shifted to the CPF. The l a w that introduced the CPF, wh i le approved by parliament, was never signed. This creates some uncertainty regarding the pension rights o f n e w recruits. This note presents model-based analysis o f the PSPS and the CPF-assuming that a l l entrants in to the c i v i l service after November 2003 are transferred to the new scheme-and suggests po l i cy options regarding future development o f the pension schemes.
Table 4. Sri Lanka: Pension Expenditures, PSPS and Widows and Orphans Scheme, 1998-2002, Mil l ions o f Rupees
Year Expenditures on Expenditures on Contributions for Total Pension civil pensions* widows and widows and expenditures expenditures as
orphans orphans percent of GDP
1998 15,151 4,277 1,816 19,428 1.9 1999 15,199 3,857 2,284 19,056 1.7 2000 17,592 4,360 3,045 21,952 1/ 1.7 200 1 20,217 5,63 1 2,655 25,847 1.8 2002 25,728 5,094 2,541 30,823 2
Source; Department o f Pensions, Ministry of Public Administration Notes. * Includes gratuities 1/ Based on the data provided by the Pensions Department to the World Bank in September 2003. According to mother source, Department o f Pensions Annual Performance Report and Accounts, 2002, total expenditures in 2000 amounted to SLR20336.5 million.
10
23. Since 1947, the PSPS has constituted the primary pension program for c iv i l servants, armed services, provincial and local govemment employees, and teachers. The PSPS i s a non-contributory scheme directly financed from the public budget. Together with the contributory scheme for widows and orphans, i t s expenditures amounted to about 2 percent of GDP in 2002 (Table 4).
24. T h e rat io o f retirees to active civil servants (dependency ratio) i s high. As o f 2002, this program covered an estimated 506,000 govemment employees and 389,000 pensioners (Table 5). Minimum retirement age i s 55 years, and mandatory retirement age i s 60 years. Even though the effective retirement age i s close to 60 years, it i s low compared to countries with similar l i fe expectancy. The current demographic profile o f the insured workers i s skewed towards younger and middle-age cohorts: about 90 percent o f them are younger than age 50. The program provides for a lifetime unreduced pension representing between 85-90 percent o f the last salary at the time o f retirement for 30 years o f service. Alternatively, a retiree could receive a pension equal to 75-85 percent o f the last salary, increased by 5-10 percentage points o f the last salary after 10 years o f retirement and complemented by commuted gratuity-a lump-sum payment at retirement, worth 24 months o f initial pension. Almost al l retirees chose the second option. The benefit diminishes by two percentage points for each year short o f 30 years o f service .
Table 5. Sr i Lanka: Evolution o f Pensioners, 1998-2003 Year Number o f Number o f Total Rate o f growth
civil widows and number o f o f total pensioners orphans pensioners pensioners, %
1998 269,645 88,583 358,228 1.7 1999 274,345 90,127 364,472 2.0 2000 279,802 91,920 371,722 3.0 2001 288,276 94,704 382,980 1.8 2002 297,041* 97,584* 394,625 1.3
Source: Department o f Pensions, Ministry o f Public Administration * Estimate
KEY CHALLENGES
25. The expenditures of the PSPS are estimated to grow as a percentage o f GDP over the next two decades, peaking at about 2.5 percent around 2025. The driving force behind this growth wil l be the increasing size o f the cohorts retiring from Sr i Lanka’s public sector. This wil l occur because o f rapid aging o f the public sector current and former labor force. After reaching the peak, the liabilities wi l l decline as the scheme is being gradually phased out. Figure 4 gives the estimated stream o f PSPS expenditures over 2003-2075 in baseline simulations done in a background paper for this note. The baseline scenario assumes 3 percent annual growth in wages, 3 percent annual inflation and indexation by 20 percent o f the inflation rate.
26. Liabilities of the PSPS could be reduced if the retirement age i s increased. However, the retirement age increase should be gradual, because o f another government’s objective-elimination o f surplus labor in the public sector through the
11
Voluntary Retrenchment Scheme (VRS). Since the increase in retirement age could act in the opposite direction, the timeframe for implementation o f this measure should allow for the VRS to take hold.
Figure 4. PSPS expenditures, % of GDP, 2003-2075 in the baseline scenario
3.0% -
2003 2013 2023 2033 2043 2053 2063 2073
27. The major problem with the PSPS benefits design i s that the flow of pension payments to an individual retiree i s heavily skewed towards early years of retirement. This i s due to two factors. The first one i s commuted gratuities paid at retirement. The second one i s an ad-hoc indexation o f benefits, on average below the inflation level, leading to a substantial fal l in the real value o f an individual’s pension over time.
28. Indexation of benefits could be quite costly if other parameters of benefits design are not changed. For full indexation by inflation to be feasible without increase in the scheme’s outlays, the average replacement rate at retirement for the retirees opting for commuted gratuity should be reduced from about 80 percent to 65-70 percent if the commuted gratuities are to be paid at their current levels, to 70-75 percent if they are cut in half, and to 75-79 percent if they are abolished.
EMERGING POLICY OPTIONS
29. Establishment of the CPF has been a positive development for at least two reasons: introduction of employee contributions and some reduction of the benefits levels compared to the PSPS. These allow for gradual reduction o f the financial burden imposed by the pension system on the government budget.
30. There are three areas for improvement in the CPF design:
(a) l ike any fully funded defined-benefit arrangement, i t i s exposed to a large number o f risks, and its financial sustainability is highly sensitive to the values o f economic, financial, and demographic parameters, which could be quite volatile in the long term. The value o f the scheme’s reserves in the two most distant scenarios o f our simulations differs by over 30 percent o f GDP after 2050.
(b) in the long run, when the scheme matures, the st i l l generous benefits i t promises may not be covered by i t s revenues. For the f i rs t decades o f its
12
operation, the CPF wil l have few or n o retirees and wi l l r a p i d l y accumulate reserves, w h i c h wil l peak around 2040-2050. A f te r th is point, however, the f inanc ia l status o f the scheme will rap id ly deteriorate and va lue o f i t s reserves i s l i k e l y to become negative.
(c) benef i ts design (largely the same issues as for the PSPS).
3 1. cou ld b e suggested.
Depend ing o n the pol i t ica l and other constraints, three options o f the CPF re form
Option 1: change the parameters of the scheme without changing its structure. Increase in the retirement age (synchronically with PSPS) and decrease in the effective replacement rate and/or amount o f gratui ty p a i d at retirement would enhance financial pos i t ion o f the scheme. However, it would not el iminate inherent vo lat i l i ty o f the funded defined-benefit arrangements.
Option 2: introduce a defined-contribution component into the CPF. Under th is strategy, the replacement rate prov ided by the scheme on the defined-benefit basis should b e reduced. In exchange, the scheme’s participants would b e of fered addi t ional benefits based o n the defined-contributions pr inciple. Sh i f t ing to this “multipillar” structure w o u l d d ivers i fy the r isks and improve the long-term financial performance o f the scheme.
Option 3: unify as much as possible design of the pension schemes covering private and public sectors of the economy. This would a l low for por tab i l i t y o f benefits between the two schemes and remove labor market distort ions (in particular, obstacles for the labor mobility between pr ivate and p u b l i c sectors) caused by the fragmentation o f the country’s pension system.
32. Whichever o f the three strategies i s chosen, there i s a need to increase the yield rate by diversification of investment of pension assets. Currently, the bulk o f funds o f a l l funded pension schemes in S r i L a n k a i s invested in government bonds. Histor ical ly, rea l returns on government bonds in S r i L a n k a were low, w h i c h puts f inancial sustainabil ity o f the scheme at risk.
33. Last, but not least, development of the effective governance structure for the CPF i s a necessary condi t ion o f i t s successful performance. Des ign o f th is structure should depend on the choice o f re fo rm strategy. If pension schemes for p u b l i c and pr ivate sector have simi lar designs, they cou ld b e managed by the same government agency; otherwise, development o f a separate govern ing b o d y for the CPF i s desirable.
13
IV. PUBLIC SECTOR EMPLOYMENT AND PAY ISSUES
Sri Lanka 3 share of public employees to population is among the highest in the world. Since 1998, the government has added about I O percent more individuals to the public sector workj5orce. Shortcomings in the devolution process, numerous and overlapping ministries and political patronage have contributed to the excess number of public employees. A further problem faced by the public sector is the low compression ratio of wages. Targeting wage increases to higher-level staff would ease dfjculties in recruiting staff with skills highly sought-after by the private sector and increase incentives for advancement in the public service.
OVERVIEW AND CHALLENGES
34. During the decades immediately after independence, the Government o f Sri Lanka was able to achieve impressive gains in leading social indicators. Even now, Sri Lanka’s public administration retains certain elements o f good governance, such as a dedicated professional staff, a transparent regulatory system, and levels o f corruption that are among the lowest o f South Asian states. However, the last three decades have witnessed increasing politicization, patronage and fragmentation in administration, leading to an overall decline in c iv i l service standards, capacity and work ethos. Sri Lanka’s public administration suffers from tremendous over-staffing, an excessive number o f institutions, an excessive reliance on administrative procedures, weak institutional control mechanisms and politicization.
35. Within Central Government, autonomous agencies also have been growing in number-including regulatory bodies, research institutes, and service delivery organizations. Table 6 reveals the growth in agencies and their total number o f employees. A s with ministries, there are evident cases o f unnecessary balkanization among statutory boards, as illustrated by the Coconut Cultivation Board, Coconut Development Authority, and Coconut Research Institute.
Table 6. Sr i Lanka: Number o f Autonomous Agencies and Their Employees
1994 1998 2002 No. o f Agencies 11 111 130 161 Employees l/ 60,209 65,551 106,654 Central Govt. Current Transfers to Public Institutions (Rs. mn.) 21 4,320 12,091 * Sources: 11 Public employee census documents, various years. 21 Central Bank o f Sri Lanka, Annual Report 2002. These transfers are not al l dedicated to salaries. * provisional
36. Devolution has led to an expansion of the central government’s administrative structure, as seen in the establishment o f ministries for regional development (e.g., Ministry o f Southern Region Development, Ministry o f Western
14
Region Development). The functions o f these central government development ministries clearly overlap with those o f the Provincial Council governments. Coordination is complicated by the fact that the geographical coverage o f the central government’s regional development ministries is not coterminous with the boundaries o f the Provincial Councils. I t has been suggested, however, that these development ministries o f central government compensate for a shortcoming in Sri Lanka’s devolution design. Devolution did not establish effective policy linkages between central government and the provincial councils, but the Secretary o f the relevant development ministry may provide a channel for provincial councils to raise policy concerns with central government.
37. Sr i Lanka’s share o f public employees to population i s among the highest in the world. Public employment exceeds 1 mi l l ion out o f a population o f little more than 19 million. The problem o f excessive employment i s long-standing. Yet, the situation has worsened in recent years. In 1998, there were roughly 930,000 public employees in Sri Lanka-already a worrisome number. Today, there are an additional 100,000. Figure 5 presents the relative share o f Civilian Central Government, Provincial Council, state- owned enterprises (SOEs), and armed forces employment. Three related factors clearly have contributed to the excess number o f public employees: (1) shortcomings in the devolution process, (2) numerous and overlapping ministries, and (3) political patronage.
Figure 5. Sr i Lanka: Shares of Total Public Employment, 2002
St at e
Civilian Central Govt. 41%
Armed Forces
12%
38. Despite having such a large share o f public employees to population, Sr i Lanka’s expenditure on public sector wages and salaries i s not higher than other countries in Asia. Table 7 presents data on the evolution o f the central government wage bil l from 1995-2001 in Sr i Lanka and three comparator countries.
39. On average, monetary allowances constituted roughly 40 percent of employees’ total pay in 2002. All employees were entitled to two interim cost-of-living allowances, which combined accounted for nearly two-thirds o f the total expenditure on allowances (excluding the armed forces). The remaining third i s difficult to account for in detail, as apart f rom the two cost-of-living allowances already mentioned, there is considerable variation in the allowances different employees receive. Indeed, the 2000
15
Salaries Commission identified as a significant problem the pay disparities arising from allowances.
Table 7. Wages and Salaries o f Consolidated Central Government 1995 1997 1999 200 1
S r i L a n k a GDP 667,772 890,272 1,108,845 1,397,453 Rs. mn. Current Revenue
Current Expenditure o/w Wages & Salaries % current exp. % current revenue % GDP
India Wages & Salaries Rs. billion % current exp.
% current revenue % GDP
Malaysia Wages & Salaries Ringgit mn. YO current exp.
% current revenue % GDP
Thailand Wages & Salaries Baht mn. % current exp.
% current revenue % GDP
136,161 195,880 34,909
17.8 25.6
5.2
170 9.7
11.6 1.4
12804 33.3 23.6
5.8
223168 51.6 28.6
5.3
164,779 228,732
44,676 19.5 27.1
5.0
266 11.5 14.4 1.7
14494 33.9 22.3
5.1
262316 49.4 30.1 5.5
195,895 267,611
58,532 21.9 29.9
5.3
322 10.6 13.8
1.7
289511 48.5 39.2
6.2
23 1,420 367,966 78,056
21.2 33.7
5.6
373 9.4
12.6 1.6
302269 38.3 33.7
5.9
Source: IMF, Government Finance Statistics Yearbook, 2002. Note. Excludes Armed Forces.
POLICY OPTIONS
40. Changes to the Administrative Structure. The “Report o f the Salaries Commission 2000” recommends limiting by statute the overall number o f central government ministries. Provincial Councils must comply with such a limit; the 13th amendment restricts the number o f ministries to five. However, a restriction o f this sort should not be necessary to reduce the number o f central government ministries to a more reasonable number. Moreover, the statute i s unlikely to succeed unless pol icy makers are convinced o f the fiscal dangers created by an expansive administrative apparatus. Rather than devote energy toward agreeing an arbitrary cap on the number o f ministries, efforts might be better devoted to studying which o f the current ministries ought to be slated for elimination.
41. Employment Reductions via Attrition. Given the enormous number o f public employees in S r i Lanka, personnel reductions through attrition alone may not be an adequate solution. In any case, the data show that over the last two years o f the current hiring freeze a significant number o f vacancies have been filled, and new posts have been created (Table 8).
16
Table 8. S r i Lanka: Growth in Employment, Population, Labor Force, and Real GDP, 1998-2002
percentage change 1998 2000 2002 1998-00 2000-02 1998-02
Central Govt Emdoyment 354,160 413,300 436,390 16.7 5.6 23.2 . - Population 17,935,000 18,467,000 18,9681480 3.0 2.7 5.8 Labour Force 7,722,811 8,103,320 8,410,623 4.9 3.8 8.9
Sources: Sri Lanka Department of Census & Statistics, “ Census o f Public and Semi-Government Sector Employment 1998” and “ Census of Public and Semi-Government Sector Employment 2002” (preliminary report); Sri Lanka MoF ‘‘ Budget Estimates 2002’’ (vol. 1-111); and World Bank Development Indicators.
GDP (constant 1995 us $) 15,067 16,658 16,909 10.6 1.5 12.2
42. Employment Reductions via a Voluntary Retirement Scheme. A carefully crafted, targeted voluntary retirement scheme might be combined with a hiring fi-eeze to generate more rapid reductions in surplus staff, particularly at mid and lower grades. The “Report o f the Salaries Commission 2000” sets an ambitious goal o f a 30 percent reduction in staff, focused on Categories C & D employees.
43. Creating a New Pay Scale. The 2000 Salaries Commission, in accordance with i t s mandate, has proposed a detailed revision o f S r i Lanka’s public pay scales. One goal o f the Commission i s to reduce the number o f pay scales. That would be a welcome change to strengthen the coherence, consistency, and transparency o f pay policy. However, the Commission’s proposals in this area are relatively timid. The Commission recommends eliminating 22 scales and creating another seven. If implemented, the reform would s t i l l leave government with more than 100 separate pay scales. Greater consolidation i s warranted.
44. Target pay increases to higher-level staff. The 2000 Salaries Commission proposed a more generous pay increase for manual laborers than for any other employee group. However, the Commission’s study o f private sector wages reveals that manual laborers in government receive 25 percent to 125 percent more than a similar person in a private company. Clerical workers, too, receive up to one-third more than their private sector equivalents. By offering a more generous percentage increase to the less skilled segment o f the public sector labor force, the effect o f the Salaries Commission proposal would be a further erosion o f the compression ratio, thereby weakening incentives for advancement in the public service.
45. The compression ratio was already a modest 9.1 under the salary scales fixed in 1992 and fe l l to 8.1 in 1997. I t would fal l further to 7.1 under the current proposals o f the Commission. Targeting increases to higher-level staff i s an obvious alternative approach to decompress the wage scale and thereby ease difficulties in recruiting staff with sk i l ls highly sought-after by the private sector (a problem identified by the Commission). Targeted increases also would also be fiscally more affordable.
46. Promoting Merit in Appointments. Patronage-style appointments have become commonplace in Sri Lanka. The Ceylon constitution o f 1948 established an independent Public Service Commission with authority over the appointment, promotion, transfer, and disciplinary control o f permanent employees. However, the authority o f the Public Service Commission was severely weakened in 1972 when the new constitution
17

transferred t h e power o f appointment to the Cabinet o f Ministers. An important remedy i s the recent ly approved 17th amendment to the constitution. In accordance with that amendment t h e nat ional Publ ic Service Commiss ion (PSC) i s granted the author i ty to appoint, promote, transfer and dismiss a l l pub l i c officers, with the exception o f department heads. However, the PSC must receive greater support from central government in order to reestablish i ts former authority.
18
PART 2. SECTOR EXPENDITURE REVIEWS
V. HEALTH
Sri Lanka has achieved exceptional improvements in health outcomes despite relatively low levels of spending in the sector. There is however a need to consolidate impressive gains and respond to emerging challenges, such as non-communicable diseases, associated with the rapidly agingpopulation. F'hile unit costs are low, there is evidence of inefficiency, such as an increasing share of resources going to curative rather than preventive care. Malnutrition is a major problem with over 30 percent of pregnant and lactating mothers suffering from anemia. There are also some inequities in the provision of health services and in health outcomes, with differences in nutritional outcomes particularly notable. Inequalities persist in terms offinancial inputs (though much of this is accounted for by differences in private expenditures)-notably in the Western Province.
SECTOR PERFORMANCE
47. Sri Lanka has achieved exceptional improvements in i t s health status despite relatively low level o f spending in the sector. Infant and maternal mortality rates o f 16.3 per 1,000 live births and 2.3 per 10,000 live births are already close to those enjoyed in OECD countries. As a result significant additional improvements in these indicators, as proposed by the Mil lennium Development Goals, are not achievable within the Sri Lanka context.
48. Sri Lanka's success reflects factors within and outside the health sector-a highly educated population making full and informed use o f available health services and adopting reasonably healthy lifestyles. Geography, climate and a range o f socio-cultural factors also play a major role. Nonetheless, the health sector can also take significant credit for these trends by ensuring that resources have generally been utilized in an equitable and efficient manner. There i s almost universal coverage o f essential services. Immunization rates exceed 95 percent even for disadvantaged groups whilst the share o f deliveries which are assisted by trained health personnel-estimated at 93.9 percent in 2000-is exceptionally high. Moreover, such coverage has been provided at extremely l o w cost. Studies show that unit costs are l o w in comparison to other countries in the region-largely a reflection o f the high (in some cases, excessive) levels o f utilization- and have been declining over time. Public services have generally been allocated in a pro poor manner. Though a large share o f resources i s allocated to secondary and tertiary care poorer groups appear to have significant access to services provided by these institutions. As a result, the hospital sector appears to provide an effective, if basic, safety net for those facing the potentially catastrophic effects associated with hospitalization. Benefit incidence studies demonstrate that the poor utilize a far greater share o f publ ic subsidies than in India, Nepal and Bangladesh.
19
49. However, there i s an unfinished agenda. Despite low unit costs there i s still evidence of inefficiency. Utilization o f in-patient services i s much higher even than OECD countries indicating that much o f this care could perhaps be delivered more cost effectively at lower levels in the system. Maternity homes, on the other hand, have very low levels o f utilization-partly a reflection o f the declining number o f births but also due to the fact that such facilities are typically bypassed. In practice, the lack o f administrative or financial incentives to encourage more appropriate referral system has encouraged such behavior.
50. Nutrition i s a major problem with over 30 percent of pregnant and lactating mothers suffering from anemia. The poor underlyng health o f mothers has also contributed to persistently high level o f low birth weighed babies.. Vulnerable groups including the economically disadvantaged living in the estates sector and those living in conflict-affected areas are particularly affected. Malnutrition i s on the increase in these areas and the incidence o f malaria i s increasing with over 50 percent o f reported cases in conflict-affected areas.
51. There exist some inequities in the provision of health services and health outcomes. Sr i Lanka’s achievements in providing universal and free education and health care to the general population are reflected in good social indicators for the poor and the poor fare considerably better in some key non-income dimensions o f poverty than in most other developing countries, a few crucial pockets o f inequity persist. In the health sector, this i s illustrated by lower access for some health services and weaker health indicators for poor and vulnerable groups, especially those living in estates, or remote or conflict-affected areas.
Figure 6. Per Capita Expenditure on Health in Sri Lanka by Province (1997)
2500
2000
1500
1000
500
0
2
52. Inequalities persist in terms of financial inputs (though much of this i s accounted for by differences in private expenditures)-notably in Western Province. As indicated in Figure 6, there are significant differences in per capita public spending on health by province although these are partly offset by expenditures through central programs. However, there has been a trend toward greater equity in public expenditure on health by province over the 1990s. Yet, there are some substantial differences in terms o f infrastructure and human resources across the regions. The number o f hospital beds
20
varies from 4.8 per thousand population in Colombo to 2.0 or less in Jaffna, Ki l inochi and Vavuniya whilst the number o f medical officers per 100,000 population varies from around 99 in Colombo to less than 12 in Jaffna, Ki l inochi and Mannar. Such differences are mainly due to the presence o f teaching, provincial and specialized hospitals in the major urban centers.
53. Performance against some of the key health service indicators i s generally good with little, if any, inequality. The proportion o f children between 12 and 23 months immunized for DPT3/4-a good indicator o f health system performance-is around 98 percent (97.2 percent in estates). The proportion o f children immunized against measles-an indicator closely linked to chi ld mortality rates-averaged 94 percent according to D H S 2000 (86.1 percent in the estates sector though more recent date suggests this gap has reduced significantly since). Overall utilization o f public services does differ widely by district. The number o f in patient admissions per head in Colombo, for instance, is double that in Nuwara Eliya. Per capita out patient contacts in Anuradapura are almost double those in Matara.
Figure 7. Sr i Lanka: Percentage of children aged 3 to 59 months who are stunted by place o f residence
60
50
40
30
20
I O
0
El 1993 2000
Colombo Metro Other Urban Rural Estate
Figure 8. Sr i Lanka: Health Outcomes by Level o f Mothers Schooling 35
0 Neonatal MR Post NeoNatal MR IM R USMR
21
54. As noted above, significant inequity in outcomes persist. Differences in nutritional outcomes are particularly notable. A child l iv ing in the estates sector i s over four times more likely to be stunted than one living in Colombo and almost three times more l ikely than one living in rural areas (although the differential i s narrowing) (see Figure 7). Outcomes are closely linked to socio-economic status as children with mothers with higher levels o f educational attainment having far better outcomes (see Figure 8).
HEALTH EXPENDITURE
55. Sr i Lanka has achieved extraordinarily good health outcomes with relative modest level of spending on health. Total expenditure on health was SLR 39,177 mi l l ion in 1999 o f which 13 percent was capital investment. This amounts to 3.5 percent of GDP, which i s somewhat lower than other regional countries (Bangladesh 3.8 percent, India 5.0 percent, China 4.5 percent, and Thailand 4.0 percent). Government funding for health mainly comes from central funds (47 percent) with provincial taxes contributing 4 percent. Private expenditure i s predominantly out-of-pocket expenditure (43 percent), with a further 4 percent coming from employers and 3 percent from private insurance. Health expenditure has been increasing, albeit fi-om a low base. Since 1990, total expenditure has been between 3-3.5 percent o f GDP o f which the Government share has fluctuated between 1.4 percent and 1.7 percent. The level o f external development assistance to this sector i s also l o w (currently between 4-6 percent o f the total health expenditure).
56. B y regional and international standards the health system i s extremely equitable and displays high levels of technical efficiency (although less so for allocative efficiency with the increasing share of resources going to curative care). Nonetheless, there i s room for improvement in a number o f areas. There are s t i l l sections of the population who lack access to basic health services. In terms o f technical efficiency whilst unit costs are low, in part because hospitals are overcrowded, many services could still be provided more cost effectively at lower levels o f the system. Perhaps more importantly, the large and rising share o f public spending going to the hospital sector in response to strong public demand for the provision o f such services, threatens future progress in other important areas. Overall spending on public health and preventive services, for example, declined by around 15 percent in real terms during the 1990s. Sri Lanka also faces new challenges particularly those associated with i ts rapidly aging population which wil l require a reorientation o f support.
KEY CHALLENGES
57. Sri Lanka needs to consolidate impressive gains, address the remaining shortcomings, and respond to emerging threat such as non-communicable diseases associated with the rapidly aging population. The latter include a r ising incidence o f cancers, health disease, diabetes, accidents and suicides. S r i Lanka i s unusual in having gone into the demographic transition at a l o w level o f per capita income. This makes an emphasis on the prevention of N C D s especially pressing, as the financial means to provide effective treatment for such conditions are unlikely to be available. The system
22
also has to face new threats such as HIV/AIDS and the re-emergence o f dengue and malaria.
58. Support needs to be targeted towards meeting the needs o f the most vulnerable, the elderly, disable, adolescents, estates workers and those affected b y conflict. Steps wil l need to be taken to make more rational use o f the existing health infrastructure-addressing issues o f overcrowding at higher level facilities and improving utilization at lower levels.
59. In order to improve efficiency it wi l l be essential to develop more flexible management approaches to promote greater delegation o f authority, the development o f more effective financial and information systems, better planning and management o f human resources. Government wi l l need to take a lead in developing and strengthening partnerships and coordination between key stakeholders in the sector including the private sector, c iv i l society and traditional systems o f medicine
60. Financing mechanisms need to be strengthened. This wil l require the strengthening o f incentives for better performance, ensuring resources continue to be allocated in a pro poor manner and the development o f further mechanisms to promote this, ensuring that adequate provision i s made for new initiatives, reviewing strategic health financing options and strengthening the information base.
61. Continued progress wi l l depend heavily on the performance of the provincial councils who are responsible for the delivery o f services. There i s no mechanism, at present, for ensuring that councils devote adequate resources to meet the health needs o f their populations. Currently, they are not even required to report formally on their spending. Provincial councils face major human resource and financial capacity constraints and remain heavily dependant upon central Government for their funding whilst there are general concerns about the overall methods o f allocating resources to the provinces.
Future resource requirements
62. Future health care costs over the coming decade wi l l depend on patient behavior, specifically the propensity o f the population to use health services when ill. Recent macro costing studies suggest that traditional increases o f 1-3 percent per annum for outpatient care imply an increase requirement o f 0.2 percent o f GDP. The changing demographic structure-and additional costs for meeting the needs o f an increasingly elderly population-is anticipated to require a similar amount o f additional expenditure. Improvements in productivity o f up to 2 percent per annum based o n historical trends would be expected to offset some o f this increase. A key area o f uncertainty i s the rate o f price inflation in the private sector which has major implications both for overall health expenditure as well influencing whether patients seek to access care in public or private sectors. Just to stand and maintain existing levels o f provision the study estimates that the share o f public spending on health needs to increase to around 1.6-1.7 percent o f GDP. This relates to the base case scenario-the figures could be much higher under less optimistic assumptions.
23
63. Achieving significant improvements in health services would require additional expenditure. Preliminary estimates suggest that significant improvements in the quality o f care could require up to 0.5 percent o f GDP whilst new programs including the provision o f anti retrovirals to HIV/AIDS patients, integration o f the estate sector, development o f the infrastructure in the North and North East could add the same again. The establishment o f a publicly funded family practitioner program could add up to 0.7 percent o f GDP.
POLICY RECOMMENDATIONS
64.
e
e
e
e
e
e
65.
The k e y reform areas that need to be tackled by the sector are:
Improve curative health care services (through hospitals and other providers) at the Provincial and district levels in order to make these services more accessible in poor, rural areas; expansion o f health care services to meet the needs o f specific groups such as the elderly, victims o f war and conflict and promoting specific areas o f health care such as occupational health problems, mental health care and estate health services; development o f health promotional programs, with special emphasis on outreach through the schools; improvement o f disease prevention amongst the poor can reduce the health financing burden and contribute to more rewarding and productive lifestyles; reform o f health care fimding, with the aim o f concentrating public support on the poor, including a better effort to mobilize and manage resources in both the public and private sectors; and coordinating financing mechanisms such as social insurance; rationalization o f human resources and health infrastructure; development o f a coherent pol icy framework for redefining the roles o f the public and private sectors in health care provision.
In terms o f resource allocation priorities the changing nature o f the health sector in S r i Lanka suggests a need for the following:
e a modest increase in overall spending on health to maintain the current levels o f provision and significant increases if Government is to take serious steps to improve quality and expand access to services; a general increase in the share o f public expenditure going to preventive care; greater focus on specific program areas notably nutrition, NCDs, maternal and chi ld health, mental health and less o n program areas where the threat i s declining (whilst continuing to provide sufficient support to consolidate previous gains and respond to outbreaks as they occur); greater focus on effective approaches within program areas, e.g. behavioral changes programs aimed at alcohol and tobacco; the development o f mechanisms to ensure that resources are increasingly focused on those district and provinces in greatest need;
e
e
e
0
24
0 increases in the allocation o f resources to support measures to increase hospital efficiency and to make more effective use o f lower level facilities.
66. Over the last decade there has been a major reorientation o f resources away f rom promotive and preventive services towards curative care. This shift has a large constituency-it i s popular with the public, politicians and medical professionals. A shift in the allocation o f resources towards preventive care wou ld signify a significant break with recent trends. Two other areas requiring major attention are:
0
0
the relationship between the centre and provinces and public sector reform efforts to improve the efficiency o f the public sector.
67. clari ty and action if sustained health development i s to be achieved.
Neither o f these can be taken forward at the sector level but bo th need greater
25
VI. EDUCATION
Universal access to primary education has been largely attained through the establishment of an island-wide network of schools offering tuition free public education. However, raising the quality of education constitutes the next major policy challenge. Education continues to enjoy a prominent place in the government budget, accounting for about 8 percent of public expenditure. Public expenditure in education is currently chiefly absorbed by salaries and wages and administrative costs in the recurrent budget and building construction in the capital budget. Obtaining higher quality educational outcomes w i l l necessitate a greater share of resources being shifted towards capital expenditures.
EDUCATION ACHIEVEMENTS AND CHALLENGES
68. Education continues to enjoy a prominent place in the government budget, accounting for about 8 percent of public expenditure. S r i Lanka i s well-known in the development pol icy literature as a country that has attained high levels o f human development relative to i t s per capita income. Historically, the Government o f S r i Lanka (GOSL) awarded high priority to investment in education, devoting the largest share o f the government budget to education. In recent years, as mil i tary expenditures increased as a result o f the conflict in the North-Eastern region and crowded out resources for development, the share o f public spending on human capital declined.
69. Educational attainment i s strongly associated with poverty in Sri Lanka. Poverty rates decline steeply as education levels increase (see Figure 9). Poverty incidence was 40 percent among households whose head was uneducated and 38 percent among households with a primary educated head in 1995/96. Among households with junior secondary educated heads, poverty incidence was 3 1 percent. Poverty rates declined continually across school levels to just 1 percent among households with heads who were university graduates or higher.
70. GOSL’s education pol icy framework emphasizes three key elements: (a) providing universal access to public primary and secondary schooling, and controlled access to public university education; (b) enhancing the quality o f education, especially cognitive achievement, and other dimensions o f quality such as good team work, a disciplined and productive work ethic, a positive, problem solving approach, and attitudes favorable to a multi-ethnic, multi-religious society; and (c) increasing the economic and social relevance o f the education system. In support o f this overarching pol icy framework, GOSL under the leadership o f the National Education Commission (NEC) has developed wide-ranging pol icy initiatives and measures to develop the education system [see NEC (1997), (2003)l. GOSL has invited the Wor ld Bank (WB) to support the development o f a medium term budgetary framework for the education sector to facilitate investment planning and enhance the efficiency and equity o f public spending.
26
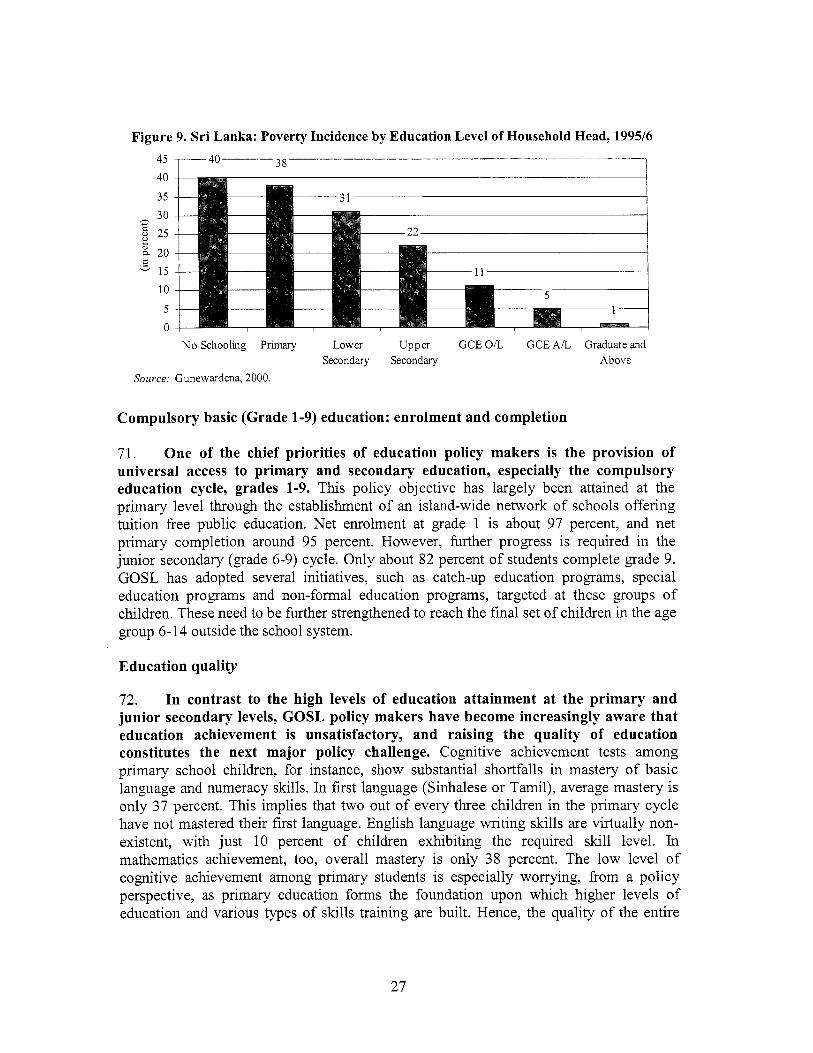
Figure 9. S r i Lanka: Poverty Incidence by Education Level o f Household Head, 1995/6
7 - 45 ~----40 38 40
35 30
6 25
e 20 c. 15
0
F
10
5 0
No Schooling Primary Lower Upper GCE O/L GCE AIL Graduate and Secondary Secondary Above
Source: Gunewardena, 2000.
Compulsory basic (Grade 1-9) education: enrolment and completion
71. One o f the chief priorities o f education policy makers i s the provision o f universal access to primary and secondary education, especially the compulsory education cycle, grades 1-9. This pol icy objective has largely been attained at the primary level through the establishment o f an island-wide network o f schools offering tuition free public education. N e t enrolment at grade 1 i s about 97 percent, and net primary completion around 95 percent. However, further progress i s required in the junior secondary (grade 6-9) cycle. Only about 82 percent o f students complete grade 9. GOSL has adopted several initiatives, such as catch-up education programs, special education programs and non-formal education programs, targeted at these groups o f children. These need to be further strengthened to reach the final set o f children in the age group 6-14 outside the school system.
Education quality
72. In contrast to the high levels o f education attainment at the primary and junior secondary levels, GOSL policy makers have become increasingly aware that education achievement i s unsatisfactory, and raising the quality o f education constitutes the next major policy challenge. Cognitive achievement tests among primary school children, for instance, show substantial shortfalls in mastery o f basic language and numeracy skills. In f i rst language (Sinhalese or Tamil), average mastery i s only 37 percent. This implies that two out o f every three children in the primary cycle have not mastered their f i rst language. English language writing sk i l ls are virtually non- existent, with just 10 percent o f children exhibiting the required skill level. In mathematics achievement, too, overall mastery i s only 38 percent. The l o w level o f cognitive achievement among primary students i s especially worrying, from a pol icy perspective, as primary education forms the foundation upon which higher levels o f education and various types o f skills training are built. Hence, the quality o f the entire
27
education system i s severely constrained by the low achievement levels in primary grades.
73. The unsatisfactory state of education quality i s also evident at the level of senior secondary education. The proportion o f students passing the GCE O/L i s low, only 37 percent, implying that about two out o f every three students taking the examination fails. Further, this low pass rate has been fairly constant over the period 1998-2002. A substantial majority o f students appear to struggle with subjects such as mathematics, English language, science and social studies. At the GCE A/L examination, too, pass rates have been around the 50-55 percent level since 1998 over the 1998-2002 period. This implies that only about one out o f every two students actually passes the GCE A/L examination. These are low pass rates at the GCE O/L and GCE A/L examinations, especially since successful completion o f these examinations i s necessary for a variety of sk i l ls training courses or access to tertiary education programs, or for entrance into a range o f labor market occupations.
74. In addition to the problem o f poor education quality as measured by l o w learning achievement scores or high examination failure rates, policy makers and employers have argued that other, non-cognitive dimensions of education quality are also unsatisfactory and need urgent improvement [NEC (1 997), (2003)l. Education pol icy makers have stressed the importance o f producing characteristics such as a disciplined work ethic, good team work, creativity and initiative, a problem solving approach and sound civic consciousness among school children and university students.
Educated youth unemployment
75. A major problem facing GOSL policy makers i s that of unemployed educated individuals, especially women (see Figure 10). Unemployment rates tend to be highest among university graduates and GCE O/L and GCE A/L completers. The high unemployment rates o f educated labor force participants are mainly caused by lengthy j ob search durations by new entrants into the labor market. The lengthy periods o f j ob search has led to considerable social unrest in the past, particularly among university graduates. The main cause o f high unemployment rates and long j o b search durations among educated young people has been the slow growth rate o f the economy, which has prevented the demand for educated labor rising sufficiently fast to absorb the rising supply o f educated young people entering the labor market. Secondary causes o f educated youth unemployment have included the production o f graduates with l o w generic skills in demand within the labor market, such as English language fluency and IT skills, and the moderate quality o f some university degree programs.
28
Figure 10. Sr i Lanka: Unemployment Rates and Job Search Durations by Education Level, Men and Women, 2000
Average unemployment rate (in percent) 30 25 20 15 10 5 0
Primary Lower Upper GCEOL GCEAIL Graduate Postgraduates Al l secondary Secondary
Average job search duration (in months)
25 20 15 10 5 0
Primary Lower Upper GCE OIL GCE AIL Graduate Postgraduates All secondary Secondary
Source: Department o f Census and Statistics, Labor Force Survey 2000.
PUBLIC SPENDING IN EDUCATION
Comparatively low public expenditure on education by international levels 76. Public education expenditure in Sri Lanka currently amounts to about SLR40 bi l l ion (US$415 million) annually. In recent years, the education budget has accounted for approximately 3 percent o f GDP and 7-8 percent o f government spending. This level o f spending i s somewhat lower than South Asian countries and low income nations which devote about 3.2 percent o f national income and 11 percent o f government expenditures to education. The group o f lower middle income countries, to which S r i Lanka i s expected to belong in the near future, spends about 4 percent o f GDP on public education. Countries such as South Korea, Malaysia, Thailand and Singapore, which act as pol icy models for Sri Lankan pol icy makers, devote considerably higher resources to education (Table 9).
29
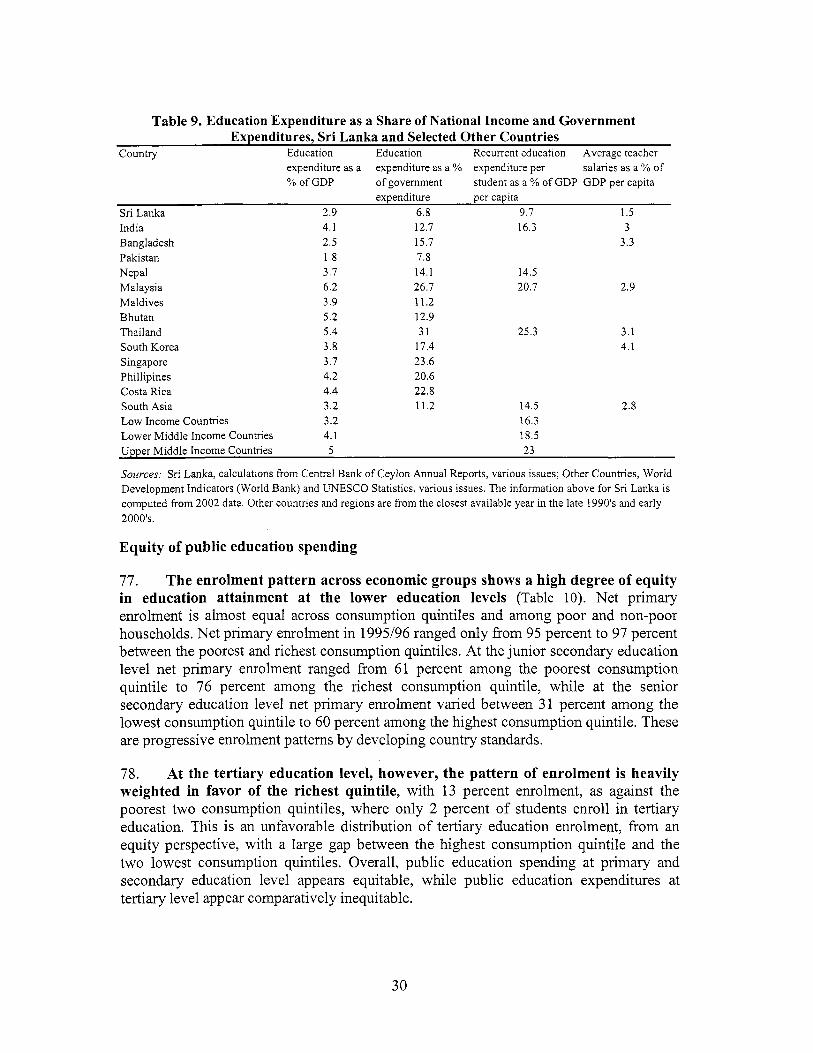
Table 9. Education Expenditure as a Share of National Income and Government Expenditures, Sri Lanka and Selected Other Countries
Country Education Education Recurrent education Average teacher
student as a % o f GDP GDP per capita expenditure as a expenditure as a % expenditure per salaries as a % o f % o f GDP o f government
expenditure per capita Sri Lanka 2.9 6.8 9.7 1.5 India 4.1 12.7 16.3 3 Bangladesh 2.5 15.7 3.3 Pakistan 1.8 7.8 Nepal 3.7 14.1 14.5 Malaysia 6.2 26.7 20.7 2.9 Maldives 3.9 11.2 Bhutan 5.2 12.9 Thailand 5.4 31 25.3 3.1 South Korea 3.8 17.4 4.1 Singapore 3.7 23.6 Phillipines 4.2 20.6 Costa Rica 4.4 22.8 South Asia 3.2 11.2 14.5 2.8 L o w Income Countries 3.2 16.3 Lower Middle Income Countries 4.1 18.5 Upper Middle Income Countries 5 23
Sources; Sri Lanka, calculations from Central Bank o f Ceylon Annual Reports, various issues; Other Countries, World Development Indicators (World Bank) and UNESCO Statistics, various issues. The information above for Sri Lanka i s computed from 2002 data. Other countries and regions are from the closest available year in the late 1990's and early 2000's.
Equity of public education spending
77. The enrolment pattern across economic groups shows a high degree o f equity in education attainment at the lower education levels (Table 10). N e t primary enrolment i s almost equal across consumption quintiles and among poor and non-poor households. Net primary enrolment in 1995196 ranged only from 95 percent to 97 percent between the poorest and richest consumption quintiles. At the junior secondary education level net primary enrolment ranged from 61 percent among the poorest consumption quintile to 76 percent among the richest consumption quintile, while at the senior secondary education level net primary enrolment varied between 31 percent among the lowest consumption quintile to 60 percent among the highest consumption quintile. These are progressive enrolment patterns by developing country standards.
78. At the tertiary education level, however, the pattern of enrolment i s heavily weighted in favor o f the richest quintile, with 13 percent enrolment, as against the poorest two consumption quintiles, where only 2 percent o f students enroll in tertiary education. This i s an unfavorable distribution o f tertiary education enrolment, from an equity perspective, with a large gap between the highest consumption quintile and the two lowest consumption quintiles. Overall, public education spending at primary and secondary education level appears equitable, while public education expenditures at tertiary level appear comparatively inequitable.
30
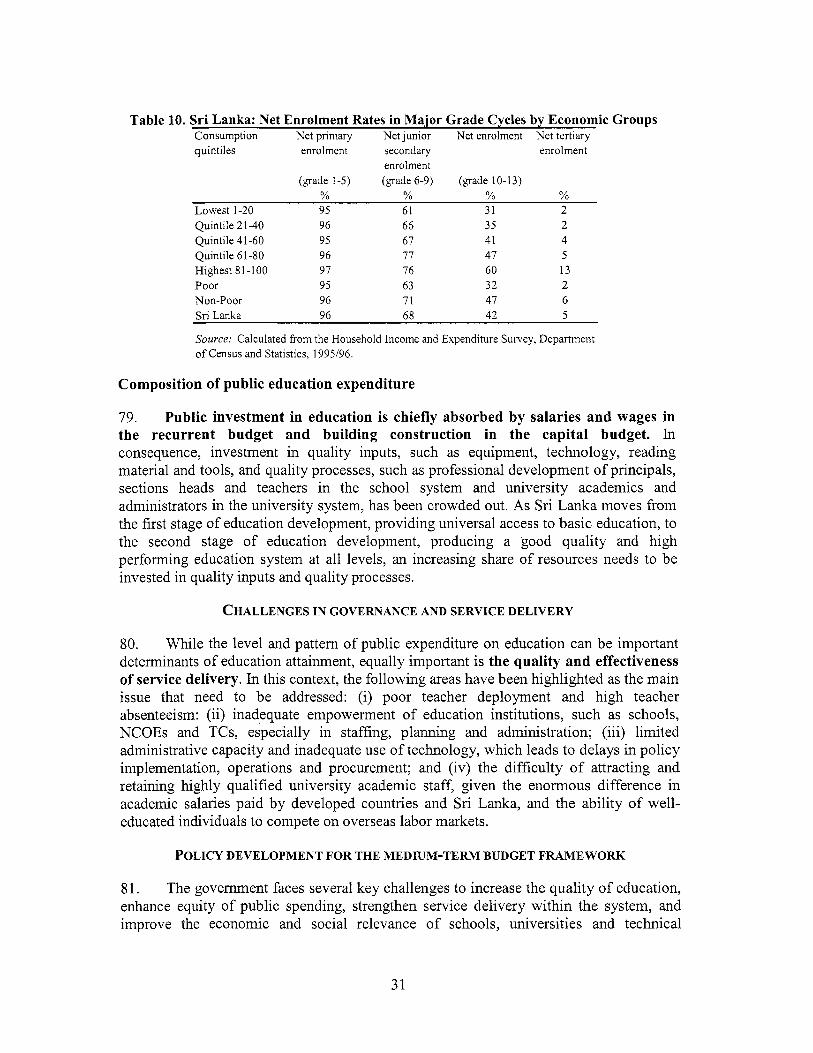
Table 10. S r i Lanka: Net Enrolment Rates in M a j o r Grade Cycles by Economic Groups Consumption Net primary N e t junior Net enrolment Net tertiary quintiles enrolment secondary enrolment
enrolment (grade 1-5) (grade 6-9) (grade 10-13)
% % % % Lowest 1-20 95 61 31 2 Quintile 21-40 96 66 35 2 Quintile 41-60 95 67 41 4 Quintile 61-80 96 77 47 5 Highest 81-100 97 76 60 13 Poor 95 63 32 2 Non-Poor 96 71 47 6 Sri Lanka 96 68 42 5
Source: Calculated from the Household Income and Expenditure Survey, Department o f Census and Statistics, 1995196.
Composition of public education expenditure
79. Public investment in education i s chiefly absorbed by salaries and wages in the recurrent budget and building construction in the capital budget. In consequence, investment in quality inputs, such as equipment, technology, reading material and tools, and quality processes, such as professional development o f principals, sections heads and teachers in the school system and university academics and administrators in the university system, has been crowded out. As S r i Lanka moves from the first stage of education development, providing universal access to basic education, to the second stage o f education development, producing a good quality and high performing education system at al l levels, an increasing share o f resources needs to be invested in quality inputs and quality processes.
CHALLENGES IN GOVERNANCE AND SERVICE DELIVERY
80. While the level and pattern o f public expenditure on education can be important determinants of education attainment, equally important i s the quality and effectiveness of service delivery. In this context, the following areas have been highlighted as the main issue that need to be addressed: (i) poor teacher deployment and high teacher absenteeism: (ii) inadequate empowerment o f education institutions, such as schools, NCOEs and TCs, especially in staffing, planning and administration; (iii) limited administrative capacity and inadequate use o f technology, which leads to delays in pol icy implementation, operations and procurement; and (iv) the dif f iculty o f attracting and retaining highly qualified university academic staff, given the enormous difference in academic salaries paid by developed countries and Sri Lanka, and the ability o f well- educated individuals to compete on overseas labor markets.
POLICY DEVELOPMENT FOR THE MEDIUM-TERM BUDGET FRAMEWORK
8 1. The government faces several key challenges to increase the quality o f education, enhance equity o f public spending, strengthen service delivery within the system, and improve the economic and social relevance o f schools, universities and technical
31
education institutions. These challenges exist at a time when public spending in education i s relatively low by international standards and the state experiences a high fiscal deficit which compels i t to adopt a conservative fiscal policy. In this context, the government can consider four sets o f measures to increase education spending and enhance the efficiency and equity o f public spending.
Increase private sector investment and participation in education
82. There i s a need to promote private sector participation in education, especially at tertiary level. Relaxing the legal barriers to private sector participation in education could produce several benefits. First, i t would increase the overall volume o f resources invested in the education sector. Second, since the students attending private schools and education institutions are likely to be drawn from upper income families, it would release more public resources, on a per student basis, for students from poorer families. Third, i t would stimulate economic activity in a sector where investment has been artificially restricted and contribute to higher growth. Fourth, i t would provide an alternative mode o f service delivery, with considerable power and responsibility at the level o f the individual education institutions, such as private schools and education institutes. These private education organizations would be compelled to offer high quality services to remain viable in an economic context where they are in competition with free public education institutions.
Protect and gradually increase public spending in the school system
83. Government pol icy to improve education quality envisages several important education pol icy measures (see NEC (2003)). These pol icy initiatives require considerable investment o f resources in the education system. Given the l ow level and decreasing trend o f real public education spending, and the major challenges Sri Lanka faces in improving the quality and economic and social relevance o f the education system, it i s important that the government preserve the current level of real expenditure in the short-term and increase public investment in education gradually over the medium-term. The real value o f the education budget needs to be preserved in 2005, and from 2006 onwards gradually increased, with the real value o f the increase in resources targeted at the school system.
Enhance the equity of public education spending
84. The pattern of student enrolment over major grade cycles and the unit costs o f education by grade level, show that spending in primary and secondary education is relatively progressive and benefit students from low and middle income households, while spending in tertiary education tends to benefit students f rom upper-income households. In consequence, there i s a strong case for allocating the major share of any increase in public resources for the education sector to primary and secondary schooling, while carefully controlling the expansion o f the public university system and allowing enrolment expansion in tertiary education take place main ly in the private sector. Opportunities for poorer students to access tertiary education could be expanded
32
through schemes such as student vouchers and student loans, rather than through direct public sector provision.
Increase cost-effectiveness of the education system
85. The tight resource constraint faced by the government makes it extremely important that the education system generates internal savings to reduce costs. In this context, three important pol icy measures are available.
i. School rationalization. The cost-effectiveness o f operating the school system can be enhanced by consolidating and amalgamating small, uneconomical schools, where this can be accomplished without reducing access to schooling and damaging enrolment and attendance. The public school network is such that a sizable proportion o f small schools are located close to other, larger government schools. MHRECA and the provincial councils designed and implemented a successful school rationalization program, during 1998-2002. This program, which was temporarily suspended due to intense political pressure, needs to be re-opened, but with careful safeguards to protect access for poor and vulnerable groups.
ii. Raise the student-teacher ratio in schools and tertiary education institutions. Currently, the student teacher ratio in schools, at 21:1, i s low. Countries with outstanding education systems and far higher income levels, such as South Korea, Singapore and Hong Kong, have higher student-teacher ratios and more cost-effective systems. The current teacher employment and deployment pol icy i s based on a target student-teacher ratio o f 22 : l for secondary grades and 26: l for primary grades. The government could consider increasing the target student-teacher ratio to 23: 1 for secondary grades and 27:l for primary grades. In addition, the student-teacher ratio in the public university system tends to be very low, at 14: l . The government could consider increasing this student-teacher ratio to the internal academic norm o f 18: 1, so that cost savings can be generated within the system.
iii. Rationalize administrative staffing. The roles, functions and responsibilities o f staff within the complex, multi-tiered education administrative system i s unclear. A careful analysis o f work loads, and de jure and de facto roles, functions and responsibilities o f staff in the various education ministries, provincial councils, zonal education offices, division education offices and tertiary education institutions i s likely to identify both duplication o f roles and functions, and gaps and shortages o f staff. Overall, there may be an excess o f staff, which a carefully designed voluntary retirement scheme could decrease, reducing pressure on the budget and releasing more resources for investment.
33
Re-investing resources saved within the education system back in the sector
86. In order to increase resources for quality enhancing education pol icy initiatives through the implementation o f cost saving measures within the education system, it i s vitally important that the Ministry o f Finance permits funds saved to b e channeled back into the education system for investment. If the funds saved through cost- reducing measures are not re-invested in the education system the objective o f enhancing education quality would be defeated. Further, the education system would lose the incentive to implement difficult measures such as school rationalization and higher student-teacher ratios.
Intra-budget shifts in resource allocation in favor of quality inputs and quality processes
87. Over time, the balance o f capital and recur ren t spending within the education budget needs to shift to allocate a greater share o f resources to capital expenditure. Within the capital budget, a higher proportion o f resources needs to be invested in quality inputs such as IT centers, science laboratories, libraries, activity rooms, multi-purpose rooms, equipment, technology and tools. The construction and expansion o f buildings, which absorbs the highest share o f the capital budget, needs to be rationalized, prioritizing the urban school system which i s experiencing rising demand. Construction work within the university system, beyond the current cycle o f buildings in progress, should be halted until a careful needs assessment has been completed. Within the recurrent budget, too, resources need to be reallocated from salaries and administrative expenses to quality processes, such as teacher education and training, management and academic training o f school principals, and the purchase o f teaching material and learning resources.
INCREASING THE QUALITY OF SERVICE DELIVERY
Decentralizing education management and establishing school boards
88. Measures to improve the quality o f service delivery within the education sector are extremely important. In this context, the government has identified a key policy proposal to improve service delivery within the school system. This i s the establishment of school boards and decentralization o f education management to schools. The objective of this pol icy initiative i s to empower principals, section heads and teachers, enable schools to forge l i n k s with local communities to improve resource mobilization and public accountability, increase the efficiency o f decision making by decreasing administrative layers, and improve service delivery. A sound evaluation o f this pi lot program would be extremely h e l p h l for future pol icy making o n the structure o f school governance.
89. The government should also consider applying the principle o f education decentralization to other education institutions, such as National Colleges o f Education (NCOE’s) and Teacher Centers (TC’s). Currently, the NCOE’s have l i t t le managerial responsibility and autonomy. Curriculum design, assessment and certification
34
of teacher education courses offered by NCOE’s are undertaken by the National Institute of Education (NIE). Recruitment o f academic staff i s to a centralized teacher educators service, and NCOE’s rarely have a voice in the choice o f academic staff allocated to them. TC’s operate in an inefficient administrative structure. The NIE designs the curricula o f continuing teacher education programs offered by TC’s. The NCOE’s act as academic advisors to TC’s. For administrative purposes, including finances, the TC’s come under the zonal education offices. This complex administrative and academic structure has badly hampered the development o f TC’s. Devolving a greater degree o f managerial autonomy and responsibility to NCOE’s and TC’s could increase the operational efficiency o f the institutions and enhance the quality o f service delivery,
Monitoring and evaluation
90. The development o f a public expenditure tracking system would help identify the quantity o f resources flowing to and within service delivery points, such as schools, NCOE’s, TC’s, universities, vocational training and technical education institutions, and the NIE, and the transactions cost o f the system. Such a public expenditure tracking mechanism would be an extremely useful management tool to increase the efficiency and equity o f resource flows and the quality o f service delivery.
35
VII. SOCIAL WELFARE
A review of expenditures of the Ministry of Samurdhi and Social Welfare reveals a high concentration of spending on direct welfare related beneJits for both Ministries. Of the two, the Samurdhi Ministry is responsible for the larger share of direct welfare payments. Yet, the poverty impact of the Samurdhi consumption transfer is weak: the scheme misses 37-47 percent the two lowest income quintiles while over 40 percent of transfers are made to the wealthiest 60 percent. Most of the Ministry of Social Welfare spending goes towards disabled soldiers and families of soldiers killed in action. While this is a needy segment of society, the Ministry of Social Welfare needs to carve out a role for itself as a primary agency for the design and delivery of social welfare to al l the vulnerable groups in the country. A number of areas require enhanced social protection schemes. One such area is the provision of social protection for the elderly.
OVERVIE$
91. Social welfare spending in S r i Lanka comprises o f a multitude o f overlapping programs administered by a number o f Ministr ies. Total welfare expenditure amounted to an estimated 3.2 percent of GDP and 12.2 percent of total government expenditure in 2003-higher than the overall education budget. Welfare programs include Samurdhi transfer payments, pensions to retired government personnel, expenditures on school uniforms and textbooks, payments to disabled soldiers and dry rations to rehgees. The main agencies directly involved with program delivery at the central level are the Ministries o f Samurdhi, Social Welfare, Education and Health, and Triple R (Relief, Rehabilitation & Resettlement). The Provincial Ministries are also involved in the implementation o f social welfare programs, notably the disbursement o f the “Poor R e l i e f ’, which i s financed by the decentralized budgets.
92. The Samurdhi transfers program, run by the Ministry of Samurdhi, i s the most significant of welfare programs. Samurdhi constitutes the second highest budget item in welfare spending (after pension payments to retired public servants). At i ts peak in 2002, expenditures o f the Ministry o f Samurdh i -o f which the transfer payments comprise a significant share-consumed close to 1 percent o f GDP and 4 percent o f the government budget; the 2003 estimates are 0.75 percent o f GDP and about 3 percent o f total government spending.
POLICY FRAMEWORK OF THE MINISTRIES AND RELATED ISSUES
93. Broadly defined, social welfare i s the provision o f government assistance to people in need. The categories o f people in need are defined as the vulnerable sections o f the elderly, disabled, children and mothers, and the poor. Strategies to support these segments o f society typically take the form o f safety nets and income support programs. L
The analysis here i s confined to the two ma in agents at the central government level delivering welfare programs, the Ministry o f Samurdhi and the Ministry o f Social Welfare, as they have the most expl ici t mandate to serve the neediest and the most vulnerable sections o f society and are the most significant in terms o f budget allocation.
36
If this understanding is translated into the policy frameworks o f the two Ministries that are assessed in this study, the vision and mandate o f the Ministry o f Social Welfare comes closest to that o f a welfare program. I t explicitly aims to target the disadvantaged sections o f society and make them partners in the national development process. Samurdhi, on the other hand, presents itself as a poverty alleviation program, which pledges to improve the social and economic conditions o f disadvantaged sections o f society.
94. As the expenditure analysis that follows reveals, the Ministry of Social Welfare dedicates the bulk of its spending on a disadvantaged section of society-disabled soldiers and families of soldiers killed in action. I t could be argued that care for this section o f society should be the priority and responsibility o f the defense institutions. They are different from war victims, which i s rightfully the target group o f the welfare agencies. This dilemma i s a l l the more important to be addressed since this group receive a predominant share o f the benefits, with l i t t le left for al l other disadvantaged groups- vulnerable children, or those affected by natural disasters, disability, or o ld age- targeting whom i s actually the stated objective o f the Ministry. Thus there appears to be a mismatch between the profile o f expenditures by the ministry and its stated objective.
95. Conversely, the Samurdhi program, which describes i tself as a development program, i s in terms o f i t s expenditure profile primarily a welfare program, providing income support to poor families (as the expenditure review below wil l show). The substantial transfer component o f the program cannot be reconciled with the stated aim o f the Samurdhi program to “empower the rural poor” to mobilize their potentials. Thus there i s a need to re-define the objectives o f the program to better match the composition o f i t s expenditures. This would also help rationalize the objectives and target group o f the Samurdhi, in the context o f the broader Welfare system that includes a multitude o f smaller programs, including those administered by the Ministry o f Social Welfare. Effectiveness o f spending i s also an issue, due to the fact that expenditures for Samurdhi transfers have not realized their potential in terms o f improving welfare.
96. As studies on the Samurdhi program reveal, the poverty impact o f the consumption transfer i s weak. The high degree o f politicization o f the program has resulted in considerable mis-targeting, with the result that Samurdhi covers many o f the non-poor (total coverage o f almost ha l f o f the population), while missing some o f the neediest, and consequently provides too l i t t le to have a marked impact on consumption levels o f the poor. The S r i Lanka Integrated Survey (SLIS) supported by the Wor ld Bank, found clear evidence o f both leakage and exclusion in regard to Samurdhi coverage. SLIS found that while 14-42 percent o f households in the three higher income quinti les also receive Samurdhi transfers, 36-47 o f households in the two lowest income quintiles did not receive the transfers (see Table 11). More than 40 percent Samurdhi transfers in the sample were made to the wealthiest 60 percent o f the population.
37
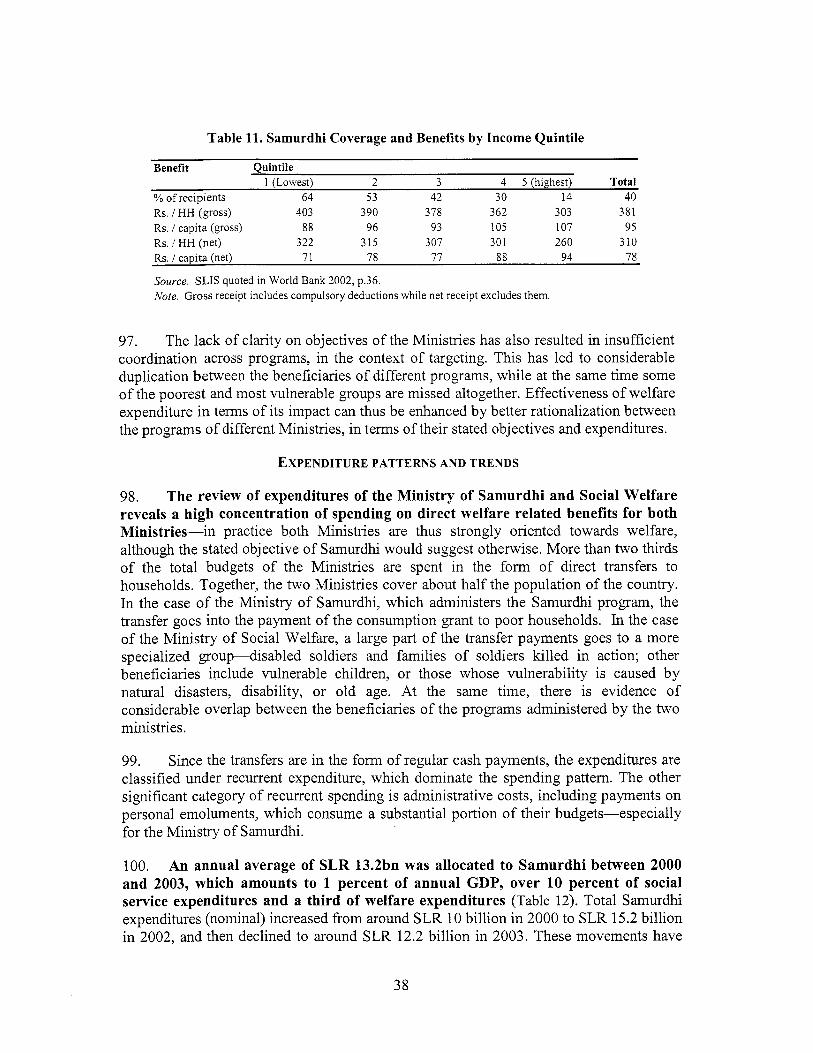
Table 11. Samurdhi Coverage and Benefits by Income Quintile
Benefit Quintile 1 (Lowest) 2 3 4 5 (highest) Total
% o f recipients 64 53 42 30 14 40 Rs. / HH (gross) 403 390 378 362 303 381
Rs. / HH (net) 322 315 307 301 260 310 Rs. / capita (net) 71 78 77 88 94 78
Source. SLIS quoted in Wor ld Bank 2002, p.36. Note. Gross receipt includes compulsory deductions whi le net receipt excludes them.
Rs. / capita (gross) 88 96 93 105 107 95
97. The lack of clarity on objectives o f the Ministries has also resulted in insufficient coordination across programs, in the context o f targeting. This has led to considerable duplication between the beneficiaries o f different programs, while at the same time some o f the poorest and most vulnerable groups are missed altogether. Effectiveness o f welfare expenditure in terms o f i t s impact can thus be enhanced by better rationalization between the programs of different Ministries, in terms o f their stated objectives and expenditures.
EXPENDITURE PATTERNS AND TRENDS
98. The review of expenditures of the Ministry of Samurdhi and Social Welfare reveals a high concentration of spending on direct welfare related benefits for both Ministries-in practice both Ministries are thus strongly oriented towards welfare, although the stated objective o f Samurdhi would suggest otherwise. More than two thirds of the total budgets o f the Min is t r ies are spent in the form o f direct transfers to households. Together, the two Min is t r ies cover about ha l f the population o f the country. In the case o f the Ministry o f Samurdhi, which administers the Samurdhi program, the transfer goes into the payment o f the consumption grant to poor households. In the case of the Ministry o f Social Welfare, a large part o f the transfer payments goes to a more specialized g roup4 isab led soldiers and families o f soldiers k i l led in action; other beneficiaries include vulnerable children, or those whose vulnerability is caused by natural disasters, disability, or o ld age. At the same time, there i s evidence o f considerable overlap between the beneficiaries o f the programs administered by the two ministries.
99. Since the transfers are in the form o f regular cash payments, the expenditures are classified under recurrent expenditure, which dominate the spending pattern. The other significant category of recurrent spending i s administrative costs, including payments on personal emoluments, which consume a substantial portion o f their budgets-especially for the Ministry o f Samurdhi.
100. An annual average of SLR 13.2bn was allocated to Samurdhi between 2000 and 2003, which amounts to 1 percent of annual GDP, over 10 percent of social service expenditures and a third of welfare expenditures (Table 12). Total Samurdhi expenditures (nominal) increased from around SLR 10 bi l l ion in 2000 to SLR 15.2 b i l l ion in 2002, and then declined to around SLR 12.2 b i l l ion in 2003. These movements have
38
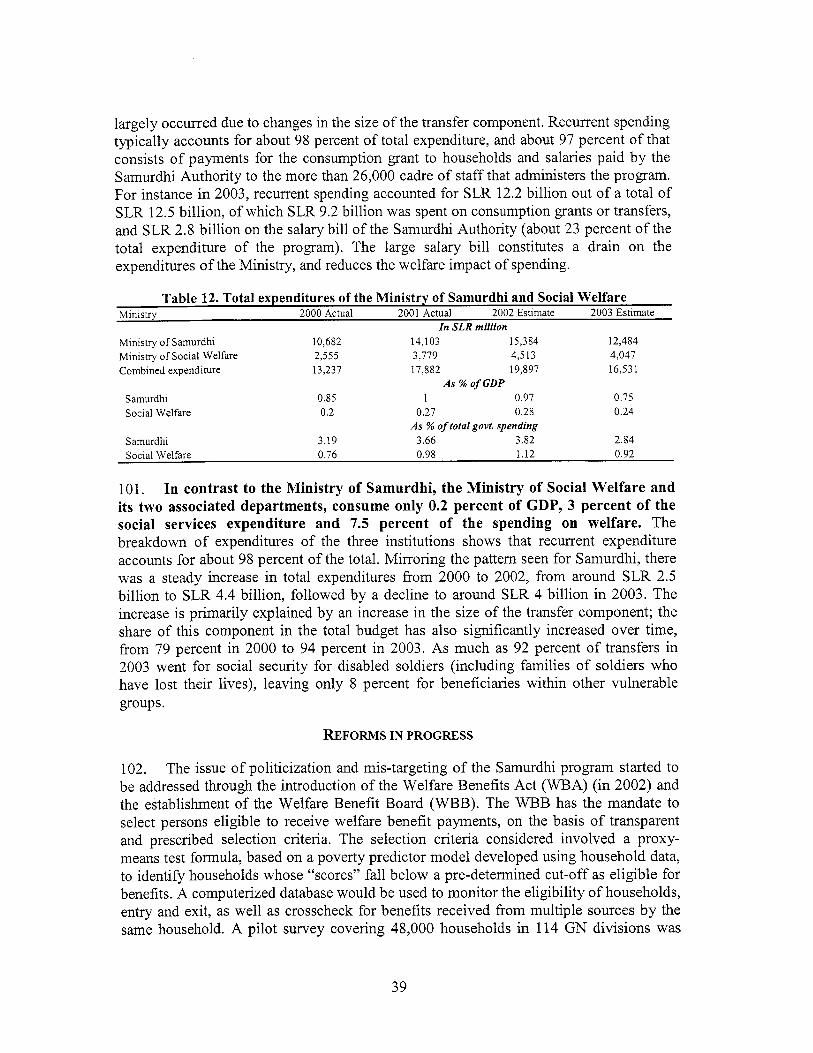
largely occurred due to changes in the size o f the transfer component. Recurrent spending typically accounts for about 98 percent o f total expenditure, and about 97 percent o f that consists o f payments for the consumption grant to households and salaries paid by the Samurdhi Authority to the more than 26,000 cadre o f staff that administers the program. For instance in 2003, recurrent spending accounted for SLR 12.2 bi l l ion out o f a total o f SLR 12.5 billion, o f which SLR 9.2 bi l l ion was spent on consumption grants or transfers, and SLR 2.8 bi l l ion on the salary bil l o f the Samurdhi Authority (about 23 percent o f the total expenditure o f the program). The large salary bill constitutes a drain on the expenditures o f the Ministry, and reduces the welfare impact o f spending.
Table 12. Total expenditures o f the Ministry o f Samurdhi and Social Welfare Ministry 2000 Actual 2001 Actual 2002 Estimate 2003 Estimate
I n SLR million Ministry o f Samurdhi 10,682 14,103 15,384 12,484 Ministry o f Social Welfare 2,555 3,779 4,513 4,047 Combined expenditure 13,237 17,882 19,897 16,531
Samurdhi 0.85 1 0.97 0.75 Social Welfare 0.2 0.27 0.28 0.24
Samurdhi 3.19 3.66 3.82 2.84 Social Welfare 0.76 0.98 1.12 0.92
As % of GDP
As % of total govt. spending
101. In contrast to the Ministry of Samurdhi, the Ministry of Social Welfare and its two associated departments, consume only 0.2 percent of GDP, 3 percent of the social services expenditure and 7.5 percent o f the spending on welfare. The breakdown o f expenditures o f the three institutions shows that recurrent expenditure accounts for about 98 percent o f the total. Mirror ing the pattern seen for Samurdhi, there was a steady increase in total expenditures from 2000 to 2002, from around SLR 2.5 bi l l ion to SLR 4.4 billion, followed by a decline to around SLR 4 bi l l ion in 2003. The increase i s primarily explained by an increase in the size o f the transfer component; the share o f this component in the total budget has also significantly increased over time, from 79 percent in 2000 to 94 percent in 2003. As much as 92 percent o f transfers in 2003 went for social security for disabled soldiers (including families o f soldiers who have lost their lives), leaving only 8 percent for beneficiaries within other vulnerable groups.
REFORMS IN PROGRESS
102. The issue o f politicization and mis-targeting o f the Samurdhi program started to be addressed through the introduction o f the Welfare Benefi ts Act (WBA) (in 2002) and the establishment o f the Welfare Benefi t Board (WBB). The WBB has the mandate to select persons eligible to receive welfare benefit payments, on the basis o f transparent and prescribed selection criteria. The selection criteria considered involved a proxy- means test formula, based on a poverty predictor model developed using household data, to identify households whose “scores” fa l l below a pre-determined cut-off as eligible for benefits. A computerized database would be used to monitor the eligibility of households, entry and exit, as wel l as crosscheck for benefits received from multiple sources by the same household. A pi lot survey covering 48,000 households in 114 GN divisions was
39
conducted in 2003 to test a proxy-means tested application process for selection o f beneficiaries of the Samurdhi program under the new Act. After completion o f the enrolment phase o f the pilot, the island-wide application and targeting process would be initiated, along with a widespread publicity campaign to generate awareness about the reformed system, which i s expected to be operational by the early part o f 2005. The role of the WBB would be limited to selection o f beneficiaries and defining the payment schedules, while the actual disbursement o f benefits under the various welfare schemes would be carried out by the relevant agencies.
103. Whi le the Samurdhi program, being the largest transfer program for the poor in the country, represented the first phase o f reforms, the medium-term agenda would be to rationalize the selection o f beneficiaries of al l transfer programs in the country, by bringing them under a set o f criteria applied by the WBB. This would help minimize duplication and inefficiencies across programs, and enable each program to be better aligned to i t s stated goals and rationale.
104. Some key implications o f the implementation o f WBA are noted here. First, the WBA provides for transparency and accountability not only on the part o f the applicant who seeks benefits, but also on the part o f officials who sanction those benefits. Second, a number o f easily observable characteristics would be used in determining a household’s eligibility for the Samurdhi transfers rather than the current practice o f relying on subjective reports on income levels. Third, the WBA would explicitly define the criteria for entry and exit o f households in and out o f the program, and the status o f households would be tracked so that overlaps in the coverage o f the different welfare programs can be minimized.
105. The cut-off point for the new selection mechanism is proposed as such that the program would cover a proportion o f the population that i s roughly in accordance with the incidence o f poverty in S r i Lanka (as estimated by the Department o f Census and Statistics). The proposals for cut-off point and payment schemes that are being considered, informed by simulations using data, wil l likely lead to: (a) limiting the Samurdhi transfers to the bottom 25-27 percent o f the population, which wil l substantially increase the amounts o f transfers to target households; (b) better accuracy in identifying the poor; (c) making the transfers progressive, i.e. giving larger amounts to the poorer households. As a part o f the reform plan, the possibility o f separating the Samurdhi transfers from the compulsory savings, insurance and lottery schemes, wil l also be considered.
POLICY RECOMMENDATIONS TO SUPPORT AND COMPLEMENT THE REFORM PROCESS
106. O n the basis o f the pol icy issues highlighted previously and the review o f expenditures-and in the light o f the ongoing reforms in the sector-a number o f pol icy implications emerge. These should also be looked upon as steps that could complement, and strengthen, the reforms in the targeting and payment mechanisms initiated by the Welfare Benefits Board.
40
Strategic areas o f policy
107. In addition to the issue o f mis-targeting, which remains the main focus o f the ongoing reforms, the experience with Samurdhi program suggests that some thought be given to i t s conceptual focus. According to i t s declared goals, the Samurdhi program should be regarded more as a poverty alleviation program; this i s however belied by the fact that a very large share o f its budget goes to the transfer program, which in turn “subsidizes” the savings and credit components that are more aligned towards poverty alleviation. There i s a good case for the latter to be de-linked from the welfare component, operationally and financially. This i s l ikely to improve the efficiency and impact o f both types o f programs, on account that the objectives and the potential clientele are likely to be quite different from each other, and the incentives o f beneficiaries and program staff often work at cross-purposes when the two kinds o f programs are combined.
108. To the extent that such de-linking may lead to financial difficulties for the savings and credit components, alternate budget transfer mechanisms can be thought o f to provide subsidies directly to these programs. Such support would however have to be justified by a close examination o f the potential impact o f these programs, and can be limited to a period o f time deemed necessary for the programs to become financially viable on their own. Moreover, as far as the microfinance component i s concerned, i t can be argued that in the long run, the government’s role should be replaced by non- government and private sector institutions. Major pol icy and regulatory reforms envisaged to streamline microfinance in the country creates the potential for working towards a long-term goal o f minimizing the role o f Ministry o f Samurdhi in the delivery o f microfinance services.
109. O n the budgetary front, the planned reforms in the targeting and payment o f Samurdhi benefits do not have any implication as far as the budget for transfers i s concerned, since al l simulations that drive the current proposals hold the current budget of SLR 9 bi l l ion for transfers constant in real terms-recognizing that this would be the minimum budget required to provide a meaningful subsidy to the poorest 25-27 percent o f the population. At the same time, with the WBB taking over the selection o f beneficiaries, the administration o f the consumption grant can be handed back to the decentralized bodies to a large extent. This would obviate the need to employ a large cadre o f development officers, and result in considerable savings on the salaries bill and other administrative overheads (that amounted to 22 percent o f the total budget in 2003). The exact impact o f reforms on the staffing needs o f the Samurdhi Ministry i s however not known yet, and would require careful examination once the fill reform takes shape. The implementation o f administrative and staffing reforms would also have to be integrated wi th the broader public sector reforms underway in the country, for instance, the implementation o f the VRS plan.
110. There i s scope for the various other associated activities implemented by various departments of the Samurdhi Ministry to b e streamlined and rationalized wi th regards to functions o f other ministries. These include activities in health, nutrition, education, training, and social security, when other ministr ies are specifically
41
dedicated to these functions. The budgetary implications o f eliminating some o f these functions would save expenditures at the Samurdhi Ministry, including administrative expenses. Although this would not amount to a significant saving, since the budgets on these activities are l ow to begin with, i t could resul t in better efficiency emerging from a focus on the delivery o f services in a few key areas.
111. The Ministry of Social Welfare needs to carve out a role for itself as a primary agency for the design and delivery of social welfare in the country. To start with the payment to soldiers could be reallocated to the budgets o f the Defense Ministry. While they do represent a marginalized segment o f society, responsibility for the provision o f care for disabled soldiers and their families rightfully rests with the defense institutions and the required finances allocated from its budgets. In the event o f a re- allocation i t i s not recommended at this stage that the budget o f the Ministry be reduced, and any such steps should be preceded by careful examination o f the needs o f the programs administered by this Ministry and their target groups.
112. I t wil l be useful for the Ministry to undertake stocktaking o f i t s many programs and activities, many o f which overlap with other Ministries (e.g., health) and even involve duplication within i t s own departments. If the activities o f the Ministry are rationalized, the same budget can be used for activities that directly address the creation o f safety nets for disadvantaged groups in need, such as the provision o f care for the elderly. Sri Lanka’s demographics point to a serious crisis in the provision o f care to its aging population. The provision o f social insurance schemes for the informal sector i s another area in need o f attention. The International Labour Organisation i s providing significant technical input into this area, and the support for such programs could be another focal area for the Ministry.
113. Further, the administrative costs of the Ministry have room for rationalization. While administrative costs as a share o f total budget are lower than that for the Samurdhi Ministry, the spending on personal emoluments i s s t i l l high relative to the total spending minus the transfer (13 percent in 2003). The expenses are partly justified due to the need for a high level o f skilled counselors and trainers (e.g., probation officers), but if this i s the case, the programs themselves should be expanded in size and coverage to just i fy the personnel cost.
114. The welfare reform’s mediudlong-term vision involves the WBB coordinating the beneficiary selection o f al l welfare programs involving transfer payments in the country, with the goal to minimize duplication, and achieve better targeting and budget planning. This would however require that the rationale, objectives and potential target group o f al l transfer programs be examined carefully before the selection criteria for different programs can be devised and applied in an integrated manner. In order for this to occur, the ministries administering these programs would need to look across the entire landscape o f programs, to identify the areas o f duplication and gaps in the coverage o f existing programs, and rationalize their programs accordingly. For instance, to complement the primary transfer program, Samurdhi , which aims to target chronically poor households, the programs o f the Ministry o f Social Welfare can be positioned to
42
focus on more narrowly defined vulnerable groups, including those affected by short- term shocks l i k e natural disasters.
Issues of process: budgeting and audit
115. There are a number of areas where the budgeting and auditing process can be improved, to better align the strategic direction of different ministries and departments with budget planning. While many o f these are not l imited to the Welfare sector, but rather reflect endemic problems, they have explicit implications for this sector, and thus deserve a mention.
116. First, there i s a need for greater coordination between the Treasury and the line Ministries and Departments. Frequently, the reclassification o f expenditures by the Treasury in the Budget Estimates i s not clear to the planners at the Ministries, which constrains effective budgeting and planning by the Ministries. Second, monitoring o f programs and activities can be enhanced beyond the largely financial and physical monitoring o f targets that presently takes place, to outcome monitoring that involves looking at what has happened once the output i s delivered and utilized by the beneficiary or recipient. With the significant reforms in the welfare sector that are planned, such monitoring o f outcomes assumes special importance, to inform how the programs can be adjusted and fine-tuned over time to achieve better impact.
117. Third, greater efforts are required to capture public expenditure at the decentralized level, especially those of the Provincial Councils. Although Constitutional requirements do not oblige Provincial Councils to report their expenditures in detail to the Treasury, some link to decentralized spending should be made in the Budget Estimates. This wil l lead to improvements in public accountability and facilitate current efforts towards greater devolution; i t wi l l also lead to better coordination between the strategic planning on Welfare at the federal and provincial levels and avoid duplication o f efforts between the central l ine ministries and Provincial Councils.
118. Fourth, both internal and external audit processes suffer from a lack o f trained staff and facilities that limit the effective functioning of the audit process. The internal auditing by the audit un i t s o f the Min is t r ies could also be made more independent so that these units play a more stringent role in overlooking the expenditures of Ministr ies and Departments. Instruments such as the Audit and Management Committees could be enhanced by the compulsory attendance o f the Audit Superintendent from the Auditor Generals department, and the profi le and legal authority of the Internal Audit and Investigation Division o f the Ministry o f Finance could be enhanced to allow more autonomy and legislative clout in the internal auditing process
43
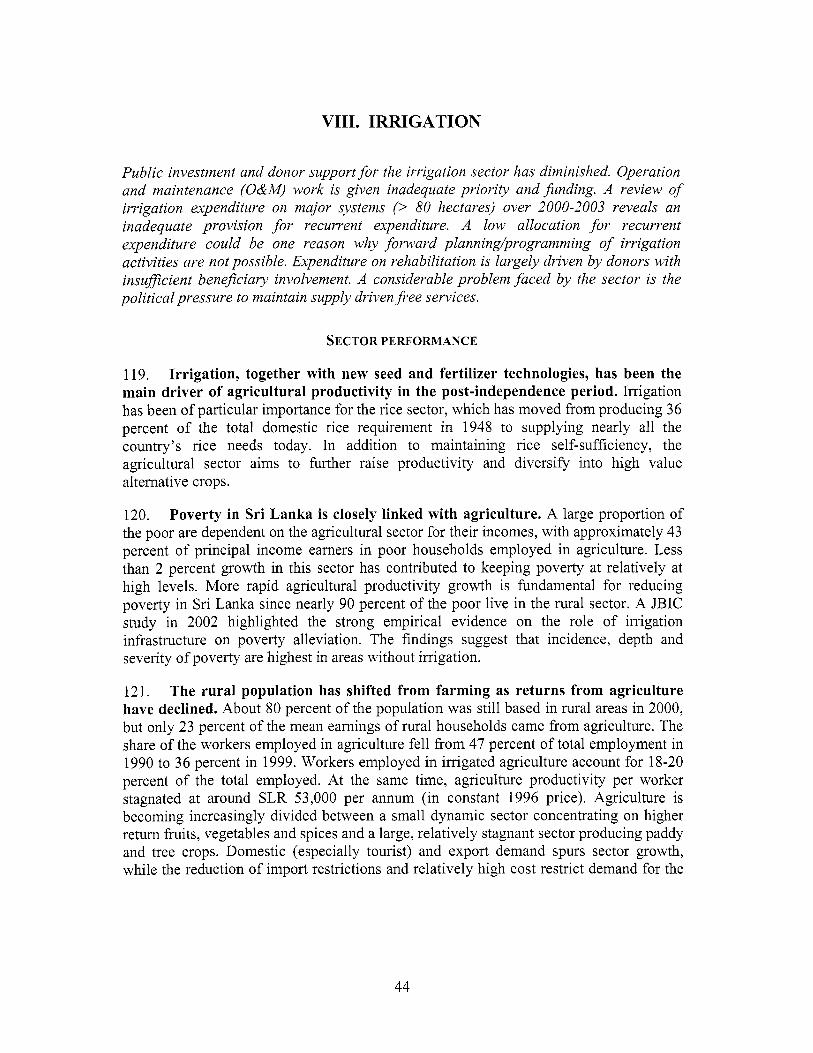
VIII. IRRIGATION
Public investment and donor support for the irrigation sector has diminished. Operation and maintenance (O&M) work is given inadequate priori ty and funding. A review of irrigation expenditure on major systems (> 80 hectares) over 2000-2003 reveals an inadequate provision for recurrent expenditure. A low allocation for recurrent expenditure could be one reason why forward planning/programming of irrigation activities are not possible. Expenditure on rehabilitation is largely driven by donors with insuficient beneficiary involvement. A considerable problem faced by the sector is the pol i t ical pressure to maintain supply driven free services.
SECTOR PERFORMANCE
119. Irrigation, together with new seed and fertilizer technologies, has been the main driver o f agricultural productivity in the post-independence period. Irrigation has been o f particular importance for the rice sector, which has moved from producing 36 percent o f the total domestic rice requirement in 1948 to supplying nearly al l the country’s rice needs today. In addition to maintaining r ice self-sufficiency, the agricultural sector aims to further raise productivity and diversify into high value alternative crops.
120. Poverty in Sr i Lanka i s closely linked with agriculture. A large proportion o f the poor are dependent on the agricultural sector for their incomes, with approximately 43 percent o f principal income earners in poor households employed in agriculture. Less than 2 percent growth in this sector has contributed to keeping poverty at relatively at high levels. More rapid agricultural productivity growth i s fundamental for reducing poverty in Sr i Lanka since nearly 90 percent o f the poor live in the rural sector. A JBIC study in 2002 highlighted the strong empirical evidence on the role o f irrigation infrastructure on poverty alleviation. The findings suggest that incidence, depth and severity o f poverty are highest in areas without irrigation.
121. The rural population has shifted from farming as returns from agriculture have declined. About 80 percent o f the population was s t i l l based in rural areas in 2000, but only 23 percent o f the mean earnings o f rural households came from agriculture. The share o f the workers employed in agriculture f e l l f rom 47 percent o f total employment in 1990 to 36 percent in 1999. Workers employed in irrigated agriculture account for 18-20 percent o f the total employed. At the same time, agriculture productivity per worker stagnated at around SLR 53,000 per annum (in constant 1996 price). Agriculture i s becoming increasingly divided between a small dynamic sector concentrating on higher return fruits, vegetables and spices and a large, relatively stagnant sector producing paddy and tree crops. Domestic (especially tourist) and export demand spurs sector growth, while the reduction o f import restrictions and relatively high cost restrict demand for the
44
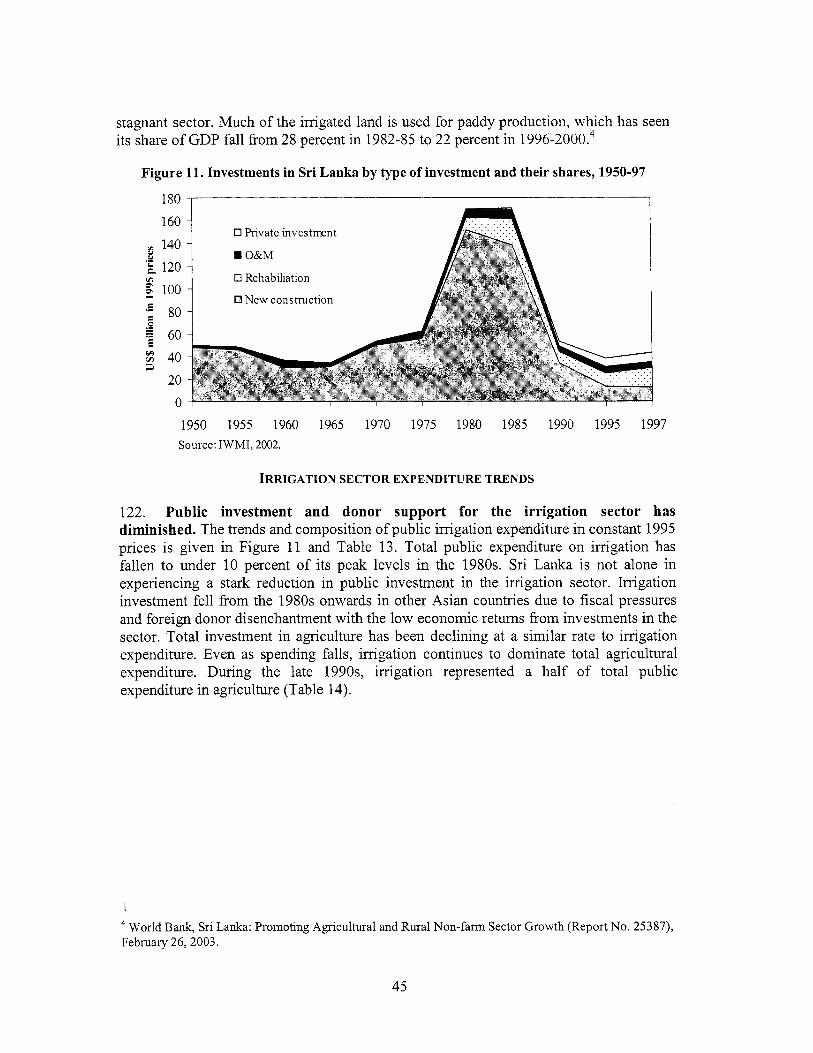
stagnant sector. Much o f the irrigated land is used for paddy production, which has seen its share o f GDP fal l from 28 percent in 1982-85 to 22 percent in 1996-2000.4
Figure 11. Investments in Sri Lanka by type of investment and their shares, 1950-97
1950 1955 1960 1965 1970 1975 1980 1985 1990 1995 1997 Source: IWMI, 2002.
IRRIGATION SECTOR EXPENDITURE TRENDS
122. Public investment and donor support for the irrigation sector has diminished. The trends and composition o f public irrigation expenditure in constant 1995 prices i s given in Figure 11 and Table 13. Total public expenditure on imgat ion has fallen to under 10 percent o f i t s peak levels in the 1980s. Sr i Lanka i s not alone in experiencing a stark reduction in public investment in the irrigation sector. Imgat ion investment f e l l f rom the 1980s onwards in other Asian countries due to fiscal pressures and foreign donor disenchantment with the low economic returns from investments in the sector. Total investment in agriculture has been declining at a similar rate to irrigation expenditure. Even as spending falls, irrigation continues to dominate total agricultural expenditure. During the late 199Os, irrigation represented a hal f o f total public expenditure in agriculture (Table 14).
L
World Bank, Sri Lanka: Promoting Agricultural and Rural Non-farm Sector Growth (Report No. 25387), February 26,2003.
45
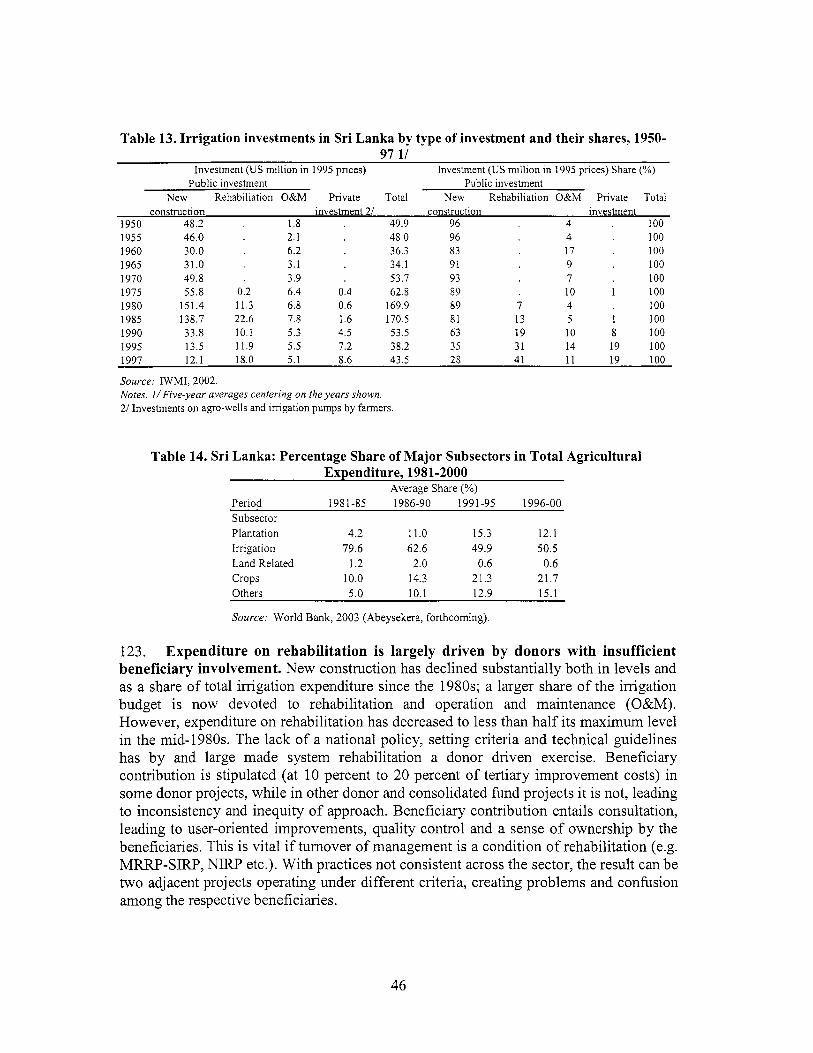
Table 13. Irr igation investments in Sri Lanka by type o f investment and their shares, 1950- 97 1/
Investment (US million in 1995 prices) Investment (US million in 1995 prices) Share (“YO) Public investment Public investment
New Rehabiliation O&M Private Total New Rehabiliation O&M Private Total construction investment 21 construction investment
1950 48.2 1.8 49.9 96 4 100 1955 46.0 2.1 48.0 96 4 100 1960 30.0 6.2 36.3 83 17 100 1965 31.0 3.1 34.1 91 9 100 1970 49.8 3.9 53.7 93 7 100 1975 55.8 0.2 6.4 0.4 62.8 89 10 1 100 1980 151.4 11.3 6.8 0.6 169.9 89 7 4 100 1985 138.7 22.6 7.8 1.6 170.5 81 13 5 1 100 1990 33.8 10.1 5.3 4.5 53.5 63 19 10 8 100 1995 13.5 11.9 5.5 7.2 38.2 35 31 14 19 100 1997 12.1 18.0 5.1 8.6 43.5 28 41 11 19 100
Source: IWMI, 2002. Notes, I / Five-year averages centering on the years shown. 2/ Investments on agro-wells and irrigation pumps by farmers.
Table 14. Sri Lanka: Percentage Share of M a j o r Subsectors in Total Agricultural Expenditure, 1981-2000
Average Share (%) Period 1981-85 1986-90 1991-95 1996-00 Subsector Plantation 4.2 11.0 15.3 12.1 Imgation 79.6 62.6 49.9 50.5 Land Related 1.2 2.0 0.6 0.6 Crops 10.0 14.3 21.3 21.7 Others 5.0 10.1 12.9 15.1
Source: World Bank, 2003 (Abeysekera, forthcoming).
123. Expenditure on rehabilitation i s largely driven by donors with insufficient beneficiary involvement. N e w construction has declined substantially both in levels and as a share o f total irrigation expenditure since the 1980s; a larger share o f the irrigation budget i s now devoted to rehabilitation and operation and maintenance (O&M). However, expenditure on rehabilitation has decreased to less than ha l f i t s maximum level in the mid-1980s. The lack o f a national policy, setting criteria and technical guidelines has by and large made system rehabilitation a donor driven exercise. Beneficiary contribution i s stipulated (at 10 percent to 20 percent o f tertiary improvement costs) in some donor projects, while in other donor and consolidated fund projects i t i s not, leading to inconsistency and inequity o f approach. Beneficiary contribution entails consultation, leading to user-oriented improvements, quality control and a sense o f ownership by the beneficiaries. This i s vi tal if turnover o f management i s a condition o f rehabilitation (e.g. MRRP-SIRP, NIRP etc.). With practices not consistent across the sector, the result can be two adjacent projects operating under different criteria, creating problems and confusion among the respective beneficiaries.
46
124. Operation and maintenance (O&M) work i s given inadequate priority and funding. O&M expenditures have been fal l ing since the mid-l980s, despite the slight increase in the irrigated area for this period. Nomina l resources provided for O&M have declined by 30 percent since 2000. Inadequate funding has led to a rapid deterioration o f canal systems, wh ich results in a poor quality o f water service to farmers and thereby contributes to l o w crop yields. Poor maintenance o f the large dams and their major structural components has created potential safety r isks and in turn potential threats to publ ic ~ a f e t y . ~ The' lack o f O&M resources also bring about the need for repeated and expensive rehabil itation programs. The fact that donors support rehabilitation rather than O&M has l e d to the practice whereby O&M investments are substituted by shorter donor funded soft loadgrant rehabilitation cycles in order to overcome system deterioration. In a monsoonal climate where O&M costs remain high and in an environment o f f iscal constraint, this practice has n o w almost become the norm.
Figure 12. Major Irrigation: Spread of Investments in 2003
Recurrent Expenditure SLR 527 Million
Personal Emoluments
Related 91%
Capital Expenditure SLR 893 Million Measurement 8%
s, Studies Improvemen t
Rehabi l i tat ion
/Structures Machinery
5%
3 9%
*Head 310 -Project 02 & Head 853 -Project 1,2,3 & 4
L
Wor ld Bank: Mahaweli Restructuring and Rehabilitation Project, Implementation Completion Report, M a y 2004
47
125. A review of irrigation expenditure on major systems (> 80 hectares) over 2000-2003 reveals an inadequate provision for recurrent expenditure (Figure 12). Recurrent expenditures for Imgation System Management and Construction (policy i s excluded) show that a major part o f the provision goes to support personnel emoluments with meager 10-1 5 percent provision for operational support. The result i s invariably that recurrent costs are charged to capital provision. For meaningful performance in relation to investment on high value human resources in the sector a more performance oriented ratio for operational support needs to be provided. While technical support in construction activities could be subsumed within capital provision, aspects such as institutional development work which could have a major impact on long term savings and specialized services vital for planning design, investigation etc. suffer.
126. A low allocation for recurrent expenditure could be one reason why forward planning/programming of irrigation activities are not possible and such services can only survive on provision made available through currently implemented activities from capital budgets. I t would appear that a minimum provision o f 25 percent needs to be provided in the recurrent budget to enable proper utilization o f the human resources made available. Unless such a development occurs development o f effective programmatic fonvard-looking planning for the sector wil l not be possible. Adequate provision for recurrent expenditure i s crucial to ensure functional effectiveness o f dedicated staff performing duties that cannot access funding from capital projects, such as monitoring and evaluation (M&E), project preparation, specialized technical services, etc.
127. Presently around 35 percent of capital votes go to support recurrent expenditure. Major costs such as vehicle fuel/ maintenance etc. were charged approximately 80 percent to Capital votes. The mixing o f recurrent and capital expenditure streams leads to misallocation and distortions in use o f resources. Whi le i t may be attractive to show large capital budgets the fact that really a third o f such budgets go for recurrent costs anyway while gravely affecting programs that do not have support of capital projects leads to a skewed and distorted evaluation o f performance. One reason for the l o w recurrent-to-capital ratio could be attributed to the lack o f adequate operational provision under recurrent votes. For example, o f the SLR 242 million, SLR 393 mi l l ion and SLR 434 mi l l ion in o f recurrent expenditure in 1999, 2000 and 2001 respectively, approximately 91 percent, 89 percent and 92 percent respectively went for personnel emoluments. Adequate levels o f recurrent operational costs need to be provided for balanced program implementation.
SECTOR POLICY AND PLANNING
128. Sri Lanka has invested heavily in irrigation, but the results have been disappointing. About 90 percent o f irrigated land i s taken up with paddy as a resul t o f combined agricultural policies to promote rice production. This ties most farm households to low productivity activities, constraining the public sector f rom introducing charges needed to fund the maintenance o f the irrigation system. The subsequent lack o f fiscal funds continues to impede water delivery blocking farmers f rom diversification into higher value crops in many areas o f the dry zone. The strategy must be to break this
48
vicious circle. The main challenges faced by the public sector in providing irrigation services are outlined in Box 2.
129. A considerable problem faced by the sector i s the pol i t ical pressure to maintain supply driven f ree services. First, this results an under-funding o f the sector. Second, the lack o f cost sharing o f services and improvements by beneficiaries result in agency driven infrastructure development and rehabilitation. Third, the free public good nature o f irrigation infrastructure attracts political leverage to be exerted to undertake local projects o f doubtful economic viability, sometimes led by local interests and nexus between local political authorities and agency staff. Lack o f proper technical investigation and economic and financial assessments result in cost over-runs and reduction o f benefits with opportunities for attention to more viable projects being reduced. Political patronage precludes a rational transformation o f irrigation agencies to provide services required under a new environment. Internal resistance to change, unless faced with severe financial crisis, i s also a factor. Crucially, the lack o f cost sharing encourages an inefficient usage o f scarce water resources as farmers do not have any incentive to conserve water in l ine with its marginal cost.
Box 2. M a i n challenges for public sector in irrigation services provision
1) Transform the public sector role from provider o f supply-driven free goods and services for the peasant based irrigated subsistence farming sector to supporter o f commercially oriented viable farming enterprise development of small holder agriculture through management and cost sharing.
Development o f an institutional and operational framework within which irrigation institutions will regulate through quality control and essential intervention rather than providing resources and services that may be effectively outsourced.
2)
3) Address the political dimension of provision of f ree public goods and services. T h e irrigation sector remains the only sector where a unit of economic infrastructure costing up to and over Rs. 1 million i s provided free o f charge, together with subsequent follow-up services and improvements. These are given to persons without proven investment or other capability resulting in a supply driven expansion. Such a policy does not promote full employment, and invariably holds the recipient in a poverty trap and results in investment with inadequate returns for the economy.
Through augmentation, improvements, technology adoption and better management transform irrigation systems established earlier to provide only supplementary irrigation to systems being capable o f providing higher incomes through full employment (250 man days/ yr).
4)
130. Water resources need to be managed in an integrated fashion within a river basin context supported by a coherent water sector pol icy and institutional framework. Competition among different sectors and users for water has increased dramatically resulting in disputes and conflicts. A recent study forecasts that, if the current rates o f high usage and low irrigation efficiency continue growing water scarcity would affect a number o f predominantly poverty stricken rural districts by the year 2025. Therefore, an integrated water resources management approach i s indispensable to strike a sustainable supply and demand balance o f resources while complementing economic, social, and environmental development needs o f the country and recognizing the inherent political dimensions. This i s particularly true given that some major rivers are shared between the South and North-East areas which are presently in political conflict.
49
POLICY RECOMMENDATIONS
131. Clear policy directions and criteria are required with respect to new development and expansion, especially where it may affect current availability of water to stakeholders in a basin and create greater irrigation and environmental problems. Whi le rehabilitation has been shown to have better economic returns, reduction in O&M provision coupled with take up for rehabilitation o f those systems at high investment, where potential returns are l o w need re-examination. This calls for longer rehabilitation cycles which are now ever getting shorter with poor O&M.
132. Budgetary allocation criteria and guidelines need to be established. A focus on construction and sector ceilings on funding should not occur at the expense o f adequate levels o f O&M. High investment in “development” at the expense o f O&M i s s e l f defeating. A fixed proportion o f the budget should be allocated for O&M, while some rationalization o f O&M provision between types o f systems needs to be established. Provision for Head Works O&M is inadequate in relation to functions and responsibilities both in Irrigation Department (ID) and Mahaweli Authority o f Sri Lanka (MASL). Similarly for O & M related institutional activities. Greater mileage from funds for rehabilitation & O&M with beneficiary contribution with linkages to farmers’ organizations appears possible. In the context o f operations o f field canals through private sector, ID needs to develop and investment strategy that includes private sector as a player.
133. Policy review and M&E of policy implementation i s ancillary to expenditure and physical progress review and should be undertaken by the central planning units in the ministry and agencies. As irrigation i s an input to agriculture and a vehicle for poverty reduction, these ‘efforts need harmonizing and integration. The Central Coordination Committee on Irrigation Management (CCCIM) could be the forum for integrating irrigation and agricultural policies and needs to be reconvened regularly. Policy studies offer opportunities for examination o f pol icy gaps while reinforcing capacity building. Surveys and case studies help provide the necessary feedback for impact assessment o f pol icy and implementation.
134. There i s a need to transform the agencies involved in irrigation and reassess their missiodfunctions in l ine with overall economic and structural changes and the future investment strategy for the sector. Both ID and Irrigation Management Div is ion (IMD) can transfer some ground level activities and take up more upstream activities focusing on water resource management through multi-disciplinary approaches. There i s additionally a need for integration o f O & M items, improvements, and rehabilitation with segregation from new development activities to ensure greater clarity with respect to investment. Need to adhere strictly to construction timelines, as take up o f many new items in the context o f sector ceilings, result in most initiated itemized works programmed for 1 to 2 years sometimes taking 5 to 7 years to compete with reduced annual budgets resulting in cost overruns and reduction in benefits. Even anniversary programs, such as Centenary Irrigation Agriculture Development Project, seem to continue far beyond anticipated conclusion o f event.
50
135. Whi le strategic plans, including six-year investment plans and pipe l ine projects were initiated by the Ministry o f Irrigation and Water Management, there i s a mismatch and a lack of coherence in the implementation process, due to: (1) Investment ceilings and fimding constraints delay implementation o f on-going projects and reduce opportunities for take-up new initiatives. (2 ) Increased ground level political pressures promote take up o f “ad-hoc projects” and resources are directed to discrete activities rather than planned programmatic approaches, leading to distortions o f intentions vis-a- vis goals. (3) New items funded through the consolidated fund invariably reflect very localized interests and though they should be channeled through the local authorities (Provincial Councils) by virtue o f falling within their mandate are taken up at national leve l on the basis that they are within the major system classification (>80 ha). While Provincial Councils are generally unwilling to support these projects financially. Consequently, the investigation, planning, and design processes for such “itemized work” are mostly short circuited to meet political priorities leading to, (a) Take up o f i tems even without proper preliminary investigation reports resulting in: complications to construction during implementation; escalation o f costs through changes to the Technical Evaluation Committee during construction; reduction o f benefits due to poor planning assumptions; delays due to unanticipated social/ land issues; doubtful financial/ economic viability. (b) Investment budgets are diffused and lack focus leading to: most local fimding channeled to construction activities normally within purview o f local authorities; lack o f priori ty by other agencies affect realization o f benefits due to problems in settlement, land development, agricultural extension or credit and social infrastructure; long gestation periods due to many competing items within investment and institutional capacity affects costs and benefits; reduced interest and investment to support program areas such as O&M, joint management and turnover, pol icy studies, specialized services and monitoring, project planning and design.
136. The more feasible approach to reforming the water sector in Sr i Lanka may be a “bottom up” approach for policy and institutional reforms as indicated by the Mahaweli Restructuring and Rehabilitation Project (MRRP). A key lesson drawn from MRRP i s that a practical approach to water sector reform i s to involve water sector agencies and water users in pi lot demonstrations and activities that incorporate the major pol icy recommendations and instruments (e.g. entitlements, farmer managed systems, bulk water based water management). Such a method i s likely to be more fi-uitful rather than pushing a reform agenda on a purely academic/conceptual basis. Pi lot interventions are l ikely to get more support from water users and agencies, particularly if the programs are action oriented and aimed at resolving real time and emerging water management problems and issues in river basins. The idea would be to get farmers closely involved in designing pi lot interventions, and create strong l inks between bottom up reforms and investment to create the right incentives.
51

52
ANNEX
March 23,2004 Draft
National Budget Circular No : Department o f National Budget, Secretariat Colombo
To: All Secretaries o f Ministr ies Chief Secretaries o f the Provincial Councils Secretary to the Finance Commission
Preparation of the 2005 Budget and Medium Term Budget Estimates in Consultation with Ministries
1. Introduction and Purpose of This Circular
To build on budget reform efforts and to assure that the 2005 Budget and the estimates for the subsequent two years reflect:
0 the requirement o f the Fiscal Management (Responsibility) Act N o . 3 o f 2003 to achieve a deficit not in excess o f 5 % o f GDP by 2006;
0 the integration o f policy priorities and expenditure;
0 information on program performance, including the init ial results o f performance budgeting and the identification o f performance indicators to measure progress in terms o f results; and
0 a sectoral perspective to priority setting and elimination o f l o w pr ior i ty and duplicative sectoral projects and activities;
the following procedures will be adopted for developing the 2005 Budget and the estimates for the two subsequent years.
2. Sectoral Consultative Committee on Budgets (SCCBs)
To strengthen the focus on priorities and performance over the medium term, the Ministry o f Finance and the Planning Department will engage spending agencies in a dialogue from the outset o f the Budget process. As a means o f advancing this objective, Sectoral Consultative Committees on Budgets (SCCBs) for each sector (as shown in Annexure I) are being established. Depending upon their responsibilities, individual Ministries may be represented o n more than one SCCB.
Please also be informed that Sectoral wor lung groups already set up under the Public Expenditure Review Program supported by the W o r l d Bank, on Health, Irrigation, Education, and Social Protection will be absorbed into the appropriate SCCB.
53
3. Composition of the Committees
SCCBs will be comprised o f Secretaries to the Ministries and Heads o f Spending Agencies in each sector, officers f rom the Departments o f National Budget, National Planning, Public Enterprises, External Resources, and Management Services as appropriate. In order to assist with the integration o f policy priorities and the Budget, officers o f the National Planning Department wil l be appointed to the appropriate SCCBs. Provincial Councils and representatives o f the Finance Commission wil l also be co-opted to the SCCBs that are reviewing devolved subjects.
4. Objectives of the Sectoral Consultative Committees on Budgets
a) To review Sectoral priorities and re-define the role o f each Ministry within the Sector, if necessary;
b) To identify issues pertaining to resource allocation within the Sectors, including duplication and overlapping o f activities among Ministries within each sector;
c) To work with preliminary Sectoral budgetary limits and to ensure their most appropriate allocation.
d) Prepare Policy Notes for each sector on the basis o f findings under (a), (b), and (c) above, including:
1)
ii)
iii)
iv)
4
an analysis o f expenditure trends in the sector in general and sub-sectors in particular;
a review o f cadre levels and distribution among projects to assure that staffing i s aligned with administrative responsibilities and priorities;
comments/views o n existing allocations o f resources, pol icy priorities, and the current performance of the sector, drawing on a review o f results, as measured by performance indicators, including those required by Budget Circular 1 1 1, dated July 3 1,2003;
the identification o f specific pol icy options and the recommended re-allocation o f resources to priority areas in 2005 and over the medium term; and
the identification o f l o w priorities, including duplicated activities, that can be terminated to permit funding o f high priority sector policies, programs, and projects.
Where sectors believe there i s a case for any increase in the preliminary expenditure limit they must present a rigorous case for any such increase. For those sectors that have no t engaged in developing a sector based strategy (strategic plan, master plan, a sector po l icy note as part o f the public expenditure review process) the SCCB should focus particularly o n expenditure trends and identifying options for eliminating duplicated functions.
54
5. Preliminary 2005 Expenditure and Cadre Limits
Preliminary expenditure and cadre limits for each sector are given at Annexure 11. The starting point for these limits was the spending agency estimates for the year 2005 as shown in the printed 2004 estimates. The 2005 expenditure estimates have been increased, and there has been some reallocation between objects, to accommodate the estimated costs o f the 2004 salary adjustments.
The challenging macroeconomic environment i s illustrated in Annexure 111. This provides the background against which SCCBs will have to ensure that they work within their l imi ts and recognize that any increase in those limits wil l be at the expense o f other sectors.
6. Activities to be Performed by SCCBs by mid-June, 2004:
SCCB meetings should init ially focus on:
a) The identification o f key issues confronting the sector;
b) A review and re-affirmation or adjustment o f sectoral priorities; and
c) The identification o f instances o f duplication and overlapping activities.
Regular SCCB meetings to discuss progress and issues emerging f rom the work to date will be necessary.
On the basis o f SCCB deliberations, the following should be forwarded to the Treasury by mid-June:
d) The Policy Note, containing a realistic assessment o f the priority needs o f the individual sectors in relation to the preliminary expenditure limits and the analysis referred to in 4 (4;
e) Distribution of the 2005 preliminary expenditure and cadre limits.
It i s expected that SCCBs will fully engage their Ministers in the issues arising f rom SCCB deliberations.
7. Final Expenditure Ceilings
The Treasury wil l submit a Budget Framework Paper o n the macroeconomic and fiscal outlook, cross-cutting issues, such as pay and employment, and proposed expenditure ceilings (after review o f the recommended allocations o f the SCCBs) for the approval o f the Economic Policy Committee o f the Cabinet by the end o f July 2004. U p o n approval o f same by the Economic Policy committee, such approved ceilings will be conveyed to the SCCBs for f inal agreement on ministry/sub-sector allocations.
8. Submission of Estimates for 2005 and Projections for 2006 and 2007
On the basis o f the final 2005 expenditure and cadre ceilings approved by the Economic Policy Committee, and the sub-sector/ministry allocations within the final sectoral ceilings agreed
55
by the SCCBs, Secretaries to Ministries should submit final 2005 estimates and expenditure projections for the years 2006 and 2007 to the Treasury by end o f July 2004.
9. Preliminary SCCB Meetings
In order to discuss the logistics o f SCCB operations, including arrangements for chairmanship o f each SCCB, an init ial meeting for each sector wi l l be scheduled by the Director General o f Nat ional Budget for the last week o f April, 2004. Additional guidance o n the role and functions o f SCCBs and on what might constitute a case for any variation to the preliminary limit to be entertained will also be provided at this meeting.
Your active participation in the Budget preparation process i s solicited in order to ensure the optimal allocation o f scarce resources.
Secretary to the Treasury
56