Embed Size (px)
Citation preview
Selected Results of the Selected Results of the 2004 Campus Climate Survey2004 Campus Climate Survey
October 2004October 2004
The University of KentuckyThe University of Kentucky
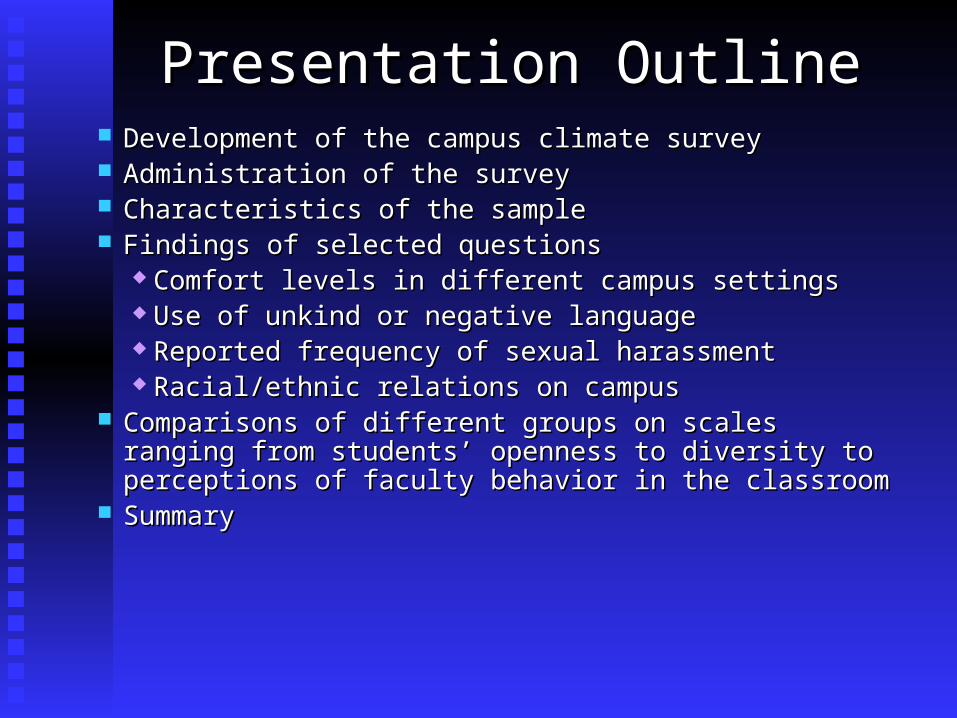
Presentation OutlinePresentation Outline Development of the campus climate surveyDevelopment of the campus climate survey Administration of the surveyAdministration of the survey Characteristics of the sampleCharacteristics of the sample Findings of selected questions Findings of selected questions
Comfort levels in different campus settingsComfort levels in different campus settings Use of unkind or negative language Use of unkind or negative language Reported frequency of sexual harassment Reported frequency of sexual harassment Racial/ethnic relations on campusRacial/ethnic relations on campus
Comparisons of different groups on scales ranging from students’ Comparisons of different groups on scales ranging from students’ openness to diversity to perceptions of faculty behavior in the openness to diversity to perceptions of faculty behavior in the classroomclassroom
SummarySummary
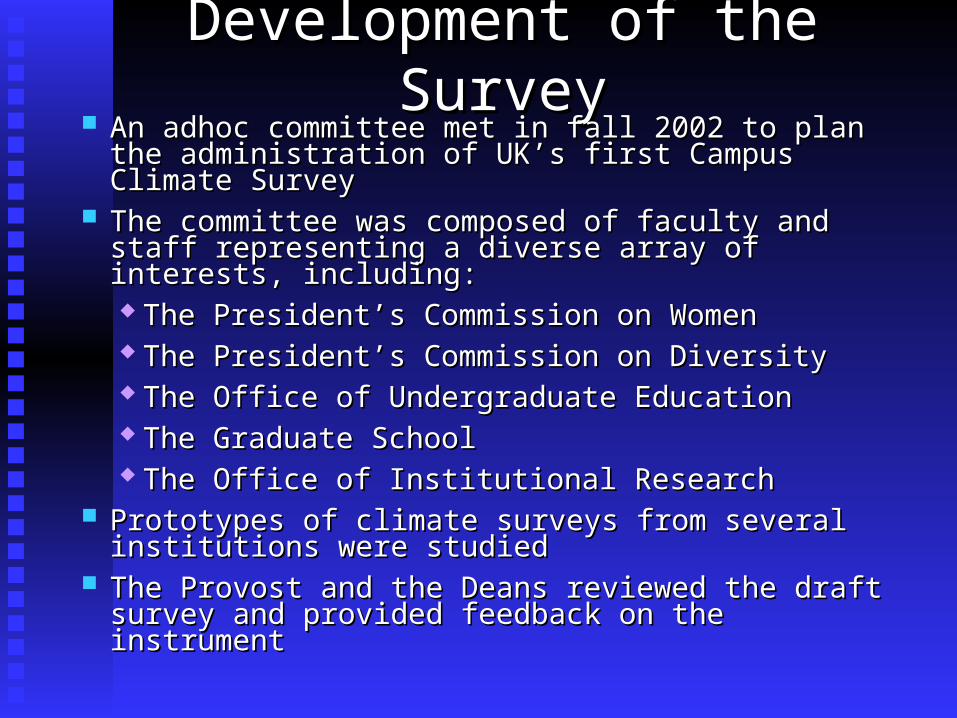
Development of the SurveyDevelopment of the Survey An adhoc committee met in fall 2002 to plan the An adhoc committee met in fall 2002 to plan the
administration of UK’s first Campus Climate Surveyadministration of UK’s first Campus Climate Survey The committee was composed of faculty and staff The committee was composed of faculty and staff
representing a diverse array of interests, including:representing a diverse array of interests, including: The President’s Commission on WomenThe President’s Commission on Women The President’s Commission on DiversityThe President’s Commission on Diversity The Office of Undergraduate EducationThe Office of Undergraduate Education The Graduate SchoolThe Graduate School The Office of Institutional ResearchThe Office of Institutional Research
Prototypes of climate surveys from several institutions Prototypes of climate surveys from several institutions were studied were studied
The Provost and the Deans reviewed the draft survey The Provost and the Deans reviewed the draft survey and provided feedback on the instrumentand provided feedback on the instrument
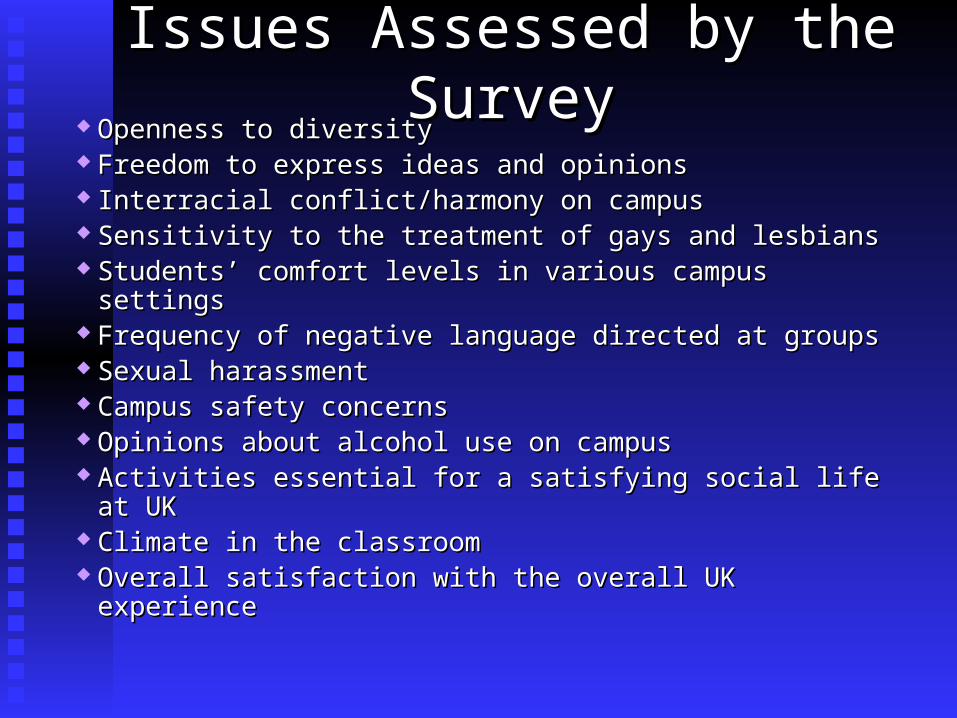
Issues Assessed by the SurveyIssues Assessed by the Survey Openness to diversity Openness to diversity Freedom to express ideas and opinionsFreedom to express ideas and opinions Interracial conflict/harmony on campus Interracial conflict/harmony on campus Sensitivity to the treatment of gays and lesbiansSensitivity to the treatment of gays and lesbians Students’ comfort levels in various campus settingsStudents’ comfort levels in various campus settings Frequency of negative language directed at groupsFrequency of negative language directed at groups Sexual harassmentSexual harassment Campus safety concernsCampus safety concerns Opinions about alcohol use on campusOpinions about alcohol use on campus Activities essential for a satisfying social life at UKActivities essential for a satisfying social life at UK Climate in the classroomClimate in the classroom Overall satisfaction with the overall UK experienceOverall satisfaction with the overall UK experience
Administration of the SurveyAdministration of the Survey
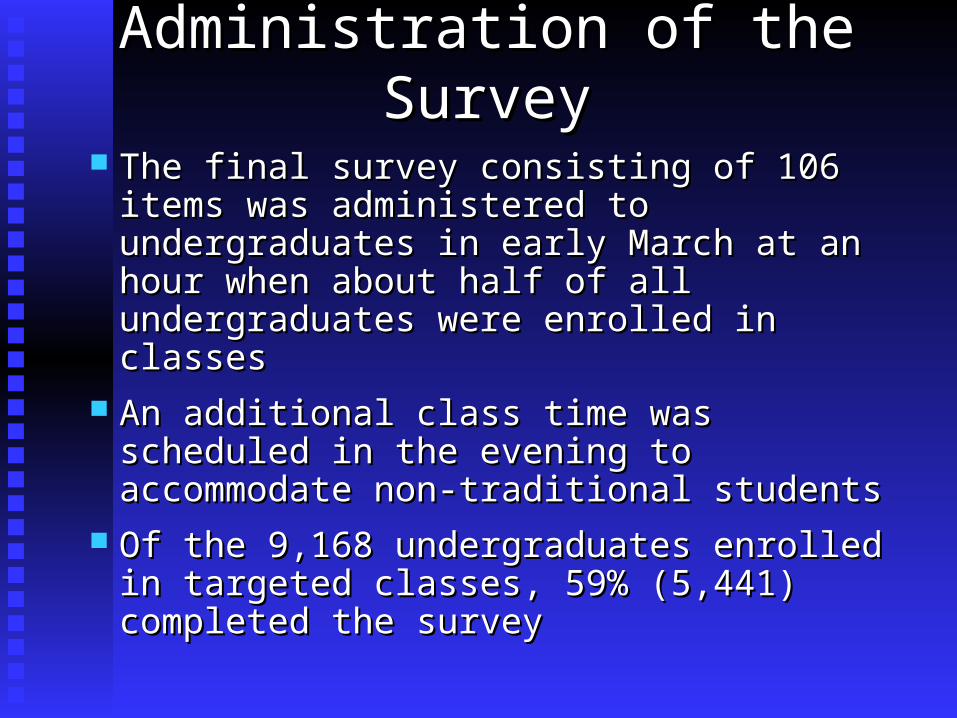
The final survey consisting of 106 items The final survey consisting of 106 items was administered to undergraduates in early was administered to undergraduates in early March at an hour when about half of all March at an hour when about half of all undergraduates were enrolled in classesundergraduates were enrolled in classes
An additional class time was scheduled in An additional class time was scheduled in the evening to accommodate non-traditional the evening to accommodate non-traditional studentsstudents
Of the 9,168 undergraduates enrolled in Of the 9,168 undergraduates enrolled in targeted classes, 59% (5,441) completed the targeted classes, 59% (5,441) completed the survey survey

Administration of the SurveyAdministration of the Survey A web-based version of the survey was A web-based version of the survey was
completed by graduate and first-professional completed by graduate and first-professional students students
Two email reminders were sent to students to Two email reminders were sent to students to maximize response ratesmaximize response rates
A total of 1,212 graduate students and 184 A total of 1,212 graduate students and 184 professional students completed the survey, professional students completed the survey, which resulted in response rates of 24% and which resulted in response rates of 24% and 13%, respectively13%, respectively
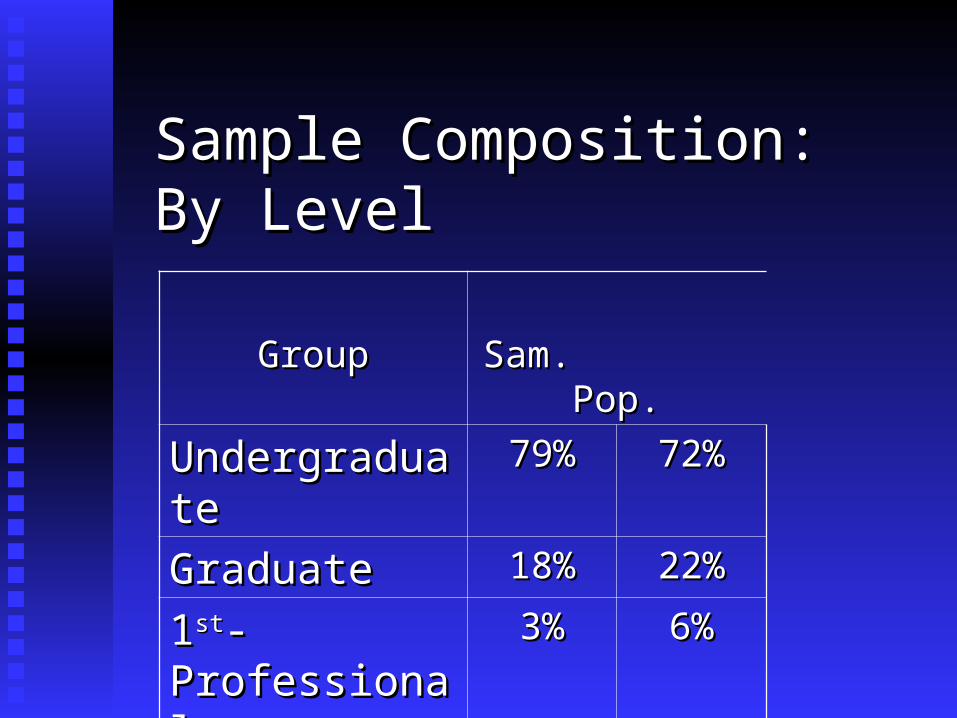
Sample Composition: Sample Composition: By LevelBy Level
GroupGroup Sam. Pop.Sam. Pop.
UndergraduateUndergraduate 79%79% 72%72%
GraduateGraduate 18%18% 22%22%
11stst-Professional-Professional 3%3% 6%6%
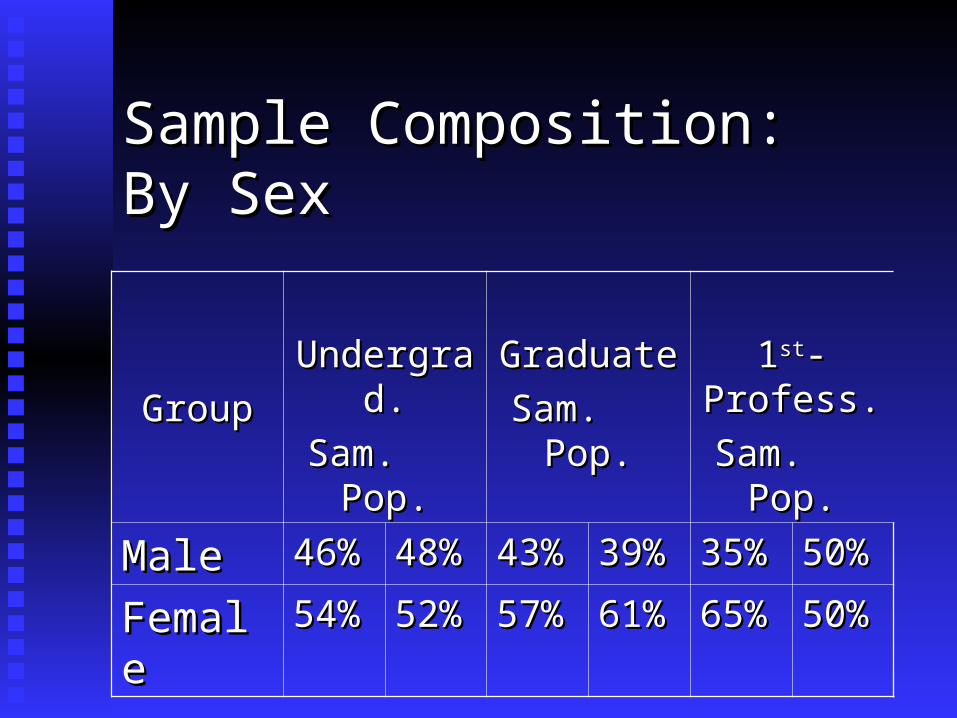
Sample Composition: Sample Composition: By SexBy Sex
GroupGroup
Undergrad.Undergrad.
Sam. Pop.Sam. Pop.
GraduateGraduate
Sam. Pop.Sam. Pop.
11stst-Profess.-Profess.
Sam. Pop.Sam. Pop.
MaleMale 46%46% 48%48% 43%43% 39%39% 35%35% 50%50%
FemaleFemale 54%54% 52%52% 57%57% 61%61% 65%65% 50%50%
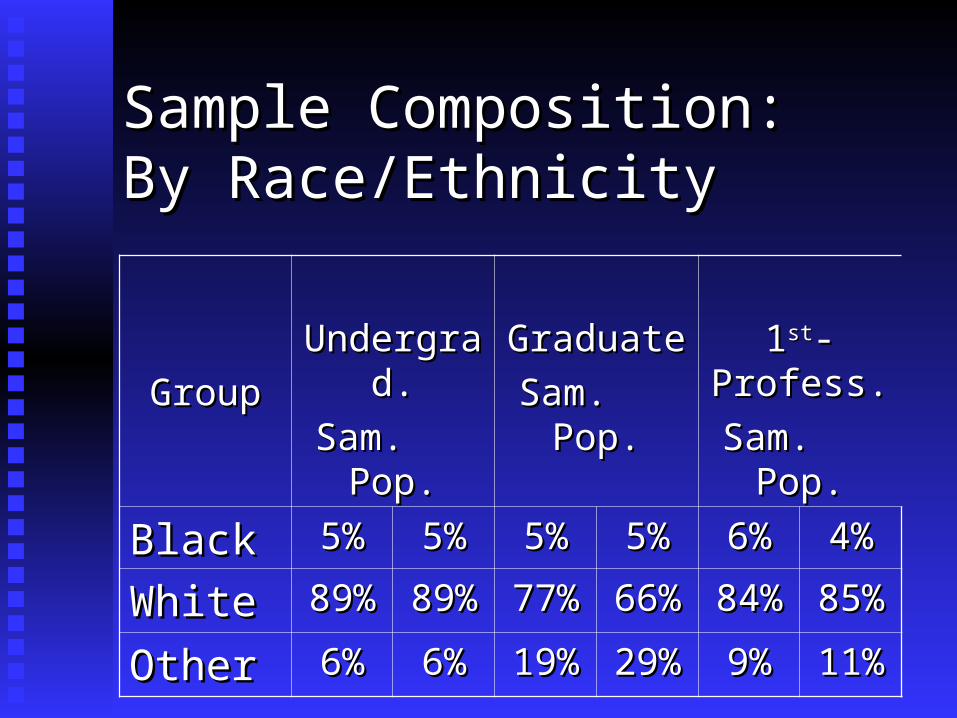
Sample Composition: Sample Composition: By Race/EthnicityBy Race/Ethnicity
GroupGroup
Undergrad.Undergrad.
Sam. Pop.Sam. Pop.
GraduateGraduate
Sam. Pop.Sam. Pop.
11stst-Profess.-Profess.
Sam. Pop.Sam. Pop.
BlackBlack 5%5% 5%5% 5%5% 5%5% 6%6% 4%4%
WhiteWhite 89%89% 89%89% 77%77% 66%66% 84%84% 85%85%
OtherOther 6%6% 6%6% 19%19% 29%29% 9%9% 11%11%
Analysis of Survey ResultsAnalysis of Survey Results
To increase the likelihood that Campus To increase the likelihood that Campus Climate Survey results are representative of Climate Survey results are representative of the UK student body’s perceptions, beliefs the UK student body’s perceptions, beliefs and opinions, responses are weighted in and opinions, responses are weighted in terms of:terms of: SexSex Race/EthnicityRace/Ethnicity Student levelStudent level
How do students perceive the social How do students perceive the social climate on campus and in class?climate on campus and in class?
Reported comfort in different campus settingsReported comfort in different campus settings Perceived frequency of unkind or negative Perceived frequency of unkind or negative
language used to describe different groupslanguage used to describe different groups Reported frequency of various forms of sexual Reported frequency of various forms of sexual
harassment harassment Perceived racial/ethnic relations on campusPerceived racial/ethnic relations on campus
Review of selected items pertaining to:
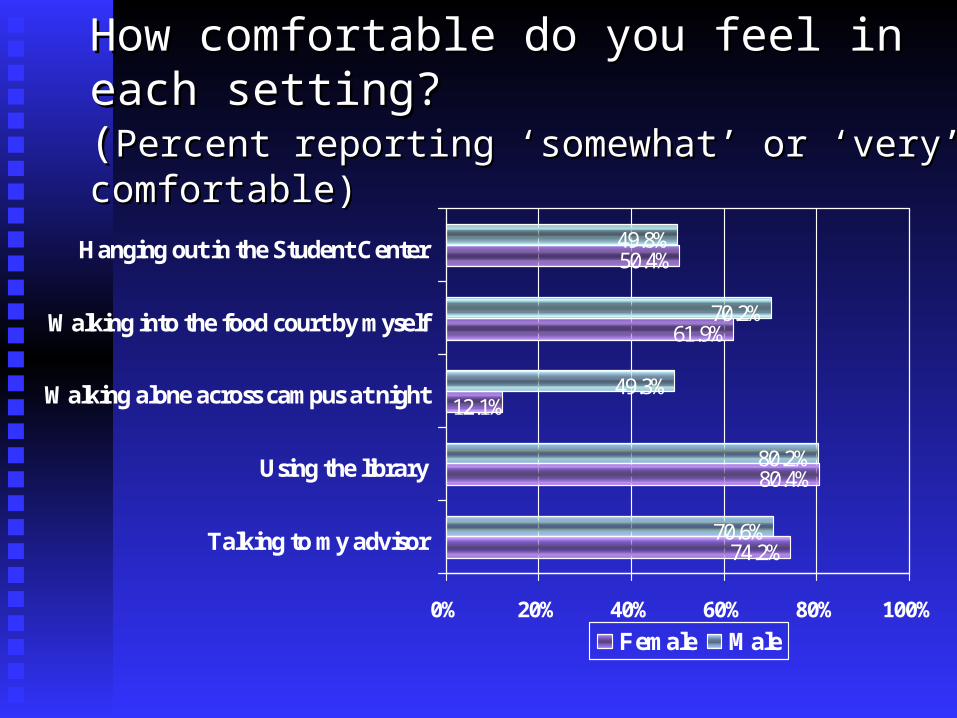
How comfortable do you feel in each setting?How comfortable do you feel in each setting?((Percent reporting ‘somewhat’ or ‘very’ comfortable)Percent reporting ‘somewhat’ or ‘very’ comfortable)
74.2%
80.4%
12.1%
61.9%
70.6%
80.2%
49.3%
70.2%
49.8%50.4%
0% 20% 40% 60% 80% 100%
Talking to my advisor
Using the library
Walking alone across campus at night
Walking into the food court by myself
Hanging out in the Student Center
Female Male
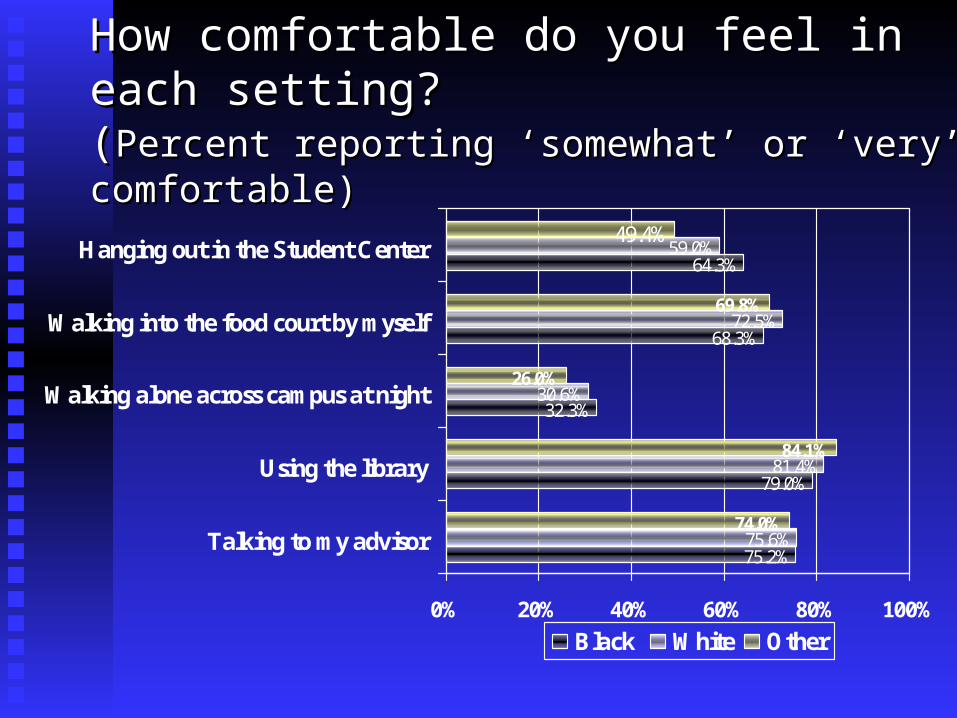
How comfortable do you feel in each setting?How comfortable do you feel in each setting?((Percent reporting ‘somewhat’ or ‘very’ comfortable)Percent reporting ‘somewhat’ or ‘very’ comfortable)
75.2%
79.0%
32.3%
68.3%
75.6%
81.4%
30.6%
59.0%
74.0%
84.1%
26.0%
69.8%
64.3%
72.5%
49.4%
0% 20% 40% 60% 80% 100%
Talking to my advisor
Using the library
Walking alone across campus at night
Walking into the food court by myself
Hanging out in the Student Center
Black White Other
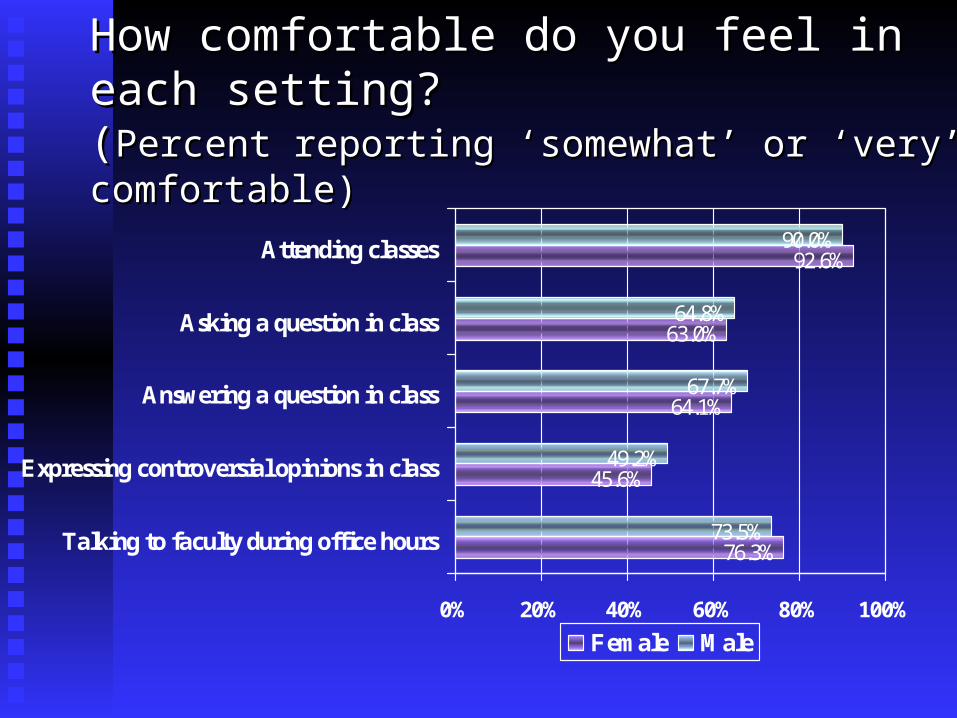
How comfortable do you feel in each setting?How comfortable do you feel in each setting?((Percent reporting ‘somewhat’ or ‘very’ comfortable)Percent reporting ‘somewhat’ or ‘very’ comfortable)
76.3%
45.6%
64.1%
63.0%
73.5%
49.2%
67.7%
64.8%
90.0%92.6%
0% 20% 40% 60% 80% 100%
Talking to faculty during office hours
Expressing controversial opinions in class
Answering a question in class
Asking a question in class
Attending classes
Female Male
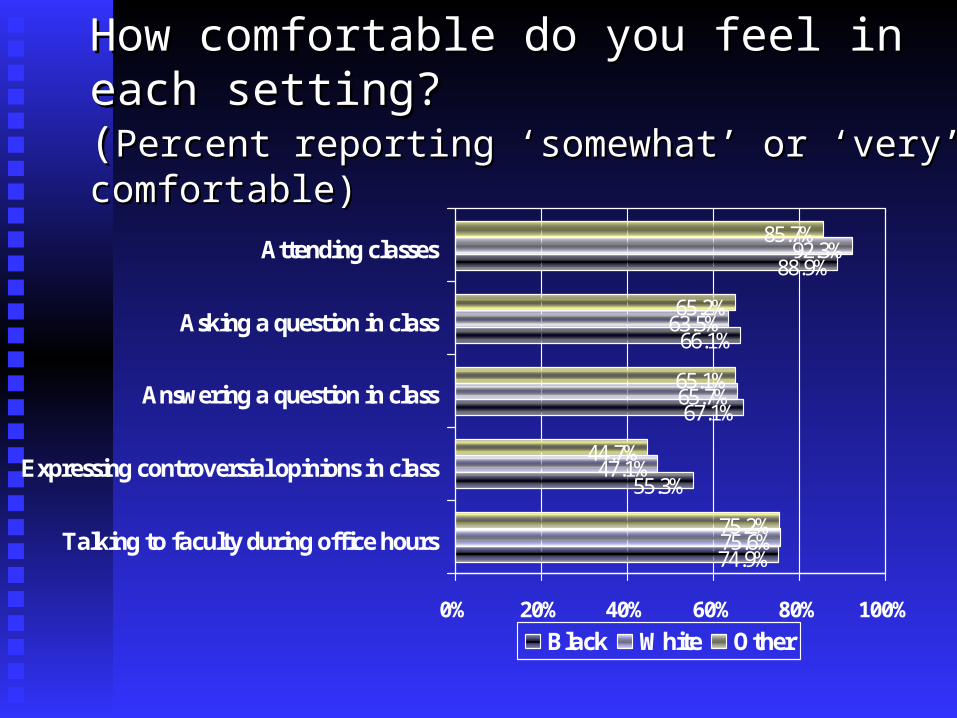
How comfortable do you feel in each setting?How comfortable do you feel in each setting?((Percent reporting ‘somewhat’ or ‘very’ comfortable)Percent reporting ‘somewhat’ or ‘very’ comfortable)
74.9%
55.3%
67.1%
66.1%
75.6%
47.1%
65.7%
63.5%
92.3%
75.2%
44.7%
65.1%
65.2%
85.7%
88.9%
0% 20% 40% 60% 80% 100%
Talking to faculty during office hours
Expressing controversial opinions in class
Answering a question in class
Asking a question in class
Attending classes
Black White Other
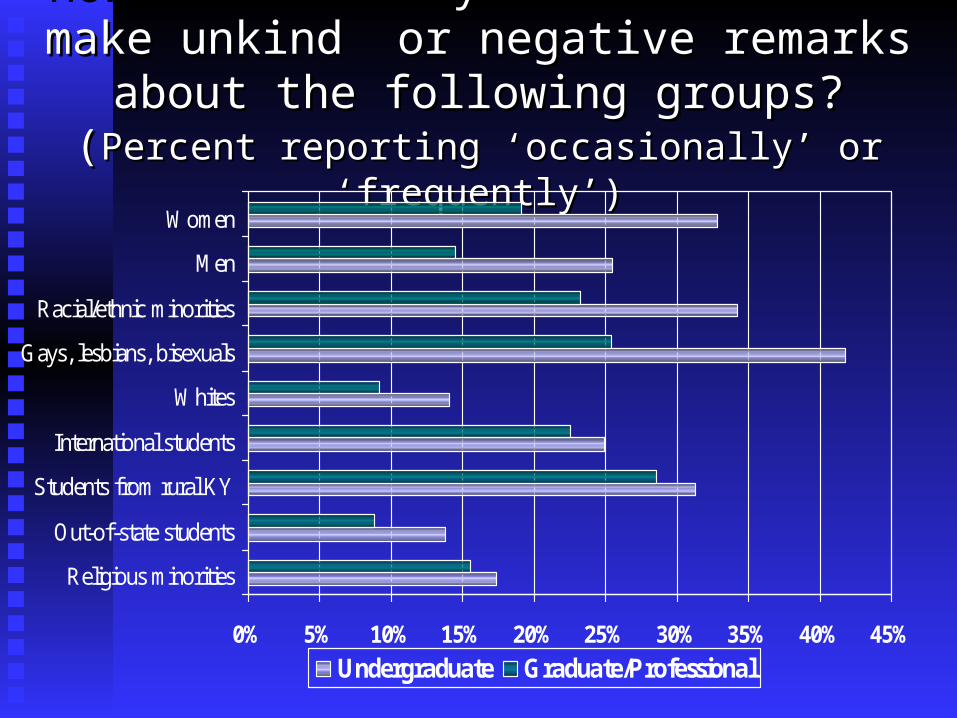
How often have you heard How often have you heard studentsstudents make unkind make unkind or negative remarks about the following groups?or negative remarks about the following groups?
((Percent reporting ‘occasionally’ or ‘frequently’)Percent reporting ‘occasionally’ or ‘frequently’)
0% 5% 10% 15% 20% 25% 30% 35% 40% 45%
Religious minorities
Out-of-state students
Students from rural KY
International students
Whites
Gays, lesbians, bisexuals
Racial/ethnic minorities
Men
Women
Undergraduate Graduate/Professional
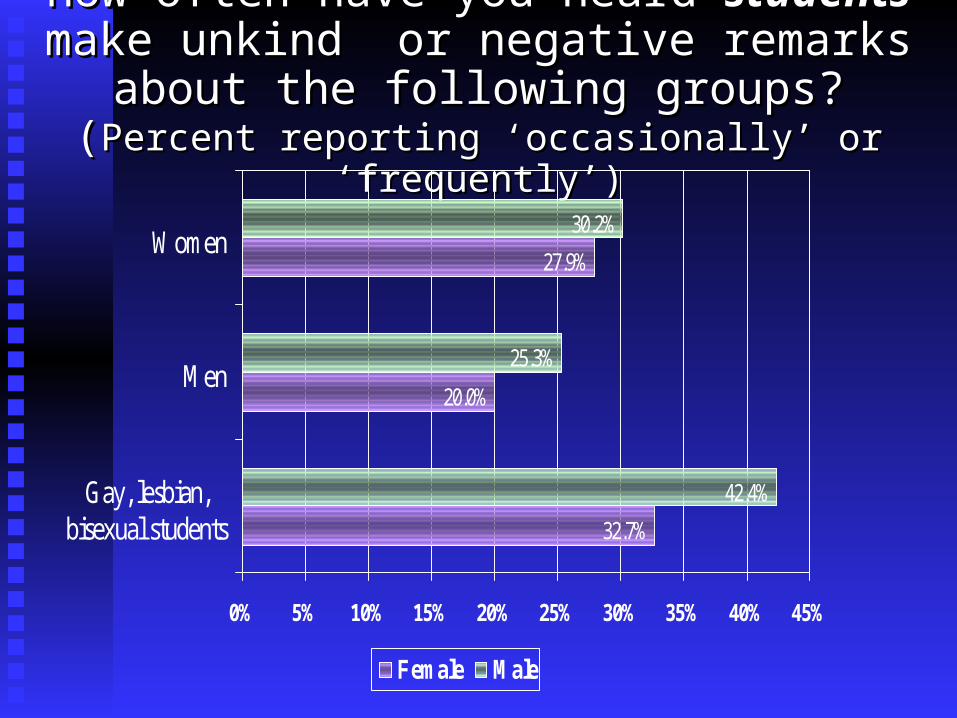
How often have you heard How often have you heard studentsstudents make unkind make unkind or negative remarks about the following groups?or negative remarks about the following groups?
((Percent reporting ‘occasionally’ or ‘frequently’)Percent reporting ‘occasionally’ or ‘frequently’)
32.7%
27.9%
42.4%
25.3%
30.2%
20.0%
0% 5% 10% 15% 20% 25% 30% 35% 40% 45%
Gay, lesbian,bisexual students
Men
Women
Female Male
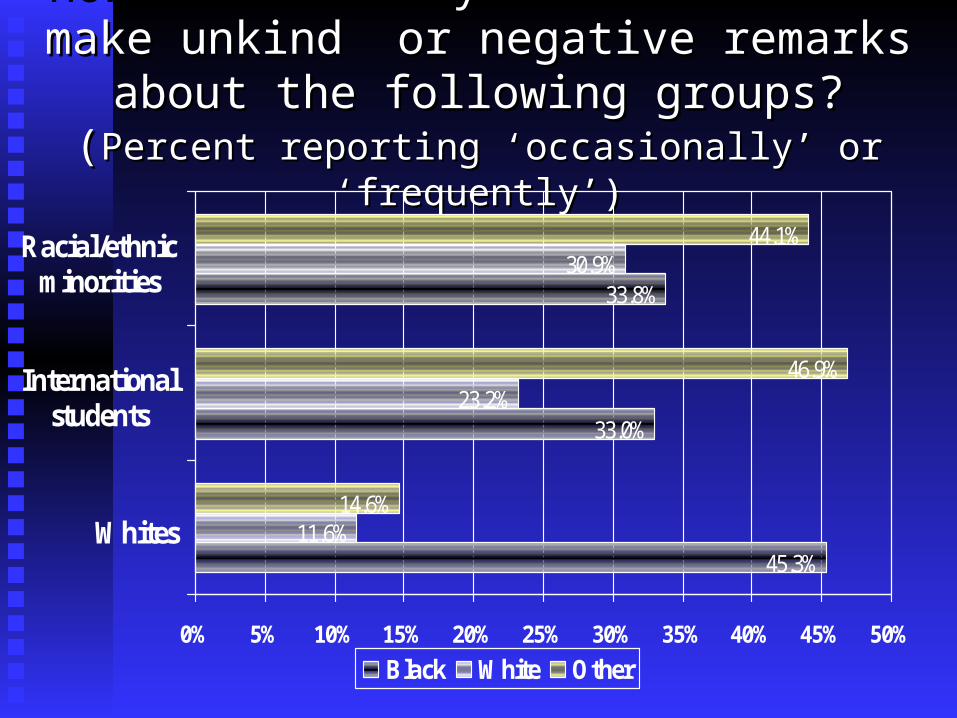
How often have you heard How often have you heard studentsstudents make unkind make unkind or negative remarks about the following groups?or negative remarks about the following groups?
((Percent reporting ‘occasionally’ or ‘frequently’)Percent reporting ‘occasionally’ or ‘frequently’)
45.3%
33.8%
11.6%
23.2%
30.9%
33.0%
14.6%
46.9%
44.1%
0% 5% 10% 15% 20% 25% 30% 35% 40% 45% 50%
Whites
Internationalstudents
Racial/ethnicminorities
Black White Other
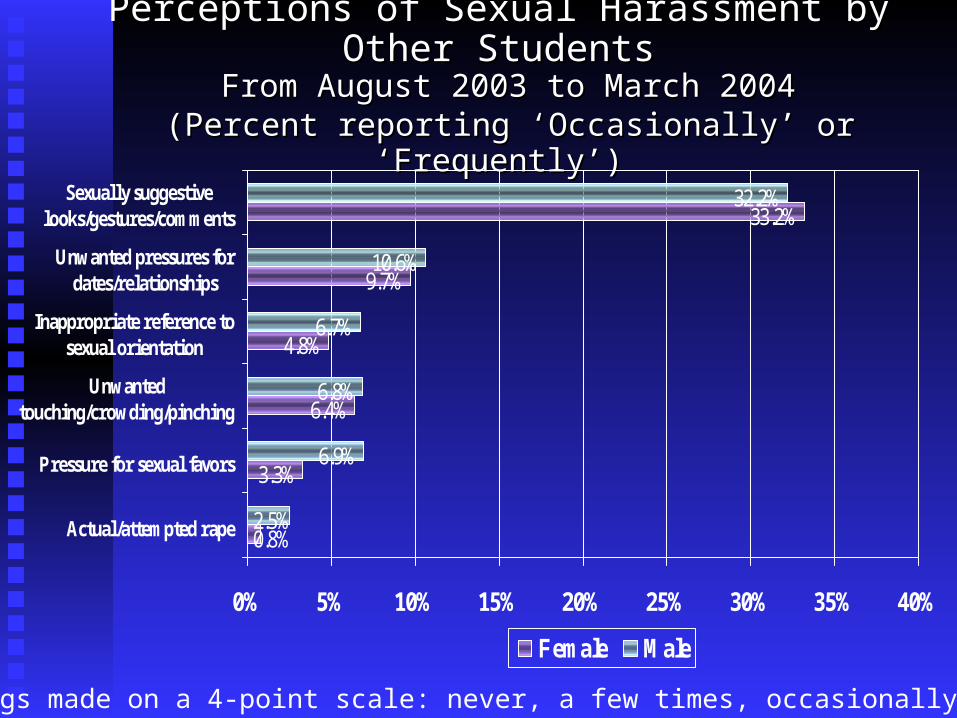
Perceptions of Sexual Harassment by Other StudentsPerceptions of Sexual Harassment by Other Students From August 2003 to March 2004 From August 2003 to March 2004
(Percent reporting ‘Occasionally’ or ‘Frequently’)(Percent reporting ‘Occasionally’ or ‘Frequently’)
0.8%
3.3%
6.4%
4.8%
9.7%
33.2%
2.5%
6.9%
6.8%
6.7%
10.6%
32.2%
0% 5% 10% 15% 20% 25% 30% 35% 40%
Actual/attempted rape
Pressure for sexual favors
Unwantedtouching/crowding/pinching
Inappropriate reference tosexual orientation
Unwanted pressures fordates/relationships
Sexually suggestivelooks/gestures/comments
Female Male
Note: ratings made on a 4-point scale: never, a few times, occasionally, frequently
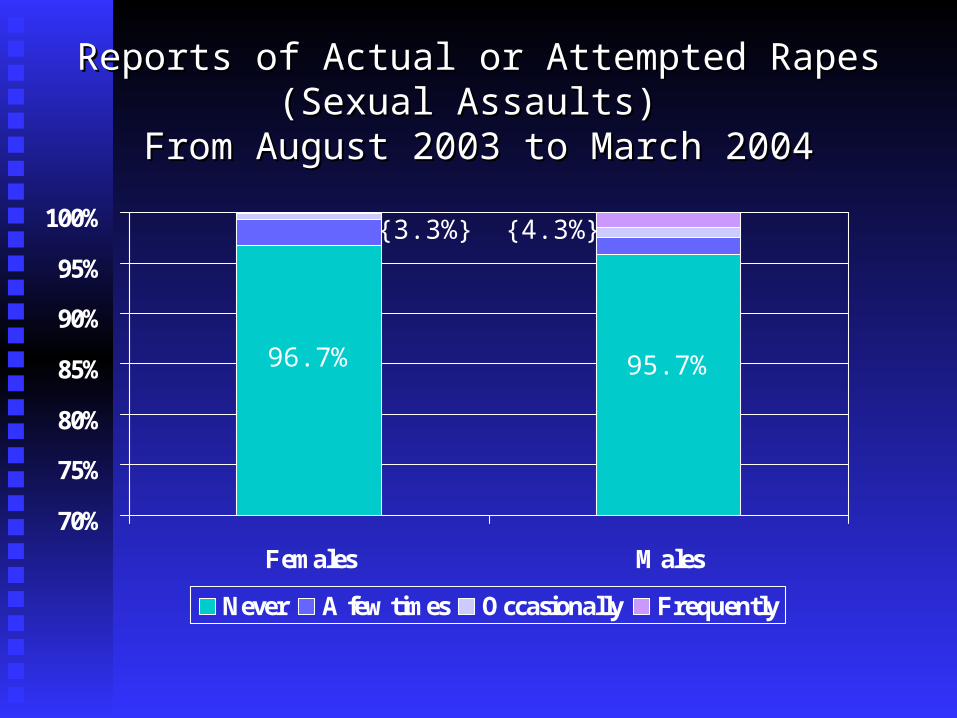
Reports of Actual or Attempted Rapes (Sexual Assaults) Reports of Actual or Attempted Rapes (Sexual Assaults) From August 2003 to March 2004From August 2003 to March 2004
70%
75%
80%
85%
90%
95%
100%
Females Males
Never A few times Occasionally Frequently
{3.3%} {4.3%}
95.7%96.7%
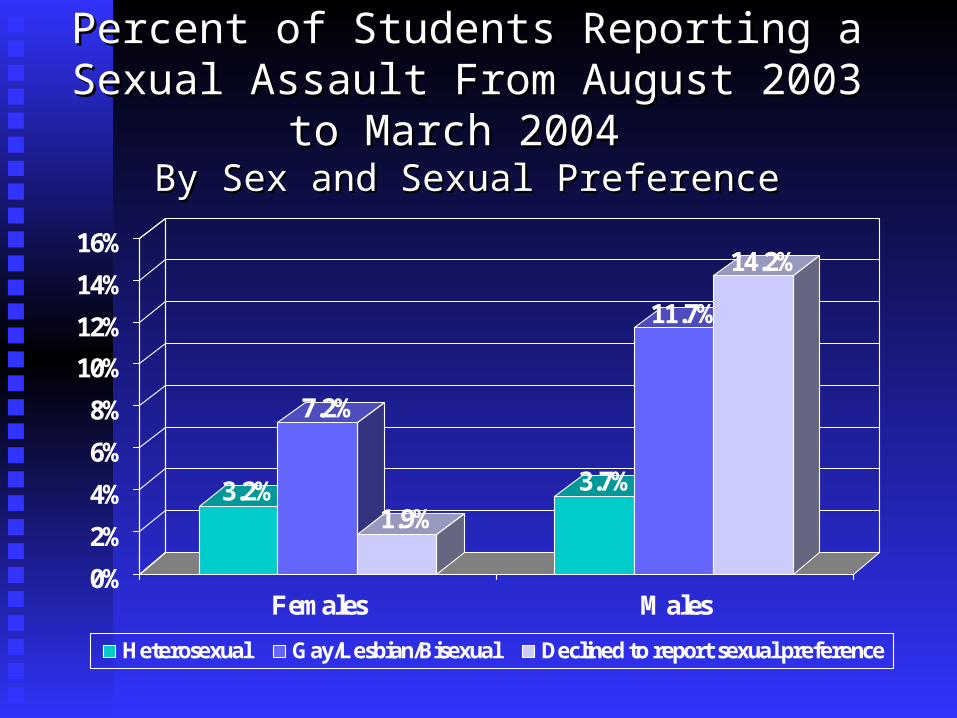
Percent of Students Reporting a Sexual Assault Percent of Students Reporting a Sexual Assault From August 2003 to March 2004 From August 2003 to March 2004
By Sex and Sexual PreferenceBy Sex and Sexual Preference
3.2%
7.2%
1.9%
3.7%
11.7%
14.2%
0%
2%
4%
6%
8%
10%
12%
14%
16%
Females Males
Heterosexual Gay/Lesbian/Bisexual Declined to report sexual preference
Selected Items Assessing Selected Items Assessing Racial and Ethnic RelationsRacial and Ethnic Relations
Campus race relations involve a complex set of Campus race relations involve a complex set of dynamics. Nuances in the perceived meaning of dynamics. Nuances in the perceived meaning of various survey items can produce seemingly various survey items can produce seemingly contradictory results.contradictory results.
How difficult is it to meet students of different races and ethnicities? Who do students interact with most on campus? Are there interracial/ethnic tensions in the classroom? How well do students of different races work together on class projects?
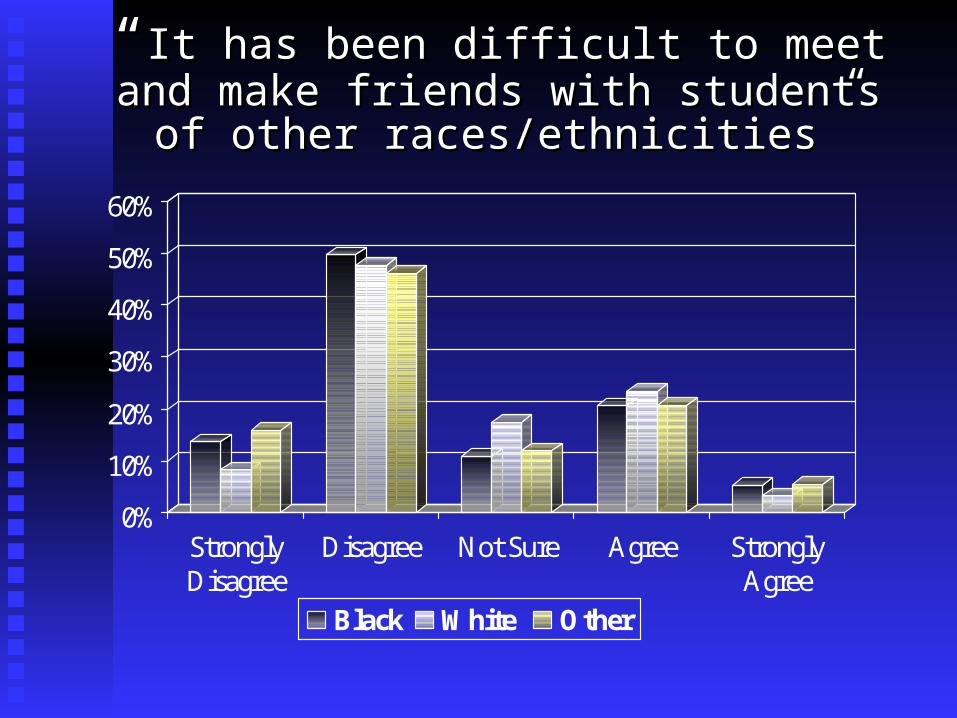
““It has been difficult to meet and make friends It has been difficult to meet and make friends with students of other races/ethnicities”with students of other races/ethnicities”
0%
10%
20%
30%
40%
50%
60%
StronglyDisagree
Disagree Not Sure Agree StronglyAgree
Black White Other
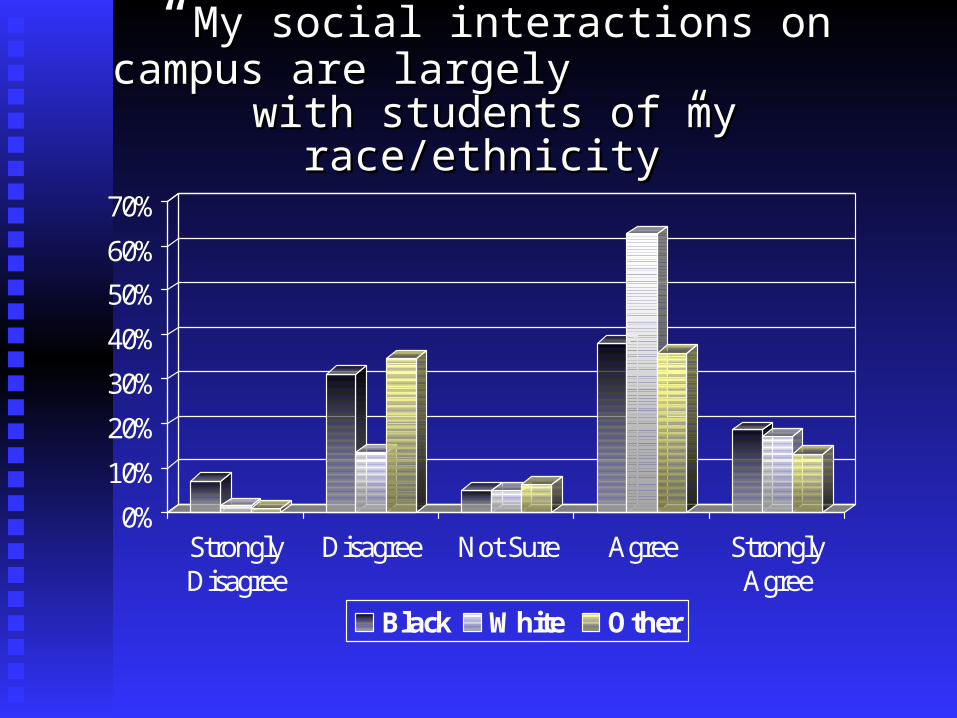
““My social interactions on campus are largely My social interactions on campus are largely with students of my race/ethnicity” with students of my race/ethnicity”
0%
10%
20%
30%
40%
50%
60%
70%
StronglyDisagree
Disagree Not Sure Agree StronglyAgree
Black White Other
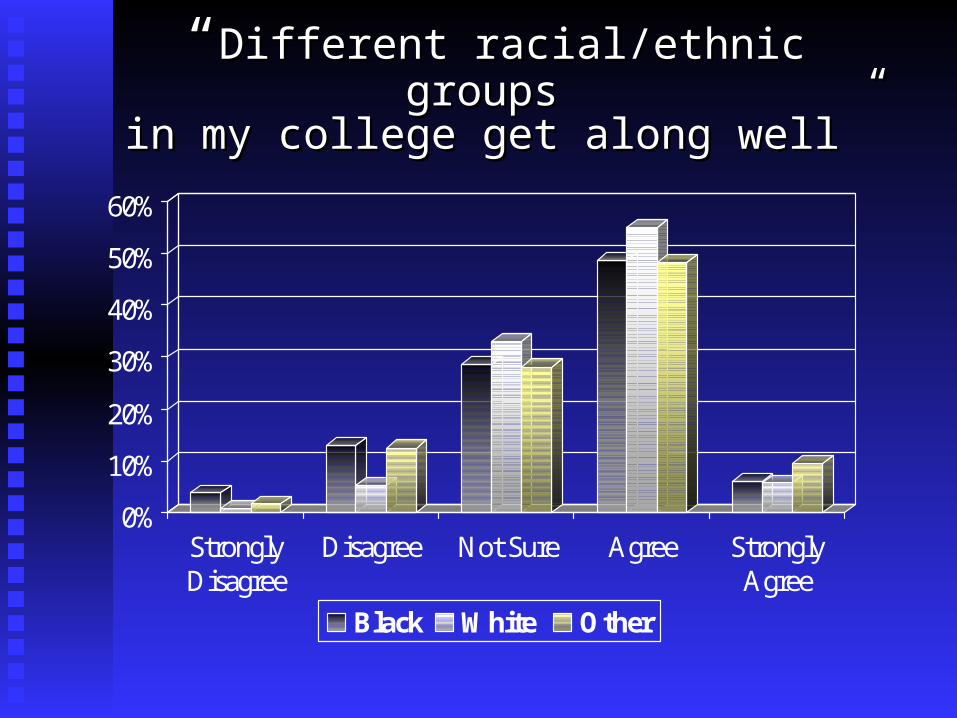
““Different racial/ethnic groups Different racial/ethnic groups in my college get along well”in my college get along well”
0%
10%
20%
30%
40%
50%
60%
StronglyDisagree
Disagree Not Sure Agree StronglyAgree
Black White Other
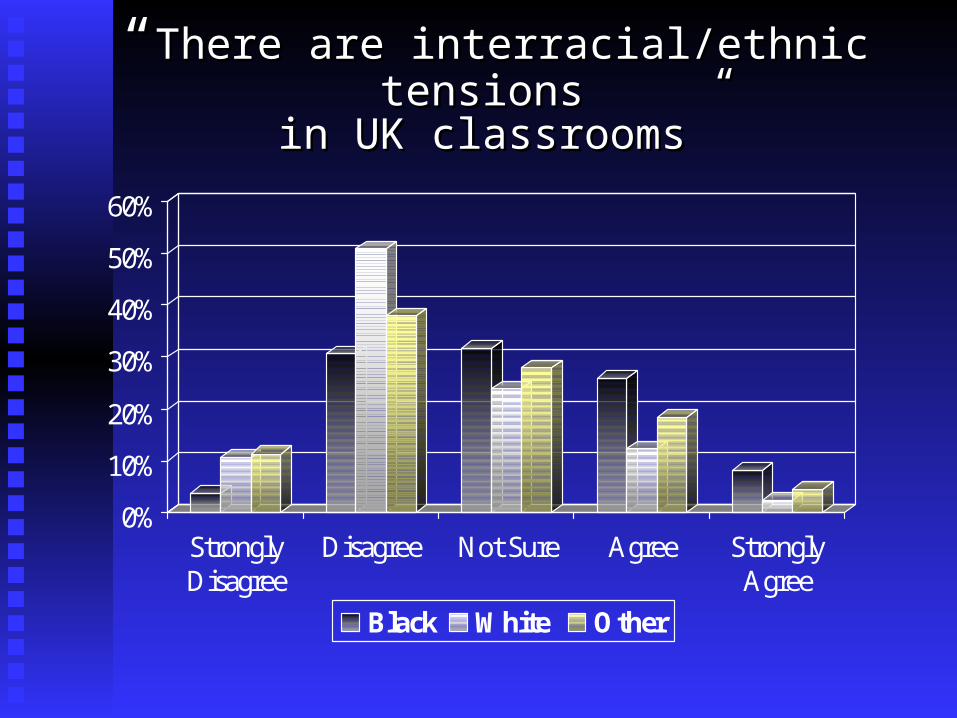
““There are interracial/ethnic tensions There are interracial/ethnic tensions in UK classrooms”in UK classrooms”
0%
10%
20%
30%
40%
50%
60%
StronglyDisagree
Disagree Not Sure Agree StronglyAgree
Black White Other
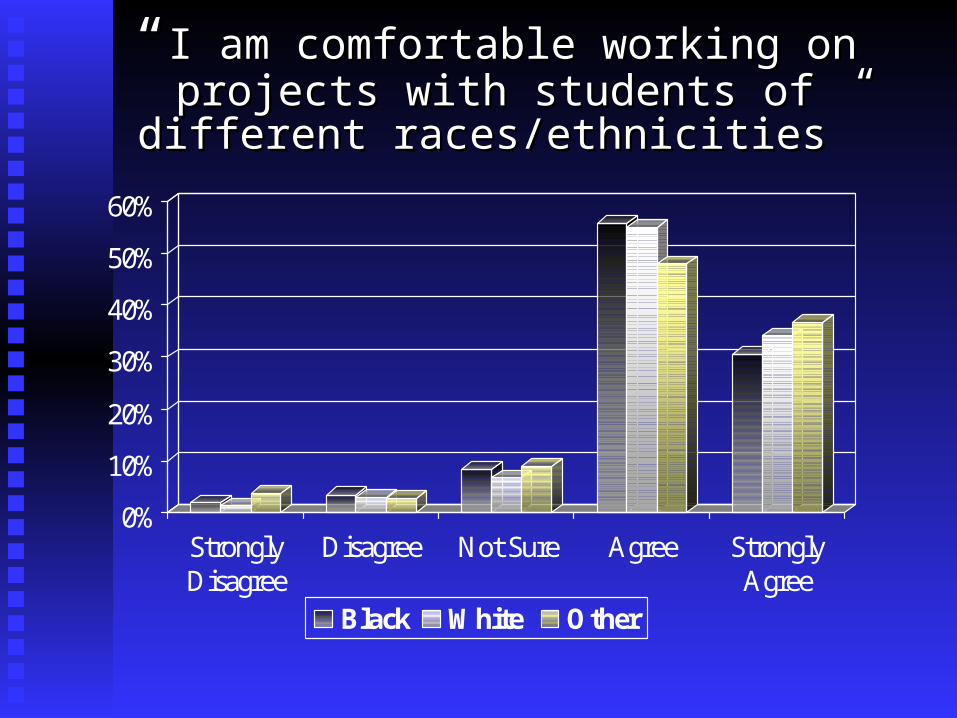
““I am comfortable working on projects with I am comfortable working on projects with students of different races/ethnicities”students of different races/ethnicities”
0%
10%
20%
30%
40%
50%
60%
StronglyDisagree
Disagree Not Sure Agree StronglyAgree
Black White Other
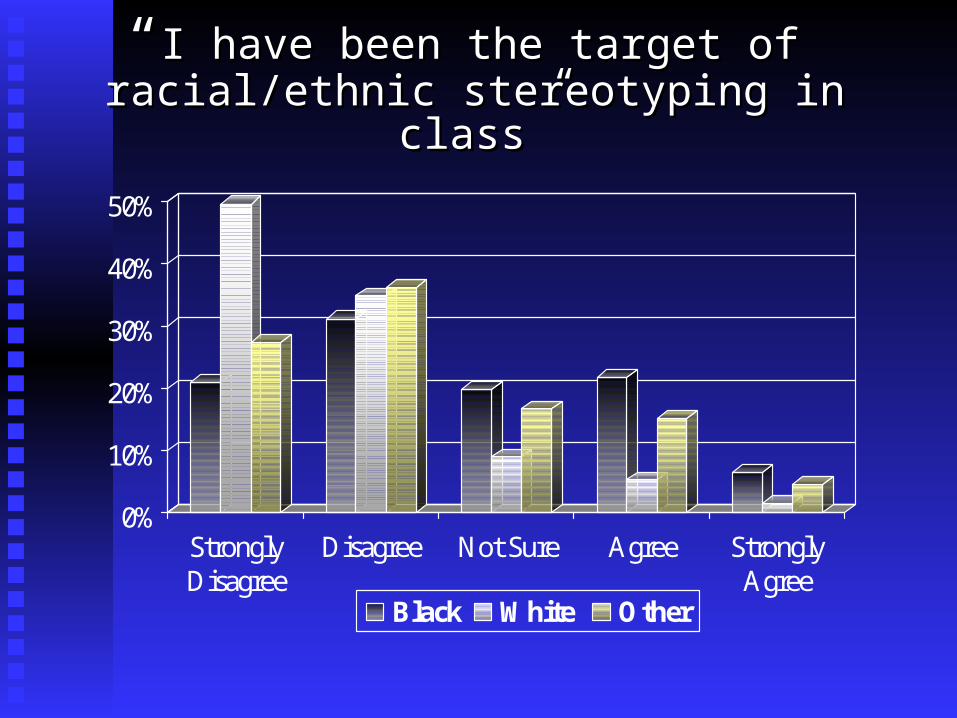
““I have been the target of I have been the target of racial/ethnic stereotyping in class”racial/ethnic stereotyping in class”
0%
10%
20%
30%
40%
50%
StronglyDisagree
Disagree Not Sure Agree StronglyAgree
Black White Other
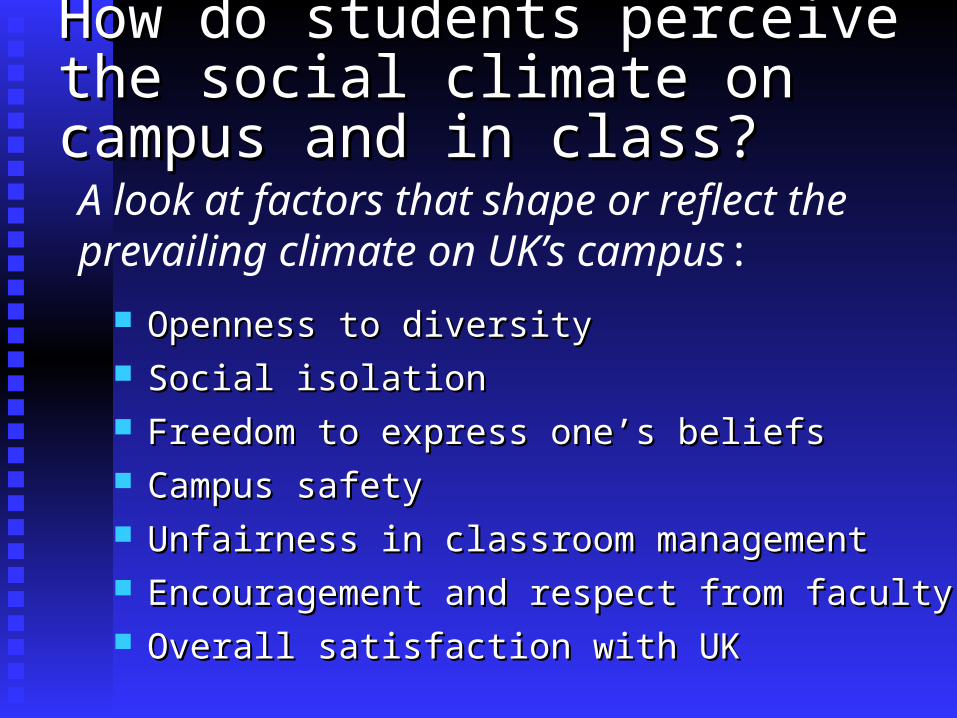
How do students perceive the social How do students perceive the social climate on campus and in class?climate on campus and in class?
Openness to diversityOpenness to diversity Social isolation Social isolation Freedom to express one’s beliefs Freedom to express one’s beliefs Campus safetyCampus safety Unfairness in classroom managementUnfairness in classroom management Encouragement and respect from facultyEncouragement and respect from faculty Overall satisfaction with UKOverall satisfaction with UK
A look at factors that shape or reflect the prevailing climate on UK’s campus:

Advantages of Using Scales Over Advantages of Using Scales Over Individual Survey ItemsIndividual Survey Items
Reduces a large pool of items to a smaller, Reduces a large pool of items to a smaller, manageable numbermanageable number
Minimizes the number of ‘chance’ findings Minimizes the number of ‘chance’ findings that can be expected that can be expected
Results in measures that are more reliableResults in measures that are more reliable Affords a clearer picture of students’ Affords a clearer picture of students’
standing on an underlying construct (e.g., standing on an underlying construct (e.g., feelings of social isolation, campus safety feelings of social isolation, campus safety concerns)concerns)
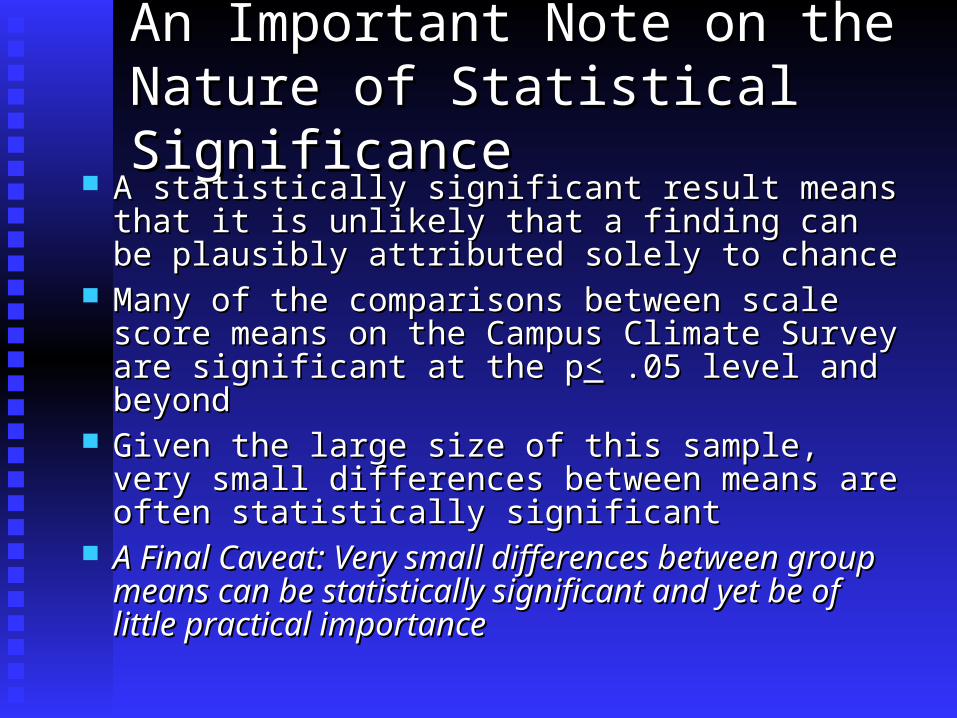
An Important Note on the Nature of An Important Note on the Nature of Statistical SignificanceStatistical Significance
A statistically significant result means that it is A statistically significant result means that it is unlikely that a finding can be plausibly attributed unlikely that a finding can be plausibly attributed solely to chancesolely to chance
Many of the comparisons between scale score Many of the comparisons between scale score means on the Campus Climate Survey are means on the Campus Climate Survey are significant at the psignificant at the p<< .05 level and beyond .05 level and beyond
Given the large size of this sample, very small Given the large size of this sample, very small differences between means are often statistically differences between means are often statistically significantsignificant
A Final Caveat: Very small differences between A Final Caveat: Very small differences between group means can be statistically significant and yet group means can be statistically significant and yet be of little practical importance be of little practical importance
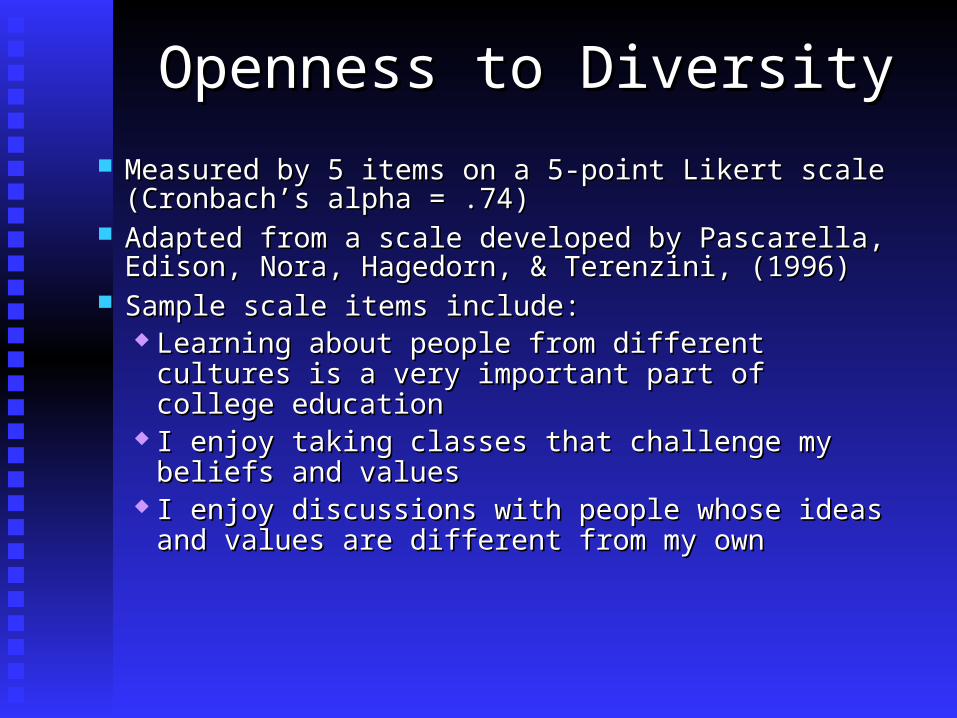
Openness to DiversityOpenness to Diversity
Measured by 5 items on a 5-point Likert scale Measured by 5 items on a 5-point Likert scale (Cronbach’s alpha = .74)(Cronbach’s alpha = .74)
Adapted from a scale developed by Pascarella, Edison, Adapted from a scale developed by Pascarella, Edison, Nora, Hagedorn, & Terenzini, (1996)Nora, Hagedorn, & Terenzini, (1996)
Sample scale items include:Sample scale items include: Learning about people from different cultures is a Learning about people from different cultures is a
very important part of college educationvery important part of college education I enjoy taking classes that challenge my beliefs and I enjoy taking classes that challenge my beliefs and
valuesvalues I enjoy discussions with people whose ideas and I enjoy discussions with people whose ideas and
values are different from my ownvalues are different from my own
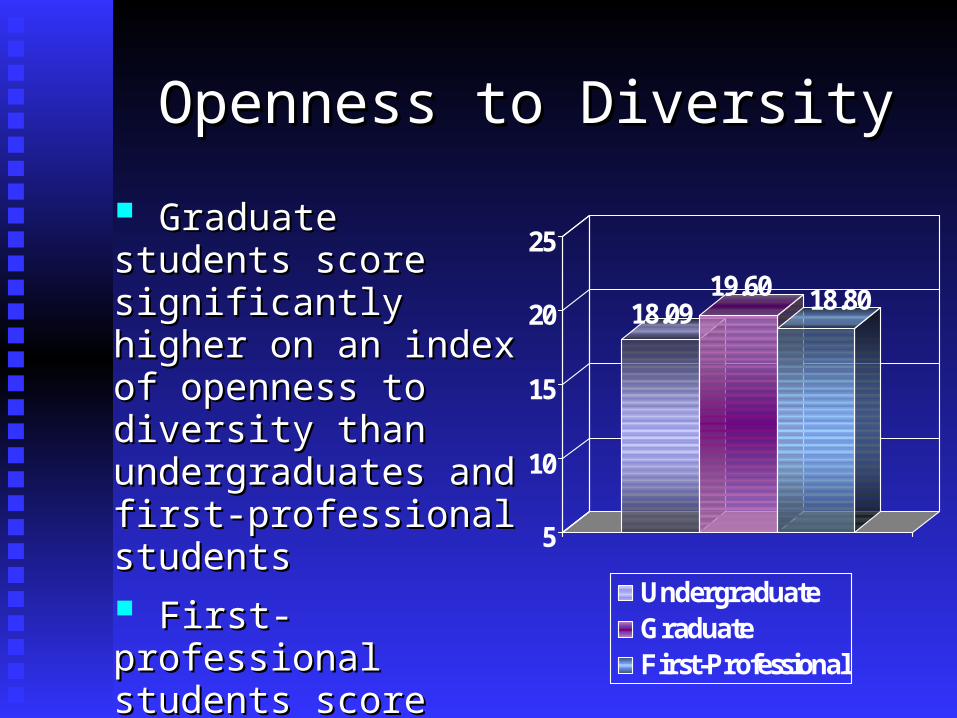
Openness to DiversityOpenness to Diversity
18.0919.60 18.80
5
10
15
20
25
UndergraduateGraduateFirst-Professional
Graduate students score Graduate students score significantly higher on an significantly higher on an index of openness to index of openness to diversity than diversity than undergraduates and first-undergraduates and first-professional studentsprofessional students
First-professional First-professional students score higher on students score higher on this index than this index than undergraduatesundergraduates
Openness to DiversityOpenness to Diversity
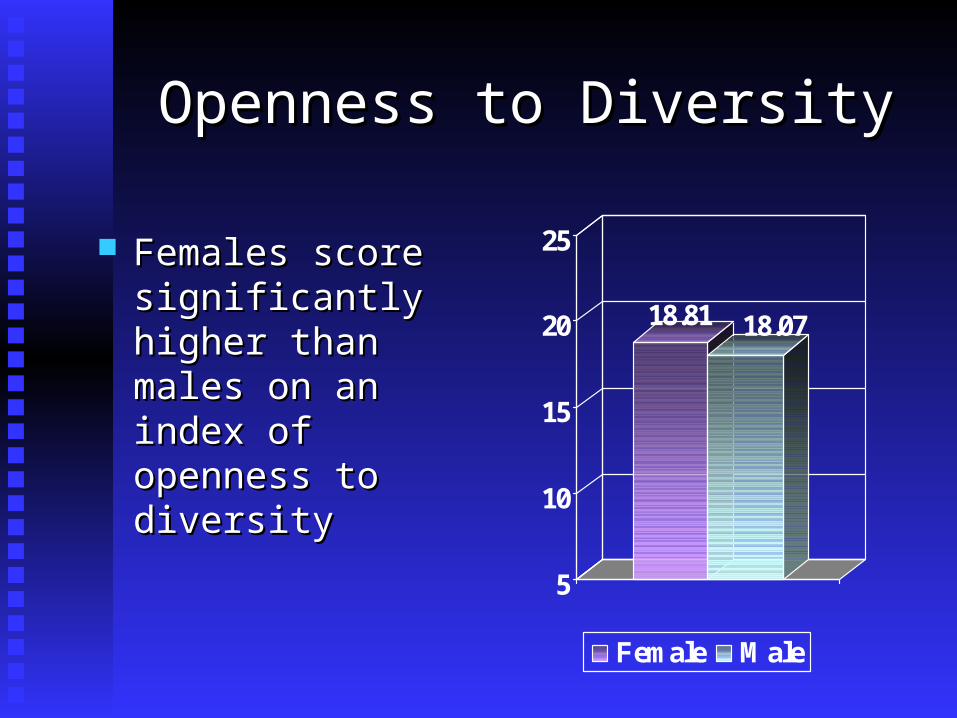
Females score Females score significantly higher than significantly higher than males on an index of males on an index of openness to diversityopenness to diversity
18.81 18.07
5
10
15
20
25
Female Male
Openness to DiversityOpenness to Diversity
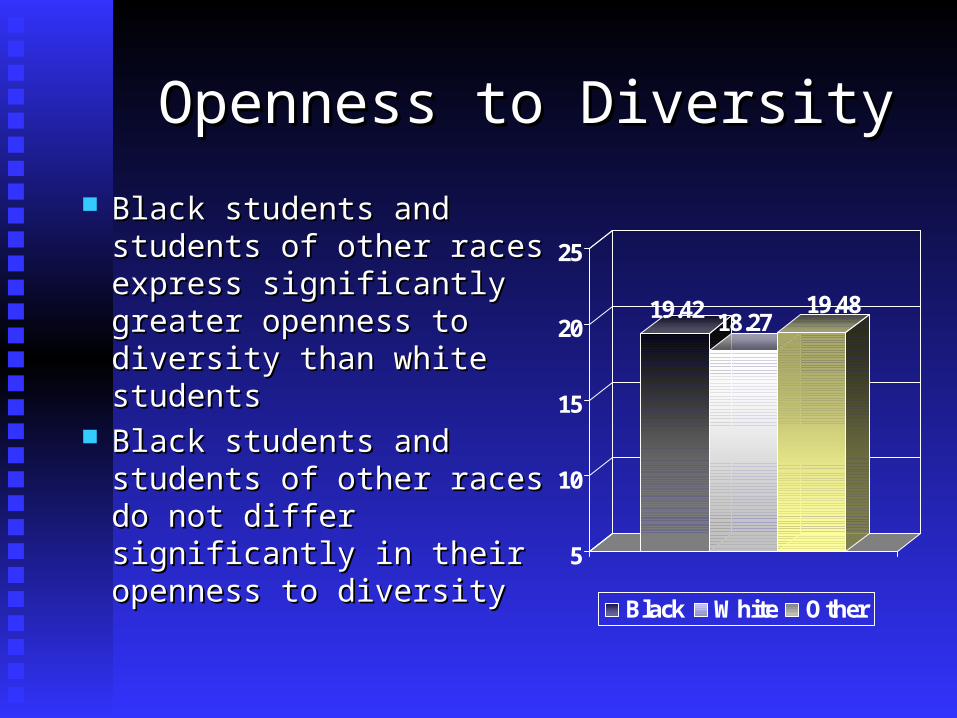
Black students and students Black students and students of other races express of other races express significantly greater significantly greater openness to diversity than openness to diversity than white studentswhite students
Black students and students Black students and students of other races do not differ of other races do not differ significantly in their significantly in their openness to diversityopenness to diversity
19.42 18.2719.48
5
10
15
20
25
Black White Other
Perceived Freedom to Express Perceived Freedom to Express Opinions and BeliefsOpinions and Beliefs
Measured by 3 items (Cronbach’s alpha = .71)Measured by 3 items (Cronbach’s alpha = .71) Sample scale items include:Sample scale items include:
Students are able to express freely their Students are able to express freely their opinions on this campusopinions on this campus
The university provides an environment for the The university provides an environment for the free and open expression of ideas, opinions, and free and open expression of ideas, opinions, and beliefsbeliefs
During the past year, how often have you felt During the past year, how often have you felt safe to express your views and opinionssafe to express your views and opinions
Perceived Freedom to Express Perceived Freedom to Express Opinions and BeliefsOpinions and Beliefs
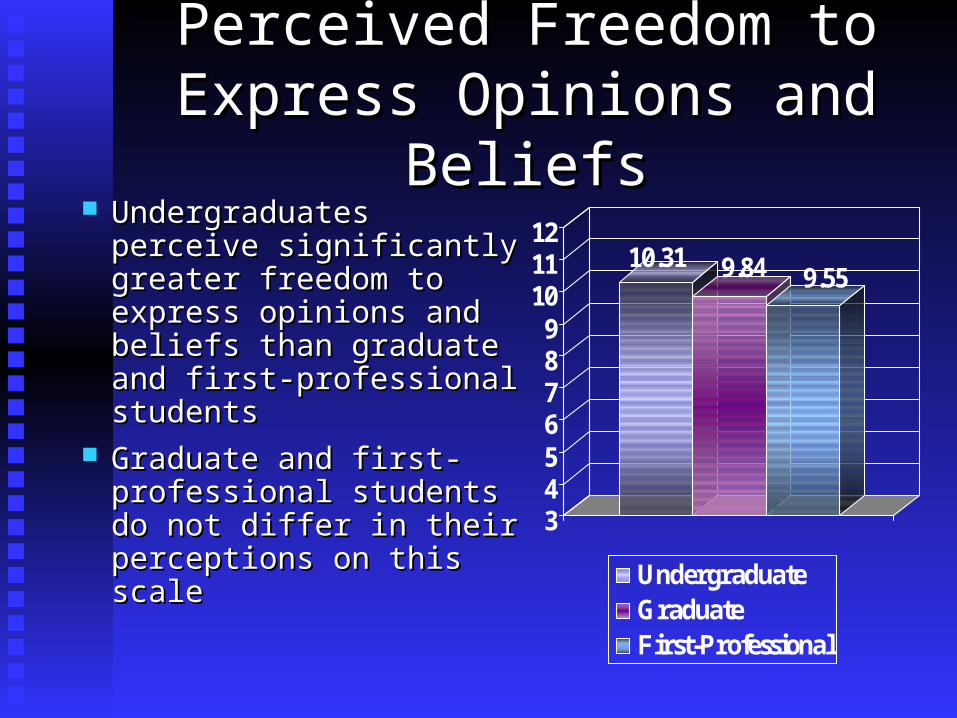
Undergraduates perceive Undergraduates perceive significantly greater significantly greater freedom to express freedom to express opinions and beliefs than opinions and beliefs than graduate and first-graduate and first-professional studentsprofessional students
Graduate and first-Graduate and first-professional students do professional students do not differ in their not differ in their perceptions on this scale perceptions on this scale
10.31 9.84 9.55
3456789
101112
UndergraduateGraduateFirst-Professional
Perceived Freedom to Express Perceived Freedom to Express Opinions and BeliefsOpinions and Beliefs
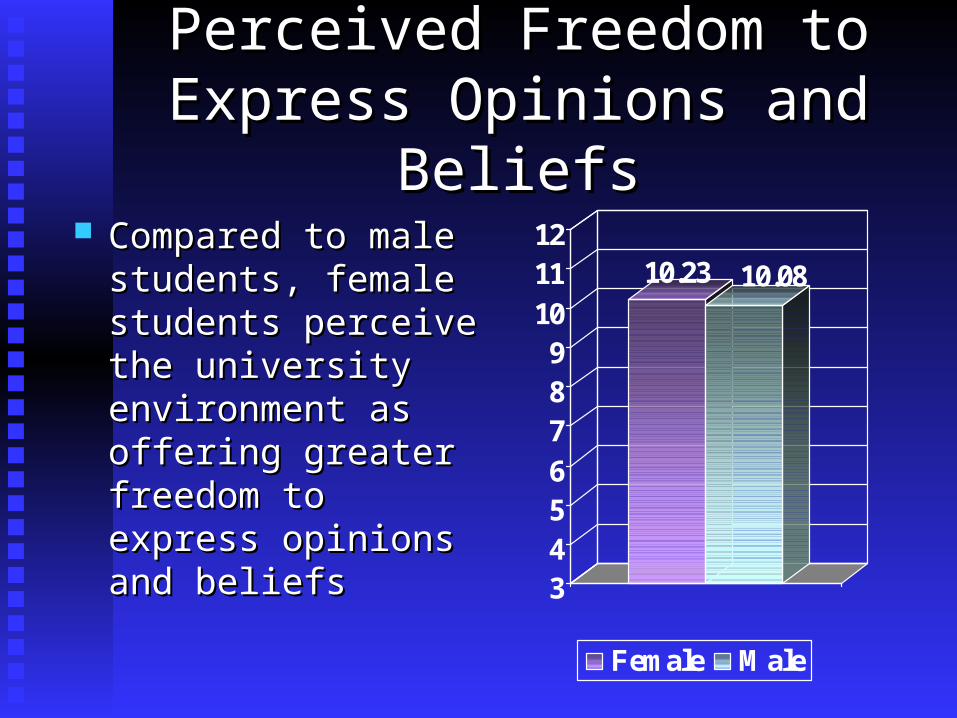
Compared to male Compared to male students, female students students, female students perceive the university perceive the university environment as offering environment as offering greater freedom to greater freedom to express opinions and express opinions and beliefsbeliefs
10.23 10.08
3456789
101112
Female Male
Perceived Freedom to Express Perceived Freedom to Express Opinions and BeliefsOpinions and Beliefs
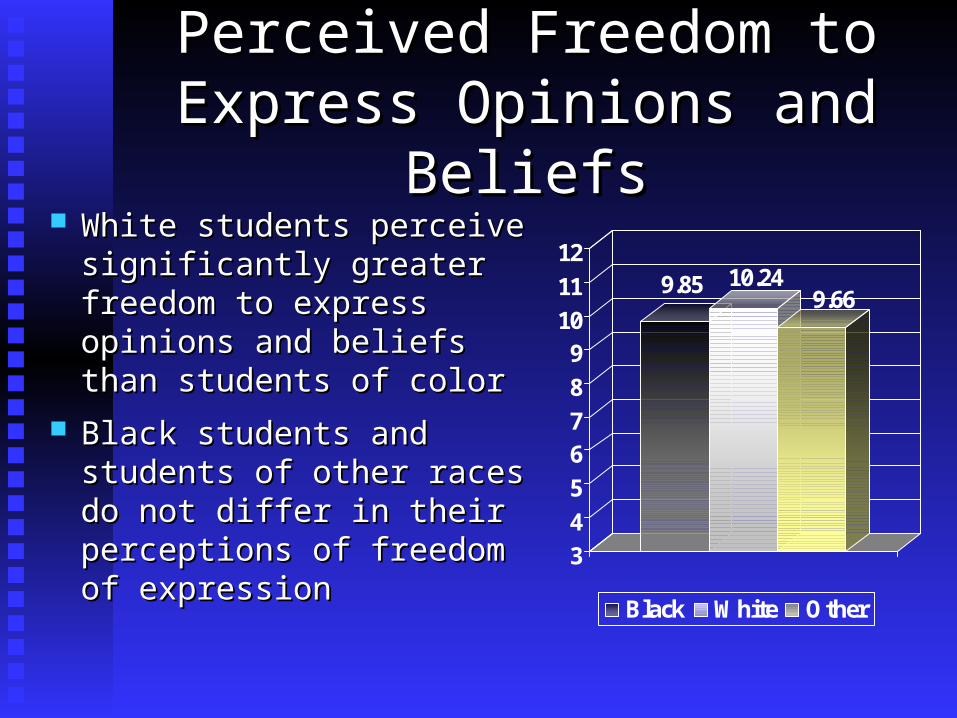
White students perceive White students perceive significantly greater freedom significantly greater freedom to express opinions and to express opinions and beliefs than students of colorbeliefs than students of color
Black students and students Black students and students of other races do not differ in of other races do not differ in their perceptions of freedom their perceptions of freedom of expressionof expression
9.85 10.249.66
3
4
5
67
8
910
11
12
Black White Other
Campus Safety ConcernsCampus Safety Concerns
Measured by 3 items (Cronbach’s alpha = .64)Measured by 3 items (Cronbach’s alpha = .64) Sample scale items include:Sample scale items include:
I am uncomfortable going places on campus by I am uncomfortable going places on campus by myself after darkmyself after dark
All students can feel safe on this campus All students can feel safe on this campus (reverse scored)(reverse scored)
How comfortable do you feel walking alone How comfortable do you feel walking alone across campus at night across campus at night (reverse scored)(reverse scored)
Campus Safety ConcernsCampus Safety Concerns
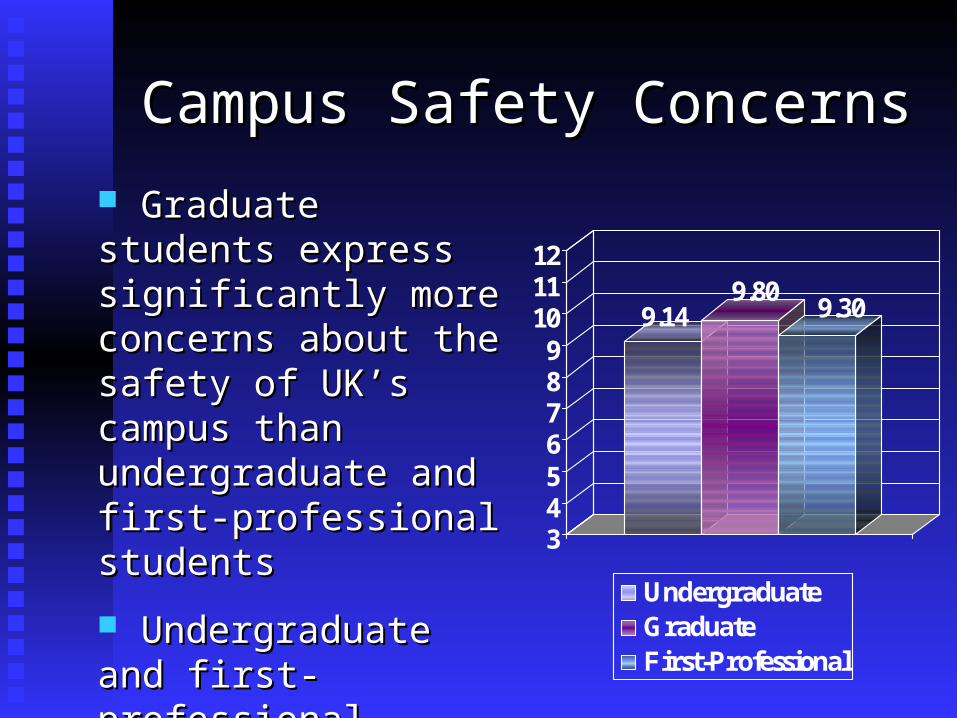
9.149.80
9.30
3456789
101112
UndergraduateGraduateFirst-Professional
Graduate students Graduate students express significantly more express significantly more concerns about the safety concerns about the safety of UK’s campus than of UK’s campus than undergraduate and first-undergraduate and first-professional studentsprofessional students
Undergraduate and first-Undergraduate and first-professional students do professional students do not differ in their level of not differ in their level of concerns about campus concerns about campus safetysafety
Campus Safety ConcernsCampus Safety Concerns
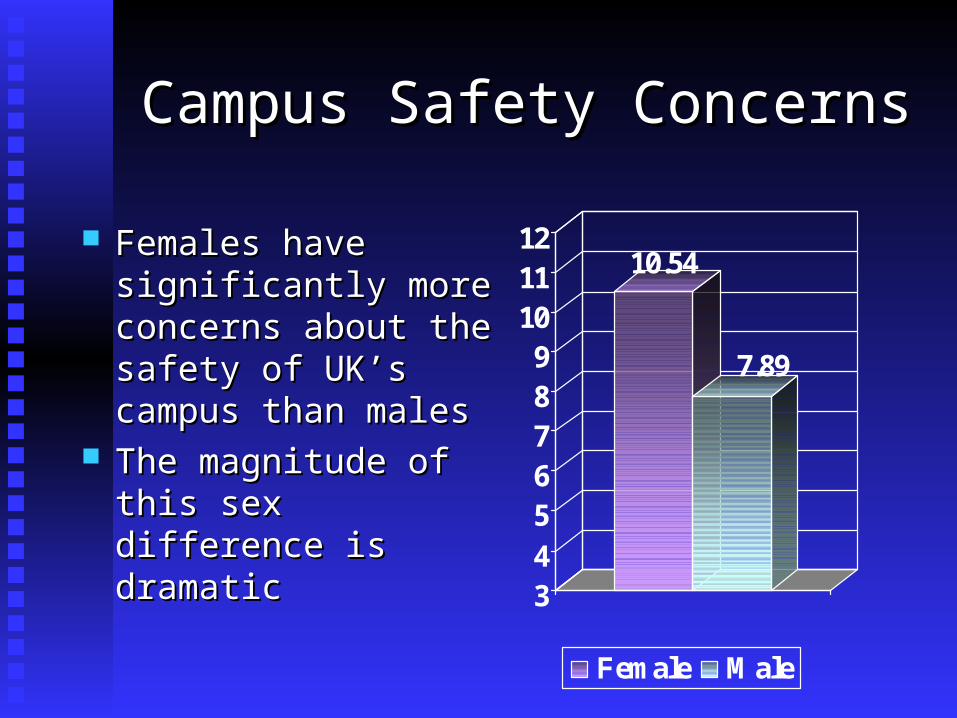
Females have Females have significantly more significantly more concerns about the safety concerns about the safety of UK’s campus than of UK’s campus than malesmales
The magnitude of this The magnitude of this sex difference is sex difference is dramaticdramatic
10.54
7.89
3456789
101112
Female Male
Feelings of Social IsolationFeelings of Social Isolation
Measured by 5 items on a scale Measured by 5 items on a scale (Cronbach’s alpha = .70)(Cronbach’s alpha = .70)
Sample scale items include:Sample scale items include: It is difficult to make female (male) It is difficult to make female (male)
friendsfriends During the past year, how often During the past year, how often
have you felt . . .have you felt . . .Isolated from othersIsolated from othersSupported by your friends Supported by your friends (reverse scored)(reverse scored)
Feelings of Social IsolationFeelings of Social Isolation
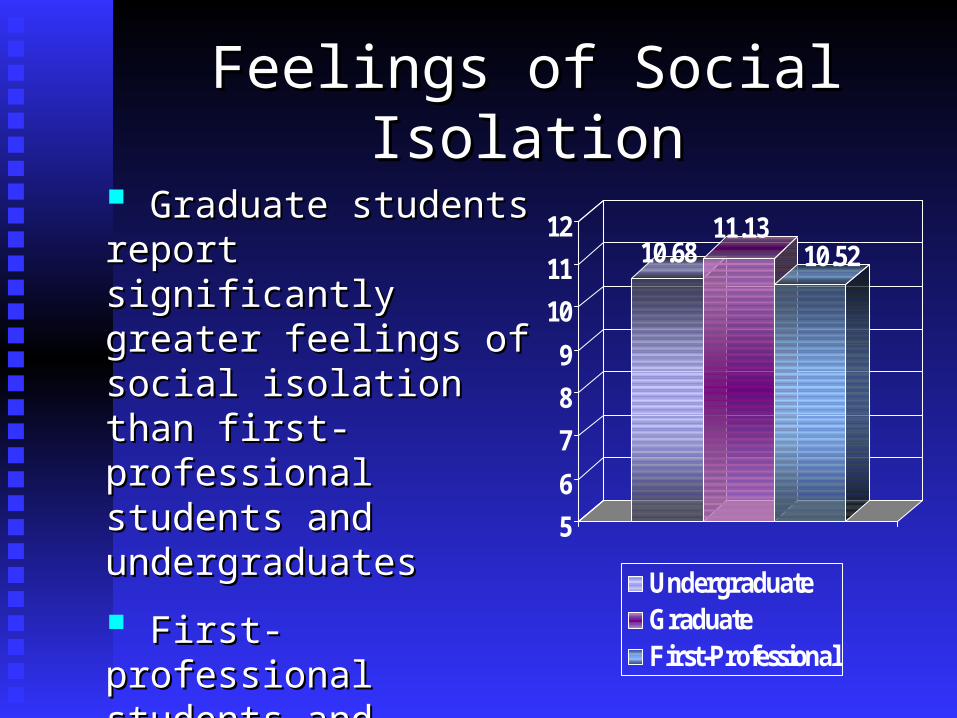
10.6811.13
10.52
5
6
7
8
9
10
11
12
UndergraduateGraduateFirst-Professional
Graduate students report Graduate students report significantly greater feelings significantly greater feelings of social isolation than first-of social isolation than first-professional students and professional students and undergraduatesundergraduates
First-professional students First-professional students and undergraduates do not and undergraduates do not differ significantly on this differ significantly on this indexindex
Feelings of Social IsolationFeelings of Social Isolation
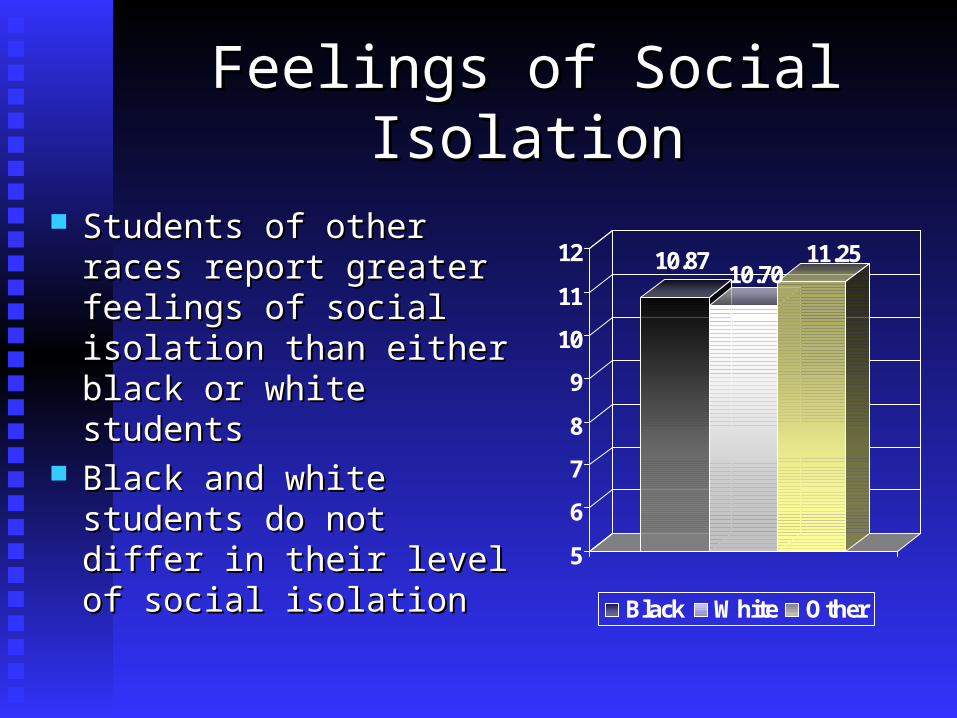
Students of other races report Students of other races report greater feelings of social greater feelings of social isolation than either black or isolation than either black or white studentswhite students
Black and white students do Black and white students do not differ in their level of not differ in their level of social isolationsocial isolation
10.8710.70
11.25
5
6
7
8
9
10
11
12
Black White Other
The Climate in the ClassroomThe Climate in the Classroom
Perceived encouragement and respect from Perceived encouragement and respect from faculty membersfaculty members
Perceived unfairness in classroom Perceived unfairness in classroom management management
Two dimensions of perceived faculty behavior were assessed:
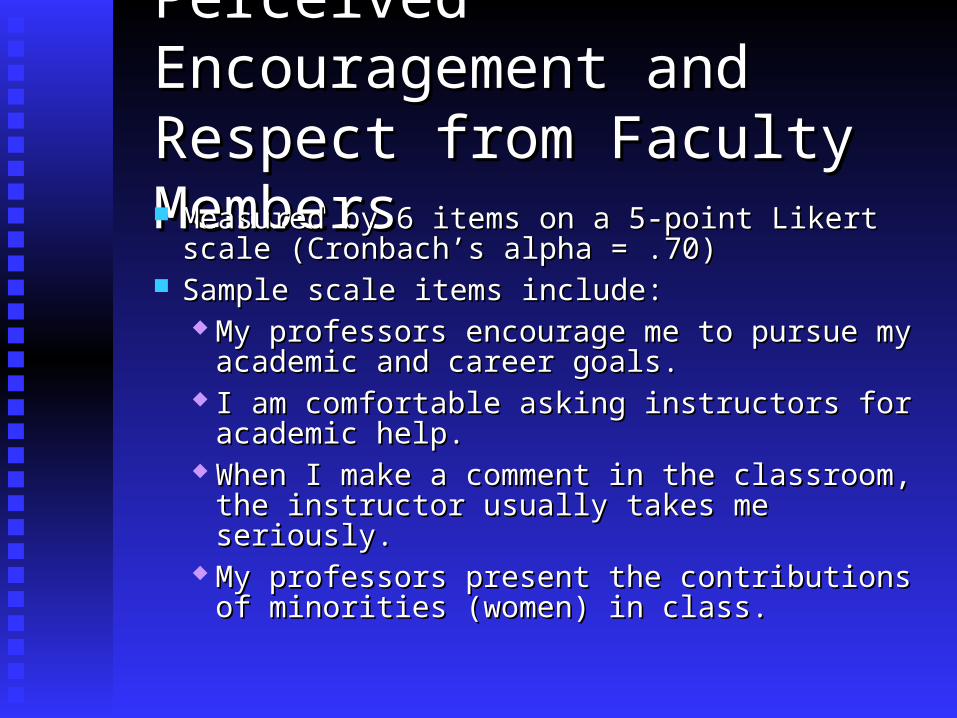
Perceived Encouragement and Perceived Encouragement and Respect from Faculty MembersRespect from Faculty Members Measured by 6 items on a 5-point Likert scale Measured by 6 items on a 5-point Likert scale
(Cronbach’s alpha = .70)(Cronbach’s alpha = .70) Sample scale items include:Sample scale items include:
My professors encourage me to pursue my academic My professors encourage me to pursue my academic and career goals.and career goals.
I am comfortable asking instructors for academic I am comfortable asking instructors for academic help.help.
When I make a comment in the classroom, the When I make a comment in the classroom, the instructor usually takes me seriously.instructor usually takes me seriously.
My professors present the contributions of minorities My professors present the contributions of minorities (women) in class.(women) in class.

Perceived Encouragement and Perceived Encouragement and Respect from FacultyRespect from Faculty
21.0022.52 22.25
68
1012141618202224
UndergraduateGraduateFirst-Professional
Graduate and first-Graduate and first-professional students professional students perceive faculty as offering perceive faculty as offering significantly more significantly more encouragement and respect encouragement and respect than undergraduatesthan undergraduates Graduate and first-Graduate and first-professional students do not professional students do not differ in their perceptions of differ in their perceptions of faculty on this dimensionfaculty on this dimension
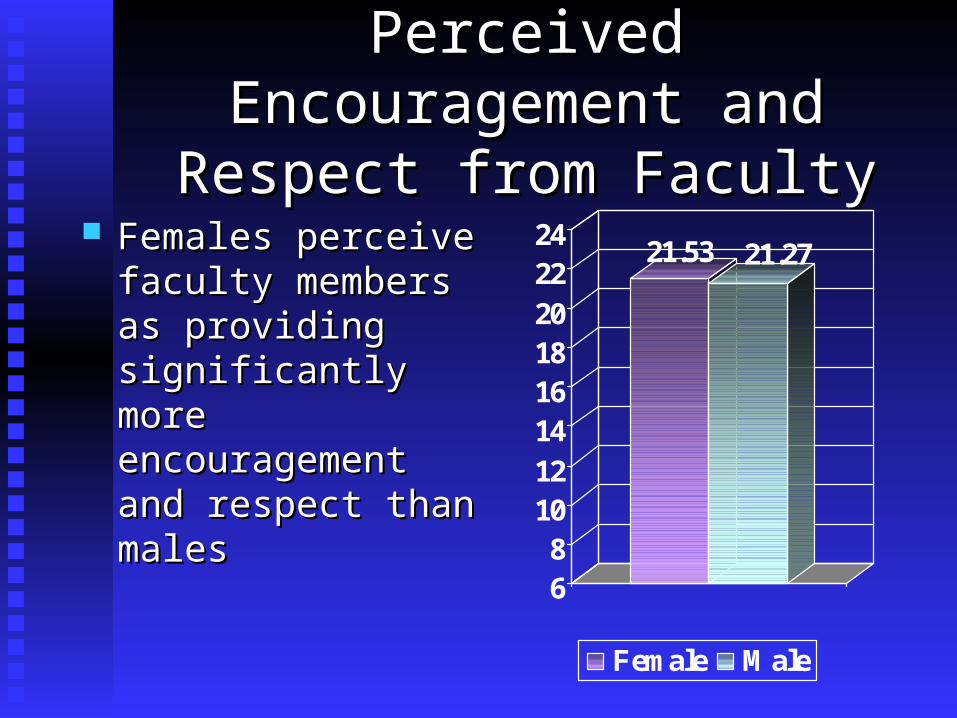
Perceived Encouragement and Perceived Encouragement and Respect from FacultyRespect from Faculty
Females perceive faculty Females perceive faculty members as providing members as providing significantly more significantly more encouragement and encouragement and respect than malesrespect than males
21.53 21.27
68
1012141618202224
Female Male
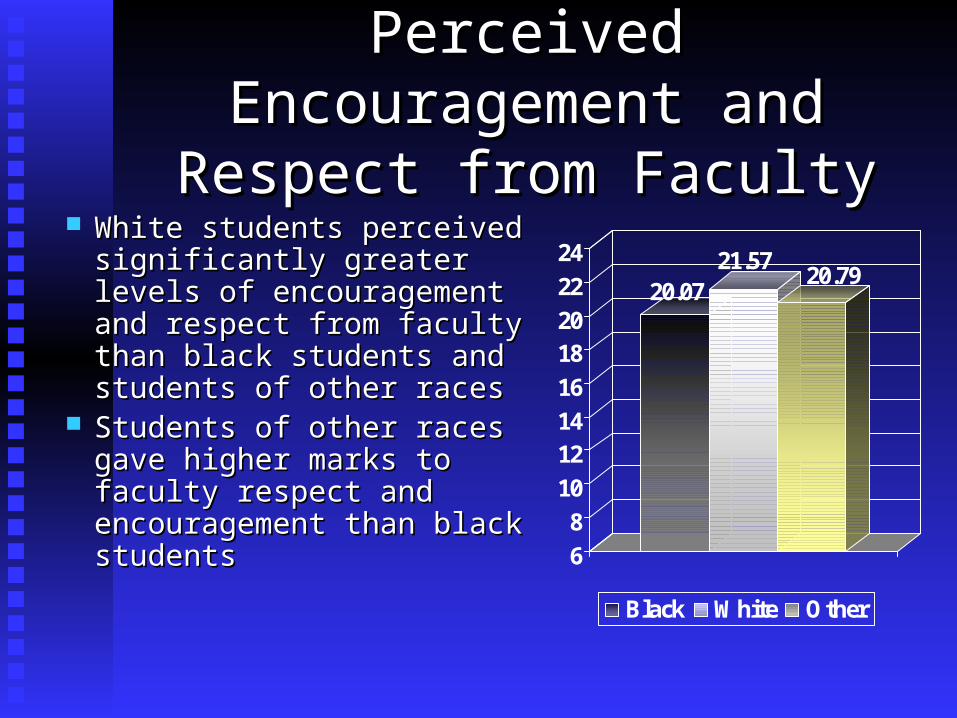
Perceived Encouragement and Perceived Encouragement and Respect from FacultyRespect from Faculty
White students perceived White students perceived significantly greater levels significantly greater levels of encouragement and of encouragement and respect from faculty than respect from faculty than black students and students black students and students of other racesof other races
Students of other races gave Students of other races gave higher marks to faculty higher marks to faculty respect and encouragement respect and encouragement than black studentsthan black students
20.0721.57
20.79
6
8
10
1214
16
1820
22
24
Black White Other
Perceived Unfairness in Perceived Unfairness in Classroom ManagementClassroom Management
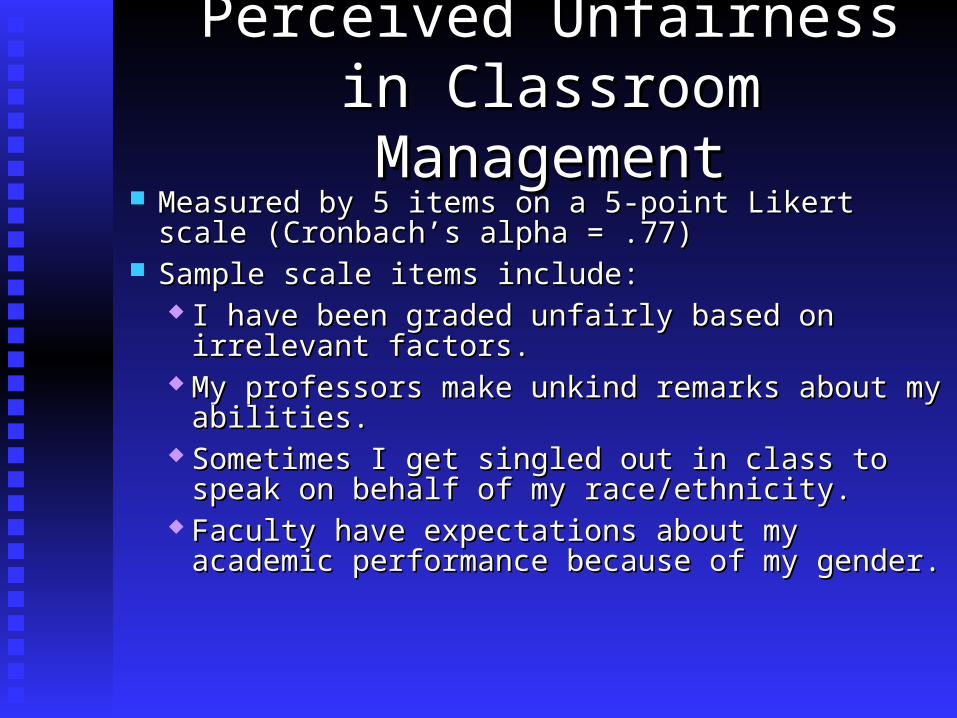
Measured by 5 items on a 5-point Likert scale Measured by 5 items on a 5-point Likert scale (Cronbach’s alpha = .77)(Cronbach’s alpha = .77)
Sample scale items include:Sample scale items include: I have been graded unfairly based on irrelevant factors.I have been graded unfairly based on irrelevant factors. My professors make unkind remarks about my My professors make unkind remarks about my
abilities.abilities. Sometimes I get singled out in class to speak on behalf Sometimes I get singled out in class to speak on behalf
of my race/ethnicity.of my race/ethnicity. Faculty have expectations about my academic Faculty have expectations about my academic
performance because of my gender.performance because of my gender.
Perceived Unfairness in Perceived Unfairness in Classroom ManagementClassroom Management
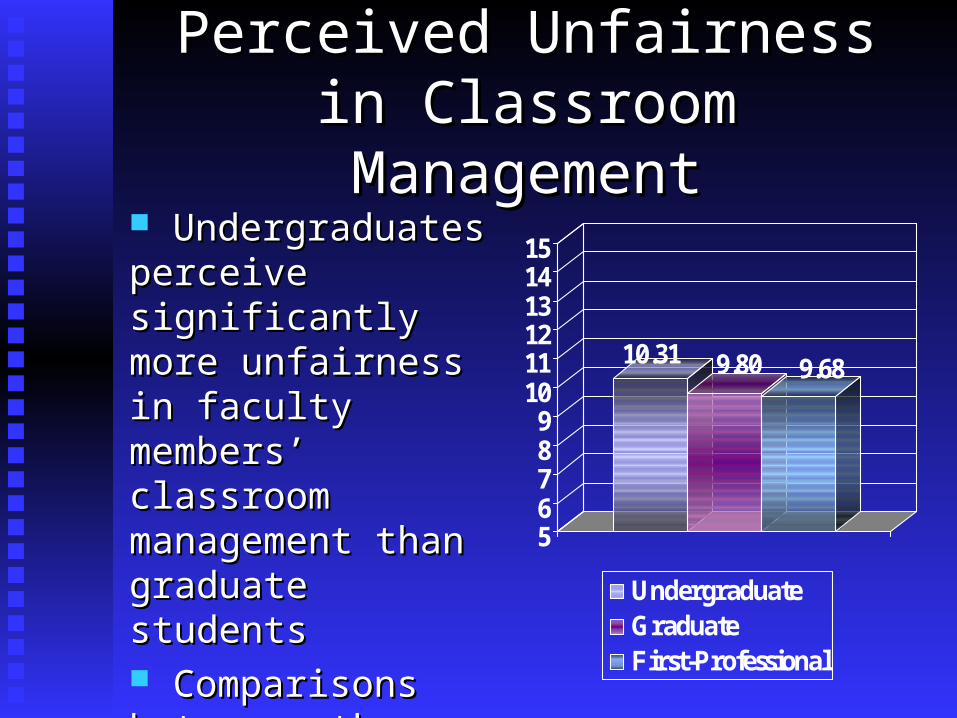
10.31 9.80 9.68
56789
101112131415
UndergraduateGraduateFirst-Professional
Undergraduates Undergraduates perceive significantly perceive significantly more unfairness in more unfairness in faculty members’ faculty members’ classroom management classroom management than graduate studentsthan graduate students Comparisons between Comparisons between other groups on this other groups on this scale were not scale were not significantsignificant
Perceived Unfairness in Perceived Unfairness in Classroom ManagementClassroom Management
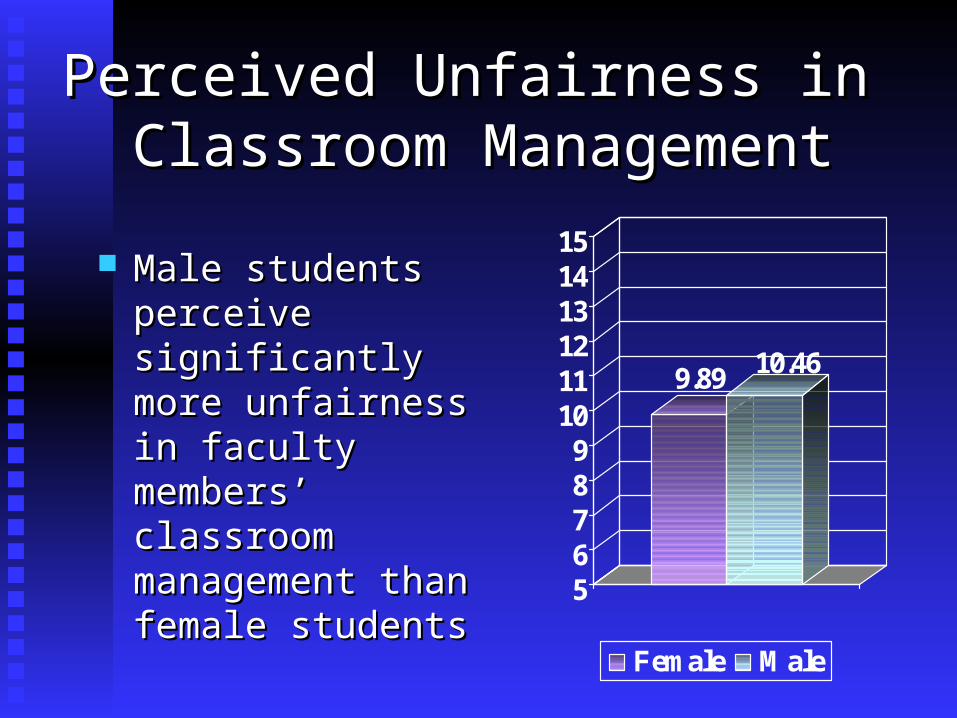
Male students perceive Male students perceive significantly more significantly more unfairness in faculty unfairness in faculty members’ classroom members’ classroom management than female management than female studentsstudents
9.89 10.46
56789
101112131415
Female Male
Perceived Unfairness in Perceived Unfairness in Classroom Management Classroom Management
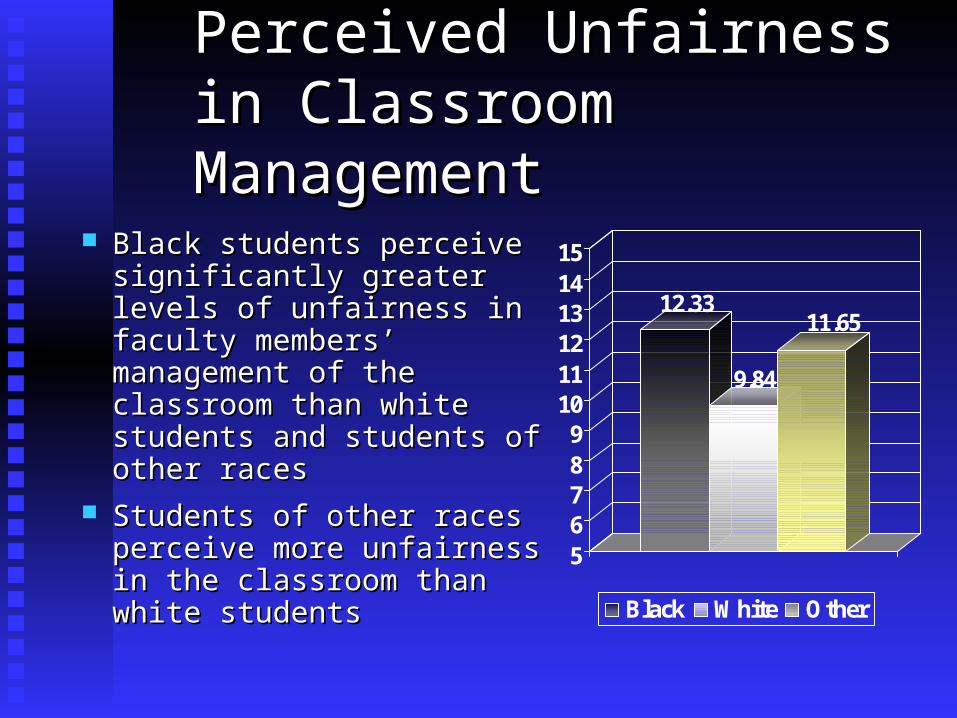
Black students perceive Black students perceive significantly greater levels of significantly greater levels of unfairness in faculty unfairness in faculty members’ management of the members’ management of the classroom than white students classroom than white students and students of other racesand students of other races
Students of other races Students of other races perceive more unfairness in perceive more unfairness in the classroom than white the classroom than white studentsstudents
12.33
9.84
11.65
56789
101112131415
Black White Other
Overall Satisfaction with Overall Satisfaction with The UK ExperienceThe UK Experience
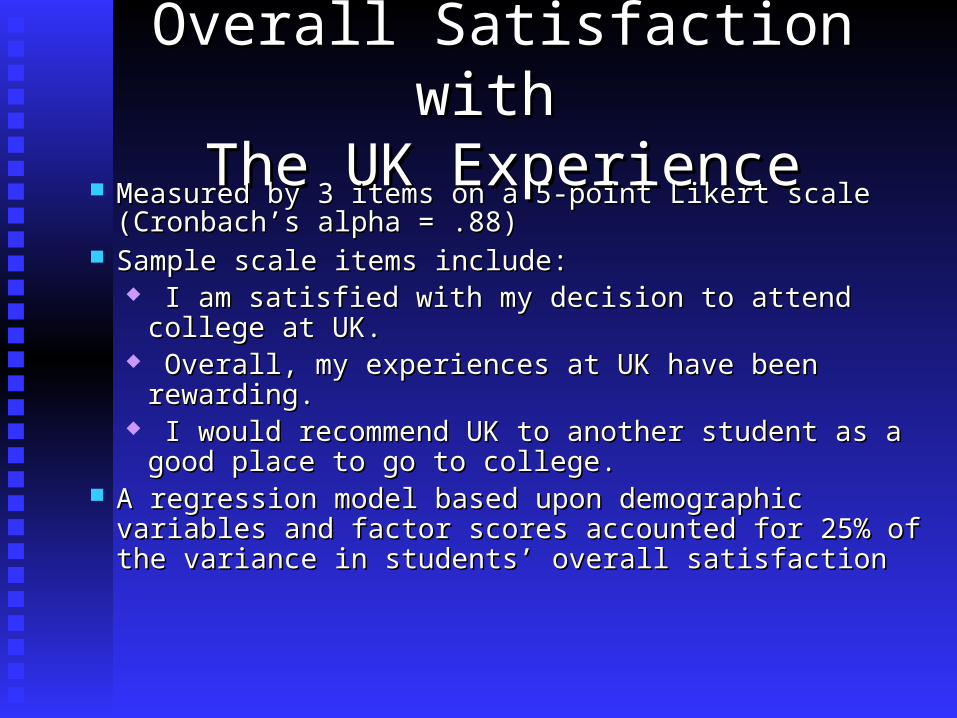
Measured by 3 items on a 5-point Likert scale (Cronbach’s Measured by 3 items on a 5-point Likert scale (Cronbach’s alpha = .88)alpha = .88)
Sample scale items include:Sample scale items include: I am satisfied with my decision to attend college at UK.I am satisfied with my decision to attend college at UK. Overall, my experiences at UK have been rewarding.Overall, my experiences at UK have been rewarding. I would recommend UK to another student as a good I would recommend UK to another student as a good
place to go to college.place to go to college. A regression model based upon demographic variables and A regression model based upon demographic variables and
factor scores accounted for 25% of the variance in students’ factor scores accounted for 25% of the variance in students’ overall satisfaction overall satisfaction
Overall Satisfaction with Overall Satisfaction with The UK ExperienceThe UK Experience
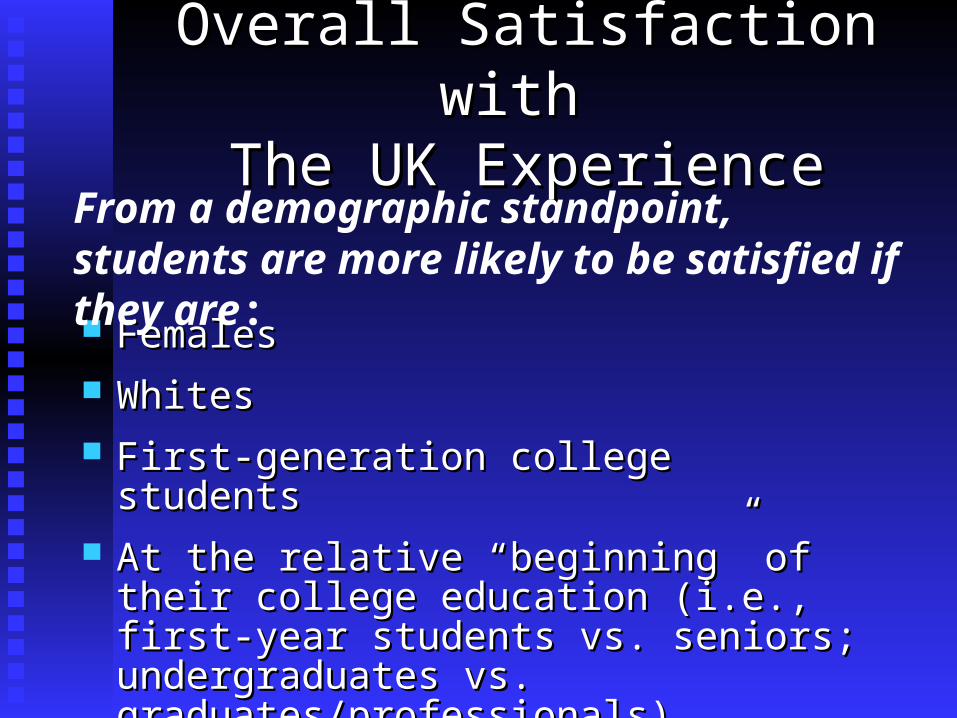
FemalesFemales WhitesWhites First-generation college studentsFirst-generation college students At the relative “beginning” of their college At the relative “beginning” of their college
education (i.e., first-year students vs. seniors; education (i.e., first-year students vs. seniors; undergraduates vs. graduates/professionals)undergraduates vs. graduates/professionals)
From a demographic standpoint, students are more likely to be satisfied if they are:
Overall Satisfaction with Overall Satisfaction with The UK ExperienceThe UK Experience
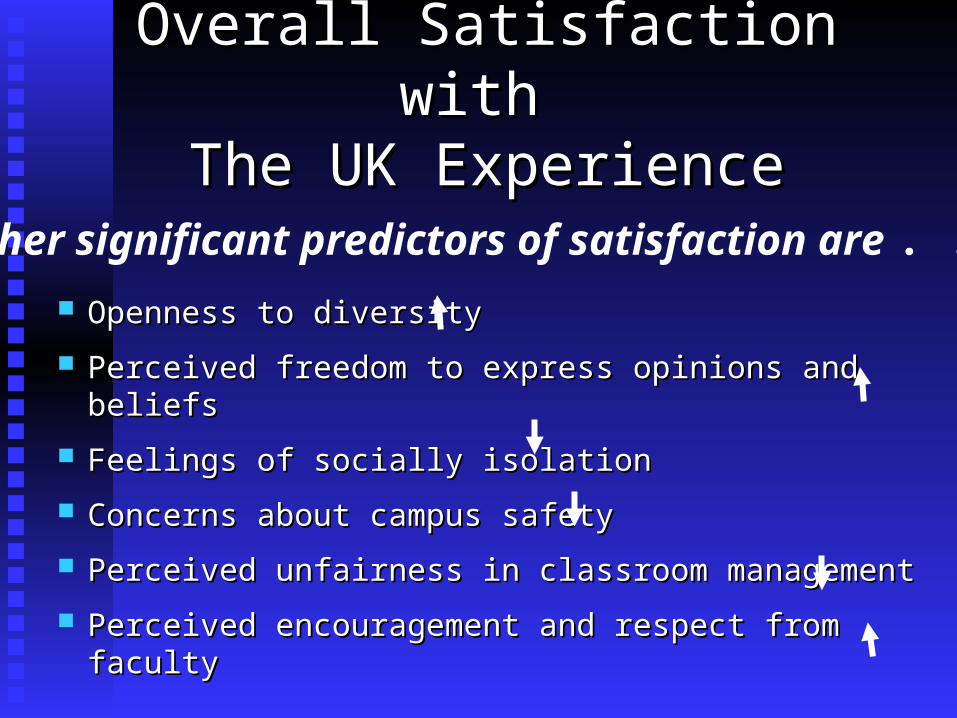
Openness to diversity Openness to diversity
Perceived freedom to express opinions and beliefsPerceived freedom to express opinions and beliefs
Feelings of socially isolation Feelings of socially isolation
Concerns about campus safety Concerns about campus safety
Perceived unfairness in classroom managementPerceived unfairness in classroom management
Perceived encouragement and respect from facultyPerceived encouragement and respect from faculty
Other significant predictors of satisfaction are . . .
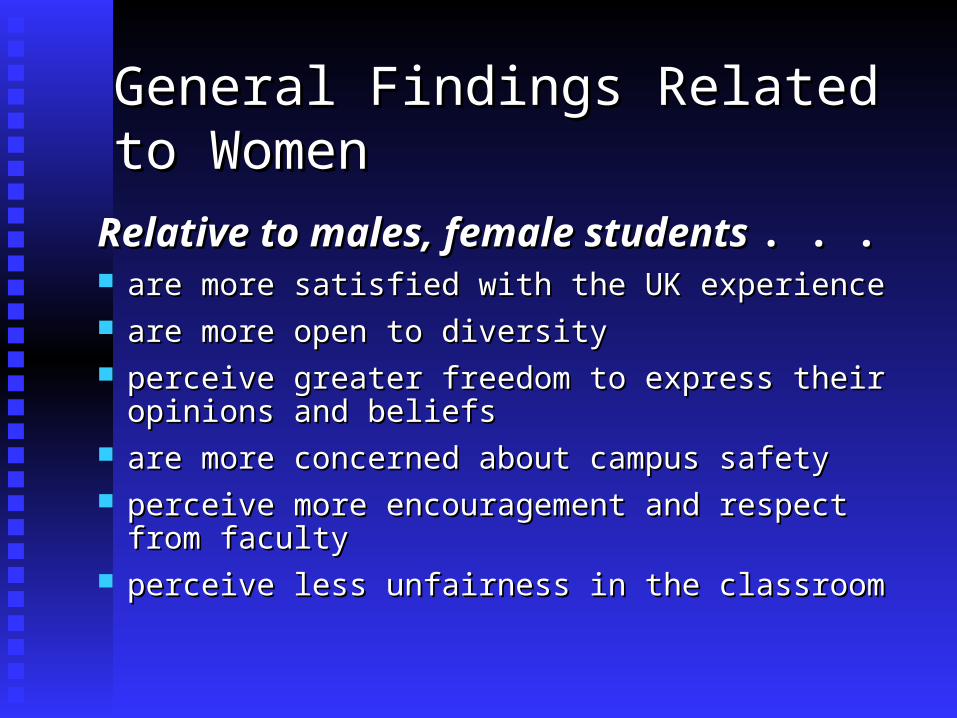
General Findings Related to WomenGeneral Findings Related to Women
Relative to males, female students Relative to males, female students . . .. . . are more satisfied with the UK experienceare more satisfied with the UK experience are more open to diversityare more open to diversity perceive greater freedom to express their opinions and perceive greater freedom to express their opinions and
beliefsbeliefs are more concerned about campus safetyare more concerned about campus safety perceive more encouragement and respect from facultyperceive more encouragement and respect from faculty perceive less unfairness in the classroomperceive less unfairness in the classroom
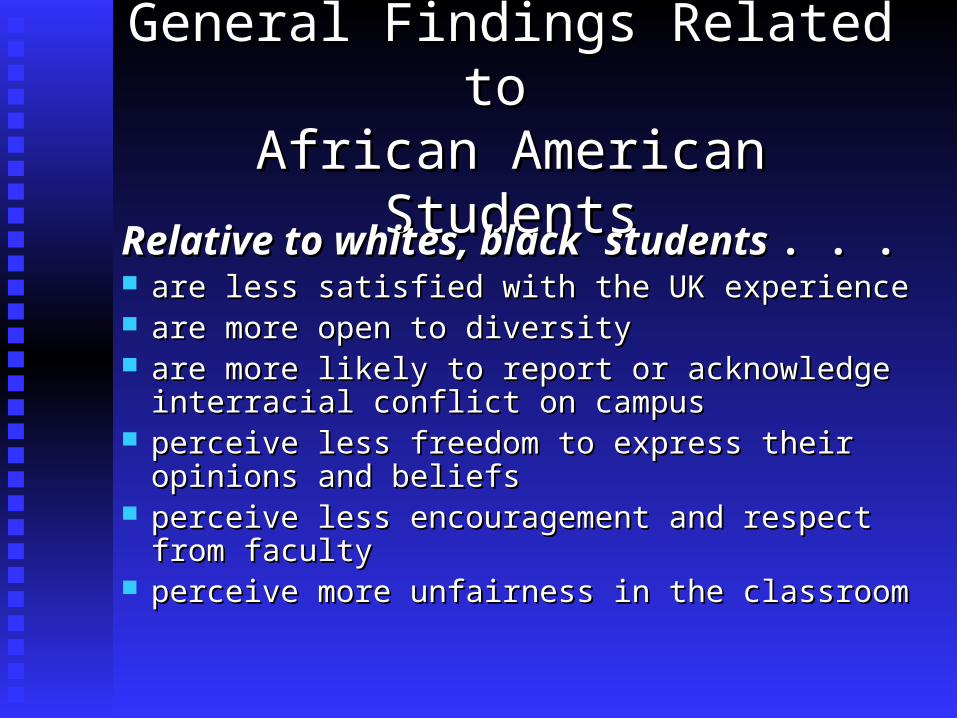
General Findings Related to General Findings Related to African American StudentsAfrican American Students
Relative to whites, blackRelative to whites, black students students . . .. . . are less satisfied with the UK experienceare less satisfied with the UK experience are more open to diversityare more open to diversity are more likely to report or acknowledge interracial are more likely to report or acknowledge interracial
conflict on campusconflict on campus perceive less freedom to express their opinions and perceive less freedom to express their opinions and
beliefsbeliefs perceive less encouragement and respect from facultyperceive less encouragement and respect from faculty perceive more unfairness in the classroomperceive more unfairness in the classroom
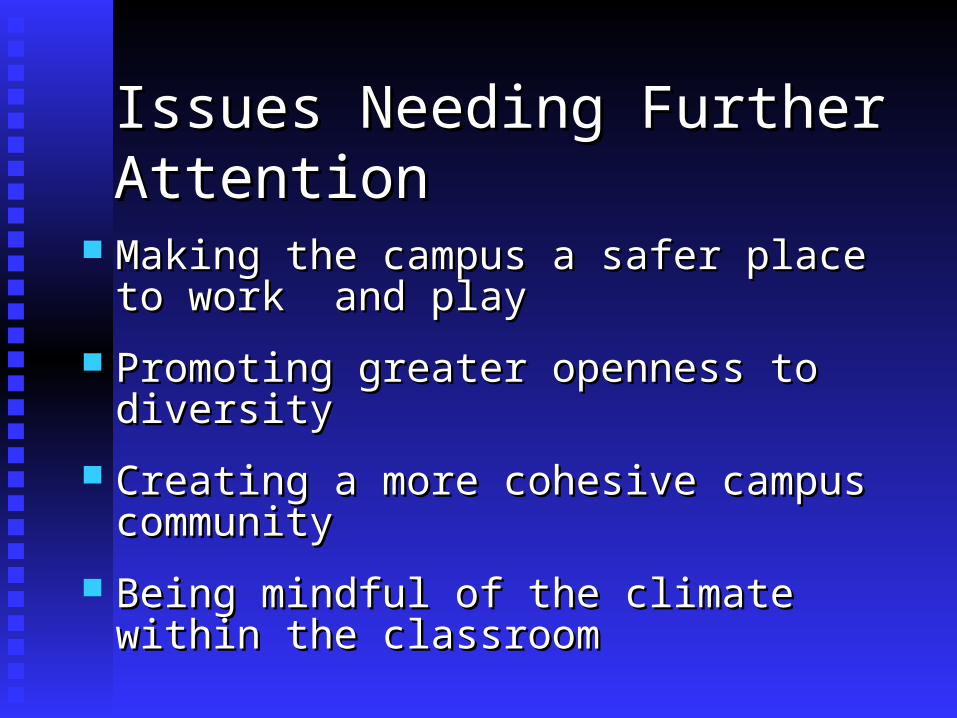
Issues Needing Further AttentionIssues Needing Further Attention
Making the campus a safer place to work Making the campus a safer place to work and playand play
Promoting greater openness to diversityPromoting greater openness to diversity
Creating a more cohesive campus community Creating a more cohesive campus community
Being mindful of the climate within the Being mindful of the climate within the classroomclassroom
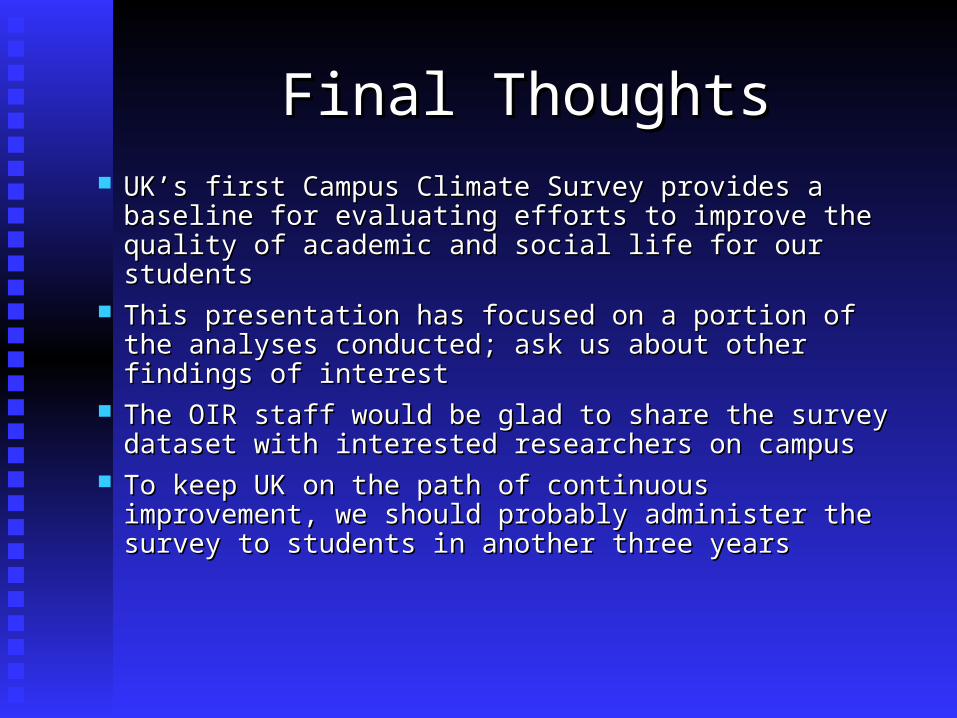
Final ThoughtsFinal Thoughts UK’s first Campus Climate Survey provides a baseline UK’s first Campus Climate Survey provides a baseline
for evaluating efforts to improve the quality of academic for evaluating efforts to improve the quality of academic and social life for our studentsand social life for our students
This presentation has focused on a portion of the This presentation has focused on a portion of the analyses conducted; ask us about other findings of analyses conducted; ask us about other findings of interestinterest
The OIR staff would be glad to share the survey dataset The OIR staff would be glad to share the survey dataset with interested researchers on campuswith interested researchers on campus
To keep UK on the path of continuous improvement, we To keep UK on the path of continuous improvement, we should probably administer the survey to students in should probably administer the survey to students in another three yearsanother three years
Office of Institutional Office of Institutional ResearchResearch
Roger Sugarman, Ph.D.Roger Sugarman, Ph.D.
[email protected]@email.uky.eduPhone: 257-7989Phone: 257-7989www.uky.edu/IR/www.uky.edu/IR/
For more information on UK’s Campus Climate Survey:


![Why would anyone believe in god (barrett 2004) [selected chapters]](https://img.pdfslide.net/doc/110x75/54ba8f804a7959a8298b469a/why-would-anyone-believe-in-god-barrett-2004-selected-chapters.jpg)