21
Selecting Enterprises and Marketing Outlets Ginger S. Myers University of Maryland Extension Extension Ag Marketing Specialist, Director, Maryland Rural Enterprise Development Center [email protected] http://extension.umd.edu/mredc http://extension.umd.edu/agmarketing 301-432-2767

Selecting Enterprises and Marketing Outlets...Marketing Channels Profit as % of Gross Sales Profit as % of Gross Sales (with Owner Labor Valued). Assigned a value for each hour of

  • Upload
    others

  • View
    3

  • Download
    0

Embed Size (px)

Citation preview

Selecting Enterprises and Marketing Outlets

Ginger S. MyersUniversity of Maryland Extension

Extension Ag Marketing Specialist, Director, Maryland Rural Enterprise Development Center

[email protected]://extension.umd.edu/mredc

http://extension.umd.edu/agmarketing301-432-2767

Director of the Maryland Rural Enterprise Development Center Extension Marketing Specialist, College of Agriculture & Natural

Resources, University of Maryland Extension. Over 30 years of experience in production agriculture, agri-

business and consulting to this position. Currently works with agricultural entrepreneurs, develops new

markets and networking opportunities, works with new and beginning farmers, and assists with business development and business planning.

Operates a grass-based livestock farm with husband.

Ginger S. [email protected] 301-432-2767

Have You Set Any Fiscal Targets?

Product Costs

• Land and Facilities• Prep or Stocking• Labor

Actual Growing

• Labor• Inputs• Shrink or Loss• Storage

Harvest or Process

• Transportation- harvesting or travel to and from processor or buyer

• Commissions• Labor

Enterprise Budgets

• A Starting Place to park your numbers• http://ag-

econ.ncsu.edu/extension/tomato-budgets

Enterprise Selection• Passion• Labor & Resources• Don’t Over Diversify• Get Really Good at Producing a quality

Product• http://extension.umd.edu/mredc/business-modules/farm-

business-planning-workbook

The 4’Ps of Marketing Traditional Approach

– Product – customer needs and wants/satisfy and solutions

– Place – making available and convenient to customer– Price – to reflect the marketplace … profit– Promotion – communicating, creating desire &

developing relationships

Fifth P- Positioning

Evaluating Marketing Outlets

Farmers’ Market

Grocery

Institutions

Farm Stand/ U-Pick

Restaurant

DistributorCooperative

CSA

Six interacting factors impact the “performance” of a marketing

channel including:

Risk…and if it rains no customers come.

Labor Requirements…and it takes 12 hours to prepare...

Sales Volume…and its only 2 hour per week...

Associated CostsIt costs $25/day

to sell there

Price & ProfitYou can sell $300 worth per hour!

Lifestyle Preferences

What’s More Important to You-Volume or Price?

Muddy Fingers Farm• Diverse vegetable & fruit production• Farmers’ markets, CSA, & restaurants• No paid labor, 6 working shares, family

& friends that volunteer• 2.5 acres in

production• Over 45 crops•Source: Matt LeRoux- Cornell Extension

Presenter
Presentation Notes
Let’s work through a real example of using the Market Channel Assessment Tool in a farm operation. Profile of a farm in Hector, NY: A husband & wife team who occasionally will use volunteer assistance of friends and family, along with a few working shares in their CSA. At the time of the first market channel assessment they were participating in 4 farmers markets, had a 50 share CSA, and were selling to 2 restaurants.

Methodology• Collect logs of all marketing labor (from harvest

to sale) for one typical, peak season week• Collect gross sales & mileage for the week• Collect ranking on lifestyle & risk• Collect weights for each ranked category.

Why labor logs?• Labor is the largest marketing expense• Consistent unit and format across farms• Operators tell hired help to complete the forms• Each employee filled out their own sheets

•Source: Matt LeRoux- Cornell Extension

Presenter
Presentation Notes
To do the assessment we collected logs of all their marketing labor. For this analysis production labor and costs are not included. “Marketing” begins at harvest and goes until the product is sold and out of the farms’ hands. Harvest costs are included because you will harvest differently depending on the marketing channel the crop goes to. This is especially true when talking about the need for consistency and uniformity, which tends to be higher in wholesale channels. Log data were collected during 1 peak season week when things were running smoothly – no major storm events, no injuries, no major break downs. For the same week we collected all the gross sales receipts for each marketing channel each day. Transportation expense associated with each channel was also collected. Participants are also asked to rank how well they enjoyed participating in each channel and, relative to the other channels, how risky they thought each channel was. The objective was to collect extensive data for 1 week on each of the performance factors, except ‘associated costs’ which was ignored. The farm also weighed how important each factor was to them. For the labor log the burden was spread across everyone on the farm not just the owner or manager. Records are typically more accurate if everyone tracks their own labor rather than one person trying to do it.

• Use data to rank and compare channels:– Profit (gross sales – (labor + mileage cost))– Labor hours required– Sales volume

• Use farmer ranking for :– Risk perception (financial risk, lost sales,

etc…)– Lifestyle preference (enjoyment, stress

aversion)•Source: Matt LeRoux- Cornell Extension

Simple Comparison of Labor & Sales

Total Labor Hours

Restaurant5%

Watkins FM13%

IFM Saturday17%

CSA18%

IFM Tuesday23%

Corning FM24%

Gross Sales

Watkins FM5%

Restaurant6%

IFM Saturday11%

IFM Tuesday14%

Corning FM19%

CSA45%

CSA: 18% of weekly labor, 45% of weekly gross sales.Watkins Glen FM: 13% of weekly labor, 5% of weekly gross sales.

Presenter
Presentation Notes
This slide takes a different look at the same data. On the left are the channels in terms of the percent of labor hours used in each. On the right the percent of total gross sales contributed by each marketing channel. The CSA required 18% of the total weekly labor, yet accounted for 45% of gross sales. Looking at the restaurant channel it took 5% of weekly labor and returned 6% of weekly gross sales. The Watkins Glen Farmers Market accounted for 13% of total labor hours, yet accounted for only 5% of weekly sales. From this simple comparison it appears the restaurant channel is pulling its own weight, in a sense it’s contributing as much as it takes. The Watkins Glen Farmers Market however uses a greater proportion of labor compared with the sales it contributes. So you begin to wonder if that is a channel to move away from. At the same time, is the CSA might be a channel that should be expanded?

ProfitProfit

0%

10%

20%

30%

40%

50%

60%

70%

80%

90%

100%

Watkins FM IFM Saturday IFM Tuesday Corning FM Restaurant CSA

Marketing Channels

Prof

it as

% o

f Gro

ss S

ales

Profit as % of Gross Sales (with Owner Labor Valued)

.

Assigned a value for each hour of labor and totaled up a labor cost for each marketing channel. Then took total gross sales minus labor cost and minus transportation cost for each channel. This is then a very easy and simple marketing profit calculation

•Source: Matt LeRoux- Cornell Extension

Presenter
Presentation Notes
To look at profit we did a very simple calculation. We assigned a value for each hour of labor and totaled up a labor cost for each marketing channel. Then took total gross sales minus labor cost and minus transportation cost for each channel. This is then a very easy and simple marketing profit calculation. On the vertical axis we have profit as a percent of gross sales. As just one way to rank for profit, this shows that the CSA tops the list followed by restaurants, and the farmers markets shake out to the bottom.

Risks & Preferences:

Labor requirementsPrice risk

Customer turn-outCompetition

Buyer back-outProcessor is bookedPeople on the farm

Customer interactionTime in the field

Wash & packDisplays

•Source: Matt LeRoux- Cornell Extension

Presenter
Presentation Notes
Looking at risks and preferences. These are the farmer identified risks. Labor that went into marketing Price risk – which is really competition in the market place from other farmers Customer turn-out – for a u-pick operation if it rains and customers don’t come Competition – typically closely associated with price Buyer back-out – typically seen in wholesale situations when a buyer places an order and then decides, for a number of reasons, they don’t want it or want a smaller quantity Processor is booked – this is a problem for livestock slaughter especially in small USDA inspected plants, but can be a problem where any value added processing is needed People on the farm – customers getting hurt, especially for u-pick operations What are the growers’ preferences for: Customer interaction Time in the field vs. time marketing vs. time in other endeavors Washing, preparing, packing & sorting Time spent creating, setting up and tearing down displays

Marketing Channel Assessment

• Identify your goals and lifestyle preferences• Keep marketing cost & returns records, if only

for “snapshot” periods• Value your own time to present an accurate

picture of marketing costs• Rank & compare opportunities to maximize

profits• Combine channels to max sales & reduce risks

•Source: Matt LeRoux- Cornell Extension

Presenter
Presentation Notes
These are some of the big picture concepts that come out of the marketing channel assessment.

Successful Marketing

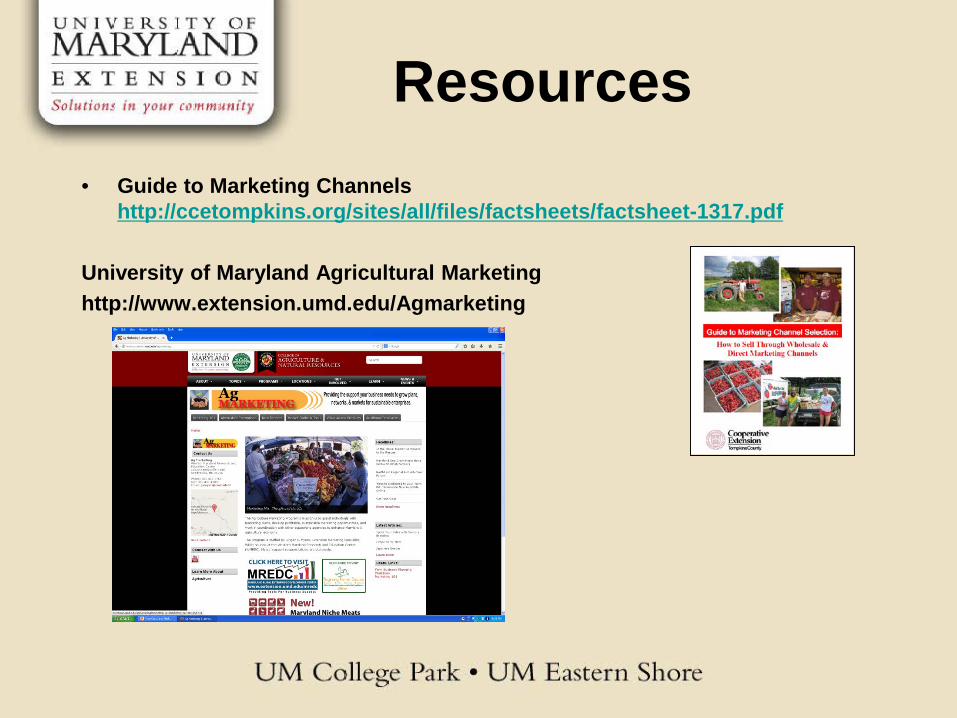
Resources• Guide to Marketing Channels

http://ccetompkins.org/sites/all/files/factsheets/factsheet-1317.pdf

University of Maryland Agricultural Marketinghttp://www.extension.umd.edu/Agmarketing