Embed Size (px)
Citation preview
at SciVerse ScienceDirect
Journal of Power Sources 216 (2012) 376e386
Contents lists available
Journal of Power Sources
journal homepage: www.elsevier .com/locate/ jpowsour
Selection of battery technology to support grid-integrated renewable electricity
Jason Leadbetter*, Lukas G. Swan 1
Dalhousie University, Mechanical Engineering C360, 5269 Morris St., Halifax, NS, Canada B3H 4R2
h i g h l i g h t s
< Renewable electricity places additional strain on the electricity grid.< Grid support services to provide flexibility are becoming more important.< Battery energy storage systems offer a broad range of storage abilities.< Lithium-ion and leadeacid batteries are suitable for short duration services.< Sodiumesulfur and vanadium redox batteries are suitable for long duration services.
a r t i c l e i n f o
Article history:Received 26 April 2012Received in revised form25 May 2012Accepted 28 May 2012Available online 1 June 2012
Keywords:Battery energy storageRenewable energy storageBattery technologiesRenewable energy integration
* Corresponding author. Tel.: þ1 902 494 6196; faxE-mail addresses: [email protected] (J. Leadbetter), L
1 Tel.: þ1 902 494 4643; fax: þ1 902 423 6711.
0378-7753/$ e see front matter � 2012 Elsevier B.V.10.1016/j.jpowsour.2012.05.081
a b s t r a c t
Operation of the electricity grid has traditionally been done using slow responding base and interme-diate load generators with fast responding peak load generators to capture the chaotic behavior of end-use demands. Many modern electricity grids are implementing intermittent non-dispatchable renewableenergy resources. As a result, the existing support services are becoming inadequate and technologicalinnovation in grid support services are necessary. Support services fall into short (seconds to minutes),medium (minutes to hours), and long duration (several hours) categories. Energy storage offers a methodof providing these services and can enable increased penetration rates of renewable energy generators.Many energy storage technologies exist. Of these, batteries span a significant range of required storagecapacity and power output. By assessing the energy to power ratio of electricity grid services, suitablebattery technologies were selected. These include lead-acid, lithium-ion, sodium-sulfur, and vanadium-redox. Findings show the variety of grid services require different battery technologies and batteries arecapable of meeting the short, medium, and long duration categories. A brief review of each batterytechnology and its present state of development, commercial implementation, and research frontiers ispresented to support these classifications.
� 2012 Elsevier B.V. All rights reserved.
1. Introduction
It is well established that dependence on fossil fuel resourcescreates vulnerability to price fluctuations in international fuelmarkets and leads to anthropogenic greenhouse gases causinghuman induced global warming. With a peak in global oilproduction likely occurring before 2020, the pressure to use alter-native energy sources is greater than ever [1]. Governments aroundthe world are developing aggressive renewable energy and elec-tricity plans focused on increasing the installed capacity of wind,solar, and other intermittent renewable generation devices (e.g. in-stream tidal). Worldwide wind turbine generating capacity grewfrom 17,400 MW in the year 2000 to 197,039 MW in the year 2010
: þ1 902 423 [email protected] (L.G. Swan).
All rights reserved.
and continues to show exponential growth rates worldwide [2].Solar energy is observing similar growth with cumulative globalinstalled photovoltaic capacity doubling since the year 2007 to39,800 MW at the end of the year 2010 [3,4]. With such rapidgrowth of these technologies, the implications of high penetrationlevels of renewable generation must be carefully considered.
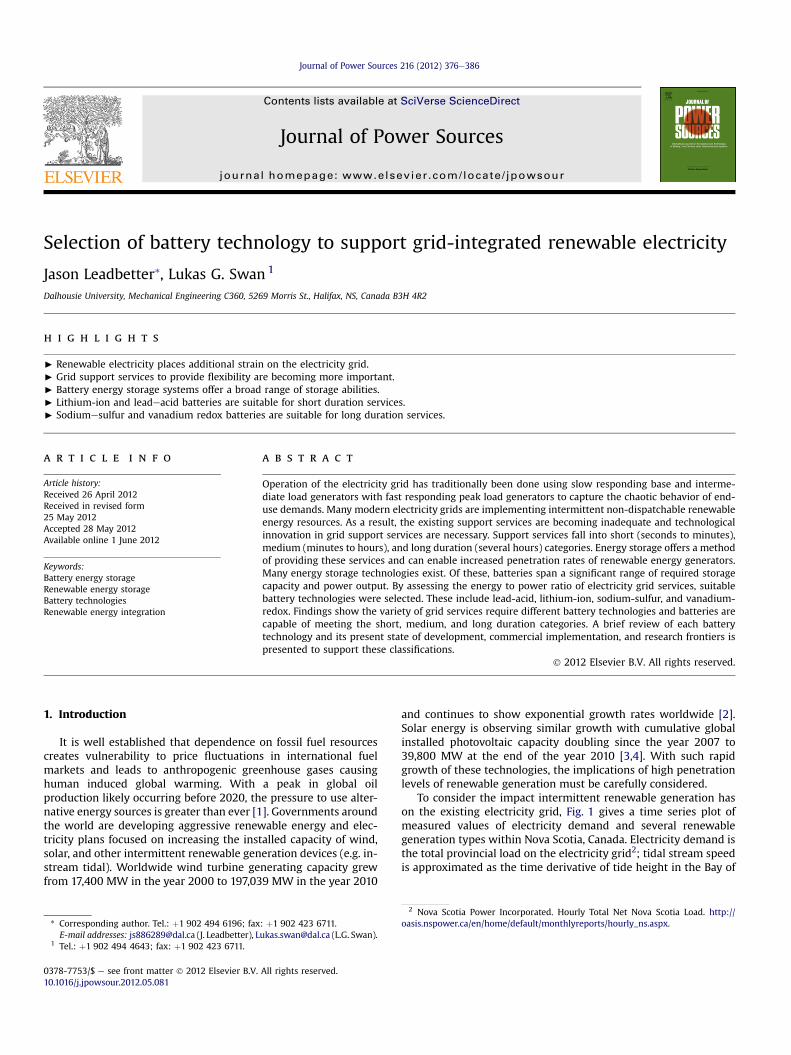
To consider the impact intermittent renewable generation hason the existing electricity grid, Fig. 1 gives a time series plot ofmeasured values of electricity demand and several renewablegeneration types within Nova Scotia, Canada. Electricity demand isthe total provincial load on the electricity grid2; tidal stream speedis approximated as the time derivative of tide height in the Bay of
2 Nova Scotia Power Incorporated. Hourly Total Net Nova Scotia Load. http://oasis.nspower.ca/en/home/default/monthlyreports/hourly_ns.aspx.
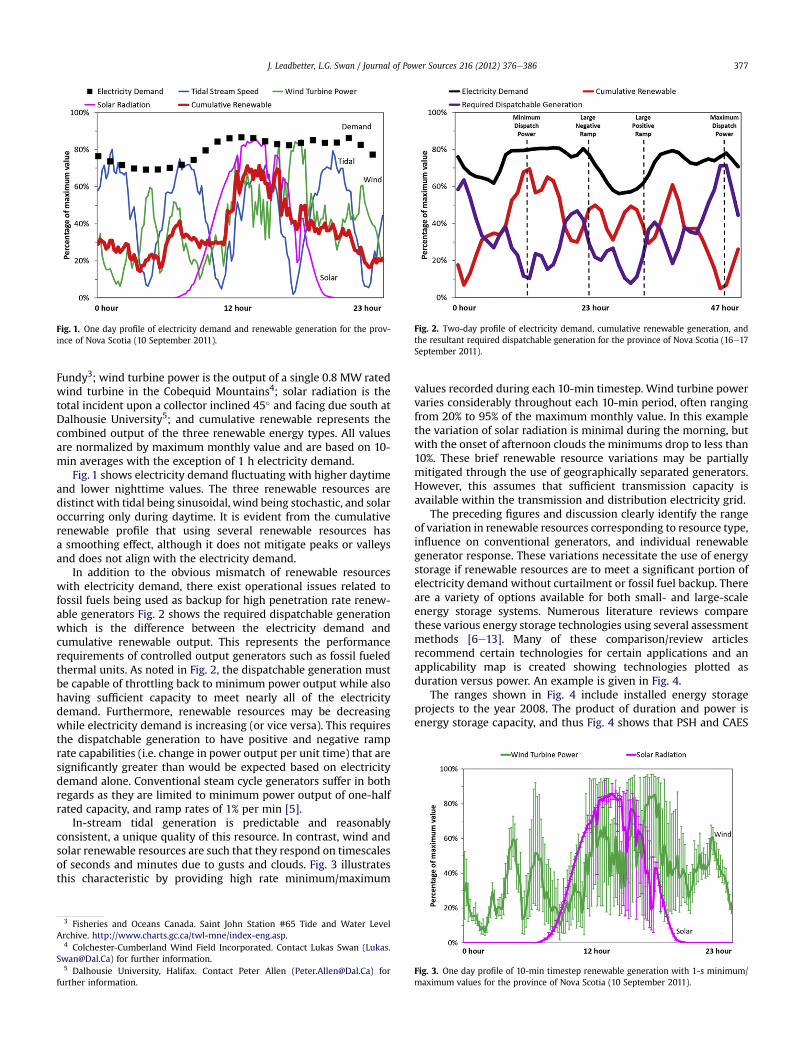
Fig. 1. One day profile of electricity demand and renewable generation for the prov-ince of Nova Scotia (10 September 2011).
Fig. 2. Two-day profile of electricity demand, cumulative renewable generation, andthe resultant required dispatchable generation for the province of Nova Scotia (16e17September 2011).
J. Leadbetter, L.G. Swan / Journal of Power Sources 216 (2012) 376e386 377
Fundy3; wind turbine power is the output of a single 0.8 MW ratedwind turbine in the Cobequid Mountains4; solar radiation is thetotal incident upon a collector inclined 45� and facing due south atDalhousie University5; and cumulative renewable represents thecombined output of the three renewable energy types. All valuesare normalized by maximum monthly value and are based on 10-min averages with the exception of 1 h electricity demand.
Fig. 1 shows electricity demand fluctuating with higher daytimeand lower nighttime values. The three renewable resources aredistinct with tidal being sinusoidal, wind being stochastic, and solaroccurring only during daytime. It is evident from the cumulativerenewable profile that using several renewable resources hasa smoothing effect, although it does not mitigate peaks or valleysand does not align with the electricity demand.
In addition to the obvious mismatch of renewable resourceswith electricity demand, there exist operational issues related tofossil fuels being used as backup for high penetration rate renew-able generators Fig. 2 shows the required dispatchable generationwhich is the difference between the electricity demand andcumulative renewable output. This represents the performancerequirements of controlled output generators such as fossil fueledthermal units. As noted in Fig. 2, the dispatchable generation mustbe capable of throttling back to minimum power output while alsohaving sufficient capacity to meet nearly all of the electricitydemand. Furthermore, renewable resources may be decreasingwhile electricity demand is increasing (or vice versa). This requiresthe dispatchable generation to have positive and negative ramprate capabilities (i.e. change in power output per unit time) that aresignificantly greater than would be expected based on electricitydemand alone. Conventional steam cycle generators suffer in bothregards as they are limited to minimum power output of one-halfrated capacity, and ramp rates of 1% per min [5].
In-stream tidal generation is predictable and reasonablyconsistent, a unique quality of this resource. In contrast, wind andsolar renewable resources are such that they respond on timescalesof seconds and minutes due to gusts and clouds. Fig. 3 illustratesthis characteristic by providing high rate minimum/maximum
3 Fisheries and Oceans Canada. Saint John Station #65 Tide and Water LevelArchive. http://www.charts.gc.ca/twl-mne/index-eng.asp.
4 Colchester-Cumberland Wind Field Incorporated. Contact Lukas Swan ([email protected]) for further information.
5 Dalhousie University, Halifax. Contact Peter Allen ([email protected]) forfurther information.
values recorded during each 10-min timestep. Wind turbine powervaries considerably throughout each 10-min period, often rangingfrom 20% to 95% of the maximum monthly value. In this examplethe variation of solar radiation is minimal during the morning, butwith the onset of afternoon clouds the minimums drop to less than10%. These brief renewable resource variations may be partiallymitigated through the use of geographically separated generators.However, this assumes that sufficient transmission capacity isavailable within the transmission and distribution electricity grid.
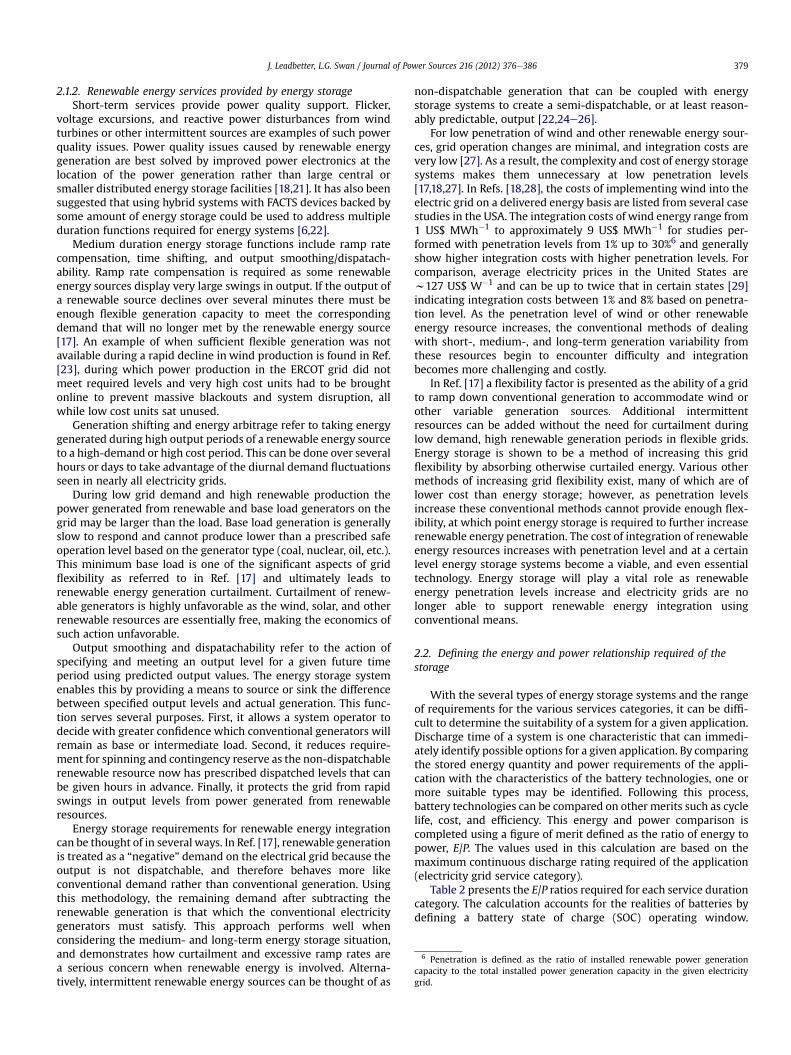
The preceding figures and discussion clearly identify the rangeof variation in renewable resources corresponding to resource type,influence on conventional generators, and individual renewablegenerator response. These variations necessitate the use of energystorage if renewable resources are to meet a significant portion ofelectricity demand without curtailment or fossil fuel backup. Thereare a variety of options available for both small- and large-scaleenergy storage systems. Numerous literature reviews comparethese various energy storage technologies using several assessmentmethods [6e13]. Many of these comparison/review articlesrecommend certain technologies for certain applications and anapplicability map is created showing technologies plotted asduration versus power. An example is given in Fig. 4.
The ranges shown in Fig. 4 include installed energy storageprojects to the year 2008. The product of duration and power isenergy storage capacity, and thus Fig. 4 shows that PSH and CAES
Fig. 3. One day profile of 10-min timestep renewable generation with 1-s minimum/maximum values for the province of Nova Scotia (10 September 2011).
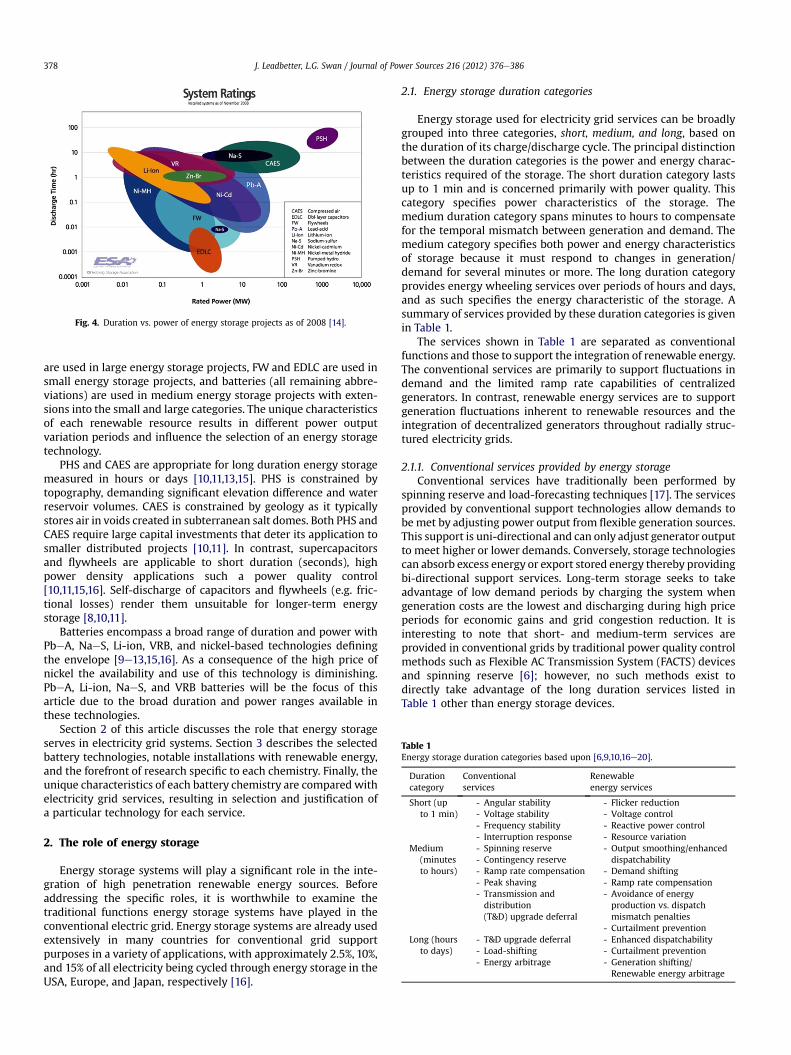
Fig. 4. Duration vs. power of energy storage projects as of 2008 [14].
Table 1Energy storage duration categories based upon [6,9,10,16e20].
Durationcategory
Conventionalservices
Renewableenergy services
Short (upto 1 min)
- Angular stability- Voltage stability- Frequency stability- Interruption response
- Flicker reduction- Voltage control- Reactive power control- Resource variation
Medium(minutesto hours)
- Spinning reserve- Contingency reserve- Ramp rate compensation- Peak shaving- Transmission anddistribution(T&D) upgrade deferral
- Output smoothing/enhanceddispatchability
- Demand shifting- Ramp rate compensation- Avoidance of energyproduction vs. dispatchmismatch penalties
- Curtailment preventionLong (hours
to days)- T&D upgrade deferral- Load-shifting- Energy arbitrage
- Enhanced dispatchability- Curtailment prevention- Generation shifting/Renewable energy arbitrage
J. Leadbetter, L.G. Swan / Journal of Power Sources 216 (2012) 376e386378
are used in large energy storage projects, FW and EDLC are used insmall energy storage projects, and batteries (all remaining abbre-viations) are used in medium energy storage projects with exten-sions into the small and large categories. The unique characteristicsof each renewable resource results in different power outputvariation periods and influence the selection of an energy storagetechnology.
PHS and CAES are appropriate for long duration energy storagemeasured in hours or days [10,11,13,15]. PHS is constrained bytopography, demanding significant elevation difference and waterreservoir volumes. CAES is constrained by geology as it typicallystores air in voids created in subterranean salt domes. Both PHS andCAES require large capital investments that deter its application tosmaller distributed projects [10,11]. In contrast, supercapacitorsand flywheels are applicable to short duration (seconds), highpower density applications such a power quality control[10,11,15,16]. Self-discharge of capacitors and flywheels (e.g. fric-tional losses) render them unsuitable for longer-term energystorage [8,10,11].
Batteries encompass a broad range of duration and power withPbeA, NaeS, Li-ion, VRB, and nickel-based technologies definingthe envelope [9e13,15,16]. As a consequence of the high price ofnickel the availability and use of this technology is diminishing.PbeA, Li-ion, NaeS, and VRB batteries will be the focus of thisarticle due to the broad duration and power ranges available inthese technologies.
Section 2 of this article discusses the role that energy storageserves in electricity grid systems. Section 3 describes the selectedbattery technologies, notable installations with renewable energy,and the forefront of research specific to each chemistry. Finally, theunique characteristics of each battery chemistry are compared withelectricity grid services, resulting in selection and justification ofa particular technology for each service.
2. The role of energy storage
Energy storage systems will play a significant role in the inte-gration of high penetration renewable energy sources. Beforeaddressing the specific roles, it is worthwhile to examine thetraditional functions energy storage systems have played in theconventional electric grid. Energy storage systems are already usedextensively in many countries for conventional grid supportpurposes in a variety of applications, with approximately 2.5%, 10%,and 15% of all electricity being cycled through energy storage in theUSA, Europe, and Japan, respectively [16].
2.1. Energy storage duration categories
Energy storage used for electricity grid services can be broadlygrouped into three categories, short, medium, and long, based onthe duration of its charge/discharge cycle. The principal distinctionbetween the duration categories is the power and energy charac-teristics required of the storage. The short duration category lastsup to 1 min and is concerned primarily with power quality. Thiscategory specifies power characteristics of the storage. Themedium duration category spans minutes to hours to compensatefor the temporal mismatch between generation and demand. Themedium category specifies both power and energy characteristicsof storage because it must respond to changes in generation/demand for several minutes or more. The long duration categoryprovides energy wheeling services over periods of hours and days,and as such specifies the energy characteristic of the storage. Asummary of services provided by these duration categories is givenin Table 1.
The services shown in Table 1 are separated as conventionalfunctions and those to support the integration of renewable energy.The conventional services are primarily to support fluctuations indemand and the limited ramp rate capabilities of centralizedgenerators. In contrast, renewable energy services are to supportgeneration fluctuations inherent to renewable resources and theintegration of decentralized generators throughout radially struc-tured electricity grids.
2.1.1. Conventional services provided by energy storageConventional services have traditionally been performed by
spinning reserve and load-forecasting techniques [17]. The servicesprovided by conventional support technologies allow demands tobe met by adjusting power output from flexible generation sources.This support is uni-directional and can only adjust generator outputto meet higher or lower demands. Conversely, storage technologiescan absorb excess energy or export stored energy thereby providingbi-directional support services. Long-term storage seeks to takeadvantage of low demand periods by charging the system whengeneration costs are the lowest and discharging during high priceperiods for economic gains and grid congestion reduction. It isinteresting to note that short- and medium-term services areprovided in conventional grids by traditional power quality controlmethods such as Flexible AC Transmission System (FACTS) devicesand spinning reserve [6]; however, no such methods exist todirectly take advantage of the long duration services listed inTable 1 other than energy storage devices.
6 Penetration is defined as the ratio of installed renewable power generationcapacity to the total installed power generation capacity in the given electricitygrid.
J. Leadbetter, L.G. Swan / Journal of Power Sources 216 (2012) 376e386 379
2.1.2. Renewable energy services provided by energy storageShort-term services provide power quality support. Flicker,
voltage excursions, and reactive power disturbances from windturbines or other intermittent sources are examples of such powerquality issues. Power quality issues caused by renewable energygeneration are best solved by improved power electronics at thelocation of the power generation rather than large central orsmaller distributed energy storage facilities [18,21]. It has also beensuggested that using hybrid systems with FACTS devices backed bysome amount of energy storage could be used to address multipleduration functions required for energy systems [6,22].
Medium duration energy storage functions include ramp ratecompensation, time shifting, and output smoothing/dispatach-ability. Ramp rate compensation is required as some renewableenergy sources display very large swings in output. If the output ofa renewable source declines over several minutes there must beenough flexible generation capacity to meet the correspondingdemand that will no longer met by the renewable energy source[17]. An example of when sufficient flexible generation was notavailable during a rapid decline in wind production is found in Ref.[23], during which power production in the ERCOT grid did notmeet required levels and very high cost units had to be broughtonline to prevent massive blackouts and system disruption, allwhile low cost units sat unused.
Generation shifting and energy arbitrage refer to taking energygenerated during high output periods of a renewable energy sourceto a high-demand or high cost period. This can be done over severalhours or days to take advantage of the diurnal demand fluctuationsseen in nearly all electricity grids.
During low grid demand and high renewable production thepower generated from renewable and base load generators on thegrid may be larger than the load. Base load generation is generallyslow to respond and cannot produce lower than a prescribed safeoperation level based on the generator type (coal, nuclear, oil, etc.).This minimum base load is one of the significant aspects of gridflexibility as referred to in Ref. [17] and ultimately leads torenewable energy generation curtailment. Curtailment of renew-able generators is highly unfavorable as the wind, solar, and otherrenewable resources are essentially free, making the economics ofsuch action unfavorable.
Output smoothing and dispatachability refer to the action ofspecifying and meeting an output level for a given future timeperiod using predicted output values. The energy storage systemenables this by providing a means to source or sink the differencebetween specified output levels and actual generation. This func-tion serves several purposes. First, it allows a system operator todecide with greater confidence which conventional generators willremain as base or intermediate load. Second, it reduces require-ment for spinning and contingency reserve as the non-dispatchablerenewable resource now has prescribed dispatched levels that canbe given hours in advance. Finally, it protects the grid from rapidswings in output levels from power generated from renewableresources.
Energy storage requirements for renewable energy integrationcan be thought of in several ways. In Ref. [17], renewable generationis treated as a “negative” demand on the electrical grid because theoutput is not dispatchable, and therefore behaves more likeconventional demand rather than conventional generation. Usingthis methodology, the remaining demand after subtracting therenewable generation is that which the conventional electricitygenerators must satisfy. This approach performs well whenconsidering the medium- and long-term energy storage situation,and demonstrates how curtailment and excessive ramp rates area serious concern when renewable energy is involved. Alterna-tively, intermittent renewable energy sources can be thought of as
non-dispatchable generation that can be coupled with energystorage systems to create a semi-dispatchable, or at least reason-ably predictable, output [22,24e26].
For low penetration of wind and other renewable energy sour-ces, grid operation changes are minimal, and integration costs arevery low [27]. As a result, the complexity and cost of energy storagesystems makes them unnecessary at low penetration levels[17,18,27]. In Refs. [18,28], the costs of implementing wind into theelectric grid on a delivered energy basis are listed from several casestudies in the USA. The integration costs of wind energy range from1 US$ MWh�1 to approximately 9 US$ MWh�1 for studies per-formed with penetration levels from 1% up to 30%6 and generallyshow higher integration costs with higher penetration levels. Forcomparison, average electricity prices in the United States arew127 US$ W�1 and can be up to twice that in certain states [29]indicating integration costs between 1% and 8% based on penetra-tion level. As the penetration level of wind or other renewableenergy resource increases, the conventional methods of dealingwith short-, medium-, and long-term generation variability fromthese resources begin to encounter difficulty and integrationbecomes more challenging and costly.
In Ref. [17] a flexibility factor is presented as the ability of a gridto ramp down conventional generation to accommodate wind orother variable generation sources. Additional intermittentresources can be added without the need for curtailment duringlow demand, high renewable generation periods in flexible grids.Energy storage is shown to be a method of increasing this gridflexibility by absorbing otherwise curtailed energy. Various othermethods of increasing grid flexibility exist, many of which are oflower cost than energy storage; however, as penetration levelsincrease these conventional methods cannot provide enough flex-ibility, at which point energy storage is required to further increaserenewable energy penetration. The cost of integration of renewableenergy resources increases with penetration level and at a certainlevel energy storage systems become a viable, and even essentialtechnology. Energy storage will play a vital role as renewableenergy penetration levels increase and electricity grids are nolonger able to support renewable energy integration usingconventional means.
2.2. Defining the energy and power relationship required of thestorage
With the several types of energy storage systems and the rangeof requirements for the various services categories, it can be diffi-cult to determine the suitability of a system for a given application.Discharge time of a system is one characteristic that can immedi-ately identify possible options for a given application. By comparingthe stored energy quantity and power requirements of the appli-cation with the characteristics of the battery technologies, one ormore suitable types may be identified. Following this process,battery technologies can be compared on other merits such as cyclelife, cost, and efficiency. This energy and power comparison iscompleted using a figure of merit defined as the ratio of energy topower, E/P. The values used in this calculation are based on themaximum continuous discharge rating required of the application(electricity grid service category).
Table 2 presents the E/P ratios required for each service durationcategory. The calculation accounts for the realities of batteries bydefining a battery state of charge (SOC) operating window.
J. Leadbetter, L.G. Swan / Journal of Power Sources 216 (2012) 376e386380
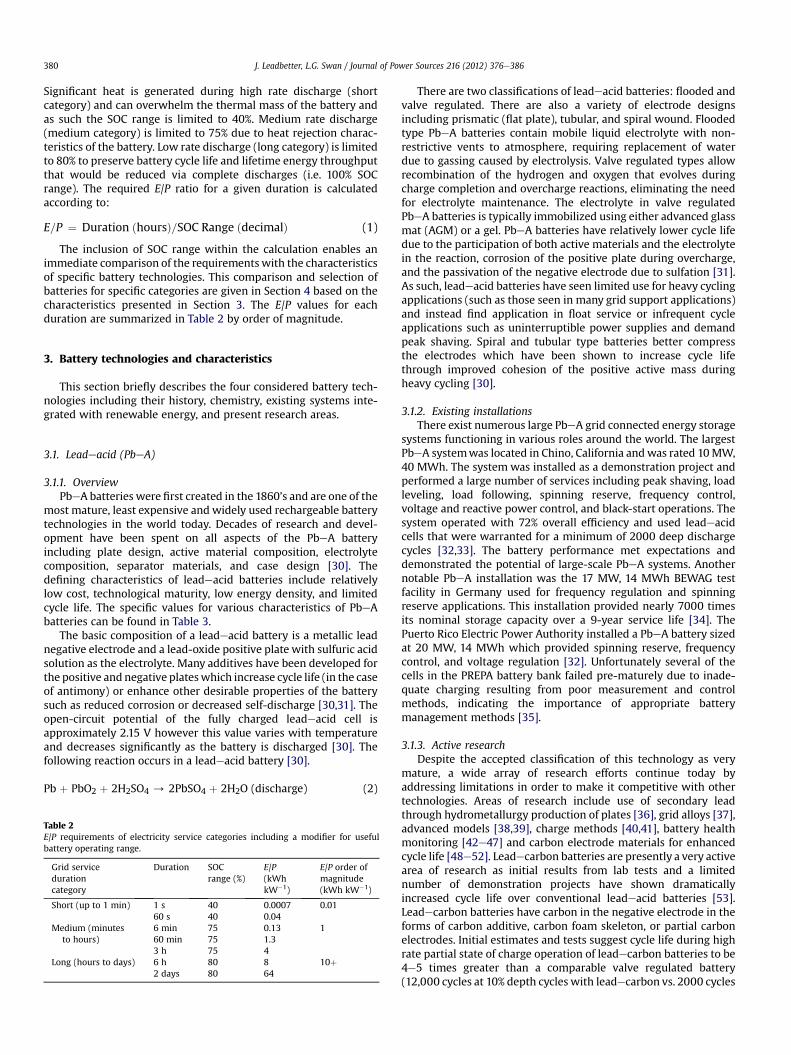
Significant heat is generated during high rate discharge (shortcategory) and can overwhelm the thermal mass of the battery andas such the SOC range is limited to 40%. Medium rate discharge(medium category) is limited to 75% due to heat rejection charac-teristics of the battery. Low rate discharge (long category) is limitedto 80% to preserve battery cycle life and lifetime energy throughputthat would be reduced via complete discharges (i.e. 100% SOCrange). The required E/P ratio for a given duration is calculatedaccording to:
E=P ¼ Duration ðhoursÞ=SOC Range ðdecimalÞ (1)
The inclusion of SOC range within the calculation enables animmediate comparison of the requirementswith the characteristicsof specific battery technologies. This comparison and selection ofbatteries for specific categories are given in Section 4 based on thecharacteristics presented in Section 3. The E/P values for eachduration are summarized in Table 2 by order of magnitude.
3. Battery technologies and characteristics
This section briefly describes the four considered battery tech-nologies including their history, chemistry, existing systems inte-grated with renewable energy, and present research areas.
3.1. Leadeacid (PbeA)
3.1.1. OverviewPbeA batteries were first created in the 1860’s and are one of the
most mature, least expensive and widely used rechargeable batterytechnologies in the world today. Decades of research and devel-opment have been spent on all aspects of the PbeA batteryincluding plate design, active material composition, electrolytecomposition, separator materials, and case design [30]. Thedefining characteristics of leadeacid batteries include relativelylow cost, technological maturity, low energy density, and limitedcycle life. The specific values for various characteristics of PbeAbatteries can be found in Table 3.
The basic composition of a leadeacid battery is a metallic leadnegative electrode and a lead-oxide positive plate with sulfuric acidsolution as the electrolyte. Many additives have been developed forthe positive and negative plateswhich increase cycle life (in the caseof antimony) or enhance other desirable properties of the batterysuch as reduced corrosion or decreased self-discharge [30,31]. Theopen-circuit potential of the fully charged leadeacid cell isapproximately 2.15 V however this value varies with temperatureand decreases significantly as the battery is discharged [30]. Thefollowing reaction occurs in a leadeacid battery [30].
Pb þ PbO2 þ 2H2SO4 / 2PbSO4 þ 2H2O (discharge) (2)
Table 2E/P requirements of electricity service categories including a modifier for usefulbattery operating range.
Grid servicedurationcategory
Duration SOCrange (%)
E/P(kWhkW�1)
E/P order ofmagnitude(kWh kW�1)
Short (up to 1 min) 1 s 40 0.0007 0.0160 s 40 0.04
Medium (minutesto hours)
6 min 75 0.13 160 min 75 1.33 h 75 4
Long (hours to days) 6 h 80 8 10þ2 days 80 64
There are two classifications of leadeacid batteries: flooded andvalve regulated. There are also a variety of electrode designsincluding prismatic (flat plate), tubular, and spiral wound. Floodedtype PbeA batteries contain mobile liquid electrolyte with non-restrictive vents to atmosphere, requiring replacement of waterdue to gassing caused by electrolysis. Valve regulated types allowrecombination of the hydrogen and oxygen that evolves duringcharge completion and overcharge reactions, eliminating the needfor electrolyte maintenance. The electrolyte in valve regulatedPbeA batteries is typically immobilized using either advanced glassmat (AGM) or a gel. PbeA batteries have relatively lower cycle lifedue to the participation of both active materials and the electrolytein the reaction, corrosion of the positive plate during overcharge,and the passivation of the negative electrode due to sulfation [31].As such, leadeacid batteries have seen limited use for heavy cyclingapplications (such as those seen in many grid support applications)and instead find application in float service or infrequent cycleapplications such as uninterruptible power supplies and demandpeak shaving. Spiral and tubular type batteries better compressthe electrodes which have been shown to increase cycle lifethrough improved cohesion of the positive active mass duringheavy cycling [30].
3.1.2. Existing installationsThere exist numerous large PbeA grid connected energy storage
systems functioning in various roles around the world. The largestPbeA systemwas located in Chino, California andwas rated 10MW,40 MWh. The system was installed as a demonstration project andperformed a large number of services including peak shaving, loadleveling, load following, spinning reserve, frequency control,voltage and reactive power control, and black-start operations. Thesystem operated with 72% overall efficiency and used leadeacidcells that were warranted for a minimum of 2000 deep dischargecycles [32,33]. The battery performance met expectations anddemonstrated the potential of large-scale PbeA systems. Anothernotable PbeA installation was the 17 MW, 14 MWh BEWAG testfacility in Germany used for frequency regulation and spinningreserve applications. This installation provided nearly 7000 timesits nominal storage capacity over a 9-year service life [34]. ThePuerto Rico Electric Power Authority installed a PbeA battery sizedat 20 MW, 14 MWh which provided spinning reserve, frequencycontrol, and voltage regulation [32]. Unfortunately several of thecells in the PREPA battery bank failed pre-maturely due to inade-quate charging resulting from poor measurement and controlmethods, indicating the importance of appropriate batterymanagement methods [35].
3.1.3. Active researchDespite the accepted classification of this technology as very
mature, a wide array of research efforts continue today byaddressing limitations in order to make it competitive with othertechnologies. Areas of research include use of secondary leadthrough hydrometallurgy production of plates [36], grid alloys [37],advanced models [38,39], charge methods [40,41], battery healthmonitoring [42e47] and carbon electrode materials for enhancedcycle life [48e52]. Leadecarbon batteries are presently a very activearea of research as initial results from lab tests and a limitednumber of demonstration projects have shown dramaticallyincreased cycle life over conventional leadeacid batteries [53].Leadecarbon batteries have carbon in the negative electrode in theforms of carbon additive, carbon foam skeleton, or partial carbonelectrodes. Initial estimates and tests suggest cycle life during highrate partial state of charge operation of leadecarbon batteries to be4e5 times greater than a comparable valve regulated battery(12,000 cycles at 10% depth cycles with leadecarbon vs. 2000 cycles
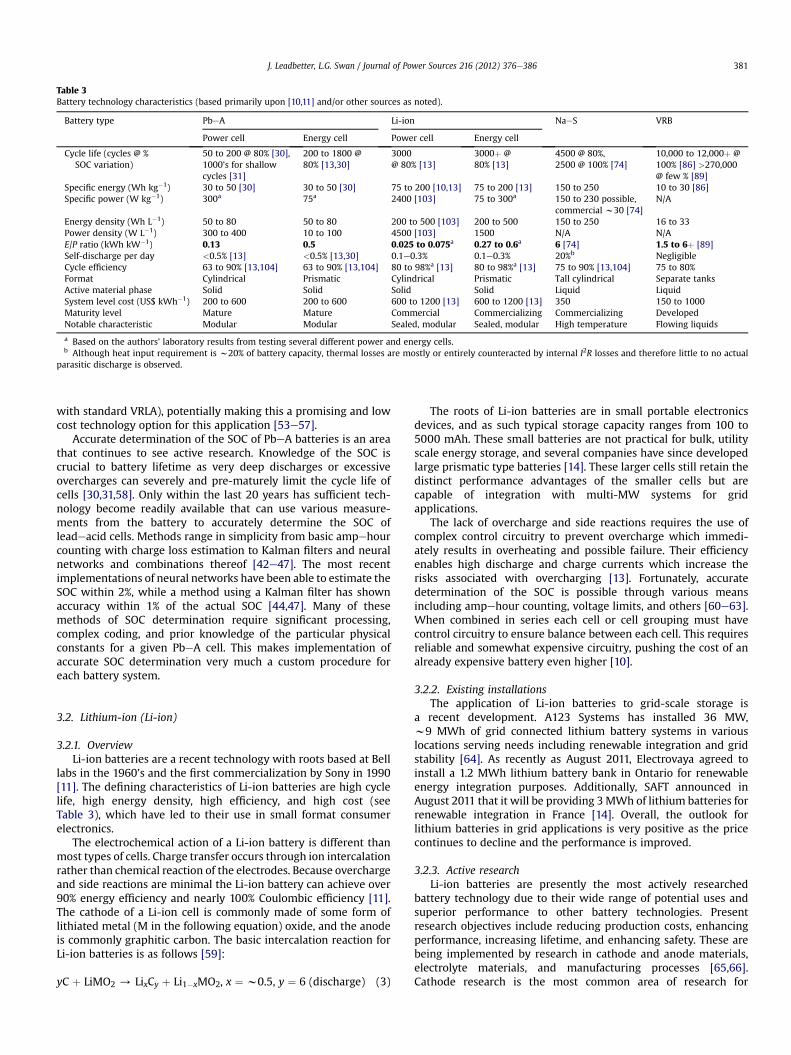
Table 3Battery technology characteristics (based primarily upon [10,11] and/or other sources as noted).
Battery type PbeA Li-ion NaeS VRB
Power cell Energy cell Power cell Energy cell
Cycle life (cycles @ %SOC variation)
50 to 200 @ 80% [30],1000’s for shallowcycles [31]
200 to 1800 @80% [13,30]
3000@ 80% [13]
3000þ @80% [13]
4500 @ 80%,2500 @ 100% [74]
10,000 to 12,000þ @100% [86] >270,000@ few % [89]
Specific energy (Wh kg�1) 30 to 50 [30] 30 to 50 [30] 75 to 200 [10,13] 75 to 200 [13] 150 to 250 10 to 30 [86]Specific power (W kg�1) 300a 75a 2400 [103] 75 to 300a 150 to 230 possible,
commercial w30 [74]N/A
Energy density (Wh L�1) 50 to 80 50 to 80 200 to 500 [103] 200 to 500 150 to 250 16 to 33Power density (W L�1) 300 to 400 10 to 100 4500 [103] 1500 N/A N/AE/P ratio (kWh kW�1) 0.13 0.5 0.025 to 0.075a 0.27 to 0.6a 6 [74] 1.5 to 6þ [89]Self-discharge per day <0.5% [13] <0.5% [13,30] 0.1e0.3% 0.1e0.3% 20%b NegligibleCycle efficiency 63 to 90% [13,104] 63 to 90% [13,104] 80 to 98%a [13] 80 to 98%a [13] 75 to 90% [13,104] 75 to 80%Format Cylindrical Prismatic Cylindrical Prismatic Tall cylindrical Separate tanksActive material phase Solid Solid Solid Solid Liquid LiquidSystem level cost (US$ kWh�1) 200 to 600 200 to 600 600 to 1200 [13] 600 to 1200 [13] 350 150 to 1000Maturity level Mature Mature Commercial Commercializing Commercializing DevelopedNotable characteristic Modular Modular Sealed, modular Sealed, modular High temperature Flowing liquids
a Based on the authors’ laboratory results from testing several different power and energy cells.b Although heat input requirement is w20% of battery capacity, thermal losses are mostly or entirely counteracted by internal I2R losses and therefore little to no actual
parasitic discharge is observed.
J. Leadbetter, L.G. Swan / Journal of Power Sources 216 (2012) 376e386 381
with standard VRLA), potentially making this a promising and lowcost technology option for this application [53e57].
Accurate determination of the SOC of PbeA batteries is an areathat continues to see active research. Knowledge of the SOC iscrucial to battery lifetime as very deep discharges or excessiveovercharges can severely and pre-maturely limit the cycle life ofcells [30,31,58]. Only within the last 20 years has sufficient tech-nology become readily available that can use various measure-ments from the battery to accurately determine the SOC ofleadeacid cells. Methods range in simplicity from basic ampehourcounting with charge loss estimation to Kalman filters and neuralnetworks and combinations thereof [42e47]. The most recentimplementations of neural networks have been able to estimate theSOC within 2%, while a method using a Kalman filter has shownaccuracy within 1% of the actual SOC [44,47]. Many of thesemethods of SOC determination require significant processing,complex coding, and prior knowledge of the particular physicalconstants for a given PbeA cell. This makes implementation ofaccurate SOC determination very much a custom procedure foreach battery system.
3.2. Lithium-ion (Li-ion)
3.2.1. OverviewLi-ion batteries are a recent technology with roots based at Bell
labs in the 1960’s and the first commercialization by Sony in 1990[11]. The defining characteristics of Li-ion batteries are high cyclelife, high energy density, high efficiency, and high cost (seeTable 3), which have led to their use in small format consumerelectronics.
The electrochemical action of a Li-ion battery is different thanmost types of cells. Charge transfer occurs through ion intercalationrather than chemical reaction of the electrodes. Because overchargeand side reactions are minimal the Li-ion battery can achieve over90% energy efficiency and nearly 100% Coulombic efficiency [11].The cathode of a Li-ion cell is commonly made of some form oflithiated metal (M in the following equation) oxide, and the anodeis commonly graphitic carbon. The basic intercalation reaction forLi-ion batteries is as follows [59]:
yC þ LiMO2 / LixCy þ Li1�xMO2, x ¼ w0.5, y ¼ 6 (discharge) (3)
The roots of Li-ion batteries are in small portable electronicsdevices, and as such typical storage capacity ranges from 100 to5000 mAh. These small batteries are not practical for bulk, utilityscale energy storage, and several companies have since developedlarge prismatic type batteries [14]. These larger cells still retain thedistinct performance advantages of the smaller cells but arecapable of integration with multi-MW systems for gridapplications.
The lack of overcharge and side reactions requires the use ofcomplex control circuitry to prevent overcharge which immedi-ately results in overheating and possible failure. Their efficiencyenables high discharge and charge currents which increase therisks associated with overcharging [13]. Fortunately, accuratedetermination of the SOC is possible through various meansincluding ampehour counting, voltage limits, and others [60e63].When combined in series each cell or cell grouping must havecontrol circuitry to ensure balance between each cell. This requiresreliable and somewhat expensive circuitry, pushing the cost of analready expensive battery even higher [10].
3.2.2. Existing installationsThe application of Li-ion batteries to grid-scale storage is
a recent development. A123 Systems has installed 36 MW,w9 MWh of grid connected lithium battery systems in variouslocations serving needs including renewable integration and gridstability [64]. As recently as August 2011, Electrovaya agreed toinstall a 1.2 MWh lithium battery bank in Ontario for renewableenergy integration purposes. Additionally, SAFT announced inAugust 2011 that it will be providing 3MWh of lithium batteries forrenewable integration in France [14]. Overall, the outlook forlithium batteries in grid applications is very positive as the pricecontinues to decline and the performance is improved.
3.2.3. Active researchLi-ion batteries are presently the most actively researched
battery technology due to their wide range of potential uses andsuperior performance to other battery technologies. Presentresearch objectives include reducing production costs, enhancingperformance, increasing lifetime, and enhancing safety. These arebeing implemented by research in cathode and anode materials,electrolyte materials, and manufacturing processes [65,66].Cathode research is the most common area of research for
J. Leadbetter, L.G. Swan / Journal of Power Sources 216 (2012) 376e386382
commercial batteries and is focusing on replacing the traditionalLiCoO2 cathode with materials as LiFePO4, LiMn2O4 (manganesespinel), LiNi0.5Mn1.5O4 (spinel structure) and other materials forincreased energy density, safety, and material availability (costreduction) [59]. Each new cathode material brings a host of newchallenges such as reduced cycle life, voltage differences, incom-patibility with existing electrolytes, or other considerations[59,67,68]. Anode material innovation includes use of LieSn andLieSi electrodes for increased specific energy. Unfortunately suchanodes suffer from material expansion which is being partiallymitigated throughmechanical design [59,69,70]. Highly specializedelectrodes such as the titanate anode aimed at high rate charge/discharge are in early stages [65,71]. Electrolyte selection isa significant component of overall cell safety with the limitedstability range and high vapor pressure of commercial electrolytesbeing unfavorable. Research is ongoing to identify additives forthermal stability, redox shuttles (to protect from overcharge),shutdown separators (to prevent thermal runaway), and otherlithium salts for use as electrolytes [59]. Ionic liquidsmay be used aselectrolytes as theywithstand higher overvoltage than lithium saltsand are often non-toxic [72,73]. As with other chemistries, accuratedetermination of SOC remains an objective and recently developedmethods can determine it to within 1% of the true value [60e63].
3.3. Sodiumesulfur (NaeS)
3.3.1. OverviewNaeS batteries are another relatively new battery technology.
Development was seen in many countries starting in the late-1960’s through mid-1990’s, at which point electric vehicle researchprograms abandoned it as it was becoming apparent the chemistrywas not appropriate for this application [9]. In the 1980’s NGKInsulators began work on developing NaeS for grid-scale applica-tions and ultimately developed a grid-scale product that has seenexponential growth rates of implementation related to grid supportand renewable energy applications [9,10,74]. NaeS batteries areregarded as one of the lowest cost options for grid-scale energystorage [75]. The defining characteristics of NaeS batteries are highcycle life, high energy density, high pulse power capability, andaverage to low cost as given in Table 3.
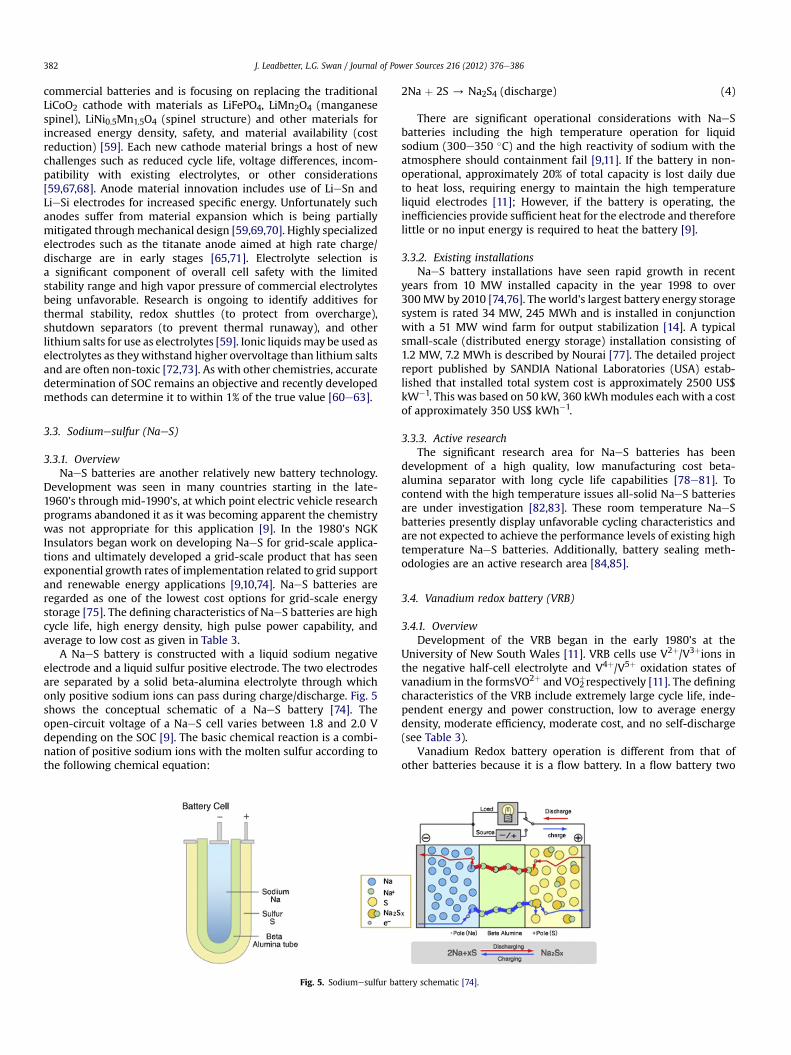
A NaeS battery is constructed with a liquid sodium negativeelectrode and a liquid sulfur positive electrode. The two electrodesare separated by a solid beta-alumina electrolyte through whichonly positive sodium ions can pass during charge/discharge. Fig. 5shows the conceptual schematic of a NaeS battery [74]. Theopen-circuit voltage of a NaeS cell varies between 1.8 and 2.0 Vdepending on the SOC [9]. The basic chemical reaction is a combi-nation of positive sodium ions with the molten sulfur according tothe following chemical equation:
Fig. 5. Sodiumesulfur ba
2Na þ 2S / Na2S4 (discharge) (4)
There are significant operational considerations with NaeSbatteries including the high temperature operation for liquidsodium (300e350 �C) and the high reactivity of sodium with theatmosphere should containment fail [9,11]. If the battery in non-operational, approximately 20% of total capacity is lost daily dueto heat loss, requiring energy to maintain the high temperatureliquid electrodes [11]; However, if the battery is operating, theinefficiencies provide sufficient heat for the electrode and thereforelittle or no input energy is required to heat the battery [9].
3.3.2. Existing installationsNaeS battery installations have seen rapid growth in recent
years from 10 MW installed capacity in the year 1998 to over300MW by 2010 [74,76]. Theworld’s largest battery energy storagesystem is rated 34 MW, 245 MWh and is installed in conjunctionwith a 51 MW wind farm for output stabilization [14]. A typicalsmall-scale (distributed energy storage) installation consisting of1.2 MW, 7.2 MWh is described by Nourai [77]. The detailed projectreport published by SANDIA National Laboratories (USA) estab-lished that installed total system cost is approximately 2500 US$kW�1. This was based on 50 kW, 360 kWhmodules each with a costof approximately 350 US$ kWh�1.
3.3.3. Active researchThe significant research area for NaeS batteries has been
development of a high quality, low manufacturing cost beta-alumina separator with long cycle life capabilities [78e81]. Tocontend with the high temperature issues all-solid NaeS batteriesare under investigation [82,83]. These room temperature NaeSbatteries presently display unfavorable cycling characteristics andare not expected to achieve the performance levels of existing hightemperature NaeS batteries. Additionally, battery sealing meth-odologies are an active research area [84,85].
3.4. Vanadium redox battery (VRB)
3.4.1. OverviewDevelopment of the VRB began in the early 1980’s at the
University of New South Wales [11]. VRB cells use V2þ/V3þions inthe negative half-cell electrolyte and V4þ/V5þ oxidation states ofvanadium in the formsVO2þ and VO2
þrespectively [11]. The definingcharacteristics of the VRB include extremely large cycle life, inde-pendent energy and power construction, low to average energydensity, moderate efficiency, moderate cost, and no self-discharge(see Table 3).
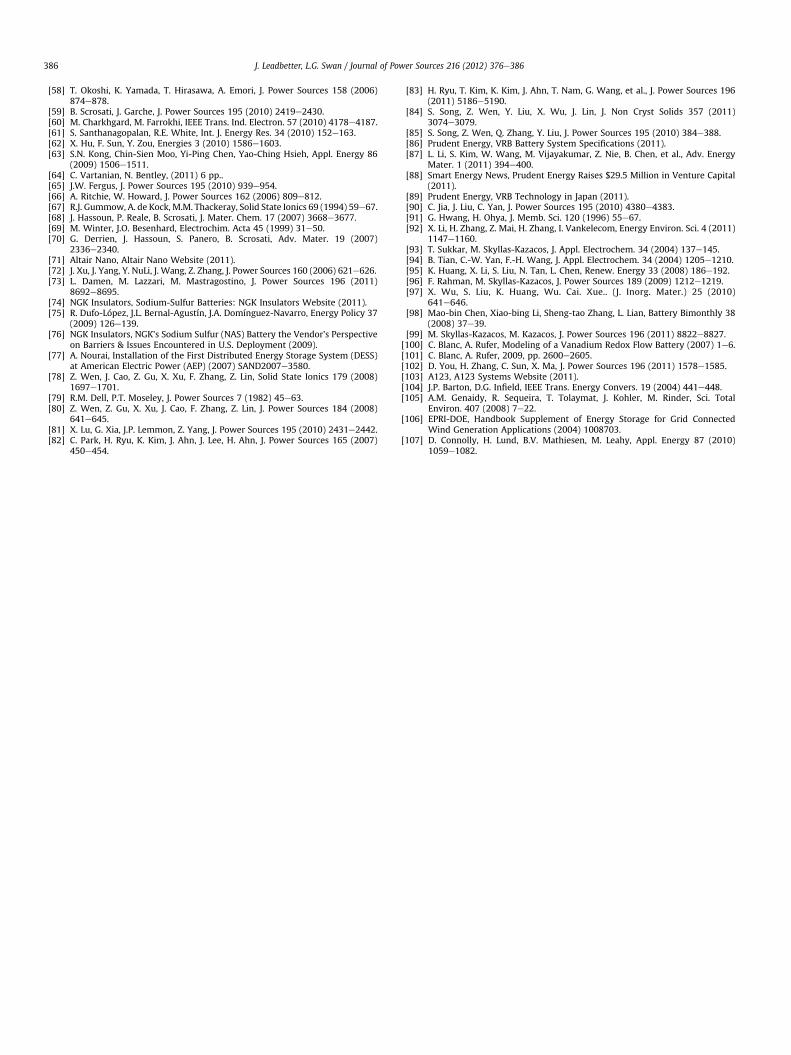
Vanadium Redox battery operation is different from that ofother batteries because it is a flow battery. In a flow battery two
ttery schematic [74].
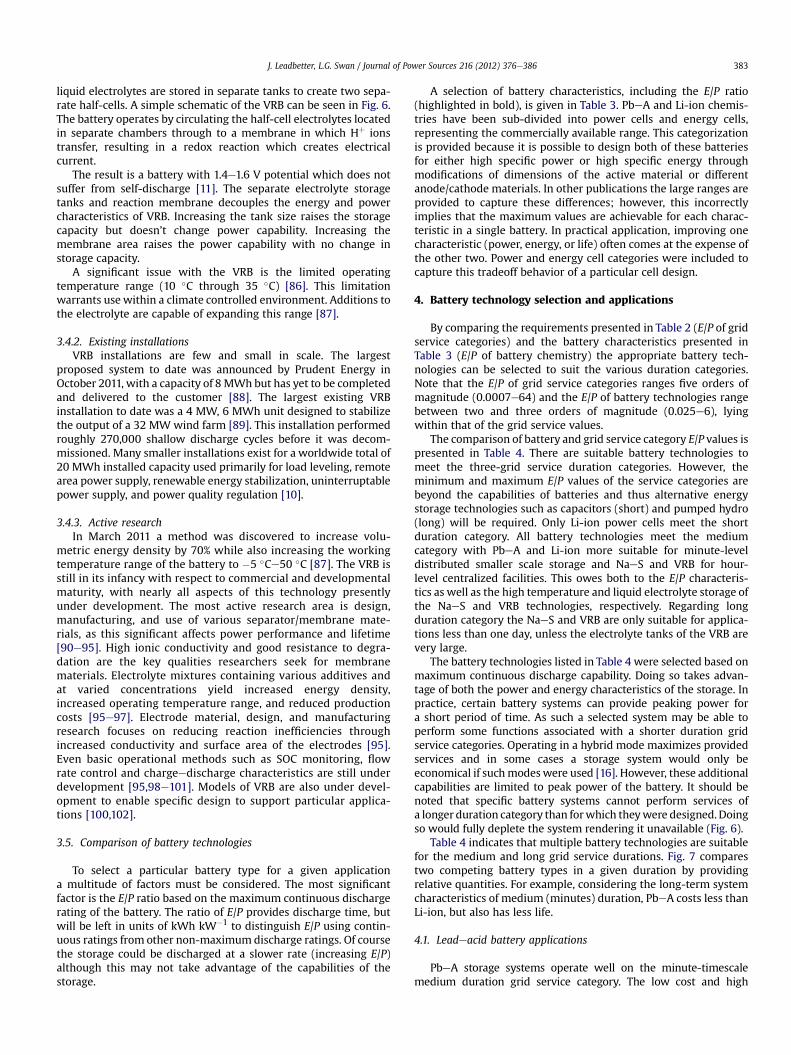
J. Leadbetter, L.G. Swan / Journal of Power Sources 216 (2012) 376e386 383
liquid electrolytes are stored in separate tanks to create two sepa-rate half-cells. A simple schematic of the VRB can be seen in Fig. 6.The battery operates by circulating the half-cell electrolytes locatedin separate chambers through to a membrane in which Hþ ionstransfer, resulting in a redox reaction which creates electricalcurrent.
The result is a battery with 1.4e1.6 V potential which does notsuffer from self-discharge [11]. The separate electrolyte storagetanks and reaction membrane decouples the energy and powercharacteristics of VRB. Increasing the tank size raises the storagecapacity but doesn’t change power capability. Increasing themembrane area raises the power capability with no change instorage capacity.
A significant issue with the VRB is the limited operatingtemperature range (10 �C through 35 �C) [86]. This limitationwarrants use within a climate controlled environment. Additions tothe electrolyte are capable of expanding this range [87].
3.4.2. Existing installationsVRB installations are few and small in scale. The largest
proposed system to date was announced by Prudent Energy inOctober 2011, with a capacity of 8 MWh but has yet to be completedand delivered to the customer [88]. The largest existing VRBinstallation to date was a 4 MW, 6 MWh unit designed to stabilizethe output of a 32 MW wind farm [89]. This installation performedroughly 270,000 shallow discharge cycles before it was decom-missioned. Many smaller installations exist for a worldwide total of20 MWh installed capacity used primarily for load leveling, remotearea power supply, renewable energy stabilization, uninterruptablepower supply, and power quality regulation [10].
3.4.3. Active researchIn March 2011 a method was discovered to increase volu-
metric energy density by 70% while also increasing the workingtemperature range of the battery to �5 �Ce50 �C [87]. The VRB isstill in its infancy with respect to commercial and developmentalmaturity, with nearly all aspects of this technology presentlyunder development. The most active research area is design,manufacturing, and use of various separator/membrane mate-rials, as this significant affects power performance and lifetime[90e95]. High ionic conductivity and good resistance to degra-dation are the key qualities researchers seek for membranematerials. Electrolyte mixtures containing various additives andat varied concentrations yield increased energy density,increased operating temperature range, and reduced productioncosts [95e97]. Electrode material, design, and manufacturingresearch focuses on reducing reaction inefficiencies throughincreased conductivity and surface area of the electrodes [95].Even basic operational methods such as SOC monitoring, flowrate control and chargeedischarge characteristics are still underdevelopment [95,98e101]. Models of VRB are also under devel-opment to enable specific design to support particular applica-tions [100,102].
3.5. Comparison of battery technologies
To select a particular battery type for a given applicationa multitude of factors must be considered. The most significantfactor is the E/P ratio based on the maximum continuous dischargerating of the battery. The ratio of E/P provides discharge time, butwill be left in units of kWh kW�1 to distinguish E/P using contin-uous ratings from other non-maximum discharge ratings. Of coursethe storage could be discharged at a slower rate (increasing E/P)although this may not take advantage of the capabilities of thestorage.
A selection of battery characteristics, including the E/P ratio(highlighted in bold), is given in Table 3. PbeA and Li-ion chemis-tries have been sub-divided into power cells and energy cells,representing the commercially available range. This categorizationis provided because it is possible to design both of these batteriesfor either high specific power or high specific energy throughmodifications of dimensions of the active material or differentanode/cathode materials. In other publications the large ranges areprovided to capture these differences; however, this incorrectlyimplies that the maximum values are achievable for each charac-teristic in a single battery. In practical application, improving onecharacteristic (power, energy, or life) often comes at the expense ofthe other two. Power and energy cell categories were included tocapture this tradeoff behavior of a particular cell design.
4. Battery technology selection and applications
By comparing the requirements presented in Table 2 (E/P of gridservice categories) and the battery characteristics presented inTable 3 (E/P of battery chemistry) the appropriate battery tech-nologies can be selected to suit the various duration categories.Note that the E/P of grid service categories ranges five orders ofmagnitude (0.0007e64) and the E/P of battery technologies rangebetween two and three orders of magnitude (0.025e6), lyingwithin that of the grid service values.
The comparison of battery and grid service category E/P values ispresented in Table 4. There are suitable battery technologies tomeet the three-grid service duration categories. However, theminimum and maximum E/P values of the service categories arebeyond the capabilities of batteries and thus alternative energystorage technologies such as capacitors (short) and pumped hydro(long) will be required. Only Li-ion power cells meet the shortduration category. All battery technologies meet the mediumcategory with PbeA and Li-ion more suitable for minute-leveldistributed smaller scale storage and NaeS and VRB for hour-level centralized facilities. This owes both to the E/P characteris-tics as well as the high temperature and liquid electrolyte storage ofthe NaeS and VRB technologies, respectively. Regarding longduration category the NaeS and VRB are only suitable for applica-tions less than one day, unless the electrolyte tanks of the VRB arevery large.
The battery technologies listed in Table 4 were selected based onmaximum continuous discharge capability. Doing so takes advan-tage of both the power and energy characteristics of the storage. Inpractice, certain battery systems can provide peaking power fora short period of time. As such a selected system may be able toperform some functions associated with a shorter duration gridservice categories. Operating in a hybrid mode maximizes providedservices and in some cases a storage system would only beeconomical if suchmodeswere used [16]. However, these additionalcapabilities are limited to peak power of the battery. It should benoted that specific battery systems cannot perform services ofa longer duration category than forwhich theywere designed. Doingso would fully deplete the system rendering it unavailable (Fig. 6).
Table 4 indicates that multiple battery technologies are suitablefor the medium and long grid service durations. Fig. 7 comparestwo competing battery types in a given duration by providingrelative quantities. For example, considering the long-term systemcharacteristics of medium (minutes) duration, PbeA costs less thanLi-ion, but also has less life.
4.1. Leadeacid battery applications
PbeA storage systems operate well on the minute-timescalemedium duration grid service category. The low cost and high
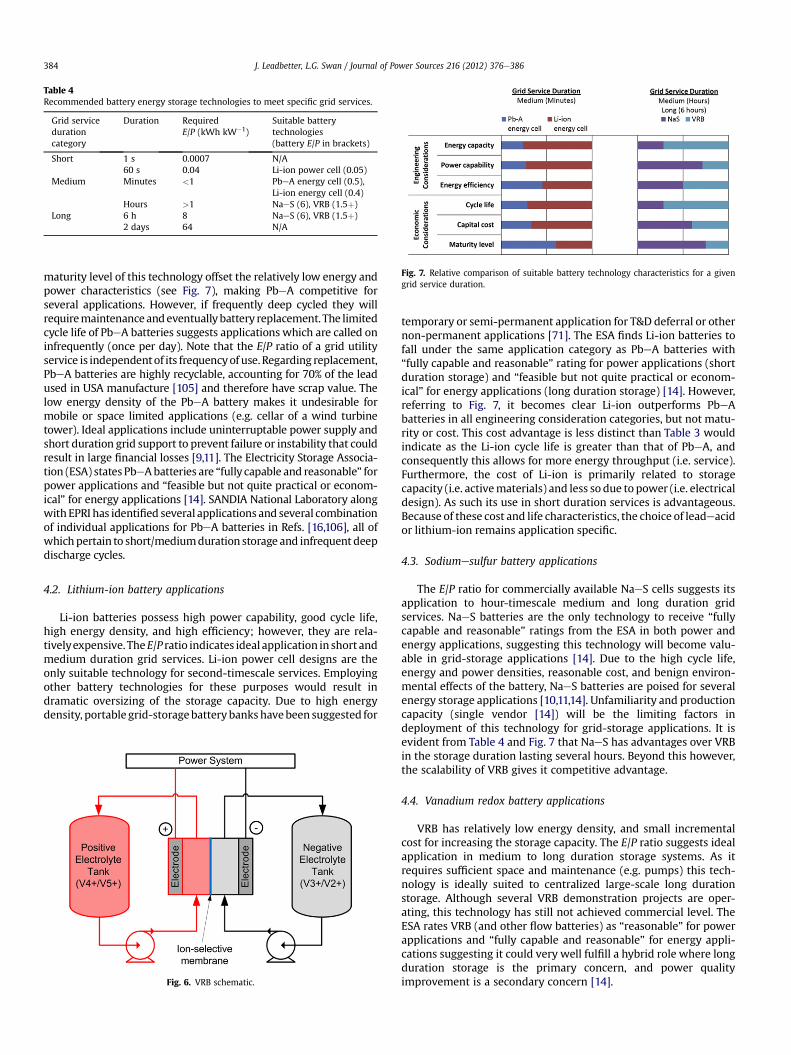
Fig. 7. Relative comparison of suitable battery technology characteristics for a givengrid service duration.
Table 4Recommended battery energy storage technologies to meet specific grid services.
Grid servicedurationcategory
Duration RequiredE/P (kWh kW�1)
Suitable batterytechnologies(battery E/P in brackets)
Short 1 s 0.0007 N/A60 s 0.04 Li-ion power cell (0.05)
Medium Minutes <1 PbeA energy cell (0.5),Li-ion energy cell (0.4)
Hours >1 NaeS (6), VRB (1.5þ)Long 6 h 8 NaeS (6), VRB (1.5þ)
2 days 64 N/A
J. Leadbetter, L.G. Swan / Journal of Power Sources 216 (2012) 376e386384
maturity level of this technology offset the relatively low energy andpower characteristics (see Fig. 7), making PbeA competitive forseveral applications. However, if frequently deep cycled they willrequiremaintenanceandeventuallybattery replacement. The limitedcycle life of PbeA batteries suggests applications which are called oninfrequently (once per day). Note that the E/P ratio of a grid utilityservice is independentof its frequencyof use. Regarding replacement,PbeA batteries are highly recyclable, accounting for 70% of the leadused in USA manufacture [105] and therefore have scrap value. Thelow energy density of the PbeA battery makes it undesirable formobile or space limited applications (e.g. cellar of a wind turbinetower). Ideal applications include uninterruptable power supply andshort duration grid support to prevent failure or instability that couldresult in large financial losses [9,11]. The Electricity Storage Associa-tion (ESA) states PbeAbatteries are “fully capable and reasonable” forpower applications and “feasible but not quite practical or econom-ical” for energy applications [14]. SANDIA National Laboratory alongwithEPRI has identified several applications and several combinationof individual applications for PbeA batteries in Refs. [16,106], all ofwhichpertain to short/mediumduration storage and infrequent deepdischarge cycles.
4.2. Lithium-ion battery applications
Li-ion batteries possess high power capability, good cycle life,high energy density, and high efficiency; however, they are rela-tivelyexpensive. TheE/P ratio indicates ideal application in short andmedium duration grid services. Li-ion power cell designs are theonly suitable technology for second-timescale services. Employingother battery technologies for these purposes would result indramatic oversizing of the storage capacity. Due to high energydensity, portable grid-storagebattery bankshavebeen suggested for
Fig. 6. VRB schematic.
temporary or semi-permanent application for T&D deferral or othernon-permanent applications [71]. The ESA finds Li-ion batteries tofall under the same application category as PbeA batteries with“fully capable and reasonable” rating for power applications (shortduration storage) and “feasible but not quite practical or econom-ical” for energy applications (long duration storage) [14]. However,referring to Fig. 7, it becomes clear Li-ion outperforms PbeAbatteries in all engineering consideration categories, but not matu-rity or cost. This cost advantage is less distinct than Table 3 wouldindicate as the Li-ion cycle life is greater than that of PbeA, andconsequently this allows for more energy throughput (i.e. service).Furthermore, the cost of Li-ion is primarily related to storagecapacity (i.e. activematerials) and less so due to power (i.e. electricaldesign). As such its use in short duration services is advantageous.Because of these cost and life characteristics, the choice of leadeacidor lithium-ion remains application specific.
4.3. Sodiumesulfur battery applications
The E/P ratio for commercially available NaeS cells suggests itsapplication to hour-timescale medium and long duration gridservices. NaeS batteries are the only technology to receive “fullycapable and reasonable” ratings from the ESA in both power andenergy applications, suggesting this technology will become valu-able in grid-storage applications [14]. Due to the high cycle life,energy and power densities, reasonable cost, and benign environ-mental effects of the battery, NaeS batteries are poised for severalenergy storage applications [10,11,14]. Unfamiliarity and productioncapacity (single vendor [14]) will be the limiting factors indeployment of this technology for grid-storage applications. It isevident from Table 4 and Fig. 7 that NaeS has advantages over VRBin the storage duration lasting several hours. Beyond this however,the scalability of VRB gives it competitive advantage.
4.4. Vanadium redox battery applications
VRB has relatively low energy density, and small incrementalcost for increasing the storage capacity. The E/P ratio suggests idealapplication in medium to long duration storage systems. As itrequires sufficient space and maintenance (e.g. pumps) this tech-nology is ideally suited to centralized large-scale long durationstorage. Although several VRB demonstration projects are oper-ating, this technology has still not achieved commercial level. TheESA rates VRB (and other flow batteries) as “reasonable” for powerapplications and “fully capable and reasonable” for energy appli-cations suggesting it could very well fulfill a hybrid role where longduration storage is the primary concern, and power qualityimprovement is a secondary concern [14].

J. Leadbetter, L.G. Swan / Journal of Power Sources 216 (2012) 376e386 385
4.5. Distributed versus central energy storage
Ideal placement of energy storage is system specific and modelsare required to assess the particular benefits of a given placement.Many programs have been developed for simulation of powersystemswith renewable energyandenergy storage systems, ofwhichan excellent review of such programs can be found in Ref. [107].Excessive transmission of electricity results in increased losses, andtherefore storage should generally be located as close to the genera-tion and/or electricity demand as possible. Considering the distrib-uted nature of renewable energy developments and the urbanizationof populations, both distributed and centralized storage have value.
Distributed storage has the advantage of placement directlyalongside distributed generators to support rural integration,especially within medium-voltage distribution electricity grids.PbeA and Li-ion batteries are most suitable for this application dueto their compact, safe, sealed, non-liquid, zero maintenance, andmodular format. This small capacity market will likely not see theuse of NaeS or VRB as they either operate with high temperatures,possess liquid connections, or show poor scaling to small storagecapacities. In this application the majority of the services will beshort and medium duration as they are associated with themedium-voltage grid difficulties.
Central storage has the advantage of economies of scale anddedicated personnel, lending itself to the high temperature NaeSbattery and VRB requiring liquid transfer. With increased scaleapplication to medium and long duration services can be achieved.Management of such systems will appear to the system operatorlike a highly flexible traditional generation source with the addedability to sink power when required. In both the distributed andcentralized storage categories communication and control isa critical aspect which will be met with smart-grid technologies.
5. Conclusion
The electricity grid services required for renewable integrationhave been identified and discussed with regards to energy storagesystems. Energy storage systems provides a means of increasinggrid flexibility and enabling integration of intermittent non-dispatchable generation sources by temporally decoupling thisgeneration from demand. There exists a wide range of storagedurations for various integration services and a single technology isunlikely to fulfill all of these roles. Using E/P values of the gridservices, several battery technologies were identified and selectedon the basis of their own E/P values, after which additional cyclelife, capital cost, energy efficiency, and maturity level are consid-ered. It was found that the variety of grid services do indeeddemand different battery technologies. Based on this frameworkthe applicable battery technologies for short, medium, and longdurations were determined and presented in Table 4. A relativecomparison of competing technologies for a particular grid servicerange is given in Fig. 7.
Acknowledgement
The authors are grateful for the funding provided by the NaturalSciences and Engineering Research Council of Canada through J.Leadbetter’s postgraduate scholarship grant.
References
[1] S. Sorrell, J. Speirs, R. Bentley, A. Brandt, R. Miller, Energy Policy 38 (2010)5290e5295.
[2] Global Wind Energy Association, GWEC Website (2011).
[3] A. Thilak, Analysis of Polysilicon, Wafers, PV Cells and Solar PV Modules to2015 (2011).
[4] British Petroleum, BP Statistical Review of World Energy (June 2011).[5] Hatch, Nova Scotia Wind Integration Study for Nova Scotia Department of
Energy (2008).[6] K.C. Divya, J. Ostergaard, Electr. Power Syst. Res. 79 (2009) 511e520.[7] N.C. Nair, N. Garimella, Energy Build. 42 (2010) 2124e2130.[8] H. Ibrahim, A. Ilinca, J. Perron, Renew. Sust. Energy Rev. 12 (2008) 1221e1250.[9] R.M. Dell, D.A.J. Rand, J. Power Sources 100 (2001) 2e17.
[10] M. Beaudin, H. Zareipour, A. Schellenberglabe, W. Rosehart, Energy Sust. Dev.14 (2010) 302e314.
[11] H. Chen, T.N. Cong, W. Yang, C. Tan, Y. Li, Y. Ding, Prog. Nat. Sci. 19 (2009)291e312.
[12] P.J. Hall, E.J. Bain, Energy Policy 36 (2008) 4352e4355.[13] I. Hadjipaschalis, A. Poullikkas, V. Efthimiou, Renew. Sust. Energy Rev. 13
(2009) 1513e1522.[14] Electricity Storage Association, 2012.[15] J. McDowall, J. Power Sources 162 (2006) 959e964.[16] EPRI-DOE, Handbook of Energy Storage for Transmission and Distribution
Applications (2003) 1001834.[17] P. Denholm, E. Ela, B. Kirby, M. Milligan, The Role of Energy Storage with
Renewable Electricity Generation (2010) NREL/TP-6A2e47187.[18] P.S. Georgilakis, Renew. Sust. Energy Rev. 12 (2008) 852e863.[19] A.Mohd, E. Ortjohann,A. Schmelter, N. Hamsic, D.Morton, 2008, pp. 1627e1632.[20] J.O.G. Tande, Wind Energy 6 (2003) 281e295.[21] B.W. Kennedy, Refocus 5 (2004) 36e37.[22] S. Teleke, M.E. Baran, A.Q. Huang, S. Bhattacharya, L. Anderson, IEEE Trans.
Energy Convers. 24 (2009) 725e732.[23] E. Ela, B. Kirby, ERCOT Event on February 26, 2008: Lessons Learned (2008)
NREL/TP-500e43373.[24] Q. Li, S.S. Choi, Y. Yuan, D.L. Yao, IEEE Trans. Sust. Energy 2 (2011) 148e158.[25] A. Uehara, T. Senjyu, Y. Kikunaga, A. Yona, N. Urasaki, T. Funabashi, et al.,
Study on Optimum Operation Planning of Wind Farm/battery System UsingForecasted Power Data (2009) pp. 907e912.
[26] T.K.A. Brekken, A. Yokochi, A. von Jouanne, Z.Z. Yen, H.M. Hapke,D.A. Halamay, IEEE Trans. Sust. Energy 2 (2011) 69e77.
[27] D. Weisser, R.S. Garcia, Renew. Energy 30 (2005) 1299e1308.[28] J. DeCesaro, K. Porter, Wind Energy and Power System Operations: a Review
of Wind Integration Studies to Date (2009) NREL/SR-550e47256.[29] M. Kohli, Average Energy Prices in New York-Northern New Jersey e July
2011 (2011).[30] D. Linden, T. Reddy, Handbook of Batteries, third ed. McGraw-Hill Profes-
sional, 2001.[31] P. Ruetschi, 127 (2004) 33e44.[32] C.D. Parker, J. Power Sources 100 (2001) 18e28.[33] G.D. Rodriguez, W.C. Spindler, D.S. Carr, J. Power Sources 31 (1990) 311e320.[34] R. Wagner, J. Power Sources 67 (1997) 163e172.[35] M.F. De Anda, J.D. Boyes, W. Torres, Lessons Learned from the Puerto Rico
Battery Energy Storage System (1999) SAND99e2232.[36] J. Liu, D. Yang, L. Gao, X. Zhu, L. Li, J. Yang, J. Power Sources 196 (2011)
8802e8808.[37] L. Tang, A. Li, H. Chen, H. Li, Q. Chen, H. Zhou, et al., Electrochim. Acta 56
(2011) 4566e4570.[38] M. Cugnet, B.Y. Liaw, J. Power Sources 196 (2011) 3414e3419.[39] K. Siniard, M. Xiao, S. Choe, J. Power Sources 195 (2010) 7102e7114.[40] K. Mamadou, T.M.P. Nguyen, E. Lemaire-Potteau, C. Glaize, J. Alzieu, J. Power
Sources 196 (2011) 3981e3987.[41] T. Ikeya, N. Sawada, S. Takagi, J. Murakami, K. Kobayashi, T. Sakabe, et al.,
J. Power Sources 75 (1998) 101e107.[42] J. Alzieu, H. Smimite, C. Glaize, J. Power Sources 67 (1997) 157e161.[43] M. Colemn, C.B. Zhu, C.K. Lee, W.G. Hurley, In: Conference Proceedings e
IEEE Applied Power Electronics Conference and Exposition e APEC, 2005,vol. 2, pp. 991e997.
[44] J. Han, D. Kim, M. Sunwoo, J. Power Sources 188 (2009) 606e612.[45] J.F.A. Leao, L.V. Hartmann, M.B.R. Correa, A.M.N. Lima, Lead-Acid Battery
Modeling and State of Charge Monitoring (2010) 239e243.[46] S. Piller, M. Perrin, A. Jossen, 96 (2001) 113e20.[47] W.X. Shen, Energ. Convers. Manage. 48 (2007) 433e442.[48] P. Ba�ca, K. Micka, P. K�rivík, K. Tonar, P. To�ser, J. Power Sources 196 (2011)
3988e3992.[49] K.R. Bullock, J. Power Sources 195 (2010) 4513e4519.[50] A. Czerwi�nski, S. Obrebowski, J. Kotowski, Z. Rogulski, J. Skowro�nski,
M. Bajsert, et al., J. Power Sources 195 (2010) 7530e7534.[51] A. Kirchev, N. Kircheva, M. Perrin, J. Power Sources 196 (2011) 8773e8788.[52] D. Pavlov, P. Nikolov, T. Rogachev, J. Power Sources 196 (2011) 5155e5167.[53] J. Furukawa, T. Takada, D. Monma, L.T. Lam, J. Power Sources 195 (2010)
1241e1245.[54] L.T. Lam, R. Louey, N.P. Haigh, O.V. Lim, D.G. Vella, C.G. Phyland, et al.,
J. Power Sources 174 (2007) 16e29.[55] P.T. Moseley, R.F. Nelson, A.F. Hollenkamp, J. Power Sources 157 (2006) 3e10.[56] Y. Chen, B. Chen, L. Ma, Y. Yuan, Electrochem. Commun. 10 (2008)
1064e1066.[57] D.G. Enos, T.H. Hund, R. Shane, Understanding the Function and Performance
of Carbon-enhanced Lead-acid Batteries (2011) SAND2011e3460.
J. Leadbetter, L.G. Swan / Journal of Power Sources 216 (2012) 376e386386
[58] T. Okoshi, K. Yamada, T. Hirasawa, A. Emori, J. Power Sources 158 (2006)874e878.
[59] B. Scrosati, J. Garche, J. Power Sources 195 (2010) 2419e2430.[60] M. Charkhgard, M. Farrokhi, IEEE Trans. Ind. Electron. 57 (2010) 4178e4187.[61] S. Santhanagopalan, R.E. White, Int. J. Energy Res. 34 (2010) 152e163.[62] X. Hu, F. Sun, Y. Zou, Energies 3 (2010) 1586e1603.[63] S.N. Kong, Chin-Sien Moo, Yi-Ping Chen, Yao-Ching Hsieh, Appl. Energy 86
(2009) 1506e1511.[64] C. Vartanian, N. Bentley, (2011) 6 pp..[65] J.W. Fergus, J. Power Sources 195 (2010) 939e954.[66] A. Ritchie, W. Howard, J. Power Sources 162 (2006) 809e812.[67] R.J. Gummow, A. de Kock, M.M. Thackeray, Solid State Ionics 69 (1994) 59e67.[68] J. Hassoun, P. Reale, B. Scrosati, J. Mater. Chem. 17 (2007) 3668e3677.[69] M. Winter, J.O. Besenhard, Electrochim. Acta 45 (1999) 31e50.[70] G. Derrien, J. Hassoun, S. Panero, B. Scrosati, Adv. Mater. 19 (2007)
2336e2340.[71] Altair Nano, Altair Nano Website (2011).[72] J. Xu, J. Yang, Y. NuLi, J. Wang, Z. Zhang, J. Power Sources 160 (2006) 621e626.[73] L. Damen, M. Lazzari, M. Mastragostino, J. Power Sources 196 (2011)
8692e8695.[74] NGK Insulators, Sodium-Sulfur Batteries: NGK Insulators Website (2011).[75] R. Dufo-López, J.L. Bernal-Agustín, J.A. Domínguez-Navarro, Energy Policy 37
(2009) 126e139.[76] NGK Insulators, NGK’s Sodium Sulfur (NAS) Battery the Vendor’s Perspective
on Barriers & Issues Encountered in U.S. Deployment (2009).[77] A. Nourai, Installation of the First Distributed Energy Storage System (DESS)
at American Electric Power (AEP) (2007) SAND2007e3580.[78] Z. Wen, J. Cao, Z. Gu, X. Xu, F. Zhang, Z. Lin, Solid State Ionics 179 (2008)
1697e1701.[79] R.M. Dell, P.T. Moseley, J. Power Sources 7 (1982) 45e63.[80] Z. Wen, Z. Gu, X. Xu, J. Cao, F. Zhang, Z. Lin, J. Power Sources 184 (2008)
641e645.[81] X. Lu, G. Xia, J.P. Lemmon, Z. Yang, J. Power Sources 195 (2010) 2431e2442.[82] C. Park, H. Ryu, K. Kim, J. Ahn, J. Lee, H. Ahn, J. Power Sources 165 (2007)
450e454.
[83] H. Ryu, T. Kim, K. Kim, J. Ahn, T. Nam, G. Wang, et al., J. Power Sources 196(2011) 5186e5190.
[84] S. Song, Z. Wen, Y. Liu, X. Wu, J. Lin, J. Non Cryst Solids 357 (2011)3074e3079.
[85] S. Song, Z. Wen, Q. Zhang, Y. Liu, J. Power Sources 195 (2010) 384e388.[86] Prudent Energy, VRB Battery System Specifications (2011).[87] L. Li, S. Kim, W. Wang, M. Vijayakumar, Z. Nie, B. Chen, et al., Adv. Energy
Mater. 1 (2011) 394e400.[88] Smart Energy News, Prudent Energy Raises $29.5 Million in Venture Capital
(2011).[89] Prudent Energy, VRB Technology in Japan (2011).[90] C. Jia, J. Liu, C. Yan, J. Power Sources 195 (2010) 4380e4383.[91] G. Hwang, H. Ohya, J. Memb. Sci. 120 (1996) 55e67.[92] X. Li, H. Zhang, Z. Mai, H. Zhang, I. Vankelecom, Energy Environ. Sci. 4 (2011)
1147e1160.[93] T. Sukkar, M. Skyllas-Kazacos, J. Appl. Electrochem. 34 (2004) 137e145.[94] B. Tian, C.-W. Yan, F.-H. Wang, J. Appl. Electrochem. 34 (2004) 1205e1210.[95] K. Huang, X. Li, S. Liu, N. Tan, L. Chen, Renew. Energy 33 (2008) 186e192.[96] F. Rahman, M. Skyllas-Kazacos, J. Power Sources 189 (2009) 1212e1219.[97] X. Wu, S. Liu, K. Huang, Wu. Cai. Xue.. (J. Inorg. Mater.) 25 (2010)
641e646.[98] Mao-bin Chen, Xiao-bing Li, Sheng-tao Zhang, L. Lian, Battery Bimonthly 38
(2008) 37e39.[99] M. Skyllas-Kazacos, M. Kazacos, J. Power Sources 196 (2011) 8822e8827.
[100] C. Blanc, A. Rufer, Modeling of a Vanadium Redox Flow Battery (2007) 1e6.[101] C. Blanc, A. Rufer, 2009, pp. 2600e2605.[102] D. You, H. Zhang, C. Sun, X. Ma, J. Power Sources 196 (2011) 1578e1585.[103] A123, A123 Systems Website (2011).[104] J.P. Barton, D.G. Infield, IEEE Trans. Energy Convers. 19 (2004) 441e448.[105] A.M. Genaidy, R. Sequeira, T. Tolaymat, J. Kohler, M. Rinder, Sci. Total
Environ. 407 (2008) 7e22.[106] EPRI-DOE, Handbook Supplement of Energy Storage for Grid Connected
Wind Generation Applications (2004) 1008703.[107] D. Connolly, H. Lund, B.V. Mathiesen, M. Leahy, Appl. Energy 87 (2010)
1059e1082.