Embed Size (px)
Citation preview
!
UNIVERSITAT AUTÒNOMA DE BARCELONA
Departament de Genètica i Microbiologia
Facultat de Biociències
Selection Of Phototrophic Microorganisms For Use As Bioindicators Of Heavy Metals
In Natural Environments. Optimization Of High-Resolution
Microscopy Techniques.
Juan Maldonado Ortiz
2011

!
UNIVERSITAT AUTÒNOMA DE BARCELONA
Departament de Genètica i Microbiologia
Facultat de Biociències
Selection Of Phototrophic Microorganisms For Use As Bioindicators Of Heavy Metals
In Natural Environments. Optimization Of High-Resolution
Microscopy Techniques.
Memòria de Tesi presentada per obtenir el grau de Doctor en Microbiolgia per la Universitat Autònoma de Barcelona, per Juan Maldonado Ortiz.
Vist i plau dels Directors de la Tesi, Dra. Isabel Esteve Martínez Dr. Antonio Solé Cornellà
Bellaterra, Juliol 2011


!
Everything is everywhere, but the environment selects
Lourens G. M. Baas Becking

!
Agradecimientos - Agraïments - Acknowledgments
investigar. (Del lat. investig!re). Realizar actividades intelectuales y experimentales de modo sistemático con el propósito de aumentar los conocimientos sobre una determinada materia.
Cuando me preguntaban de pequeño, que quería ser de mayor o a que me gustaría dedi-car, yo decía siempre: quiero ser biólogo, científico, investigador. Creo que algo he conseguido en parte, aunque se que todavía me queda mucho camino, todavía tengo muchas ganas de aprender pero sobre todo, de investigar. Llegar hasta aquí después de 4 años, no ha sido para nada una tarea fácil. Si miro hacia atrás han sido muchas horas de esfuerzo y dedicación, buenos y malos momentos (también los tiene que haber, no?), pero el final de ese viaje o camino, llega y aquí está la recompensa.
En primer lloc, vull agraïr a la meva directora de tesi, la Dra. Isabel Esteve ja que gràcies a ella he pogut realitzar aquest treball. Isabel, em quedo sense paraules per agraïr tot el que m’has ensenyat, aconsellat i el gran suport que m’has donat en tot aquest temps, moltes gràcies. Gràcies també al meu altre director de tesi, el Dr. Antoni Solé per haver-me ensenyat tant desde el primer dia i per recordar-me que pensant una mica en positiu, res, només una mica, les coses surten.
Muchas gracias a todas las personas que están o han pasado durante este tiempo por el
Laboratorio de Ecología Microbiana de la UAB, habéis sido muy importantes para mi, ahí vais: Elia!!!! que rápido pasa el tiempo, parece ayer cuando entre al lab. Te agradezco tanto…uff… que no se ni por donde empezar ni acabar, en serio. He aprendido muchísimo estos años gracias a ti, tanto a nivel profesional como a nivel personal que no me salen las palabras para poder describirlo. Muchas gracias!. Mireia!! Malgrat haver estat poc temps junts al lab, gràcies per donar-me consells i suport quan ho necessitava. Gràcies per ensenyar-me a fer els meus primers pasos amb metalls i cianobacteris ja que m’han servit moltíssim per fer aquesta historieta. Et desitjo lo millor Miris!. Zully, gracias por estos tres años juntos en el laboratorio, por tantos consejos, ayuda, “técnicas microbiológicas peruanas” (jeje) pero sobretodo gracias por despren-der esa energía latina que corre por tus venas y que siempre me hacia, y todavía me hace sonreir. Te deseo todo lo mejor. Eduard i Anama! Us poso en el mateix calaix, els dos sou “tal para cual”. Moltes gràcies per tants bons moments, per fer-me la punyeta, per ser tant revolucionaris i per donar-me tants ànims en aquests anys junts, gràcies als dos, la veritat trobare a faltar aquell, Joaaaaaann! a les 9 del matí. Massimiliano Baratelli, gracie mille!. Tu también eres parte de esta tesis, ya que es parte de tu trabajo (bueno nuestro, jeje) con Paracoccus sp. DE2007 (mírate el Chapter 4!). Eres de lo que no hay Max, gracias por recordarme que cualquier cosa puede ser aplicada en biotecnologia y/o ser patentada. Con respecto las últimas incorporaciones en el lab, Marina, Álvaro y Jordi, chicos os deseo lo mejor en vuestra vida investigadora aquí o dónde continúe!. Gracias por este último año de doctorado juntos!. He de agradecer también el soporte de nuestras técnicos de laboratorio, Cris, Pili, Sandra y Merche ya que gracias ellas siempre tenía el material de laboratorio (medios, botellas, tubitos de tapón verde de 7 mL autoclavados…) a punto. Gracias por tantos consejos, resolución de dudillas y de buenos momentos en el labora-torio. Por último hacer mención especial a los protagonistas de esta tesis que són: Micrococcus luteus DE2008, Paracoccus sp. DE2007, Microcoleus chthonoplastes, DE2009 microalga, Oscilla-
toria sp. PCC 7515, Chroococcus sp. PCC 9106, Spirulina sp. PCC 6313 y los microcosmos de los tapetes microbianos del Delta del Ebro. Ellos han sido la base mas importante de este trabajo.
He de agradecer también, a mis compañeros y compañeras del Laboratorio de Micobac-
teriologia que han sido de grandísima ayuda y apoyo. Agraïr a la Sílvia, per tants… no! tantís-sims moments junts, pels cafés a les 8 del vespre (i 8 del matí), per tantes “hores de terapia”, per escoltar-me quan ho necessitava i donar-me tot el suport, per riure amb els meus acudits dolents, per descobrirme grups de música nous…en fi Sílvia la llista no s’acaba! … moltes gràcies, ets genial!. A l’Esther… (a.k.a WikiEsther.com, senyors/res aquesta dona ho sap tot!) Moltes gràcies! per donar tants ànims, per ser tant… insitent (viatge a Roma), per tants consells (però molts!), per tantes historietes; sobre tot aquelles que començen: “Segurament, vosaltres no ha-vieu nascut…”. Oihane!! Que ya está! Jo, como ha volao el tiempo no? Gracias por compartir tantos momentos en el trabajo y fuera de él! Pero se que te tengo que agradecer una cosa que sino te lo agradezco me matarás porque se que te acuerdas… ayudarme a diferenciar un gram-positivo de un gram-negativo (pssst no se lo digas a nadie!). Hasier! resumiendo: “eres un crack”… gracias por tantisimos buenos momentos, por favor no cambies nunca, sigue así y llegarás muy lejos, de verdad. Lluiiiis! Gràcies per tantes bones estones amb la Sílvia, us trobaré a faltar als dos, pero molt, molt i molt!, un petó al front!!!. Ceci, al final te he puesto aquí, porque hija no sabía donde ponerte! (es broma!). Ahora con tus micobacterias y sus cuerdas…ves con cuidado que me he enterado que aumentan la fertilidad en la mujer… je je vales un montón, te deseo lo mejor. Muito obrigado! Ya por último agradecer también a Gemma por traer esa sonri-sa en las reuniones de la 3ª planta y a Marina Luquin por esos deliciosos crepes de jamon y que-so de cada Navidad, me tienes que dar la receta!.
De la 4ª planta del Departamento agradezco a mucha gente…Agnes, Joan R, Denis, Lui-
sa, Nuria T. Fran Pérez… pero en especial a tres personas que casi cada dia subía a darles la “ta-barra”: Laura Garrido, que muchas gracias por todo en esta etapa juntos, no la olvidaré nunca, de verdad. Voy a echar de menos tantas cosas… sobre todo tu sonrisa y tus animos. Te deseo mucha suerte campeona. Naroa muchas gracias por darme tantos ánimos y por desprender esa energia tan positiva (te envidio mucho) ahora ya se porque funcionan tan bien tus pilas micro-bianas, por cierto, ¿Para cuándo coches híbridos? je je mucha suerte. Laura Medina! Que no ploris, si-us-plau!? Muchas gracias por compartir tantos buenos momentos en el máster, en el Departamento, por ayudarme a desconectar del trabajo (que a veces me hacía falta) y por descu-brirme tantos sitios “guayones” para comer en Barcelona, bueno y los que nos quedan no? Molta sort i gràcies.
Oops! Que no me puedo olvidar de nuestras secres: Conchi, Julia y Maite, gracias por
todo. Gracias a todo Servei de Microscòpia de la UAB, ya que sin ellos no hubiera sido posible
este trabajo. Las horas que me he pasado allí abajo, buf! Ya me quedaba poco para tener el Season-Pass!. Pero en especial, de ese lugar, sub-mundo sin cobertura, ni Wi-Fi, ni luz solar… quiero agradecer a Alex por tantas horas de buenos momentos, chistes y frases para recordar, pero también por darme tantos buenos consejos, muchas gracias. Pero antes de dejar el Servei… no me podía despedir sin hacer una mención especial (otra vez) a todos los microscopios, soft-wares, detectores y aparatos varios; TEM, SEM, EDX, CLSM, detector espectrofluorométrico
!
(a.k.a "scan), punto crítico, metalizador de Au, Leica e INCA software. También gracias a todos ellos.
He de agradecer al grupo de Robert Duran de l’Equipe Environnement et Microbiologie,
IPREM, Université de Pau et des Pays de l’Adour de Francia por toda la ayuda en estos años y la indentificación molecular de Micrococcus .luteus, antes también conocida como: Colonia B. Agradecer también a Carmen Ascaso y Asunción de los Rios del Instituto de Recursos Naturales, Centro de Ciencias Medioambientales (CSIC) de Madrid, que nos estan ayudando a indentificar la microalga DE2009.
Gràcies també al Ramón i al Marc Alamany (Ecologia Portuaria S.L.) per tantes rialles
als viatges del congressos i gràcies per resoldre’m el dubte de com gira la Lluna al voltant de la Terra amb un got de cafè glacé.
MUCHAS GRACIAS (y lo digo en mayúsculas) a mis amigos de la carrera. Algunos nos
conocemos desde hace casi 10 años (buah! como pasa el tiempo), Isaac, Julio, Víctor, Núria, Gemma, Bego, Marta, Natalia, Debs, Noelia, Juanra, Marc, Laura García, Laura Garrido, Nadia, Loreto, Merche… lo siento si me dejo a alguien. Me gustaría poder hacer unas líneas para cada uno de vosotros, porque sois todos geniales de verdad, pero es que si no esto se va a parecer la biblia! Je je. Muchas gracias por tantísimos momentos juntos en viajes, comidas, cenas, meren-dolas, fiestas, horas y horas en la bilbioteca, coffes, UNO’s, casas rurales… chicos la lista no se acaba. Os agradezco todo el apoyo (que ha sido muchísimo) que me habéis dado durante todo este tiempo. Os deseo lo mejor y mucha suerte a todos.
Thank you Corey, you are part of this PhD Thesis (Did you see cover?). Thanks for ma-
king me grow a little more as a person in these years, thanks for improving my English and thank you for believing that I can change the world cleaning the ocean with my bugs (I have yet to figure out how) thank you buddy. Xavi, gràcies per dir-me sempre: “arribaras ben lluny, nen” (em pujaba molt l’autoestima eh??) i per corregir-me taaaantes faltes ortogràfiques (sóc un pun-yetero desastre!). Danke Matthias, por tantas risas, por tantos cafés-terapia, por alguna traduc-ción que otra del inglés cuando no estaba seguro… y por darme tantos ánimos, moltes gràcies. Cesc, moltes gràcies per obligar-me forçadament (podríem dir, literalement) a desconnectar de la tesi de tant en tant (i.e cines, sopars, crusans de xocolata…). A en Joan T. per tantes hores de desconnexió en Gràcia i a més a més per fer-me soci del Club dels Voll-Dammistes. Gràcies Joanet!.
Seguramente me dejo a alguien, ahora mismo mis neuronas creo que ya no pueden mas.
De todas maneras, gracias a todos los que habéis hecho posible que llegue hasta aquí. Ya para acabar, quiero dedicar todo este trabajo a mi familia. Gracias por todo el apoyo
y ánimos que me habéis dado (y me seguís dando). Muchas gracias.

!
Resum
En aquest treball s'ha determinat l'efecte i la capacitat de captació dels metalls pe-
sants (Pb i Cu) per part de diferents microorganismes fotòtrofs i heteròtrofs, mitjançant
tècniques microscòpiques d'alta resolució per tal de seleccionar microorganismes com a
indicadors de contaminació per metalls.
Per a aquest objectiu, han estat seleccionats diferents microorganismes fotòtrofs
aïllats dels tapets microbians del delta de l'Ebre (un ecosistema declarat Parc Natural al
1983) i cianobacteris de la col.lecció de cultius Pasteur (PCC). Aquests tapets on domi-
nen els microorganismes fotosintètics com els cianobacteris i les algues (productors
primaris en aquests ecosistemes) poden patir contaminació per compostos tòxics com
ara el petroli o els metalls pesants. En aquest treball, els metalls assajats per a la selecció
de bioindicadors, han estat el plom (Pb) i el coure (Cu) donat que tots dos s'han detectat
en el riu Ebre, i també perquè el primer és molt tòxic i no presenta cap funció biològica i
el segon és en canvi un element essencial a baixes dosis i tòxic a elevades dosis.
Per determinar la sensibilitat a un metall (tolerància-resistència), s'ha utilitzat la
microscopia làser confocal acoblada a un detector espectrofluoromètric (CLSM-"scan).
Els resultats demostren que Chroococcus sp. PCC 9106 i la microalga DE2009 presenten
una major tolerància a Pb (0.5 mM) que Oscillatoria sp. PCC 7515 i Spirulina sp. 6313
(0,1 mM).
Per determinar la biocaptació externa i interna del metall, s'ha utilitzat la micros-
còpia electrònica de rastreig (SEM), la microscòpia electrònica de transmissió (TEM) i el
microanàlisi d'energia dispersiva per raigs X (EDX) acoblada a aquests dos microscopis.
Els resultats indiquen que, tots els microorganismes utilitzats (tant els fotòtrofs com els
heteròtrofs) tenen la capacitat d'acumular Pb i Cu externament en el seu EPS.
Finalment, l'anàlisi de les seccions ultrafines (TEM-EDX) mostra que tots els mi-
croorganismes fotòtrofs estudiats acumulen Pb en les inclusions de polifosfat (PP).
Per contra, els bacteris heteròtrofs tot i presentar aquestes inclusions, no acumu-
len cap dels dos metalls, ni en el citoplasma ni en les inclusions intracel·lulars.
Una vegada provada l'eficàcia d'aquestes tècniques microscòpiques tant en els
microorganismes aïllats de l'ambient natural com en els de col.lecció, s'ha realitzat el
mateix tipus d'assajos en microcosmos, amb l'objectiu d'obtenir bons bioindicadors de
contaminació per metalls, tenint com a objectiu final la seva aplicació en l'ambient natu-
ral. En aquests experiments s'ha assajat únicament el Pb, i s'ha comprovat que igual que
en els cultius, els microorganismes més abundants seleccionats en aquest sistema artifi-
cial, Lyngbya-like i Phormidium-like (cianobacteris) tenen la capacitat d'acumular
aquest metall tant externa com internament i sempre en inclusions de PP.
Considerant tots els resultats obtinguts es podria concloure que tots els ciano-
bacteris i la microalga DE2009 analitzats podrien ser considerats bons indicadors de
contaminació per metalls. No obstant això, Oscillatoria sp. i Microcoleus sp. han estat
seleccionats per ser: els més abundants en l'ambient natural, de major grandària, tole-
rants a elevades concentracions de metalls i finalment per la seva capacitat d'acumular-
los extra i intracel·lularment.
!
Resumen
En este trabajo se ha determinado el efecto y la capacidad de captación de los
metales pesados (Pb y Cu) por parte de diferentes microorganismos fotótrofos y heteró-
trofos, mediante técnicas microscópicas de alta resolución con el fin de seleccionar mi-
croorganismos como indicadores de contaminacion por metales.
Para este objetivo, han sido seleccionados diferentes microorganismos fotótrofos
aislados de los tapetes microbianos del delta del Ebro (un ecosistema declarado Parque
Natural en 1983) y cianobacterias de la colección de cultivos Pasteur (PCC). Estos tape-
tes en los que dominan los microorganismos fotosintéticos como las cianobacterias y las
algas (productores primarios en estos ecosistemas) pueden sufrir contaminación por
compuestos tóxicos tales como el petróleo o los metales pesados. En este trabajo, los
metales ensayados para la selección de bioindicadores, han sido el plomo (Pb) y el cobre
(Cu) ya que ambos se han detectado en el río Ebro, y también porqué el primero es muy
tóxico y no presenta ninguna función biológica y el segundo es en cambio un elemento
esencial a bajas dosis y tóxico a elevadas dosis.
Para determinar la sensibilidad a un metal (tolerancia-resistencia), se ha utiliza-
do la microscopia láser confocal acoplada a un detector espectrofluorométrico (CLSM-
"scan). Los resultados demuestran que Chroococcus sp. PCC 9106 y la microalga
DE2009 presentan una mayor tolerancia al Pb (0.5 mM) que Oscillatoria sp. PCC 7515 y
Spirulina sp. 6313 (0.1 mM).
Para determinar la biocaptación externa e interna del metal, se ha utilizado la
microscopia electrónica de barrido (SEM), la microscopia electrónica de transmisión
(TEM) y el microanálisis de energía dispersiva por rayos X (EDX) acoplada a estos dos
microcoscopios. Los resultados indican que, todos los miroorganismos utilizados (tanto
fototrófos como heterótrofos) tienen la capacidad de acumular Pb i Cu externamente en
el EPS.
Finalmente, el análisis de las secciones ultrafinas (TEM-EDX) muestra que todos
los microorganismos fotótrofos estudiados acumulan Pb en las inclusiones de polifosfa-
to (PP).
Por el contrario las bacterias heterótrofas a pesar de presentar estas inclusiones,
no acumulan ninguno de los dos metales, ni el en citoplasma ni en las inclusiones intra-
celulares.
Una vez probada la eficacia de estas técnicas microscópicas tanto en los microor-
ganismos aislados del ambiente natural como en los de coleccion, se ha realizado el
mismo tipo de ensayos en microcosmos, con el objetivo de obtener buenos bioindicado-
res de contaminación por metales, teniendo como objetivo final su aplicación en el am-
biente natural. En estos experimentos se ha ensayado únicamente el Pb, y se ha compro-
bado que al igual que en los cultivos, los microorganismos más abundantes selecciona-
dos en este sistema artificial, Lyngbya-like y Phormidium-like (cianobacterias) tienen la
capacidad de acumular este metal tanto externa como internamente y siempre en inclu-
siones de PP.
Considerando todos los resultados obtenidos podría concluirse que todas las
cianobacterias y la microalga DE2009 analizadas podrían ser consideradas buenos indi-
cadores de contaminación por metales. No obstante, Oscillatoria sp. y Microcoleus sp.
han sido seleccionados por ser: los mas abundates en el ambiente natural; de mayor ta-
maño; tolerantes a elevadas concentraciones de metales y finalmente por su capacidad
de acumularlos extra e intracelularmente.
!
Summary
In this work, the effect and capacity to capture heavy metals (Pb and Cu) of dif-
ferent phototrophic and heterotrophic microorganisms have been studied through
high-resolution microscopy techniques in order to select microorganisms as metal pol-
lution indicators. For this purpose, different phototrophic microorganisms isolated from Ebro
Delta microbial mats (an ecosystem declared as Natural Park in 1983) and cyanobacteria
from the Pasteur culture collection (PCC) have been selected. These mats, dominated by
photosynthetic microorganisms like cyanobacteria and algae (primary producers in the-
se habitats) can suffer pollution by toxic compounds such as oil or heavy metals. In this
study, metals tested to select the bioindicators were lead (Pb) and copper (Cu), as both
have been detected in the Ebro River, and also because the former is very toxic, showing
no biological function, while the latter, by contrast, is an essential element at low doses,
while at high doses it is toxic.
To determine the sensitivity to a metal (tolerance-resistance), confocal laser mi-
croscopy coupled to a spectrofluorometric detector (CLSM-"scan) has been used. The
results show that Chroococcus sp. PCC 9106 and DE2009 microalgae show greater toler-
ance to lead Pb (0.5 mM) than Oscillatoria sp. PCC 7515 and Spirulina sp. 6313 (0.1
mM).
To determine the external and intracellular metal biocapture, scanning electron
microscopy (SEM), transmission electron microscopy (TEM) and energy dispersive X-
ray microanalysis (EDX) coupled with these microscopes have been used, respectively.
The results indicated that, all the microorganisms tested (both phototrophic and hetero-
trophic) have capacity to accumulate Pb and Cu externally in the EPS.
Finally, the analysis of ultrathin sections (TEM-EDX) shows that all the photo-
trophic microorganisms studied accumulate Pb in the polyphosphate inclusions (PP).
By contrast, although the heterotrophic bacteria show these inclusions, they do
not accumulate either of the two metals either in cytoplasm or in intracellular inclusions.
Once the effectiveness of these microscopy techniques has been shown both in
microorganisms isolated from the natural environment and in those from the culture
collection, the same tests have been carried out in microcosms in order to obtain good
bioindicators of metal pollution, with the ultimate aim of applying them in the natural
environment. In these experiments it has been shown that, as in cultures, the most
abundant microorganisms selected in this artificial ecosystem, Lyngbya-like and Phor-
midium-like (cyanobacteria), have the capacity to accumulate this metal both externally
and internally, always in PP inclusions.
Considering all the results obtained it can be concluded that all cyanobacteria
and DE2009 microalga analysed could be considered good metal pollution indicators.
However, Oscillatoria sp. and Microcoleus sp. have been selected as the best indicators of
metal pollution in the natural environment because: they are the most abundant, largest
in size, tolerant to high concentrations of metals and, finally, capable of accumulating
metal extra- and intracellularly.
!
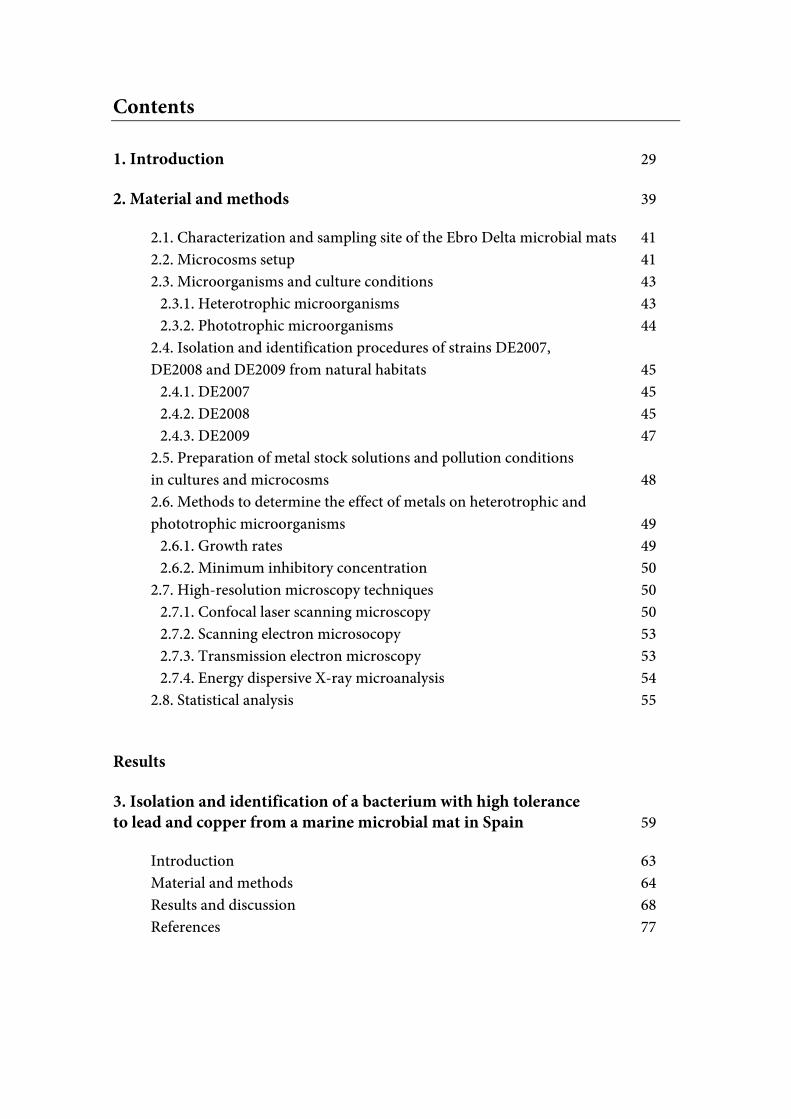
Contents 1. Introduction 29 2. Material and methods 39
2.1. Characterization and sampling site of the Ebro Delta microbial mats 41 2.2. Microcosms setup 41 2.3. Microorganisms and culture conditions 43
2.3.1. Heterotrophic microorganisms 43 2.3.2. Phototrophic microorganisms 44
2.4. Isolation and identification procedures of strains DE2007, DE2008 and DE2009 from natural habitats 45
2.4.1. DE2007 45 2.4.2. DE2008 45 2.4.3. DE2009 47
2.5. Preparation of metal stock solutions and pollution conditions in cultures and microcosms 48 2.6. Methods to determine the effect of metals on heterotrophic and phototrophic microorganisms 49
2.6.1. Growth rates 49 2.6.2. Minimum inhibitory concentration 50
2.7. High-resolution microscopy techniques 50 2.7.1. Confocal laser scanning microscopy 50 2.7.2. Scanning electron microsocopy 53 2.7.3. Transmission electron microscopy 53 2.7.4. Energy dispersive X-ray microanalysis 54
2.8. Statistical analysis 55 Results 3. Isolation and identification of a bacterium with high tolerance to lead and copper from a marine microbial mat in Spain 59
Introduction 63 Material and methods 64 Results and discussion 68 References 77
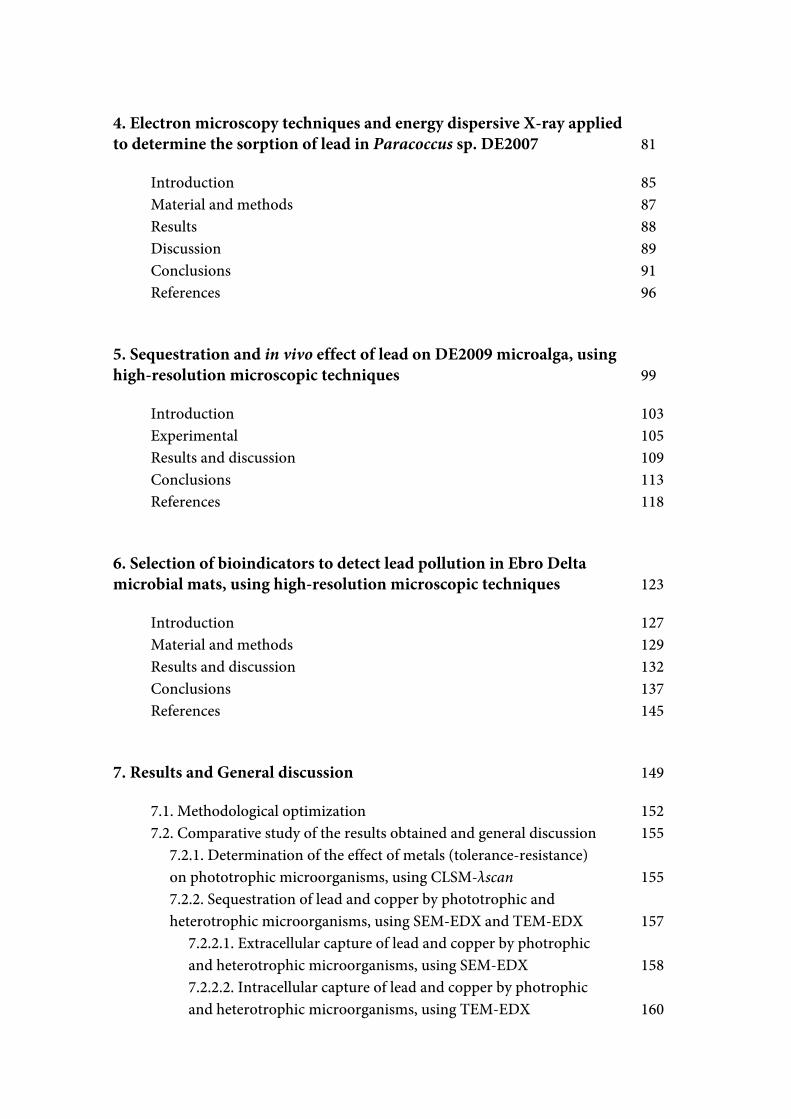
4. Electron microscopy techniques and energy dispersive X-ray applied to determine the sorption of lead in Paracoccus sp. DE2007 81
Introduction 85 Material and methods 87 Results 88 Discussion 89 Conclusions 91 References 96
5. Sequestration and in vivo effect of lead on DE2009 microalga, using high-resolution microscopic techniques 99
Introduction 103 Experimental 105 Results and discussion 109 Conclusions 113 References 118
6. Selection of bioindicators to detect lead pollution in Ebro Delta microbial mats, using high-resolution microscopic techniques 123
Introduction 127 Material and methods 129 Results and discussion 132 Conclusions 137 References 145
7. Results and General discussion 149
7.1. Methodological optimization 152 7.2. Comparative study of the results obtained and general discussion 155
7.2.1. Determination of the effect of metals (tolerance-resistance) on phototrophic microorganisms, using CLSM-!scan 155 7.2.2. Sequestration of lead and copper by phototrophic and heterotrophic microorganisms, using SEM-EDX and TEM-EDX 157
7.2.2.1. Extracellular capture of lead and copper by photrophic and heterotrophic microorganisms, using SEM-EDX 158 7.2.2.2. Intracellular capture of lead and copper by photrophic and heterotrophic microorganisms, using TEM-EDX 160

!
8. Conclusions and Future prospects 163 References 169 Annex I 187 Annex II 193

!
Tables and figures
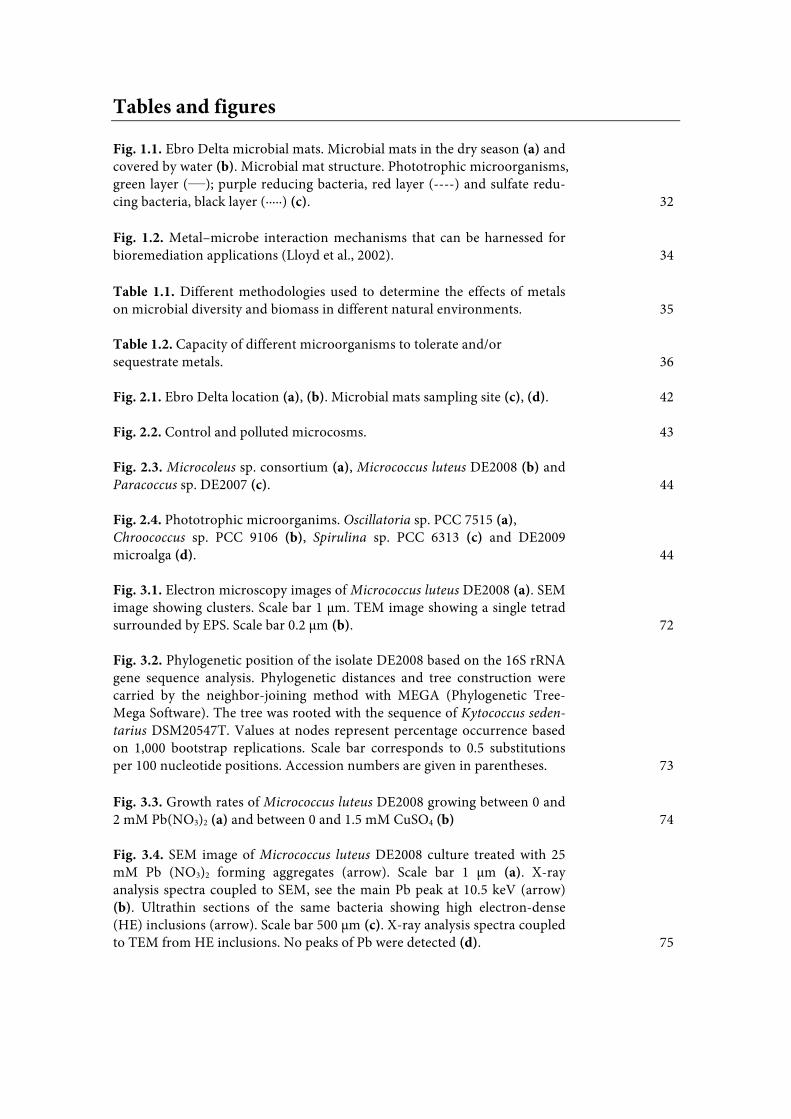
Fig. 1.1. Ebro Delta microbial mats. Microbial mats in the dry season (a) and covered by water (b). Microbial mat structure. Phototrophic microorganisms, green layer (____); purple reducing bacteria, red layer (----) and sulfate redu-cing bacteria, black layer (·····) (c). 32 !Fig. 1.2. Metal–microbe interaction mechanisms that can be harnessed for bioremediation applications (Lloyd et al., 2002). 34 !Table 1.1. Different methodologies used to determine the effects of metals on microbial diversity and biomass in different natural environments. 35 Table 1.2. Capacity of different microorganisms to tolerate and/or sequestrate metals. 36 Fig. 2.1. Ebro Delta location (a), (b). Microbial mats sampling site (c), (d). 42 Fig. 2.2. Control and polluted microcosms. 43 Fig. 2.3. Microcoleus sp. consortium (a), Micrococcus luteus DE2008 (b) and Paracoccus sp. DE2007 (c). 44 Fig. 2.4. Phototrophic microorganims. Oscillatoria sp. PCC 7515 (a), Chroococcus sp. PCC 9106 (b), Spirulina sp. PCC 6313 (c) and DE2009 microalga (d). 44 Fig. 3.1. Electron microscopy images of Micrococcus luteus DE2008 (a). SEM image showing clusters. Scale bar 1 μm. TEM image showing a single tetrad surrounded by EPS. Scale bar 0.2 μm (b). 72 Fig. 3.2. Phylogenetic position of the isolate DE2008 based on the 16S rRNA gene sequence analysis. Phylogenetic distances and tree construction were carried by the neighbor-joining method with MEGA (Phylogenetic Tree-Mega Software). The tree was rooted with the sequence of Kytococcus seden-tarius DSM20547T. Values at nodes represent percentage occurrence based on 1,000 bootstrap replications. Scale bar corresponds to 0.5 substitutions per 100 nucleotide positions. Accession numbers are given in parentheses. 73 !Fig. 3.3. Growth rates of Micrococcus luteus DE2008 growing between 0 and 2 mM Pb(NO3)2 (a) and between 0 and 1.5 mM CuSO4 (b) 74 Fig. 3.4. SEM image of Micrococcus luteus DE2008 culture treated with 25 mM Pb (NO3)2 forming aggregates (arrow). Scale bar 1 μm (a). X-ray analysis spectra coupled to SEM, see the main Pb peak at 10.5 keV (arrow) (b). Ultrathin sections of the same bacteria showing high electron-dense (HE) inclusions (arrow). Scale bar 500 μm (c). X-ray analysis spectra coupled to TEM from HE inclusions. No peaks of Pb were detected (d). 75
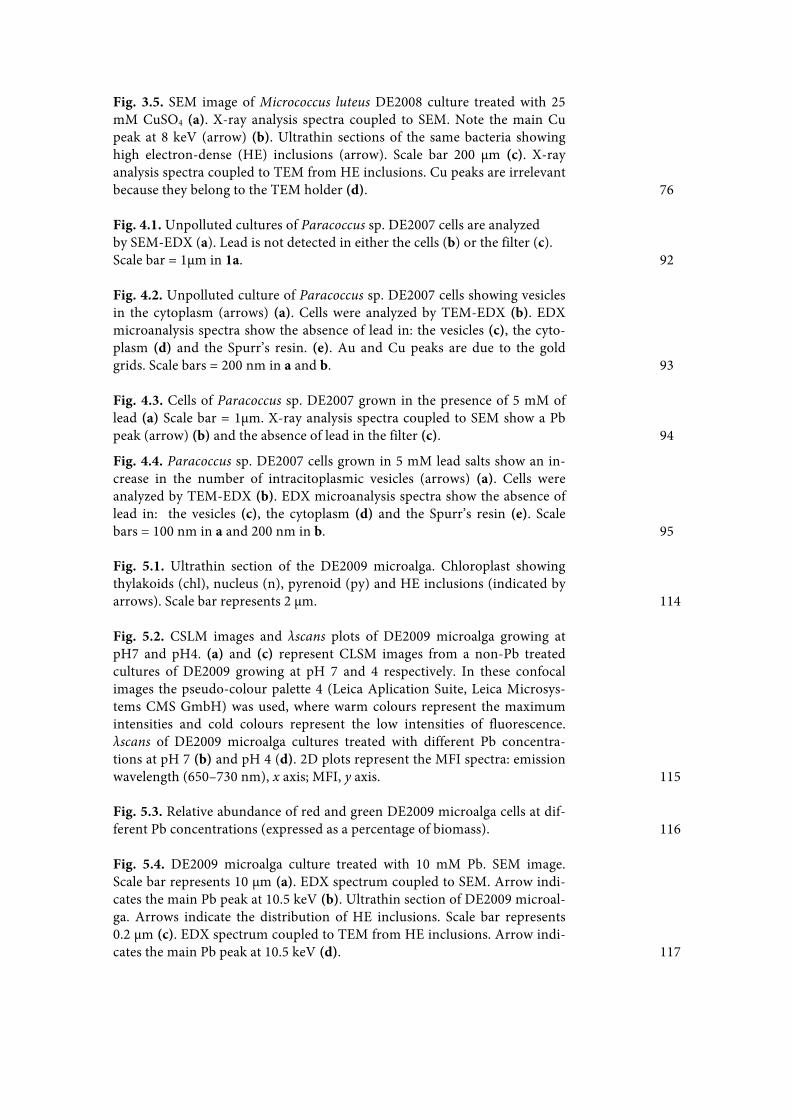
Fig. 3.5. SEM image of Micrococcus luteus DE2008 culture treated with 25 mM CuSO4 (a). X-ray analysis spectra coupled to SEM. Note the main Cu peak at 8 keV (arrow) (b). Ultrathin sections of the same bacteria showing high electron-dense (HE) inclusions (arrow). Scale bar 200 μm (c). X-ray analysis spectra coupled to TEM from HE inclusions. Cu peaks are irrelevant because they belong to the TEM holder (d). 76 Fig. 4.1. Unpolluted cultures of Paracoccus sp. DE2007 cells are analyzed by SEM-EDX (a). Lead is not detected in either the cells (b) or the filter (c). Scale bar = 1µm in 1a. 92 Fig. 4.2. Unpolluted culture of Paracoccus sp. DE2007 cells showing vesicles in the cytoplasm (arrows) (a). Cells were analyzed by TEM-EDX (b). EDX microanalysis spectra show the absence of lead in: the vesicles (c), the cyto-plasm (d) and the Spurr’s resin. (e). Au and Cu peaks are due to the gold grids. Scale bars = 200 nm in a and b. 93 Fig. 4.3. Cells of Paracoccus sp. DE2007 grown in the presence of 5 mM of lead (a) Scale bar = 1µm. X-ray analysis spectra coupled to SEM show a Pb peak (arrow) (b) and the absence of lead in the filter (c). 94
Fig. 4.4. Paracoccus sp. DE2007 cells grown in 5 mM lead salts show an in-crease in the number of intracitoplasmic vesicles (arrows) (a). Cells were analyzed by TEM-EDX (b). EDX microanalysis spectra show the absence of lead in: the vesicles (c), the cytoplasm (d) and the Spurr’s resin (e). Scale bars = 100 nm in a and 200 nm in b. 95 !Fig. 5.1. Ultrathin section of the DE2009 microalga. Chloroplast showing thylakoids (chl), nucleus (n), pyrenoid (py) and HE inclusions (indicated by arrows). Scale bar represents 2 µm. 114 Fig. 5.2. CSLM images and "scans plots of DE2009 microalga growing at pH7 and pH4. (a) and (c) represent CLSM images from a non-Pb treated cultures of DE2009 growing at pH 7 and 4 respectively. In these confocal images the pseudo-colour palette 4 (Leica Aplication Suite, Leica Microsys-tems CMS GmbH) was used, where warm colours represent the maximum intensities and cold colours represent the low intensities of fluorescence. "scans of DE2009 microalga cultures treated with different Pb concentra-tions at pH 7 (b) and pH 4 (d). 2D plots represent the MFI spectra: emission wavelength (650–730 nm), x axis; MFI, y axis. 115 !Fig. 5.3. Relative abundance of red and green DE2009 microalga cells at dif-ferent Pb concentrations (expressed as a percentage of biomass). 116 Fig. 5.4. DE2009 microalga culture treated with 10 mM Pb. SEM image. Scale bar represents 10 µm (a). EDX spectrum coupled to SEM. Arrow indi-cates the main Pb peak at 10.5 keV (b). Ultrathin section of DE2009 microal-ga. Arrows indicate the distribution of HE inclusions. Scale bar represents 0.2 µm (c). EDX spectrum coupled to TEM from HE inclusions. Arrow indi-cates the main Pb peak at 10.5 keV (d). 117 !
!
Fig. 6.1. CLSM images and "scans plots of unpolluted and polluted cyano-bacteria cultures. Oscillatoria sp. PCC 7515 (a); Chroococcus sp. PCC 9106 (c) and Spirulina sp. PCC 6313 (e) from unpolluted cultures are represented in CLSM images. Scale bars represent 50, 25 and 10 µm, respectively. In these confocal images the pseudo-colour palette 4 (Leica Aplication Suite, Leica Microsystems CMS GmbH) was used, where warm colours represent the maximum intensities and cold colours respresent the low intensities of fluo-rescence. "scans plots of Oscillatoria sp. PCC 7515 (b); Chroococcus sp. PCC 9106 (d) and Spirulina sp. PCC 6313 (f) polluted with different Pb concen-tracions. 2D plots represent the MFI spectra: emission wavelenght, x axis; MFI, y axis. 138 !Fig. 6.2. Rapid test to detect lead in cyanobacteria by SEM-EDX. Analysis points indicated by arrows from Oscillatoria sp. PCC 7515 (a), Chroococcus sp. PCC 9106 (c) and Spirulina sp. PCC 6313 (e) obtained by SEM. Scale bars represents 10, 10 and 20 µm, respectively. Pb peak showed in the spectrum (obtained by SEM-EDX) is indicated in each case by arrow (b), (d) and (f). 139 !Fig. 6.3. Lead sequestration by Oscillatoria sp. PCC 7515. Analysis point indicated by arrow from Oscillatoria sp. PCC 7515 obtained by SEM. Scale bar represents 20 µm (a). Pb peak showed in the spectrum obtained by SEM-EDX (see arrow) (b). High electron-dense inclusions from an ultrathin sec-tion of Oscillatoria sp. PCC 7515 are indicated by arrows. Scale bar repre-sents 2 µm (c). Pb, Ca and P peaks showed in the spectrum obtained by TEM-EDX from high electron-dense (see arrows) (d). 140 Fig. 6.4. Lead sequestration by Chroococcus sp. PCC 9106. Analysis point indicated by arrow from Chroococcus sp. PCC 9106 obtained by SEM. Scale bar represents 10 µm (a). Pb peak showed in the spectrum obtained by SEM-EDX (see arrow) (b). High electron-dense inclusions from an ultrat-hin section of Chroococcus sp. PCC 9106 are indicated by arrows. Scale bar represents 2 µm (c). Pb, Ca and P peaks showed in the spectrum obtained by TEM-EDX from high electron-dense inclusions (see arrows) (d). 141 Fig. 6.5. Lead sequestration by Spirulina sp. PCC 6313. Analysis point indi-cated by arrow from Spirulina sp. PCC 6313 obtained by SEM. Scale bar represents 10 µm (a). Pb peak showed in the spectrum obtained by SEM-EDX (see arrow) (b). High electron-dense inclusions from an ultrathin sec-tion of Spirulina sp. PCC 6313 are indicated by arrows. PHA granule is mar-ked with a dashed rectangle. Scale bar represents 0.2 µm (c). Pb, Ca and P peaks showed in the spectrum (obtained by TEM-EDX) from high electron-dense inclusions (see arrows) (d). 142 Fig. 6.6. CLSM images from unpolluted and polluted microcosms. CLSM image from the unpolluted microcosm shows Oscillatoria-like (1) and Mi-crocoleus-like (2). Scale bar represents 50 µm (a). CLSM image from polluted microcosm shows Lyngbya-like (1) and Phormidium-like (2). Scale bar represents 50 µm (b). 143
Fig. 6.7. Lead sequestration by cyanobacteria in microcosm experiments. Analysis points indicated by arrows from cyanobacteria in the uncontami-nated microcosm obtained by SEM. Scale bar represents 10 µm (a). Fe, Si and Ca peaks showed in the spectrum obtained by SEM-EDX (see arrows) (b). Analysis point indicated by arrow from Lyngbya-like in the contami-nated microcosm obtained by SEM. Scale bar represents 10 µm (c). Fe, Si, Ca and Pb peaks showed in the spectrum obtained by SEM-EDX (see arrows) (d). High electron-dense inclusions from an ultrathin section of Phormi-dium-like in the polluted microcosm are indicated by arrows. Scale bar re-presents 0.2 µm (e). Fe, P, Ca and Pb showed in the spectrum obtained by TEM-EDX from high electron-dense inclusions are (see arrows) (f). 144 !Fig. 7.1. EDX spectra obtained by SEM from Cu (a), Au (b), Ti (c) and Ni (d) grids. Cu peak is indicated by arrow. 154 !Fig. 7.2. EDX spectra obtained by TEM from Cu (a), Au (b), Ti (c) and Ni (d) grids. Cu and Cr peaks are indicated by arrows. 154 Table 7.1. Minimum metal concentration (Pb and Cu) with toxic effect on different phototrophic microorganisms by means of CLSM-"scan. 156 Table 7.2. Sequestration of Pb by different phototrophic and heterotrophic microorganisms using electron microscopic techniques coupled to EDX. 159 Table 7.3. Sequestration of Cu by different phototrophic and heterotrophic microorganisms using electron microscopy techniques coupled to EDX. 159 !
!
Structure of the Thesis
Introduction: This chapter introduces the natural environment studied, the Ebro Delta
microbial mats, and the effect of metal pollution in natural ecosystems. Finally it em-
phasizes the importance of searching photosynthetic microorganisms as indicators for
metal pollution in natural habitats.
Material and methods: In this chapter is described the methodology used in this work
in addition, the microorganisms used and their culture conditions.
Isolation and identification of a bacterium with high tolerance to lead and copper from a marine microbial mat in Spain: In this chapter is described the identification of
a heterotrophic bacterium (DE2008) isolated from Ebro Delta microbial mats. At the
same time, is determined the strain’s ability to tolerate high concentrations of heavy
metls and accumulate these externally in sheaths or internally in intracytoplasmic inclu-
sions. This work has been published in the journal Annals of Microbiology. The molecu-
lar identification of the strain DE2008 has been made in collaboration with the Equipe
Environnement et Microbiologie, IPREM UMR CNRS 5254, Université de Pau et des Pays
de l’Adour, France.
Electron microscopy techniques and energy dispersive X-ray applied to determine the sorption of lead in Paracoccus sp. DE2007. This chapter details the ability to bioac-
cumulate Pb (externally and internally) by the heterotrophic bacterium Paracoccus sp.
DE2007 using electron microscopy techniques and energy dispersive X-ray analysis. This work has been published as a chapter book in Current Research, Technology and
Education Topics in Applied Microbiology and Microbial Biotechnology.
Sequestration and in vivo effect of lead on DE2009 microalga, using high-resolution microscopic techniques. This chapter describes the tolerance-resistance of DE2009
microalga (isolated from microbial mats of the Ebro Delta) to Pb by means CLSM-"scan
and to determine their total and individual biomass (CLSM-IA). Complementary stud-
ies using SEM, TEM and energy dispersive X-ray microanalysis coupled to both micro-
scopes were also performed to test the capacity of DE2009 microalga for extra- and in-
tracellular uptake of Pb. This work has been published in the Journal of Hazardous Ma-
terials. The molecular indentification of DE2009 microalga has been made in collabora-
tion the group Instituto de Recursos Naturales, Centro de Ciencias Medioambientales
(CSIC) Madrid, Spain.
Selection of bioindicators to detect lead pollution in Ebro Delta microbial mats, us-ing high-resolution microscopic techniques: In this chapter is described the potential
of different cyanobacteria to be considered bioindicators of lead pollution in coastal
microbial mats, using CLSM-"scan to determine the sensitivity to lead and SEM-EDX
and TEM-EDX to determine the capacity to accumulate this metal extra and/or in-
tracelularlly. This work has been published in the journal Aquatic Toxicology.
Results and General discussion: In this chapter are summarized the results presented
in Chapters 3-6 and widely discussed.
Conclusions and Future prospects: Finally, the conclusions are listed and the future
prospects opened up by this work.

!
1. Introduction

Introduction
! 31
The Ebro Delta, located at the outfall of the Ebro River (Spain), is the second
largest wetland in Spain after the Guadalquivir River marshes and the second biggest in
the Mediterranean after the Camargue (France). In 1983, some of the most outstanding
natural areas of the Delta were included in the Ebro Delta Natural Park (Parc Natural
del Delta de l'Ebre) for their biological and cultural significance. The Ebro River is 928
km long, flows from the north of the Iberian Peninsula to the Mediterranean Sea and
drains an area approximately of 85,000 km2. Its basin is the most economically im-
portant area of northern of Spain (Ramos et al., 2004). The Ebro Delta is the third larg-
est delta in the Mediterranean: a triangular area of 320 km2 and located on the north-
eastern coastline of the Iberian Peninsula (0°35’E–0°56’E; 40°33’N–40°47’N) (Guerrero
et al., 2002). Of its total area, 78 km2 corresponds to the Natural Park (25%), 160 km2 to
rice farming (50%) and 85 km2 to orchards and fruit (25%). The formation of the Ebro
Delta began at the end of the last Ice Age about 50,000 years ago (Quaternary period).
As a consequence, the sea level rose flooding the mainland and the continental shelf
served as a base for sediment transported from the Ebro River. The Delta’s geology has
varied over the centuries, but its crucial formation period was established around the
17th Century. Different ecosystems such as microbial mats, marshes, salt ponds, dunes
and sandy beaches provide habitat for a large number flora and fauna species forming
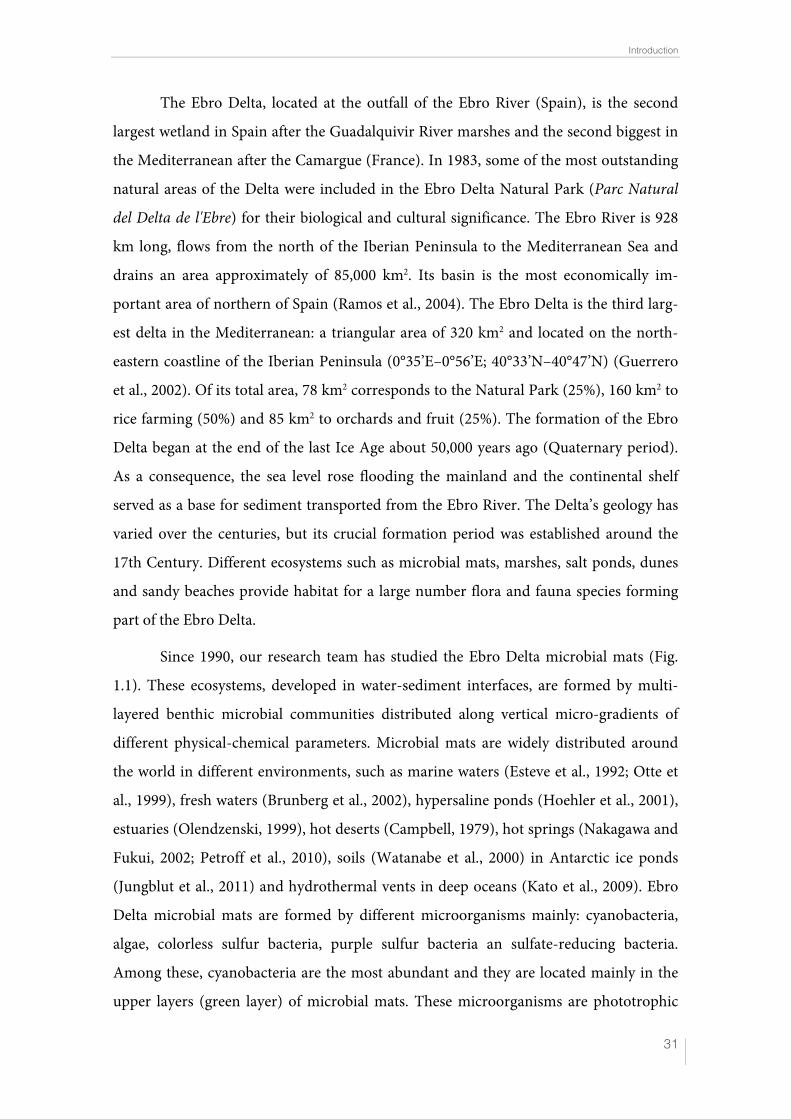
part of the Ebro Delta. Since 1990, our research team has studied the Ebro Delta microbial mats (Fig.
1.1). These ecosystems, developed in water-sediment interfaces, are formed by multi-
layered benthic microbial communities distributed along vertical micro-gradients of
different physical-chemical parameters. Microbial mats are widely distributed around
the world in different environments, such as marine waters (Esteve et al., 1992; Otte et
al., 1999), fresh waters (Brunberg et al., 2002), hypersaline ponds (Hoehler et al., 2001),
estuaries (Olendzenski, 1999), hot deserts (Campbell, 1979), hot springs (Nakagawa and
Fukui, 2002; Petroff et al., 2010), soils (Watanabe et al., 2000) in Antarctic ice ponds
(Jungblut et al., 2011) and hydrothermal vents in deep oceans (Kato et al., 2009). Ebro
Delta microbial mats are formed by different microorganisms mainly: cyanobacteria,
algae, colorless sulfur bacteria, purple sulfur bacteria an sulfate-reducing bacteria.
Among these, cyanobacteria are the most abundant and they are located mainly in the
upper layers (green layer) of microbial mats. These microorganisms are phototrophic
Introduction
!32
gram-negative oxygenic bacteria and they have the capacity to assimilate CO2. Their
major photosynthetic pigment is chlorophyll a (chl a), as in algae and plants. It is
thought that during the Proterozoic period, cyanobacteria contributed to the formation
of an oxygenated atmosphere (Hoehler et al., 2001).
In recent years, microbial mats have also become particularly interesting ecosys-
tems due to their bioremediation capacities. Different authors have demonstrated the
significant role of these ecosystems in the bioremediation of oil-polluted coastal areas of
the Arabian Gulf, during the 1991 Gulf War, achieving hydrocarbon degradation in few
months (Al-Hassan et al., 1998). The ability of these ecosystems to sequester heavy met-
als has also been demonstrated (Bender et al., 1994). As mentioned above, the Ebro Del-
ta has been declared a protected area for more than 25 years. Despite this, both the River
and the Delta are nowadays subjected to anthropogenic pollution, mainly as a conse-
quence of industrial activities that discharge their waste into the river and the agricul-
Fig. 1.1. Ebro Delta microbial mats. Microbial mats in the dry season (a) and covered by water (b). Microbial mat structure. Phototrophic microorganisms, green layer (____); purple reducing bacteria, red
layer (----) and sulfate reducing bacteria, black layer (·····) (c).
Introduction
! 33
tural crops (rice and fruit), which increase the amount of pesticides in the Delta. All
these circumstances cause serious environmental effects attributable to the accumula-
tion of the contaminants in sediments, water, soil and biota. The predominant pollu-
tants in these habitats are: herbicides, insecticides, hydrocarbons and heavy metals (Ma-
ñosa et al., 2000). Another important source of pollution has been the use of lead (Pb)
pellets in hunting waterfowl (Mateo et al., 1997). Nowadays, metals are released from
natural and anthropogenic sources (e.g. industry, transport, fossil fuel combustion, the
mining industry and agriculture) into natural aquatic environments (Nogales et al.,
2011). These are accumulated in the sediments and biota, generating resistance in mi-
croorganisms leading to environmental and public health problems. The toxicity of
metals in these biological systems depends on their bioavailable form and on different
biotic and abiotic factors (Roane and Pepper, 2000).
The term heavy metal has been often used as a group named for metals and sem-
imetals (metalloids) associated with pollution and potential ecotoxicity. Heavy metals
are a group of elements, characterized by their high density and they are member of a
subgroup of elements with metallic properties. They mainly include the transition met-
als, some metalloids, lanthanides, and actinides. Among these metals are arsenic (As),
cadmium (Cd), chromium (Cr), copper (Cu), lead (Pb), mercury (Hg), nickel (Ni), sele-
nium (Se) and zinc (Zn) (Duffus, 2002). From a physiological point of view, metals may
fall into three main categories: (i) those essential and basically non-toxic ones e.g. calci-
um (Ca) and magnesium (Mg), (ii) essential ones, but harmful at high concentrations
e.g. iron (Fe), manganese (Mn), zinc (Zn), copper (Cu), cobalt (Co), nickel (Ni) and
molybdenum (Mo), and (iii) toxic ones e.g. mercury (Hg) or cadmium (Cd). Moreover,
the interactions with metals depend not only on the particular element but also on its
chemical speciation (Valls and de Lorenzo, 2002). For many microorganisms some met-
als are considered essential because they form part of metabolic processes or the active
centers in some proteins. At low concentrations these might not be harmful for cells but
at high concentrations they could cause cellular damage. For instance, Cu is an essential
metal for cyanobacteria because it forms part of the plastocyanin and a c-type cyto-
chrome oxidase (necessary proteins for the photosynthesis). However, at high concen-
trations it causes serious toxic effects. For example, Surosz and Palinska, (2004) demon-
strated the reduction of chl a concentration in Anabaena flos-aquae while this cyano-
Introduction
!34
bacterium was growing up to 6 mg L-1 of Cu. On the other hand, metals such as Pb, Hg
or Cd are toxic at any concentration and do not have any kind of biological function.
Metal pollution is particulary serious, which is why various techniques have been
employed to treat of metal industrial effluents, usually falling into two broad divisions:
abiotic and biotic methods. Abiotic methods include precipitation, adsorption, ion ex-
change, and membrane and electrochemical technologies. Regarding biotic methods,
there are three main advantages of biological technologies for removing pollutants: bio-
logical processes can be carried out in situ at the polluted site; bioprocesses are envi-
ronmentally benign (no secondary pollution is generated) and thirdly, they are cost-
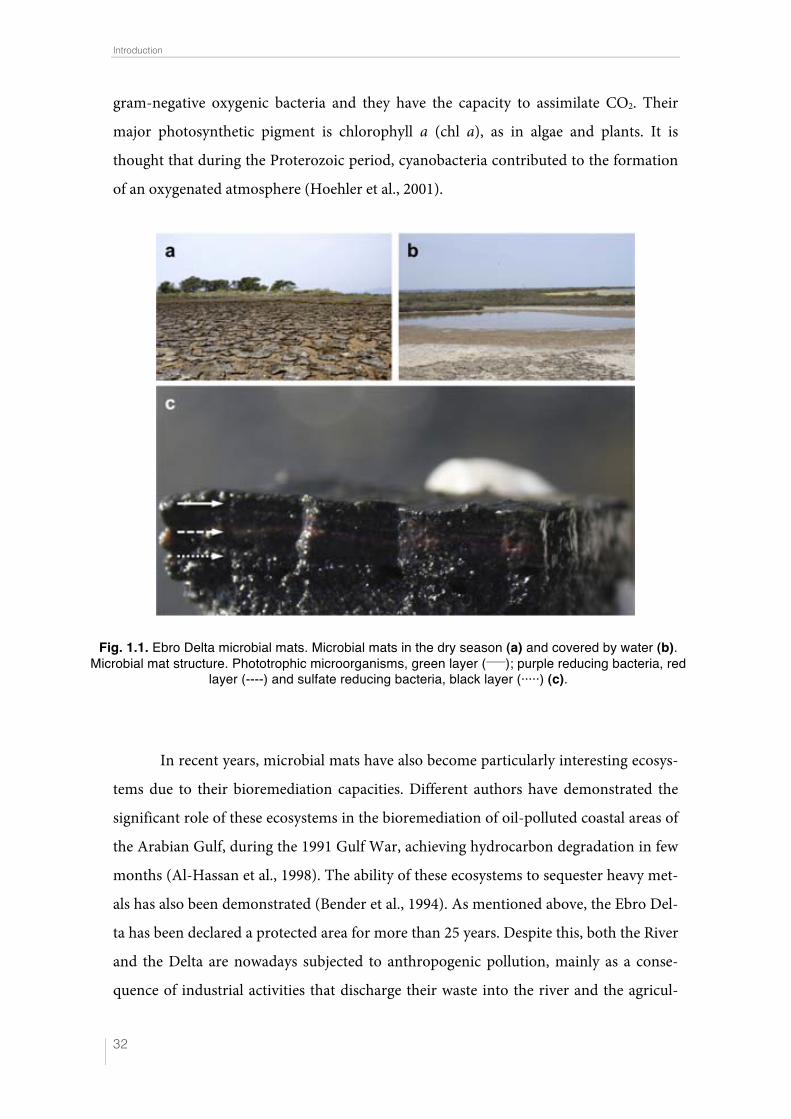
effective (Vijayaraghavan and Yun, 2008). Biotic processes are based on the ability of
organisms to interact with metals by biosorption, bioaccumulation, biomineralization,
bioleaching and enzymatic transformation of metals (Fig. 1.2).
In the face of this problem, studies are being conducted on how heavy metals af-
fect the microbial communities of natural environments (including environments such
as microbial mats) at the level of their activity, structure, biodiversity and biomass.
In Table 1.1., data are collected about the effects of metals on the diversity and biomass
of microbial populations in natural samples and techniques used for that purpose.
Fig. 1.2. Metal–microbe interaction mechanisms that can be harnessed for bioremediation applications (Lloyd et al., 2002).
Introduction
! 35
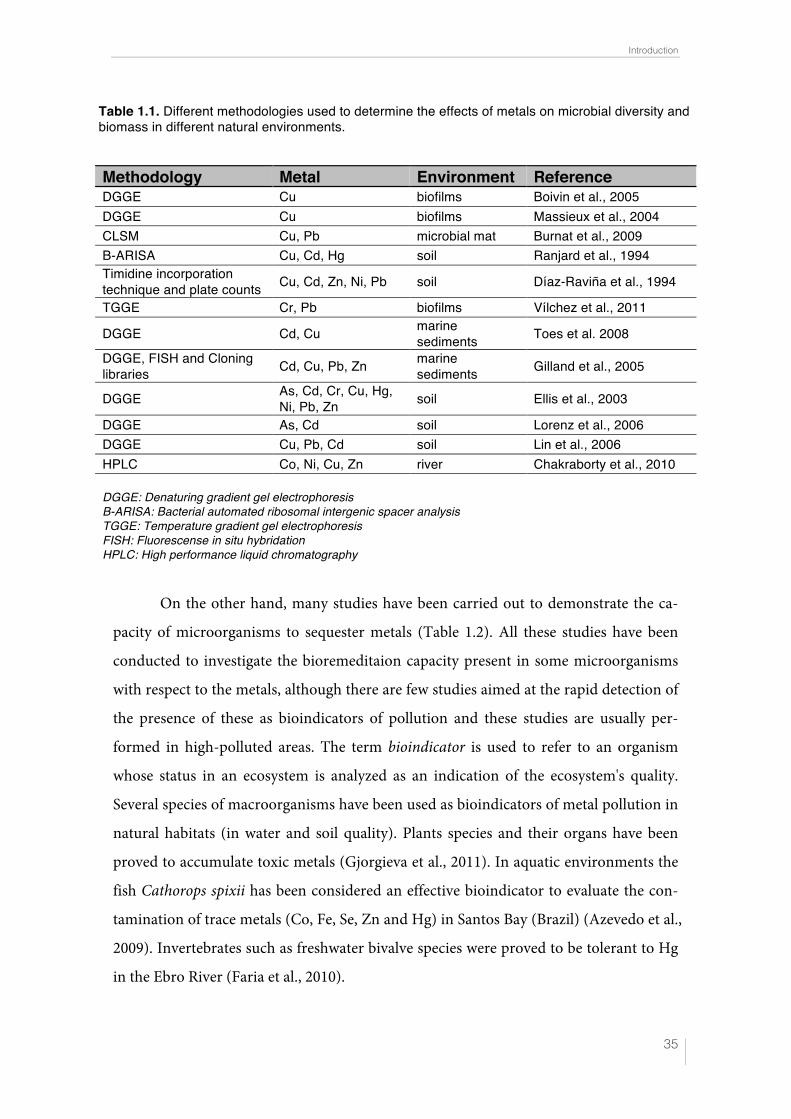
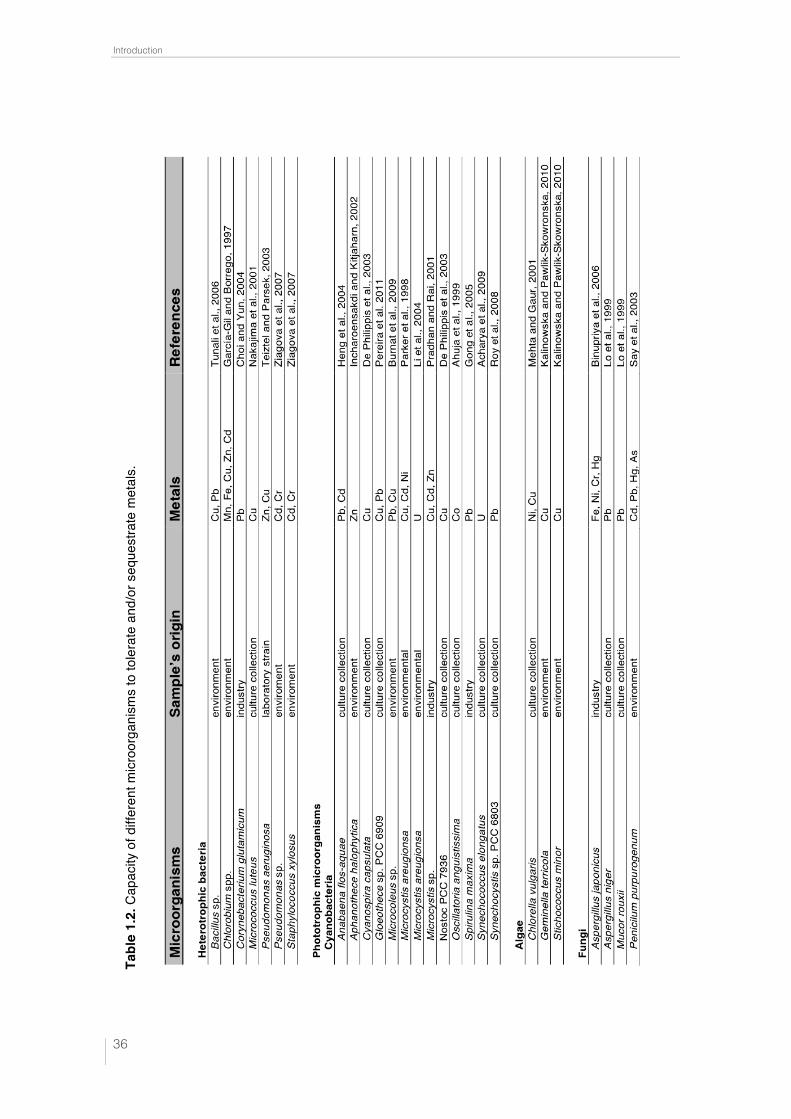
On the other hand, many studies have been carried out to demonstrate the ca-
pacity of microorganisms to sequester metals (Table 1.2). All these studies have been
conducted to investigate the bioremeditaion capacity present in some microorganisms
with respect to the metals, although there are few studies aimed at the rapid detection of
the presence of these as bioindicators of pollution and these studies are usually per-
formed in high-polluted areas. The term bioindicator is used to refer to an organism
whose status in an ecosystem is analyzed as an indication of the ecosystem's quality.
Several species of macroorganisms have been used as bioindicators of metal pollution in
natural habitats (in water and soil quality). Plants species and their organs have been
proved to accumulate toxic metals (Gjorgieva et al., 2011). In aquatic environments the
fish Cathorops spixii has been considered an effective bioindicator to evaluate the con-
tamination of trace metals (Co, Fe, Se, Zn and Hg) in Santos Bay (Brazil) (Azevedo et al.,
2009). Invertebrates such as freshwater bivalve species were proved to be tolerant to Hg
in the Ebro River (Faria et al., 2010).
Methodology Metal Environment Reference DGGE Cu biofilms Boivin et al., 2005 DGGE Cu biofilms Massieux et al., 2004 CLSM Cu, Pb microbial mat Burnat et al., 2009 B-ARISA Cu, Cd, Hg soil Ranjard et al., 1994 Timidine incorporation technique and plate counts Cu, Cd, Zn, Ni, Pb soil Díaz-Raviña et al., 1994
TGGE Cr, Pb biofilms Vílchez et al., 2011
DGGE Cd, Cu marine sediments Toes et al. 2008
DGGE, FISH and Cloning libraries Cd, Cu, Pb, Zn marine
sediments Gilland et al., 2005
DGGE As, Cd, Cr, Cu, Hg, Ni, Pb, Zn soil Ellis et al., 2003
DGGE As, Cd soil Lorenz et al., 2006 DGGE Cu, Pb, Cd soil Lin et al., 2006 HPLC Co, Ni, Cu, Zn river Chakraborty et al., 2010 DGGE: Denaturing gradient gel electrophoresis B-ARISA: Bacterial automated ribosomal intergenic spacer analysis TGGE: Temperature gradient gel electrophoresis FISH: Fluorescense in situ hybridation HPLC: High performance liquid chromatography
Table 1.1. Different methodologies used to determine the effects of metals on microbial diversity and biomass in different natural environments.
Introduction
!36
Tabl
e 1.
2. C
apac
ity o
f diff
eren
t micr
oorg
anis
ms
to to
lera
te a
nd/o
r seq
uest
rate
met
als.
Introduction
! 37
Finally, birds such as the ornate tinamou (Nothoprocta ornata) and mammals
like the greater white-toothed shrew (Crocidura russula) have been used as bioindicators
of metal pollution by mean of tissues analysis at Bolivian mining sites and the Ebro Del-
ta, respectively (Garitano-Zavala et al., 2010; Sánchez-Chardi et al., 2007).
Despite the extensive information mentioned above, nothing is known about the
use of phototrophic microorganisms (algae and cyanobacteria) in microbial mats alt-
hough they are the most abundant microorganisms in these habitats. The aim of this work is to select the best phototrophic microorganisms as indicators of metal pollu-tion by Pb and Cu using high-resolution microscopic techniques.
For this purpose, we will consider the following characteristics in selecting the
appropriate bioindicators: ubiquity and abundance of the selected microorganisms; ease
of growth under laboratory conditions; sensitivity to the chosen metal and the ability to
accumulate it. Among the methods used for this goal, in recent years our working group
has optimized different high-resolution microscopy techniques: confocal laser scanning
microscopy (CLSM), transmission electron microscopy (TEM) and scanning electron
microscopy (SEM) both coupled to an electron dispersive X-ray detector (EDX). The
first, technique determines the in vivo effect of different metals on phototrophic micro-
organisms (sensitivity), while the others, to detect the ability of these microorganisms to
capture metals extra- and/or intracellularly (Burnat et al., 2009, 2010).
For this work, different microorganisms (phototrophic and heterotrophic) have
been selected: a) two heterotrophic bacteria (Paracoccus sp. DE2007 and Micrococcus
luteus sp. DE2008) and a microalga (DE2009) isolated from a consortium of microor-
ganisms of Ebro Delta microbial mats, b) three cyanobacteria (Oscillatoria sp. PCC 7515,
Chroococcus sp. 9106 and Spirulina sp. PCC 6313) chosen from the Pasteur culture col-
lection of cyanobacteria (PCC) and c) environmental samples from Ebro Delta microbi-
al mats collected to perform pollution experiments in microcosms.
Finally, Cu and Pb were the metals chosen to be tested in this study. As men-
tioned above, Cu has biological functions at low concentrations, although at high con-
centrations it has a toxic effect. On the other hand, Pb is always a toxic metal with no
biological functions.
Introduction
!38
The methodologies used are described in Chapter 2. The methods used and re-
sults obtained in this work are detailed in Chapters 3, 4, 5, and 6. Finally, all the results
are summarized and discussed in Chapter 7.

!
!
2. Material and methods

!
!
Material and methods
! 41
In this chapter is described the sampling area and the methodologies used for
processing the samples of microcosms and the microorganisms used to select microor-
ganisms as metal pollution indicators.
2.1. Characterization and sampling site of the Ebro Delta microbial mats
The Ebro Delta is the third largest delta in the Mediterranean: a triangular area of 320
km2 and located on the northeastern coastline of the Iberian Peninsula (Guerrero et al.,
2002). Ebro Delta is second most important wetland area in the Iberian Peninsula after
the Guadalquivir River marshes (Spain), and the second of the Mediterranean after the
Camargue (France). In the Delta exist numerous ecosystems; beaches, salt ponds, mars-
hes, dunes and microbial mats.
Ebro Delta microbial mats develope 1 to 7 cm below the water surface. The tem-
perature of water covering these mats range from 12°C to 30°C; conductivity from 59 to
105 mS cm-1; salinity from 40‰ to 75‰, pH from 7.5 to 9.0, and being exposed to an
annual rainfall of 500 L m-2 (Esteve et al., 1994).
2.2. Microcosms setup
To determine the ability of cyanobacteria from microbial mats to capture external
and/or internally Pb, a laboratory microcosms experiments with samples from Ebro
Delta microbial mats was designed. Microcosms are artificial laboratory systems that are
used to simulate and predict changes in natural environments under controlled
conditions.
Samples were collected from the Ebro Delta on October 2009 (Fig. 2.1). Sedi-
ment samples were taken taken carefully in 55 x 43 x 88 mm poly(methyl methacrylate)
boxes preserving the structure of the microbial mat. Microcosms were transferred to the
laboratory protected from light and refrigerated at 4ºC.

Material and methods
!42
Fig.
2.1
. Ebr
o De
lta lo
catio
n (a
), (b
). M
icrob
ial m
ats
sam
plin
g si
te (c
), (d
).
Material and methods
! 43
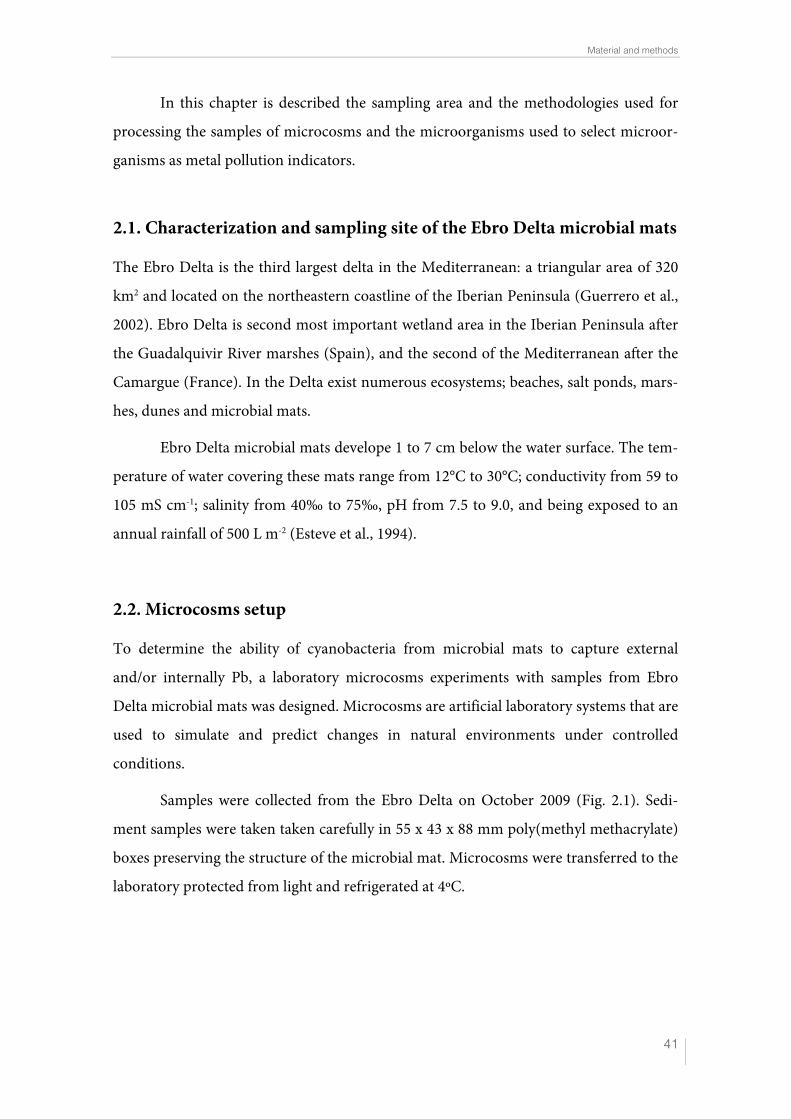
One microcosm was used as a control experiment (unpolluted) and the other
microcosm was polluted with 25 mL of 10 mM [Pb(NO3)2] solution. In the control expe-
riment the same amount of deionized water was added (Fig. 2.2). The microcosms were
maintained in laboratory conditions for 9 days, after which the metal solution was re-
moved by decanting from the polluted microcosm.
Samples for electron microscopy (SEM and TEM) and CLSM were taken with
glass cores ! (6 mm) from the upper layers of the microbial mat.
2.3. Microorganisms and culture conditions
The different microorganisms (heterotrophic and phototrophic) and its culture condi-
tions used in this work are following described.
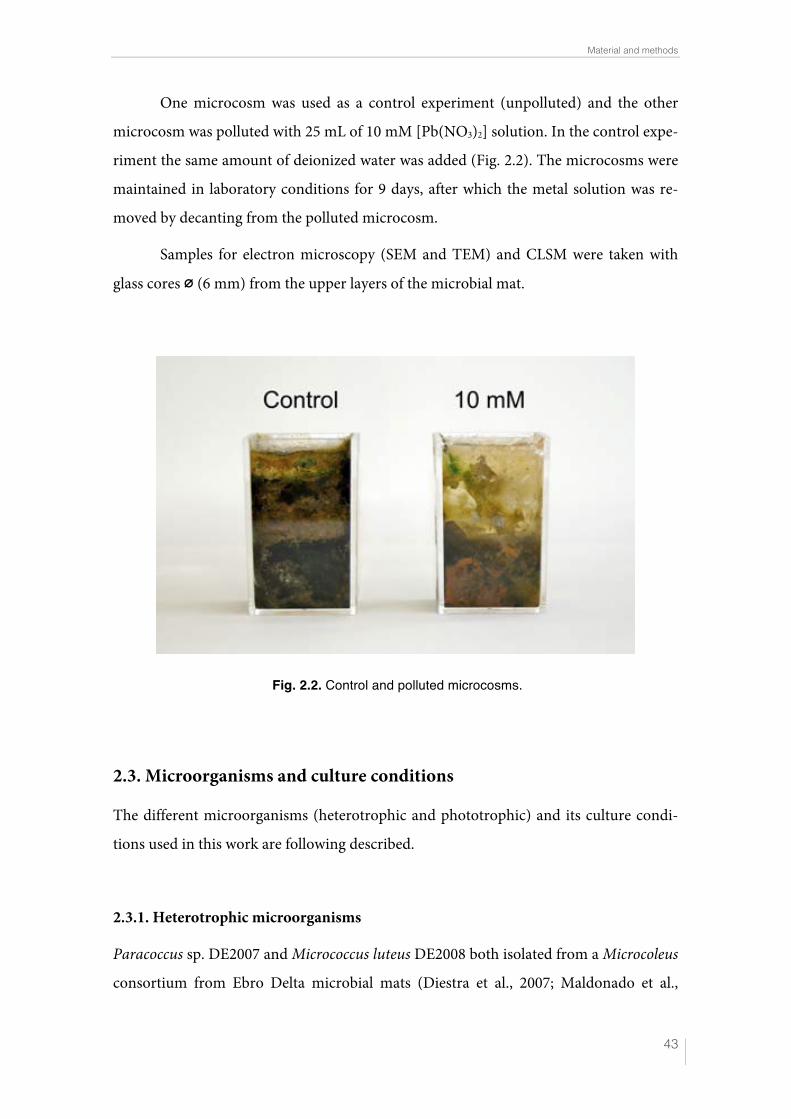
2.3.1. Heterotrophic microorganisms
Paracoccus sp. DE2007 and Micrococcus luteus DE2008 both isolated from a Microcoleus
consortium from Ebro Delta microbial mats (Diestra et al., 2007; Maldonado et al.,
Fig. 2.2. Control and polluted microcosms.
Material and methods
!44
2010a) were cultivated in Luria-Bertani rich medium (LB) (agar or broth) at 27ºC in
darkness (Fig. 2.3). (Composition of LB medium is described in Annex I).
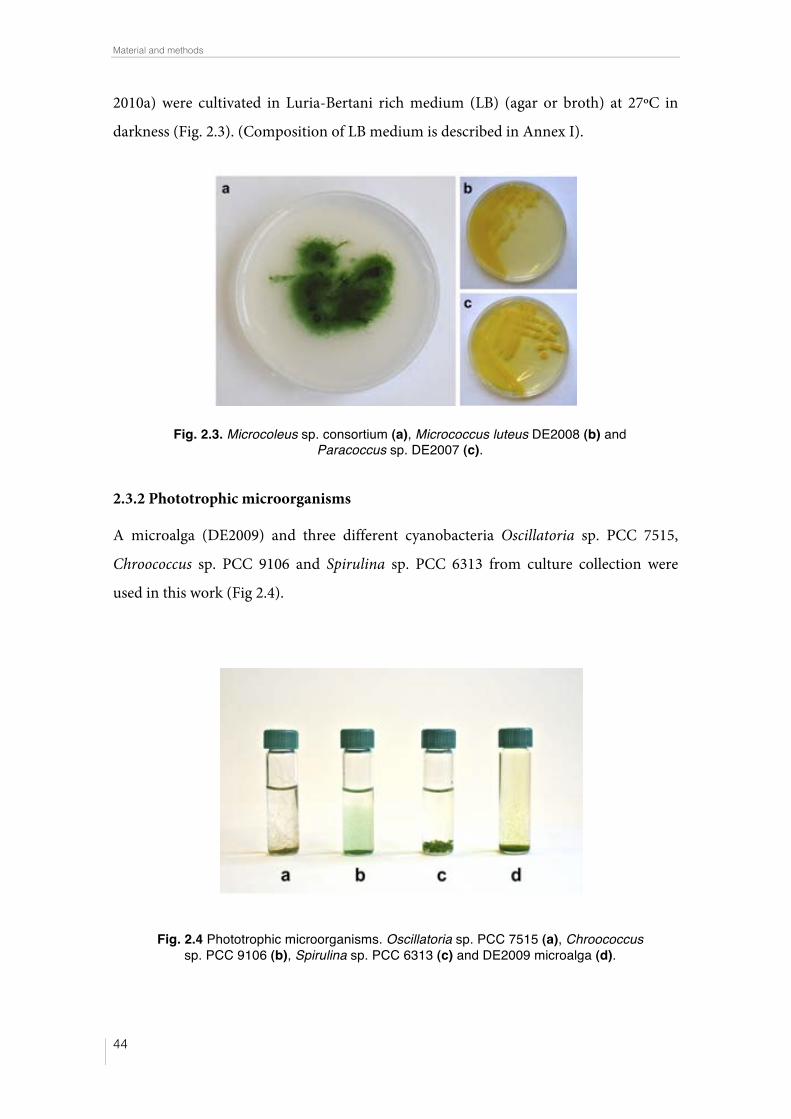
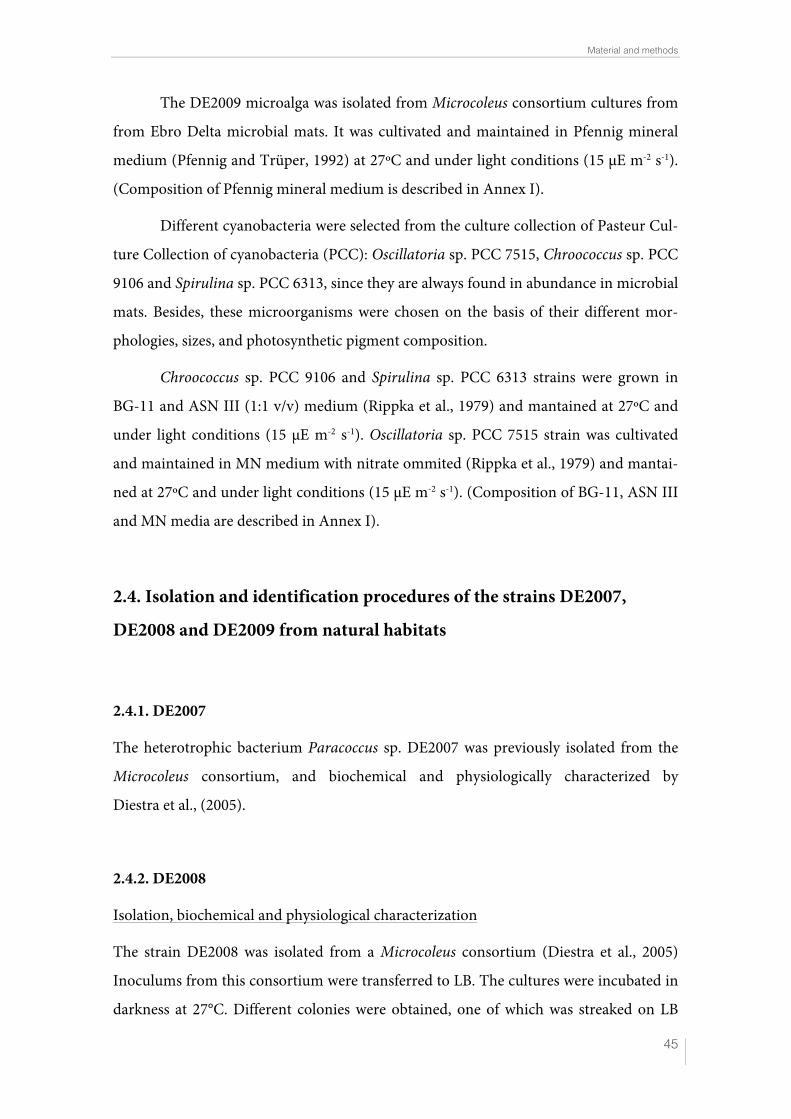
2.3.2 Phototrophic microorganisms
A microalga (DE2009) and three different cyanobacteria Oscillatoria sp. PCC 7515,
Chroococcus sp. PCC 9106 and Spirulina sp. PCC 6313 from culture collection were
used in this work (Fig 2.4).
Fig. 2.3. Microcoleus sp. consortium (a), Micrococcus luteus DE2008 (b) and Paracoccus sp. DE2007 (c).
Fig. 2.4 Phototrophic microorganisms. Oscillatoria sp. PCC 7515 (a), Chroococcus sp. PCC 9106 (b), Spirulina sp. PCC 6313 (c) and DE2009 microalga (d).
Material and methods
! 45
The DE2009 microalga was isolated from Microcoleus consortium cultures from
from Ebro Delta microbial mats. It was cultivated and maintained in Pfennig mineral
medium (Pfennig and Trüper, 1992) at 27ºC and under light conditions (15 µE m-2 s-1).
(Composition of Pfennig mineral medium is described in Annex I).
Different cyanobacteria were selected from the culture collection of Pasteur Cul-
ture Collection of cyanobacteria (PCC): Oscillatoria sp. PCC 7515, Chroococcus sp. PCC
9106 and Spirulina sp. PCC 6313, since they are always found in abundance in microbial
mats. Besides, these microorganisms were chosen on the basis of their different mor-
phologies, sizes, and photosynthetic pigment composition.
Chroococcus sp. PCC 9106 and Spirulina sp. PCC 6313 strains were grown in
BG-11 and ASN III (1:1 v/v) medium (Rippka et al., 1979) and mantained at 27ºC and
under light conditions (15 µE m-2 s-1). Oscillatoria sp. PCC 7515 strain was cultivated
and maintained in MN medium with nitrate ommited (Rippka et al., 1979) and mantai-
ned at 27ºC and under light conditions (15 µE m-2 s-1). (Composition of BG-11, ASN III
and MN media are described in Annex I).
2.4. Isolation and identification procedures of the strains DE2007,
DE2008 and DE2009 from natural habitats
2.4.1. DE2007
The heterotrophic bacterium Paracoccus sp. DE2007 was previously isolated from the
Microcoleus consortium, and biochemical and physiologically characterized by
Diestra et al., (2005).
2.4.2. DE2008
Isolation, biochemical and physiological characterization
The strain DE2008 was isolated from a Microcoleus consortium (Diestra et al., 2005)
Inoculums from this consortium were transferred to LB. The cultures were incubated in
darkness at 27°C. Different colonies were obtained, one of which was streaked on LB
Material and methods
!46
agar and isolated in pure culture. The morphological characteristics of strain DE2008
were examined with an Olympus BH2 conventional light microscope. Different stain
methods were used to characterize the DE2008 bacterium (Gram, Toluidine Blue,
Wirtz-Conklin, and Negative stains). Motility was determined with an optical micro-
scope using the hanging-drop technique. The biochemical assays were made using the
API 20 NE strip-identification system (BioMerieux, Marcy l’Étoile, France). Oxidase
activity was analysed by oxidation of 1% p-aminodimethylaniline oxalate (Cowan and
Steel, 1965). Catalase activity was determined by the presence of bubbles with a 3% H2O2
solution (Takeuchi et al., 1996). Starch hydrolysis was analyzed as described by Cowan
and Steel (1965).
The effect of different physical–chemical parameters were also tested on bacterial
strain DE2008. The pH range for growth was determined by incubating cells in LB me-
dium at 27°C for 4 days at the following pH: 2, 3, 4 (LB broth medium), 5, 6, 7, 8, 9, 10,
and 11 (LB agar medium). NaCl tolerance was measured in LB agar medium at concen-
trations of 0, 1, 2, 3, 4, 5, 6, 7, 8, and 10% (w/v). To determine the temperature range,
the growth of the strain at different temperatures (8–43°C) was tested.
Molecular identification of the strain DE2008
Genomic DNA was extracted from 2 mL of an overnight DE2008 culture in liquid LB
using UltraCleanTM Soil DNA Isolation Kit (Mobio Laboratories, Carlsbad, USA) ac-
cording to manufacturer’s instructions. The 16S rRNA gene fragment was obtained by
PCR amplification using primers 8F (5!-AGAGTTTGATCCTGGCTCAG-3!) and 1489R
(5!-TACCTTGTTACGACTTCA-3!), according to the procedure previously described
(Bordenave et al., 2004). The following PCR conditions were applied: 35 cycles of 10
min at 95°C, 45 s at 95°C, 45 s at 51°C, and 1.5 min at 72°C, with a final step of 10 min at
72°C. PCR product was then purified using the GFXTM PCR DNA and Gel Band Puri-
fication Kit as directed by the supplier (GE Heathcare, UK). The sequence of the puri-
fied DNA fragment was obtained using the BigDye Terminator Cycle Sequence Kit (ver-
sions 1.1; Applied Biosystems, Foster City, USA) on an ABI PRISM310 Genetic Analyz-
er (Applied Biosystems).
Material and methods
! 47
The sequence was compared to those present in the NCBI database
(http://www.ncbi.nlm.nih.gov) using the BLAST program. For phylogenetic analysis, a
dataset containing GenBank 16S rRNA gene sequences was used. Pairwise evolutionary
distances based on 1,455 unambiguous nucleotides were computed by the method of
Jukes and Cantor (1969) with MEGA version 3.0 software (Kumar et al., 2004). The
phylogenetic tree was constructed using neighbor-joining (Saitou and Nei, 1987). Con-
fidence in the tree topology was determined by bootstrap analysis using 1,000
resampling of the sequences.
2.4.3. DE2009
The DE2009 microalga was isolated from Microcoleus consortium cultures from Ebro
Delta microbial mats.
Molecular identification of the strain DE2009
Genomic DNA was extracted from an DE2009 overnight culture in Pfennig medium
using UltraCleanTM Microbial DNA Isolation Kit (Mobio Laboratories, Carlsbad, USA)
according to manufacturer’s instructions. The 18S rRNA gene fragment was obtained by
PCR amplification using SR1 (5! -TACCTGGTTGATCCTGCCAG-3! ) and Euk516 (5!-
ACCAGACTTGCCCTCC-3!) primers (Diez et al., 2001), using PureTqTM Ready-To-
GoTM PCR (GE Healthcare). The PCR conditions were those described in (Diez et al.,
2001). The PCR product was then purified using the QIAquick PCR purification Kit
(Quiagen) as directed by the supplier. Both complementary strands were sequenced
separately at the SECUGEN sequencing company (S.L. Madrid, Spain).
Material and methods
!48
2.5. Preparation of metal stock solutions and pollution conditions in
cultures and microcosms
Lead and copper stock solutions were prepared with Pb(NO3)2 and CuSO4, respectively
(Merck KGaA, Darmstadt, Germany) in deionized water and sterilized by filtration in
Millex-GP 0.22 µm filters (Millipore, USA).
Micrococcus luteus DE2008
The concentrations used for both Pb and Cu to determine the growth of Micrococcus
luteus DE2008 with metals and the ability to accumulate them external and/or internally
were: 0, 0.1, 0.5, 1, 1.5, 2, 5 and 25 mM for period of 12-24 h.
Paracoccus sp. DE2007
The concentrations used to determine the ability of Paracoccus sp. DE2007 to accumu-
late Pb external and/or internally were: 0 and 5 mM for a period of 12-24 h.
DE2009 microalga
The concentrations used to determine the sensitivity of DE2009 microalga to Pb and the
ability to accumulate the metal external and/or internally were: 0, 0.1, 0.5, 0.75, 1, 5 and
10 mM at two pHs (7 and 4) for a period of 9 days.
Oscillatoria sp. PCC 7515, Chroococcus sp. PCC 9106 and Spirulina sp. PCC 6313.
The concentrations used to determine the sensitivity of cyanobacterial strains to Pb and
the ability to accumulate the metal external and/or internally were: 0, 0.1, 0.5, 0.75, 1, 2
and 10 mM for a period of 9 days.
Material and methods
! 49
Microcosms
The concentrations used to determine the ability of cyanobacteria from polluted micro-
cosms to accumulate Pb external and/or internally were: 0.5 and 10 mM for a period of
9 days.
2.6. Methods to determine the effect of metals on heterotrophic and
phototrophic microorganisms
Growth rates and minimum inhibitory concentration methods were used to determine
the effect of Pb and Cu in Micrococcus luteus DE2008 and CLSM-"scan was used to de-
termine the Pb sensitivity in microalga DE2009, Oscillatoria sp. PCC 7515, Chroococcus
sp. PCC 6313 and Spirulina sp. PCC 9106.
This section only describes the protocols for the heterotrophic microorganisms,
while CLSM-"scan technique is described in section 2.7.1.
2.6.1 Growth rates
Overnight cultures of DE2008 strain grown on LB medium were inoculated into LB
medium supplemented with different Pb(NO3)2 or CuSO4 concentrations: 0.1, 0.5, 1, 1.5,
and 2 mM. The cultures were incubated in an orbital shaker (180 rpm) at 27°C for 12 h.
Growth rate was determined by measuring the increase in turbidity (absorbance at 550
nm; Greenblatt et al., 2004) every 30 min with a Beckman Coulter DU 730 Life/Science
UV/ Vis spectrophotometer.
The specific growth rate (μ) was calculated for each Pb and Cu concentration us-
ing the following formula (Wang, 2005).
!
µ =1
OD0
"ODt #OD0( )Tt #T0( )
Material and methods
!50
ODt and OD0 represent the optical density (550 nm) of the cultures at the time t (final
time) and 0 (initial time), and Tt and T0 represent homologous times (h).
2.6.2 Minimum inhibitory concentration
In order to determine the minimum inhibitory concentration (MIC) for lead and cop-
per, two techniques were used: the agar diffusion method and an assay by tube dilution.
For the agar diffusion method, Petri plates containing LB agar medium evenly
inoculated with the test microorganism were prepared. Known amounts (20 μL) at dif-
ferent concentrations of metals were placed on the surface of the agar. Milli-Q water
solutions without metals were used as a control experiment. Plates were incubated at
27°C for 48 h to determine zones of inhibition of bacterial growth.
For the assay by tube dilution, series of culture were prepared, each one contain-
ing medium with a different concentration of the metal. All tubes of the series were in-
oculated with the test microorganism. Cultures without metals were used as a control
experiment. The tubes were incubated at the same conditions mentioned above.
2.7. High-resolution microscopy techniques
In this section are described the high-resolution microscopy techniques used in this
work for the selection of metal bioindicators among the microorganisms tested, to de-
termine the sensitivity and the capacity to accumulate the metal externally and/or
internally.
2.7.1 Confocal laser scanning microscopy
This microscopic technique was used in order to determine: i) the sensitivity of DE2009
microalga and cyanobacteria strains (Oscillatoria sp. PCC 7515, Chroococcus sp. PCC
9106 and Spirulina sp. PCC 6313) to lead by using the "scan function (CLSM-"scan),
and ii) to determine the biomass of DE2009 microalga to different lead concentrations
using the CLSM and the image analysis software ImageJ (CLSM-IA).
CLSM-"scan
Material and methods
! 51
Pigment analysis of DE2009 microalga and Oscillatoria sp. PCC 7515, Chroococcus sp.
PCC 9106 and Spirulina sp. PCC 6313, was determined by "scan function of CLSM.
This technique provides information on the state of the photosynthetic pigments of
phototrophic microorganisms on the basis of the emission wavelength region and the
fluorescence intensity emitted (autofluorescence).
Each image sequence was obtained by scanning the same xy optical section
throughout the visible spectrum. Images were acquired at the z position at which the
fluorescence was maximal, and acquisition settings were constant throughout the exper-
iment. The sample excitation was carried out with an Argon Laser at 488 nm (λexe 488)
with a λstep size of between 3 and 4.74 nm for an emission wavelength between 510 and
752 nm. In order to measure the mean fluorescence intensity (MFI) of the xy", CLSM
data sets obtained by means of the Leica Confocal Software (Leica Microsystems CMS
GmbH) were used. The regions-of-interest (ROIs) function of the software was used to
measure the spectral signature. For each sample, 70 ROIs of 1 µm2 taken from cyanobac-
teria and DE2009 microalga cells were analysed.
CLSM-IA
This technique was applied to estimate the microalga DE2009 biomass (total and
individual).
Two types of fluorescence at cell level from the same DE2009 microalga were ob-
served in images obtained in all cultures analysed. Red (red cells) and green (green cells)
were distinguished on screen as pseudo-colours. For that reason, a sequential scan in
two channels was carried out from each same xy optical section. On the first channel,
samples were excited with a diode 561 nm (λexe 561) and the emission of fluorescence
was captured between 670 and 794 nm (red pseudo-colour). On the second channel,
samples were excited with an Argon Laser at 488 nm (λexe 488) and the emission of fluo-
rescence was captured between 550 and 575 nm (green pseudo-colour). Finally, 10 red
and 10 green confocal images were obtained from all cultures studied. Total biomass
estimations from the red and green algal cells were obtained separately. Moreover, indi-
vidual biomass for both types of cells was studied. Finally, total and individual biomass
was estimated for each metal concentration.
Material and methods
!52
In this work, we have used a modification of the method described by Solé et al.
(2007) using CLSM and a free image-processing analysis software, ImageJ v1.41.
(CLSM-IA). This method was used to determine the percentage between red and green
pixels of DE2009 microalga and their biomass from the different cultures studied in
this work.
The method used in this paper is as follows: for total biomass each pair of images
(red and green) from an identical xy optical section were opened in their original format
(8-bit, 1024 × 1024 pixels) as tiff images and the corresponding overlay image was ob-
tained. These three images were transformed to binary images (black/white) using dif-
ferent thresholds. Values of 70 and 25 were applied respectively to red and green images
from 0.1, 0.5, 0.75, 1 and 5 mM metal concentrations. Conversely, threshold values of 50
and 60 were applied respectively to red and green images from the 10 mM metal
concentration.
In order to determine the percentage between the red and green fluorescences at
pixel level the image calculator function of the ImageJ was used. To obtain images with
cells showing up only as red fluorescence, all green fluorescence was subtracted from the
image. In the same way, red fluorescence is subtracted from the image when greens only
are obtained. In both cases to clean the images it was necessary to filter out the red and
green pixels. A smoothing filter (median filter with a radius of 2.0 pixels) was then ap-
plied to the images. To obtain biovolume values, the Voxel Counter plug-in was applied
to these filtered images (Rasband, 2010). This specific application calculates the ratio of
the thresholded voxels (the red or green microalga volume), to all voxels from the bina-
ry image determined. The biovolume value obtained (Volume Fraction) was finally mul-
tiplied by a conversion factor of 310 fgC µm-3 to convert it to biomass (Bloem et al.,
1995; Fry, 1990). To calculate the individual biomass, 30 red and 30 green cells were
selected using ImageJ software and then the cells were analysed following the same pro-
tocol described above.
2.7.2 Scanning electron microscopy
This microscopic technique was used in order to observe the external morphology and
the EPS formation on heterotrophic bacteria (Paracoccus sp. DE2007 and Micrococcus
Material and methods
! 53
luteus DE2008), DE2009 microalga, cyanobacteria strains (Oscillatoria sp. PCC 7515,
Chroococcus sp. PCC 9106 and Spirulina sp. PCC 6313) and cyanobacteria from
microcosms experiments.
Samples were filtrated in NucleoporeTM polycarbonate membranes (Whatman,
Ltd.) and then were fixed in 2.5% glutaraldehyde Millonig’s buffer phosphate (Millonig,
1967) (0.1M pH 4) at 4ºC for 2 hours washed four times (15 min) in the same buffer at
4ºC to remove excess of fixative. They were then dehydrated in a graded series (30%,
50%, 70%, 90%, and 100%) of ethanol (5 min) and dried by critical-point (CPD 030
Critical Point Drier, BAL-TEC GmbH D - 58579 Schalksmühle). Samples were mounted
on aluminum metal stubs using a electrically-conductive double-sided adhesive tape
and then coated with a 5 µm gold layer (K550 Sputter Coater, Emitech, Ashford, UK)
Finally, samples were viewed in a Jeol JSM-6300 (Jeol Ltd., Tokyo, Japan) and in a Zeiss
EVO® MA 10 (Carl Zeiss NTS GmbH, Oberkochen, Germany) scanning electron
microscopes.
2.7.3 Transmission electron microscopy
This microscopic technique was used in order to observe the ultrastructure of hetero-
trophic bacteria (Paracoccus sp. DE2007 and Micrococcus luteus DE2008), DE2009 mi-
croalga, cyanobacteria strains (Oscillatoria sp. PCC 7515, Chroococcus sp. PCC 9106 and
Spirulina sp. PCC 6313) and cyanobacteria from microcosms experiments.
Samples were fixed in 2.5% glutaraldehyde Millonig’s buffer phosphate (Millo-
nig, 1967) (0.1M pH 4) at 4ºC for 2 hours washed four times (15 min) in the same buffer
at 4ºC. Then samples were post-fixed in 1% osmium tetroxide (OsO4) at 4ºC for 2 hours,
and washed four times in the same buffer. Then samples were centrifuged in order to
obtain a pellet. They were then dehydrated in graded series (30%, 50%, 70%, 90%, 100%)
of acetone and embedded in Spurr resin. Once the samples were included in the resin, a
piramidotome was used (TM 60, C. Reichert AG. Wien, Austria) for pyramiding sam-
ples and an ultramicrotome (Leica EM UC6 ULTRACUT, Leica Microsystems, GmbH,
Heidelberg, Germany) for the ultrathin sections. To show a better quality image, sec-
tions of 70 nm of the samples were mounted on carbon-coated copper grids and stained
with uranil acetate and lead citrate according to the method described by Reynolds et al.,
Material and methods
!54
(1963). Samples were viewed in a Hitachi H-7000 electron microscope (Hitachi Ltd.,
Tokyo, Japan).
2.7.4 Energy dispersive X-ray microanalysis
EDX is a technique used for the elemental analysis of a sample. The technique is based
on the analysis of X-rays emitted by matter in response to collisions with charged parti-
cles. To stimulate the emission of X-rays, a high energy beam of charged particles such
as electrons, protons or an X-ray beam is focused in the area of the study sample. This
charged particle collides with internal shell of the element and then an electron from an
outer shell moves into empty shell. Since there are a series of jumps from higher to sma-
ller shells, at this time X-rays are generated. This phenomenon is due to the fundamen-
tal principle that every element has a unique atomic structure that allows X-rays that are
characteristic of the atomic structure of an element to be identified only from each other.
The number and energy of emitted X-rays in a sample can be measured semiquantitati-
vely by an energy dispersive spectrometer.
This detector that may be coupled to both a SEM and a TEM, is connected to a
computer with the software INCA v.4.13 (Oxford Instruments, Bucks, England) that
generates graphics with different peaks corresponding to each of the chemical elements
present in the analized area. Usually the analysis of a sample area takes 60 s. The great
advantage of this approach is that the area to be analyzed can be selected by the user.
SEM-EDX
In order to determine the capacity of heterotrophic bacteria (Paracoccus sp. DE2007 and
Micrococcus luteus DE2008), DE2009 microalga, cyanobacteria strains (Oscillatoria sp.
PCC 7515, Chroococcus sp. PCC 9106 and Spirulina sp. PCC 6313) and cyanobacteria
from microcosms experiments to accumulate (adsorbe) Pb and/or Cu extracellularly,
SEM coupled to EDX was used.
For this analysis, samples followed the same protocol as for conventional SEM. A
Jeol JSM-6300 (Jeol Ltd., Tokyo, Japan) and a Zeiss EVO® MA 10 (Carl Zeiss NTS
GmbH, Oberkochen, Germany) scanning electron microscopes with an EDX Link Isis-
Material and methods
! 55
200 (Oxford Instruments, Bucks, England) operated at 20kV coupled to the microscopes
was used for the analysis of the samples.
TEM-EDX
In order to determine the capacity of heterotrophic bacteria (Micrococcus luteus DE2008
and Paracoccus sp. DE2007), DE2009 microalga, cyanobacteria strains (Oscillatoria sp.
PCC 7515, Chroococcus sp. PCC 9106 and Spirulina sp. PCC 6313) and cyanobacteria
from microcosms experiments to bioaccumulate Pb and/or Cu intracellularly in the
cytoplasm or in the polyphosphate (PP) inclussions, TEM coupled to EDX was used.
For the analysis, the above-mentioned protocol was used, but in this particular
case, the sections were about 200 nm thick. These sections were not stained with lead
citrate in order to avoid elemental substitution during the analysis. Then were mounted
on carbon-coated titanium and/or gold grids. All samples were analyzed with a Jeol
Jem-2011 (Jeol LTD, Tokyo, Japan) transmission microscope with an EDX Link Isis-200
(Oxford Instruments, Bucks, England) operated at 20kV coupled to this microscope.
2.8. Statistical analysis
Data obtained from from growth cultures, percentages, biomass, MFI data, were compa-
red using a Student’s t test, one-way analysis of variance (ANOVA) and Tukey and Bon-
ferroni’s comparison post hoc tests. Significant differences were accepted at p < 0.05. The
analyses were performed using SPSS software (version 19.0 for Mac OS X).

!
!

!
!
Results

!
!
!
!
3. Isolation and identification of a bacterium with high tolerance
to lead and copper from a marine microbial
mat in Spain

!
!
!
!
Isolation and identification of a bacterium with high tolerance to lead and copper from a marine microbial
mat in Spain
Juan Maldonado a, Elia Diestra a, Lionel Huang b, Ana M. Domènech a, Eduard Villagrasa a, Zully M. Puyen a, Robert Duran b, Isabel Esteve a and Antonio Solé a.
a Department of Genetics and Microbiology, Biosciences Faculty,
Universitat Autònoma de Barcelona, Bellaterra 08193, Barcelona, Spain.
b Equipe Environnement et Microbiologie, IPREM UMR CNRS 5254, Université de Pau et des Pays de l'Adour, IBEAS, BP 1155, 64013 Pau Cedex, France.
Abstract
A bacterial strain (DE2008) was isolated from a consortium of microorganisms living in
the microbial mats of the Ebro Delta with the ability to grow under conditions of high
concentrations of lead and copper. Strain DE2008 has been characterized by microsco-
pic and metabolic techniques and identified by sequencing of PCR-amplified 16S rRNA
gene fragments as Micrococcus luteus. The strain is highly resistant to lead and copper.
Micrococcus luteus DE2008 grew optimally until levels of 1 mM of Pb (NO3)2 and CuSO4,
respectively, and was completely inhibited at 3 mM Pb(NO3)2 and at 1.5 mM CuSO4.
Elemental analysis determined by energy-dispersive X-ray spectroscopy (EDX) coupled
with scanning electron microscopy and transmission electron microscopy from polluted
cultures of DE2008 show that this microorganism can biosorpt Pb and Cu in exopoly-
saccharide envelopes, without accumulating them inside the cells.

!
!
Isolation and identification of a bacterium with high tolerance to lead and copper from a marine microbal mat in Spain
! 63
Introduction
Contaminated environments such as soils and sediments polluted by crude oil, heavy
metals or pesticides can be considered as extreme conditions for microbial growth. The
effects of these contaminants in different populations have been reported (Al-Hasan et
al., 1998; Radwan and Sorkhoh, 1993). The bioremediation capacity of phototrophic
microorganisms (cyanobacteria and algae), heterotrophic bacteria, yeast and fungi have
been investigated (Binupriya et al., 2006; Gong et al., 2005).
Gram-positive bacteria are known to possess high metal sorption capacities. The
ability of the cell wall of Bacillus subitilis to interact with different heavy metals has been
largely studied (Tunali et al., 2006). Although several papers have shown that the cell
walls of Gram-positive cocci such as those of Staphylococcus xylosus and Micrococcus
luteus have an affinity for metal ions (Nakajima and Tsuruta, 2004; Ziagova et al., 2007),
the metal sorption by the cell walls still to be characterized. Indigenous microbes in na-
ture, tolerate high concentrations of heavy metals and may play an important role in
restoring contaminated soils. For example, Wei et al. (2009) recently identified Agrobac-
terium (CCNWRS33-2), from the Taibai gold mining region in China as the bacterial
strain most resistant to heavy metals. This bacterium was able to grow in up to 2 mM of
copper and lead.
Stratified benthic marine ecosystems (microbial mats) are often exposed to
heavy metals (Sánchez-Chardi et al., 2007). The microorganisms that compose these
ecosystems are mainly cyanobacteria, oxygenic phototrophic microorganisms, which
are primary producers on these habitats (Stal, 2000). Our group of work has studied the
diversity and biomass of cyanobacteria in oil-polluted and unpolluted microbial mats
around Europe (Diestra et al., 2004; Solé et al., 2009). Over the last few years, we have
also isolated a consortium, formed mainly by a single cyanobacterium, Microcoleus
chthonoplastes, and by different heterotrophic bacteria (Diestra et al., 2005; Sánchez et
al., 2005). In addition, this consortium was able to degrade crude oil (García de Oteyza
et al., 2004) and tolerate heavy metals (Burnat et al., 2010).
Recently, we have isolated a Gram-positive heterotrophic bacterium (DE2008)
from the above-mentioned consortium, with the ability to grow in high concentrations
of heavy metals. Two metals were selected for this work: Pb and Cu. The first one is a
Isolation and identification of a bacterium with high tolerance to lead and copper from a marine microbal mat in Spain
!64
toxic metal, whilst the second one is an essential metal with known biological functions
in all organisms (Roane and Pepper, 2000).
The goals of this work are to identify this bacterium and to determine the maxi-
mum concentration levels of both metals in which the bacterium can grow. At the same
time, we are trying to determine whether the strain’s ability to tolerate such high con-
centrations of heavy metals is from an ability to accumulate Pb and/or Cu externally in
sheaths or internally in intracytoplasmic inclusions.
Materials and methods
Isolation, biochemical and physiological characterization of the strain DE2008
Inoculums from a Microcoleus consortium (Diestra et al., 2005) were transferred to Lu-
ria-Bertani (LB) agar medium containing tryptone (10.0 g L−1), yeast extract (5.0 g L−1),
and NaCl (10.0 g L−1), pH 7.0. The cultures were incubated in darkness at 27°C. Differ-
ent colonies were obtained, one of which was streaked on LB agar and isolated in pure
culture. The morphological characteristics of strain DE2008 were examined with an
Olympus BH2 conventional light microscope. Different stain methods were used to
characterize the DE2008 bacterium (Gram, Toluidine Blue, Wirtz-Conklin, and Nega-
tive stains). Motility was determined with an optical microscope using the hanging-drop
technique. The biochemical assays were made using the API 20 NE strip identification
system (BioMerieux, Marcy l’Étoile, France). Oxidase activity was analysed by oxidation
of 1% p-aminodimethylaniline oxalate (Cowan and Steel, 1965). Catalase activity was
determined by the presence of bubbles with a 3% H2O2 solution (Takeuchi et al., 1996).
Starch hydrolysis was analyzed as described by Cowan and Steel (1965).
The effect of different physical–chemical parameters were also tested on bacterial
strain DE2008. The pH range for growth was determined by incubating cells in LB me-
dium at 27°C for 4 days at the following pH: 2, 3, 4 (LB broth medium), 5, 6, 7, 8, 9, 10,
and 11 (LB agar medium). NaCl tolerance was measured in LB agar medium at concen-
trations of 0, 1, 2, 3, 4, 5, 6, 7, 8, and 10% (w/v). To determine the temperature range,
the growth of the strain at different temperatures (8–43°C) was tested.
Isolation and identification of a bacterium with high tolerance to lead and copper from a marine microbal mat in Spain
! 65
Phylogenetic characterization
Genomic DNA was extracted from 2 mL of an overnight DE2008 culture in liquid LB
using UltraCleanTM Soil DNA Isolation Kit (Mobio Laboratories, Carlsbad, USA) ac-
cording to manufacturer’s instructions. The 16S rRNA gene fragment was obtained by
PCR amplification using primers 8F (5!-AGAGTTTGATCCTGGCTCAG-3!) and 1489R
(5!-TACCTTGTTACGACTTCA-3!), according to the procedure previously described
(Bordenave et al., 2004). The following PCR conditions were applied: 35 cycles of 10
min at 95°C, 45 s at 95°C, 45 s at 51°C, and 1.5 min at 72°C, with a final step of 10 min at
72°C. PCR product was then purified using the GFXTM PCR DNA and Gel Band Puri-
fication Kit as directed by the supplier (GE Heathcare, UK). The sequence of the puri-
fied DNA fragment was obtained using the BigDye Terminator Cycle Sequence Kit (ver-
sions 1.1; Applied Biosystems, Foster City, USA) on an ABI PRISM310 Genetic Analyz-
er (Applied Biosystems).
The sequence was compared to those present in the NCBI database
(http://www.ncbi.nlm.nih.gov) using the BLAST program. For phylogenetic analysis, a
dataset containing GenBank 16S rRNA gene sequences was used. Pairwise evolutionary
distances based on 1,455 unambiguous nucleotides were computed by the method of
Jukes and Cantor (1969) with MEGA version 3.0 software (Kumar et al., 2004). The
phylogenetic tree was constructed using neighbor-joining (Saitou and Nei, 1987). Con-
fidence in the tree topology was determined by bootstrap analysis using 1,000
resampling of the sequences.
Effects of Pb and Cu on the growth of the strain DE2008
Overnight cultures of DE2008 strain grown on LB medium were inoculated into LB
medium supplemented with different Pb(NO3)2 or CuSO4 concentrations: 0.1, 0.5, 1, 1.5,
and 2 mM. The cultures were incubated in an orbital shaker (180 rpm) at 27°C for 12 h.
Growth rate was determined by measuring the increase in turbidity (absorbance at 550
nm; Greenblatt et al., 2004) every 30 min with a Beckman Coulter DU 730 Life/Science
UV/ Vis spectrophotometer.
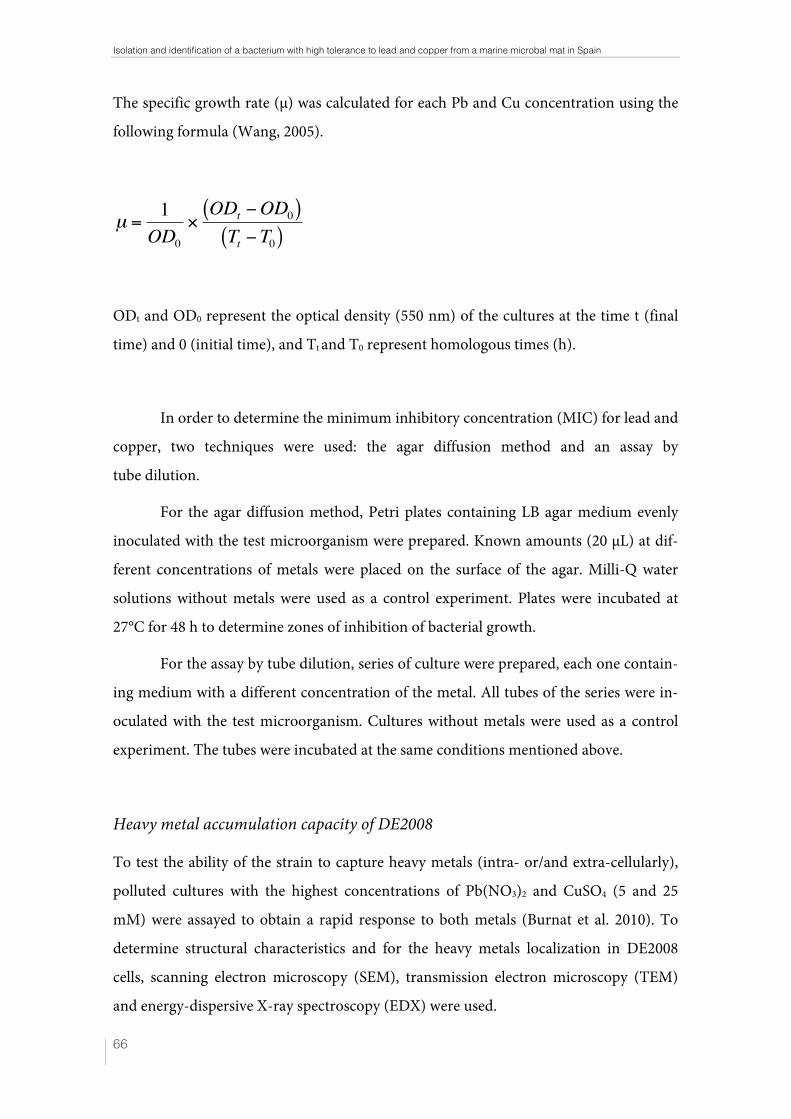
Isolation and identification of a bacterium with high tolerance to lead and copper from a marine microbal mat in Spain
!66
The specific growth rate (µ) was calculated for each Pb and Cu concentration using the
following formula (Wang, 2005).
!
µ =1
OD0
"ODt #OD0( )Tt #T0( )
ODt and OD0 represent the optical density (550 nm) of the cultures at the time t (final
time) and 0 (initial time), and Tt and T0 represent homologous times (h).
In order to determine the minimum inhibitory concentration (MIC) for lead and
copper, two techniques were used: the agar diffusion method and an assay by
tube dilution.
For the agar diffusion method, Petri plates containing LB agar medium evenly
inoculated with the test microorganism were prepared. Known amounts (20 µL) at dif-
ferent concentrations of metals were placed on the surface of the agar. Milli-Q water
solutions without metals were used as a control experiment. Plates were incubated at
27°C for 48 h to determine zones of inhibition of bacterial growth.
For the assay by tube dilution, series of culture were prepared, each one contain-
ing medium with a different concentration of the metal. All tubes of the series were in-
oculated with the test microorganism. Cultures without metals were used as a control
experiment. The tubes were incubated at the same conditions mentioned above.
Heavy metal accumulation capacity of DE2008
To test the ability of the strain to capture heavy metals (intra- or/and extra-cellularly),
polluted cultures with the highest concentrations of Pb(NO3)2 and CuSO4 (5 and 25
mM) were assayed to obtain a rapid response to both metals (Burnat et al. 2010). To
determine structural characteristics and for the heavy metals localization in DE2008
cells, scanning electron microscopy (SEM), transmission electron microscopy (TEM)
and energy-dispersive X-ray spectroscopy (EDX) were used.
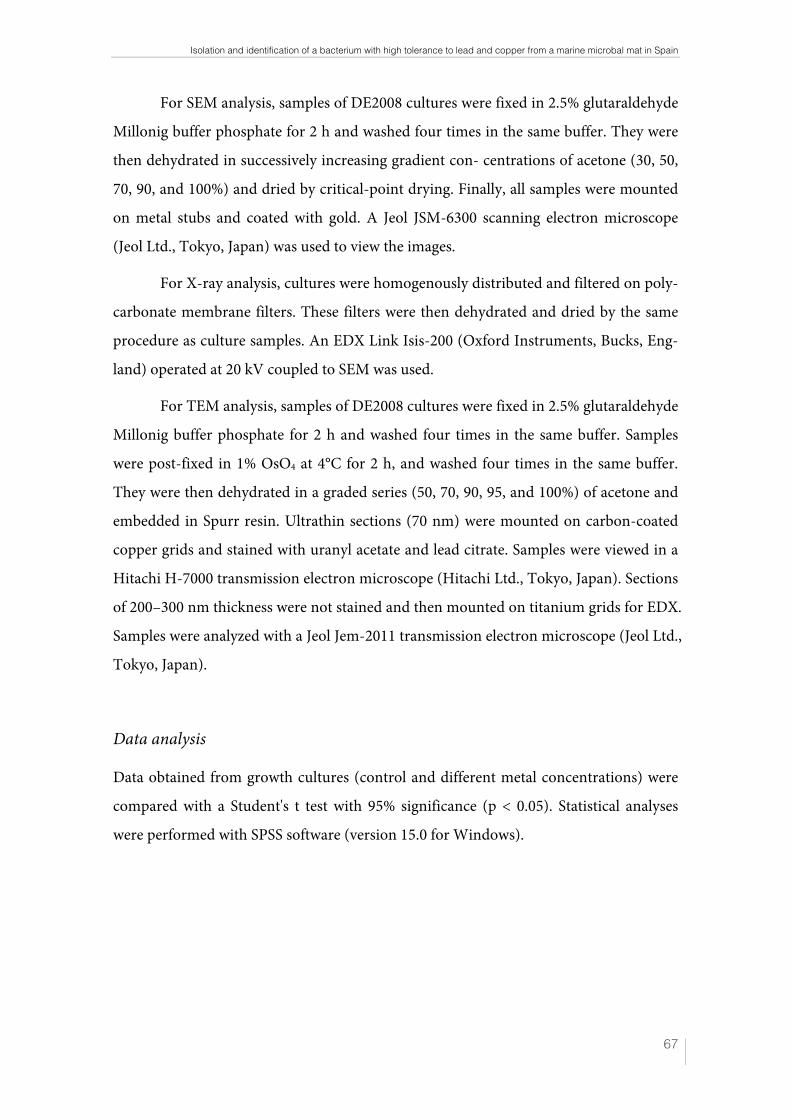
Isolation and identification of a bacterium with high tolerance to lead and copper from a marine microbal mat in Spain
! 67
For SEM analysis, samples of DE2008 cultures were fixed in 2.5% glutaraldehyde
Millonig buffer phosphate for 2 h and washed four times in the same buffer. They were
then dehydrated in successively increasing gradient con- centrations of acetone (30, 50,
70, 90, and 100%) and dried by critical-point drying. Finally, all samples were mounted
on metal stubs and coated with gold. A Jeol JSM-6300 scanning electron microscope
(Jeol Ltd., Tokyo, Japan) was used to view the images.
For X-ray analysis, cultures were homogenously distributed and filtered on poly-
carbonate membrane filters. These filters were then dehydrated and dried by the same
procedure as culture samples. An EDX Link Isis-200 (Oxford Instruments, Bucks, Eng-
land) operated at 20 kV coupled to SEM was used.
For TEM analysis, samples of DE2008 cultures were fixed in 2.5% glutaraldehyde
Millonig buffer phosphate for 2 h and washed four times in the same buffer. Samples
were post-fixed in 1% OsO4 at 4°C for 2 h, and washed four times in the same buffer.
They were then dehydrated in a graded series (50, 70, 90, 95, and 100%) of acetone and
embedded in Spurr resin. Ultrathin sections (70 nm) were mounted on carbon-coated
copper grids and stained with uranyl acetate and lead citrate. Samples were viewed in a
Hitachi H-7000 transmission electron microscope (Hitachi Ltd., Tokyo, Japan). Sections
of 200–300 nm thickness were not stained and then mounted on titanium grids for EDX.
Samples were analyzed with a Jeol Jem-2011 transmission electron microscope (Jeol Ltd.,
Tokyo, Japan).
Data analysis
Data obtained from growth cultures (control and different metal concentrations) were
compared with a Student's t test with 95% significance (p < 0.05). Statistical analyses
were performed with SPSS software (version 15.0 for Windows).
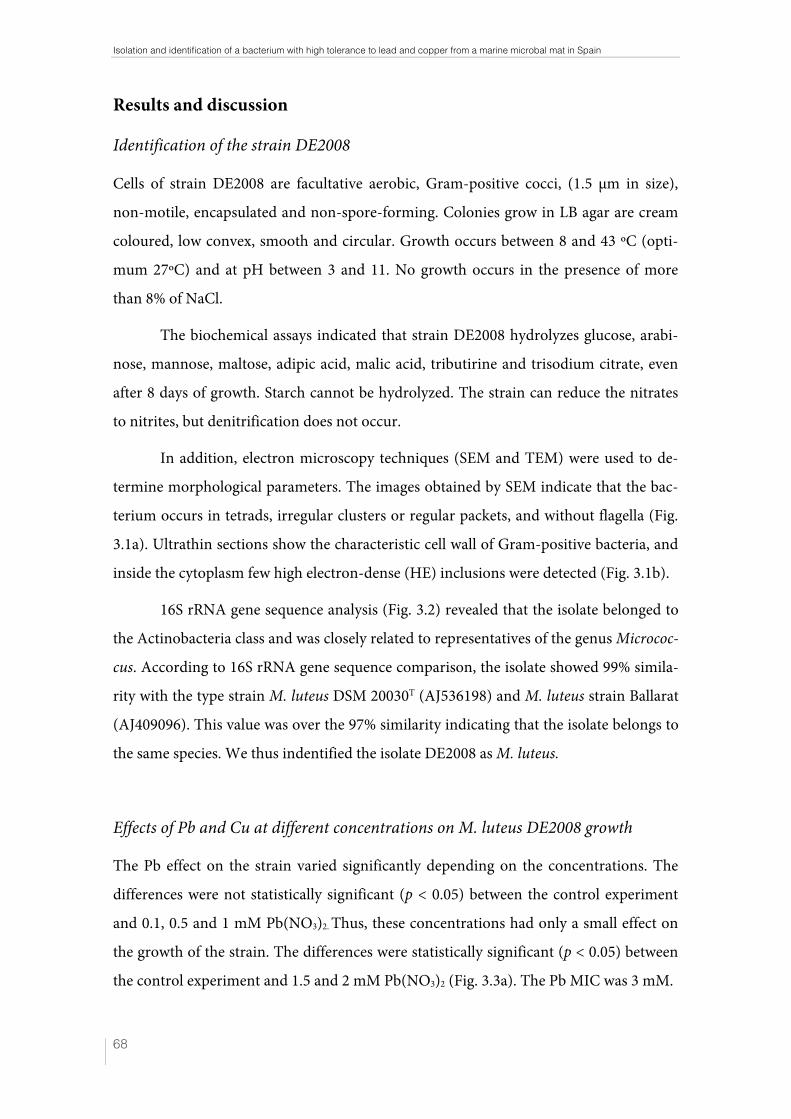
Isolation and identification of a bacterium with high tolerance to lead and copper from a marine microbal mat in Spain
!68
Results and discussion
Identification of the strain DE2008
Cells of strain DE2008 are facultative aerobic, Gram-positive cocci, (1.5 µm in size),
non-motile, encapsulated and non-spore-forming. Colonies grow in LB agar are cream
coloured, low convex, smooth and circular. Growth occurs between 8 and 43 ºC (opti-
mum 27ºC) and at pH between 3 and 11. No growth occurs in the presence of more
than 8% of NaCl.
The biochemical assays indicated that strain DE2008 hydrolyzes glucose, arabi-
nose, mannose, maltose, adipic acid, malic acid, tributirine and trisodium citrate, even
after 8 days of growth. Starch cannot be hydrolyzed. The strain can reduce the nitrates
to nitrites, but denitrification does not occur.
In addition, electron microscopy techniques (SEM and TEM) were used to de-
termine morphological parameters. The images obtained by SEM indicate that the bac-
terium occurs in tetrads, irregular clusters or regular packets, and without flagella (Fig.
3.1a). Ultrathin sections show the characteristic cell wall of Gram-positive bacteria, and
inside the cytoplasm few high electron-dense (HE) inclusions were detected (Fig. 3.1b).
16S rRNA gene sequence analysis (Fig. 3.2) revealed that the isolate belonged to
the Actinobacteria class and was closely related to representatives of the genus Micrococ-
cus. According to 16S rRNA gene sequence comparison, the isolate showed 99% simila-
rity with the type strain M. luteus DSM 20030T (AJ536198) and M. luteus strain Ballarat
(AJ409096). This value was over the 97% similarity indicating that the isolate belongs to
the same species. We thus indentified the isolate DE2008 as M. luteus.
Effects of Pb and Cu at different concentrations on M. luteus DE2008 growth
The Pb effect on the strain varied significantly depending on the concentrations. The
differences were not statistically significant (p < 0.05) between the control experiment
and 0.1, 0.5 and 1 mM Pb(NO3)2. Thus, these concentrations had only a small effect on
the growth of the strain. The differences were statistically significant (p < 0.05) between
the control experiment and 1.5 and 2 mM Pb(NO3)2 (Fig. 3.3a). The Pb MIC was 3 mM.
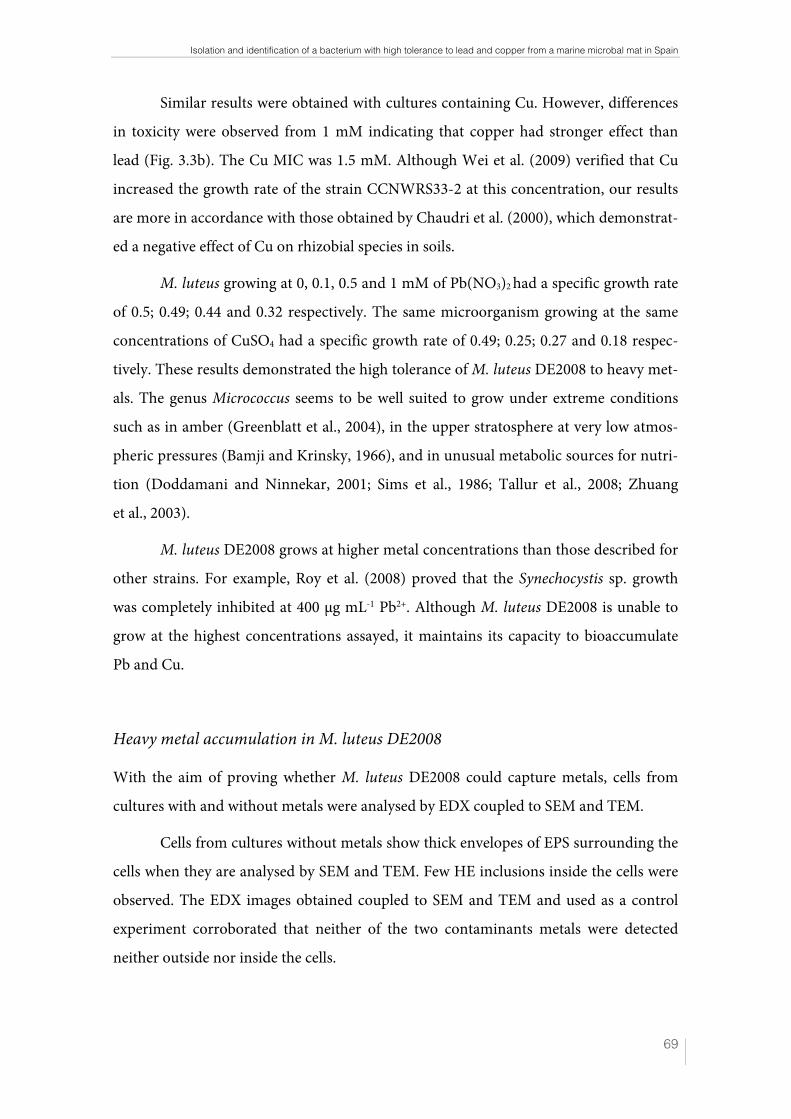
Isolation and identification of a bacterium with high tolerance to lead and copper from a marine microbal mat in Spain
! 69
Similar results were obtained with cultures containing Cu. However, differences
in toxicity were observed from 1 mM indicating that copper had stronger effect than
lead (Fig. 3.3b). The Cu MIC was 1.5 mM. Although Wei et al. (2009) verified that Cu
increased the growth rate of the strain CCNWRS33-2 at this concentration, our results
are more in accordance with those obtained by Chaudri et al. (2000), which demonstrat-
ed a negative effect of Cu on rhizobial species in soils.
M. luteus growing at 0, 0.1, 0.5 and 1 mM of Pb(NO3)2 had a specific growth rate
of 0.5; 0.49; 0.44 and 0.32 respectively. The same microorganism growing at the same
concentrations of CuSO4 had a specific growth rate of 0.49; 0.25; 0.27 and 0.18 respec-
tively. These results demonstrated the high tolerance of M. luteus DE2008 to heavy met-
als. The genus Micrococcus seems to be well suited to grow under extreme conditions
such as in amber (Greenblatt et al., 2004), in the upper stratosphere at very low atmos-
pheric pressures (Bamji and Krinsky, 1966), and in unusual metabolic sources for nutri-
tion (Doddamani and Ninnekar, 2001; Sims et al., 1986; Tallur et al., 2008; Zhuang
et al., 2003).
M. luteus DE2008 grows at higher metal concentrations than those described for
other strains. For example, Roy et al. (2008) proved that the Synechocystis sp. growth
was completely inhibited at 400 μg mL-1 Pb2+. Although M. luteus DE2008 is unable to
grow at the highest concentrations assayed, it maintains its capacity to bioaccumulate
Pb and Cu.
Heavy metal accumulation in M. luteus DE2008
With the aim of proving whether M. luteus DE2008 could capture metals, cells from
cultures with and without metals were analysed by EDX coupled to SEM and TEM.
Cells from cultures without metals show thick envelopes of EPS surrounding the
cells when they are analysed by SEM and TEM. Few HE inclusions inside the cells were
observed. The EDX images obtained coupled to SEM and TEM and used as a control
experiment corroborated that neither of the two contaminants metals were detected
neither outside nor inside the cells.
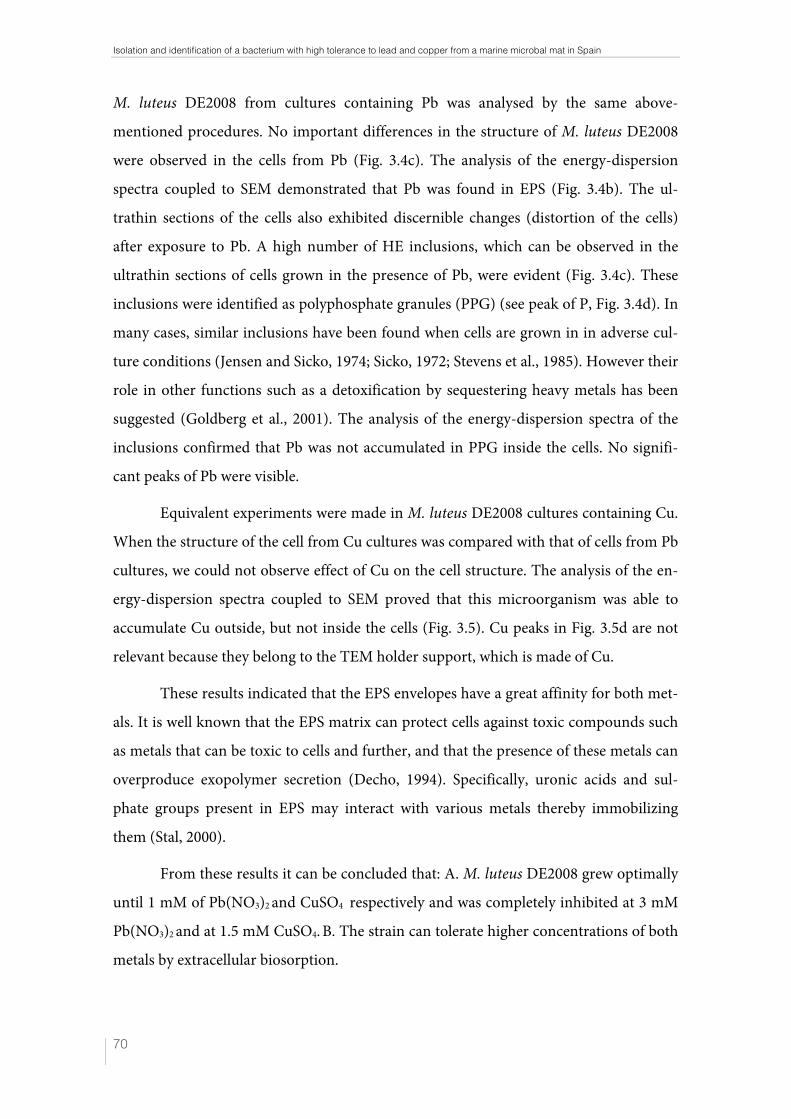
Isolation and identification of a bacterium with high tolerance to lead and copper from a marine microbal mat in Spain
!70
M. luteus DE2008 from cultures containing Pb was analysed by the same above-
mentioned procedures. No important differences in the structure of M. luteus DE2008
were observed in the cells from Pb (Fig. 3.4c). The analysis of the energy-dispersion
spectra coupled to SEM demonstrated that Pb was found in EPS (Fig. 3.4b). The ul-
trathin sections of the cells also exhibited discernible changes (distortion of the cells)
after exposure to Pb. A high number of HE inclusions, which can be observed in the
ultrathin sections of cells grown in the presence of Pb, were evident (Fig. 3.4c). These
inclusions were identified as polyphosphate granules (PPG) (see peak of P, Fig. 3.4d). In
many cases, similar inclusions have been found when cells are grown in in adverse cul-
ture conditions (Jensen and Sicko, 1974; Sicko, 1972; Stevens et al., 1985). However their
role in other functions such as a detoxification by sequestering heavy metals has been
suggested (Goldberg et al., 2001). The analysis of the energy-dispersion spectra of the
inclusions confirmed that Pb was not accumulated in PPG inside the cells. No signifi-
cant peaks of Pb were visible.
Equivalent experiments were made in M. luteus DE2008 cultures containing Cu.
When the structure of the cell from Cu cultures was compared with that of cells from Pb
cultures, we could not observe effect of Cu on the cell structure. The analysis of the en-
ergy-dispersion spectra coupled to SEM proved that this microorganism was able to
accumulate Cu outside, but not inside the cells (Fig. 3.5). Cu peaks in Fig. 3.5d are not
relevant because they belong to the TEM holder support, which is made of Cu.
These results indicated that the EPS envelopes have a great affinity for both met-
als. It is well known that the EPS matrix can protect cells against toxic compounds such
as metals that can be toxic to cells and further, and that the presence of these metals can
overproduce exopolymer secretion (Decho, 1994). Specifically, uronic acids and sul-
phate groups present in EPS may interact with various metals thereby immobilizing
them (Stal, 2000).
From these results it can be concluded that: A. M. luteus DE2008 grew optimally
until 1 mM of Pb(NO3)2 and CuSO4 respectively and was completely inhibited at 3 mM
Pb(NO3)2 and at 1.5 mM CuSO4. B. The strain can tolerate higher concentrations of both
metals by extracellular biosorption.
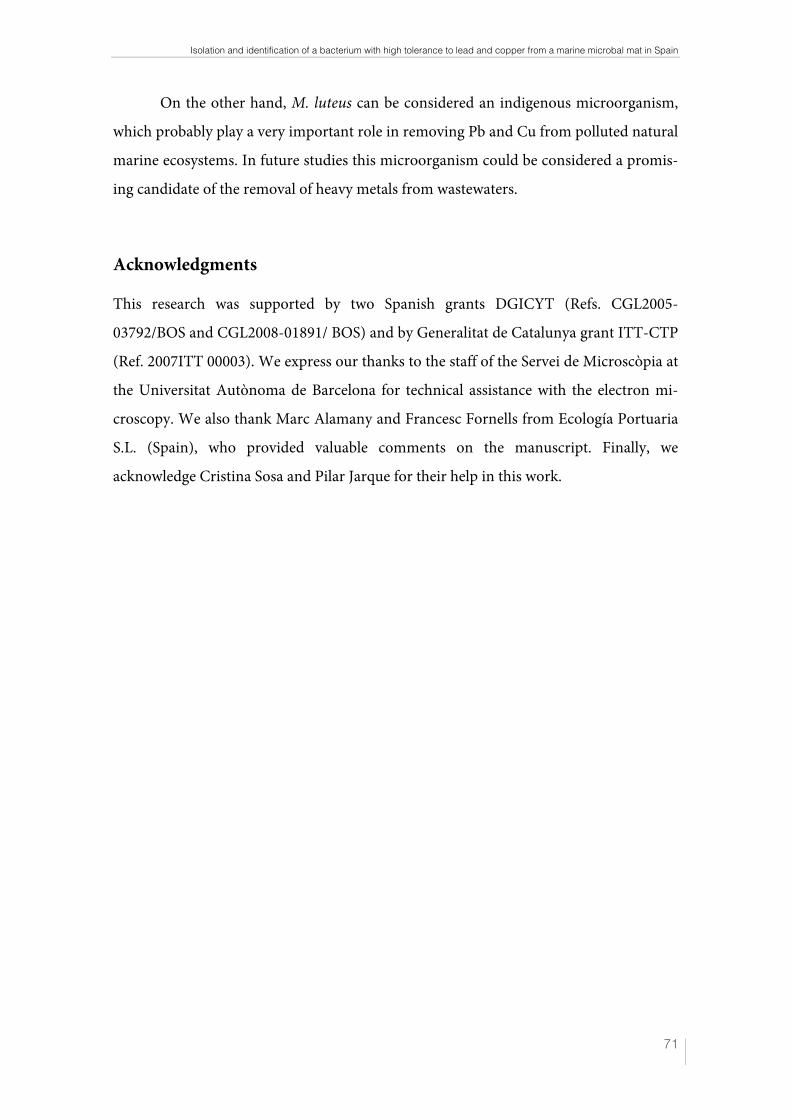
Isolation and identification of a bacterium with high tolerance to lead and copper from a marine microbal mat in Spain
! 71
On the other hand, M. luteus can be considered an indigenous microorganism,
which probably play a very important role in removing Pb and Cu from polluted natural
marine ecosystems. In future studies this microorganism could be considered a promis-
ing candidate of the removal of heavy metals from wastewaters.
Acknowledgments
This research was supported by two Spanish grants DGICYT (Refs. CGL2005-
03792/BOS and CGL2008-01891/ BOS) and by Generalitat de Catalunya grant ITT-CTP
(Ref. 2007ITT 00003). We express our thanks to the staff of the Servei de Microscòpia at
the Universitat Autònoma de Barcelona for technical assistance with the electron mi-
croscopy. We also thank Marc Alamany and Francesc Fornells from Ecología Portuaria
S.L. (Spain), who provided valuable comments on the manuscript. Finally, we
acknowledge Cristina Sosa and Pilar Jarque for their help in this work.
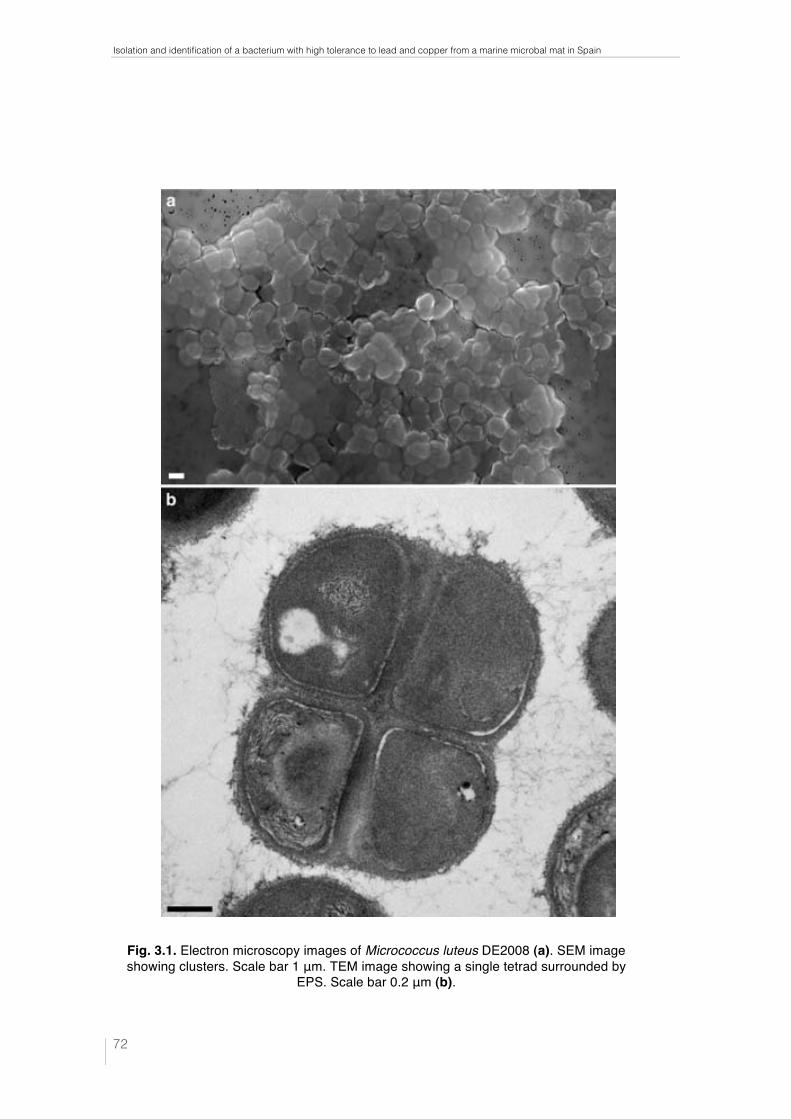
Isolation and identification of a bacterium with high tolerance to lead and copper from a marine microbal mat in Spain
!72
!
Fig. 3.1. Electron microscopy images of Micrococcus luteus DE2008 (a). SEM image showing clusters. Scale bar 1 μm. TEM image showing a single tetrad surrounded by
EPS. Scale bar 0.2 μm (b).
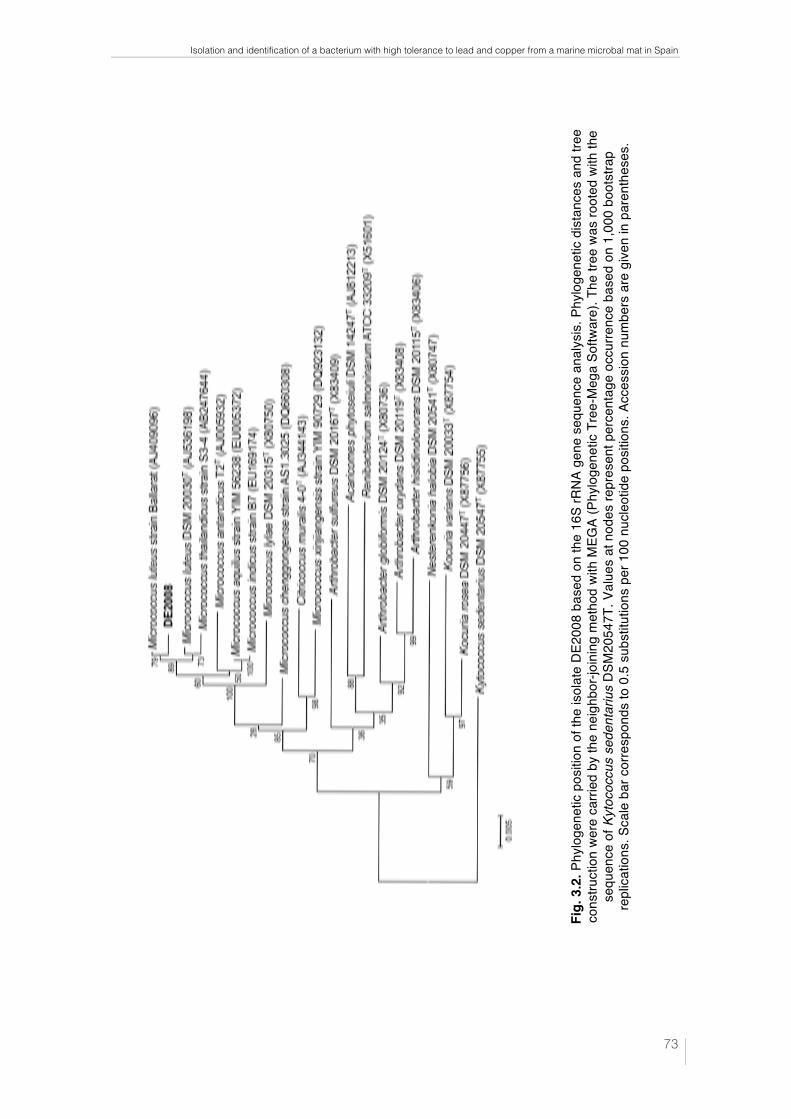
Isolation and identification of a bacterium with high tolerance to lead and copper from a marine microbal mat in Spain
! 73
Fig.
3.2
. Phy
loge
netic
pos
ition
of th
e is
olat
e DE
2008
bas
ed o
n th
e 16
S rR
NA g
ene
sequ
ence
ana
lysis
. Phy
loge
netic
dis
tanc
es a
nd tr
ee
cons
truct
ion
were
car
ried
by th
e ne
ighb
or-jo
inin
g m
etho
d wi
th M
EGA
(Phy
loge
netic
Tre
e-M
ega
Softw
are)
. The
tree
was
root
ed w
ith th
e se
quen
ce o
f Kyt
ococ
cus
sede
ntar
ius
DSM
2054
7T. V
alue
s at
nod
es re
pres
ent p
erce
ntag
e oc
curre
nce
base
d on
1,0
00 b
oots
trap
re
plica
tions
. Sca
le b
ar c
orre
spon
ds to
0.5
sub
stitu
tions
per
100
nuc
leot
ide
posi
tions
. Acc
essi
on n
umbe
rs a
re g
iven
in p
aren
thes
es.
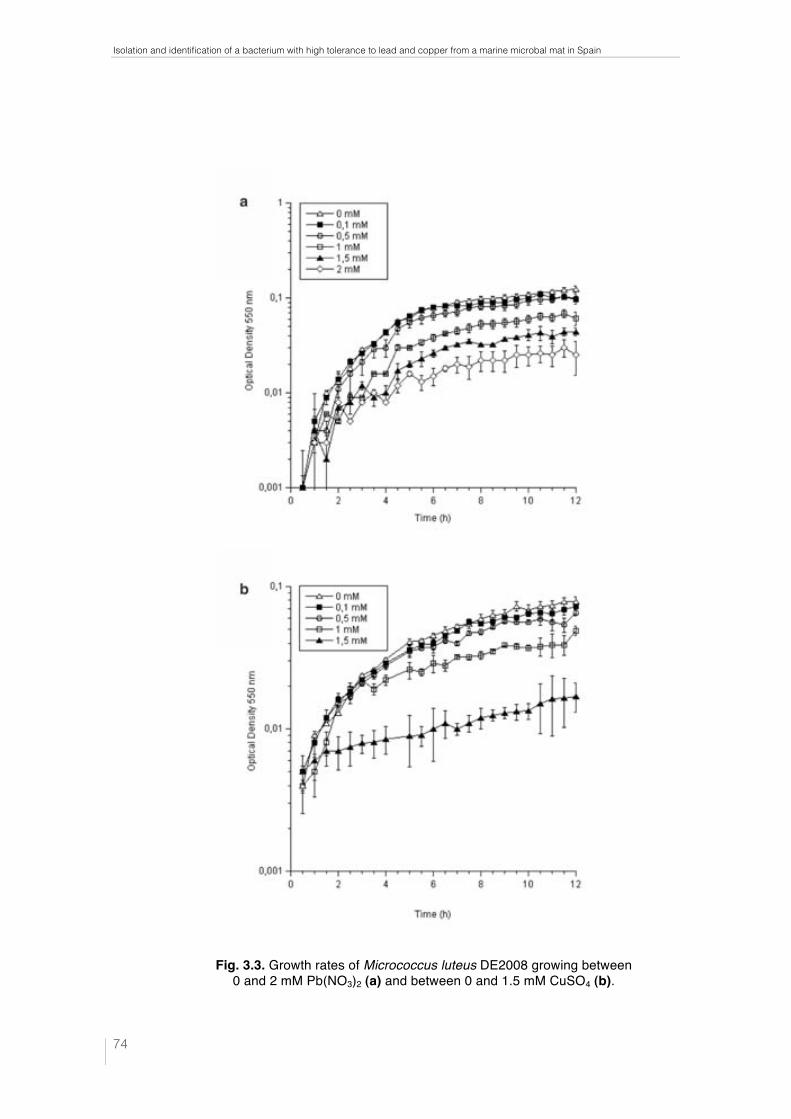
Isolation and identification of a bacterium with high tolerance to lead and copper from a marine microbal mat in Spain
!74
!!
Fig. 3.3. Growth rates of Micrococcus luteus DE2008 growing between 0 and 2 mM Pb(NO3)2 (a) and between 0 and 1.5 mM CuSO4 (b).
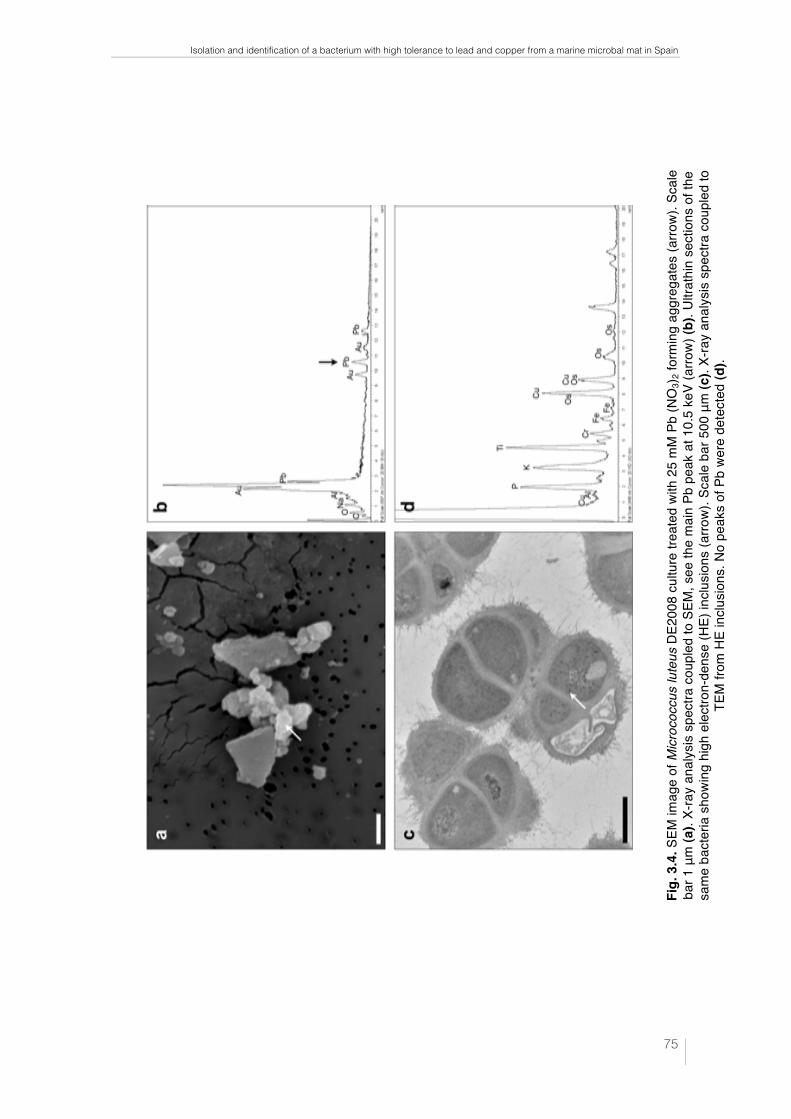
Isolation and identification of a bacterium with high tolerance to lead and copper from a marine microbal mat in Spain
! 75
Fig.
3.4
. SEM
imag
e of
Micr
ococ
cus
lute
us D
E200
8 cu
lture
trea
ted
with
25
mM
Pb
(NO
3) 2 fo
rmin
g ag
greg
ates
(arro
w). S
cale
ba
r 1 μ
m (a
). X-
ray
anal
ysis
spe
ctra
cou
pled
to S
EM, s
ee th
e m
ain
Pb p
eak
at 1
0.5
keV
(arro
w) (b
). Ul
trath
in s
ectio
ns o
f the
sa
me
bact
eria
sho
wing
hig
h el
ectro
n-de
nse
(HE)
inclu
sion
s (a
rrow)
. Sca
le b
ar 5
00 μ
m (c
). X-
ray
anal
ysis
spe
ctra
cou
pled
to
TEM
from
HE
inclu
sion
s. N
o pe
aks
of P
b we
re d
etec
ted
(d).
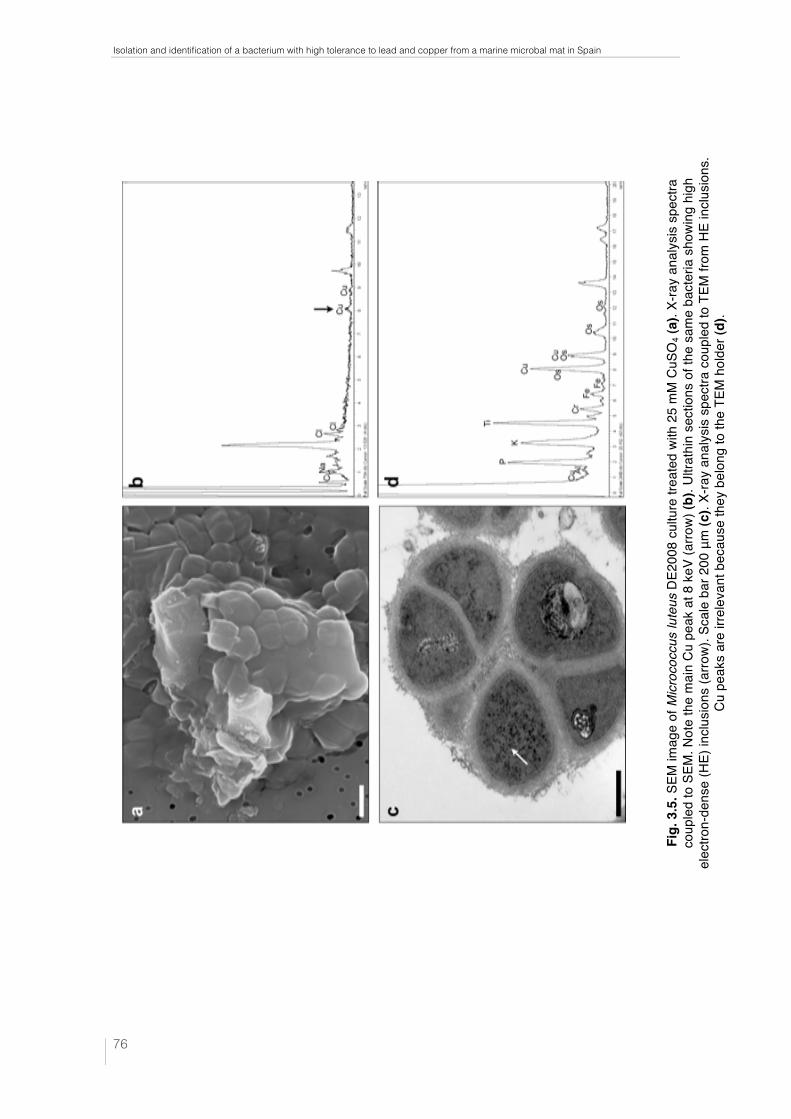
Isolation and identification of a bacterium with high tolerance to lead and copper from a marine microbal mat in Spain
!76
Fig.
3.5
. SEM
imag
e of
Micr
ococ
cus
lute
us D
E200
8 cu
lture
trea
ted
with
25
mM
CuS
O4 (
a). X
-ray
anal
ysis
spe
ctra
co
uple
d to
SEM
. Not
e th
e m
ain
Cu p
eak
at 8
keV
(arro
w) (b
). Ul
trath
in s
ectio
ns o
f the
sam
e ba
cter
ia s
howi
ng h
igh
el
ectro
n-de
nse
(HE)
inclu
sion
s (a
rrow)
. Sca
le b
ar 2
00 μ
m (c
). X-
ray
anal
ysis
spe
ctra
cou
pled
to T
EM fr
om H
E in
clusi
ons.
Cu
pea
ks a
re ir
rele
vant
bec
ause
they
bel
ong
to th
e TE
M h
olde
r (d)
.
Isolation and identification of a bacterium with high tolerance to lead and copper from a marine microbal mat in Spain
! 77
References
Al-Hasan R.H., Al-Bader D., Sorkhoh N.A. and Radwan S.S. (1998). Evidence for n-
alakane consumption and oxidation by filamentous cyanobacteria from oil-
contaminated coasts of the Arabian Gulf. Mar. Biol. 130, 521-527.
Bamji M.S. and Krinsky N.I. (1966) The carotenoid pigments of a radiation-resistant
Micrococcus species. Biochim. Biophys. Acta. 115, 276-284.
Binupriya A.R., Sathishkumar M., Swaminathan K., Jeong E.S., Yun S.E. and Pattabi S. (2006) Biosorption of metal ions from aqueous solution and electroplating in-
dustry wastewater by Aspergillus japonicus: phytotoxicity studies. Bull. Environ.
Contam. Toxicol. 77, 219-227.
Bordenave S., Fourçans A., Blachard S., Goñi M.S., Caumette P. and Duran R. (2004)
Structure and functional analysis of bacterial communities changes in microbial
mats following petroleum exposure. Ophelia. 58, 195-203.
Burnat M., Diestra E., Esteve I. and Solé A. (2010) Confocal laser scanning microscopy
coupled to a spectrofluorometric detector as a rapid tool for determining the in vi-
vo effect of metals on phototrophic bacteria. Bull. Environ. Contam. Toxicol. 84,
55-60.
Chaudri A.M., Allain C.M.G., Barbosa-Jefferson V.L., Nicholson F.A., Chambers B.J. and McGrath S.P. (2000) A study of the impacts of Zn and Cu on two rhizobial
species in soils of a long-term field experiment. Plant. Soil. 221, 167-179.
Cowan S.T. and Steel K.J. (1965) Manual for the identification of medical bacteria.
London: Cambridge University Press, New York.
Decho A.W. (1994) Exopolymers in microbial mats: assessing their adaptative roles. In:
Stal L.J. and Caumette P. (Eds.), Microbial Mats. Structure, development and envi-
ronment significance. Springer-Verlag, Berlin, Heidelberg, pp. 215-219.
Diestra E., Solé A. and Esteve I. (2004) A comparative study of cyanobacterial diversity
in polluted and unpolluted microbial mats by means of CLSM. Ophelia. 58, 151-
156.
Isolation and identification of a bacterium with high tolerance to lead and copper from a marine microbal mat in Spain
!78
Diestra E., Solé A., Martí.M., García de Oteyza T., Grimalt J.O. and Esteve I. (2005)
Characterization of an oil-degrading Microcoleus consortium by means of confo-
cal scanning microscopy, scanning electron microscopy and transmission electron
microscopy. Scanning. 27, 176-180.
Doddamani H.P. and Ninnekar H.Z. (2001) Biodegradation of carbaryl by a Micrococ-
cus species. Curr. Microbiol. 43, 69-73.
García de Oteyza T., Grimalt J.O., Diestra E., Solé A. and Esteve I. (2004). Changes in
the composition of polar and apolar crude oil fractions under the action of Micro-
coleus consortia. Appl. Microbiol. Biotechnol. 66, 226-232.
Goldberg J., González H., Jensen T.E. and Corpe W.A. (2001) Quantitative analysis of
the elemental composition and the mass of bacterial polyphosphate bodies using
STEM EDX. Microbios. 106, 177-188.
Gong R., Ding Y., Liu H., Chen Q. and Liu Z. (2005) Lead biosorption and desorption
by intact and pretreated Spirulina maxima biomass. Chemosphere. 58, 125-130.
Greenblatt C.L., Baum J., Klein B.Y., Nachshon S., Koltunov V. and Cano R.J. (2004)
Micrococcus luteus -- survival in amber. Microb. Ecol. 48, 120-127.
Jensen T.E. and Sicko L.M. (1974) Phosphate metabolism in blue-green algae. I. Fine
structure of the "polyphosphate overplus" phenomenon in Plectonema boryanum.
Can. J. Microbiol. 20, 1235-1239.
Jukes T.H. and Cantor C.R. (1969) Evolution of proteins molecules. In: Munro H.R.
(Eds.), Mammalian Proteins Metabolism, Academic Press, New York, pp. 21-23.
Kumar S., Tamura K. and Nei M. (2004) MEGA3: Integrated software for Molecular
Evolutionary Genetics Analysis and sequence alignment. Brief. Bioinform. 5, 150-
163.
Nakajima A. and Tsuruta T. (2004) Competitive biosorption of thorium and uranium
by Micrococcus luteus. J. Radioanal. Nucl. Chem. 260, 13-18.
Radwan S.S. and Sorkhoh N.A. (1993) Lipids of n-alkanes ultilizing microorganisms
and their application potential. Adv. Appl. Microbiol. 39, 29-90.
Isolation and identification of a bacterium with high tolerance to lead and copper from a marine microbal mat in Spain
! 79
Roane T.M. and Pepper I.L. (2000) Microorganisms and metal pollutants, In: Maier
R.M., Pepper I.L. and Gerba C.P. (Eds.), Environmental Microbiology, Academic
Press, New York, pp. 403-423.
Roy S., Ghosh A.N. and Thakur A.R. (2008) Uptake of Pb(2+)by a cyanobacterium
belonging to the genus Synechocystis, isolated from East Kolkata Wetlands. Bio-
metals. 21, 515-524.
Saitou N. and Nei M. (1987) The neighbor-joining method: a new method for recon-
structing phylogenetic trees. Mol. Biol. Evol. 4, 406-425.
Sánchez O., Diestra E., Esteve I. and Mas J. (2005) Molecular characterization of an
oil-degrading cyanobacterial consortium. Microb. Ecol. 50, 580-588.
Sánchez-Chardi A., López-Fuster M.J. and Nadal J. (2007) Bioaccumulation of lead,
mercury, and cadmium in the greater white-toothed shrew, Crocidura russula,
from the Ebro Delta (NE Spain): sex- and age-dependent variation. Environ. Pollut.
145, 7-14.
Sicko L.M. (1972) Structural variation of polyphosphate bodies in blue-green algae. In:
Arceneaux J. (Eds.), Ann. Proc. Electron. Micros. Soc. Amer. Los Angeles, Califor-
nia, pp. 218-219.
Sims G.K., Sommers L.E. and Konopka A. (1986) Degradation of pyridine by Micro-
coccus luteus isolated from soil. Appl. Environ. Microbiol. 5, 963-968.
Solé A., Diestra E. and Esteve I. (2009) Confocal laser scanning microscopy image
analysis for cyanobacterial biomass determined at microscale level in different mi-
crobial mats. Microb. Ecol. 57, 649-656.
Stal L.J. (2000) Cyanobacterial mats and stromatolites. In: Whitton B.A., Potts M.
(Eds.), The ecology of cyanobacteria. Kluwer Academic Publishers, Dordrecht, The
Netherlands, pp. 61-120.
Stevens Jr S.E., Nierzwicki-Bauer S.A., Balkwill D.L. (1985) Effect of nitrogen starva-
tion on the morphology and ultrastructure of the cyanobacterium Mastigocladus
laminosus. J. Bacteriol. 161, 1215-1218.
Isolation and identification of a bacterium with high tolerance to lead and copper from a marine microbal mat in Spain
!80
Takeuchi M., Weiss N., Schumann P. and Yokota A. (1996) Leucobacter komagatae
gen. nov., sp. nov., a new aerobic gram-positive, nonsporulating rod with 2,4-
diaminobutyric acid in the cell wall. Int. J. Syst. Bacteriol. 46, 967-971.
Tallur P.N., Megadi V.B. and Ninnekar H.Z. (2008) Biodegradation of cypermethrin
by Micrococcus sp. strain CPN 1. Biodegradation. 19, 77-82.
Tunali S., Çabu A. and Akar T. (2006) Removal of lead and copper ions from aqueous
solutions by bacterial strain isolated from soil. Chem. Eng. J. 115, 203-211.
Wang Y.C. (2005) Study on kinetics of alcohol fermentation on the basis of the biomass
specific growth rate. Liq. Sci. Technol. 9, 48-51.
Wei G., Fan L., Zhu W., Fu Y., Yu J. and Tang M. (2009) Isolation and characteriza-
tion of the heavy metal resistant bacteria CCNWRS33-2 isolated from root nodule
of Lespedeza cuneata in gold mine tailings in China. J. Hazard. Mater. 162, 50-56.
Zhuang W.Q., Tay J.H., Maszenan A.M., Krumholz L.R. and Tay S.T. (2003) Im-
portance of Gram-positive naphthalene-degrading bacteria in oil-contaminated
tropical marine sediments. Lett. Appl. Microbiol. 36, 251-257.
Ziagova M., Dimitriadis G., Aslanidou D., Papaioannou X., Litopoulou Tzannetaki E. and Liakopoulou-Kyriakides M., (2007) Comparative study of Cd(II) and
Cr(VI) biosorption on Staphylococcus xylosus and Pseudomonas sp. in single and
binary mixtures. Bioresour. Technol. 98, 2859-2865.

!
!
4. Electron microscopy techniques and energy
dispersive X-ray applied to determine the sorption
of lead in Paracoccus sp. DE2007

!
!
!
!
Electron microscopy techniques and energy dispersive X-ray applied to determine the sorption of lead
in Paracoccus sp. DE2007
Massimiliano Baratelli, Juan Maldonado, Isabel Esteve, Antonio Solé and Elia Diestra.
Department of Genetics and Microbiology. Biosciences Faculty. Autonomous University of Barcelona. Bellaterra, 08193. Barcelona-Spain.
Abstract
Paracoccus sp. DE2007 was isolated from a consortium of microorganisms in
Ebro Delta microbial mats. The isolated strain was identified according to its biochemi-
cal and molecular characteristics as Paracoccus sp. DE2007 (Diestra et al., 2007).
The strain was able to grow in solid medium in the presence of heavy metals and
crude oil. In the present work electron microscopy techniques coupled to Energy Dis-
persive X-ray were used to determine if this strain is able to capture lead extra- and/or
intra-cellularly because lead has been detected in Ebro delta as a toxic pollutant.
The results indicate that Paraccoccus sp. DE2007 has a great affinity for lead,
which is absorbed into the external envelope but not into the cytoplasmic space.

!
!
Electron microscopy techniques and energy dispersive X-ray applied to determine the sorption of lead in Paracoccus sp. DE2007
! 85
Introduction
Among the possible applications of the capacity of microorganisms to interact with
metals, biosorption and bioaccumulation are potential options for replacing abiotic
techniques in the removal of toxic metals (Vijayaraghavan and Yun, 2008). The biosorp-
tion process takes place mainly at the cell surface, where there are a large variety of cel-
lular compounds that can bind metals, such as the peptidoglycan, teichoic acids and
lipoteichoic acids and several polysaccharides and proteins (Wang and Chen, 2009).
Functional groups containing O-, N-, S- or P- are directly involved in the binding of
metals. The most important of these groups are: carbonyl (ketone), carboxyl, sulfhydryl
(thiol), sulfonate, thioether, amine, secondary amine, amide, imine, imidazole, phos-
phonate and phosphodiester (Wang and Chen, 2009). The mechanisms involved in
metals binding to the cell surface are metabolically passive and include electrostatic in-
teractions, Van der Waals forces, covalent bonds, redox interactions, extracellular pre-
cipitation, mineral nucleation and combinations of these (Gavrilescu, 2004) The extra-
cellular polymeric substance (EPS) is currently receiving much attention as it is able to
flocculate and absorb metal ions and enhance colonization and microbial growth
through the formation of biofilms (Vu et al., 2009). Many microorganisms produce EPS,
which is a mixture of biopolymers composed mainly of polysaccharides, as well as pro-
teins, nucleic acids, lipids and humic substances. The EPS is also located in the intercel-
lular space of microbial aggregates and forms the structure and architecture of the bio-
film matrix. Its secretion and features depend on the species and growing conditions. It
has been observed that some bacteria can increase their EPS production in the presence
of toxic compounds (e.g. metals) as a defense mechanism (Decho, 1994).
On the other hand, bioaccumulation is defined as the intracellular accumulation
of metals. It consists first in biosorption to the cell surface, followed by transport and
concentration in intracytoplasm compartments. The extracellular heavy metals can
move in the cytoplasm through two processes: the first is rapid, nonspecific, and usually
based on the chemiosmotic gradient (passive transport), and since it is used by a wide
variety of substrates it is expressed constitutively; the second transport system has a high
specificity for the substrate, is slower and often uses adeninatriphosphate hydrolysis
(ATP) as the energy source (active transport), but can also function by osmotic gradient.
Electron microscopy techniques and energy dispersive X-ray applied to determine the sorption of lead in Paracoccus sp. DE2007
!86
The latter system is inducible and is produced by the cell during stress conditions or cell
starvation (Nies, 1999). The metals released into the cell bind or chelate different cellu-
lar components before being incorporated into cellular compartments, if they are suita-
ble. The captured metal can form complexes with compounds such as proteins rich in
thiol groups physiologically present in cells (enzymes of metabolic pathways) or synthe-
sized in the presence of metals (metallothioneins and phytochelatins) and glutathione (a
compound that determines oxidative stress in cells) (Wang and Chen, 2009).
The need for more new products to bioremediate polluted ecosystems makes it
necessary to find microorganisms with unique capabilities to capture metals. These mi-
croorganisms are often found and isolated in polluted environments where there is high
selective pressure.
In recent years a Microcoleus consortium that is capable of degrading crude oil
(García de Oteyza et al., 2004) was isolated in our laboratory by Diestra et al. (2005)
from Ebro Delta microbial mats (Tarragona-Spain). The Microcoleus consortium was
formed by a phototrophic cyanobacterium and different heterotrophic microorganisms.
Microcoleus sp. DE2005 (Diestra et al. 2005) and Micrococcus sp. DE2008 (Maldonado et
al., 2010a) were isolated and their capacities to tolerate or biocapture heavy metals were
determined. Although Paracoccus sp. DE2007 isolated from the same consortium was
also identified by Diestra et al. (2007), its capacity to biosorption and/or bioaccumulate
heavy metals was not determined.
Despite the extensive information available on the genus Paracoccus, very little is
known about its ability to biocapture heavy metals. Since both the Microcoleus consorti-
um and some of the isolated microorganisms mentioned above are able to biosorption
or bioaccumulate heavy metals, the objective of this study was to determine whether
Paracoccus DE2007 has this ability. For this purpose we used electron microscopy tech-
niques in combination with an electron dispersive X-ray detector. We select lead among
heavy metal because it is very toxic and has no biological functions and because it has
been detected in Ebro Delta.
Electron microscopy techniques and energy dispersive X-ray applied to determine the sorption of lead in Paracoccus sp. DE2007
! 87
Material and Methods
Bacterial strain and culture conditions
Paracoccus sp. DE2007 was isolated from a Microcoleus consortium (Diestra et al.,
2007). Cells were grown in Luria Bertani (LB) liquid medium containing tryptone (10.0
g L-1), yeast extract (5.0 g L-1) and NaCl (10.0 g L-1) at pH 7 and 27ºC for 24 h. Lead stock
solution was prepared with Pb(NO3)2 (Merck KGaA, Darmstadt, Germany) in deionized
water and was sterilized by filtration with polycarbonate membrane filters. To test
whether Paracoccus sp. DE2007 could grow in the presence of lead. Pb stock solution
was added to LB liquid medium to reach a final concentration of 5 mM. Cultures were
incubated at 27ºC for 24 h.
Scanning electron microscopy (SEM) and energy dispersive X-ray (EDX)
microanalysis:
For SEM analysis, samples of Paracoccus sp. cultures were fixed in 2.5% glutaraldehyde
(Millonig’s buffer) (Millonig, 1961) (0.1M and pH7) for 2 h and washed four times in
the same buffer. They were then dehydrated in successively increasing gradient concen-
trations of ethanol (30, 50, 70, 90 and 100%) and dried by critical point. Finally, all sam-
ples were mounted on metal stubs and coated with gold. A Jeol JSM-6300 scanning elec-
tron microscope (Jeol Ltd., Tokyo, Japan) was used to view the images.
For energy dispersive X-ray microanalysis, cells were homogenously distributed and
filtered with polycarbonate membrane filters. These filters were dehydrated and dried
by critical point and coated with gold. An energy dispersive X-ray spectrophotometer
(EDX) Link Isis-200 (Oxford Instruments, Bucks, England) operated at 20 kV coupled
to SEM was used.
Electron microscopy techniques and energy dispersive X-ray applied to determine the sorption of lead in Paracoccus sp. DE2007
!88
Transmission electron microscopy (TEM) and energy dispersive X-ray (EDX)
microanalysis:
For TEM analysis, samples of Paracoccus sp. DE2007 cultures were fixed in 2.5% glutar-
aldehyde (Millonig’s buffer) 0.1 M, pH 7 for 2 h and washed four times in the same
buffer. Samples were post-fixed in 1% OsO4 at 4ºC for 2 h, and washed four times in the
same buffer. They were then dehydrated in a graded series (50, 70, 90, 95 and 100%) of
acetone and embedded in Spurr’s resin. Ultrathin sections (70 nm) were mounted on
carbon coated copper grids and stained with uranyl acetate and lead citrate. Samples
were viewed with a Hitachi H-7000 transmission electron microscope (Hitachi Ltd.,
Tokyo, Japan). Sections with a thickness of 200 nm were not stained with lead citrate in
order to avoid elemental substitution during the analysis. They were mounted on gold
and copper grids for energy dispersive X-ray microanalysis. The samples were analyzed
with a Jeol JEM-2011 transmission electron microscope (Jeol Ltd., Tokyo, Japan).
Results
We used SEM and TEM coupled to EDX to study the effect of lead on Paracoccus
sp. DE2007 in order to determine the capacity of this microorganism to capture
heavy metals.
Paracoccus sp. DE2007, as mentioned above, was isolated from a Microcoleus
consortium formed by this cyanobacterium and different heterotrophic bacteria encased
in a dense exopolysaccharide (EPS) envelope (Diestra et al., 2005; Sánchez et al., 2005).
In liquid medium this bacterial aggregate formed a dense mucilaginous mass, and in
solid medium it formed green filamentous colonies.
In this work Paracoccus sp. DE2007 cultures were prepared with a 5 mM lead
concentration with the aim of determining whether Paracoccus sp. DE2007 can capture
metals. Unpolluted and polluted cultures were prepared and analyzed by EDX coupled
to SEM and TEM (Fig. 4.1 and 4.2).
Individual cells and groups of 2 to 4 cells are view in SEM image (Fig. 4.1a). The
EDX analysis of the cells shows that lead is not detected in the cells (Fig. 4.1b) or in the
filter (Fig. 4.1c). The ultrathin sections show cells with a wall and membrane structure
Electron microscopy techniques and energy dispersive X-ray applied to determine the sorption of lead in Paracoccus sp. DE2007
! 89
characteristic of Gram-negative cells. In the cytoplasm some vesicles that are only very
slightly electrodense can be observed (Fig. 4.2a, indicated by arrows), similar to those
found by other authors (Osanjo et al., 2009). We assumed that these vesicles have lipid
content as they were positively stained with Sudan Black (data not shown). The results
obtained in the TEM-EDX analysis (Fig. 4.2b) evidence the absence of lead in: the cyto-
plasm, the vesicles and the resin (Figs. 4.2c, 2d and 2e).
Cells from Pb-polluted cultures exhibit morphological and ultrastructural
changes (Figs. 4.3 and 4.4). The SEM image shows cells that are more deformed and
which have a higher tendency to aggregate (Fig. 4.3a). The EDX analysis evidences the
presence of lead in the cells (Fig. 4.3b, indicated by an arrow); however, no lead was
found in the filters in which the cells are retained (Fig. 4.3c).
The TEM analysis of the same cells shows an increase in the intracytoplasmic
vesicles at the ultrastructural level (Fig. 4.4a, also indicated by arrows). The TEM-EDX
analysis (Fig. 4.4b) gives evidence that lead is not retained in either the vesicles (Fig.
4.4c) or the cytoplasm (Fig. 4.4d). The resin in which the samples were embedded was
also analyzed as a control, and as expected it gave a negative result (Fig. 4.4e).
Copper and gold were detected in the spectra of the unpolluted cells because the
gold grids are made of Cu covered with Au.
Discussion
The phylum Proteobacteria is composed of an extensive and diverse group of bacteria,
some of which, especially some Pseudomonas species, have been demonstrated to have
the ability to absorb lead (Gavrilescu, 1994; Malik, 2004). The members of the genus
Paracoccus are metabolically versatile and are widely distributed, both in land and ma-
rine environments. The isolation of some strains in polluted environments evidences
the capacity of these organisms to tolerate the presence of toxic compounds. Moreover,
their ability to grow heterotrophically on a large number of organic compounds allows
them to degrade some organic pollutants (Liu et al., 2008, López-Cortés et al., 2008,
Zhang et al., 2004).
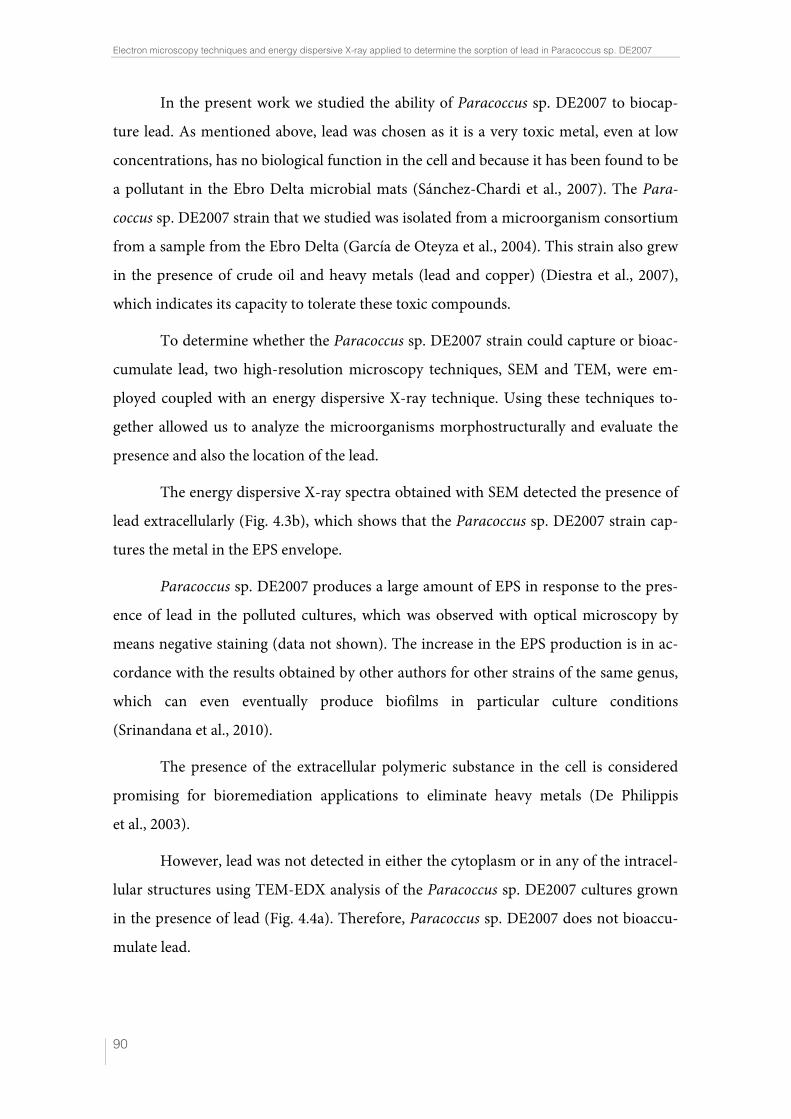
Electron microscopy techniques and energy dispersive X-ray applied to determine the sorption of lead in Paracoccus sp. DE2007
!90
In the present work we studied the ability of Paracoccus sp. DE2007 to biocap-
ture lead. As mentioned above, lead was chosen as it is a very toxic metal, even at low
concentrations, has no biological function in the cell and because it has been found to be
a pollutant in the Ebro Delta microbial mats (Sánchez-Chardi et al., 2007). The Para-
coccus sp. DE2007 strain that we studied was isolated from a microorganism consortium
from a sample from the Ebro Delta (García de Oteyza et al., 2004). This strain also grew
in the presence of crude oil and heavy metals (lead and copper) (Diestra et al., 2007),
which indicates its capacity to tolerate these toxic compounds.
To determine whether the Paracoccus sp. DE2007 strain could capture or bioac-
cumulate lead, two high-resolution microscopy techniques, SEM and TEM, were em-
ployed coupled with an energy dispersive X-ray technique. Using these techniques to-
gether allowed us to analyze the microorganisms morphostructurally and evaluate the
presence and also the location of the lead.
The energy dispersive X-ray spectra obtained with SEM detected the presence of
lead extracellularly (Fig. 4.3b), which shows that the Paracoccus sp. DE2007 strain cap-
tures the metal in the EPS envelope.
Paracoccus sp. DE2007 produces a large amount of EPS in response to the pres-
ence of lead in the polluted cultures, which was observed with optical microscopy by
means negative staining (data not shown). The increase in the EPS production is in ac-
cordance with the results obtained by other authors for other strains of the same genus,
which can even eventually produce biofilms in particular culture conditions
(Srinandana et al., 2010).
The presence of the extracellular polymeric substance in the cell is considered
promising for bioremediation applications to eliminate heavy metals (De Philippis
et al., 2003).
However, lead was not detected in either the cytoplasm or in any of the intracel-
lular structures using TEM-EDX analysis of the Paracoccus sp. DE2007 cultures grown
in the presence of lead (Fig. 4.4a). Therefore, Paracoccus sp. DE2007 does not bioaccu-
mulate lead.
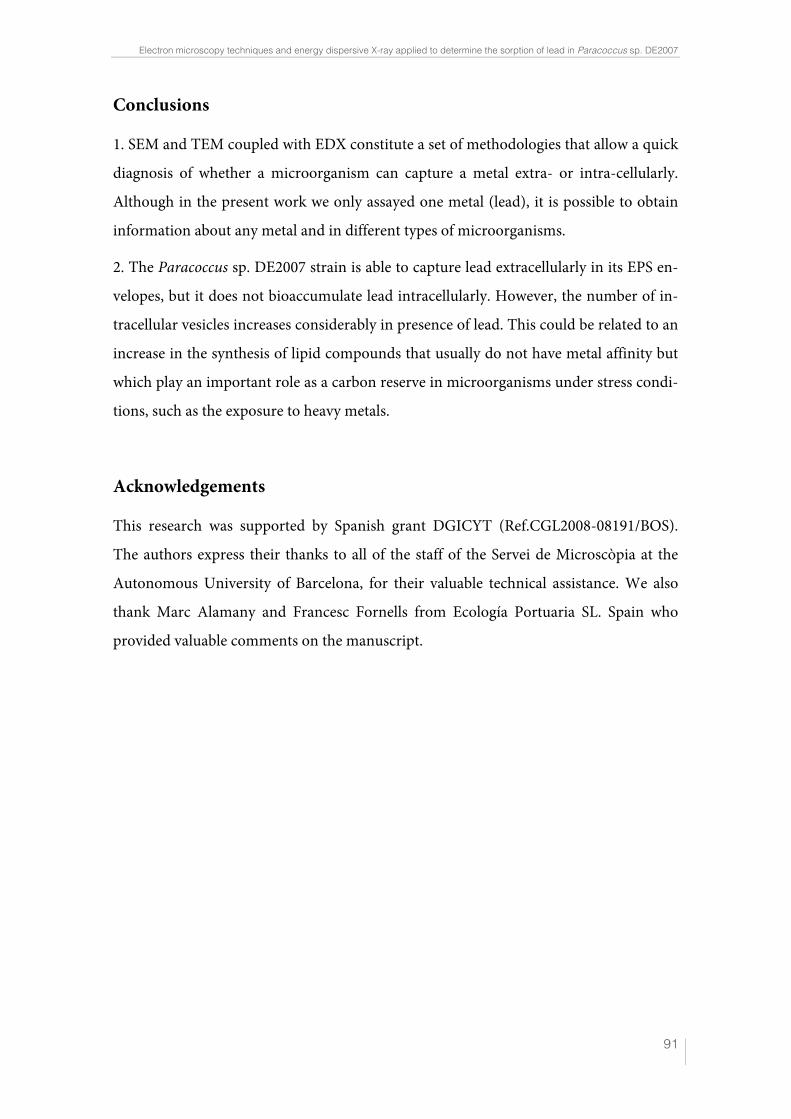
Electron microscopy techniques and energy dispersive X-ray applied to determine the sorption of lead in Paracoccus sp. DE2007
! 91
Conclusions
1. SEM and TEM coupled with EDX constitute a set of methodologies that allow a quick
diagnosis of whether a microorganism can capture a metal extra- or intra-cellularly.
Although in the present work we only assayed one metal (lead), it is possible to obtain
information about any metal and in different types of microorganisms.
2. The Paracoccus sp. DE2007 strain is able to capture lead extracellularly in its EPS en-
velopes, but it does not bioaccumulate lead intracellularly. However, the number of in-
tracellular vesicles increases considerably in presence of lead. This could be related to an
increase in the synthesis of lipid compounds that usually do not have metal affinity but
which play an important role as a carbon reserve in microorganisms under stress condi-
tions, such as the exposure to heavy metals.
Acknowledgements
This research was supported by Spanish grant DGICYT (Ref.CGL2008-08191/BOS).
The authors express their thanks to all of the staff of the Servei de Microscòpia at the
Autonomous University of Barcelona, for their valuable technical assistance. We also
thank Marc Alamany and Francesc Fornells from Ecología Portuaria SL. Spain who
provided valuable comments on the manuscript.
Electron microscopy techniques and energy dispersive X-ray applied to determine the sorption of lead in Paracoccus sp. DE2007
!92
Fig.
4.1
. Unp
ollu
ted
cultu
res
of P
arac
occu
s sp
. DE2
007
cells
are
ana
lyzed
by
SEM
-EDX
(a).
Lead
is n
ot d
etec
ted
in e
ither
the
cells
(b) o
r the
filte
r (c)
. Sca
le b
ar =
1µm
in 1
a.
Electron microscopy techniques and energy dispersive X-ray applied to determine the sorption of lead in Paracoccus sp. DE2007
! 93
Fig. 4.2. Unpolluted culture of Paracoccus sp. DE2007 cells showing vesicles in the cytoplasm (arrows) (a). Cells were analyzed by TEM-EDX (b). EDX microanalysis spectra
show the absence of lead in: the vesicles (c), the cytoplasm (d) and the Spurrʼs resin. (e). Au and Cu peaks are due to the gold grids. Scale bars = 200nm in a and b.
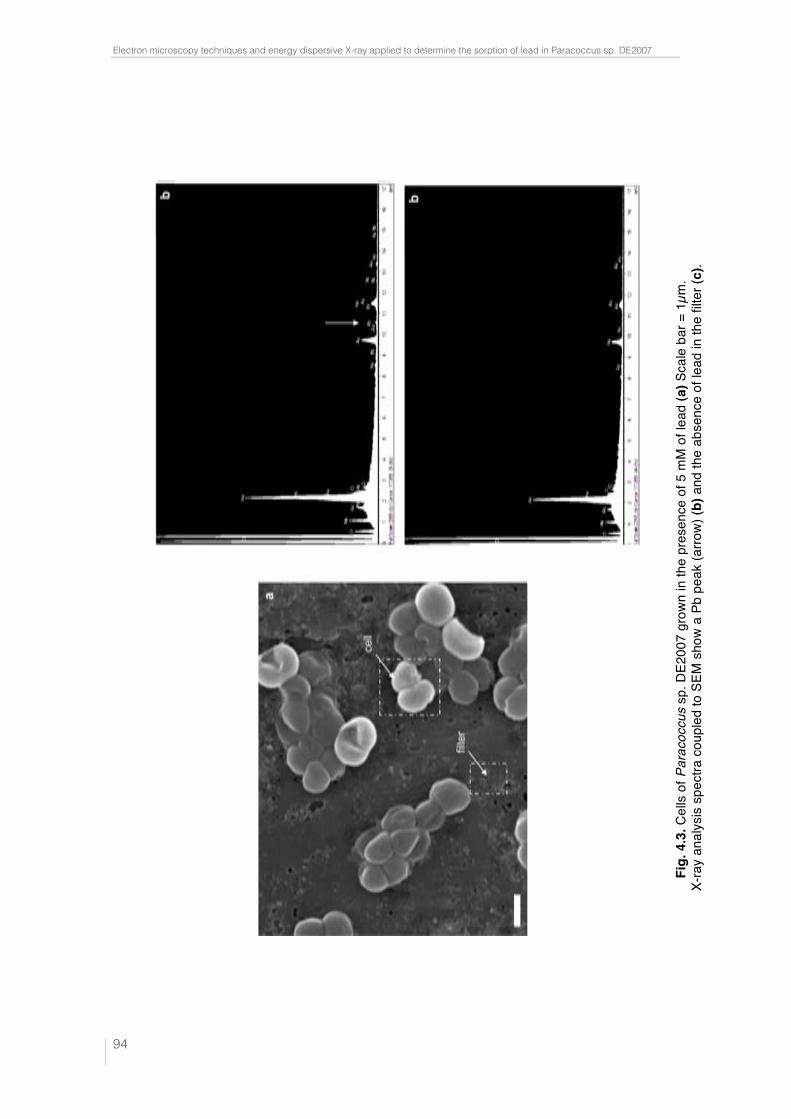
Electron microscopy techniques and energy dispersive X-ray applied to determine the sorption of lead in Paracoccus sp. DE2007
!94
Fig.
4.3
. Cel
ls o
f Par
acoc
cus
sp. D
E200
7 gr
own
in th
e pr
esen
ce o
f 5 m
M o
f lea
d (a
) Sca
le b
ar =
1µm
. X
-ray
anal
ysis
spe
ctra
cou
pled
to S
EM s
how
a Pb
pea
k (a
rrow)
(b) a
nd th
e ab
senc
e of
lead
in th
e filt
er (c
).
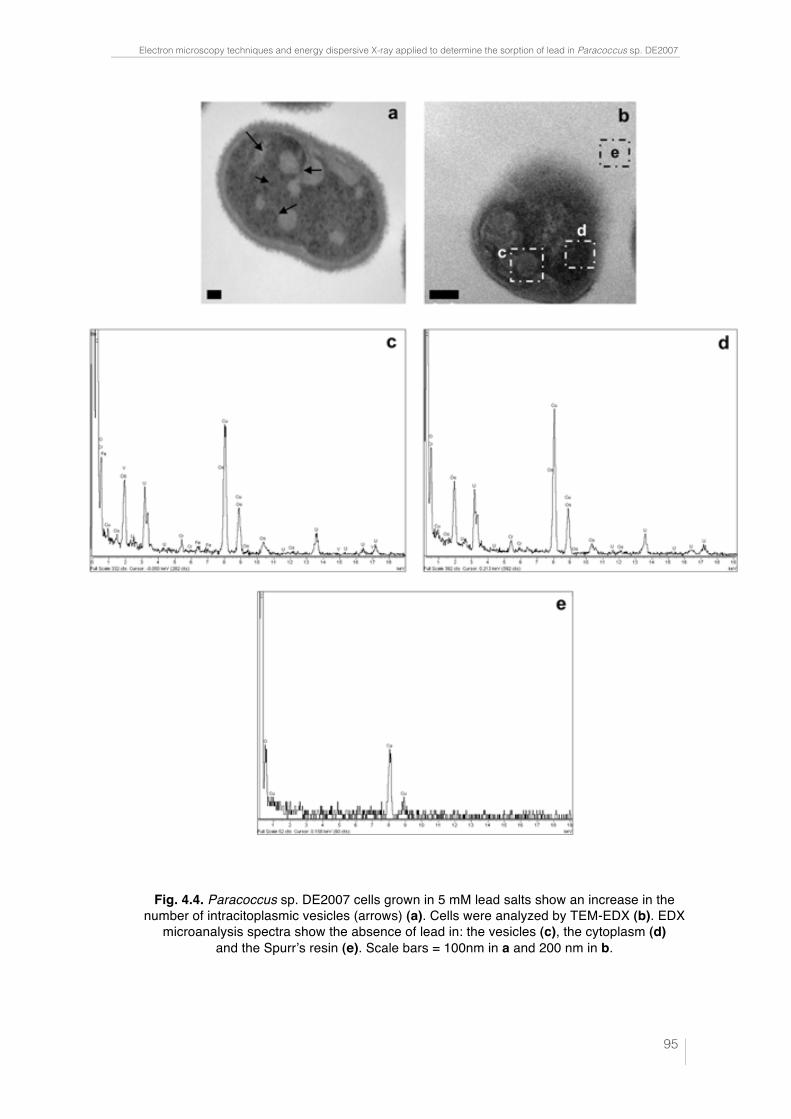
Electron microscopy techniques and energy dispersive X-ray applied to determine the sorption of lead in Paracoccus sp. DE2007
! 95
Fig. 4.4. Paracoccus sp. DE2007 cells grown in 5 mM lead salts show an increase in the
number of intracitoplasmic vesicles (arrows) (a). Cells were analyzed by TEM-EDX (b). EDX microanalysis spectra show the absence of lead in: the vesicles (c), the cytoplasm (d)
and the Spurrʼs resin (e). Scale bars = 100nm in a and 200 nm in b.
Electron microscopy techniques and energy dispersive X-ray applied to determine the sorption of lead in Paracoccus sp. DE2007
!96
References
De Philippis R., Paperi R., Sili C. and Vincenzini M. (2003) Assessment of the metal
removal capability of two capsulated cyanobacteria, Cyanospira capsulata and
Nostoc PCC7936. J. Appl. Phycol. 15, 155-161.
Decho A.W. (1994) Exopolymers in microbial mats: assessing their adaptative roles. In:
Stal L.J. and Caumette P. (Eds.), Microbial Mats. Structure, development and envi-
ronment significance. Springer-Verlag, Berlin, Heidelberg, pp. 215-219.
Diestra E., Solé A., Martí.M., García de Oteyza T., Grimalt J.O. and Esteve I. (2005)
Characterization of an oil-degrading Microcoleus consortium by means of confo-
cal scanning microscopy, scanning electron microscopy and transmission electron
microscopy. Scanning. 27, 176-180.
Diestra E., Esteve I., Burnat M., Maldonado J. and Solé A. (2007) Isolation and char-
acterization of a heterotrophic bacterium able to grow in different environmental
stress conditions, including crude oil and heavy metals. In: A. Méndez-Vilas,
(Eds.), Communicating Current Research and Educational Topics and Trends in
Applied Microbiology FORMATEX pp. 90-99.
García de Oteyza T., Grimalt J.O., Diestra E., Solé A. and Esteve I. (2004). Changes in
the composition of polar and apolar crude oil fractions under the action of Micro-
coleus consortia. Appl. Microbiol. Biotechnol. 66, 226-232.
Gavrilescu M. (2004) Removal of heavy metals from the environment by biosorption.
Eng. Life Sci. 4, 219-232.
Liu Z.P., Wang B.J., Liu X.Y., Dai X., Liu Y.H. and Liu S.J. (2008) Paracoccus hal-
ophilus sp. nov., isolated from marine sediment of the South China Sea, China,
and emended description of genus Paracoccus Davis 1969. J. Syst. Evol. Microbiol.
58, 257-261.
López-Cortés A., Lanz-Landázuri A. and García-Maldonado J.Q. (2008) Screening
and isolation of PHB-Producing bacteria in a polluted marine microbial mat. Mi-
crob. Ecol. 56, 112-120.
Electron microscopy techniques and energy dispersive X-ray applied to determine the sorption of lead in Paracoccus sp. DE2007
! 97
Maldonado J., Diestra E., Huang L., Domènech A.M., Villagrasa E., Puyen Z.M., Du-ran R., Esteve I. and Solé A. (2010a) Isolation and identification of a bacterium
with high tolerance to lead and copper from a marine microbial mat in Spain.
Ann. Microbiol. 60, 113-120.
Malik A. (2004) Metal bioremediation through growing cells. Environ. Int. 30, 261-278.
Milloning G. (1961) Advantages of phosphate buffer OsO4 solutions in fixation. J. Appl.
Phys. 32, 1637.
Nies DH. (1999) Microbial heavy-metal resistance. Appl. Microbiol. Biotechnol. 51, 730-
750.
Osanjo G.O., Muthike E.W., Tsuma L., Okoth M.W., Bulimo W.D., Lünsdorf H., Abraham W.R., Dion M., Timmis K.N., Golyshin P.N. and Mulaa F.J. (2009) A
salt lake extremophile, Paracoccus bogoriensis sp. nov., efficiently produces xan-
thophyll carotenoids. Afr. J. Microbiol. Res. 3, 426-433.
Sánchez O., Diestra E., Esteve I. and Mas J. (2005) Molecular characterization of an
oil-degrading cyanobacterial consortium. Microb. Ecol. 50, 580-588.
Sánchez-Chardi A., López-Fuster M.J. and Nadal J. (2007) Bioaccumulation of lead,
mercury, and cadmium in the greater white-toothed shrew, Crocidura russula,
from the Ebro Delta (NE Spain): sex- and age-dependent variation. Environ. Pollut.
145, 7-14.
Srinandana C.S., Jadava V., Cecilia D. and Nerurkara A.S. (2010) Nutrients determine
the spatial architecture of Paracoccus sp. biofilm. Biofouling. 26, 449-459.
Vijayaraghavan K. and Yun YS. (2008) Bacterial biosorbents and biosorption. Biotech-
nol. Adv. 26, 266-291.
Vu B., Chen M., Crawford R.J. and Ivanova E.P. (2009) Bacterial extracellular polysac-
charides involved in biofilm formation. Molecules. 14, 2535-2554.
Wang J., and Chen C. (2009) Biosorbents for heavy metals removal and their future.
Biotechnol. Adv. 27, 195-226.
Electron microscopy techniques and energy dispersive X-ray applied to determine the sorption of lead in Paracoccus sp. DE2007
!98
Zhang H., Kallimanis A, Koukkou A.I. and Drainas C. (2004) Isolation and character-
ization of novel bacteria degrading polycyclic aromatic hydrocarbons from pollut-
ed Greek soils. Appl. Microbiol. Biotechnol. 65, 124-131.
!
!
!
!!!
5. Sequestration and in vivo effect of lead on DE2009 microalga,
using high-resolution microscopic techniques
!

!
!
!!!!!!
!
!
Sequestration and in vivo effect of lead on DE2009 microalga, using high-resolution
microscopic techniques
Juan Maldonado a, Asunción de los Rios b, Isabel Esteve a, Carmen Ascaso b, Zully M. Puyen a, Cecilia Brambilla a and Antonio Solé a.
a Department of Genetics and Microbiology, Biosciences Faculty,
Universitat Autònoma de Barcelona, Edifici C - Campus de la UAB, Bellaterra 08193, Barcelona, Spain.
b Instituto de Recursos Naturales, Centro de Ciencias Medioambientales (CSIC),
Serrano 115 dpdo, 28006 Madrid, Spain.
Abstract
Algae are primary producers in a wide variety of natural ecosystems, and these microor-
ganisms have been used in bioremediation studies. Nevertheless, very little is known
about the in vivo effect of heavy metals on individual living cells. In this paper, we have
applied a method based on confocal laser scanning microscopy and lambda scan fun-
ction (CLSM-"scan) to determine the effect of lead (Pb), at different concentrations, on
the DE2009 microalga. At the same time, we have optimized a method based on CLSM
and image-analysis software (CLSM-IA) to determine in vivo biomass of this microor-
ganism. The results obtained by lambda scan function indicated that the pigment peak
decreases while the concentration of metal increases at pH 7. On the other hand at pH 4
there is no good correlation between the concentration of metal and the intensity of the
emission of fluorescence of the pigment. Also, in some cases a displacement of the chl a
peak towards 680 nm is produced. Total and individual biomass determined by CLSM-
IA shows statistically significant differences between unpolluted and 10 mM polluted
cultures. Complementary studies using electron microscopy techniques coupled to energy
dispersive X-ray microanalysis (EDX) demonstrate that the microalga can sequestrate
Pb extra- and intracellularly.

!
!
Sequestration and in vivo effect of lead on DE2009 microalga, using high-resolution microscopic techniques
!103
Introduction
Microalgae and cyanobacteria are the most important primary producers in stratified
laminated ecosystems, such as microbial mats, which cover large extensions of marine
coastal environments (Esteve et al., 1994, Fourçans et al., 2004, Guerrero et al., 1993;
Nakagawa and Fukui, 2002; Wieland et al., 2003;). In the last few years, we have isolated
a consortium of microorganisms, from Ebro Delta microbial mats, dominated by a sin-
gle cyanobacterium, Microcoleus sp., and different heterotrophic bacteria (Diestra et al.,
2005; Sánchez et al., 2005). Recently we have isolated a new phototrophic microorgan-
ism, a microalga (DE2009) from the same habitat. Given that Microcoleus sp. was able to
tolerate lead and copper (Burnat et al., 2009) in this study we propose an analysis of
whether DE2009 microalga is able to sequestrate heavy metals.
Phototrophic microorganisms have been frequently used in biosorption research
(De Philippis et al., 2003; Gong et al., 2005; Heng et al., 2004; Solisio et al., 2006). Metals
are one group of contaminants frequently involved in marine environmental pollution.
It is known that some metals at low concentrations, participate in different metabolic
routes (essentials), but at high concentrations they are toxic for many living organisms;
whilst others metals always have a toxic effect (Valls and de Lorenzo, 2002). Different
methods have been proposed to study the toxic effect of heavy metals on microalgae, but
most authors conclude that the metal concentration that affects growth in microalgae is
variable and depends of many different factors, including the ability to accumulate
heavy metals (Luoma and Rainbow, 2005; Moreno-Garrido et al., 2002). Algal surfaces
have been found that containing different chemical function groups that differ in affini-
ty and specificity towards these metals (Kaplan et al., 1987; Tien, 2002; Tien, 2005).
Although the capacity of some microalgae to capture heavy metals has been de-
scribed, little is known about the effect of these metals in individual living cells, which is
needed to predict the impact of heavy metals on natural ecosystems. In this study we
selected Pb as a toxic metal and because the microbial mats studied are located in a lead-
polluted area of the Ebro Delta (Sánchez-Chardi et al., 2007).
Confocal laser scanning microscopy (CLSM) based on natural pigment fluores-
cence emitted by phototrophic microorganisms is proving to be an excellent methodol-
ogy for different types of studies related to these microorganisms. This optical micros-
Sequestration and in vivo effect of lead on DE2009 microalga, using high-resolution microscopic techniques
!104
copy technique avoids the need for either manipulating or staining the samples and al-
lows accurate and non-destructive optical sectioning that generates high-resolution im-
ages, where out-of-focus is eliminated. Due to its high-resolution, it is easy to differenti-
ate morphotypes of phototrophic microorganisms living in mixed populations, because
they emit natural fluorescence.
The CLSM coupled to a spectrofluorometric detector ("scan function), provides
simultaneous three-dimensional information on photosynthetic microorganisms and
their fluorescence spectra profiles in stratified ecosystems, such as microbial mats and
biofilms. The most significant application is the discrimination of cells with specific
fluorescence spectra profiles within a colony, and the correlation of morphology and
individual cell states (Roldán et al., 2004).
In this paper, we have applied CLSM-"scan, to determine the in vivo effect of Pb
(at different concentrations) on DE2009 microalga and CLSM-IA to determine their
total and individual biomass.
Complementary studies using scanning electron microscopy (SEM), transmis-
sion electron microscopy (TEM) and energy dispersive X-ray microanalysis (EDX) cou-
pled to SEM and TEM were also performed to test the capacity of DE2009 microalga for
extra- and intracellular uptake of Pb.
Sequestration and in vivo effect of lead on DE2009 microalga, using high-resolution microscopic techniques
!105
Experimental
Culture conditions
Cultures of DE2009 microalga 15 µE m-2 s-1 in liquid mineral Pfennig medium at two
pHs (7 and 4) and at different concentrations (0, 0.1, 0.5, 0.75, 1, 5 and 10 mM) of lead
[Pb(NO3)2] for 9 days.
Confocal laser scanning microscopy
The confocal experiments were performed using a confocal laser scanning microscope
(Leica TCS SP5; Leica Heidelberg, Germany).
"scan function
Pigment analysis of DE2009 microalga cultures was determined by "scan function of
CLSM. This technique provides information on the state of the photosynthetic pigments
of phototrophic microorganisms on the basis of the emission wavelength region and the
fluorescence intensity emitted (autofluorescence). Each image sequence was obtained by
scanning the same xy optical section throughout the visible spectrum. Images were ac-
quired at the z position at which the fluorescence was maximal, and acquisition settings
were constant throughout the experiment. The sample excitation was carried out with
an Argon Laser at 488 nm (λ exe 488) with a λ step size of 3 nm for an emission wavelen-
gth between 510 and 752 nm.
In order to measure the mean fluorescence intensity (MFI) of the xy", CLSM da-
ta sets obtained by means of the Leica Confocal Software (Leica Microsystems CMS
GmbH) were used. The regions-of-interest (ROIs) function of the software was used to
measure the spectral signature. For each sample, 70 ROIs of 1 µm2 taken from DE2009
microalga cells were analysed.
Biomass estimations
Confocal images were obtained using the CLSM mentioned above. Two types of fluo-
rescence at cell level from the same DE2009 microalga were observed in images ob-
tained in all cultures analysed. Red (red cells) and green (green cells) were distinguished

Sequestration and in vivo effect of lead on DE2009 microalga, using high-resolution microscopic techniques
!106
on screen as pseudo-colours. For that reason, a sequential scan in two channels was car-
ried out from each same xy optical section. On the first channel, samples were excited
with a diode 561 nm (λexe 561) and the emission of fluorescence was captured between
670 and 794 nm (red pseudo-colour). On the second channel, samples were excited with
an Argon Laser at 488 nm (λexe 488) and the emission of fluorescence was captured be-
tween 550 and 575 nm (green pseudo-colour). Finally, 10 red and 10 green confocal
images were obtained from all cultures studied. Total biomass estimations from the red
and green algal cells were obtained separately. Moreover, individual biomass for both
types of cells was studied. Finally, total and individual biomass was estimated for each
metal concentration.
In this paper, we have used a modification of the method described by Solé et al.
(2007) using CLSM and a free image-processing analysis software, ImageJ v1.41.
(CLSM-IA). This method was used to determine the percentage between red and green
pixels of DE2009 microalga and their biomass from the different cultures studied in this
work.
The method used in this paper is as follows: for total biomass each pair of images
(red and green) from an identical xy optical section were opened in their original format
(8-bit, 1024 × 1024 pixels) as tiff images and the corresponding overlay image was ob-
tained. These three images were transformed to binary images (black/white) using dif-
ferent thresholds. Values of 70 and 25 were applied respectively to red and green images
from 0.1, 0.5, 0.75, 1 and 5 mM metal concentrations. Conversely, threshold values of 50
and 60 were applied respectively to red and green images from the 10 mM metal con-
centration.
In order to determine the percentage between the red and green fluorescences at
pixel level the image calculator function of the ImageJ was used. To obtain images with
cells showing up only as red fluorescence, all green fluorescence was subtracted from the
image. In the same way, red fluorescence is subtracted from the image when greens only
are obtained. In both cases to clean the images it was necessary to filter out the red and
green pixels. A smoothing filter (median filter with a radius of 2.0 pixels) was then ap-
plied to the images.To obtain biovolume values, the Voxel Counter plug-in was applied
to these filtered images (Rasband, 2010). This specific application calculates the ratio of
Sequestration and in vivo effect of lead on DE2009 microalga, using high-resolution microscopic techniques
!107
the thresholded voxels (the red or green microalga volume), to all voxels from the bina-
ry image determined. The biovolume value obtained (Volume Fraction) was finally mul-
tiplied by a conversion factor of 310 fgC µm-3 to convert it to biomass (Bloem et al.,
1995; Fry, 1990). To calculate the individual biomass, 30 red and 30 green cells were
selected using ImageJ software and then the cells were analysed following the same pro-
tocol described above.
Scanning electron microscopy
To determine whether DE2009 microalga was able to capture Pb extracellularly, cultures
polluted with 10 mM Pb were incubated under the same conditions as previous experi-
ments. The following procedure was used: cultures were fixed in 2.5% glutaraldehyde
Millonig buffer phosphate (0.1 M pH 4) for 2 h and washed four times in the same buf-
fer. They were then dehydrated in a graded series (30%, 50%, 70%, 90%, and 100%) of
ethanol and dried by critical-point. The samples were mounted on metal stubs and
coated with gold and then viewed in a Jeol JSM-6300 scanning electron microscope (Jeol
Ltd., Tokyo, Japan). For X-ray analysis, cultures were filtered on polycarbonate mem-
brane filters. These filters were then dehydrated and dried by the same procedure used
for culture samples. An EDX Link Isis-200 (Oxford Instruments, Bucks, England) ope-
rated at 20kV coupled to SEM was used.
Transmission electron microscopy
In order to assess whether DE2009 microalga was able to capture the metal intracellu-
larly, cultures polluted with 10 mM Pb were incubated under the same conditions as
previous experiments. The following procedure was used: cultures were fixed in 2.5%
glutaraldehyde Millonig buffer phosphate (0.1 M pH4) for 2 hand washed four times in
the same buffer. Samples were post-fixed in 1% OsO4 at 4ºC for 2 h, and washed four
times in the same buffer. They were then dehydrated in a graded series (30%, 50%, 70%,
90%, and 100%) of acetone and embedded in Spurr resin. To show a better quality ima-
ge, ultrathin sections of 70 nm were mounted on carbon coated copper grids and stai-
ned with uranil acetate and lead citrate. Samples were viewed in a Hitachi H-7000 elec-
Sequestration and in vivo effect of lead on DE2009 microalga, using high-resolution microscopic techniques
!108
tron microscope (Hitachi Ltd., Tokyo, Japan). To determine the capacity of polyphosp-
hate inclusions for accumulating Pb, sections of 200 nm thick mounted on titanium
grids were used for energy dispersive X-ray microanal ysis. Samples were analysed with
a Jeol Jem-2011 (Jeol Ltd., Tokyo, Japan).
Statistical analysis
Means and standard errors for each sample parameter determined in this study were
calculated using SPSS software (version 15.0 for Windows). Data obtained for !scan
experiments were compared using a Student’s t test with a 95% significance (p < 0.05).
Data obtained from percentages, and biomass was compared separately in the same way.
All the statistical analyses were performed with the same software.
Molecular characterisation
Genomic DNA was extracted from an DE2009 overnight culture in Pfennig medium
using UltraCleanTM Microbial DNA Isolation Kit (Mobio Laboratories, Carlsbad, USA)
according to manufac- turer’s instructions. The 18S rRNA gene fragment was obtained
by PCR amplification using SR1 (5! -TACCTGGTTGATCCTGCCAG-3! ) and Euk516
(5!-ACCAGACTTGCCCTCC-3!) primers (Diez et al., 2001), using PureTqTM Ready-To-
GoTM PCR (GE Healthcare). The PCR conditions were those described in Diez et al.,
2001). The PCR product was then purified using the QIAquick PCR purification Kit
(Quiagen) as directed by the supplier. Both complementary strands were sequenced
separately at the SECUGEN sequencing company (S.L. Madrid, Spain).
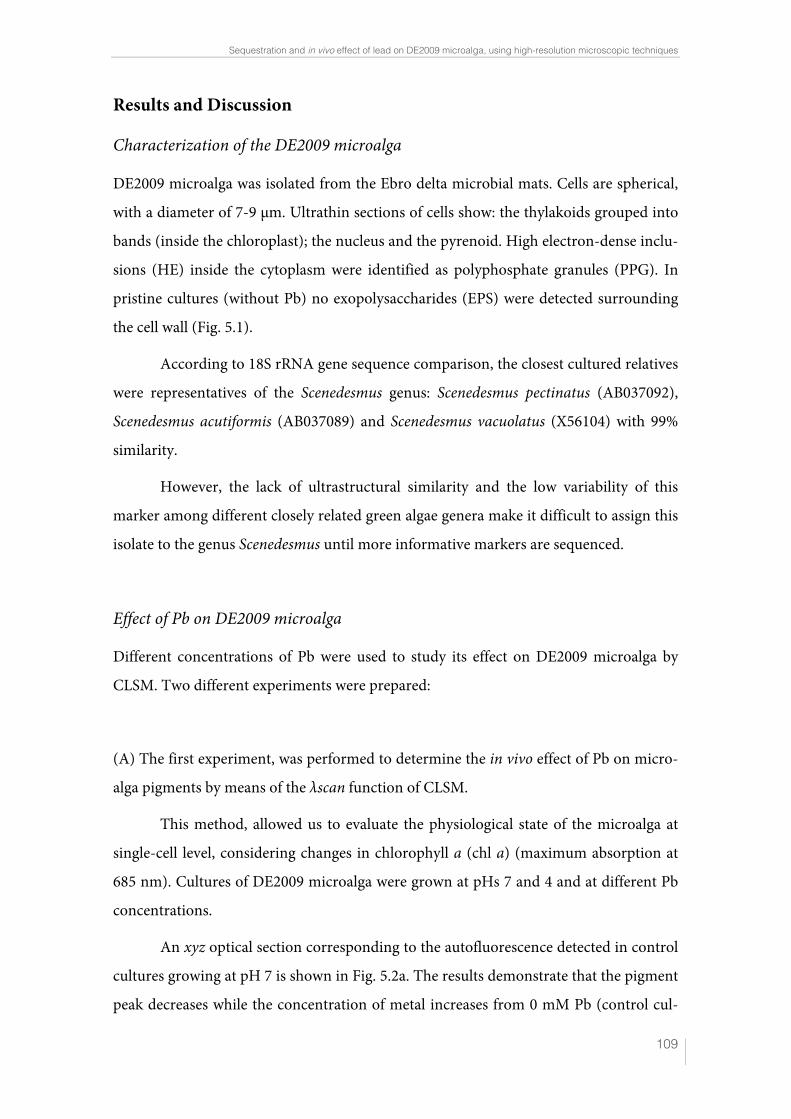
Sequestration and in vivo effect of lead on DE2009 microalga, using high-resolution microscopic techniques
!109
Results and Discussion
Characterization of the DE2009 microalga
DE2009 microalga was isolated from the Ebro delta microbial mats. Cells are spherical,
with a diameter of 7-9 μm. Ultrathin sections of cells show: the thylakoids grouped into
bands (inside the chloroplast); the nucleus and the pyrenoid. High electron-dense inclu-
sions (HE) inside the cytoplasm were identified as polyphosphate granules (PPG). In
pristine cultures (without Pb) no exopolysaccharides (EPS) were detected surrounding
the cell wall (Fig. 5.1).
According to 18S rRNA gene sequence comparison, the closest cultured relatives
were representatives of the Scenedesmus genus: Scenedesmus pectinatus (AB037092),
Scenedesmus acutiformis (AB037089) and Scenedesmus vacuolatus (X56104) with 99%
similarity.
However, the lack of ultrastructural similarity and the low variability of this
marker among different closely related green algae genera make it difficult to assign this
isolate to the genus Scenedesmus until more informative markers are sequenced.
Effect of Pb on DE2009 microalga
Different concentrations of Pb were used to study its effect on DE2009 microalga by
CLSM. Two different experiments were prepared:
(A) The first experiment, was performed to determine the in vivo effect of Pb on micro-
alga pigments by means of the "scan function of CLSM.
This method, allowed us to evaluate the physiological state of the microalga at
single-cell level, considering changes in chlorophyll a (chl a) (maximum absorption at
685 nm). Cultures of DE2009 microalga were grown at pHs 7 and 4 and at different Pb
concentrations.
An xyz optical section corresponding to the autofluorescence detected in control
cultures growing at pH 7 is shown in Fig. 5.2a. The results demonstrate that the pigment
peak decreases while the concentration of metal increases from 0 mM Pb (control cul-
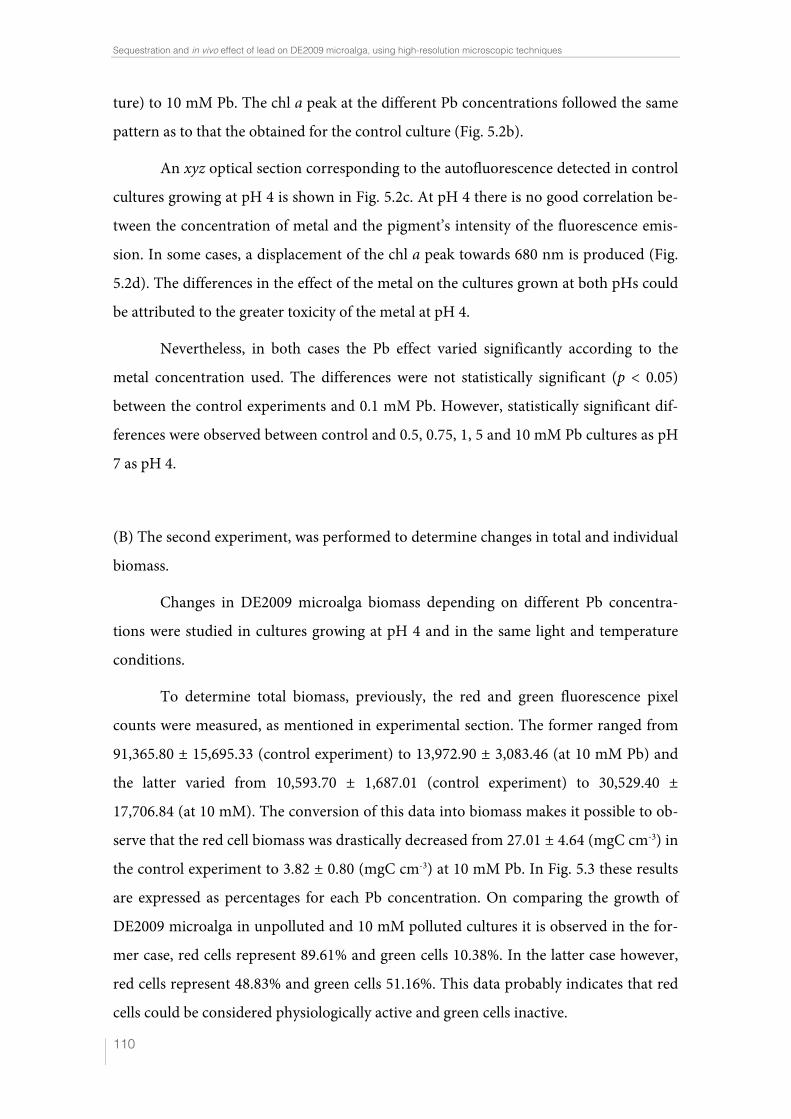
Sequestration and in vivo effect of lead on DE2009 microalga, using high-resolution microscopic techniques
!110
ture) to 10 mM Pb. The chl a peak at the different Pb concentrations followed the same
pattern as to that the obtained for the control culture (Fig. 5.2b).
An xyz optical section corresponding to the autofluorescence detected in control
cultures growing at pH 4 is shown in Fig. 5.2c. At pH 4 there is no good correlation be-
tween the concentration of metal and the pigment’s intensity of the fluorescence emis-
sion. In some cases, a displacement of the chl a peak towards 680 nm is produced (Fig.
5.2d). The differences in the effect of the metal on the cultures grown at both pHs could
be attributed to the greater toxicity of the metal at pH 4.
Nevertheless, in both cases the Pb effect varied significantly according to the
metal concentration used. The differences were not statistically significant (p < 0.05)
between the control experiments and 0.1 mM Pb. However, statistically significant dif-
ferences were observed between control and 0.5, 0.75, 1, 5 and 10 mM Pb cultures as pH
7 as pH 4.
(B) The second experiment, was performed to determine changes in total and individual
biomass.
Changes in DE2009 microalga biomass depending on different Pb concentra-
tions were studied in cultures growing at pH 4 and in the same light and temperature
conditions.
To determine total biomass, previously, the red and green fluorescence pixel
counts were measured, as mentioned in experimental section. The former ranged from
91,365.80 ± 15,695.33 (control experiment) to 13,972.90 ± 3,083.46 (at 10 mM Pb) and
the latter varied from 10,593.70 ± 1,687.01 (control experiment) to 30,529.40 ±
17,706.84 (at 10 mM). The conversion of this data into biomass makes it possible to ob-
serve that the red cell biomass was drastically decreased from 27.01 ± 4.64 (mgC cm-3) in
the control experiment to 3.82 ± 0.80 (mgC cm-3) at 10 mM Pb. In Fig. 5.3 these results
are expressed as percentages for each Pb concentration. On comparing the growth of
DE2009 microalga in unpolluted and 10 mM polluted cultures it is observed in the for-
mer case, red cells represent 89.61% and green cells 10.38%. In the latter case however,
red cells represent 48.83% and green cells 51.16%. This data probably indicates that red
cells could be considered physiologically active and green cells inactive.
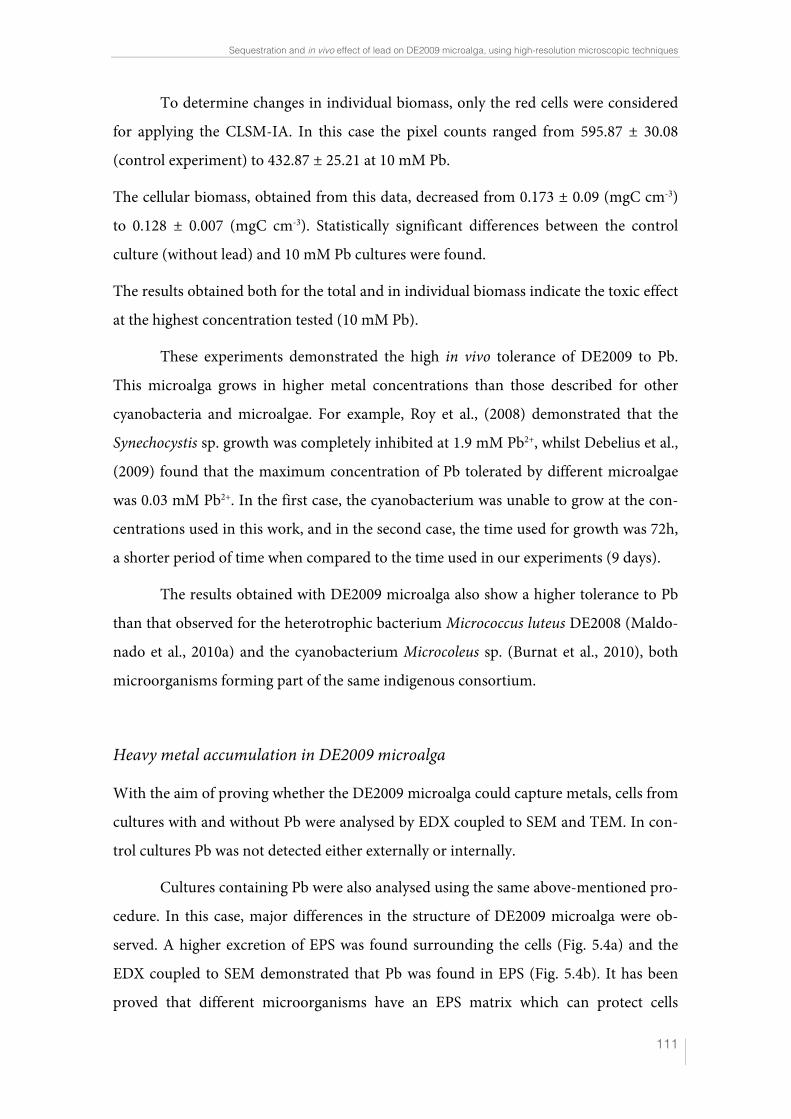
Sequestration and in vivo effect of lead on DE2009 microalga, using high-resolution microscopic techniques
!111
To determine changes in individual biomass, only the red cells were considered
for applying the CLSM-IA. In this case the pixel counts ranged from 595.87 ± 30.08
(control experiment) to 432.87 ± 25.21 at 10 mM Pb.
The cellular biomass, obtained from this data, decreased from 0.173 ± 0.09 (mgC cm-3)
to 0.128 ± 0.007 (mgC cm-3). Statistically significant differences between the control
culture (without lead) and 10 mM Pb cultures were found.
The results obtained both for the total and in individual biomass indicate the toxic effect
at the highest concentration tested (10 mM Pb).
These experiments demonstrated the high in vivo tolerance of DE2009 to Pb.
This microalga grows in higher metal concentrations than those described for other
cyanobacteria and microalgae. For example, Roy et al., (2008) demonstrated that the
Synechocystis sp. growth was completely inhibited at 1.9 mM Pb2+, whilst Debelius et al.,
(2009) found that the maximum concentration of Pb tolerated by different microalgae
was 0.03 mM Pb2+. In the first case, the cyanobacterium was unable to grow at the con-
centrations used in this work, and in the second case, the time used for growth was 72h,
a shorter period of time when compared to the time used in our experiments (9 days).
The results obtained with DE2009 microalga also show a higher tolerance to Pb
than that observed for the heterotrophic bacterium Micrococcus luteus DE2008 (Maldo-
nado et al., 2010a) and the cyanobacterium Microcoleus sp. (Burnat et al., 2010), both
microorganisms forming part of the same indigenous consortium.
Heavy metal accumulation in DE2009 microalga
With the aim of proving whether the DE2009 microalga could capture metals, cells from
cultures with and without Pb were analysed by EDX coupled to SEM and TEM. In con-
trol cultures Pb was not detected either externally or internally.
Cultures containing Pb were also analysed using the same above-mentioned pro-
cedure. In this case, major differences in the structure of DE2009 microalga were ob-
served. A higher excretion of EPS was found surrounding the cells (Fig. 5.4a) and the
EDX coupled to SEM demonstrated that Pb was found in EPS (Fig. 5.4b). It has been
proved that different microorganisms have an EPS matrix which can protect cells
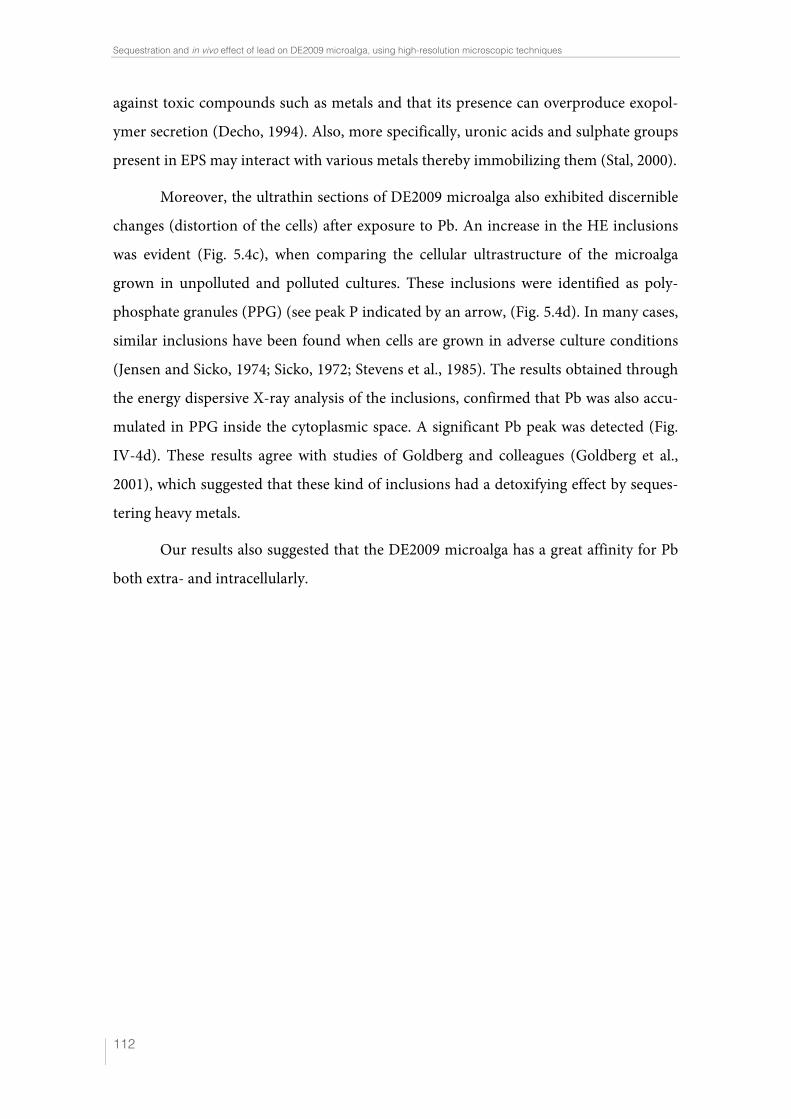
Sequestration and in vivo effect of lead on DE2009 microalga, using high-resolution microscopic techniques
!112
against toxic compounds such as metals and that its presence can overproduce exopol-
ymer secretion (Decho, 1994). Also, more specifically, uronic acids and sulphate groups
present in EPS may interact with various metals thereby immobilizing them (Stal, 2000).
Moreover, the ultrathin sections of DE2009 microalga also exhibited discernible
changes (distortion of the cells) after exposure to Pb. An increase in the HE inclusions
was evident (Fig. 5.4c), when comparing the cellular ultrastructure of the microalga
grown in unpolluted and polluted cultures. These inclusions were identified as poly-
phosphate granules (PPG) (see peak P indicated by an arrow, (Fig. 5.4d). In many cases,
similar inclusions have been found when cells are grown in adverse culture conditions
(Jensen and Sicko, 1974; Sicko, 1972; Stevens et al., 1985). The results obtained through
the energy dispersive X-ray analysis of the inclusions, confirmed that Pb was also accu-
mulated in PPG inside the cytoplasmic space. A significant Pb peak was detected (Fig.
IV-4d). These results agree with studies of Goldberg and colleagues (Goldberg et al.,
2001), which suggested that these kind of inclusions had a detoxifying effect by seques-
tering heavy metals.
Our results also suggested that the DE2009 microalga has a great affinity for Pb
both extra- and intracellularly.
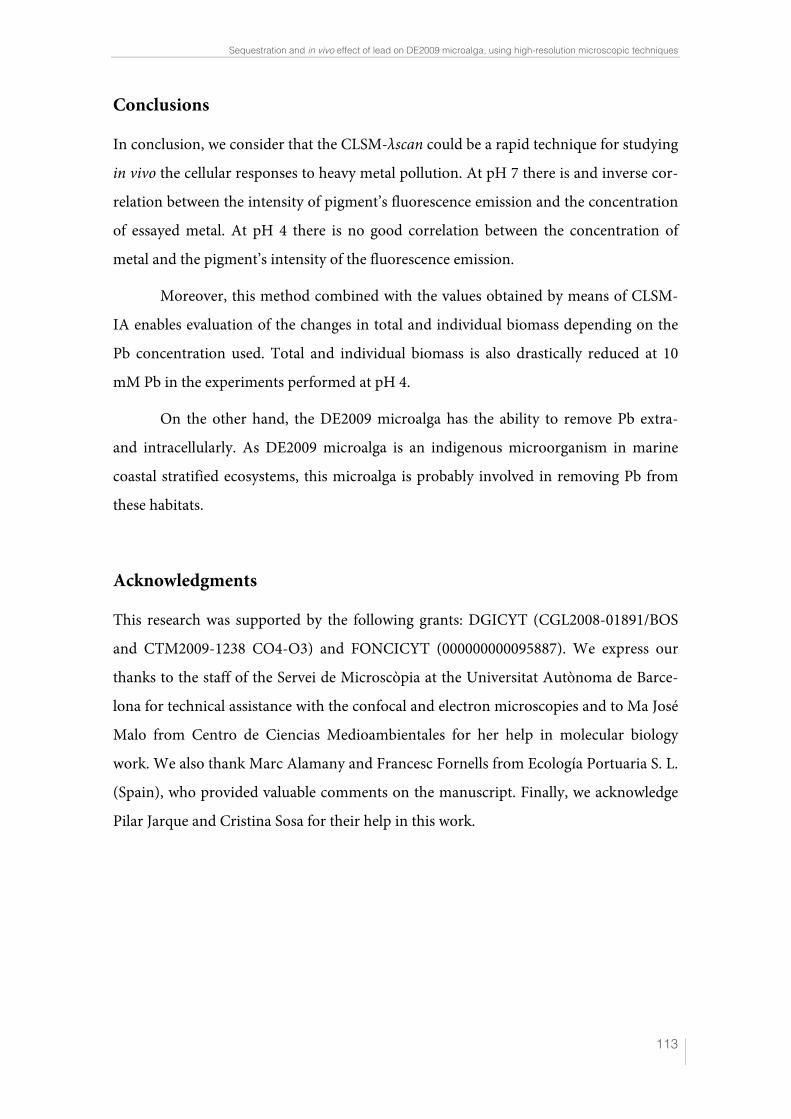
Sequestration and in vivo effect of lead on DE2009 microalga, using high-resolution microscopic techniques
!113
Conclusions
In conclusion, we consider that the CLSM-"scan could be a rapid technique for studying
in vivo the cellular responses to heavy metal pollution. At pH 7 there is and inverse cor-
relation between the intensity of pigment’s fluorescence emission and the concentration
of essayed metal. At pH 4 there is no good correlation between the concentration of
metal and the pigment’s intensity of the fluorescence emission.
Moreover, this method combined with the values obtained by means of CLSM-
IA enables evaluation of the changes in total and individual biomass depending on the
Pb concentration used. Total and individual biomass is also drastically reduced at 10
mM Pb in the experiments performed at pH 4.
On the other hand, the DE2009 microalga has the ability to remove Pb extra-
and intracellularly. As DE2009 microalga is an indigenous microorganism in marine
coastal stratified ecosystems, this microalga is probably involved in removing Pb from
these habitats.
Acknowledgments
This research was supported by the following grants: DGICYT (CGL2008-01891/BOS
and CTM2009-1238 CO4-O3) and FONCICYT (000000000095887). We express our
thanks to the staff of the Servei de Microscòpia at the Universitat Autònoma de Barce-
lona for technical assistance with the confocal and electron microscopies and to Ma José
Malo from Centro de Ciencias Medioambientales for her help in molecular biology
work. We also thank Marc Alamany and Francesc Fornells from Ecología Portuaria S. L.
(Spain), who provided valuable comments on the manuscript. Finally, we acknowledge
Pilar Jarque and Cristina Sosa for their help in this work.
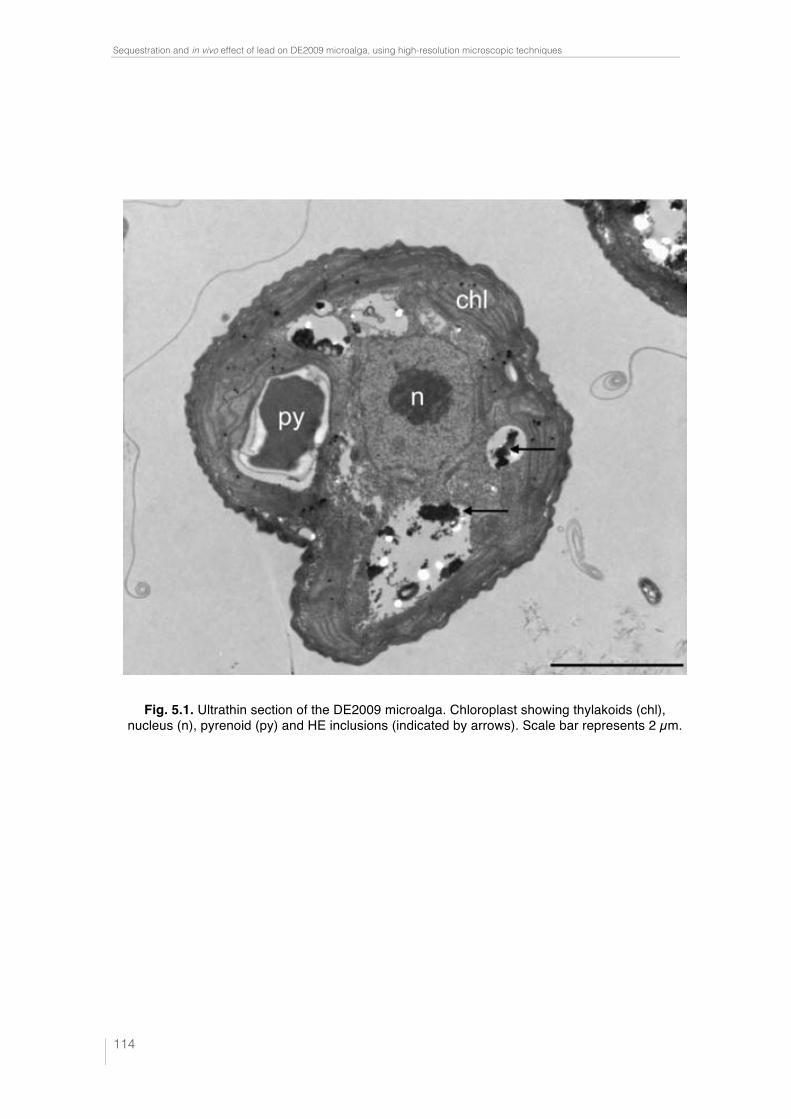
Sequestration and in vivo effect of lead on DE2009 microalga, using high-resolution microscopic techniques
!114
Fig. 5.1. Ultrathin section of the DE2009 microalga. Chloroplast showing thylakoids (chl), nucleus (n), pyrenoid (py) and HE inclusions (indicated by arrows). Scale bar represents 2 µm.
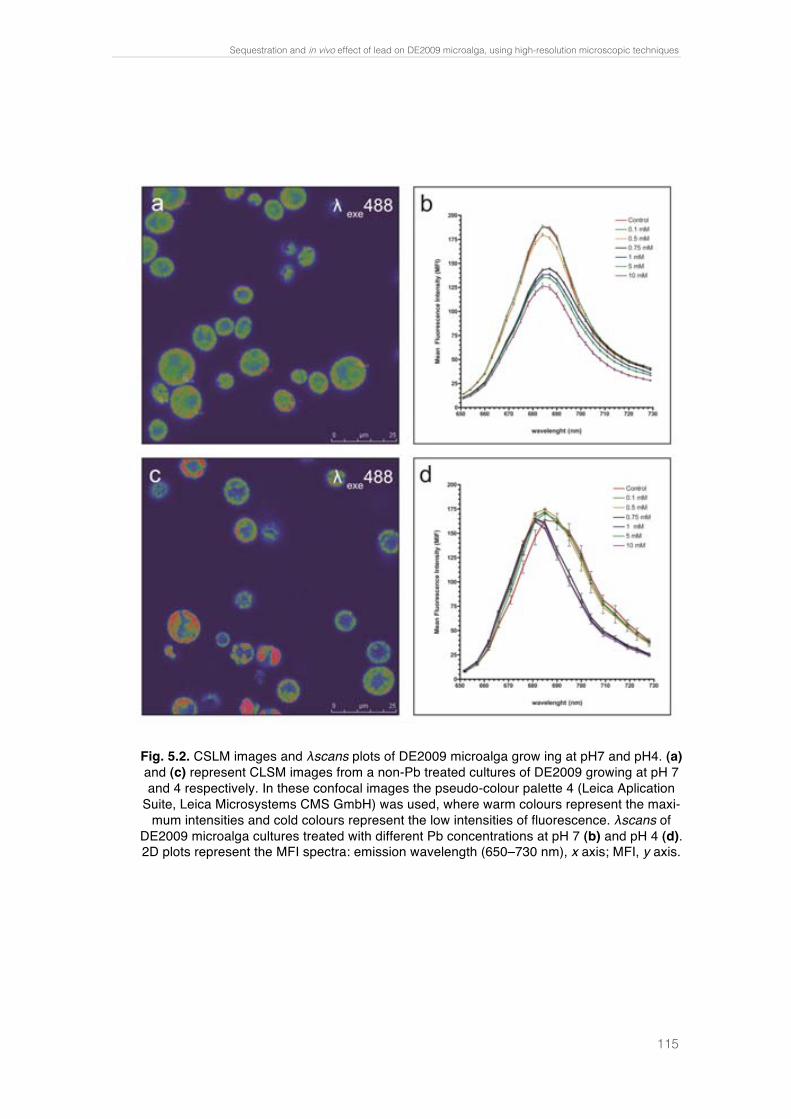
Sequestration and in vivo effect of lead on DE2009 microalga, using high-resolution microscopic techniques
!115
Fig. 5.2. CSLM images and λscans plots of DE2009 microalga grow ing at pH7 and pH4. (a) and (c) represent CLSM images from a non-Pb treated cultures of DE2009 growing at pH 7 and 4 respectively. In these confocal images the pseudo-colour palette 4 (Leica Aplication
Suite, Leica Microsystems CMS GmbH) was used, where warm colours represent the maxi-mum intensities and cold colours represent the low intensities of fluorescence. λscans of
DE2009 microalga cultures treated with different Pb concentrations at pH 7 (b) and pH 4 (d). 2D plots represent the MFI spectra: emission wavelength (650–730 nm), x axis; MFI, y axis.

Sequestration and in vivo effect of lead on DE2009 microalga, using high-resolution microscopic techniques
!116
Fig.
5.3
. Rel
ative
abu
ndan
ce o
f red
and
gre
en D
E200
9 m
icroa
lga
cells
at d
iffer
ent P
b co
ncen
tratio
ns (e
xpre
ssed
as
a pe
rcen
tage
of b
iom
ass)
.
Sequestration and in vivo effect of lead on DE2009 microalga, using high-resolution microscopic techniques
!117
Fig.
5.4
. DE2
009
micr
oalg
a cu
lture
trea
ted
with
10
mM
Pb.
SEM
imag
e. S
cale
bar
repr
esen
ts 1
0 µm
(a).
EDX
spec
trum
cou
pled
to S
EM. A
rrow
indi
cate
s th
e m
ain
Pb p
eak
at 1
0.5
keV
(b).
Ultra
thin
sec
tion
of D
E200
9 m
icro-
alga
. Arro
ws in
dica
te th
e di
strib
utio
n of
HE
inclu
sion
s. S
cale
bar
repr
esen
ts 0
.2 µ
m (c
). ED
X sp
ectru
m c
oupl
ed to
TE
M fr
om H
E in
clusi
ons.
Arro
w in
dica
tes
the
mai
n Pb
pea
k at
10.
5 ke
V (d
).
Sequestration and in vivo effect of lead on DE2009 microalga, using high-resolution microscopic techniques
!118
References
Bloem J., Veninga M. and Shepherd J. (1995) Fully automatic determination of soil
bacterium numbers, cell volumes, and frequencies of dividing cells by confocal la-
ser scanning microscopy and image analysis. Appl. Environ. Microbiol. 61 926-
936.
Burnat M., Diestra E., Esteve I. and Solé A. (2009) In situ determination of the effects
of lead and copper on cyanobacterial populations in microcosms. PLoS One. 4,
e6204.
Burnat M., Diestra E., Esteve I. and Solé A. (2010) Confocal laser scanning microscopy
coupled to a spectrofluorometric detector as a rapid tool for determining the in vi-
vo effect of metals on phototrophic bacteria. Bull. Environ. Contam. Toxicol. 84,
55-60.
De Philippis R., Paperi R., Sili C. and Vincenzini M. (2003) Assessment of the metal
removal capability of two capsulated cyanobacteria, Cyanobacteria capsulata and
Nostoc PCC7936. J. Appl. Phycol. 15, 155-161.
Debelius B., Forja J.M., DelValls A. and Lubian L.M. (2009) Toxicity and bioaccumu-
lation of copper and lead in five marine microalgae. Ecotoxicol. Environ. Saf. 72,
1503-1513.
Decho A.W. (1994) Exopolymers in microbial mats: assessing their adaptative roles. In:
Stal L.J. and Caumette P. (Eds.), Microbial Mats. Structure, development and envi-
ronment significance. Springer-Verlag, Berlin, Heidelberg, pp. 215-219.
Diestra E., Solé A., Martí M., García de Oteyza T., Grimalt J.O. and Esteve I. (2005)
Characterization of an oil-degrading Microcoleus consortium by means of confo-
cal scanning microscopy, scanning electron microscopy and transmission electron
microscopy. Scanning. 27, 176-180.
Diez B., Pedros-Alió C., Marsh T.L. and Massana R. (2001) Application of denaturing
gradient gel electrophoresis (DGGE) to study the diversity of marine picoeukary-
otic assemblages and comparison of DGGE with other molecular techniques.
Appl. Environ. Microbiol. 67, 2942-2951.
Sequestration and in vivo effect of lead on DE2009 microalga, using high-resolution microscopic techniques
!119
Esteve I., Ceballos D., Martínez-Alonso M., Gaju N. and Guerrero R. (1994) Devel-
opment of versicolored microbial mats: succession of microbial communites. Mi-
crobial mats: structure, development and environmental significance, In: Stal L.J.
and Caumette P. (Eds.), NATO ASI Series G: Ecological Sciences, Springer-Verlag,
Berlin, Heidelberg, pp. 4165-4420.
Fourçans A., García de Oteyza T., Wieland A., Solé A., Diestra E., van Bleijswijk J., Grimalt J.O., Kuhl M., Esteve I., Muyzer G., Caumette P. and Duran R. (2004)
Characterization of functional bacterial groups in a hypersaline microbial mat
community (Salins-de-Giraud, Camargue, France). FEMS Microbiol. Ecol. 51, 55-
70.
Fry J.C. (1990) Direct methods and biomass estimation. Meth. Microbiol. 22, 441-485.
Goldberg J., González H., Jensen T.E. and Corpe W.A. (2001) Quantitative analysis of
the elemental composition and the mass of bacterial polyphosphate bodies using
STEM EDX. Microbios. 106, 177-188.
Gong R., Ding Y., Liu H., Chen Q. and Liu Z. (2005) Lead biosorption and desorption
by intact and pretreated Spirulina maxima biomass. Chemosphere. 58, 125-130.
Guerrero R., Urmeneta J. and Rampone G. (1993) Distribution of types of microbial
mats at the Ebro Delta, Spain. BioSystems. 31, 135-144.
Heng L.Y., Jusoh K., Ling C.H. and Idris M. (2004) Toxicity of single and combina-
tions of lead and cadmium to the cyanobacteria Anabaena flos-aquae. Bull. Envi-
ron. Contam. Toxicol. 72, 373-379.
Jensen T.E. and Sicko L.M. (1974) Phosphate metabolism in blue-green algae. I. Fine
structure of the "polyphosphate overplus" phenomenon in Plectonema boryanum.
Can. J. Microbiol. 20, 1235-1239.
Kaplan D., Christiansen D. and Arad S.M. (1987) Chelating properties of extracellular
polysaccharides from Chlorella spp.. Appl. Environ. Microbiol. 53, 2953-2956.
Luoma S.N. and Rainbow P.S. (2005) Why is metal bioaccumulation so variable? Bio-
dynamics as a unifying concept. Environ. Sci. Technol. 39, 1921-1931.
Sequestration and in vivo effect of lead on DE2009 microalga, using high-resolution microscopic techniques
!120
Maldonado J., Diestra E., Huang L., Domènech A.M., Villagrasa E., Puyen Z.M., Du-ran R., Esteve I. and Solé A. (2010a) Isolation and identification of a bacterium
with high tolerance to lead and copper from a marine microbial mat in Spain.
Ann. Microbiol. 60, 113-120.
Moreno-Garrido I., Lubian L.M. and Soares A.M. (2000) Influence of cellular density
on determination of EC(50) in microalgal growth inhibition tests. Ecotoxicol. En-
viron. Saf. 47, 112-116.
Nakagawa T. and Fukui M. (2002) Phylogenetic characterization of microbial mats and
streamers from a Japanese alkaline hot spring with a thermal gradient. J. Gen.
Appl. Microbiol. 48, 211-222.
Rasband W.S. (1997-2010) ImageJ. US National Institutes of Health, Bethesda, MD,
USA. http://rsb.info.nih.gov/ij
Roldán M., Thomas F., Castel S., Quesada A. and Hernández-Mariné M. (2004) Non-
invasive pigment identification in single cells from living phototrophic biofilms by
confocal imaging spectrofluorometry. Appl. Environ. Microbiol. 70, 3745-3750.
Roy S., Ghosh A.N. and Thakur A.R. (2008) Uptake of Pb(2+) by a cyanobacterium
belonging to the genus Synechocystis, isolated from East Kolkata Wetlands. Bio-
metals. 21, 515-524.
Sánchez O., Diestra E., Esteve I. and Mas J. (2005) Molecular characterization of an
oil-degrading cyanobacterial consortium. Microb. Ecol. 50, 580-588.
Sánchez-Chardi A., López-Fuster M.J. and Nadal J. (2007) Bioaccumulation of lead,
mercury, and cadmium in the greater white-toothed shrew, Crocidura russula,
from the Ebro Delta (NE Spain): sex- and age-dependent variation. Environ. Pollut.
145, 7-14.
Sicko L.M. (1972) Structural variation of polyphosphate bodies in blue-green algae. In:
Arceneaux J. (Eds.), Ann. Proc. Electron. Micros. Soc. Amer. Los Angeles, Califor-
nia, pp. 218-219.
Solé A., Mas J. and Esteve I. (2007) A new method based on image analysis for deter-
mining cyanobacterial biomass by CLSM in stratified benthic sediments. Ultrami-
croscopy. 107, 669-673.
Sequestration and in vivo effect of lead on DE2009 microalga, using high-resolution microscopic techniques
!121
Solisio C., Lodi A., Torre P., Converti A. and Del Borghi M. (2006) Copper removal
by dry and re-hydrated biomass of Spirulina platensis. Bioresour. Technol. 97,
1756-1760.
Stal L.J. (2000) Cyanobacterial mats and stromatolites. In: Whitton B.A., Potts M.
(Eds.), The ecology of cyanobacteria. Kluwer Academic Publishers, Dordrecht, The
Netherlands, pp. 61-120.
Stevens Jr S.E., Nierzwicki-Bauer S.A., Balkwill D.L. (1985) Effect of nitrogen starva-
tion on the morphology and ultrastructure of the cyanobacterium Mastigocladus
laminosus. J. Bacteriol. 161, 1215-1218.
Tien C.J. (2002) Biosorption of metal ions by freshwater algae with different surface
characteristics. Process. Biochem. 38, 605-613.
Tien C.J. (2005) Copper adsorption kinetics of cultured algal cells and freshwater phy-
toplankton with emphasis on cell surface characteristics. J. Appl. Phycol. 17, 379-
389.
Valls M. and de Lorenzo V. (2002) Exploiting the genetic and biochemical capacities of
bacteria for the remediation of heavy metal pollution. FEMS Microbiol. Rev. 26,
327-338.
Wieland A., Kuhl M., McGowan L., Fourcans A., Duran R., Caumette P., García de Oteyza T., Grimalt J.O., Solé A., Diestra E., Esteve I. and Herbert R.A. (2003)
Microbial mats on the Orkney Islands revisited: microenvironment and microbial
community composition. Microb. Ecol. 46, 371-390.

!
!
! !
!
!
!!!!!!!!!!!!!!!!!!!
6. Selection of bioindicators to detect lead pollution in
Ebro Delta microbial mats, using high-resolution
microscopic techniques !

!
!
!!!!!!!!!!!!!!!!!!!!!!!!!!!!!!!!!
!
!
Selection of bioindicators to detect lead pollution in Ebro Delta microbial mats, using high-resolution
microscopic techniques
Juan Maldonado, Antonio Solé, Zully M. Puyen and Isabel Esteve.
Departament de Genètica i Microbiologia. Facultat de Biociències. Universitat Autònoma de Barcelona. Spain.
Abstract
Lead (Pb) is a metal that is non-essential to any metabolic process and, moreover, highly
deleterious to life. In microbial mats – benthic stratified ecosystems – located in coastal
areas, phototrophic microorganisms (algae and oxygenic phototrophic bacteria) are the
primary producers and they are exposed to pollution by metals. In this paper we de-
scribe the search for bioindicators among phototrophic populations of Ebro delta mi-
crobial mats, using high-resolution microscopic techniques that we have optimized in
previous studies. Confocal laser scanning microscopy coupled to a spectrofluorometric
detector (CLSM-"scan) to determine in vivo sensitivity of different cyanobacteria to lead,
and scanning electron microscopy (SEM) and transmission electron microscopy (TEM),
both coupled to energy dispersive X-ray microanalysis (EDX), to determine the extra-
and intracellular sequestration of this metal in cells, were the techniques used for this
purpose.
Oscillatoria sp. PCC 7515, Chroococcus sp. PCC 9106 and Spirulina sp. PCC
6313 tested in this paper could be considered bioindicators for lead pollution, because
all of these microorganisms are indigenous, have high tolerance to high concentrations
of lead and are able to accumulate this metal externally in extracellular polymeric sub-
stances (EPS) and intracellularly in polyphosphate (PP) inclusions.
Experiments made with microcosms demonstrated that Phormidium-like and
Lyngbya-like organisms selected themselves at the highest concentrations of lead
assayed.
In the present study it is shown that all cyanobacteria studied (both in culture
and in microcosms) present PP inclusions in their cytoplasm and that these increase in
!
!
number in lead polluted cultures and microcosms. We believe that the application of
these microscopic techniques open up broad prospects for future studies of metal
ecotoxicity.
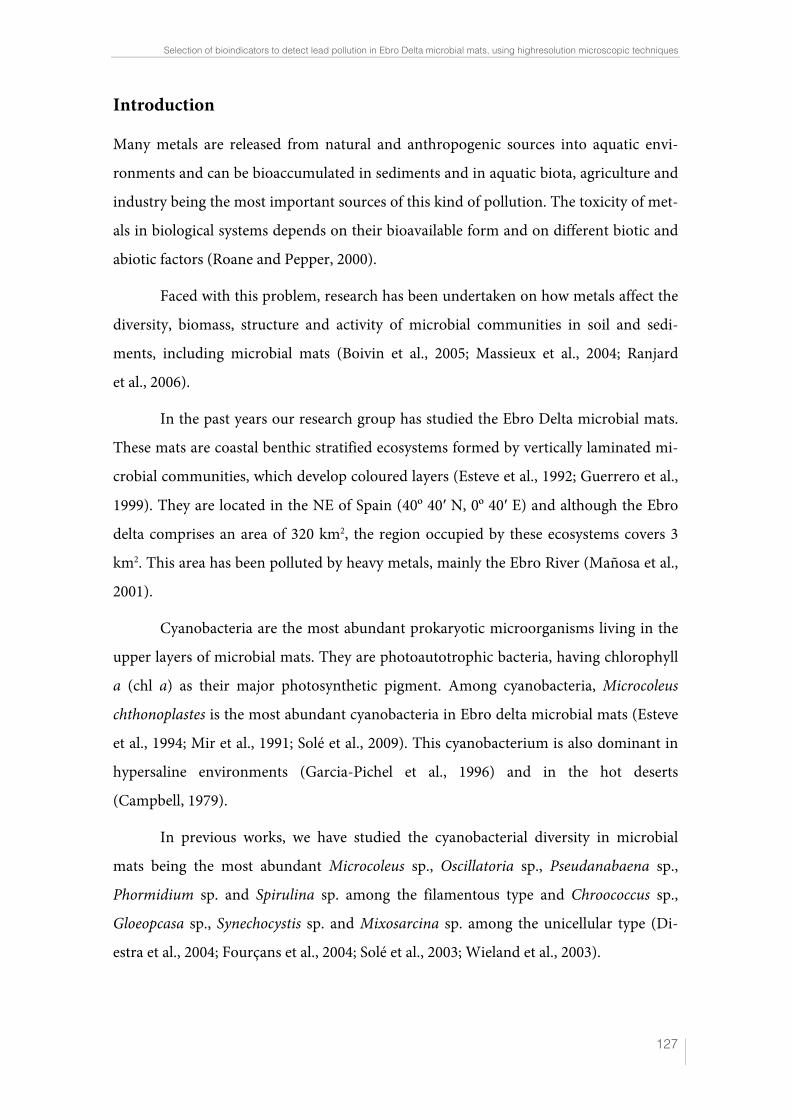
Selection of bioindicators to detect lead pollution in Ebro Delta microbial mats, using highresolution microscopic techniques
!127
Introduction
Many metals are released from natural and anthropogenic sources into aquatic envi-
ronments and can be bioaccumulated in sediments and in aquatic biota, agriculture and
industry being the most important sources of this kind of pollution. The toxicity of met-
als in biological systems depends on their bioavailable form and on different biotic and
abiotic factors (Roane and Pepper, 2000).
Faced with this problem, research has been undertaken on how metals affect the
diversity, biomass, structure and activity of microbial communities in soil and sedi-
ments, including microbial mats (Boivin et al., 2005; Massieux et al., 2004; Ranjard
et al., 2006).
In the past years our research group has studied the Ebro Delta microbial mats.
These mats are coastal benthic stratified ecosystems formed by vertically laminated mi-
crobial communities, which develop coloured layers (Esteve et al., 1992; Guerrero et al.,
1999). They are located in the NE of Spain (40º 40! N, 0º 40! E) and although the Ebro
delta comprises an area of 320 km2, the region occupied by these ecosystems covers 3
km2. This area has been polluted by heavy metals, mainly the Ebro River (Mañosa et al.,
2001).
Cyanobacteria are the most abundant prokaryotic microorganisms living in the
upper layers of microbial mats. They are photoautotrophic bacteria, having chlorophyll
a (chl a) as their major photosynthetic pigment. Among cyanobacteria, Microcoleus
chthonoplastes is the most abundant cyanobacteria in Ebro delta microbial mats (Esteve
et al., 1994; Mir et al., 1991; Solé et al., 2009). This cyanobacterium is also dominant in
hypersaline environments (Garcia-Pichel et al., 1996) and in the hot deserts
(Campbell, 1979).
In previous works, we have studied the cyanobacterial diversity in microbial
mats being the most abundant Microcoleus sp., Oscillatoria sp., Pseudanabaena sp.,
Phormidium sp. and Spirulina sp. among the filamentous type and Chroococcus sp.,
Gloeopcasa sp., Synechocystis sp. and Mixosarcina sp. among the unicellular type (Di-
estra et al., 2004; Fourçans et al., 2004; Solé et al., 2003; Wieland et al., 2003).
Selection of bioindicators to detect lead pollution in Ebro Delta microbial mats, using highresolution microscopic techniques
!128
Communities living in microbial mats are often subjected to strong environmen-
tal changes, including the presence of pollutants, among them heavy metals. Many stud-
ies have been carried out to demonstrate the capacity of microorganisms to sequestrate
heavy metals: on bacteria (Borrego and Figueras, 1997), fungi (Lo et al., 1999); algae
(Mehta and Gaur, 2001) and cyanobacteria (De Philippis et al., 2003; Incharoensakdi
and Kitjaharn, 2002).
Although some species of plants, invertebrates, fish, birds and mammals, have
been used as bioindicators of contamination and water quality (Azevedo et al., 2009;
Faria et al., 2010) and soil quality (Garitano-Zavala, 2010, Gjorgieva et al., 2011;
Sánchez-Chardi et al., 2007), nothing is known about the use of algae and cyanobacteria
as metal bioindicators in polluted microbial mats.
As was mentioned above, given the ecological importance of heavy metal pollu-
tion and considering that no bioindicators have been described for this type of pollution
in microbial mats; we propose, in this work to select bioindicators for lead.
We consider the following characteristics to select the bioindicators: ubiquity
and abundance of the selected microorganisms; ease of growth under laboratory condi-
tions; sensitivity to the chosen metal and the ability to accumulate it.
In the recent years, our working group has optimized high-resolution microsco-
py techniques (CLSM, SEM-EDX and TEM-EDX) to determine in vivo the effect of dif-
ferent heavy metals on phototrophic microorganisms (sensitivity) and to detect the abil-
ity of these microorganisms to capture metals extra- and/or intracellularly (Burnat et al.,
2009, 2010; Maldonado et al., 2010b).
For this research, we chose three cyanobacteria from the Pasteur culture collec-
tion of cyanobacteria (PCC) that are abundant in the Ebro delta microbial mats. Lead
was chosen because it is a non-essential toxic metal and in the past, lead pellets were
reported to have been found in high densities in the Ebro River sediment
(Mateo et al., 1997).
The aim of this work is therefore to assess the potential of different cyanobacte-
ria to be considered bioindicators of lead pollution in coastal microbial mats, using
high-resolution microscopy techniques.
Selection of bioindicators to detect lead pollution in Ebro Delta microbial mats, using highresolution microscopic techniques
!129
Material and Methods
Cyanobacteria strains and culture conditions
Oscillatoria sp. PCC 7515, Chroococcus sp. PCC 9106 and Spirulina sp. PCC 6313, were
chosen from the PCC (Herdman et al., 2005) because they are always present in Ebro
delta microbial mats. The first strain was cultivated in Marine medium (MN) with ni-
trate omitted (Rippka et al., 1979) and the other two strains were grown in a 1:1 (v/v)
BG11 and ASN III mixture medium (Rippka et al., 1979). All culture strains were grown
at 27ºC and 15 µE m-2 s-1.
Sampling site and microcosms setup
Microbial mat samples were collected from the Ebro Delta on October 2009. Samples
were taken in 55 x 43 x 88 mm poly(methyl methacrylate) boxes and transferred to the
laboratory. Two microcosm experiments were prepared, one microcosm was used as a
control experiment (unpolluted) and the other microcosm was polluted with 10 mM
[Pb(NO3)2] solution. The microcosms were maintained in laboratory conditions for 9
days, after which the metal solution was removed from the polluted microcosm. Sam-
ples for electron microscopy and CLSM were taken with glass cores " (6 mm).
Confocal laser scanning microscopy
Cultures of the cyanobacteria strains were polluted at different Pb concentrations: 0
(unpolluted culture), 0.1, 0.5, 0.75, 1 and 2 mM (polluted cultures). All experiments
were performed for a period of 9 days under the same culture conditions mentioned in
culture conditions.
Pigment analysis was carried out by the "scan function of CLSM (Leica TCS SP5;
Leica Heidelberg, Germany). This technique made it possible to obtain information
about the state of pigments on the basis of the emission wavelength region and the fluo-
rescence intensity emitted. Each image sequence was acquired by scanning the same xy
optical section throughout the visible spectrum. Images were acquired at the z position
at which the fluorescence was maximal, and acquisition settings were constant through-
Selection of bioindicators to detect lead pollution in Ebro Delta microbial mats, using highresolution microscopic techniques
!130
out each experiment. The sample excitation was carried out with an Argon Laser at 488
nm (λexe 488) with a λ step size between 3 and 4.74 nm for an emission wavelength be-
tween 510 and 752 nm.
In order to measure the mean fluorescence intensity (MFI) of the xy" data sets,
the Leica Confocal Software (Leica Microsystems CMS GmbH) was used. The regions-
of-interest (ROIs) function of the software was used to measure the spectral signature of
the samples. 70 ROIs of 1 μm2 taken from cells from each sample were analyzed.
Scanning electron microscopy
Scanning electron microscopy coupled to EDX (SEM-EDX) was used in order to assess
whether the selected cyanobacteria strains and cyanobacteria from the polluted micro-
cosm were able to capture Pb extracellularly. Cultures of the three strains and micro-
cosms experiments were both polluted with 10 mM Pb for a period of 9 days. This con-
centration was used to obtain a rapid response to Pb from cyanobacteria.
The following procedure was used: samples were fixed in 2.5% glutaraldehyde
Millonig buffer phosphate (0.1 M pH 4) for 2 hours and washed four times in the same
buffer. They were then dehydrated in graded series (30%, 50%, 70%, 90%, and 100%) of
ethanol and dried by critical point. The samples were mounted on metal stubs, coated
with gold and viewed in a Zeiss EVO® MA 10 scanning electron microscope (Carl Zeiss
NTS GmbH, Oberkochen, Germany). An EDX Link Isis-200 (Oxford Instruments,
Bucks, England) operated at 20kV coupled to the microscope was used.
Transmission electron microscopy
TEM was used to determine the ultrastructure of cyanobacteria and TEM coupled to
EDX (TEM-EDX) to assess whether the cyanobacteria strains and cyanobacteria from
the polluted microcosm were able to bioaccumulate the heavy metal intracellularly. Cul-
ture conditions were the same as described for scanning electron microscopy.
The following procedure was used: samples were fixed in 2.5% glutaraldehyde
Millonig buffer phosphate (0.1M pH 4) for 2 hours and washed four times in the same
buffer. Samples were post-fixed in 1% OsO4 at 4ºC for 2 h, and washed four times in the
Selection of bioindicators to detect lead pollution in Ebro Delta microbial mats, using highresolution microscopic techniques
!131
same buffer. They were then dehydrated in graded series (30%, 50%, 70%, 90%, 100%)
of acetone and embedded in Spurr resin. To show a better quality image, ultrathin sec-
tions of 70 nm were mounted on carbon-coated copper grids and stained with uranil
acetate and lead citrate. Samples were viewed in a Hitachi H-7000 electron microscope
(Hitachi Ltd., Tokyo, Japan). To analyze the samples with EDX, sections of 200 nm
thick mounted on carbon-coated titanium grids were used. These sections were not
stained with lead citrate in order to avoid elemental substitution during the analysis.
Samples were analyzed with a Jeol Jem-2011 (Jeol Ltd., Tokyo, Japan). An EDX Link
Isis-200 (Oxford Instruments, Bucks, England) operated at 20kV coupled to this micro-
scope was used.
Statistical analysis
The MFI analysis of "scan experiments, were carried out by one-way analysis of vari-
ance (ANOVA) and Tukey and Bonferroni’s comparison post hoc tests. Significant dif-
ferences were accepted at p < 0.05. The analyses were performed using SPSS software
(version 19.0 for Mac OS X).
Selection of bioindicators to detect lead pollution in Ebro Delta microbial mats, using highresolution microscopic techniques
!132
Results and discussion
The bioindicators were chosen on the basis of whether the microorganisms being stud-
ied fulfilled the aforementioned conditions: (a) ubiquity and abundance of the chosen
microorganisms; (b) ease of growth under laboratory conditions; (c) sensitivity to the
chosen metal; (d) the ability to accumulate it.
Lead-sensitivity of cyanobacteria strains determined by means of the CLSM-"scan
function
The three cyanobacteria studied in this work grew both in liquid medium and solid me-
dium. These media and the culture conditions have been mentioned above in the sec-
tion cyanobacteria strains and culture conditions. With the liquid medium cultures (un-
polluted and polluted) as a starting-point, the corresponding experiments were per-
formed using CLSM.
The CLSM-"scan experiments corresponding to each of the cyanobacteria tested
were performed to determine sensitivity to Pb and its effect in vivo. To this end, the state
of pigments was considered by means of the maximum fluorescence signal detected at:
575 nm [phycoerythrin (PE)] for Oscillatoria sp. PCC 7515 (Bryant, 1982); 680 nm
[chlorophyll a (chl a)] for Chroococcus sp. PCC 9106 and 652 nm [chlorophyll a (chl a)]
for Spirulina sp. PCC 6313.
(A) The autofluorescence detected in control cultures of Oscillatoria sp. PCC 7515 cor-
responding to an xyz optical section is shown in Fig. 6.1a. In the plot the maxi-
mum fluorescence peak is shown, which corresponds to 575 nm (Fig. 6.1b). The
results demonstrate that the fluorescence peak decreases while the Pb concentra-
tion increases from 0 mM (control experiment) to 2 mM. The 0.1 mM fluores-
cence spectrum followed the same pattern as the control culture, although at the
other concentrations (0.5, 0.75, 1 and 2 mM) there is a displacement of the fluo-
rescence peak from 575 nm towards to 570 nm. In this study a blue-shift of the
MFI from 0.5 mM has also been observed, which corresponds with the changes in
the PE pigment. An analog effect has been demonstrated by Murthy and Mohanty
(1991) in Spirulina platensis growing in the presence of mercury and at high tem-
Selection of bioindicators to detect lead pollution in Ebro Delta microbial mats, using highresolution microscopic techniques
!133
peratures (Murthy et al., 2004). Statistically significant differences were found be-
tween all the conditions tested (F = 236.980) (p < 0.05). Using the Tukey and Bon-
ferroni comparison tests, the only concentrations that were no significant between
them were those of 0.5 mM and 0.75 mM, as these concentrations have the same
effect on the MFI. The minimum metal concentration (when compared with the
control) that affected the intensity of the pigment was 0.1 mM Pb.
(B) Chroococcus sp. PCC 9106 xyz optical section corresponding to the autofluro-
rescence observed in control cultures is shown in Fig. 6.1c. The control spectrum
shows the maximum fluorescence peak at 682 nm, which decreases, while the Pb
concentration increases (from 0 to 2 mM). The 0.1 and 0.5 mM fluorescence spec-
tra follow the same pattern as control cultures, but at 0.5 mM the fluorescence in-
tensity is lower. From 0.75 mM there is a decrease in the MFI reaching the lowest
levels and no fluorescence was detected at the highest concentration tested (2
mM). Statistically significant differences were found between all the conditions
tested (F = 1709.574) (p < 0.05). The minimum metal concentration (when com-
pared with the control) that affected the intensity of the pigment was 0.5 mM Pb.
(C) As in the two experiments mentioned above, a Spirulina sp. PCC 6313 xyz optical
section corresponding to the autofluorescence in control cultures is shown in Fig.
6.1e. A maximum fluorescence peak is detected at 652 nm. Moreover, at the high-
est concentrations (1 and 2 mM) the MFI is drastically reduced (Fig. 6.1f). The 2
mM concentration was not included in this figure because no fluorescence signal
was detected. Statistically significant differences were found between all the condi-
tions tested (F = 1109.582) (p < 0.05). The minimum metal concentration (when
compared with the control) that affected the intensity of the pigment was 0.1 mM
Pb. In Fig. 6.1f, the fluorescence spectra obtained at 0.5 mM and 0.75 mM do not
correspond with the expected trend, making this particular case difficult to inter-
pret.
From these results, it can be concluded that Oscillatoria sp. PCC 7515 and Spiruli-
na sp. PCC 6313 are sensitive at the concentration of 0.1 mM, while Chroococcus sp.
Selection of bioindicators to detect lead pollution in Ebro Delta microbial mats, using highresolution microscopic techniques
!134
PCC 9106 is sensitive at that of 0.5 mM. In all three cases there is an inverse correlation
between the MFI and the concentration of the metal (Figs. 6.1b, 6.1d and 6.1f). These
results consistent with those obtained by Massieux et al. (2004), which showed that met-
als could affect the physiology and photosynthetic activity of the phototrophic
community.
Lead sequestration in cyanobacteria strains by SEM-EDX and TEM-EDX
A rapid test by SEM-EDX was performed on each one of the cyanobacteria studied to
determine the minimum concentration at which metal uptake occurs (considering the
results obtained by CLSM-"scan). Moreover, in polluted cultures analyzed we also test-
ed different parts of the filters to be sure that Pb was retained only in cells.
The result was positive in all of them for the minimum metal concentration used,
and negative for the control (Fig. 6.2).
With the purpose or ascertaining whether the three strains of cyanobacteria
could accumulate metal internally, cultures of each strain were polluted with 10 mM, to
increase the signal, and analyzed by TEM-EDX. In all cases, images by SEM-EDX were
also obtained to compare the results by both methodologies.
In the control cultures (without Pb), and using these techniques, it was found
that the metal was not detected either internally or externally in any of the three micro-
organisms.
On the other hand, the results observed after Pb pollution for each of the three
cyanobacteria are as follows.
Oscillatoria sp. PCC 7515 is seen to accumulate Pb in the EPS, which can be ob-
served in the EDX spectrum (Figs. 6.3a and 6.3b). Furthermore, the ultrathin sections of
this microorganism show abundant high electron-dense inclusions of different sizes in
its cytoplasm (Fig. 6.3c). EDX analysis of these, demonstrate that are PP inclusions (P
and Ca peaks) and that they retain lead (Pb main peak at 10.5 KeV indicated by arrow)
(Fig. 6.3d). These results are in accordance with those obtained by Jensen and Sicko
(1974).
Selection of bioindicators to detect lead pollution in Ebro Delta microbial mats, using highresolution microscopic techniques
!135
In the samples of Chroococcus sp. PCC 9106 the results obtained by SEM-EDX
and TEM-EDX are similar to those shown in Oscillatoria sp. PCC 7515 and they
demonstrate this microorganism’s ability to accumulate Pb extra- and intracelullarly
(Fig. 6.4).
Finally, Spirulina sp. PCC 6313 shows a similar ability to retain Pb in the EPS
(Figs. 6.5a and 6.5b). Ultrathin sections show expanded thylakoids, high electron-dense
PP inclusions and polyhydroxyalkanoates (PHA) granules, identified previously in an
optical microscope by Sudan Black stain (Fig. 6.5c). This cyanobacterium also accumu-
lates Pb in PP inclusions (Fig. 6.5d). Furthermore, the presence of PHA granules in
Spirulina sp. PCC 6313, probably demonstrate a nitrogen limitation in the lead-polluted
cultures, that has also been shown in Synechocystis sp. strain PCC 6803 (Schlebusch and
Forchhammer, 2010).
Taken together, the results described in this section show that the three cyano-
bacteria are able to accumulate the metal externally (in the EPS) and internally in the
intracytoplasmatic PP inclusions.
Previous studies also showed that Microcoleus sp. one of the dominant cyanobac-
teria in the Ebro Delta microbial mats accumulates lead in the PP inclusions (Burnat
et al., 2010).
Lead detection in cyanobacteria from polluted microcosms by SEM-EDX and
TEM-EDX
In order to ascertain whether cyanobacteria can be bioindicators of lead pollution in
microbial mats, a microcosm was polluted with a concentration of 10 mM and the re-
sults were compared with a control microcosm (unpolluted). In this case, since the im-
ages of natural environments do not allow us a clear view of the variety of microorgan-
ism, due to the high microbial density and the presence of EPS, which masks the results,
a CLSM analysis of the in vivo diversity was done previously. In the unpolluted micro-
cosm Oscillatoria-like was the dominant cyanobacterium while Phormidium-like and
Lyngbya-like were the most abundant in the polluted microcosm. In the latter, very
small and thin unidentified filaments were also present (Figs. 6.6a and 6b).
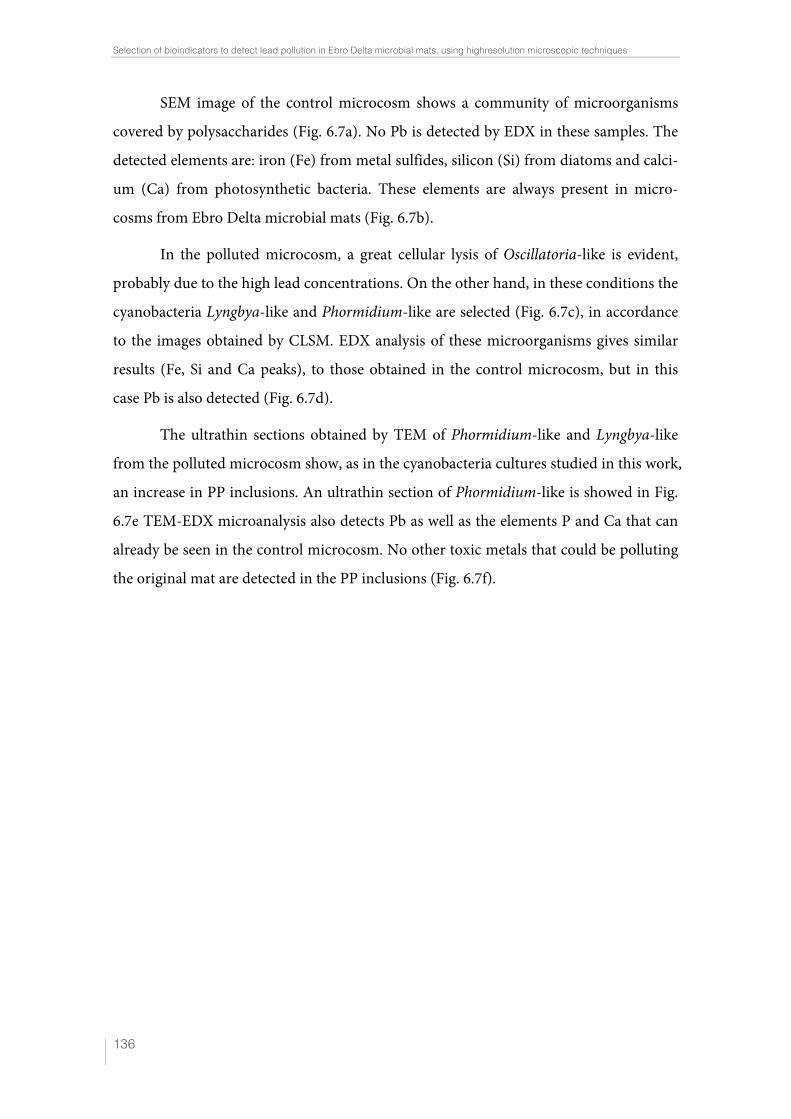
Selection of bioindicators to detect lead pollution in Ebro Delta microbial mats, using highresolution microscopic techniques
!136
SEM image of the control microcosm shows a community of microorganisms
covered by polysaccharides (Fig. 6.7a). No Pb is detected by EDX in these samples. The
detected elements are: iron (Fe) from metal sulfides, silicon (Si) from diatoms and calci-
um (Ca) from photosynthetic bacteria. These elements are always present in micro-
cosms from Ebro Delta microbial mats (Fig. 6.7b).
In the polluted microcosm, a great cellular lysis of Oscillatoria-like is evident,
probably due to the high lead concentrations. On the other hand, in these conditions the
cyanobacteria Lyngbya-like and Phormidium-like are selected (Fig. 6.7c), in accordance
to the images obtained by CLSM. EDX analysis of these microorganisms gives similar
results (Fe, Si and Ca peaks), to those obtained in the control microcosm, but in this
case Pb is also detected (Fig. 6.7d).
The ultrathin sections obtained by TEM of Phormidium-like and Lyngbya-like
from the polluted microcosm show, as in the cyanobacteria cultures studied in this work,
an increase in PP inclusions. An ultrathin section of Phormidium-like is showed in Fig.
6.7e TEM-EDX microanalysis also detects Pb as well as the elements P and Ca that can
already be seen in the control microcosm. No other toxic metals that could be polluting
the original mat are detected in the PP inclusions (Fig. 6.7f).
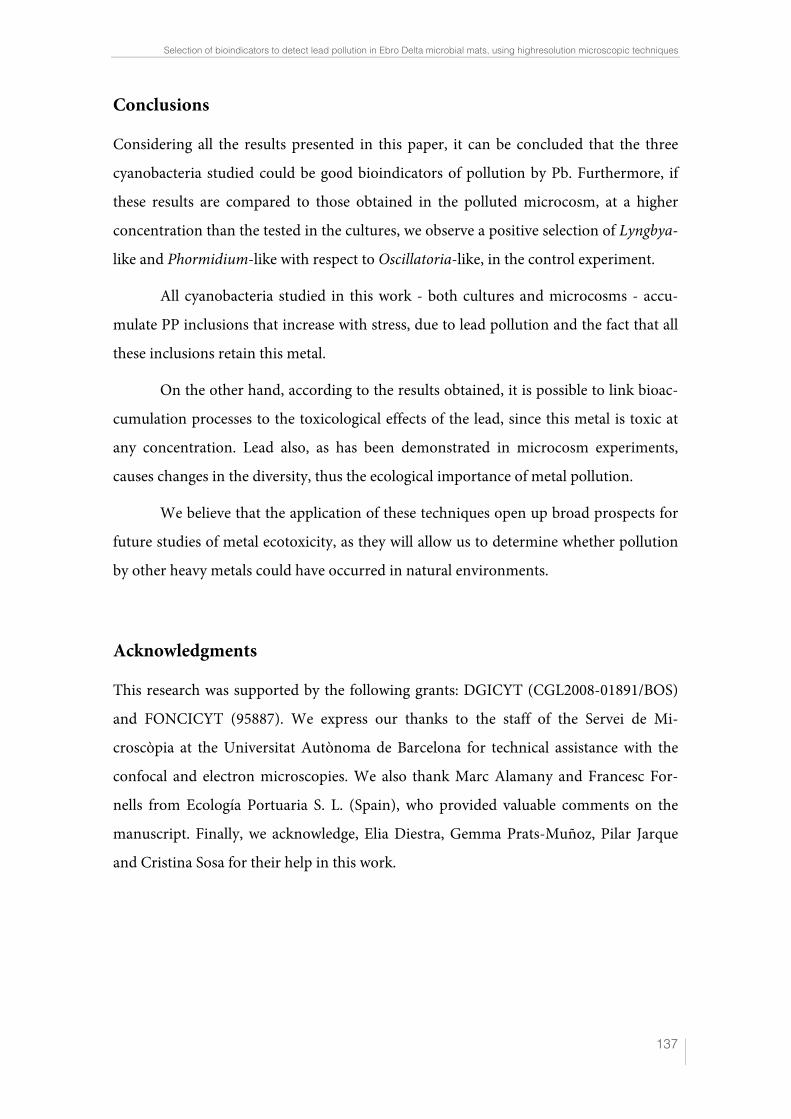
Selection of bioindicators to detect lead pollution in Ebro Delta microbial mats, using highresolution microscopic techniques
!137
Conclusions
Considering all the results presented in this paper, it can be concluded that the three
cyanobacteria studied could be good bioindicators of pollution by Pb. Furthermore, if
these results are compared to those obtained in the polluted microcosm, at a higher
concentration than the tested in the cultures, we observe a positive selection of Lyngbya-
like and Phormidium-like with respect to Oscillatoria-like, in the control experiment.
All cyanobacteria studied in this work - both cultures and microcosms - accu-
mulate PP inclusions that increase with stress, due to lead pollution and the fact that all
these inclusions retain this metal.
On the other hand, according to the results obtained, it is possible to link bioac-
cumulation processes to the toxicological effects of the lead, since this metal is toxic at
any concentration. Lead also, as has been demonstrated in microcosm experiments,
causes changes in the diversity, thus the ecological importance of metal pollution.
We believe that the application of these techniques open up broad prospects for
future studies of metal ecotoxicity, as they will allow us to determine whether pollution
by other heavy metals could have occurred in natural environments.
Acknowledgments
This research was supported by the following grants: DGICYT (CGL2008-01891/BOS)
and FONCICYT (95887). We express our thanks to the staff of the Servei de Mi-
croscòpia at the Universitat Autònoma de Barcelona for technical assistance with the
confocal and electron microscopies. We also thank Marc Alamany and Francesc For-
nells from Ecología Portuaria S. L. (Spain), who provided valuable comments on the
manuscript. Finally, we acknowledge, Elia Diestra, Gemma Prats-Muñoz, Pilar Jarque
and Cristina Sosa for their help in this work.
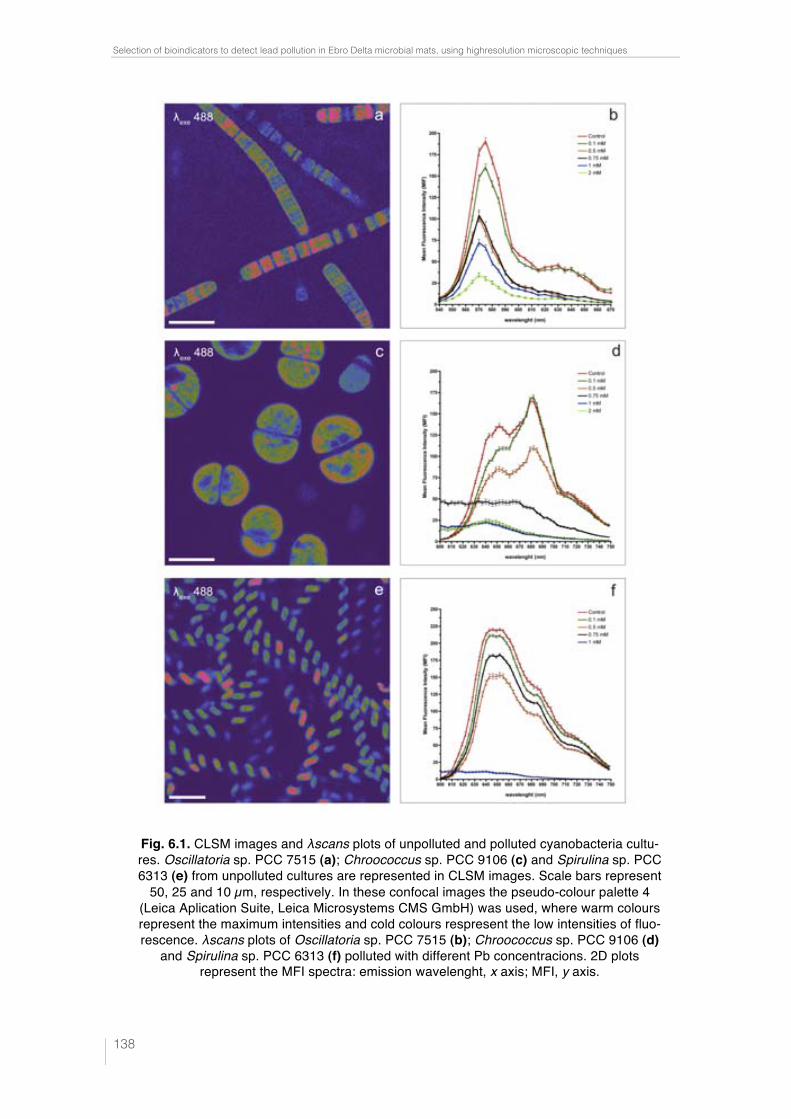
Selection of bioindicators to detect lead pollution in Ebro Delta microbial mats, using highresolution microscopic techniques
!138
Fig. 6.1. CLSM images and λscans plots of unpolluted and polluted cyanobacteria cultu-res. Oscillatoria sp. PCC 7515 (a); Chroococcus sp. PCC 9106 (c) and Spirulina sp. PCC 6313 (e) from unpolluted cultures are represented in CLSM images. Scale bars represent
50, 25 and 10 µm, respectively. In these confocal images the pseudo-colour palette 4 (Leica Aplication Suite, Leica Microsystems CMS GmbH) was used, where warm colours represent the maximum intensities and cold colours respresent the low intensities of fluo-rescence. λscans plots of Oscillatoria sp. PCC 7515 (b); Chroococcus sp. PCC 9106 (d)
and Spirulina sp. PCC 6313 (f) polluted with different Pb concentracions. 2D plots represent the MFI spectra: emission wavelenght, x axis; MFI, y axis.
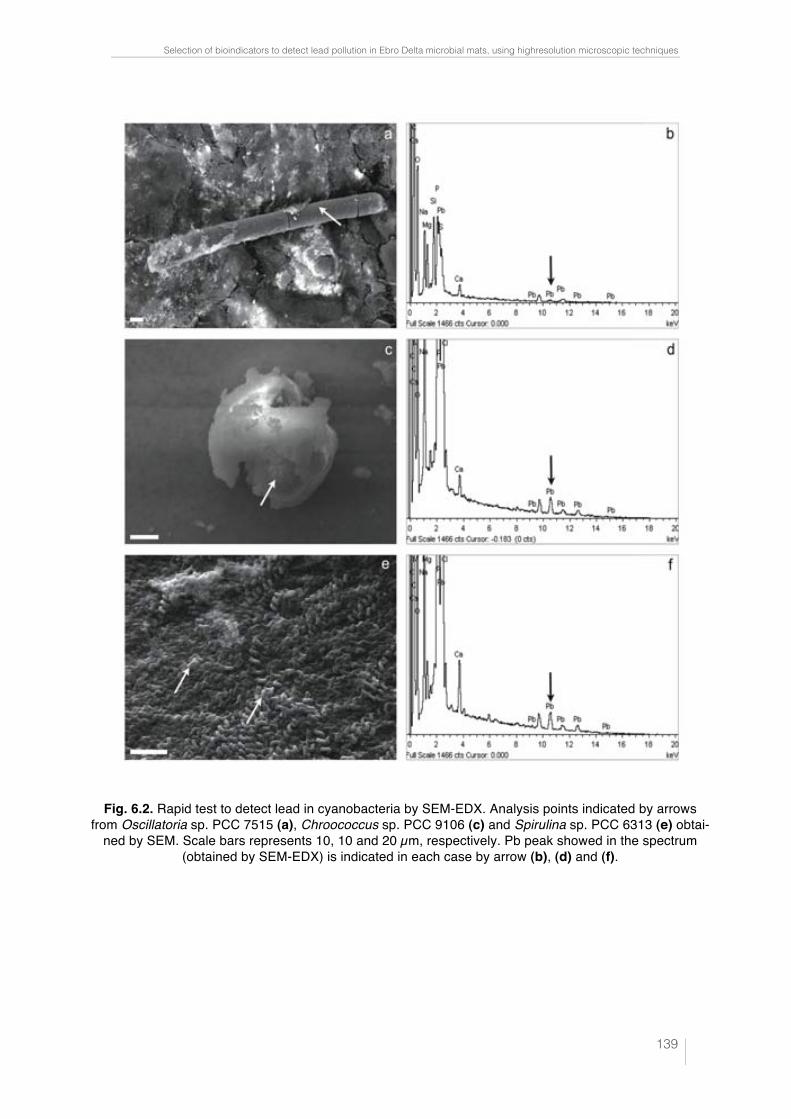
Selection of bioindicators to detect lead pollution in Ebro Delta microbial mats, using highresolution microscopic techniques
!139
Fig. 6.2. Rapid test to detect lead in cyanobacteria by SEM-EDX. Analysis points indicated by arrows from Oscillatoria sp. PCC 7515 (a), Chroococcus sp. PCC 9106 (c) and Spirulina sp. PCC 6313 (e) obtai-
ned by SEM. Scale bars represents 10, 10 and 20 µm, respectively. Pb peak showed in the spectrum (obtained by SEM-EDX) is indicated in each case by arrow (b), (d) and (f).
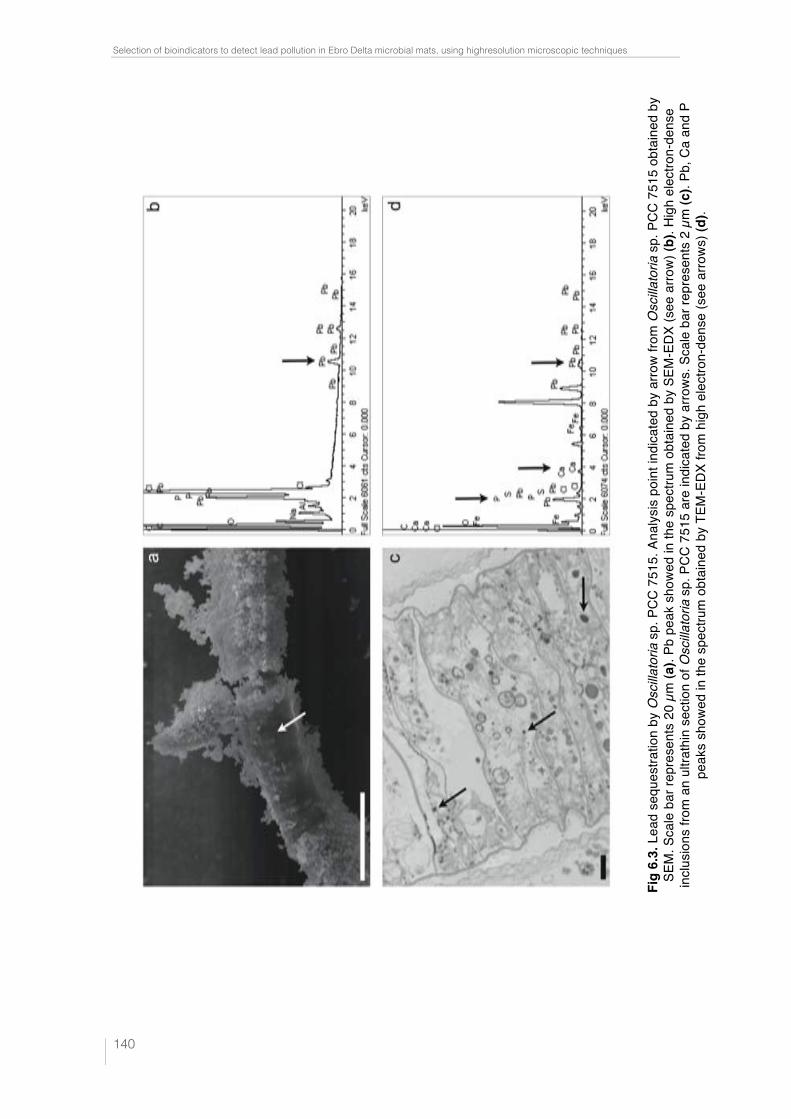
Selection of bioindicators to detect lead pollution in Ebro Delta microbial mats, using highresolution microscopic techniques
!140
Fig
6.3.
Lea
d se
ques
tratio
n by
Osc
illato
ria s
p. P
CC 7
515.
Ana
lysis
poi
nt in
dica
ted
by a
rrow
from
Osc
illato
ria s
p. P
CC 7
515
obta
ined
by
SEM
. Sca
le b
ar re
pres
ents
20
µm (a
). Pb
pea
k sh
owed
in th
e sp
ectru
m o
btai
ned
by S
EM-E
DX (s
ee a
rrow)
(b).
High
ele
ctro
n-de
nse
inclu
sion
s fro
m a
n ul
trath
in s
ectio
n of
Osc
illato
ria s
p. P
CC 7
515
are
indi
cate
d by
arro
ws. S
cale
bar
repr
esen
ts 2
µm
(c).
Pb, C
a an
d P
peak
s sh
owed
in th
e sp
ectru
m o
btai
ned
by T
EM-E
DX fr
om h
igh
elec
tron-
dens
e (s
ee a
rrows
) (d)
.
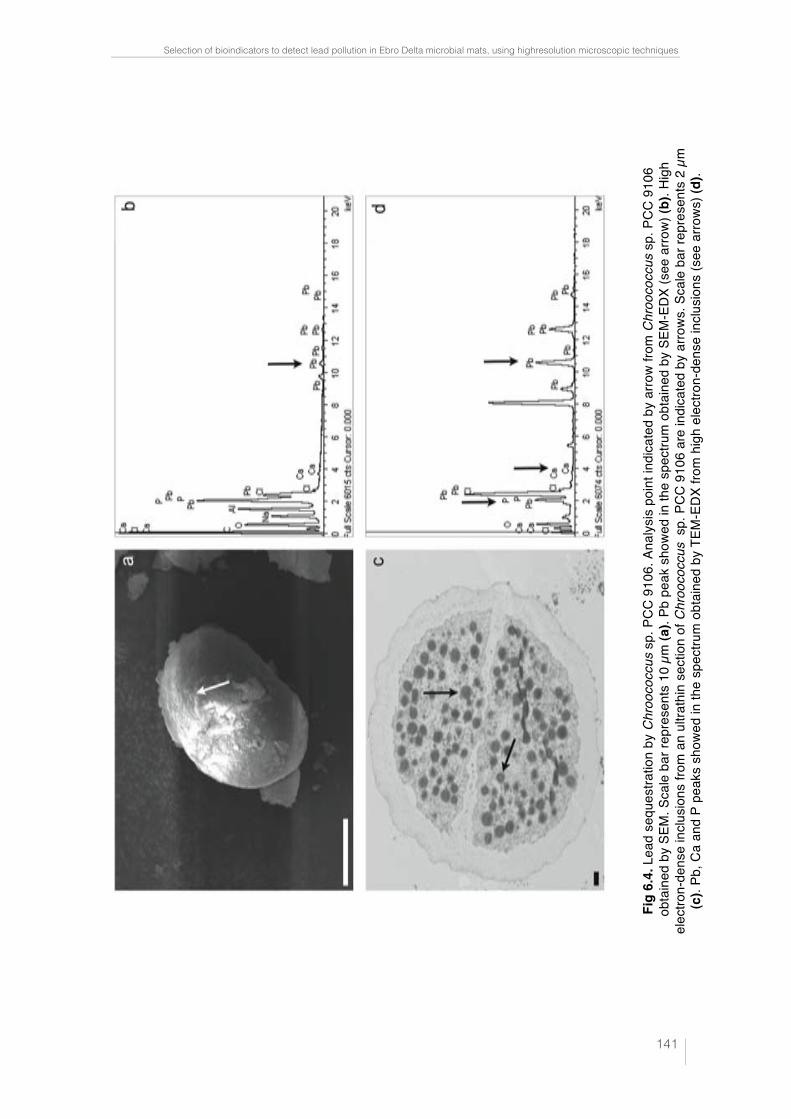
Selection of bioindicators to detect lead pollution in Ebro Delta microbial mats, using highresolution microscopic techniques
!141
Fig
6.4.
Lea
d se
ques
tratio
n by
Chr
ooco
ccus
sp.
PCC
910
6. A
nalys
is p
oint
indi
cate
d by
arro
w fro
m C
hroo
cocc
us s
p. P
CC 9
106
obt
aine
d by
SEM
. Sca
le b
ar re
pres
ents
10
µm (a
). Pb
pea
k sh
owed
in th
e sp
ectru
m o
btai
ned
by S
EM-E
DX (s
ee a
rrow)
(b).
High
el
ectro
n-de
nse
inclu
sion
s fro
m a
n ul
trath
in s
ectio
n of
Chr
ooco
ccus
sp.
PCC
910
6 ar
e in
dica
ted
by a
rrows
. Sca
le b
ar re
pres
ents
2 µ
m
(c).
Pb, C
a an
d P
peak
s sh
owed
in th
e sp
ectru
m o
btai
ned
by T
EM-E
DX fr
om h
igh
elec
tron-
dens
e in
clusi
ons
(see
arro
ws) (
d).
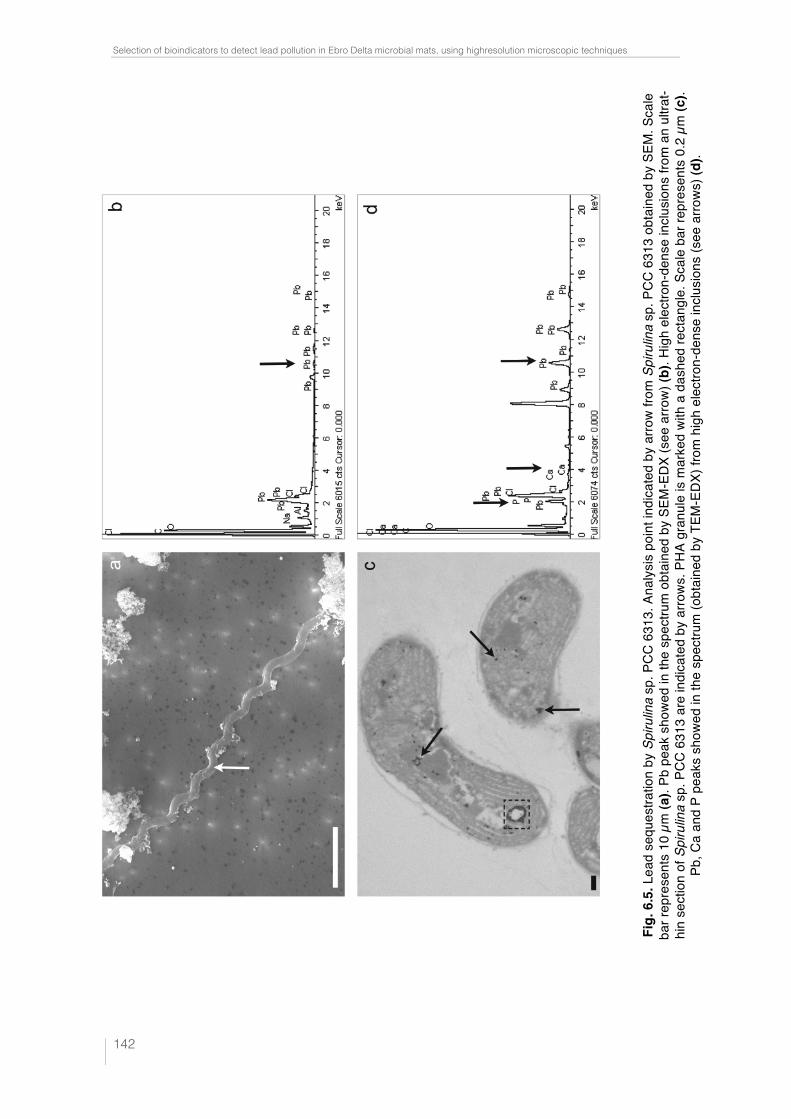
Selection of bioindicators to detect lead pollution in Ebro Delta microbial mats, using highresolution microscopic techniques
!142
Fig.
6.5
. Lea
d se
ques
tratio
n by
Spi
rulin
a sp
. PCC
631
3. A
nalys
is p
oint
indi
cate
d by
arro
w fro
m S
piru
lina
sp. P
CC 6
313
obta
ined
by
SEM
. Sca
le
bar r
epre
sent
s 10
µm
(a).
Pb p
eak
show
ed in
the
spec
trum
obt
aine
d by
SEM
-EDX
(see
arro
w) (b
). Hi
gh e
lect
ron-
dens
e in
clusi
ons
from
an
ultra
t-hi
n se
ctio
n of
Spi
rulin
a sp
. PCC
631
3 ar
e in
dica
ted
by a
rrows
. PHA
gra
nule
is m
arke
d wi
th a
das
hed
rect
angl
e. S
cale
bar
repr
esen
ts 0
.2 µ
m (c
). Pb
, Ca
and
P pe
aks
show
ed in
the
spec
trum
(obt
aine
d by
TEM
-EDX
) fro
m h
igh
elec
tron-
dens
e in
clusi
ons
(see
arro
ws) (
d).
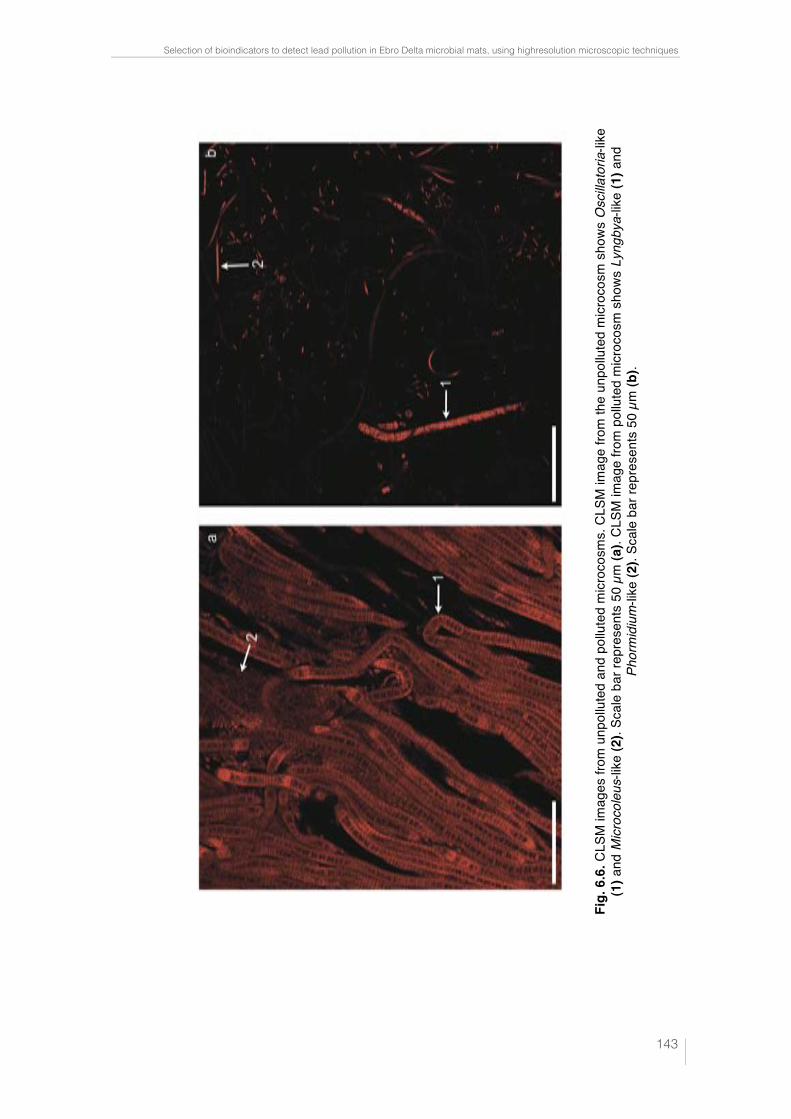
Selection of bioindicators to detect lead pollution in Ebro Delta microbial mats, using highresolution microscopic techniques
!143
Fig.
6.6
. CLS
M im
ages
from
unp
ollu
ted
and
pollu
ted
micr
ocos
ms.
CLS
M im
age
from
the
unpo
llute
d m
icroc
osm
sho
ws O
scilla
toria
-like
(1
) and
Micr
ocol
eus-
like
(2).
Scal
e ba
r rep
rese
nts
50 µ
m (a
). CL
SM im
age
from
pol
lute
d m
icroc
osm
sho
ws L
yngb
ya-li
ke (1
) and
Ph
orm
idiu
m-li
ke (2
). Sc
ale
bar r
epre
sent
s 50
µm
(b).
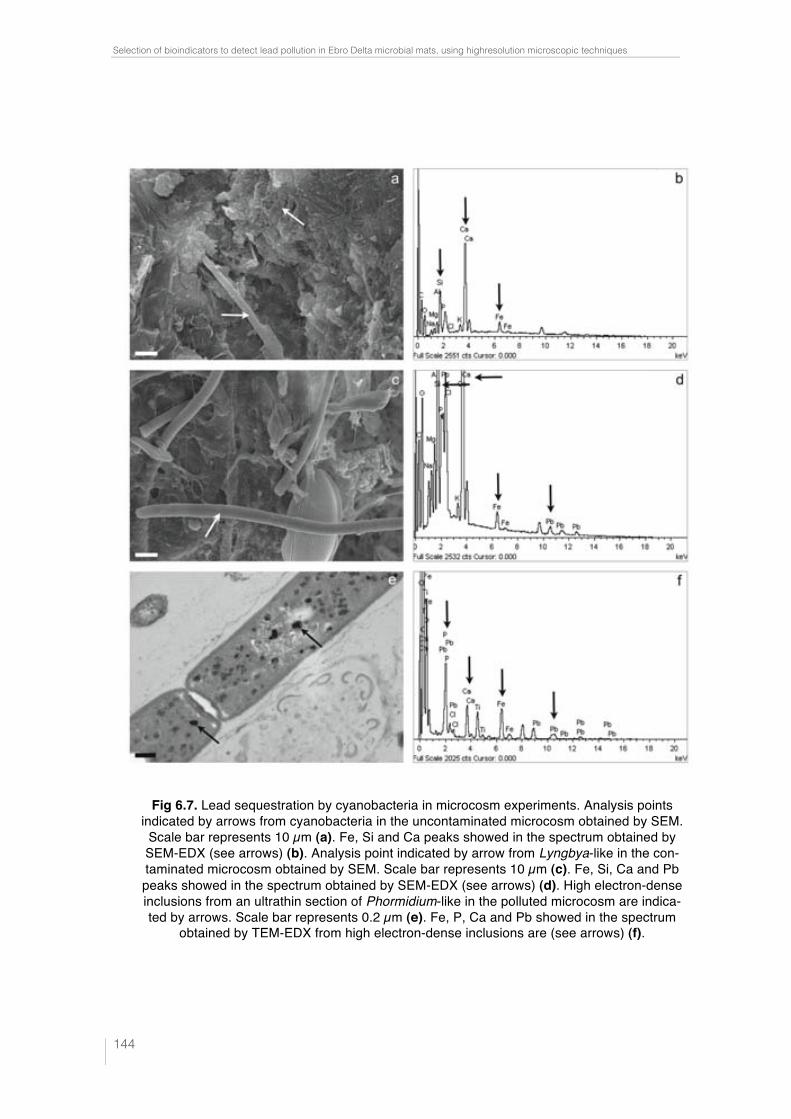
Selection of bioindicators to detect lead pollution in Ebro Delta microbial mats, using highresolution microscopic techniques
!144
Fig 6.7. Lead sequestration by cyanobacteria in microcosm experiments. Analysis points indicated by arrows from cyanobacteria in the uncontaminated microcosm obtained by SEM. Scale bar represents 10 µm (a). Fe, Si and Ca peaks showed in the spectrum obtained by SEM-EDX (see arrows) (b). Analysis point indicated by arrow from Lyngbya-like in the con-taminated microcosm obtained by SEM. Scale bar represents 10 µm (c). Fe, Si, Ca and Pb peaks showed in the spectrum obtained by SEM-EDX (see arrows) (d). High electron-dense inclusions from an ultrathin section of Phormidium-like in the polluted microcosm are indica-ted by arrows. Scale bar represents 0.2 µm (e). Fe, P, Ca and Pb showed in the spectrum
obtained by TEM-EDX from high electron-dense inclusions are (see arrows) (f).
!
Selection of bioindicators to detect lead pollution in Ebro Delta microbial mats, using highresolution microscopic techniques
!145
References
Azevedo J.S., Fernandez W.S., Farias L.A., Favaro D.T. and Braga E.S. (2009). Use of
Cathorops spixii as bioindicator of pollution of trace metals in the Santos Bay, Braz.
Ecotoxicology. 18, 577-586.
Boivin M.E., Massieux B., Breure A.M., van den Ende F.P., Greve G.D., Rutgers M. and Admiraal W. (2005) Effects of copper and temperature on aquatic bacterial
communities. Aquat. Toxicol. 71, 345-356.
Borrego J.J. and Figueras M.J. (1997) Microbiological quality of natural waters. Micro-
biologia. 13, 413-426.
Bryant D.A. (1982) Phycoerythrocyanin and Phycoerythrin: properties and occurrence
in cyanobacteria. J. Gen. Microbiol. 128, 835-844.
Burnat M., Diestra E., Esteve I. and Solé A. (2009) In situ determination of the effects
of lead and copper on cyanobacterial populations in microcosms. PLoS One. 4,
e6204.
Burnat M., Diestra E., Esteve I. and Solé, A. (2010) Confocal laser scanning microsco-
py coupled to a spectrofluorometric detector as a rapid tool for determining the in
vivo effect of metals on phototrophic bacteria. Bull. Environ. Contam. Toxicol. 84,
55-60.
Campbell S.E. (1979) Soil stabilization by a prokaryotic desert crust: implications for
Precambrian land biota. Orig. Life. 9, 335-348.
De Philippis R., Paperi R., Sili C. and Vincenzini M. (2003) Assessment of the metal
removal capability of two capsulated cyanobacteria, Cyanobacteria capsulata and
Nostoc PCC7936. J. Appl. Phycol. 15, 155-161.
Diestra E., Solé A. and Esteve I. (2004) A comparative study of cyanobacterial diversity
in polluted and unpolluted microbial mats by means of CLSM. Ophelia. 58, 151-
156.
Esteve I., Martínez-Alonso M. and Mir J. (1992) Distribution, typology and structure
of microbial mat communities in Spain. Preliminary studies. Limnetica. 8, 185-195.
Selection of bioindicators to detect lead pollution in Ebro Delta microbial mats, using highresolution microscopic techniques
!146
Esteve I., Ceballos D., Martínez-Alonso M., Gaju N. and Guerrero R. (1994) Devel-
opment of versicolored microbial mats: succession of microbial communites. Mi-
crobial mats: structure, development and environmental significance, In: Stal L.J.
and Caumette P. (Eds.), NATO ASI Series G: Ecological Sciences, Springer-Verlag,
Berlin, Heidelberg, pp. 4165-4420.
Faria M., López M.A., Diez S. and Barata C. (2010) Are native naiads more tolerant to
pollution than exotic freshwater bivalve species? An hypothesis tested using phys-
iological responses of three species transplanted to mercury contaminated sites in
the Ebro River (NE, Spain). Chemosphere. 81, 1218- 1226.
Fourçans A., García de Oteyza, T., Wieland A., Solé A., Diestra E., van Bleijswijk J., Grimalt J.O., Kuhl M., Esteve I., Muyzer G., Caumette P. and Duran R. (2004)
Characterization of functional bacterial groups in a hypersaline microbial mat
community (Salins-de-Giraud, Camargue, France), FEMS Microbiol. Ecol. 51, 55-
70.
García-Pichel F., Prufert-Bebout L. and Muyzer G. (1996) Phenotypic and phyloge-
netic analyses show Microcoleus chthonoplastes to be a cosmopolitan cyanobacte-
rium. Appl. Environ. Microbiol. 62, 3284- 3291.
Garitano-Zavala A., Cotín J., Borràs M. and Nadal, J. (2010) Trace metal concentra-
tions in tissues of two tinamou species in mining areas of Bolivia and their poten-
tial as environmental sentinels. Environ. Monit. Assess. 168, 629-644.
Gjorgieva D., Kadifkova-Panovska T., Baceva K. and Stafilov, T. (2011). Assessment
of heavy metal pollution in republic of macedonia using a plant assay. Arch. Envi-
ron. Contam. Toxicol. 60, 233-244.
Guerrero R., Haselton A., Solé M. and Margulis L. (1999) Titanospirillum velox: A
huge, speedy, sulfur-storing spirillum from Ebro Delta microbial mats. Proc. Nat.
Acad. Sci. USA. 96, 11584-11588.
Herdman M., Iteman I. and Rippka R. (2005) Catalogue of Cyanobacterial strains,
second ed. Institut Pasteur, Paris.
Selection of bioindicators to detect lead pollution in Ebro Delta microbial mats, using highresolution microscopic techniques
!147
Incharoensakdi A. and Kitjaharn P. (2002) Zinc biosorption from aqueous solution by
a halotolerant cyanobacterium Aphanothece halophytica. Curr. Microbiol. 45, 261-
264.
Jensen T.E. and Sicko L.M. (1974) Phosphate metabolism in blue-green algae. I. Fine
structure of the "polyphosphate overplus" phenomenon in Plectonema boryanum.
Can. J. Microbiol. 20, 1235-1239.
Lo W., Chua H., Lam K.H. and Bi S.P. (1999) A comparative investigation on the bio-
sorption of lead by filamentous fungal biomass. Chemosphere. 39, 2723- 2736.
Maldonado J., de los Rios A., Esteve I., Ascaso C., Puyen Z.M. Brambilla C. and Solé A. (2010b) Sequestration and in vivo effect of lead on DE2009 microalga, using
high-resolution microscopic techniques. J. Hazard. Mater. 183, 44–50.
Mañosa S., Mateo R. and Guitart R. (2001) A review of the effects of agricultural and
industrial contamination on the Ebro delta biota and wildlife. Environ. Monit. As-
sess. 71, 187-205.
Massieux B., Boivin M.E., Van Den Ende F.P., Langenskiold J., Marvan P., Bar-ranguet C., Admiraal W., Laanbroek H.J. and Zwart G. (2004) Analysis of struc-
tural and physiological profiles to assess the effects of Cu on biofilm microbial
communities. Appl. Environ. Microbiol. 70, 4512-4521.
Mateo, R., Martinez-Vilalta, A. and Guitart, R. (1997) Lead shot pellets in the Ebro
delta, Spain: densities in sediments and prevalence of exposure in waterflow. Envi-
ron. Pollut. 96, 335-341.
Mehta S.K. and Gaur J.P. (2001) Concurrent sorption of Ni2+ and Cu2+ by Chlorella
vulgaris from a binary metal solution. Appl. Microbiol. Biotechnol. 55, 379-382.
Mir J., Martínez-Alonso M., Esteve I. and Guerrero R. (1991) Vertical stratification
and microbial assemblage of a microbial mat in the Ebro Delta (Spain). FEMS Mi-
crobiol. Ecol. 86, 59-68.
Murthy S.D.S. and Mohant. P. (1991) Mercury induces alteration of energy transfer in
phycobilisome by selectively affecting the pigment protein, phycocyanin, in the
cyanobacterium, Spirulina platensis. Plant. Cell. Physiol. 32, 231-237.
Selection of bioindicators to detect lead pollution in Ebro Delta microbial mats, using highresolution microscopic techniques
!148
Murthy S.D.S. Ramanaiah V.V. and Sudhir P. (2004) High temperature induced alter-
ations in energy transfer in phycobilisomes of the cyanobacterium Spirulina
platensis. Photosynthetica 42, 615-617.
Ranjard L., Lignier L. and Chaussod R. (2006) Cumulative effects of short-term
polymetal contamination on soil bacterial community structure. Applied and En-
viron. Microbiol. 72, 1684-1687.
Roane T.M. and Pepper I.L. (2000) Microorganisms and metal pollutants, In: Maier
R.M., Pepper I.L. and Gerba C.P. (Eds.), Environmental Microbiology, Academic
Press, New York, pp. 403-423.
Rippka R., Deruelles J., Waterbury J.B., Herdman M. and Stanier, R.Y. (1979) Gener-
ic assignments, strain histories and properties of pure cultures of cyanobacteria. J.
Gen. Microbiol. 111, 1-61.
Sánchez-Chardi A., López-Fuster M.J. and Nadal J. (2007) Bioaccumulation of lead,
mercury, and cadmium in the greater white-toothed shrew, Crocidura russula,
from the Ebro Delta (NE Spain): sex- and age-dependent variation. Environ. Pollut.
145, 7-14.
Schlebusch M. and Forchhammer K. (2010) Requirement of the nitrogen starvation-
induced protein Sll0783 for polyhydroxybutyrate accumulation in Synechocystis sp.
strain PCC 6803. Appl. Environ. Microbiol. 76, 6101-6107.
Solé A., Gaju N. and Esteve I., (2003) The biomass dynamics of cyanobacteria in an
annual cycle determined by confocal laser scanning microscopy. Scanning. 1, 1-7.
Solé A., Diestra E. and Esteve I. (2009) Confocal laser scanning microscopy image
analysis for cyanobacterial biomass determined at microscale level in different mi-
crobial mats. Microb. Ecol. 57, 649-656.
Wieland A., Kuhl M,. McGowan L., Fourçans A., Duran R., Caumette P., García de Oteyza T., Grimalt J.O., Solé A., Diestra E., Esteve I. and Herbert, R.A. 2003.
Microbial mats on the Orkney Islands revisited: microenvironment and microbial
community composition. Microb. Ecol. 46, 371-390
!

!
! !!!!!!!!!!!!!!!!!!!!!!!!!!!
!!
!
7. Results and
General discussion

!
Results and General Discussion
!151
The aim of this PhD thesis study has been to use electron microscopy techniques
to determine how different photrophic and heterotrophic microorganisms are affected
by metals, as well as their capacity to capture them. To do this, and as indicated in
Chapter 2 (Material and methods) different microorganisms isolated from the natural
environment (Ebro Delta microbial mats) have been used, together with strains of cya-
nobacteria from the Pasteur culture collection (PCC). The metals tested were Pb and Cu,
as both have been detected in the Ebro River, and also because the former is very toxic,
showing no biological function, while the latter, by contrast, is an essential element at
low doses, while at high doses it is toxic. The techniques used, involving CLSM, SEM,
TEM and EDX coupled with the latter two microscopes, have been optimized and used
with different purposes. CLSM-"scan has been used to determine sensitivity to metal
(tolerance-resistance) while SEM-EDX and TEM-EDX respectively have been used to
determine external and intracellular metal biocapture.
This section discusses the importance of adapting the sample preparation proto-
cols to the metal to be tested and the features of each microscope, and EDX in particular,
to determine the effect and capture of metals in the heterotrophic and phototrophic
microorganisms indicated above, which have been selected because they are the most
abundant in Ebro Delta microbial mats. Once the effectiveness of these methodologies
has been proven, the same tests have been carried out in microcosms in order to obtain
good bioindicators of metal pollution, with the ultimate aim of applying them in the
natural environment.
The protocols used are then optimized and the possible sources of metal pollu-
tion from outside the samples are determined. Secondly, the results obtained are sum-
marized and presented in the form of articles (Chapters 3, 4, 5 and 6) for the selection of
bioindicators. These results are also presented in tables so that they can be discussed
more easily.
Results and General Discussion
!152
7.1 Methodological optimization
In general, the standard protocols described in Chapter 2 on Material and Methods,
have been followed, so this section describes only the improvements applied to these
protocols to clear up the interaction of the metals tested with external contamination
(presence of metals in sample supports and electron microscopes).
In the experiments carried out with CLSM-"scan to determine Pb sensitivity in
photosynthetic microorganisms, the protocol described by Burnat et al., (2010) has been
followed. However, in this study a greater number of MFI analyses (70 ROIs) have been
carried out in order to obtain more reliable results.
The methodological optimization has basically focused on analysis by EDX cou-
pled with SEM and TEM. As mentioned-above, the EDX is a technique used for the el-
emental analysis of a sample. The technique is based on the analysis of X-rays emitted
by matter in response to collisions with charged particles coming from an energy beam
of the electron microscope. The number and energy of emitted X-rays in a sample can
be measured semi-quantitatively by an energy dispersive spectrometer that can be cou-
pled to both SEM and TEM.
Concerning EDX, one of the main disadvantages of its use is the possible interac-
tion between metals that may occur at protocol and at sample observation level.
Protocol optimization
In this case, the concentration of the metal tested, the staining used and the metalliza-
tion of the samples has been considered.
In the experiments carried out using different metal concentrations it has been
observed that, in the case of Cu, the concentration of metal used must be taken into ac-
count, as at high concentrations (greater than 5 mM Cu), the Cu is precipitated, con-
taminating even the resin in which the samples are placed to be analysed by TEM-EDX.
The same happens with analysis by SEM-EDX, in which Cu can be detected in the filter
retaining the sample. On the other hand in the experiments in which lower doses have
been used (1 µM in the case of DE2009 microalga, Alvaro Burgos personal communica-
tion) no metal precipitation has occurred that would mask the results. For this reason, it
Results and General Discussion
!153
is recommended using low concentrations of metal in all cases, both Pb and for Cu, to
prevent precipitation.
In addition, the protocols used to prepare the ultrathin section for TEM include
solutions that dye the samples, providing contrast. The most commonly used are uranyl,
phosphotungstic acid and lead citrate. The use of lead citrate has therefore been ruled
out for evaluating Pb capture both in intracytoplasmic inclusions and in the cytoplasm
of the microorganisms, to prevent interference with this metal.
Concerning the preparation of samples for SEM, in order to obtain good con-
trast with them, metallizing is carried out with a noble metal. Whether the metal used
for metallizing the samples, has an energy peak in the element spectrum overlapping the
metal to be evaluated has been taken into account. This is why Au has been used, as its
energy peak does not overlap either with Pb or with Cu.
Sample observation
In this section, the support grids and the presence of metals in electron microscopes
have been considered.
Given the importance placed on the selection of support grids, we also wanted to
evaluate their composition, considering those most frequently used: Cu, Au, Ni and Ti
(Fig. 7.1 and 7.2).
From the results obtained in the EDX spectra it is deduced that, in the case of Pb
contamination, any of the grids mentioned above could be used. By contrast, in the case
of Cu-polluted samples, Ni or Ti ones should be used if the data obtained by SEM-EDX
is considered (Fig. 7.1). However, if the SEM-EDX and TEM-EDX results are compared,
it is concluded that the TEM specime holder, shows traces of Cu and Cr (Fig. 7.2). It is
for this reason that, for experiments with Cu, it is necessary to subtract the value corre-
sponding to the Cu peak determined as control from the maximum Cu peak of the
sample analysed.
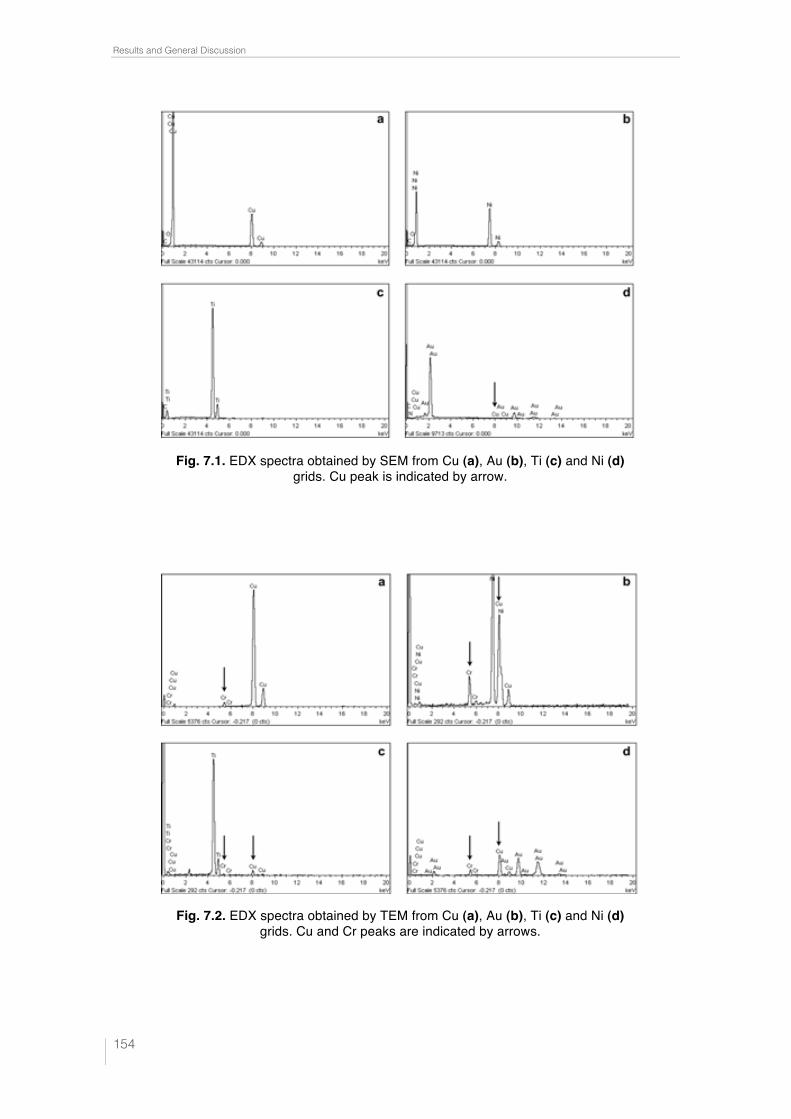
Results and General Discussion
!154
Fig. 7.1. EDX spectra obtained by SEM from Cu (a), Au (b), Ti (c) and Ni (d) grids. Cu peak is indicated by arrow.
Fig. 7.1. EDX spectra obtained by SEM from Cu (a), Au (b), Ti (c) and Ni (d) grids. Cu peak is indicated by arrow.
!
Fig. 7.2. EDX spectra obtained by TEM from Cu (a), Au (b), Ti (c) and Ni (d) grids. Cu and Cr peaks are indicated by arrows.
!
Results and General Discussion
!155
7.2. Comparative study of the results obtained and general discussion.
For this goal it has been determined the in vivo effect of Pb on different phototrophic
microorganisms (tolerance-resistance) (CLSM-"scan), and the ability of these microor-
ganisms to capture metals extra- and/or intracellularly (SEM-EDX and TEM-EDX) as
described in Chapters 3, 4, 5 and 6.
7.2.1 Determination of the effect of metals (tolerance-resistance) on phototrophic microorganisms, using CLSM-!scan.
The first objective of this study has been to determine the sensitivity to Pb of the differ-
ent phototrophic microorganisms (directly isolated from the natural environment and
also some of the culture collection) using CLSM coupled to a spectrofluorometric detec-
tor (CLSM-"scan).
The minimum inhibitory concentration (MIC) technique is commonly used to
determine the sensitivity of microorganisms to metals or antibiotics, requiring the mi-
croorganism tested to have growth capacity in liquid and solid mediums. This means
the technique is valid for the majority of heterotrophic microorganisms and for some
phototrophic microorganisms. However, this method cannot be applied in filamentous
cyanobacteria that show slow and or irregular growth. On the other hand, high-
performance liquid chromatography (HPLC) (Chakrabortys et al., 2010), which gives
indirect biomass values for a photosynthetic population based on the pigments extract-
ed from it, would also be rejected because this method does not allow the determination
of the effect of a metal directly at cell level, and requires long protocols.
This is the reason for the interest in seeking other methods allowing us to deter-
mine the effect of metals on these microorganisms in a more precise way, as well as be-
ing able to determine this in vivo effect at individual cell level.
Confocal laser scanning microscopy (CLSM) is an outstanding optical microsco-
py technique because allows accurate and non-destructive optical sectioning giving
high-resolution images (optical sections) where out-of-focus views are eliminated. It is
also a very interesting technique for observing phototrophic microorganisms (algae and
cyanobacteria) because they emit natural fluorescence and staining protocols are not
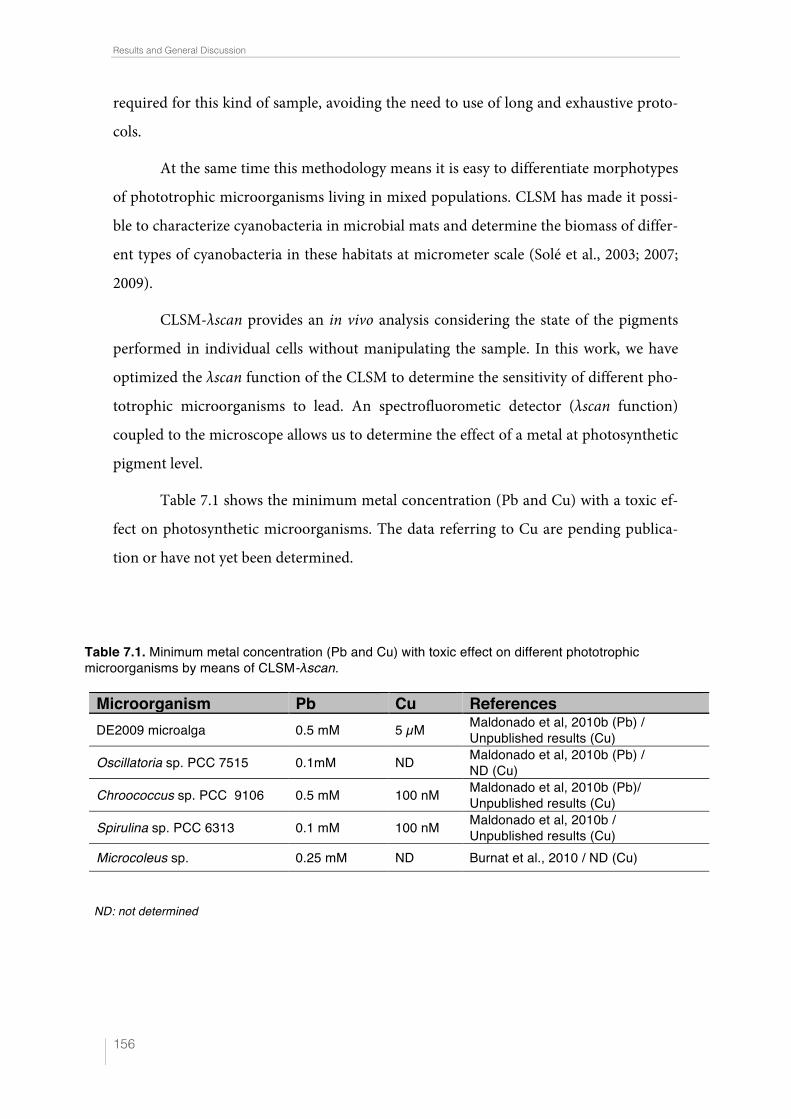
Results and General Discussion
!156
required for this kind of sample, avoiding the need to use of long and exhaustive proto-
cols.
At the same time this methodology means it is easy to differentiate morphotypes
of phototrophic microorganisms living in mixed populations. CLSM has made it possi-
ble to characterize cyanobacteria in microbial mats and determine the biomass of differ-
ent types of cyanobacteria in these habitats at micrometer scale (Solé et al., 2003; 2007;
2009).
CLSM-"scan provides an in vivo analysis considering the state of the pigments
performed in individual cells without manipulating the sample. In this work, we have
optimized the "scan function of the CLSM to determine the sensitivity of different pho-
totrophic microorganisms to lead. An spectrofluorometic detector ("scan function)
coupled to the microscope allows us to determine the effect of a metal at photosynthetic
pigment level.
Table 7.1 shows the minimum metal concentration (Pb and Cu) with a toxic ef-
fect on photosynthetic microorganisms. The data referring to Cu are pending publica-
tion or have not yet been determined.
Table 7.1. Minimum metal concentration (Pb and Cu) with toxic effect on different phototrophic microorganisms by means of CLSM-λscan.!
ND: not determined
Microorganism Pb Cu References DE2009 microalga 0.5 mM 5 µM Maldonado et al, 2010b (Pb) /
Unpublished results (Cu)
Oscillatoria sp. PCC 7515 0.1mM ND Maldonado et al, 2010b (Pb) / ND (Cu)
Chroococcus sp. PCC 9106 0.5 mM 100 nM Maldonado et al, 2010b (Pb)/ Unpublished results (Cu)
Spirulina sp. PCC 6313 0.1 mM 100 nM Maldonado et al, 2010b / Unpublished results (Cu)
Microcoleus sp. 0.25 mM ND Burnat et al., 2010 / ND (Cu)
Results and General Discussion
!157
These results demonstrate that Chroococcus sp. PCC 9106 and DE2009 microal-
ga show greater tolerance to Pb than Oscillatoria sp. PCC 7515 and Spirulina sp.
PCC 6313.
Previous results, in Microcoleus sp. (Burnat et al., 2010), show that this cyano-
bacteria tolerates a minimum concentration of 0.25 mM Pb which is lower than that
presented by Chroococcus sp. PCC 9106 and DE2009 microalga and greater than that of
Oscillatoria sp. PCC 7515 and Spirulina sp. PCC 6313.
In the case of Cu, the minimum concentration with a toxic effect is 100 nM in
the collection cultures tested. This value is much lower than that obtained for Pb (0.1
mM). The same thing happens in DE2009 microalga, with 5 µM for Cu and 0.5 mM for
Pb. These results allow us to conclude that Cu, despite being a metal considered essen-
tial for phototrophic microorganisms, is much more toxic than Pb.
Surosz and Palinska, 2004 have also demonstrated in Anabaena flos-aquae that
Cu at high concentrations causes the expansion of thylakoids in this cyanobacteria and
lower production of photosynthetic pigments, largely chl a.
The CLSM-"scan technique is very sensitive because allows us to detect changes in fluo-
rescence intensity at 100 nM.
7.2.2. Sequestration of lead and copper by phototrophic and heterotrophic microorganisms, using SEM-EDX and TEM-EDX.
The second aim of this study has been to determine the capacity of different microor-
ganisms to accumulate lead or copper, both externally in the EPS and internally in PP
inclusions. Alongside this and with the same aim, experiments have been carried out in
microcosms contaminated with Pb to evaluate the capture capacity of photosynthetic
microorganisms in situ.
Results and General Discussion
!158
7.2.2.1 Extracellular capture of lead and copper by photrophic and heterotrophic microorganisms, using SEM-EDX.
Biosorption (extracellular metal capture) is used in biorepair processes to describe the
passive accumulation of metals and radioactive elements by samples of biological origin
(Schiewer and Volesky 2000).
As has already been said, the most abundant microorganisms in microbial mats
are cyanobacteria and the majority of these microorganisms show EPS envelopes that
can be present in the form of sheaths or slimes. In tables 7.2 and 7.3 it can be seen that
all the microorganisms analysed, including heterotrophic microorganisms, show both
Pb and Cu in the EPS in the elemental analysis spectra.
Also, the cyanobacteria in the microcosms contaminated with Pb, which have
been studied in this work, capture the metal in the EPS.
With respect to the functions the EPS may have, various authors have suggested
protection against dehydration and UV radiation, biomineralization, phagocytosis, ad-
hesion capacity to the surrounding substrate and capacity to sequester metals (Pereira et
al., 2011). The latter is also demonstrated in this experimental work carried out.
Meanwhile, Decho (1999) observed an increase in EPS production in different
microorganisms when they grow in the presence of toxic compounds. Also, in this PhD
thesis study, a tendency to increase the thickness of the EPS in a directly proportional
way to the concentration of the metal tested has been observed through the images ob-
tained by SEM and TEM.
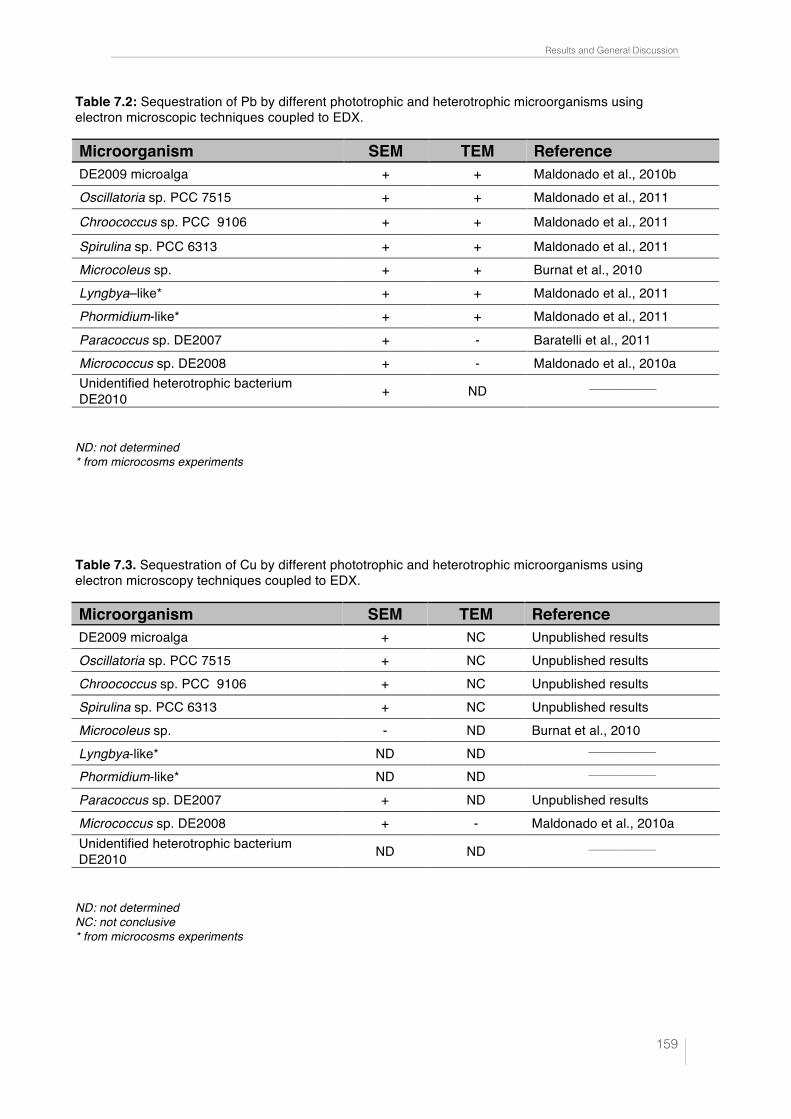
Results and General Discussion
!159
Table 7.2: Sequestration of Pb by different phototrophic and heterotrophic microorganisms using electron microscopic techniques coupled to EDX.
Microorganism SEM TEM Reference DE2009 microalga + + Maldonado et al., 2010b Oscillatoria sp. PCC 7515 + + Maldonado et al., 2011
Chroococcus sp. PCC 9106 + + Maldonado et al., 2011
Spirulina sp. PCC 6313 + + Maldonado et al., 2011 Microcoleus sp. + + Burnat et al., 2010 Lyngbya–like* + + Maldonado et al., 2011 Phormidium-like* + + Maldonado et al., 2011 Paracoccus sp. DE2007 + - Baratelli et al., 2011 Micrococcus sp. DE2008 + - Maldonado et al., 2010a Unidentified heterotrophic bacterium DE2010 + ND ______________
ND: not determined * from microcosms experiments
Table 7.3. Sequestration of Cu by different phototrophic and heterotrophic microorganisms using electron microscopy techniques coupled to EDX.
Microorganism SEM TEM Reference DE2009 microalga + NC Unpublished results Oscillatoria sp. PCC 7515 + NC Unpublished results Chroococcus sp. PCC 9106 + NC Unpublished results Spirulina sp. PCC 6313 + NC Unpublished results Microcoleus sp. - ND Burnat et al., 2010 Lyngbya-like* ND ND ______________ Phormidium-like* ND ND ______________ Paracoccus sp. DE2007 + ND Unpublished results Micrococcus sp. DE2008 + - Maldonado et al., 2010a Unidentified heterotrophic bacterium DE2010 ND ND ______________
ND: not determined NC: not conclusive * from microcosms experiments
Results and General Discussion
!160
7.2.2.2 Intracellular capture of lead and copper by photrophic and heterotrophic microorganisms, using TEM-EDX.
Bioaccumulation is defined as the intracellular accumulation of metals by microorgan-
isms. It consists in the first place of biosorption in the cell surface followed by transport
and accumulation either in intracellular compartments or directly in the cell cytoplasm.
In this study it has been possible to show that all the cyanobacteria studied and
the DE2009 microalga accumulate Pb in the PP inclusions (Table 7.2). It has been
shown using the EDX spectra, that these inclusions are PP because they contain P and
also divalent cations of Ca and/or K (Figs. 3.4d, 3.5d, 5.4d, 6.3d, 6.4d, 6.5d and 6.7f). The
accumulation of metals in these inclusions have also been demonstrated in other micro-
organisms: algae (Perverly et al., 1978), yeasts (Raguzzi et al., 1988) and some cyanobac-
teria (Petterson et al., 1985; Surosz and Palinska, 2004; Pereira et al., 2011; Burnat et al.,
2010; Jensen et al., 1982).
It has been demonstrated that these inclusions are formed due to some kind of
stress, for example restricted access to nutrients like nitrogen (Stevens et al., 1985) or a
high concentration of metals in the environment, as has been observed in the results
presented in the figures previously mentioned in this study.
Meanwhile, Surosz and Palinska, (2004) suggest that cyanobacteria play an im-
portant role in the compartmentalization and mobilization of heavy metals in the aquat-
ic medium, as has also been corroborated for Pb-polluted microcosms experiments.
By contrast, despite showing PP inclusions, the heterotrophic bacteria tested
(Paracoccus sp. DE2007 and Micrococcus luteus sp. DE2008) have all given a negative
result for metal capture (Tables 7.2 and 7.3).
In the case of Cu, the results have not been considered conclusive due to prob-
lems of external contamination with this metal, as has already been mentioned in the
methodological optimization section. Given that TEM-EDX is a semi-quantitative tech-
nique it should be stated that an increase in the Cu peak has been observed in the PP
inclusions, greater than that observed in other parts of the Chroococcus sp. PCC 9106
cell (Marina Seder-Colomina personal communication). In any case, it would be neces-
Results and General Discussion
!161
sary to carry out greater experimentation to obtain more conclusive results. Concerning
the sensitivity of the analysis by SEM-EDX and TEM-EDX, new experiments are carried
out using a wide range of concentrations, both for Pb and for Cu.
As a summary of what has been explained, it is observed that all the cyanobacte-
ria and DE2009 microalga analysed in this study could be considered good bioindicators
of pollution. However, DE2009 microalga have been discounted for this purpose be-
cause they are not abundant in Ebro Delta microbial mats, although they could offer
future prospects for studies of metal bioremediation.
Finally, considering the results obtained, it is proposed to select Oscillatoria sp.
and Microcoleus sp. as the best bioindicators because they are dominant in the natural
environment, larger in size, tolerant to high concentrations of metals and have capacity
to accumulate them extra- and intracellularly.
We will now list the conclusions and indicate future prospects that could emerge
from the experimental study presented.

!

!
8. Conclusions and
Future prospects

!
!!!!!!!!!!!!!!!!!!!!!!!!!!!!!!!!!!!!
Conclusions and Future prospects
!165
Conclusions obtained based on methodological optimization
For the objectives set, firstly the techniques involving the use of CLSM, SEM, TEM and
EDX coupled to these last two microscopes have been optimized, both for preparing the
samples and for observation.
1. The samples preparation protocols have been the standard ones described in Material
and Methods. However, considering the metals used in this study Pb and Cu, it was ad-
visable not to use lead citrate as a stain for the ultrathin sections (TEM-EDX) in lead
contamination experiments to prevent overlap with this metal and it is also recom-
mended for metallisation (SEM-EDX) of samples to use Au, as this does not cause inter-
ference either with Pb or with Cu.
2. The metal compositions of 4 types of grids, the most commonly used: Au, Cu, Ti and
Ni were analysed by TEM-EDX. With respect to these, for the ultrathin sections, Ti and
Ni are recommended, as these metals show no interference either with Pb or with Cu.
However, it has been shown that the TEM holder specimen has traces of Cu and Cr, so
this external contamination should be considered when the analysis of the contaminated
samples with these metals is required.
3. CLSM-"scan is mainly suitable in cases where it is necessary to analyse the tolerance-
resistance of phototrophic microorganisms against a metal, because the observation is in
vivo, with no handling of the sample and with immediate observation. SEM-EDX and
TEM-EDX are also the best methods of checking the capacity of a microorganism to
accumulate a metal extracellularly in the EPS and to determine metal accumulation
within the cytoplasm, respectively.
Conclusions and Future prospects
!166
Conclusions from the results obtained
The overall aim has been to seek good indicators of lead and copper pollution. The con-
clusions obtained using each of the techniques tested are detailed below.
4. CLSM-"scan has made it possible to detect the tolerance-resistance of phototrophic
microorganisms. Chroococcus sp. PCC 9106 and DE2009 microalga show greater toler-
ance to Pb (0.5 mM) than Oscillatoria sp. PCC 7515 and Spirulina sp. 6313 (0.1 mM). In
the case of Cu, the minimum concentration tolerated by Chroococcus sp. PCC 9106 and
Spirulina sp. PCC 6313 is 100 nM, allowing us to conclude that Cu, although it is con-
sidered an essential metal, is more toxic than Pb. The technique explained is very precise
as it detects the toxic effect in cells at nM level.
5. SEM coupled to EDX allows us to determine that all the microorganisms studied
(phototrophic and heterotrophic) have capacity to accumulate Pb and Cu externally in
the EPS.
6. TEM coupled to EDX has allowed us to determine that all the phototrophic microor-
ganisms studied accumulate Pb in PP inclusions. On the other hand, heterotrophic bac-
teria, although they show such inclusions, do not accumulate this metal. The results
obtained in the samples contaminated by Cu have not been considered conclusive, as
external contamination from the microscope has occurred, masking the results obtained.
7. With respect to the contamination experiments for metals in microcosms, only Pb
has been tested, and it has been shown that, as with cultures, all phototrophic microor-
ganisms growing in these polluted artificial ecosystems are capable of accumulating this
metal both externally and internally, always in PP inclusions.
8. Considering all the results obtained it can be concluded that all cyanobacteria and
DE2009 microalga analysed could be considered good metal pollution indicators. How-
ever, Oscillatoria sp. and Microcoleus sp. have been selected as the best indicators of
metal pollution in the natural environment because: they are the most abundant, largest
in size, tolerant to high concentrations of metals and, finally, capable of accumulating
metal extra- and intracellularly.
!!
Conclusions and Future prospects
!167
Future prospects
The study presented opens up new short- and long-term prospects for research. In the
short-term and in accordance with the results obtained both in cultures and in micro-
cosms, cyanobacteria, and in particular Microcoleus sp. and Oscillatoria sp., will be used
as microorganisms indicating metal pollution directly in the natural environment. In
forthcoming experiments, ultrathin sections will be obtained directly from different
samples of the green layer of Ebro Delta microbial mats and the TEM-EDX spectra of
the PP inclusions of the cyanobacteria present will be analysed. The future aim is to de-
termine whether the zone is pristine or if it is exposed to any type of metal pollution. Before this study, a rapid overview of research into metal capture in the EPS will be car-
ried out using SEM-EDX.
In the longer term, the determination by CLSM-"scan of the tolerance-resistance
to several metals of different photosynthetic microorganisms grown in mixed cultures
will be considered and the effect of more than one metal at a time on a single microor-
ganism will be tested. The aim in this case will be the study of the possible interactions
between microorganisms and metals. As was mentioned before, the samples are ob-
served in vivo and without manipulation and the sensitivity of this technique is of the
order of 100 nM. The results that can be obtained will provide greater knowledge about
the direct interactions occurring between microorganisms and metals in the natural
habitat. This technique will also make it possible to carry out new experiments to ana-
lyse the physiological state of cells under different culture conditions.
Finally, in phototrophic microorganisms such as: DE2009 microalga or Microco-
leus sp., in which greater metal accumulation has been seen using SEM-EDX and TEM-
EDX, future studies of capture efficiency could be carried out by chemical analysis.
Based on the results obtained, it might be considered that these microorganisms would
be useful in industrial bioremediation processes.
!!

!
!
!!!!!!!!!!!!!!!!!!!!!!!!!!!!!!!!

!
!
References !!

!
!
!!!!!!!!!!!!!!!!!!!!!!!!!!!!!!!
References
!171
Acharya C., Joseph D. and Apte S.K. (2009) Uranium sequestration by a marine cy-
anobacterium, Synechococcus elongatus strain BDU/75042 Bioresour. Technol.
100, 2176-2181.
Ahuja P., Gupta R. and Saxena R.K. (1999) Sorption and desorption of cobalt by Osci-
llatoria anguistissima. Curr. Microbiol. 39, 49-52.
Al-Hasan R.H., Al-Bader D., Sorkhoh N.A. and Radwan S.S. (1998) Evidence for n-
alakane consumption and oxidation by filamentous cyanobacteria from oil-
contaminated coasts of the Arabian Gulf. Mar. Biol. 130, 521-527.
Azevedo J.S., Fernandez W.S., Farias L.A., Favaro D.T. and Braga E.S. (2009) Use of
Cathorops spixii as bioindicator of pollution of trace metals in the Santos Bay, Braz.
Ecotoxicology. 18, 577-586.
Bamji M.S. and Krinsky N.I. (1966) The carotenoid pigments of a radiation-resistant
Micrococcus species. Biochim. Biophys. Acta. 2, 276-284.
Baptista M.S. and Vasconcelos M.T. (2006) Cyanobacteria metal interactions: re-
quirements, toxicity, and ecological implications. Cr. Rev. Microbiol. 32, 127-137.
Bender J., Gould J.P., Vatcharapijarn Y., Young J.S. and Phillips P. (1994) Removal
of zinc and manganese from contaminated water with cyanobacteria mats. Water
Environ. Fed. 66, 679-683.
Binupriya A.R., Sathishkumar M., Swaminathan K., Jeong E.S., Yun S.E. and Pattabi S. (2006) Biosorption of metal ions from aqueous solution and electroplating in-
dustry wastewater by Aspergillus japonicus: phytotoxicity studies. Bull. Environ.
Contam. Toxicol. 2, 219-227.
Bloem J., Veninga M. and Shepherd J. (1995) Fully automatic determination of soil
bacterium numbers, cell volumes, and frequencies of dividing cells by confocal la-
ser scanning microscopy and image analysis. Appl. Environ. Microbiol. 61 926-
936.
Boivin M.E., Massieux B., Breure A.M., van den Ende F.P., Greve G.D., Rutgers M. and Admiraal W. (2005) Effects of copper and temperature on aquatic bacterial
communities. Aquat. Toxicol. 71, 345-356.
References
!172
Bordenave S., Fourçans A., Blachard S., Goñi M.S., Caumette P. and Duran R. (2004)
Structure and functional analysis of bacterial communities changes in microbial
mats following petroleum exposure. Ophelia. 58, 195-203.
Borrego J.J. and Figueras M.J. (1997) Microbiological quality of natural waters. Micro-
biologia. 13, 413-426.
Garcia-Gil, J. and Borrego, C. (1997) "Sorption of metals by Chlorobium spp." Micro-
biología: publicación de la Sociedad Española de Microbiología. 13, 445-452.
Brunberg, A.-K., Nilsson E. and Blomqvist P. (2002) Characteristics of oligotrophic
hardwater lakes in a postglacial land-rise area in mid Sweden. Freshwater Biol. 47,
1451-1462.
Bryant D.A. (1982) Phycoerythrocyanin and Phycoerythrin: properties and occurrence
in cyanobacteria. J. Gen. Microbiol. 128, 835-844.
Burnat M., Diestra E., Esteve I. and Solé A. (2009) In situ determination of the effects
of lead and copper on cyanobacterial populations in microcosms. PLoS One. 4,
e6204.
Burnat M., Diestra E., Esteve I. and Solé A. (2010) Confocal laser scanning microscopy
coupled to a spectrofluorometric detector as a rapid tool for determining the in vi-
vo effect of metals on phototrophic bacteria. Bull. Environ. Contam. Toxicol. 84,
55-60.
Campbell S.E. (1979) Soil stabilization by a prokaryotic desert crust: implications for
Precambrian land biota. Orig. Life. 9, 335-348.
Chakraborty P., Raghunadh Babu P.V., Acharyya T. and Bandyopadhyay D. (2010)
Stress and toxicity of biologically important transition metals (Co, Ni, Cu and Zn)
on phytoplankton in a tropical freshwater system: An investigation with pigment
analysis by HPLC. Chemosphere 80, 548–553.
Chaudri A.M., Allain C.M.G., Barbosa-Jefferson V.L., Nicholson F.A., Chambers B.J. and McGrath S.P. (2000) A study of the impacts of Zn and Cu on two rhizobial
species in soils of a long-term field experiment. Plant. Soil. 221, 167-179.
References
!173
Choi S.B. and Yun Y.S. (2004) Lead biosorption by waste biomass of Corynebacterium
glutamicum generated from lysine fermentation process. Biotechnol. Lett. 26,
331-336.
Cowan S.T. and Steel K.J. (1965) Manual for the identification of medical bacteria.
London: Cambridge University Press, New York.
De Philippis R., Paperi R., Sili C. and Vincenzini M. (2003) Assessment of the metal
removal capability of two capsulated cyanobacteria, Cyanospira capsulata and
Nostoc PCC7936. J. Appl. Phycol. 15, 155–161.
Debelius B., Forja J.M., DelValls A. and Lubian L.M. (2009) Toxicity and bioaccumu-
lation of copper and lead in five marine microalgae. Ecotoxicol. Environ. Saf. 72,
1503-1513.
Decho A.W. (1994) Exopolymers in microbial mats: assessing their adaptative roles. In:
Stal L.J. and Caumette P. (Eds.), Microbial Mats. Structure, development and envi-
ronment significance. Springer-Verlag, Berlin, Heidelberg, pp. 215-219.
Díaz-Raviña M., Bååth E. and Frostegård A. (1994) Multiple heavy metal tolerance of
soil bacterial communities and its measurement by a thymidine incorporation
technique. Appl. Environ. Microbiol. 60, 2238-2247
Diestra E., Solé A. and Esteve I. (2004) A comparative study of cyanobacterial diversity
in polluted and unpolluted microbial mats by means of CLSM. Ophelia. 58, 151-
156.
Diestra E., Solé A., Martí M., García de Oteyza T., Grimalt J.O. and Esteve I. (2005)
Characterization of an oil-degrading Microcoleus consortium by means of confo-
cal scanning microscopy, scanning electron microscopy and transmission electron
microscopy. Scanning. 27, 176-180.
Diestra E., Esteve I., Burnat M., Maldonado J. and Solé A. (2007) Isolation and char-
acterization of a heterotrophic bacterium able to grow in different environmental
stress conditions, including crude oil and heavy metals. In: A. Méndez-Vilas,
(Eds.), Communicating Current Research and Educational Topics and Trends in
Applied Microbiology FORMATEX pp. 90-99.
References
!174
Diez B., Pedros-Alió C., Marsh T.L. and Massana R. (2001) Application of denaturing
gradient gel electrophoresis (DGGE) to study the diversity of marine picoeukary-
otic assemblages and comparison of DGGE with other molecular techniques.
Appl. Environ. Microbiol. 67, 2942-2951.
Doddamani H.P. and Ninnekar H.Z. (2001) Biodegradation of carbaryl by a Micrococ-
cus species. Curr. Microbiol. 43, 69-73.
Duffus J.H. (2002) “Heavy Metals”- a meaningless term? Pure Appl. Chem. 74, 793–807.
Ellis R.J., Morgan P., Weightman A.J. and Fry J.C. (2003) Cultivation-dependent and
-independent approaches for determining bacterial diversity in heavy-metal-
contaminated soil. Appl. Environ. Microbiol. 69, 3223-3230.
Esteve I., Ceballos D., Martínez-Alonso M., Gaju N. and Guerrero R. (1994) Devel-
opment of versicolored microbial mats: succession of microbial communites. Mi-
crobial mats: structure, development and environmental significance, In: Stal L.J.
and Caumette P. (Eds.), NATO ASI Series G: Ecological Sciences, Springer-Verlag,
Berlin, Heidelberg, pp. 4165–4420.
Esteve I., Martínez-Alonso M. and Mir J. (1992) Distribution, typology and structure
of microbial mat communities in Spain. Preliminary studies. Limnetica. 8, 185-195.
Faria M., López M.A., Diez S. and Barata C. (2010) Are native naiads more tolerant to
pollution than exotic freshwater bivalve species? An hypothesis tested using phys-
iological responses of three species transplanted to mercury contaminated sites in
the Ebro River (NE, Spain). Chemosphere. 81, 1218- 1226.
Fourçans A., García de Oteyza, T., Wieland A., Solé A., Diestra E., van Bleijswijk J., Grimalt J.O., Kuhl M., Esteve I., Muyzer G., Caumette P. and Duran R. (2004)
Characterization of functional bacterial groups in a hypersaline microbial mat
community (Salins-de-Giraud, Camargue, France). FEMS Microbiol. Ecol. 51, 55-
70.
Fry J.C. (1990) Direct methods and biomass estimation. Meth. Microbiol. 22, 441-485.
García de Oteyza T., Grimalt J.O., Diestra E., Solé A. and Esteve I. (2004). Changes in
the composition of polar and apolar crude oil fractions under the action of Micro-
coleus consortia. Appl. Microbiol. Biotechnol. 66, 226-232.
References
!175
García-Pichel F., Prufert-Bebout L. and Muyzer G. (1996) Phenotypic and phyloge-
netic analyses show Microcoleus chthonoplastes to be a cosmopolitan cyanobacte-
rium. Appl. Environ. Microbiol. 62, 3284- 3291.
Garitano-Zavala A., Cotín J., Borràs M. and Nadal, J. (2010) Trace metal concentra-
tions in tissues of two tinamou species in mining areas of Bolivia and their poten-
tial as environmental sentinels. Environ. Monit. Assess. 168, 629-644.
Gavrilescu M. (2004) Removal of Heavy Metals from the environment by biosorption.
Eng. Life Sci. 4, 219-232.
Gillan D.C., Danis B., Pernet P., Joly G. and Dubois P. (2005) Structure of sediment-
associated microbial communities along a heavy-metal contamination gradient in
the marine environment. Appl. Environ. Microbiol. 71, 679-90.
Gjorgieva D., Kadifkova-Panovska T., Baceva K. and Stafilov, T. (2011). Assessment
of heavy metal pollution in republic of macedonia using a plant assay. Arch. Envi-
ron. Contam. Toxicol. 60, 233-244.
Goldberg J., González H., Jensen T.E. and Corpe W.A. (2001) Quantitative analysis of
the elemental composition and the mass of bacterial polyphosphate bodies using
STEM EDX. Microbios. 106, 177-188.
Gong R., Ding Y., Liu H., Chen Q. and Liu Z. (2005) Lead biosorption and desorption
by intact and pretreated Spirulina maxima biomass. Chemosphere. 58, 125-130.
Greenblatt C.L., Baum J., Klein B.Y., Nachshon S., Koltunov V. and Cano R.J. (2004)
Micrococcus luteus -- survival in amber. Microb. Ecol. 48, 120-127.
Guerrero R., Urmeneta J. and Rampone G. (1993) Distribution of types of microbial
mats at the Ebro Delta, Spain. BioSystems. 31, 135-144.
Guerrero R., Haselton A., Solé M. and Margulis L. (1999) Titanospirillum velox: A
huge, speedy, sulfur-storing spirillum from Ebro Delta microbial mats. Proc. Nat.
Acad. Sci. USA. 96, 11584-11588.
Guerrero R., Piqueras M. and Berlanga M. (2002) Microbial mats and the search for
minimal ecosystems. Int. Microbiol. 5, 177-188.
References
!176
Heng L.Y., Jusoh K., Ling C.H. and Idris M. (2004) Toxicity of single and combina-
tions of lead and cadmium to the cyanobacteria Anabaena flos-aquae, Bull. Envi-
ron. Contam. Toxicol. 72, 373-379.
Herdman M., Iteman I. and Rippka R. (2005) Catalogue of Cyanobacterial strains,
second ed. Institut Pasteur, Paris.
Hoehler T.M., Bebout B.M. and Des Marais D.J. (2001). The role of microbial mats in
the production of reduced gases on the early Earth. Nature 412, 324–327.
Incharoensakdi A. and Kitjaharn P. (2002) Zinc biosorption from aqueous solution by
a halotolerant cyanobacterium Aphanothece halophytica. Curr. Microbiol. 45, 261-
264.
Jensen T. E., Baxter M., Rachlin J. W. and Jani V. (1982) Uptake of heavy metals by
Plectonema boryanum (Cyanophyceae) into cellular components, especially poly-
phosphate bodies: an x-ray energy dispersive study. Environ. Pollut. A. 27, 119-127
Jensen T.E. and Sicko L.M. (1974) Phosphate metabolism in blue-green algae. I. Fine
structure of the "polyphosphate overplus" phenomenon in Plectonema boryanum.
Can. J. Microbiol. 20, 1235-1239.
Jukes T.H. and Cantor C.R. (1969) Evolution of proteins molecules. In: Munro H.R.
(Eds.), Mammalian Proteins Metabolism, Academic Press, New York, pp. 21-23.
Jungblut A.D. and Neilan B.A. (2010) NifH-gene diversity and expression in a micro-
bial mat community on the McMurdo Ice Shelf, Antarctica. Antarc. Sci. 22, 117-
122.
Kalinowska R. and Pawlik-Skowronska B. (2010) Response of two terrestrial green
microalgae (Chlorophyta, Trebouxiophyceae) isolated from Cu-rich and unpo-
lluted soils to copper stress. Environ. Pollut. 158, 2778-2785.
Kaplan D., Christiansen D. and Arad S.M. (1987) Chelating properties of extracellular
polysaccharides from Chlorella spp.. Appl. Environ. Microbiol. 53, 2953-2956.
Kato S., Kobayashi C.,1 Kakegawa T. and Yamagishi A. (2009) Microbial communi-
ties in iron-silica-rich microbial mats at deep-sea hydrothermal fields of the
Southern Mariana Trough#!Environ. Microbiol. 11, 2094-2111.
References
!177
Keasling J. D., Van Dien S. J. and Pramanik J. (1998) Engineering polyphosphate me-
tabolism in Escherichia coli: Implications for bioremediation of inorganic contam-
inants. Biotechnol. Bioeng. 58, 231-9.
Kumar S., Tamura K. and Nei M. (2004) MEGA3: Integrated software for Molecular
Evolutionary Genetics Analysis and sequence alignment. Brief. Bioinform. 5, 150-
163.
Li P.F., Mao Z.Y., Rao X.J., Wang X.M., Min M.Z., Qiu L.W. and Liu Z.L. (2004) Bio-
sorption of uranium by lake-harvested biomass from a cyanobacterium bloom.
Bioresour. Technol. 94, 193-195.
Lin W.C., Chen, Y.S., Cheng, W.Y. (2006) Effect of metals on biodegradation kinetics
for methyltert-butylether. Biochem. Eng. J. 32, 25-32.
Liu Z.P., Wang B.J., Liu X.Y., Dai X., Liu Y.H. and Liu S.J. (2008) Paracoccus hal-
ophilus sp. nov., isolated from marine sediment of the South China Sea, China,
and emended description of genus Paracoccus Davis 1969. J. Syst. Evol. Microbiol.
58, 257-261.
Lloyd J.R. (2002) Bioremediation of metals; the application of micro-organisms that
make and break minerals. Microbiology Today. 29, 87-89.
Lo W., Chua H., Lam K.H. and Bi S.P. (1999) A comparative investigation on the bio-
sorption of lead by filamentous fungal biomass. Chemosphere. 39, 2723- 2736.
López-Cortés A., Lanz-Landázuri A. and García-Maldonado J.Q. (2008) Screening
and isolation of PHB-Producing bacteria in a polluted marine microbial mat. Mi-
crob. Ecol. 56, 112–120.
Lorenz N., Hintemann T., Kramarewa T., Katayama A., Yasuta T., Marschner P. and Kandeler E. (2006) Response of microbial activity and microbial community
composition in soils to long-term arsenic and cadmium exposure. Soil. Biol. Bio-
chem. 38, 1430-1437.
Luoma S.N. and Rainbow P.S. (2005) Why is metal bioaccumulation so variable? Bio-
dynamics as a unifying concept. Environ. Sci. Technol. 39, 1921-1931.
References
!178
Maldonado J., Diestra E., Huang L., Domènech A.M., Villagrasa E., Puyen Z.M., Du-ran R., Esteve I. and Solé A. (2010a) Isolation and identification of a bacterium
with high tolerance to lead and copper from a marine microbial mat in Spain.
Ann. Microbiol. 60, 113-120.
Maldonado J., de los Rios A., Esteve I., Ascaso C., Puyen Z.M. Brambilla C. and Solé A. (2010b) Sequestration and in vivo effect of lead on DE2009 microalga, using
high-resolution microscopic techniques. J. Hazard. Mater. 183, 44–50.
Maldonado J., Solé A., Puyen Z.M. and Esteve I. (2011) Selection of bioindicators to
detect lead pollution in Ebro delta microbial mats, using high-resolution micro-
scopic techniques. Aquat Toxicol. 104, 135-144.
Malik A. (2004) Metal bioremediation through growing cells. Environ. Int. 30, 261–278.
Mañosa S., Mateo R. and Guitart R. (2001) A review of the effects of agricultural and
industrial contamination on the Ebro delta biota and wildlife. Environ. Monit. As-
sess. 71, 187-205
Massieux B., Boivin M.E., Van Den Ende F.P., Langenskiold J., Marvan P., Bar-ranguet C., Admiraal W., Laanbroek H.J. and Zwart G. (2004) Analysis of struc-
tural and physiological profiles to assess the effects of Cu on biofilm microbial
communities. Appl. Environ. Microbiol. 70, 4512-4521.
Mateo, R., Martinez-Vilalta, A. and Guitart, R. (1997) Lead shot pellets in the Ebro
delta, Spain: densities in sediments and prevalence of exposure in waterflow. Envi-
ron. Pollut. 96, 335-341.
Mehta S.K. and Gaur J.P. (2001) Concurrent sorption of Ni2+ and Cu2+ by Chlorella
vulgaris from a binary metal solution. Appl. Microbiol. Biotechnol. 55, 379-382.
Milloning G. (1961) Advantages of phosphate buffer OsO4 solutions in fixation. J. Appl.
Phys. 32, 1637.
Mir J., Martínez-Alonso M., Esteve I. and Guerrero R. (1991) Vertical stratification
and microbial assemblage of a microbial mat in the Ebro Delta (Spain). FEMS Mi-
crobiol. Ecol. 86, 59-68.
References
!179
Moreno-Garrido I., Lubian L.M. and Soares A.M. (2000) Influence of cellular density
on determination of EC(50) in microalgal growth inhibition tests. Ecotoxicol. En-
viron. Saf. 47, 112-116.
Murthy S.D.S. and Mohant. P. (1991) Mercury induces alteration of energy transfer in
phycobilisome by selectively affecting the pigment protein, phycocyanin, in the
cyanobacterium, Spirulina platensis. Plant. Cell. Physiol. 32, 231-237.
Murthy S.D.S. Ramanaiah V.V. and Sudhir P. (2004) High temperature induced alter-
ations in energy transfer in phycobilisomes of the cyanobacterium Spirulina
platensis. Photosynthetica 42, 615-617.
Nakagawa T. and Fukui M. (2002) Phylogenetic characterization of microbial mats and
streamers from a Japanese alkaline hot spring with a thermal gradient. J. Gen.
Appl. Microbiol. 48, 211-222.
Nakajima A. and Tsuruta T. (2004) Competitive biosorption of thorium and uranium
by Micrococcus luteus. J. Radioanal. Nucl. Chem. 260, 13-18.
Nies DH. (1999) Microbial heavy-metal resistance. Appl. Microbiol. Biotechnol. 51, 730-
750.
Nies, D. H. (2003) Eflux-mediated heavy metal resistance in prokaryotes. FEMS Micro-
biol. Rev. 27, 313–339.
Nogales B., Lanfranconi M.P., Piña-Villalonga J.M. and Bosch R. (2011) Anthropo-
genic perturbations in marine microbial communities. FEMS Microbiol. Rev. 35,
275–298.
Olendzenski L.C. (1999). Growth, fine structure and cyst formation of a microbial mat
ciliate: Pseudocohnilembus pusillus (Ciliophora, Scuticociliatida). J. Eukar. Micro-
biol. 46, 132-141.
Osanjo G.O., Muthike E.W., Tsuma L., Okoth M.W., Bulimo W.D., Lünsdorf H., Abraham W.R., Dion M., Timmis K.N., Golyshin P.N. and Mulaa F.J. (2009) A
salt lake extremophile, Paracoccus bogoriensis sp. nov., efficiently produces xan-
thophyll carotenoids. Afr. J. Microbiol. Res. 3, 426-433.
References
!180
Otte S., Kuenen J.G., Nielsen L.P., Paerl H.W., Zopfi J., Schulz H.N., Teske, A., Strotmann B., Gallardo V.A. and Jorgensen B.B. (1999). Nitrogen, carbon, and
sulfur metabolism in natural Thioploca samples. Appl. Environ. Microbiol. 65,
3148-3157.
Parker D.L., Rai L.C., Mallick N., Rai P.K. and Kumar H.D. (1998) Effects of cellular
metabolism and viability on metal ion accumulation by cultured biomass from a
bloom of the cyanobacterium microcystis aeruginosa. Appl. Environ. Microbiol.
64, 1545-1547.
Pereira S., Micheletti E., Zille A., Santos A., Moradas-Ferreira P., Tamagnini P. and De Philippis R. (2011) Using extracellular polymeric substances (EPS)-producing
cyanobacteria for the bioremediation of heavy metals: do cations compete for the
EPS functional groups and also accumulate inside the cell? Microbiology 157, 451-
458.
Petroff A.P., Sim M.S., Maslov A., Krupenin M., Rothman D. H., and Bosak T. (2010) Biophysical basis for the geometry of conical stromatolites. PNAS 107,
9956-9961.
Pettersson A., Kunst L., Bergman B. and Roomans G. M. (1985) Accumulation of
aluminum by Anabaena cylindrica into polyphosphate granules and cell walls: An
x-ray energy-dispersive microanalysis study. J. Gen. Micro. 131, 2545-2548.
Peverly J. H., Adamec H. and Parthasarathy M. V. (1978) Association of potassium
and some other monovalent cations with occurrence of polyphosphate bodies in
Chlorella pyrenoidosa. Plant. Physiol. 62, 120-126.
Pfennig N. and Trüper H.G. (1992) The family of Chromatiaceae. In: Balows A.,
Trüper H.G., Dworkin M., Harder W. and Schleifer K.H. (Eds.), The prokaryotes,
2nd edn. Springer-Verlag, Berlin, pp. 3200-3221.
Pradhan S. and Rai L.C. (2001) Biotechnological potential of Microcystis sp. in Cu, Zn
and Cd biosorption from single and multimetallic systems. Biometals. 14, 67-74.
Radwan S.S. and Sorkhoh N.A. (1993) Lipids of n-alkanes ultilizing microorganisms
and their application potential. Adv. Appl. Microbiol. 39, 29-90.
References
!181
Raguzzi F., Lesuisse, E. and Crichton, R. R. (1988) Iron storage in Saccharomyces cere-
visiae. FEBS Lett. 231, 253-258.
Ramos L., Fernández M.A., González M.J. and Hernández L.M. (1999) Heavy metal
pollution in water, sediments, and earthworms from the Ebro River, Spain. Bull.
Environ. Contam. Toxicol. 63, 305-311.
Ranjard L., Lignier L. and Chaussod R. (2006) Cumulative effects of short-term
polymetal contamination on soil bacterial community structure. Applied and En-
viron. Microbiol. 72, 1684-1687.
Rasband W.S. (1997-2010) ImageJ. US National Institutes of Health, Bethesda, MD,
USA. http://rsb.info.nih.gov/ij
Reynolds E.S. (1963) The use of lead citrate at high pH as an electron-opaque stain in
electron microscopy. J. Cell Biol. 17, 208-212
Rippka R., Deruelles J., Waterbury J.B., Herdman M. and Stanier, R.Y. (1979) Gener-
ic assignments, strain histories and properties of pure cultures of cyanobacteria. J.
Gen. Microbiol. 111, 1-61.
Roane T.M. and Pepper I.L. (2000) Microorganisms and metal pollutants, In: Maier
R.M., Pepper I.L. and Gerba C.P. (Eds.), Environmental Microbiology, Academic
Press, New York, pp. 403-423.
Roldán M., Thomas F., Castel S., Quesada A. and Hernández-Mariné M. (2004) Non-
invasive pigment identification in single cells from living phototrophic biofilms by
confocal imaging spectrofluorometry. Appl. Environ. Microbiol. 70, 3745-3750.
Roy S., Ghosh A.N. and Thakur A.R. (2008) Uptake of Pb(2+) by a cyanobacterium
belonging to the genus Synechocystis, isolated from East Kolkata Wetlands. Bio-
metals. 21, 515-524.
Saitou N. and Nei M. (1987) The neighbor-joining method: a new method for recon-
structing phylogenetic trees. Mol. Biol. Evol. 4, 406-425.
Sánchez O., Diestra E., Esteve I. and Mas J. (2005) Molecular characterization of an
oil-degrading cyanobacterial consortium. Microb. Ecol. 50, 580-588.
References
!182
Sánchez-Chardi A., Lopez-Fuster M.J. and Nadal J. (2007) Bioaccumulation of lead,
mercury, and cadmium in the greater white-toothed shrew, Crocidura russula,
from the Ebro Delta (NE Spain): sex- and age-dependent variation. Environ. Pol-
lut. 145, 7-14.
Say R., Yılmazb N. and Denizlic A. (2003) Biosorption of cadmium, lead, mercury, and
arsenic ions by the fungus Penicillium purpurogenum. Separ. Sci. Technol. 38,
2039-2053.
Schiewer S. and Volesky B. (2000) Biosorption processes for heavy metal removal. In:
Lovley D.R (Eds.), Environmental microbe-metal interactions. ASM Press, Wash-
ingon, D.C. USA, pp. 329-362.
Schlebusch M. and Forchhammer K. (2010) Requirement of the nitrogen starvation-
induced protein Sll0783 for polyhydroxybutyrate accumulation in Synechocystis sp.
strain PCC 6803. Appl. Environ. Microbiol. 76, 6101-6107.
Sicko L.M. (1972) Structural variation of polyphosphate bodies in blue-green algae. In:
Arceneaux J. (Eds.), Ann. Proc. Electron. Micros. Soc. Amer. Los Angeles, Califor-
nia, pp. 218-219.
Sims G.K., Sommers L.E. and Konopka A. (1986) Degradation of pyridine by Micro-
coccus luteus isolated from soil. Appl. Environ. Microbiol. 5, 963-968.
Solé A., Gaju N. and Esteve I., (2003) The biomass dynamics of cyanobacteria in an
annual cycle determined by confocal laser scanning microscopy. Scanning. 1, 1-7.
Solé A., Mas J. and Esteve I. (2007) A new method based on image analysis for deter-
mining cyanobacterial biomass by CLSM in stratified benthic sediments. Ultrami-
croscopy. 107, 669-673.
Solé A., Diestra E. and Esteve I. (2009) Confocal laser scanning microscopy image
analysis for cyanobacterial biomass determined at microscale level in different mi-
crobial mats. Microb. Ecol. 57, 649-656.
Solisio C., Lodi A., Torre P., Converti A. and Del Borghi M. (2006) Copper removal
by dry and re-hydrated biomass of Spirulina platensis. Bioresour. Technol. 97,
1756-1760.
References
!183
Srinandana C.S., Jadava V., Cecilia D. and Nerurkara A.S. (2010) Nutrients determine
the spatial architecture of Paracoccus sp. biofilm. Biofouling. 26, 449–459.
Stal L.J. (2000) Cyanobacterial mats and stromatolites In: Whitton B.A. and Potts M.
(Eds.), The ecology of cyanobacteria. Kluwer Academic Publishers, Dordrecht, The
Netherlands, pp. 61-120.
Stevens Jr S.E., Nierzwicki-Bauer S.A. and Balkwill D.L. (1985) Effect of nitrogen
starvation on the morphology and ultrastructure of the cyanobacterium Mastigo-
cladus laminosus. J. Bacteriol. 161, 1215-1218.
Surosz W. and Palinska K.A. (2004) Effects of heavy-metal stress on cyanobacterium
Anabaena flos-aquae. Arch. Environ. Contam. Toxicol. 48, 40-48.
Takeuchi M., Weiss N., Schumann P. and Yokota A. (1996) Leucobacter komagatae
gen. nov., sp. nov., a new aerobic gram-positive, nonsporulating rod with 2,4-
diaminobutyric acid in the cell wall. Int. J. Syst. Bacteriol. 46, 967-971.
Tallur P.N., Megadi V.B. and Ninnekar H.Z. (2008) Biodegradation of cypermethrin
by Micrococcus sp. strain CPN 1. Biodegradation. 19, 77-82.
Teitzel G.M. and Parsek M.R. (2003) Heavy metal resistance of biofilm and planktonic
Pseudomonas aeruginosa. Appl. Environ. Microbiol. 69, 2313-2320.
Tien C.J. (2002) Biosorption of metal ions by freshwater algae with different surface
characteristics. Process. Biochem. 38, 605-613.
Tien C.J. (2005) Copper adsorption kinetics of cultured algal cells and freshwater phy-
toplankton with emphasis on cell surface characteristics. J. Appl. Phycol. 17, 379-
389.
Toes A.C.M, Finke N., Kuenen J.G. and Muyzer G. (2008) Effects of deposition of
heavy-metal-polluted harbor mud on microbial diversity and metal resistance in
sandy marine sediments. Arch. Environ. Contam. Toxicol. 55, 372-385.
Tunali S., Çabu A. and Akar T. (2006) Removal of lead and copper ions from aqueous
solutions by bacterial strain isolated from soil. Chem. Eng. J. 115, 203-211.
References
!184
Valls M. and de Lorenzo V. (2002) Exploiting the genetic and biochemical capacities of
bacteria for the remediation of heavy metal pollution. FEMS Microbiol. Rev. 26,
327-338.
Vijayaraghavan K. and Yun YS. (2008) Bacterial biosorbents and biosorption. Biotech-
nol. Adv. 26, 266–291.
Vílchez R., Gómez-Silván C., Purswani J., González-López J. and Rodelas B. (2011)
Characterization of bacterial communities exposed to Cr(III) and Pb(II) in sub-
merged fixed-bed biofilms for groundwater treatment. Ecotoxicology. 20, 779-792.
Vu B., Chen M., Crawford R.J. and Ivanova E.P. (2009) Bacterial extracellular polysac-
charides involved in biofilm formation. Molecules. 14, 2535-2554.
Wang J., and Chen C. (2009) Biosorbents for heavy metals removal and their future.
Biotechnol. Adv. 27, 195–226.
Wang Y.C. (2005) Study on kinetics of alcohol fermentation on the basis of the biomass
specific growth rate. Liq. Sci. Technol. 9, 48-51.
Watanabe, Y., Martini, J.E.J. and Ohmoto, H. (2000) Geochemical evidence for terres-
trial ecosystems 2.6 billion years ago. Nature 408, 574–578.
Wei G., Fan L., Zhu W., Fu Y., Yu J. and Tang M. (2009) Isolation and characteriza-
tion of the heavy metal resistant bacteria CCNWRS33-2 isolated from root nodule
of Lespedeza cuneata in gold mine tailings in China. J. Hazard. Mater. 162, 50-56.
Wieland A., Kuhl M,. McGowan L., Fourçans A., Duran R., Caumette P., García de Oteyza T., Grimalt J.O., Solé A., Diestra E., Esteve I. and Herbert, R.A. 2003.
Microbial mats on the Orkney Islands revisited: microenvironment and microbial
community composition. Microb. Ecol. 46, 371-390.
Zhang H., Kallimanis A, Koukkou A.I. and Drainas C. (2004) Isolation and character-
ization of novel bacteria degrading polycyclic aromatic hydrocarbons from pollut-
ed Greek soils. Appl. Microbiol. Biotechnol. 65, 124-131.
Zhuang W.Q., Tay J.H., Maszenan A.M., Krumholz L.R. and Tay S.T. (2003) Im-
portance of Gram-positive naphthalene-degrading bacteria in oil-contaminated
tropical marine sediments. Lett. Appl. Microbiol. 36, 251-257.
References
!185
Ziagova M., Dimitriadis G., Aslanidou D., Papaioannou X., Litopoulou Tzannetaki E. and Liakopoulou-Kyriakides M., (2007) Comparative study of Cd(II) and
Cr(VI) biosorption on Staphylococcus xylosus and Pseudomonas sp. in single and
binary mixtures. Bioresour. Technol. 98, 2859-2865.
!!!!!!!!!!!!!!!!!!!!!!!!

!

!
Annex I !!

!
!!!!!!!!!!!!!!!!!!!!!!!!!!!!!!!!!!!!!!!!!!!
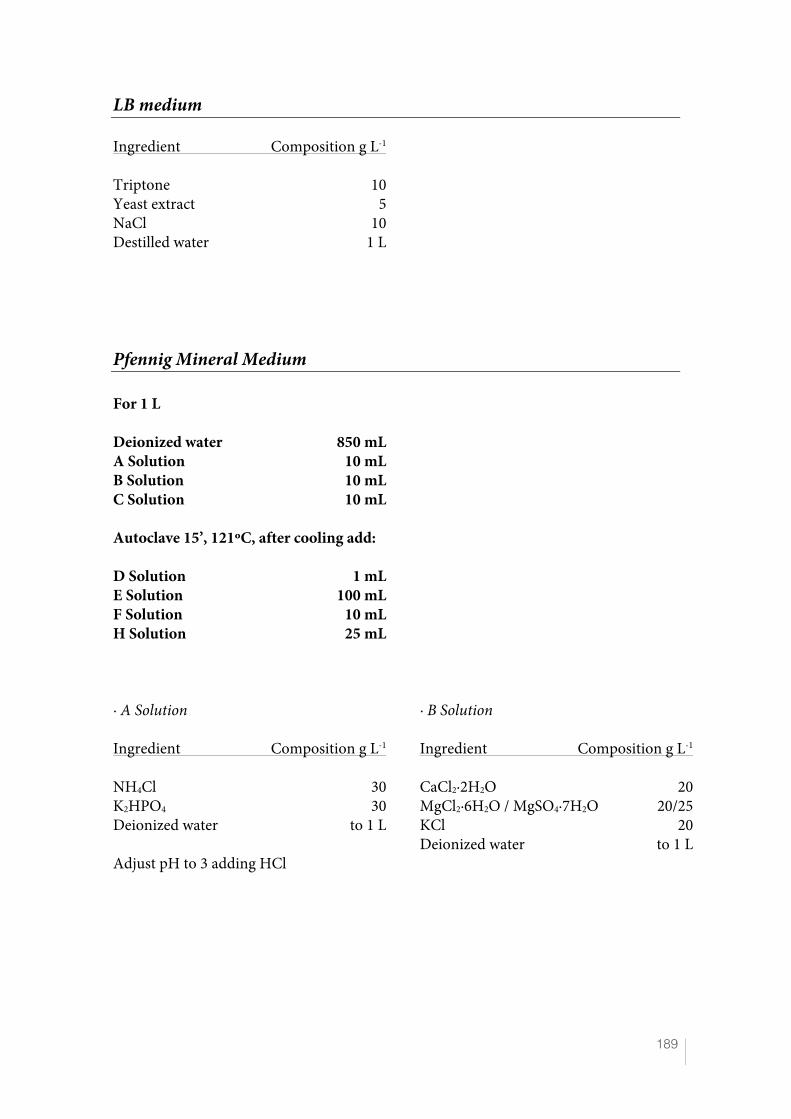
!
!189
LB medium Ingredient Composition g L-1
Triptone 10 Yeast extract 5 NaCl 10 Destilled water 1 L
Pfennig Mineral Medium For 1 L Deionized water 850 mL A Solution 10 mL B Solution 10 mL C Solution 10 mL Autoclave 15’, 121ºC, after cooling add: D Solution 1 mL E Solution 100 mL F Solution 10 mL H Solution 25 mL · A Solution Ingredient Composition g L-1
NH4Cl 30 K2HPO4 30 Deionized water to 1 L Adjust pH to 3 adding HCl
· B Solution Ingredient Composition g L-1
CaCl2·2H2O 20 MgCl2·6H2O / MgSO4·7H2O 20/25 KCl 20 Deionized water to 1 L
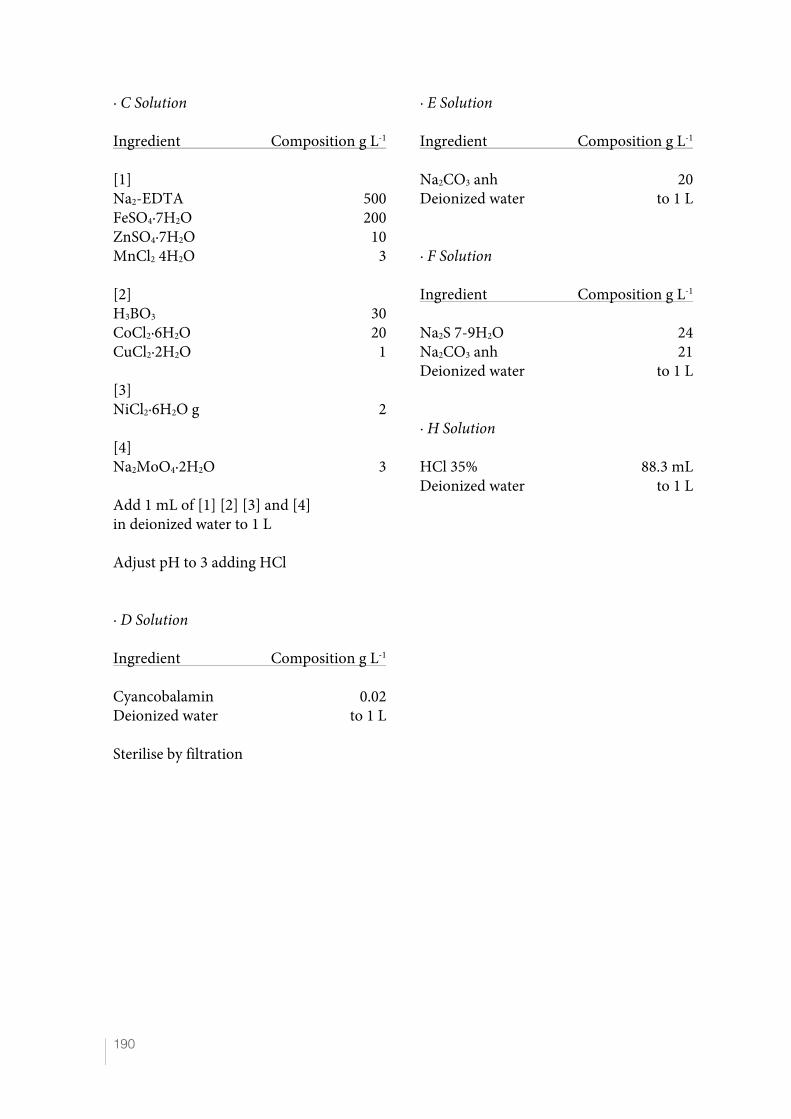
!
!190
· C Solution Ingredient Composition g L-1
[1] Na2-EDTA 500 FeSO4·7H2O 200 ZnSO4·7H2O 10 MnCl2 4H2O 3 [2] H3BO3 30 CoCl2·6H2O 20 CuCl2·2H2O 1 [3] NiCl2·6H2O g 2 [4] Na2MoO4·2H2O 3 Add 1 mL of [1] [2] [3] and [4] in deionized water to 1 L Adjust pH to 3 adding HCl · D Solution Ingredient Composition g L-1
Cyancobalamin 0.02 Deionized water to 1 L Sterilise by filtration
· E Solution Ingredient Composition g L-1
Na2CO3 anh 20 Deionized water to 1 L · F Solution Ingredient Composition g L-1
Na2S 7-9H2O 24 Na2CO3 anh 21 Deionized water to 1 L · H Solution HCl 35% 88.3 mL Deionized water to 1 L
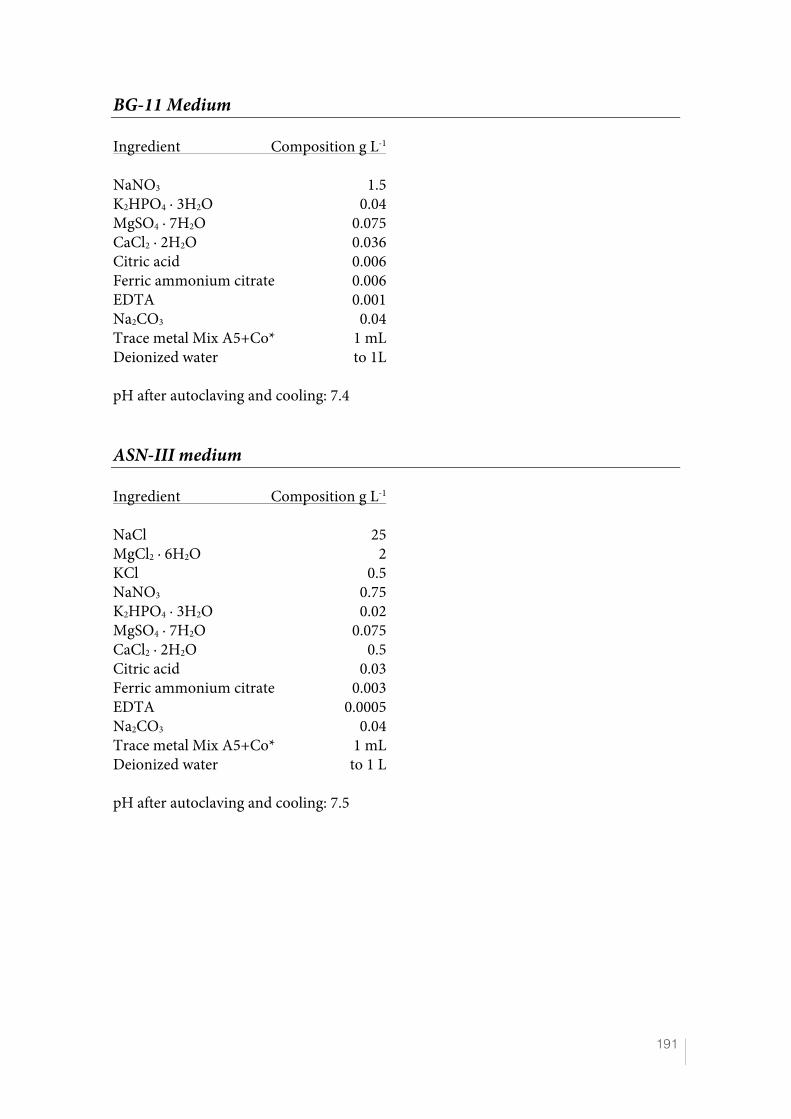
!
!191
BG-11 Medium Ingredient Composition g L-1 NaNO3 1.5 K2HPO4 · 3H2O 0.04 MgSO4 · 7H2O 0.075 CaCl2 · 2H2O 0.036 Citric acid 0.006 Ferric ammonium citrate 0.006 EDTA 0.001 Na2CO3 0.04 Trace metal Mix A5+Co* 1 mL Deionized water to 1L pH after autoclaving and cooling: 7.4 ASN-III medium Ingredient Composition g L-1 NaCl 25 MgCl2 · 6H2O 2 KCl 0.5 NaNO3 0.75 K2HPO4 · 3H2O 0.02 MgSO4 · 7H2O 0.075 CaCl2 · 2H2O 0.5 Citric acid 0.03 Ferric ammonium citrate 0.003 EDTA 0.0005 Na2CO3 0.04 Trace metal Mix A5+Co* 1 mL Deionized water to 1 L pH after autoclaving and cooling: 7.5
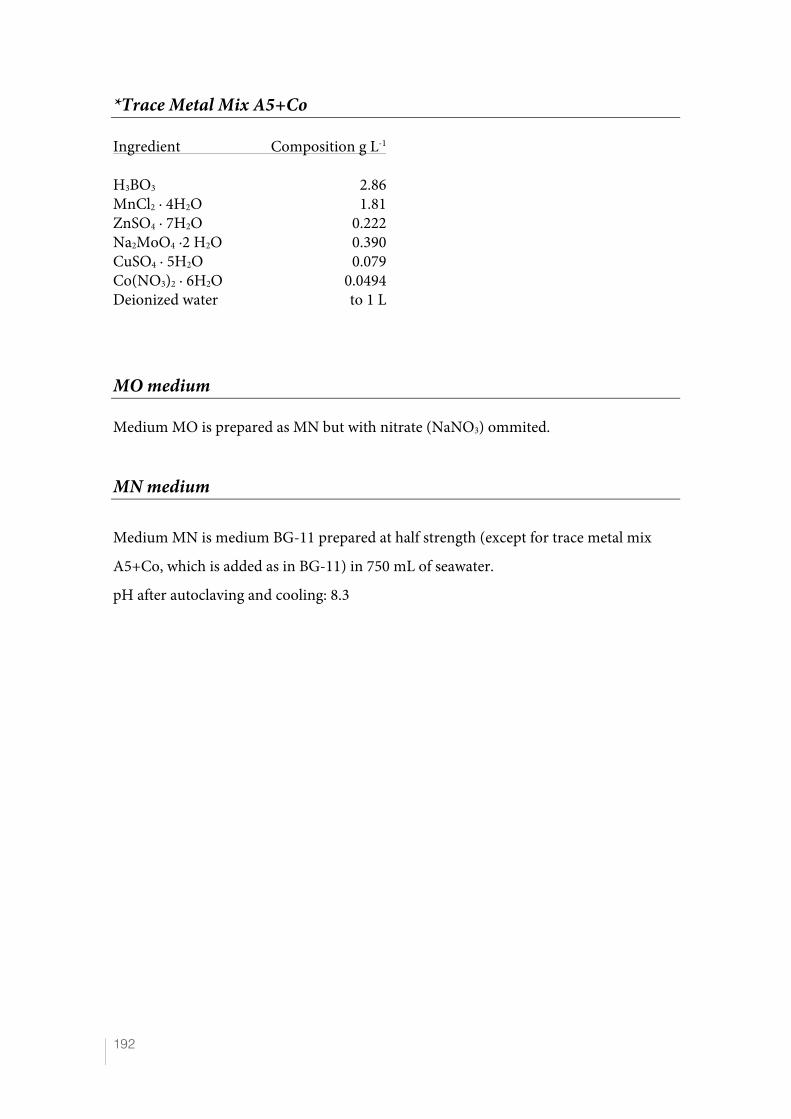
!
!192
*Trace Metal Mix A5+Co Ingredient Composition g L-1 H3BO3 2.86 MnCl2 · 4H2O 1.81 ZnSO4 · 7H2O 0.222 Na2MoO4 ·2 H2O 0.390 CuSO4 · 5H2O 0.079 Co(NO3)2 · 6H2O 0.0494 Deionized water to 1 L
MO medium Medium MO is prepared as MN but with nitrate (NaNO3) ommited.
MN medium
Medium MN is medium BG-11 prepared at half strength (except for trace metal mix
A5+Co, which is added as in BG-11) in 750 mL of seawater.
pH after autoclaving and cooling: 8.3
!!!!!!!!!!!!!

!
!
!!!!!!!!!!!!!!!!!!!!!!!!!!!!!!!!!!!!!!!!!!!!!
Annex II
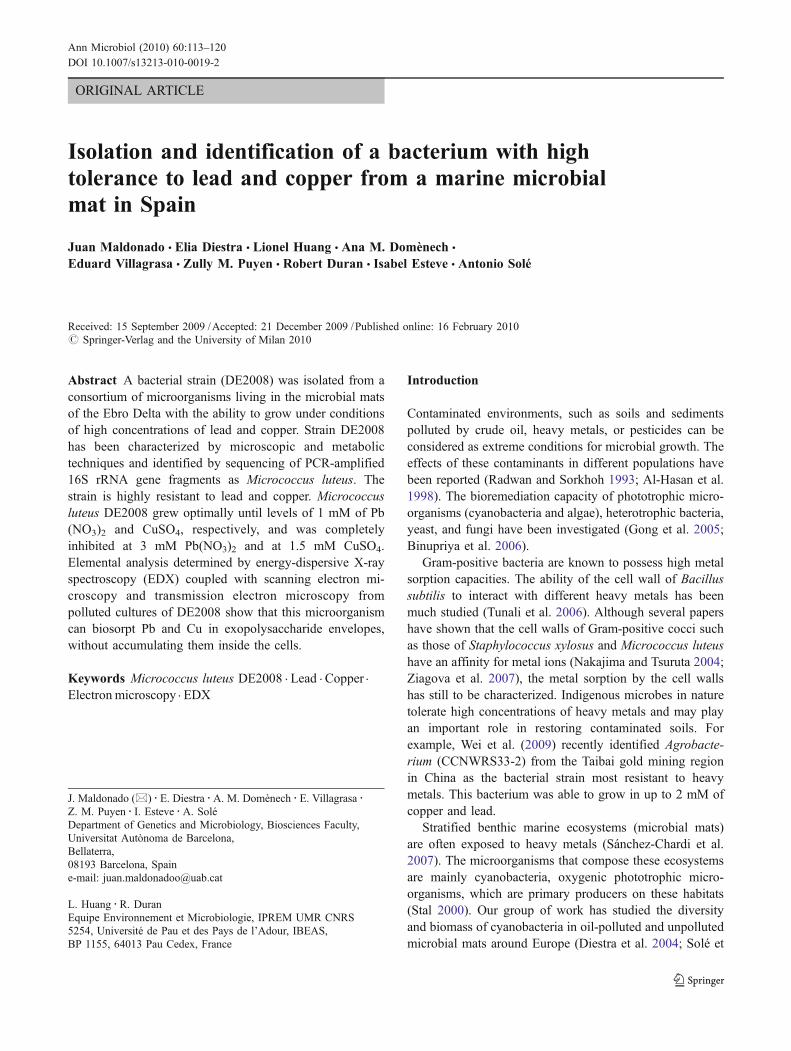
ORIGINAL ARTICLE
Isolation and identification of a bacterium with hightolerance to lead and copper from a marine microbialmat in Spain
Juan Maldonado & Elia Diestra & Lionel Huang & Ana M. Domènech &
Eduard Villagrasa & Zully M. Puyen & Robert Duran & Isabel Esteve & Antonio Solé
Received: 15 September 2009 /Accepted: 21 December 2009 /Published online: 16 February 2010# Springer-Verlag and the University of Milan 2010
Abstract A bacterial strain (DE2008) was isolated from aconsortium of microorganisms living in the microbial matsof the Ebro Delta with the ability to grow under conditionsof high concentrations of lead and copper. Strain DE2008has been characterized by microscopic and metabolictechniques and identified by sequencing of PCR-amplified16S rRNA gene fragments as Micrococcus luteus. Thestrain is highly resistant to lead and copper. Micrococcusluteus DE2008 grew optimally until levels of 1 mM of Pb(NO3)2 and CuSO4, respectively, and was completelyinhibited at 3 mM Pb(NO3)2 and at 1.5 mM CuSO4.Elemental analysis determined by energy-dispersive X-rayspectroscopy (EDX) coupled with scanning electron mi-croscopy and transmission electron microscopy frompolluted cultures of DE2008 show that this microorganismcan biosorpt Pb and Cu in exopolysaccharide envelopes,without accumulating them inside the cells.
Keywords Micrococcus luteus DE2008 . Lead . Copper .
Electron microscopy . EDX
Introduction
Contaminated environments, such as soils and sedimentspolluted by crude oil, heavy metals, or pesticides can beconsidered as extreme conditions for microbial growth. Theeffects of these contaminants in different populations havebeen reported (Radwan and Sorkhoh 1993; Al-Hasan et al.1998). The bioremediation capacity of phototrophic micro-organisms (cyanobacteria and algae), heterotrophic bacteria,yeast, and fungi have been investigated (Gong et al. 2005;Binupriya et al. 2006).
Gram-positive bacteria are known to possess high metalsorption capacities. The ability of the cell wall of Bacillussubtilis to interact with different heavy metals has beenmuch studied (Tunali et al. 2006). Although several papershave shown that the cell walls of Gram-positive cocci suchas those of Staphylococcus xylosus and Micrococcus luteushave an affinity for metal ions (Nakajima and Tsuruta 2004;Ziagova et al. 2007), the metal sorption by the cell wallshas still to be characterized. Indigenous microbes in naturetolerate high concentrations of heavy metals and may playan important role in restoring contaminated soils. Forexample, Wei et al. (2009) recently identified Agrobacte-rium (CCNWRS33-2) from the Taibai gold mining regionin China as the bacterial strain most resistant to heavymetals. This bacterium was able to grow in up to 2 mM ofcopper and lead.
Stratified benthic marine ecosystems (microbial mats)are often exposed to heavy metals (Sánchez-Chardi et al.2007). The microorganisms that compose these ecosystemsare mainly cyanobacteria, oxygenic phototrophic micro-organisms, which are primary producers on these habitats(Stal 2000). Our group of work has studied the diversityand biomass of cyanobacteria in oil-polluted and unpollutedmicrobial mats around Europe (Diestra et al. 2004; Solé et
J. Maldonado (*) : E. Diestra :A. M. Domènech : E. Villagrasa :Z. M. Puyen : I. Esteve :A. SoléDepartment of Genetics and Microbiology, Biosciences Faculty,Universitat Autònoma de Barcelona,Bellaterra,08193 Barcelona, Spaine-mail: [email protected]
L. Huang :R. DuranEquipe Environnement et Microbiologie, IPREM UMR CNRS5254, Université de Pau et des Pays de l’Adour, IBEAS,BP 1155, 64013 Pau Cedex, France
Ann Microbiol (2010) 60:113–120DOI 10.1007/s13213-010-0019-2
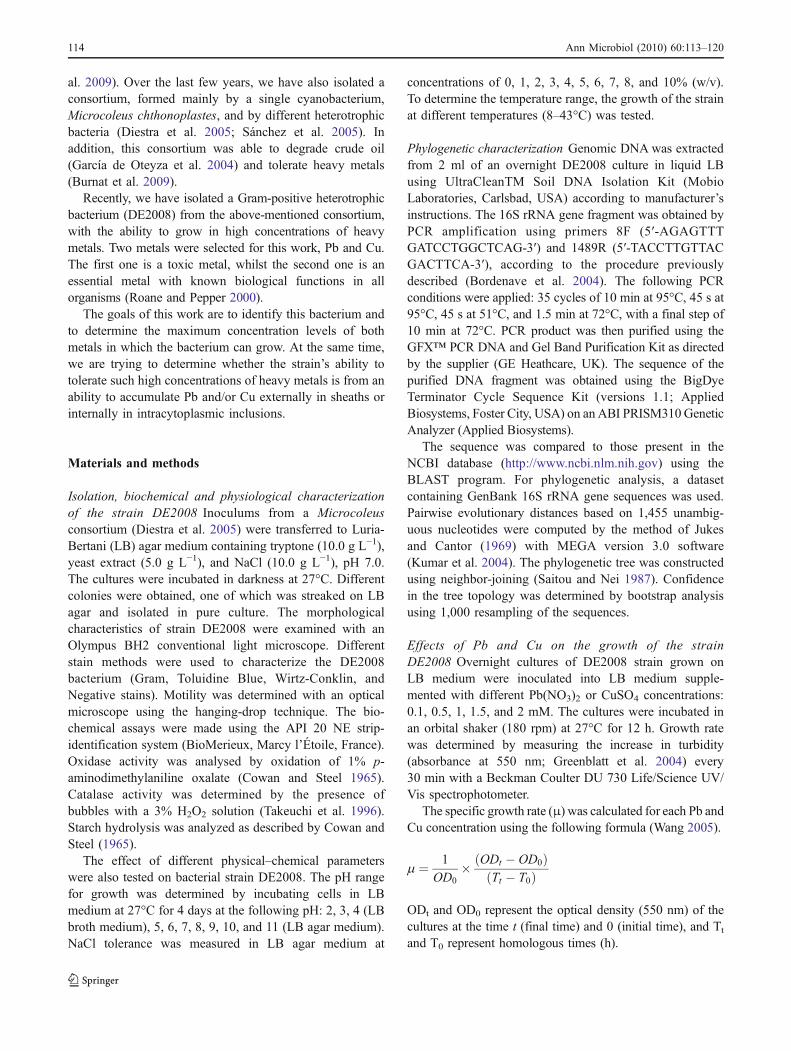
al. 2009). Over the last few years, we have also isolated aconsortium, formed mainly by a single cyanobacterium,Microcoleus chthonoplastes, and by different heterotrophicbacteria (Diestra et al. 2005; Sánchez et al. 2005). Inaddition, this consortium was able to degrade crude oil(García de Oteyza et al. 2004) and tolerate heavy metals(Burnat et al. 2009).
Recently, we have isolated a Gram-positive heterotrophicbacterium (DE2008) from the above-mentioned consortium,with the ability to grow in high concentrations of heavymetals. Two metals were selected for this work, Pb and Cu.The first one is a toxic metal, whilst the second one is anessential metal with known biological functions in allorganisms (Roane and Pepper 2000).
The goals of this work are to identify this bacterium andto determine the maximum concentration levels of bothmetals in which the bacterium can grow. At the same time,we are trying to determine whether the strain’s ability totolerate such high concentrations of heavy metals is from anability to accumulate Pb and/or Cu externally in sheaths orinternally in intracytoplasmic inclusions.
Materials and methods
Isolation, biochemical and physiological characterizationof the strain DE2008 Inoculums from a Microcoleusconsortium (Diestra et al. 2005) were transferred to Luria-Bertani (LB) agar medium containing tryptone (10.0 g L!1),yeast extract (5.0 g L!1), and NaCl (10.0 g L!1), pH 7.0.The cultures were incubated in darkness at 27°C. Differentcolonies were obtained, one of which was streaked on LBagar and isolated in pure culture. The morphologicalcharacteristics of strain DE2008 were examined with anOlympus BH2 conventional light microscope. Differentstain methods were used to characterize the DE2008bacterium (Gram, Toluidine Blue, Wirtz-Conklin, andNegative stains). Motility was determined with an opticalmicroscope using the hanging-drop technique. The bio-chemical assays were made using the API 20 NE strip-identification system (BioMerieux, Marcy l’Étoile, France).Oxidase activity was analysed by oxidation of 1% p-aminodimethylaniline oxalate (Cowan and Steel 1965).Catalase activity was determined by the presence ofbubbles with a 3% H2O2 solution (Takeuchi et al. 1996).Starch hydrolysis was analyzed as described by Cowan andSteel (1965).
The effect of different physical–chemical parameterswere also tested on bacterial strain DE2008. The pH rangefor growth was determined by incubating cells in LBmedium at 27°C for 4 days at the following pH: 2, 3, 4 (LBbroth medium), 5, 6, 7, 8, 9, 10, and 11 (LB agar medium).NaCl tolerance was measured in LB agar medium at
concentrations of 0, 1, 2, 3, 4, 5, 6, 7, 8, and 10% (w/v).To determine the temperature range, the growth of the strainat different temperatures (8–43°C) was tested.
Phylogenetic characterization Genomic DNA was extractedfrom 2 ml of an overnight DE2008 culture in liquid LBusing UltraCleanTM Soil DNA Isolation Kit (MobioLaboratories, Carlsbad, USA) according to manufacturer’sinstructions. The 16S rRNA gene fragment was obtained byPCR amplification using primers 8F (5!-AGAGTTTGATCCTGGCTCAG-3!) and 1489R (5!-TACCTTGTTACGACTTCA-3!), according to the procedure previouslydescribed (Bordenave et al. 2004). The following PCRconditions were applied: 35 cycles of 10 min at 95°C, 45 s at95°C, 45 s at 51°C, and 1.5 min at 72°C, with a final step of10 min at 72°C. PCR product was then purified using theGFX™ PCR DNA and Gel Band Purification Kit as directedby the supplier (GE Heathcare, UK). The sequence of thepurified DNA fragment was obtained using the BigDyeTerminator Cycle Sequence Kit (versions 1.1; AppliedBiosystems, Foster City, USA) on an ABI PRISM310GeneticAnalyzer (Applied Biosystems).
The sequence was compared to those present in theNCBI database (http://www.ncbi.nlm.nih.gov) using theBLAST program. For phylogenetic analysis, a datasetcontaining GenBank 16S rRNA gene sequences was used.Pairwise evolutionary distances based on 1,455 unambig-uous nucleotides were computed by the method of Jukesand Cantor (1969) with MEGA version 3.0 software(Kumar et al. 2004). The phylogenetic tree was constructedusing neighbor-joining (Saitou and Nei 1987). Confidencein the tree topology was determined by bootstrap analysisusing 1,000 resampling of the sequences.
Effects of Pb and Cu on the growth of the strainDE2008 Overnight cultures of DE2008 strain grown onLB medium were inoculated into LB medium supple-mented with different Pb(NO3)2 or CuSO4 concentrations:0.1, 0.5, 1, 1.5, and 2 mM. The cultures were incubated inan orbital shaker (180 rpm) at 27°C for 12 h. Growth ratewas determined by measuring the increase in turbidity(absorbance at 550 nm; Greenblatt et al. 2004) every30 min with a Beckman Coulter DU 730 Life/Science UV/Vis spectrophotometer.
The specific growth rate (μ) was calculated for each Pb andCu concentration using the following formula (Wang 2005).
m ! 1OD0
" ODt # OD0$ %Tt # T0$ %
ODt and OD0 represent the optical density (550 nm) of thecultures at the time t (final time) and 0 (initial time), and Tt
and T0 represent homologous times (h).
114 Ann Microbiol (2010) 60:113–120
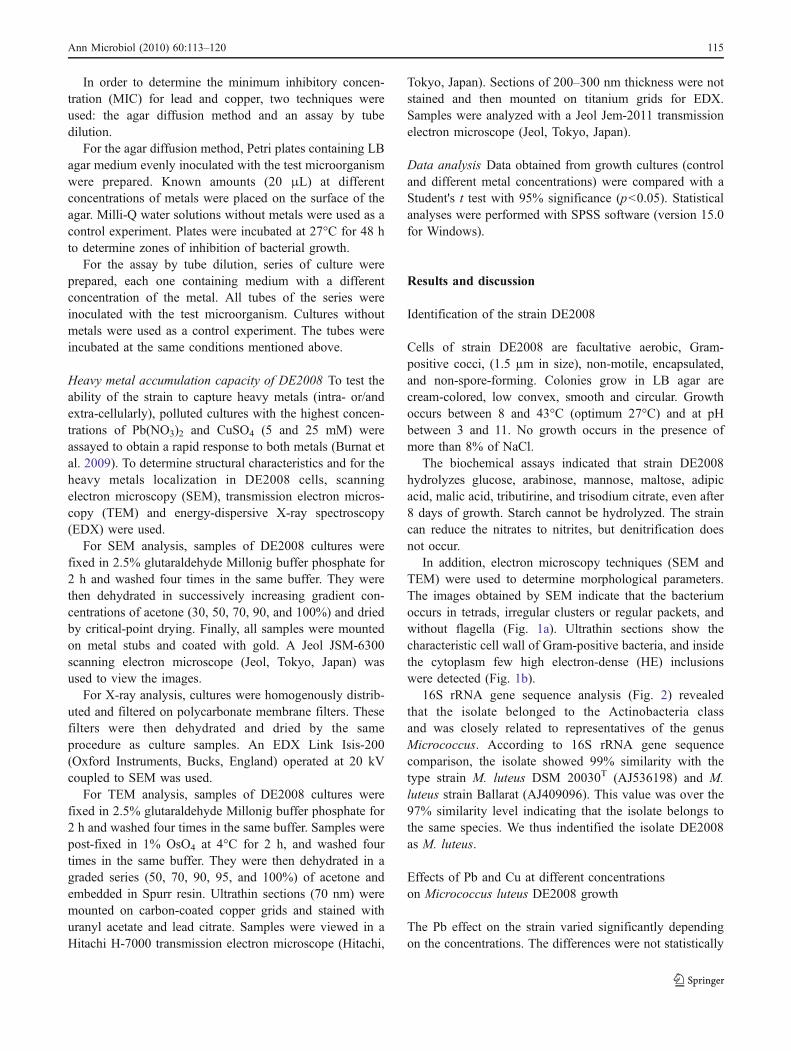
In order to determine the minimum inhibitory concen-tration (MIC) for lead and copper, two techniques wereused: the agar diffusion method and an assay by tubedilution.
For the agar diffusion method, Petri plates containing LBagar medium evenly inoculated with the test microorganismwere prepared. Known amounts (20 μL) at differentconcentrations of metals were placed on the surface of theagar. Milli-Q water solutions without metals were used as acontrol experiment. Plates were incubated at 27°C for 48 hto determine zones of inhibition of bacterial growth.
For the assay by tube dilution, series of culture wereprepared, each one containing medium with a differentconcentration of the metal. All tubes of the series wereinoculated with the test microorganism. Cultures withoutmetals were used as a control experiment. The tubes wereincubated at the same conditions mentioned above.
Heavy metal accumulation capacity of DE2008 To test theability of the strain to capture heavy metals (intra- or/andextra-cellularly), polluted cultures with the highest concen-trations of Pb(NO3)2 and CuSO4 (5 and 25 mM) wereassayed to obtain a rapid response to both metals (Burnat etal. 2009). To determine structural characteristics and for theheavy metals localization in DE2008 cells, scanningelectron microscopy (SEM), transmission electron micros-copy (TEM) and energy-dispersive X-ray spectroscopy(EDX) were used.
For SEM analysis, samples of DE2008 cultures werefixed in 2.5% glutaraldehyde Millonig buffer phosphate for2 h and washed four times in the same buffer. They werethen dehydrated in successively increasing gradient con-centrations of acetone (30, 50, 70, 90, and 100%) and driedby critical-point drying. Finally, all samples were mountedon metal stubs and coated with gold. A Jeol JSM-6300scanning electron microscope (Jeol, Tokyo, Japan) wasused to view the images.
For X-ray analysis, cultures were homogenously distrib-uted and filtered on polycarbonate membrane filters. Thesefilters were then dehydrated and dried by the sameprocedure as culture samples. An EDX Link Isis-200(Oxford Instruments, Bucks, England) operated at 20 kVcoupled to SEM was used.
For TEM analysis, samples of DE2008 cultures werefixed in 2.5% glutaraldehyde Millonig buffer phosphate for2 h and washed four times in the same buffer. Samples werepost-fixed in 1% OsO4 at 4°C for 2 h, and washed fourtimes in the same buffer. They were then dehydrated in agraded series (50, 70, 90, 95, and 100%) of acetone andembedded in Spurr resin. Ultrathin sections (70 nm) weremounted on carbon-coated copper grids and stained withuranyl acetate and lead citrate. Samples were viewed in aHitachi H-7000 transmission electron microscope (Hitachi,
Tokyo, Japan). Sections of 200–300 nm thickness were notstained and then mounted on titanium grids for EDX.Samples were analyzed with a Jeol Jem-2011 transmissionelectron microscope (Jeol, Tokyo, Japan).
Data analysis Data obtained from growth cultures (controland different metal concentrations) were compared with aStudent's t test with 95% significance (p<0.05). Statisticalanalyses were performed with SPSS software (version 15.0for Windows).
Results and discussion
Identification of the strain DE2008
Cells of strain DE2008 are facultative aerobic, Gram-positive cocci, (1.5 µm in size), non-motile, encapsulated,and non-spore-forming. Colonies grow in LB agar arecream-colored, low convex, smooth and circular. Growthoccurs between 8 and 43°C (optimum 27°C) and at pHbetween 3 and 11. No growth occurs in the presence ofmore than 8% of NaCl.
The biochemical assays indicated that strain DE2008hydrolyzes glucose, arabinose, mannose, maltose, adipicacid, malic acid, tributirine, and trisodium citrate, even after8 days of growth. Starch cannot be hydrolyzed. The straincan reduce the nitrates to nitrites, but denitrification doesnot occur.
In addition, electron microscopy techniques (SEM andTEM) were used to determine morphological parameters.The images obtained by SEM indicate that the bacteriumoccurs in tetrads, irregular clusters or regular packets, andwithout flagella (Fig. 1a). Ultrathin sections show thecharacteristic cell wall of Gram-positive bacteria, and insidethe cytoplasm few high electron-dense (HE) inclusionswere detected (Fig. 1b).
16S rRNA gene sequence analysis (Fig. 2) revealedthat the isolate belonged to the Actinobacteria classand was closely related to representatives of the genusMicrococcus. According to 16S rRNA gene sequencecomparison, the isolate showed 99% similarity with thetype strain M. luteus DSM 20030T (AJ536198) and M.luteus strain Ballarat (AJ409096). This value was over the97% similarity level indicating that the isolate belongs tothe same species. We thus indentified the isolate DE2008as M. luteus.
Effects of Pb and Cu at different concentrationson Micrococcus luteus DE2008 growth
The Pb effect on the strain varied significantly dependingon the concentrations. The differences were not statistically
Ann Microbiol (2010) 60:113–120 115
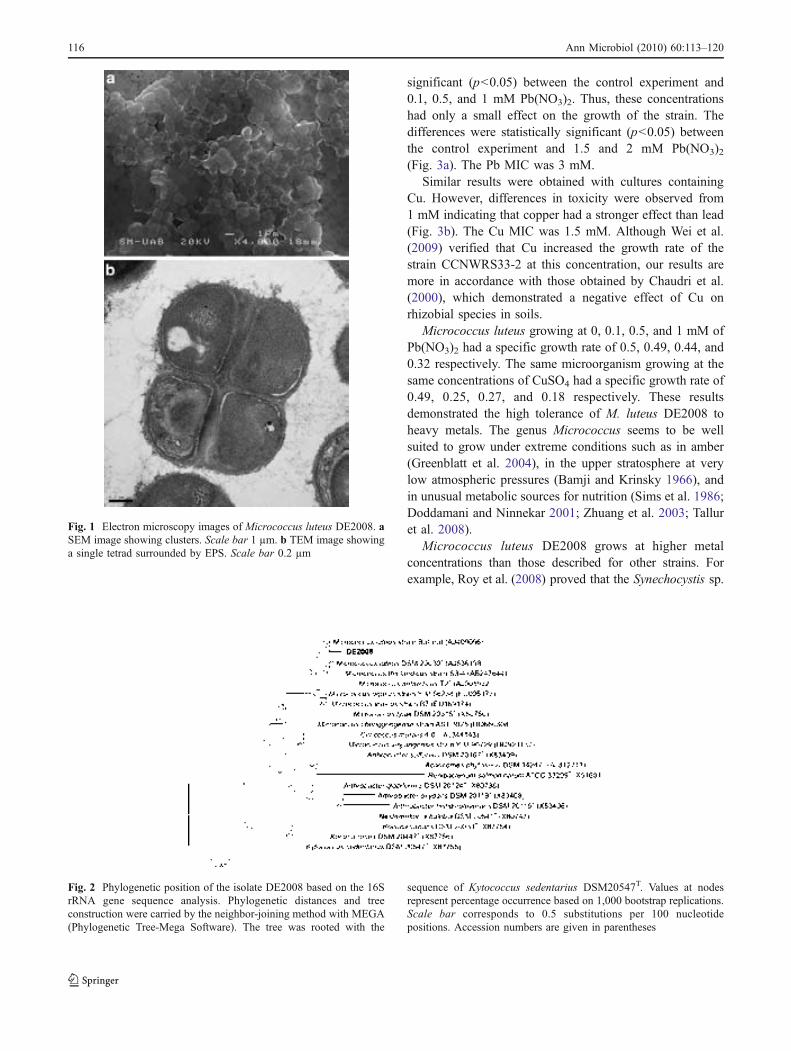
significant (p<0.05) between the control experiment and0.1, 0.5, and 1 mM Pb(NO3)2. Thus, these concentrationshad only a small effect on the growth of the strain. Thedifferences were statistically significant (p<0.05) betweenthe control experiment and 1.5 and 2 mM Pb(NO3)2(Fig. 3a). The Pb MIC was 3 mM.
Similar results were obtained with cultures containingCu. However, differences in toxicity were observed from1 mM indicating that copper had a stronger effect than lead(Fig. 3b). The Cu MIC was 1.5 mM. Although Wei et al.(2009) verified that Cu increased the growth rate of thestrain CCNWRS33-2 at this concentration, our results aremore in accordance with those obtained by Chaudri et al.(2000), which demonstrated a negative effect of Cu onrhizobial species in soils.
Micrococcus luteus growing at 0, 0.1, 0.5, and 1 mM ofPb(NO3)2 had a specific growth rate of 0.5, 0.49, 0.44, and0.32 respectively. The same microorganism growing at thesame concentrations of CuSO4 had a specific growth rate of0.49, 0.25, 0.27, and 0.18 respectively. These resultsdemonstrated the high tolerance of M. luteus DE2008 toheavy metals. The genus Micrococcus seems to be wellsuited to grow under extreme conditions such as in amber(Greenblatt et al. 2004), in the upper stratosphere at verylow atmospheric pressures (Bamji and Krinsky 1966), andin unusual metabolic sources for nutrition (Sims et al. 1986;Doddamani and Ninnekar 2001; Zhuang et al. 2003; Talluret al. 2008).
Micrococcus luteus DE2008 grows at higher metalconcentrations than those described for other strains. Forexample, Roy et al. (2008) proved that the Synechocystis sp.
Fig. 2 Phylogenetic position of the isolate DE2008 based on the 16SrRNA gene sequence analysis. Phylogenetic distances and treeconstruction were carried by the neighbor-joining method with MEGA(Phylogenetic Tree-Mega Software). The tree was rooted with the
sequence of Kytococcus sedentarius DSM20547T. Values at nodesrepresent percentage occurrence based on 1,000 bootstrap replications.Scale bar corresponds to 0.5 substitutions per 100 nucleotidepositions. Accession numbers are given in parentheses
Fig. 1 Electron microscopy images of Micrococcus luteus DE2008. aSEM image showing clusters. Scale bar 1 µm. b TEM image showinga single tetrad surrounded by EPS. Scale bar 0.2 µm
116 Ann Microbiol (2010) 60:113–120
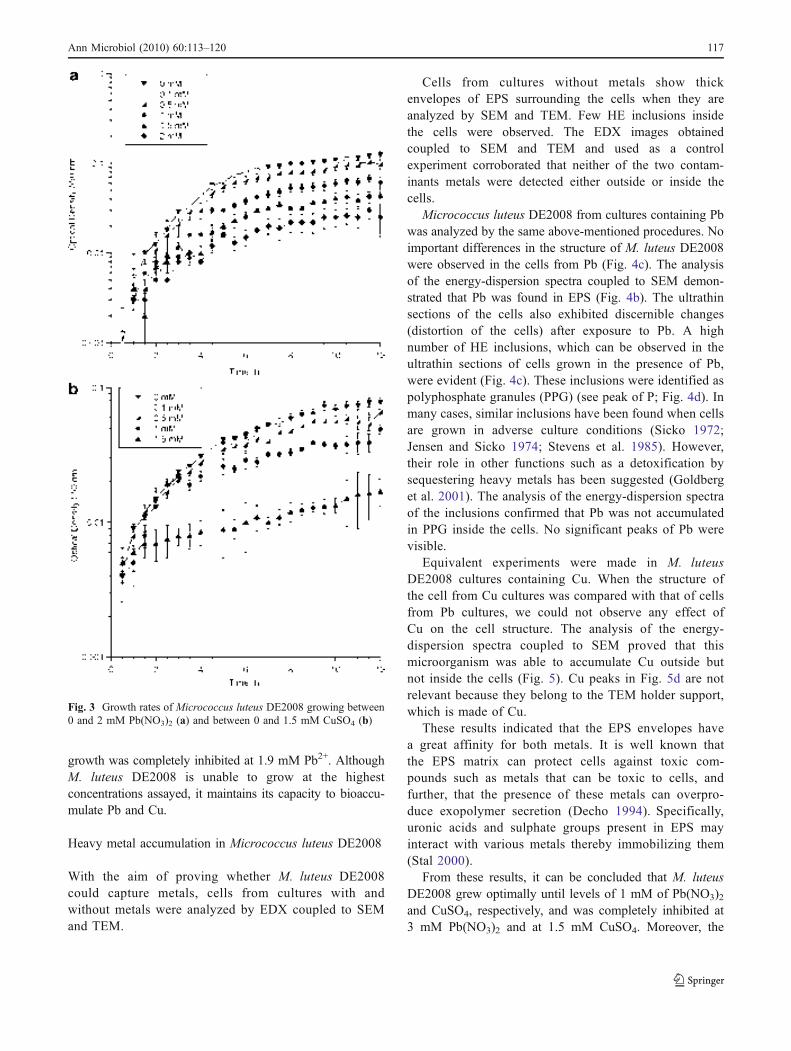
growth was completely inhibited at 1.9 mM Pb2+. AlthoughM. luteus DE2008 is unable to grow at the highestconcentrations assayed, it maintains its capacity to bioaccu-mulate Pb and Cu.
Heavy metal accumulation in Micrococcus luteus DE2008
With the aim of proving whether M. luteus DE2008could capture metals, cells from cultures with andwithout metals were analyzed by EDX coupled to SEMand TEM.
Cells from cultures without metals show thickenvelopes of EPS surrounding the cells when they areanalyzed by SEM and TEM. Few HE inclusions insidethe cells were observed. The EDX images obtainedcoupled to SEM and TEM and used as a controlexperiment corroborated that neither of the two contam-inants metals were detected either outside or inside thecells.
Micrococcus luteus DE2008 from cultures containing Pbwas analyzed by the same above-mentioned procedures. Noimportant differences in the structure of M. luteus DE2008were observed in the cells from Pb (Fig. 4c). The analysisof the energy-dispersion spectra coupled to SEM demon-strated that Pb was found in EPS (Fig. 4b). The ultrathinsections of the cells also exhibited discernible changes(distortion of the cells) after exposure to Pb. A highnumber of HE inclusions, which can be observed in theultrathin sections of cells grown in the presence of Pb,were evident (Fig. 4c). These inclusions were identified aspolyphosphate granules (PPG) (see peak of P; Fig. 4d). Inmany cases, similar inclusions have been found when cellsare grown in adverse culture conditions (Sicko 1972;Jensen and Sicko 1974; Stevens et al. 1985). However,their role in other functions such as a detoxification bysequestering heavy metals has been suggested (Goldberget al. 2001). The analysis of the energy-dispersion spectraof the inclusions confirmed that Pb was not accumulatedin PPG inside the cells. No significant peaks of Pb werevisible.
Equivalent experiments were made in M. luteusDE2008 cultures containing Cu. When the structure ofthe cell from Cu cultures was compared with that of cellsfrom Pb cultures, we could not observe any effect ofCu on the cell structure. The analysis of the energy-dispersion spectra coupled to SEM proved that thismicroorganism was able to accumulate Cu outside butnot inside the cells (Fig. 5). Cu peaks in Fig. 5d are notrelevant because they belong to the TEM holder support,which is made of Cu.
These results indicated that the EPS envelopes havea great affinity for both metals. It is well known thatthe EPS matrix can protect cells against toxic com-pounds such as metals that can be toxic to cells, andfurther, that the presence of these metals can overpro-duce exopolymer secretion (Decho 1994). Specifically,uronic acids and sulphate groups present in EPS mayinteract with various metals thereby immobilizing them(Stal 2000).
From these results, it can be concluded that M. luteusDE2008 grew optimally until levels of 1 mM of Pb(NO3)2and CuSO4, respectively, and was completely inhibited at3 mM Pb(NO3)2 and at 1.5 mM CuSO4. Moreover, the
Fig. 3 Growth rates of Micrococcus luteus DE2008 growing between0 and 2 mM Pb(NO3)2 (a) and between 0 and 1.5 mM CuSO4 (b)
Ann Microbiol (2010) 60:113–120 117
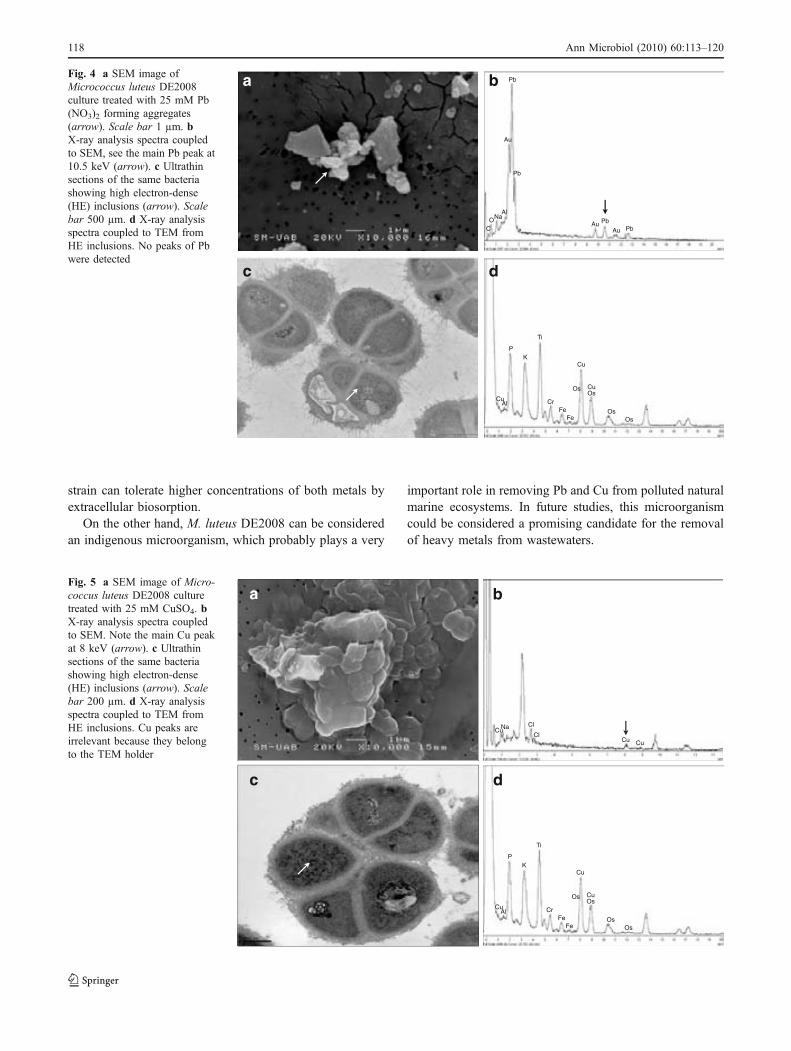
strain can tolerate higher concentrations of both metals byextracellular biosorption.
On the other hand, M. luteus DE2008 can be consideredan indigenous microorganism, which probably plays a very
important role in removing Pb and Cu from polluted naturalmarine ecosystems. In future studies, this microorganismcould be considered a promising candidate for the removalof heavy metals from wastewaters.
Cu
Cu
OsOs
OsOs
FeFe
Cr
Ti
CuAl
PK
PbPbAu
Au
Pb
Pb
Au
CONa
Al
a b
c d
Fig. 4 a SEM image ofMicrococcus luteus DE2008culture treated with 25 mM Pb(NO3)2 forming aggregates(arrow). Scale bar 1 µm. bX-ray analysis spectra coupledto SEM, see the main Pb peak at10.5 keV (arrow). c Ultrathinsections of the same bacteriashowing high electron-dense(HE) inclusions (arrow). Scalebar 500 µm. d X-ray analysisspectra coupled to TEM fromHE inclusions. No peaks of Pbwere detected
Cu Cu
Cl
ClNaCu
Cu
Cu
Ti
K
P
Ti
Fe
Fe
Cu
Cu
OsOs
OsOs
FeFe
Cr
Ti
CuAl
PK
a b
c d
Fig. 5 a SEM image of Micro-coccus luteus DE2008 culturetreated with 25 mM CuSO4. bX-ray analysis spectra coupledto SEM. Note the main Cu peakat 8 keV (arrow). c Ultrathinsections of the same bacteriashowing high electron-dense(HE) inclusions (arrow). Scalebar 200 µm. d X-ray analysisspectra coupled to TEM fromHE inclusions. Cu peaks areirrelevant because they belongto the TEM holder
118 Ann Microbiol (2010) 60:113–120
Acknowledgments This research was supported by two Spanishgrants DGICYT (Refs. CGL2005-03792/BOS and CGL2008-01891/BOS) and by Generalitat de Catalunya grant ITT-CTP (Ref. 2007ITT00003). We express our thanks to the staff of the Servei deMicroscòpia at the Universitat Autònoma de Barcelona for technicalassistance with the electron microscopy. We also thank Marc Alamanyand Francesc Fornells from Ecología Portuaria S.L. (Spain), whoprovided valuable comments on the manuscript. Finally, we acknowl-edge Cristina Sosa and Pilar Jarque for their help in this work.
References
Al-Hasan RH, Al-Bader D, Sorkhoh NA, Radwan SS (1998) Evidencefor n-alakane consumption and oxidation by filamentous cyano-bacteria from oil-contaminated coasts of the Arabian Gulf. MarBiol 130:521–527
Bamji MS, Krinsky NI (1966) The carotenoid pigments of a radiation-resistant Micrococcus species. Biochim Biophys Acta 2:276–284
Binupriya AR, Sathishkumar M, Swaminathan K, Jeong ES, Yun SE,Pattabi S (2006) Biosorption of metal ions from aqueoussolution and electroplating industry wastewater by Aspergillusjaponicus: phytotoxicity studies. Bull Environ Contam Toxicol2:219–227
Bordenave S, Fourçans A, Blachard S, Goño MS, Caumette P, DuranP (2004) Structure and functional analysis of bacterial commu-nities changes in microbial mats following petroleum exposure.Ophelia 58:195–203
Burnat M, Diestra E, Esteve I, Solé A (2009) Confocal laser scanningmicroscopy coupled to a spectrofluorometric detector as a rapidtool for determining the in vivo effect of metals on phototrophicbacteria. Bull Environ Contam Toxicol. doi:10.1007/s00128-009-9907-1
Chaudri AM, Celine G, Allain Vl, Barbosa-Jefferson FA, NicholsonBJ, Chambers SP, McGrath A (2000) A study of the impacts ofZn and Cu on two rhizobial species in soils of a long-term fieldexperiment. Plant Soil 221:167–179
Cowan ST, Steel KJ (1965) Manual for the identification of medicalbacteria. Cambridge University Press, New York
Decho AW (1994) Exopolymers in microbial mats: assessing theiradaptative roles. In: Stal LJ, Caumette P (eds) Microbial mats.Structure, developement and environmental significance. Spring-er, Berlin, pp 215–219
Diestra E, Solé A, Esteve I (2004) A comparative study ofcyanobacterial diversity in polluted and unpolluted microbialmats by means of CLSM. Ophelia 58:151–156
Diestra E, Solé A, Martí M, García de Oteyza T, Grimalt JO, Esteve I(2005) Characterization of an oil-degrading Microcoleus consor-tium by means of confocal scanning microscopy, scanningelectron microscopy and transmission electron microscopy.Scanning 4:176–180
Doddamani HP, Ninnekar HZ (2001) Biodegradation of carbaryl by aMicrococcus species. Curr Microbiol 1:69–73
García de Oteyza T, Grimalt JO, Diestra E, Solé A, Esteve I (2004)Changes in the composition of polar and apolar crude oilfractions under the action of Microcoleus consortia. ApplMicrobiol Biotechnol 2:226–232
Goldberg J, González H, Jensen TE, Corpe WA (2001) Quantitativeanalysis of the elemental composition and the mass of bacterialpolyphosphate bodies using STEM EDX. Microbios 415:177–188
Gong R, Ding Y, Liu H, Chen Q, Liu Z (2005) Lead biosorption anddesorption by intact and pretreated Spirulina maxima biomass.Chemosphere 1:125–130
Greenblatt CL, Baum J, Klein BY, Nachshon S, Koltunov V, Cano RJ(2004) Micrococcus luteus—survival in amber. Microb Ecol1:120–127
Jensen TE, Sicko LM (1974) Phosphate metabolism in blue-greenalgae. I. Fine structure of the “polyphosphate overplus” phe-nomenon in Plectonema boryanum. Can J Microbiol 9:1235–1239
Jukes TH, Cantor CR (1969) Evolution of proteins molecules. In:Munro HR (ed) Mammalian proteins metabolism. Academic, NewYork, pp 21–23
Kumar S, Tamura K, Nei M (2004) MEGA3: integrated software formolecular evolutionary genetics analysis and sequence align-ment. Brief Bioinform 2:150–163
Nakajima A, Tsuruta T (2004) Competitive biosorption of thoriumand uranium by Micrococcus luteus. J Radioanal Nucl Chem260:13–18
Radwan SS, Sorkhoh NA (1993) Lipids of n-alkanes ultilizingmicroorganisms and their application potential. Adv Appl Micro-biol 39:29–90
Roane TM, Pepper IL (2000) Microorganisms and metal pollutants.In: Maier RM, Pepper IL, Gerba CP (eds) Environmentalmicrobiology, Academic, New York, pp 403–423
Roy S, Ghosh AN, Thakur AR (2008) Uptake of Pb(2+)by acyanobacterium belonging to the genus Synechocystis, isolatedfrom East Kolkata Wetlands. Biometals 5:515–524
Saitou N, Nei M (1987) The neighbor-joining method: a newmethod for reconstructing phylogenetic trees. Mol Biol Evol4:406–425
Sánchez O, Diestra E, Esteve I, Mas J (2005) Molecular characteriza-tion of an oil-degrading cyanobacterial consortium. Microb Ecol4:580–588
Sánchez-Chardi A, López-Fuster MJ, Nadal J (2007) Bioaccumulationof lead, mercury, and cadmium in the greater white-toothedshrew, Crocidura russula, from the Ebro Delta (NE Spain): sex-and age-dependent variation. Environ Pollut 1:7–14
Sicko LM (1972) Structural variation of polyphosphate bodies in blue-green algae. In: Arceneaux J (ed) 30th Annual Proceedings of theElectron Microscope Society of America. Los Angeles, pp 218–219
Sims GK, Sommers LE, Konopka A (1986) Degradation of pyridineby micrococcus luteus isolated from soil. Appl Environ Micro-biol 5:963–968
Solé A, Diestra E, Esteve I (2009) Confocal laser scanningmicroscopy image analysis for cyanobacterial biomass deter-mined at microscale level in different microbial mats. MicrobEcol 4:649–656
Stal LJ (2000) Cyanobacterial mats and stromatolites. In: Whitton BA,Potts M (eds) The ecology of cyanobacteria. Kluwer, Dordrecht,pp 61–120
Stevens SE Jr, Nierzwicki-Bauer SA, Balkwill DL (1985) Effect ofnitrogen starvation on the morphology and ultrastructure of thecyanobacterium Mastigocladus laminosus. J Bacteriol 3:1215–1218
Takeuchi M, Weiss N, Schumann P, Yokota A (1996) Leucobacterkomagatae gen. nov., sp. nov., a new aerobic Gram-positive,nonsporulating rod with 2, 4-diaminobutyric acid in the cell wall.Int J Syst Bacteriol 4:967–971
Tallur PN, Megadi VB, Ninnekar HZ (2008) Biodegradation ofcypermethrin by Micrococcus sp. strain CPN 1. Biodegradation1:77–82
Tunali S, Çabu A, Akar T (2006) Removal of lead and copper ionsfrom aqueous solutions by bacterial strain isolated from soil.Chem Eng J 115:203–211
Wang YC (2005) Study on kinetics of alcohol fermentation on thebasis of the biomass specific growth rate. Liq Sci Technol 9:48–51
Ann Microbiol (2010) 60:113–120 119
Wei G, Fan L, Zhu W, Fu Y, Yu J, Tang M (2009) Isolation andcharacterization of the heavy metal resistant bacteriaCCNWRS33-2 isolated from root nodule of Lespedezacuneata in gold mine tailings in China. J Hazard Mater 1:50–56
Zhuang WQ, Tay JH, Maszenan AM, Krumholz LR, Tay ST (2003)Importance of Gram-positive naphthalene-degrading bacteria in
oil-contaminated tropical marine sediments. Lett Appl Microbiol4:251–257
Ziagova M, Dimitriadis G, Aslanidou D, Papaioannou X, LitopoulouTE, Liakopoulou-Kyriakides M (2007) Comparative study of Cd(II) and Cr(VI) biosorption on Staphylococcus xylosus andPseudomonas sp. in single and binary mixtures. Bioresour Technol15:2859–2865
120 Ann Microbiol (2010) 60:113–120
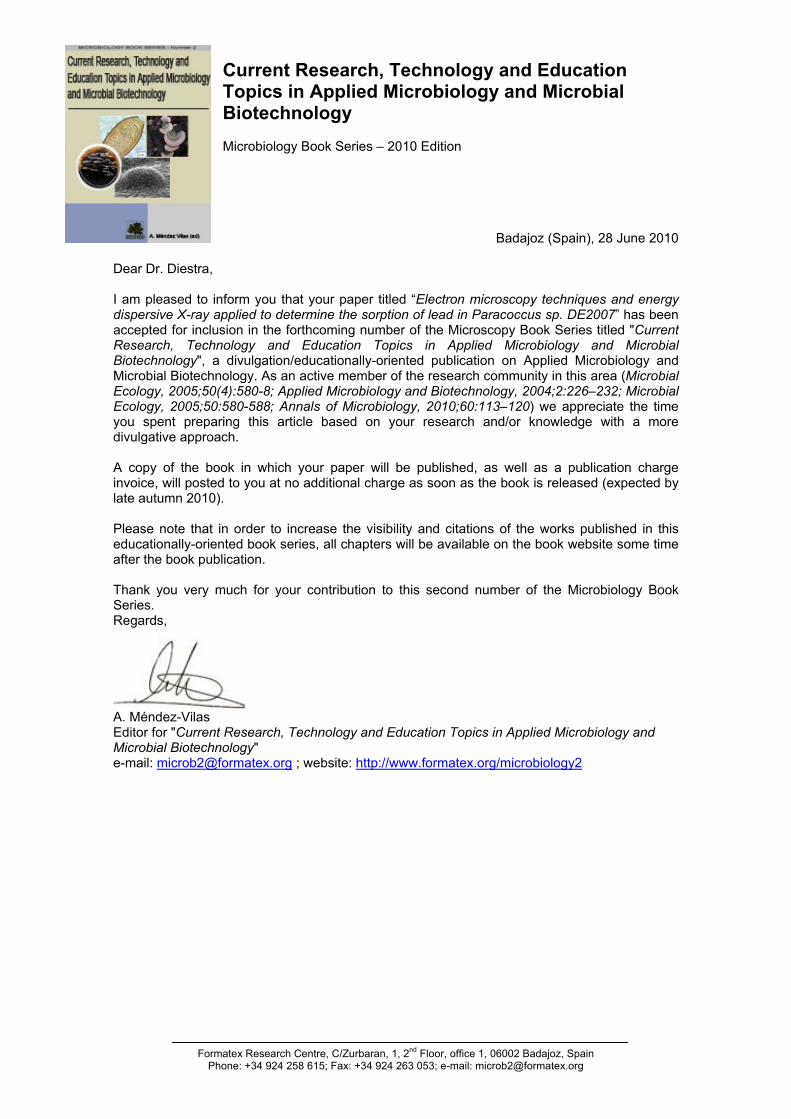
Formatex Research Centre, C/Zurbaran, 1, 2nd Floor, office 1, 06002 Badajoz, Spain
Phone: +34 924 258 615; Fax: +34 924 263 053; e-mail: [email protected]
Current Research, Technology and Education Topics in Applied Microbiology and Microbial Biotechnology Microbiology Book Series – 2010 Edition
Badajoz (Spain), 28 June 2010
Dear Dr. Diestra, I am pleased to inform you that your paper titled “Electron microscopy techniques and energy dispersive X-ray applied to determine the sorption of lead in Paracoccus sp. DE2007” has been accepted for inclusion in the forthcoming number of the Microscopy Book Series titled "Current Research, Technology and Education Topics in Applied Microbiology and Microbial Biotechnology", a divulgation/educationally-oriented publication on Applied Microbiology and Microbial Biotechnology. As an active member of the research community in this area (Microbial Ecology, 2005;50(4):580-8; Applied Microbiology and Biotechnology, 2004;2:226–232; Microbial Ecology, 2005;50:580-588; Annals of Microbiology, 2010;60:113–120) we appreciate the time you spent preparing this article based on your research and/or knowledge with a more divulgative approach. A copy of the book in which your paper will be published, as well as a publication charge invoice, will posted to you at no additional charge as soon as the book is released (expected by late autumn 2010). Please note that in order to increase the visibility and citations of the works published in this educationally-oriented book series, all chapters will be available on the book website some time after the book publication. Thank you very much for your contribution to this second number of the Microbiology Book Series. Regards,
A. Méndez-Vilas Editor for "Current Research, Technology and Education Topics in Applied Microbiology and Microbial Biotechnology" e-mail: [email protected] ; website: http://www.formatex.org/microbiology2
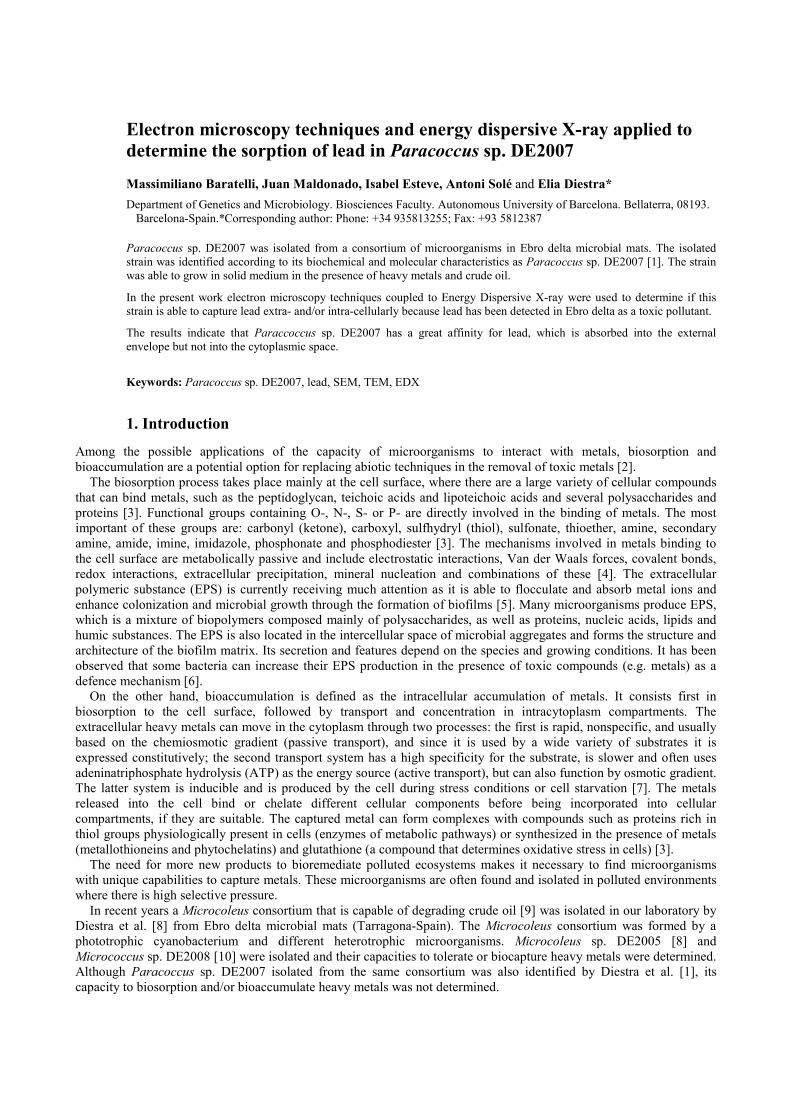
Electron microscopy techniques and energy dispersive X-ray applied to determine the sorption of lead in Paracoccus sp. DE2007
Massimiliano Baratelli, Juan Maldonado, Isabel Esteve, Antoni Solé and Elia Diestra* Department of Genetics and Microbiology. Biosciences Faculty. Autonomous University of Barcelona. Bellaterra, 08193.
Barcelona-Spain.*Corresponding author: Phone: +34 935813255; Fax: +93 5812387
Paracoccus sp. DE2007 was isolated from a consortium of microorganisms in Ebro delta microbial mats. The isolated strain was identified according to its biochemical and molecular characteristics as Paracoccus sp. DE2007 [1]. The strain was able to grow in solid medium in the presence of heavy metals and crude oil.
In the present work electron microscopy techniques coupled to Energy Dispersive X-ray were used to determine if this strain is able to capture lead extra- and/or intra-cellularly because lead has been detected in Ebro delta as a toxic pollutant.
The results indicate that Paraccoccus sp. DE2007 has a great affinity for lead, which is absorbed into the external envelope but not into the cytoplasmic space.
Keywords: Paracoccus sp. DE2007, lead, SEM, TEM, EDX
1. Introduction
Among the possible applications of the capacity of microorganisms to interact with metals, biosorption and
bioaccumulation are a potential option for replacing abiotic techniques in the removal of toxic metals [2].
The biosorption process takes place mainly at the cell surface, where there are a large variety of cellular compounds
that can bind metals, such as the peptidoglycan, teichoic acids and lipoteichoic acids and several polysaccharides and
proteins [3]. Functional groups containing O-, N-, S- or P- are directly involved in the binding of metals. The most important of these groups are: carbonyl (ketone), carboxyl, sulfhydryl (thiol), sulfonate, thioether, amine, secondary
amine, amide, imine, imidazole, phosphonate and phosphodiester [3]. The mechanisms involved in metals binding to
the cell surface are metabolically passive and include electrostatic interactions, Van der Waals forces, covalent bonds,
redox interactions, extracellular precipitation, mineral nucleation and combinations of these [4]. The extracellular
polymeric substance (EPS) is currently receiving much attention as it is able to flocculate and absorb metal ions and
enhance colonization and microbial growth through the formation of biofilms [5]. Many microorganisms produce EPS, which is a mixture of biopolymers composed mainly of polysaccharides, as well as proteins, nucleic acids, lipids and
humic substances. The EPS is also located in the intercellular space of microbial aggregates and forms the structure and
architecture of the biofilm matrix. Its secretion and features depend on the species and growing conditions. It has been
observed that some bacteria can increase their EPS production in the presence of toxic compounds (e.g. metals) as a
defence mechanism [6]. On the other hand, bioaccumulation is defined as the intracellular accumulation of metals. It consists first in
biosorption to the cell surface, followed by transport and concentration in intracytoplasm compartments. The
extracellular heavy metals can move in the cytoplasm through two processes: the first is rapid, nonspecific, and usually
based on the chemiosmotic gradient (passive transport), and since it is used by a wide variety of substrates it is
expressed constitutively; the second transport system has a high specificity for the substrate, is slower and often uses
adeninatriphosphate hydrolysis (ATP) as the energy source (active transport), but can also function by osmotic gradient. The latter system is inducible and is produced by the cell during stress conditions or cell starvation [7]. The metals
released into the cell bind or chelate different cellular components before being incorporated into cellular
compartments, if they are suitable. The captured metal can form complexes with compounds such as proteins rich in
thiol groups physiologically present in cells (enzymes of metabolic pathways) or synthesized in the presence of metals
(metallothioneins and phytochelatins) and glutathione (a compound that determines oxidative stress in cells) [3].
The need for more new products to bioremediate polluted ecosystems makes it necessary to find microorganisms with unique capabilities to capture metals. These microorganisms are often found and isolated in polluted environments
where there is high selective pressure.
In recent years a Microcoleus consortium that is capable of degrading crude oil [9] was isolated in our laboratory by
Diestra et al. [8] from Ebro delta microbial mats (Tarragona-Spain). The Microcoleus consortium was formed by a
phototrophic cyanobacterium and different heterotrophic microorganisms. Microcoleus sp. DE2005 [8] and
Micrococcus sp. DE2008 [10] were isolated and their capacities to tolerate or biocapture heavy metals were determined. Although Paracoccus sp. DE2007 isolated from the same consortium was also identified by Diestra et al. [1], its
capacity to biosorption and/or bioaccumulate heavy metals was not determined.
_______________________________________________________________________________________
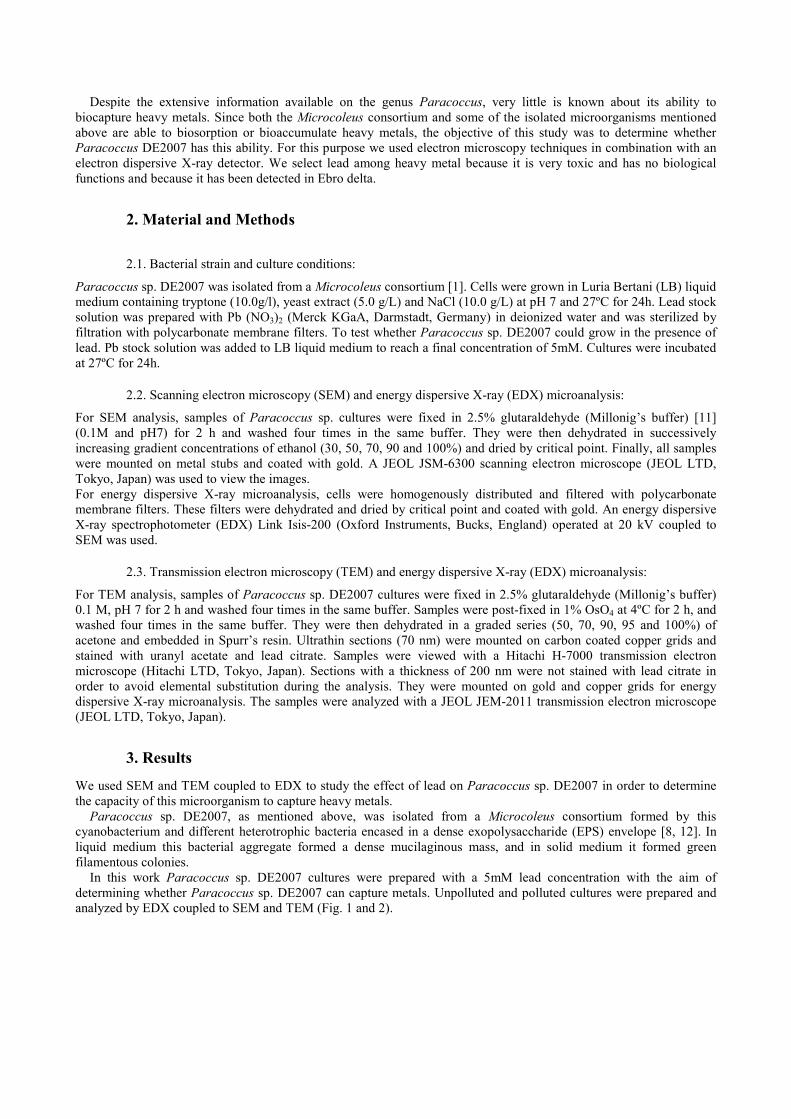
Despite the extensive information available on the genus Paracoccus, very little is known about its ability to biocapture heavy metals. Since both the Microcoleus consortium and some of the isolated microorganisms mentioned above are able to biosorption or bioaccumulate heavy metals, the objective of this study was to determine whether Paracoccus DE2007 has this ability. For this purpose we used electron microscopy techniques in combination with an electron dispersive X-ray detector. We select lead among heavy metal because it is very toxic and has no biological functions and because it has been detected in Ebro delta.
2. Material and Methods
2.1. Bacterial strain and culture conditions:
Paracoccus sp. DE2007 was isolated from a Microcoleus consortium [1]. Cells were grown in Luria Bertani (LB) liquid medium containing tryptone (10.0g/l), yeast extract (5.0 g/L) and NaCl (10.0 g/L) at pH 7 and 27ºC for 24h. Lead stock solution was prepared with Pb (NO3)2 (Merck KGaA, Darmstadt, Germany) in deionized water and was sterilized by filtration with polycarbonate membrane filters. To test whether Paracoccus sp. DE2007 could grow in the presence of lead. Pb stock solution was added to LB liquid medium to reach a final concentration of 5mM. Cultures were incubated at 27ºC for 24h.
2.2. Scanning electron microscopy (SEM) and energy dispersive X-ray (EDX) microanalysis:
For SEM analysis, samples of Paracoccus sp. cultures were fixed in 2.5% glutaraldehyde (Millonig’s buffer) [11] (0.1M and pH7) for 2 h and washed four times in the same buffer. They were then dehydrated in successively increasing gradient concentrations of ethanol (30, 50, 70, 90 and 100%) and dried by critical point. Finally, all samples were mounted on metal stubs and coated with gold. A JEOL JSM-6300 scanning electron microscope (JEOL LTD, Tokyo, Japan) was used to view the images. For energy dispersive X-ray microanalysis, cells were homogenously distributed and filtered with polycarbonate membrane filters. These filters were dehydrated and dried by critical point and coated with gold. An energy dispersive X-ray spectrophotometer (EDX) Link Isis-200 (Oxford Instruments, Bucks, England) operated at 20 kV coupled to SEM was used.
2.3. Transmission electron microscopy (TEM) and energy dispersive X-ray (EDX) microanalysis:
For TEM analysis, samples of Paracoccus sp. DE2007 cultures were fixed in 2.5% glutaraldehyde (Millonig’s buffer) 0.1 M, pH 7 for 2 h and washed four times in the same buffer. Samples were post-fixed in 1% OsO4 at 4ºC for 2 h, and washed four times in the same buffer. They were then dehydrated in a graded series (50, 70, 90, 95 and 100%) of acetone and embedded in Spurr’s resin. Ultrathin sections (70 nm) were mounted on carbon coated copper grids and stained with uranyl acetate and lead citrate. Samples were viewed with a Hitachi H-7000 transmission electron microscope (Hitachi LTD, Tokyo, Japan). Sections with a thickness of 200 nm were not stained with lead citrate in order to avoid elemental substitution during the analysis. They were mounted on gold and copper grids for energy dispersive X-ray microanalysis. The samples were analyzed with a JEOL JEM-2011 transmission electron microscope (JEOL LTD, Tokyo, Japan).
3. Results
We used SEM and TEM coupled to EDX to study the effect of lead on Paracoccus sp. DE2007 in order to determine the capacity of this microorganism to capture heavy metals. Paracoccus sp. DE2007, as mentioned above, was isolated from a Microcoleus consortium formed by this cyanobacterium and different heterotrophic bacteria encased in a dense exopolysaccharide (EPS) envelope [8, 12]. In liquid medium this bacterial aggregate formed a dense mucilaginous mass, and in solid medium it formed green filamentous colonies. In this work Paracoccus sp. DE2007 cultures were prepared with a 5mM lead concentration with the aim of determining whether Paracoccus sp. DE2007 can capture metals. Unpolluted and polluted cultures were prepared and analyzed by EDX coupled to SEM and TEM (Fig. 1 and 2).
_______________________________________________________________________________________
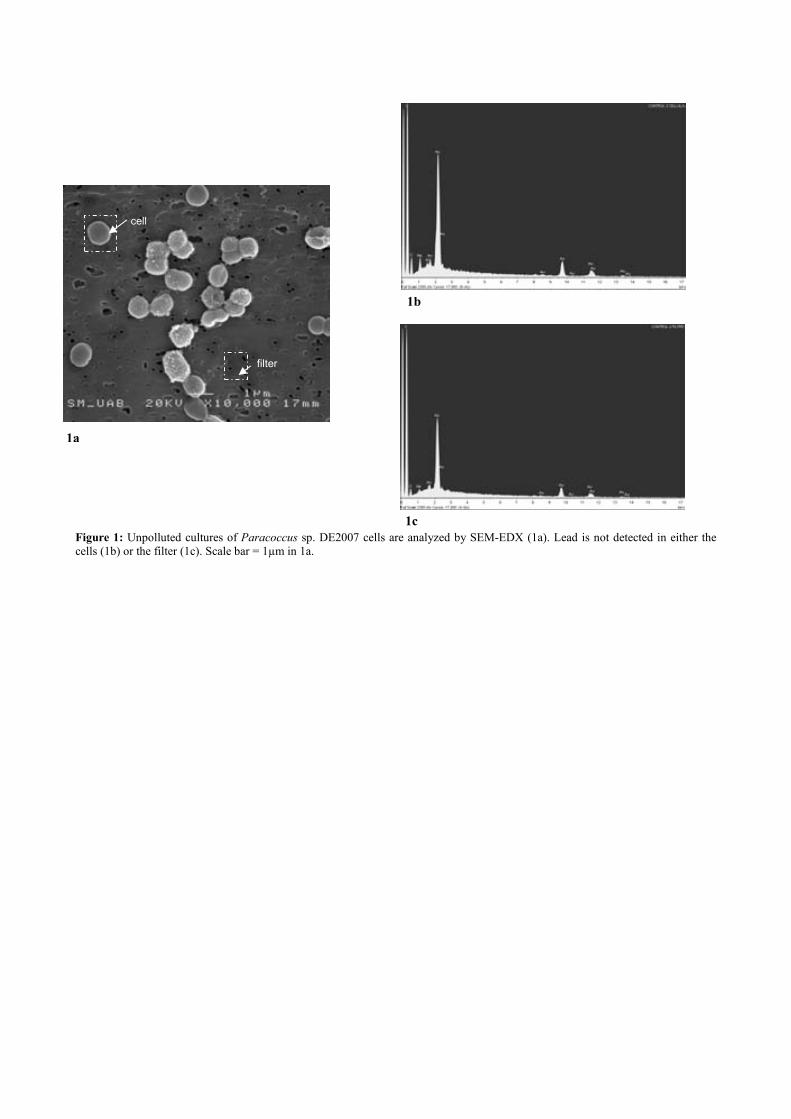
Figure 1: Unpolluted cultures of Paracoccus sp. DE2007 cells are analyzed by SEM-EDX (1a). Lead is not detected in either the cells (1b) or the filter (1c). Scale bar = 1µm in 1a.
1c
1a
cell
filter
1b
_______________________________________________________________________________________
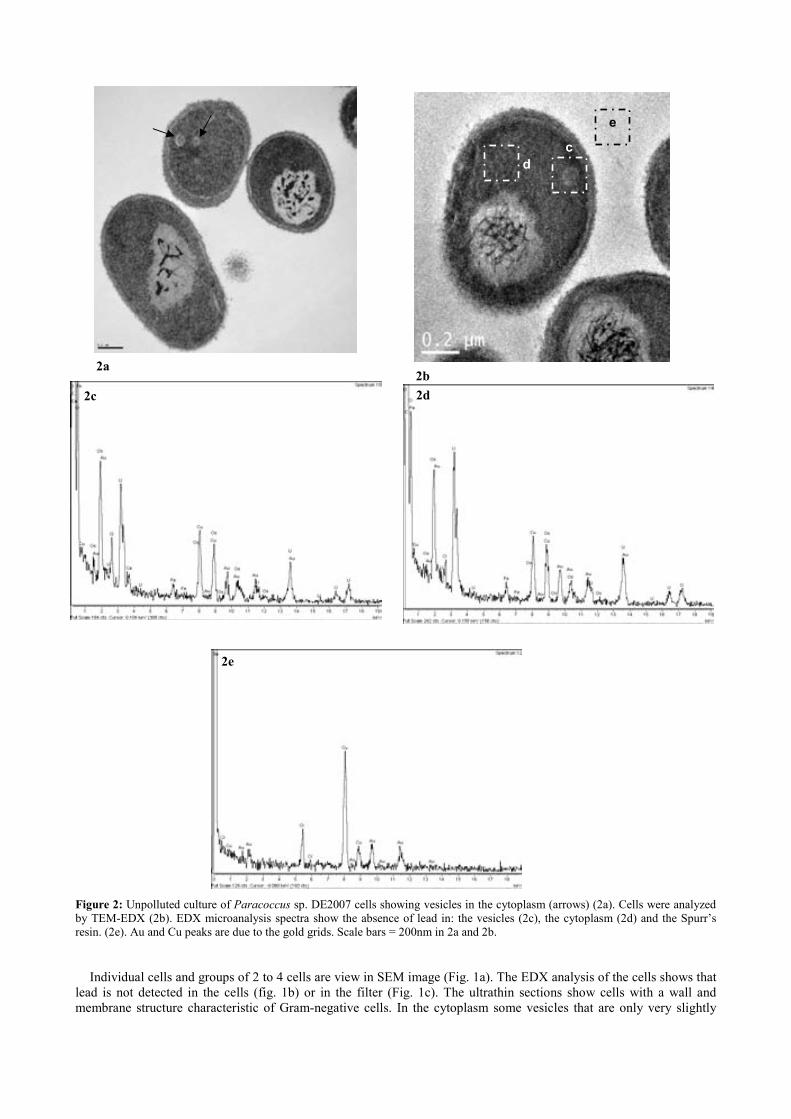
Figure 2: Unpolluted culture of Paracoccus sp. DE2007 cells showing vesicles in the cytoplasm (arrows) (2a). Cells were analyzed by TEM-EDX (2b). EDX microanalysis spectra show the absence of lead in: the vesicles (2c), the cytoplasm (2d) and the Spurr’s resin. (2e). Au and Cu peaks are due to the gold grids. Scale bars = 200nm in 2a and 2b. Individual cells and groups of 2 to 4 cells are view in SEM image (Fig. 1a). The EDX analysis of the cells shows that lead is not detected in the cells (fig. 1b) or in the filter (Fig. 1c). The ultrathin sections show cells with a wall and membrane structure characteristic of Gram-negative cells. In the cytoplasm some vesicles that are only very slightly
2b
c d
e
2c 2d
2e
2a
_______________________________________________________________________________________
electrodense can be observed (Fig. 2a, indicated by arrows), similar to those found by other authors [13]. We assumed
that these vesicles have lipid content as they were positively stained with Sudan Black (data not shown). The results
obtained in the TEM-EDX analysis (Fig. 2b) evidence the absence of lead in: the cytoplasm, the vesicles and the resin
(Figs. 2c-2e).
Cells from Pb-polluted cultures exhibit morphological and ultrastructural changes (Figs. 3 and 4). The SEM image
shows cells that are more deformed and which have a higher tendency to aggregate (Fig. 3a). The EDX analysis
evidences the presence of lead in the cells (Fig. 3b, indicated by an arrow); however, no lead was found in the filters in
which the cells are retained (Fig. 3c).
Figure 3: Cells of Paracoccus sp. DE2007 grown in the presence of 5mM of lead (3a) Scale bar = 1µm. X-ray analysis spectra
coupled to SEM show a Pb peak (arrow) (3b) and the absence of lead in the filter (3c).
3c
3b cell
filterr
3a
_______________________________________________________________________________________
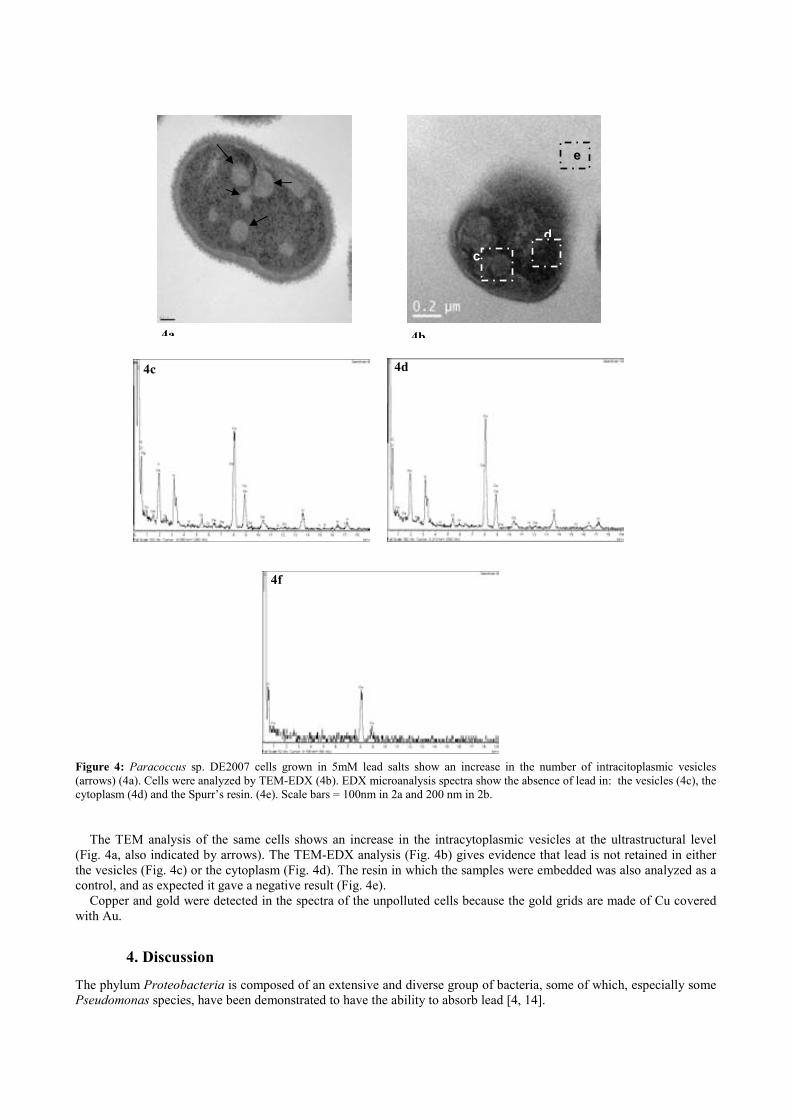
Figure 4: Paracoccus sp. DE2007 cells grown in 5mM lead salts show an increase in the number of intracitoplasmic vesicles (arrows) (4a). Cells were analyzed by TEM-EDX (4b). EDX microanalysis spectra show the absence of lead in: the vesicles (4c), the cytoplasm (4d) and the Spurr’s resin. (4e). Scale bars = 100nm in 2a and 200 nm in 2b.
The TEM analysis of the same cells shows an increase in the intracytoplasmic vesicles at the ultrastructural level (Fig. 4a, also indicated by arrows). The TEM-EDX analysis (Fig. 4b) gives evidence that lead is not retained in either the vesicles (Fig. 4c) or the cytoplasm (Fig. 4d). The resin in which the samples were embedded was also analyzed as a control, and as expected it gave a negative result (Fig. 4e). Copper and gold were detected in the spectra of the unpolluted cells because the gold grids are made of Cu covered with Au.
4. Discussion
The phylum Proteobacteria is composed of an extensive and diverse group of bacteria, some of which, especially some Pseudomonas species, have been demonstrated to have the ability to absorb lead [4, 14].
4c
c d
e
4b
4d
4f
4a
_______________________________________________________________________________________
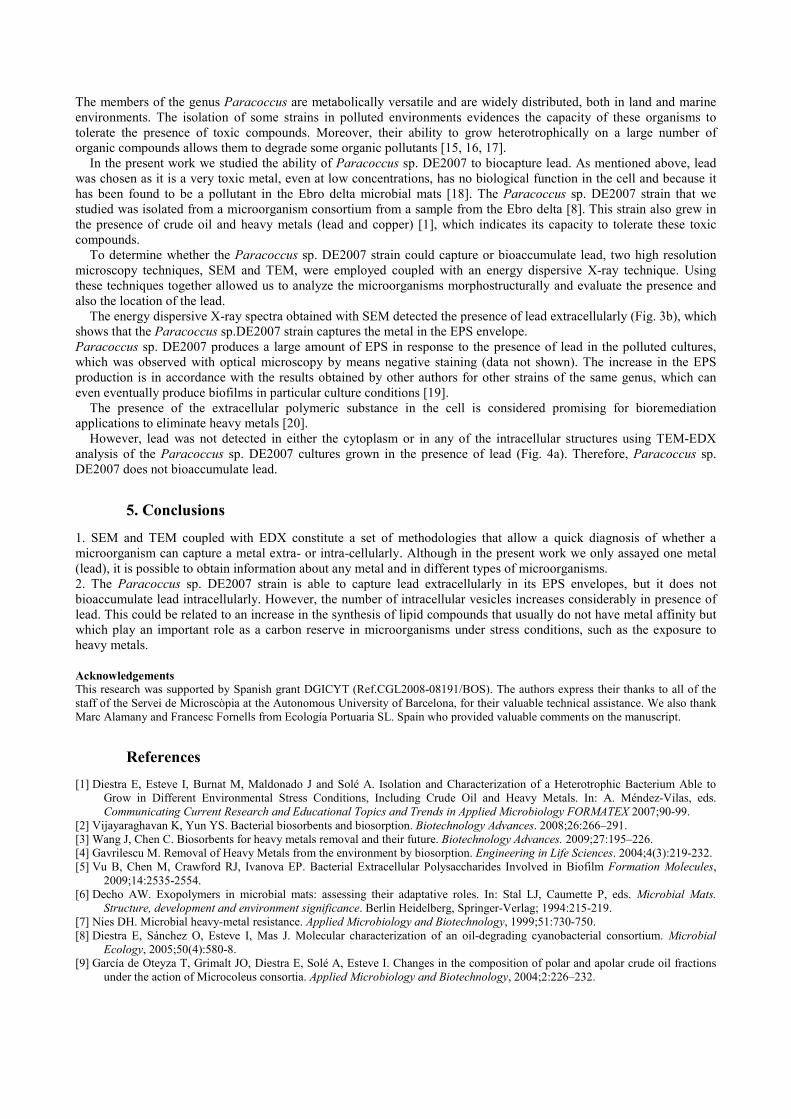
The members of the genus Paracoccus are metabolically versatile and are widely distributed, both in land and marine
environments. The isolation of some strains in polluted environments evidences the capacity of these organisms to
tolerate the presence of toxic compounds. Moreover, their ability to grow heterotrophically on a large number of
organic compounds allows them to degrade some organic pollutants [15, 16, 17]. In the present work we studied the ability of Paracoccus sp. DE2007 to biocapture lead. As mentioned above, lead
was chosen as it is a very toxic metal, even at low concentrations, has no biological function in the cell and because it
has been found to be a pollutant in the Ebro delta microbial mats [18]. The Paracoccus sp. DE2007 strain that we
studied was isolated from a microorganism consortium from a sample from the Ebro delta [8]. This strain also grew in
the presence of crude oil and heavy metals (lead and copper) [1], which indicates its capacity to tolerate these toxic
compounds.
To determine whether the Paracoccus sp. DE2007 strain could capture or bioaccumulate lead, two high resolution
microscopy techniques, SEM and TEM, were employed coupled with an energy dispersive X-ray technique. Using
these techniques together allowed us to analyze the microorganisms morphostructurally and evaluate the presence and
also the location of the lead.
The energy dispersive X-ray spectra obtained with SEM detected the presence of lead extracellularly (Fig. 3b), which
shows that the Paracoccus sp.DE2007 strain captures the metal in the EPS envelope.
Paracoccus sp. DE2007 produces a large amount of EPS in response to the presence of lead in the polluted cultures,
which was observed with optical microscopy by means negative staining (data not shown). The increase in the EPS
production is in accordance with the results obtained by other authors for other strains of the same genus, which can
even eventually produce biofilms in particular culture conditions [19].
The presence of the extracellular polymeric substance in the cell is considered promising for bioremediation
applications to eliminate heavy metals [20].
However, lead was not detected in either the cytoplasm or in any of the intracellular structures using TEM-EDX
analysis of the Paracoccus sp. DE2007 cultures grown in the presence of lead (Fig. 4a). Therefore, Paracoccus sp.
DE2007 does not bioaccumulate lead.
5. Conclusions
1. SEM and TEM coupled with EDX constitute a set of methodologies that allow a quick diagnosis of whether a
microorganism can capture a metal extra- or intra-cellularly. Although in the present work we only assayed one metal
(lead), it is possible to obtain information about any metal and in different types of microorganisms.
2. The Paracoccus sp. DE2007 strain is able to capture lead extracellularly in its EPS envelopes, but it does not
bioaccumulate lead intracellularly. However, the number of intracellular vesicles increases considerably in presence of
lead. This could be related to an increase in the synthesis of lipid compounds that usually do not have metal affinity but
which play an important role as a carbon reserve in microorganisms under stress conditions, such as the exposure to
heavy metals.
Acknowledgements
This research was supported by Spanish grant DGICYT (Ref.CGL2008-08191/BOS). The authors express their thanks to all of the
staff of the Servei de Microscòpia at the Autonomous University of Barcelona, for their valuable technical assistance. We also thank
Marc Alamany and Francesc Fornells from Ecología Portuaria SL. Spain who provided valuable comments on the manuscript.
References [1] Diestra E, Esteve I, Burnat M, Maldonado J and Solé A. Isolation and Characterization of a Heterotrophic Bacterium Able to
Grow in Different Environmental Stress Conditions, Including Crude Oil and Heavy Metals. In: A. Méndez-Vilas, eds.
Communicating Current Research and Educational Topics and Trends in Applied Microbiology FORMATEX 2007;90-99.
[2] Vijayaraghavan K, Yun YS. Bacterial biosorbents and biosorption. Biotechnology Advances. 2008;26:266–291.
[3] Wang J, Chen C. Biosorbents for heavy metals removal and their future. Biotechnology Advances. 2009;27:195–226.
[4] Gavrilescu M. Removal of Heavy Metals from the environment by biosorption. Engineering in Life Sciences. 2004;4(3):219-232.
[5] Vu B, Chen M, Crawford RJ, Ivanova EP. Bacterial Extracellular Polysaccharides Involved in Biofilm Formation Molecules,
2009;14:2535-2554.
[6] Decho AW. Exopolymers in microbial mats: assessing their adaptative roles. In: Stal LJ, Caumette P, eds. Microbial Mats. Structure, development and environment significance. Berlin Heidelberg, Springer-Verlag; 1994:215-219.
[7] Nies DH. Microbial heavy-metal resistance. Applied Microbiology and Biotechnology, 1999;51:730-750.
[8] Diestra E, Sánchez O, Esteve I, Mas J. Molecular characterization of an oil-degrading cyanobacterial consortium. Microbial Ecology, 2005;50(4):580-8.
[9] García de Oteyza T, Grimalt JO, Diestra E, Solé A, Esteve I. Changes in the composition of polar and apolar crude oil fractions
under the action of Microcoleus consortia. Applied Microbiology and Biotechnology, 2004;2:226–232.
_______________________________________________________________________________________
[10] Maldonado J, Destra E, Huang L, Domènech AM, Villagrasa E, Puyen ZM, Duran R, Esteve I, Solé A. Isolation and identification of a bacterium with high tolerance to lead and copper from a marine microbial mat in Spain. Annals of Microbiology, 2010;60:113–120.
[11] Miloning G. Advantages of phosphate buffer OsO4 solutions in fixation. Journal of Applied Physics, 1961;32:1637. [12] Sánchez O, Diestra E, Esteve I, Mas J. Molecular characterization of fan oil-degradation cyanobacterial consortium. Microbial
Ecology, 2005;50:580-588. [13] Osanjo GO, Muthike EW, Tsuma L, Okoth MW, Bulimo WD, Lünsdorf H, Abraham WR, Dion M, Timmis KN, Golyshin PN,
Mulaa FJ. A salt lake extremophile, Paracoccus bogoriensis sp. nov., efficiently produces xanthophyll carotenoids. African Journal of Microbiology Research, 2009;3(8):426-433.
[14] Malik A. Metal bioremediation through growing cells. Environment International, 2004;30:261–278. [15] López-Cortés A, Lanz-Landázuri A, García-Maldonado JQ. Screening and Isolation of PHB-Producing Bacteria in a Polluted
Marine Microbial Mat. Microbial Ecology, 2008;56:112–120. [16] Liu ZP, Wang BJ, Liu XY, Dai X, Liu YH, Liu SJ. Paracoccus halophilus sp. nov., isolated from marine sediment of the South
China Sea, China, and emended description of genus Paracoccus Davis 1969. International Journal of Systematic and Evolutionary Microbiolog, 2008;58:257–261.
[17] Zhang H, Kallimanis A, Koukkou AI, Drainas C. Isolation and characterization of novel bacteria degrading polycyclic aromatic hydrocarbons from polluted Greek soils. Applied Microbiology and Biotechnology, 2004;65:124–131.
[18] Sánchz-Chardi A, López-Fuster MJ, Nadal J. Bioaccumulation of lead, mercury, and cadmium in the greater white-yoothed shrew, Crocidura russula, from Ebro Delta (NE spain): sex and age-dependent variation. Environmental Pollution, 2007;1:7-14.
[19] Srinandana CS, Jadava V, Cecilia D, Nerurkara AS. Nutrients determine the spatial architecture of Paracoccus sp. biofilm. Biofouling, 2010;26(4):449–459.
[20] De Philippis R, Paperi R, Sili C, Vincenzini M. Assessment of the metal removal capability of two capsulated cyanobacteria, Cyanospira capsulata and Nostoc PCC7936. Journal of Applied Phycology, 2003;15:155–161.
_______________________________________________________________________________________
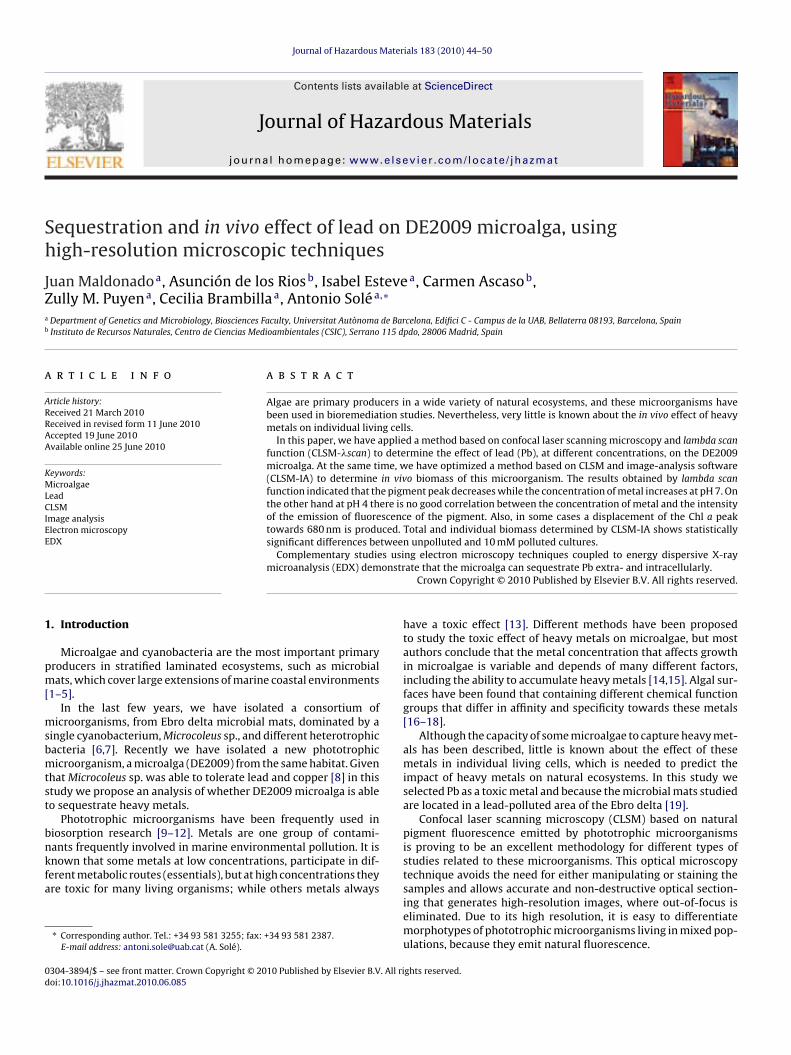
Journal of Hazardous Materials 183 (2010) 44–50
Contents lists available at ScienceDirect
Journal of Hazardous Materials
journa l homepage: www.e lsev ier .com/ locate / jhazmat
Sequestration and in vivo effect of lead on DE2009 microalga, usinghigh-resolution microscopic techniques
Juan Maldonadoa, Asunción de los Riosb, Isabel Estevea, Carmen Ascasob,Zully M. Puyena, Cecilia Brambillaa, Antonio Soléa,!
a Department of Genetics and Microbiology, Biosciences Faculty, Universitat Autònoma de Barcelona, Edifici C - Campus de la UAB, Bellaterra 08193, Barcelona, Spainb Instituto de Recursos Naturales, Centro de Ciencias Medioambientales (CSIC), Serrano 115 dpdo, 28006 Madrid, Spain
a r t i c l e i n f o
Article history:Received 21 March 2010Received in revised form 11 June 2010Accepted 19 June 2010Available online 25 June 2010
Keywords:MicroalgaeLeadCLSMImage analysisElectron microscopyEDX
a b s t r a c t
Algae are primary producers in a wide variety of natural ecosystems, and these microorganisms havebeen used in bioremediation studies. Nevertheless, very little is known about the in vivo effect of heavymetals on individual living cells.
In this paper, we have applied a method based on confocal laser scanning microscopy and lambda scanfunction (CLSM-!scan) to determine the effect of lead (Pb), at different concentrations, on the DE2009microalga. At the same time, we have optimized a method based on CLSM and image-analysis software(CLSM-IA) to determine in vivo biomass of this microorganism. The results obtained by lambda scanfunction indicated that the pigment peak decreases while the concentration of metal increases at pH 7. Onthe other hand at pH 4 there is no good correlation between the concentration of metal and the intensityof the emission of fluorescence of the pigment. Also, in some cases a displacement of the Chl a peaktowards 680 nm is produced. Total and individual biomass determined by CLSM-IA shows statisticallysignificant differences between unpolluted and 10 mM polluted cultures.
Complementary studies using electron microscopy techniques coupled to energy dispersive X-raymicroanalysis (EDX) demonstrate that the microalga can sequestrate Pb extra- and intracellularly.
Crown Copyright © 2010 Published by Elsevier B.V. All rights reserved.
1. Introduction
Microalgae and cyanobacteria are the most important primaryproducers in stratified laminated ecosystems, such as microbialmats, which cover large extensions of marine coastal environments[1–5].
In the last few years, we have isolated a consortium ofmicroorganisms, from Ebro delta microbial mats, dominated by asingle cyanobacterium, Microcoleus sp., and different heterotrophicbacteria [6,7]. Recently we have isolated a new phototrophicmicroorganism, a microalga (DE2009) from the same habitat. Giventhat Microcoleus sp. was able to tolerate lead and copper [8] in thisstudy we propose an analysis of whether DE2009 microalga is ableto sequestrate heavy metals.
Phototrophic microorganisms have been frequently used inbiosorption research [9–12]. Metals are one group of contami-nants frequently involved in marine environmental pollution. It isknown that some metals at low concentrations, participate in dif-ferent metabolic routes (essentials), but at high concentrations theyare toxic for many living organisms; while others metals always
! Corresponding author. Tel.: +34 93 581 3255; fax: +34 93 581 2387.E-mail address: [email protected] (A. Solé).
have a toxic effect [13]. Different methods have been proposedto study the toxic effect of heavy metals on microalgae, but mostauthors conclude that the metal concentration that affects growthin microalgae is variable and depends of many different factors,including the ability to accumulate heavy metals [14,15]. Algal sur-faces have been found that containing different chemical functiongroups that differ in affinity and specificity towards these metals[16–18].
Although the capacity of some microalgae to capture heavy met-als has been described, little is known about the effect of thesemetals in individual living cells, which is needed to predict theimpact of heavy metals on natural ecosystems. In this study weselected Pb as a toxic metal and because the microbial mats studiedare located in a lead-polluted area of the Ebro delta [19].
Confocal laser scanning microscopy (CLSM) based on naturalpigment fluorescence emitted by phototrophic microorganismsis proving to be an excellent methodology for different types ofstudies related to these microorganisms. This optical microscopytechnique avoids the need for either manipulating or staining thesamples and allows accurate and non-destructive optical section-ing that generates high-resolution images, where out-of-focus iseliminated. Due to its high resolution, it is easy to differentiatemorphotypes of phototrophic microorganisms living in mixed pop-ulations, because they emit natural fluorescence.
0304-3894/$ – see front matter. Crown Copyright © 2010 Published by Elsevier B.V. All rights reserved.doi:10.1016/j.jhazmat.2010.06.085
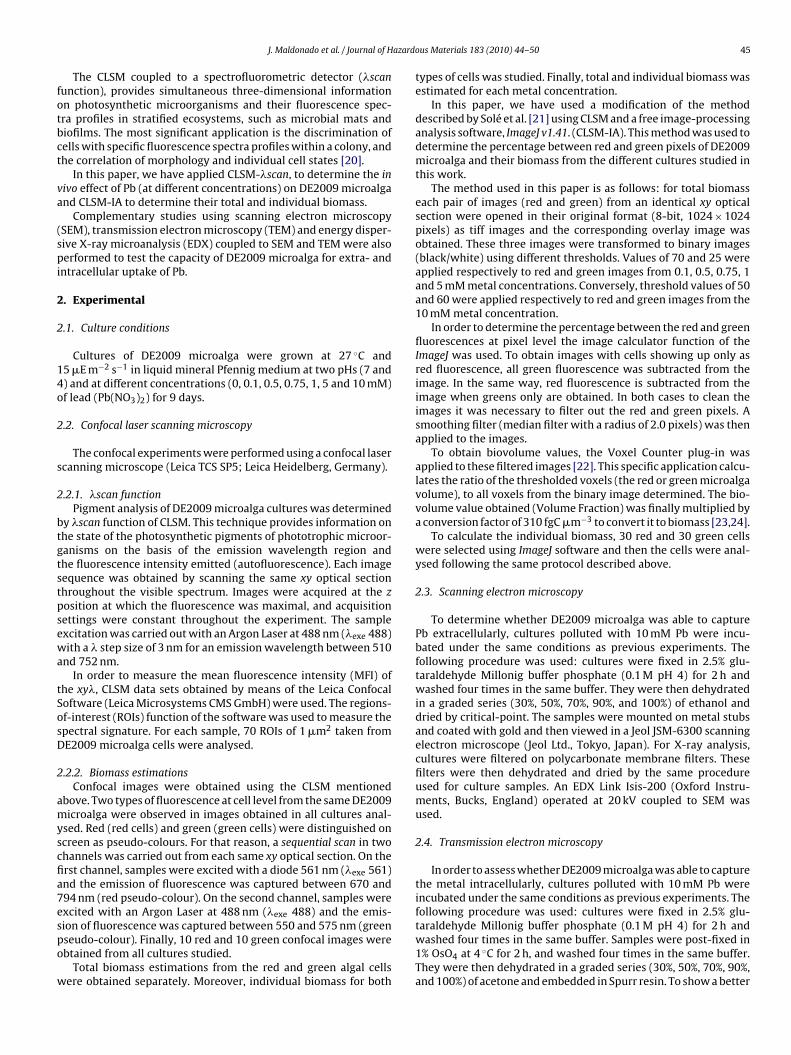
J. Maldonado et al. / Journal of Hazardous Materials 183 (2010) 44–50 45
The CLSM coupled to a spectrofluorometric detector (!scanfunction), provides simultaneous three-dimensional informationon photosynthetic microorganisms and their fluorescence spec-tra profiles in stratified ecosystems, such as microbial mats andbiofilms. The most significant application is the discrimination ofcells with specific fluorescence spectra profiles within a colony, andthe correlation of morphology and individual cell states [20].
In this paper, we have applied CLSM-!scan, to determine the invivo effect of Pb (at different concentrations) on DE2009 microalgaand CLSM-IA to determine their total and individual biomass.
Complementary studies using scanning electron microscopy(SEM), transmission electron microscopy (TEM) and energy disper-sive X-ray microanalysis (EDX) coupled to SEM and TEM were alsoperformed to test the capacity of DE2009 microalga for extra- andintracellular uptake of Pb.
2. Experimental
2.1. Culture conditions
Cultures of DE2009 microalga were grown at 27 !C and15 !E m"2 s"1 in liquid mineral Pfennig medium at two pHs (7 and4) and at different concentrations (0, 0.1, 0.5, 0.75, 1, 5 and 10 mM)of lead (Pb(NO3)2) for 9 days.
2.2. Confocal laser scanning microscopy
The confocal experiments were performed using a confocal laserscanning microscope (Leica TCS SP5; Leica Heidelberg, Germany).
2.2.1. !scan functionPigment analysis of DE2009 microalga cultures was determined
by !scan function of CLSM. This technique provides information onthe state of the photosynthetic pigments of phototrophic microor-ganisms on the basis of the emission wavelength region andthe fluorescence intensity emitted (autofluorescence). Each imagesequence was obtained by scanning the same xy optical sectionthroughout the visible spectrum. Images were acquired at the zposition at which the fluorescence was maximal, and acquisitionsettings were constant throughout the experiment. The sampleexcitation was carried out with an Argon Laser at 488 nm (!exe 488)with a ! step size of 3 nm for an emission wavelength between 510and 752 nm.
In order to measure the mean fluorescence intensity (MFI) ofthe xy!, CLSM data sets obtained by means of the Leica ConfocalSoftware (Leica Microsystems CMS GmbH) were used. The regions-of-interest (ROIs) function of the software was used to measure thespectral signature. For each sample, 70 ROIs of 1 !m2 taken fromDE2009 microalga cells were analysed.
2.2.2. Biomass estimationsConfocal images were obtained using the CLSM mentioned
above. Two types of fluorescence at cell level from the same DE2009microalga were observed in images obtained in all cultures anal-ysed. Red (red cells) and green (green cells) were distinguished onscreen as pseudo-colours. For that reason, a sequential scan in twochannels was carried out from each same xy optical section. On thefirst channel, samples were excited with a diode 561 nm (!exe 561)and the emission of fluorescence was captured between 670 and794 nm (red pseudo-colour). On the second channel, samples wereexcited with an Argon Laser at 488 nm (!exe 488) and the emis-sion of fluorescence was captured between 550 and 575 nm (greenpseudo-colour). Finally, 10 red and 10 green confocal images wereobtained from all cultures studied.
Total biomass estimations from the red and green algal cellswere obtained separately. Moreover, individual biomass for both
types of cells was studied. Finally, total and individual biomass wasestimated for each metal concentration.
In this paper, we have used a modification of the methoddescribed by Solé et al. [21] using CLSM and a free image-processinganalysis software, ImageJ v1.41. (CLSM-IA). This method was used todetermine the percentage between red and green pixels of DE2009microalga and their biomass from the different cultures studied inthis work.
The method used in this paper is as follows: for total biomasseach pair of images (red and green) from an identical xy opticalsection were opened in their original format (8-bit, 1024 # 1024pixels) as tiff images and the corresponding overlay image wasobtained. These three images were transformed to binary images(black/white) using different thresholds. Values of 70 and 25 wereapplied respectively to red and green images from 0.1, 0.5, 0.75, 1and 5 mM metal concentrations. Conversely, threshold values of 50and 60 were applied respectively to red and green images from the10 mM metal concentration.
In order to determine the percentage between the red and greenfluorescences at pixel level the image calculator function of theImageJ was used. To obtain images with cells showing up only asred fluorescence, all green fluorescence was subtracted from theimage. In the same way, red fluorescence is subtracted from theimage when greens only are obtained. In both cases to clean theimages it was necessary to filter out the red and green pixels. Asmoothing filter (median filter with a radius of 2.0 pixels) was thenapplied to the images.
To obtain biovolume values, the Voxel Counter plug-in wasapplied to these filtered images [22]. This specific application calcu-lates the ratio of the thresholded voxels (the red or green microalgavolume), to all voxels from the binary image determined. The bio-volume value obtained (Volume Fraction) was finally multiplied bya conversion factor of 310 fgC !m"3 to convert it to biomass [23,24].
To calculate the individual biomass, 30 red and 30 green cellswere selected using ImageJ software and then the cells were anal-ysed following the same protocol described above.
2.3. Scanning electron microscopy
To determine whether DE2009 microalga was able to capturePb extracellularly, cultures polluted with 10 mM Pb were incu-bated under the same conditions as previous experiments. Thefollowing procedure was used: cultures were fixed in 2.5% glu-taraldehyde Millonig buffer phosphate (0.1 M pH 4) for 2 h andwashed four times in the same buffer. They were then dehydratedin a graded series (30%, 50%, 70%, 90%, and 100%) of ethanol anddried by critical-point. The samples were mounted on metal stubsand coated with gold and then viewed in a Jeol JSM-6300 scanningelectron microscope (Jeol Ltd., Tokyo, Japan). For X-ray analysis,cultures were filtered on polycarbonate membrane filters. Thesefilters were then dehydrated and dried by the same procedureused for culture samples. An EDX Link Isis-200 (Oxford Instru-ments, Bucks, England) operated at 20 kV coupled to SEM wasused.
2.4. Transmission electron microscopy
In order to assess whether DE2009 microalga was able to capturethe metal intracellularly, cultures polluted with 10 mM Pb wereincubated under the same conditions as previous experiments. Thefollowing procedure was used: cultures were fixed in 2.5% glu-taraldehyde Millonig buffer phosphate (0.1 M pH 4) for 2 h andwashed four times in the same buffer. Samples were post-fixed in1% OsO4 at 4 !C for 2 h, and washed four times in the same buffer.They were then dehydrated in a graded series (30%, 50%, 70%, 90%,and 100%) of acetone and embedded in Spurr resin. To show a better
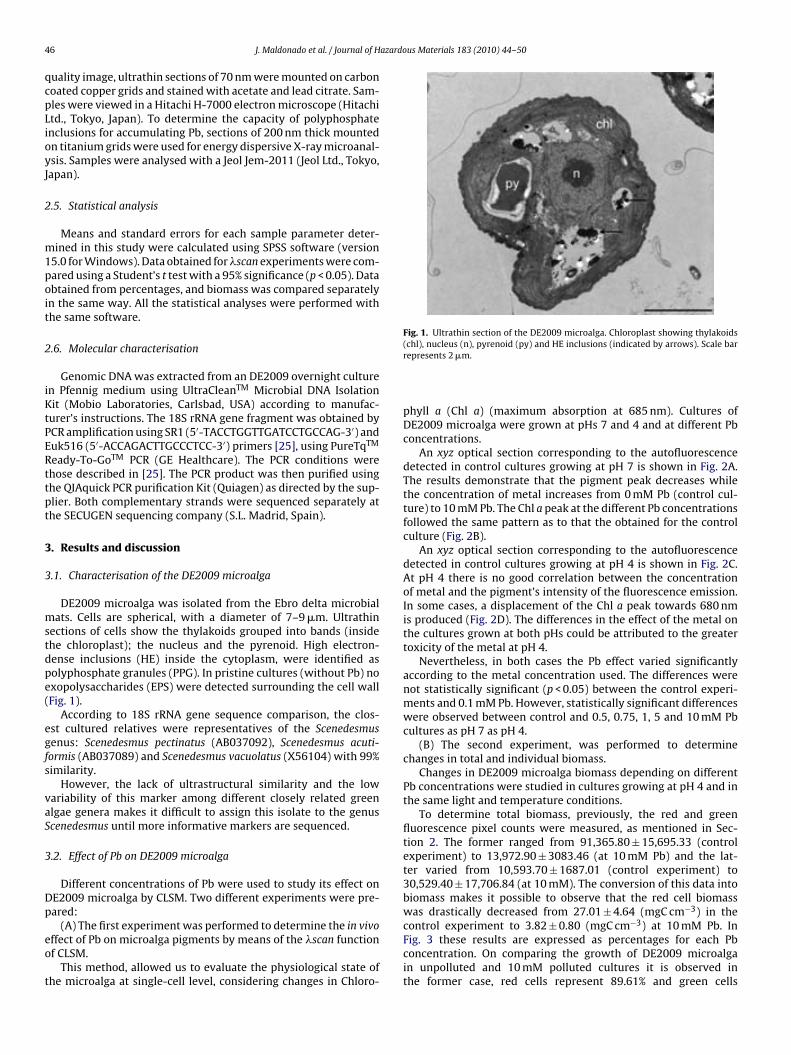
46 J. Maldonado et al. / Journal of Hazardous Materials 183 (2010) 44–50
quality image, ultrathin sections of 70 nm were mounted on carboncoated copper grids and stained with acetate and lead citrate. Sam-ples were viewed in a Hitachi H-7000 electron microscope (HitachiLtd., Tokyo, Japan). To determine the capacity of polyphosphateinclusions for accumulating Pb, sections of 200 nm thick mountedon titanium grids were used for energy dispersive X-ray microanal-ysis. Samples were analysed with a Jeol Jem-2011 (Jeol Ltd., Tokyo,Japan).
2.5. Statistical analysis
Means and standard errors for each sample parameter deter-mined in this study were calculated using SPSS software (version15.0 for Windows). Data obtained for !scan experiments were com-pared using a Student’s t test with a 95% significance (p < 0.05). Dataobtained from percentages, and biomass was compared separatelyin the same way. All the statistical analyses were performed withthe same software.
2.6. Molecular characterisation
Genomic DNA was extracted from an DE2009 overnight culturein Pfennig medium using UltraCleanTM Microbial DNA IsolationKit (Mobio Laboratories, Carlsbad, USA) according to manufac-turer’s instructions. The 18S rRNA gene fragment was obtained byPCR amplification using SR1 (5!-TACCTGGTTGATCCTGCCAG-3!) andEuk516 (5!-ACCAGACTTGCCCTCC-3!) primers [25], using PureTqTM
Ready-To-GoTM PCR (GE Healthcare). The PCR conditions werethose described in [25]. The PCR product was then purified usingthe QIAquick PCR purification Kit (Quiagen) as directed by the sup-plier. Both complementary strands were sequenced separately atthe SECUGEN sequencing company (S.L. Madrid, Spain).
3. Results and discussion
3.1. Characterisation of the DE2009 microalga
DE2009 microalga was isolated from the Ebro delta microbialmats. Cells are spherical, with a diameter of 7–9 !m. Ultrathinsections of cells show the thylakoids grouped into bands (insidethe chloroplast); the nucleus and the pyrenoid. High electron-dense inclusions (HE) inside the cytoplasm, were identified aspolyphosphate granules (PPG). In pristine cultures (without Pb) noexopolysaccharides (EPS) were detected surrounding the cell wall(Fig. 1).
According to 18S rRNA gene sequence comparison, the clos-est cultured relatives were representatives of the Scenedesmusgenus: Scenedesmus pectinatus (AB037092), Scenedesmus acuti-formis (AB037089) and Scenedesmus vacuolatus (X56104) with 99%similarity.
However, the lack of ultrastructural similarity and the lowvariability of this marker among different closely related greenalgae genera makes it difficult to assign this isolate to the genusScenedesmus until more informative markers are sequenced.
3.2. Effect of Pb on DE2009 microalga
Different concentrations of Pb were used to study its effect onDE2009 microalga by CLSM. Two different experiments were pre-pared:
(A) The first experiment was performed to determine the in vivoeffect of Pb on microalga pigments by means of the !scan functionof CLSM.
This method, allowed us to evaluate the physiological state ofthe microalga at single-cell level, considering changes in Chloro-
Fig. 1. Ultrathin section of the DE2009 microalga. Chloroplast showing thylakoids(chl), nucleus (n), pyrenoid (py) and HE inclusions (indicated by arrows). Scale barrepresents 2 !m.
phyll a (Chl a) (maximum absorption at 685 nm). Cultures ofDE2009 microalga were grown at pHs 7 and 4 and at different Pbconcentrations.
An xyz optical section corresponding to the autofluorescencedetected in control cultures growing at pH 7 is shown in Fig. 2A.The results demonstrate that the pigment peak decreases whilethe concentration of metal increases from 0 mM Pb (control cul-ture) to 10 mM Pb. The Chl a peak at the different Pb concentrationsfollowed the same pattern as to that the obtained for the controlculture (Fig. 2B).
An xyz optical section corresponding to the autofluorescencedetected in control cultures growing at pH 4 is shown in Fig. 2C.At pH 4 there is no good correlation between the concentrationof metal and the pigment’s intensity of the fluorescence emission.In some cases, a displacement of the Chl a peak towards 680 nmis produced (Fig. 2D). The differences in the effect of the metal onthe cultures grown at both pHs could be attributed to the greatertoxicity of the metal at pH 4.
Nevertheless, in both cases the Pb effect varied significantlyaccording to the metal concentration used. The differences werenot statistically significant (p < 0.05) between the control experi-ments and 0.1 mM Pb. However, statistically significant differenceswere observed between control and 0.5, 0.75, 1, 5 and 10 mM Pbcultures as pH 7 as pH 4.
(B) The second experiment, was performed to determinechanges in total and individual biomass.
Changes in DE2009 microalga biomass depending on differentPb concentrations were studied in cultures growing at pH 4 and inthe same light and temperature conditions.
To determine total biomass, previously, the red and greenfluorescence pixel counts were measured, as mentioned in Sec-tion 2. The former ranged from 91,365.80 ± 15,695.33 (controlexperiment) to 13,972.90 ± 3083.46 (at 10 mM Pb) and the lat-ter varied from 10,593.70 ± 1687.01 (control experiment) to30,529.40 ± 17,706.84 (at 10 mM). The conversion of this data intobiomass makes it possible to observe that the red cell biomasswas drastically decreased from 27.01 ± 4.64 (mgC cm"3) in thecontrol experiment to 3.82 ± 0.80 (mgC cm"3) at 10 mM Pb. InFig. 3 these results are expressed as percentages for each Pbconcentration. On comparing the growth of DE2009 microalgain unpolluted and 10 mM polluted cultures it is observed inthe former case, red cells represent 89.61% and green cells
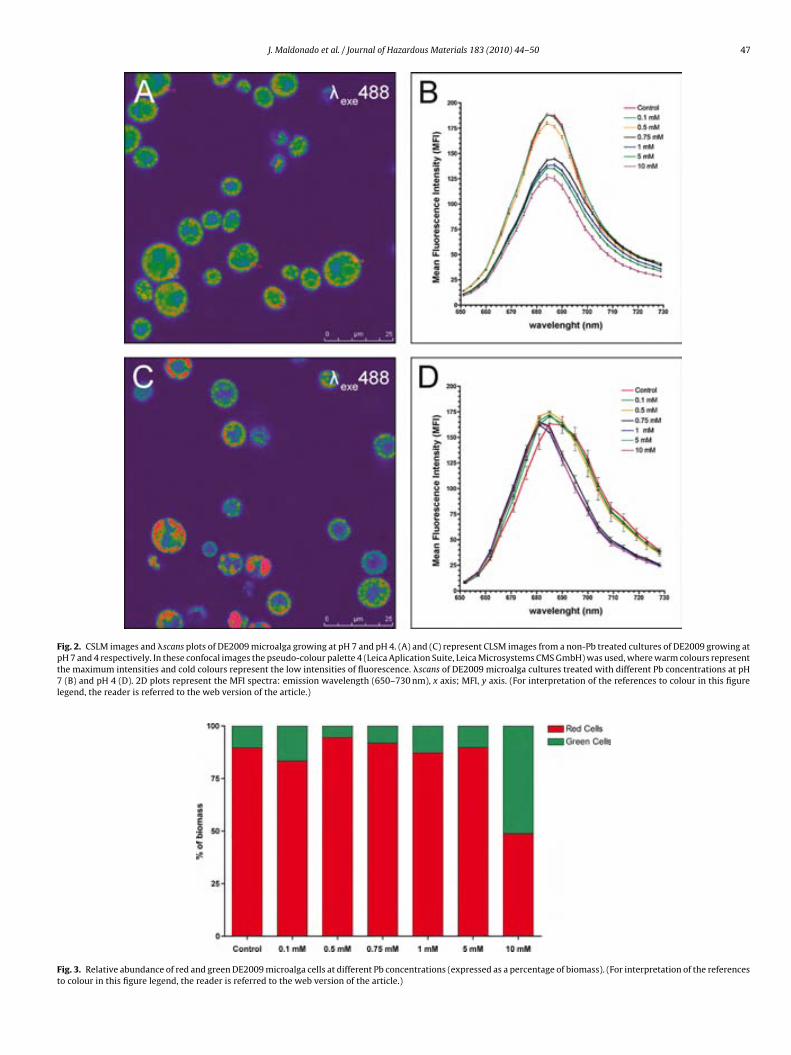
J. Maldonado et al. / Journal of Hazardous Materials 183 (2010) 44–50 47
Fig. 2. CSLM images and !scans plots of DE2009 microalga growing at pH 7 and pH 4. (A) and (C) represent CLSM images from a non-Pb treated cultures of DE2009 growing atpH 7 and 4 respectively. In these confocal images the pseudo-colour palette 4 (Leica Aplication Suite, Leica Microsystems CMS GmbH) was used, where warm colours representthe maximum intensities and cold colours represent the low intensities of fluorescence. !scans of DE2009 microalga cultures treated with different Pb concentrations at pH7 (B) and pH 4 (D). 2D plots represent the MFI spectra: emission wavelength (650–730 nm), x axis; MFI, y axis. (For interpretation of the references to colour in this figurelegend, the reader is referred to the web version of the article.)
Fig. 3. Relative abundance of red and green DE2009 microalga cells at different Pb concentrations (expressed as a percentage of biomass). (For interpretation of the referencesto colour in this figure legend, the reader is referred to the web version of the article.)
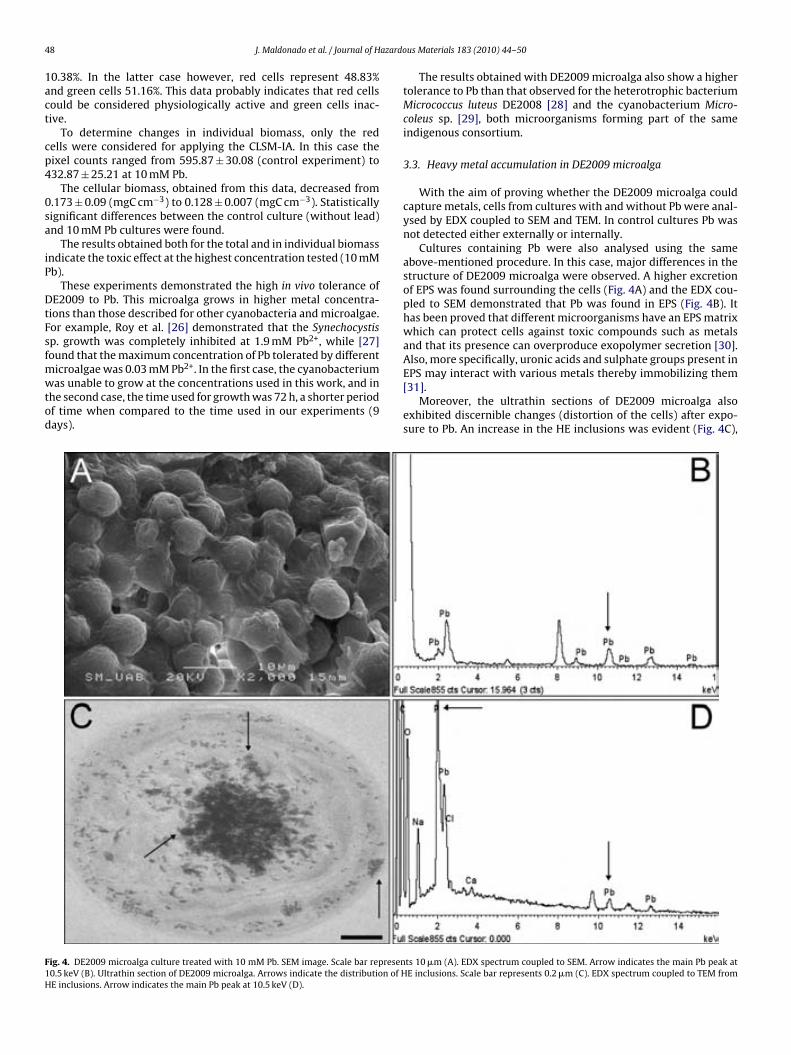
48 J. Maldonado et al. / Journal of Hazardous Materials 183 (2010) 44–50
10.38%. In the latter case however, red cells represent 48.83%and green cells 51.16%. This data probably indicates that red cellscould be considered physiologically active and green cells inac-tive.
To determine changes in individual biomass, only the redcells were considered for applying the CLSM-IA. In this case thepixel counts ranged from 595.87 ± 30.08 (control experiment) to432.87 ± 25.21 at 10 mM Pb.
The cellular biomass, obtained from this data, decreased from0.173 ± 0.09 (mgC cm!3) to 0.128 ± 0.007 (mgC cm!3). Statisticallysignificant differences between the control culture (without lead)and 10 mM Pb cultures were found.
The results obtained both for the total and in individual biomassindicate the toxic effect at the highest concentration tested (10 mMPb).
These experiments demonstrated the high in vivo tolerance ofDE2009 to Pb. This microalga grows in higher metal concentra-tions than those described for other cyanobacteria and microalgae.For example, Roy et al. [26] demonstrated that the Synechocystissp. growth was completely inhibited at 1.9 mM Pb2+, while [27]found that the maximum concentration of Pb tolerated by differentmicroalgae was 0.03 mM Pb2+. In the first case, the cyanobacteriumwas unable to grow at the concentrations used in this work, and inthe second case, the time used for growth was 72 h, a shorter periodof time when compared to the time used in our experiments (9days).
The results obtained with DE2009 microalga also show a highertolerance to Pb than that observed for the heterotrophic bacteriumMicrococcus luteus DE2008 [28] and the cyanobacterium Micro-coleus sp. [29], both microorganisms forming part of the sameindigenous consortium.
3.3. Heavy metal accumulation in DE2009 microalga
With the aim of proving whether the DE2009 microalga couldcapture metals, cells from cultures with and without Pb were anal-ysed by EDX coupled to SEM and TEM. In control cultures Pb wasnot detected either externally or internally.
Cultures containing Pb were also analysed using the sameabove-mentioned procedure. In this case, major differences in thestructure of DE2009 microalga were observed. A higher excretionof EPS was found surrounding the cells (Fig. 4A) and the EDX cou-pled to SEM demonstrated that Pb was found in EPS (Fig. 4B). Ithas been proved that different microorganisms have an EPS matrixwhich can protect cells against toxic compounds such as metalsand that its presence can overproduce exopolymer secretion [30].Also, more specifically, uronic acids and sulphate groups present inEPS may interact with various metals thereby immobilizing them[31].
Moreover, the ultrathin sections of DE2009 microalga alsoexhibited discernible changes (distortion of the cells) after expo-sure to Pb. An increase in the HE inclusions was evident (Fig. 4C),
Fig. 4. DE2009 microalga culture treated with 10 mM Pb. SEM image. Scale bar represents 10 !m (A). EDX spectrum coupled to SEM. Arrow indicates the main Pb peak at10.5 keV (B). Ultrathin section of DE2009 microalga. Arrows indicate the distribution of HE inclusions. Scale bar represents 0.2 !m (C). EDX spectrum coupled to TEM fromHE inclusions. Arrow indicates the main Pb peak at 10.5 keV (D).
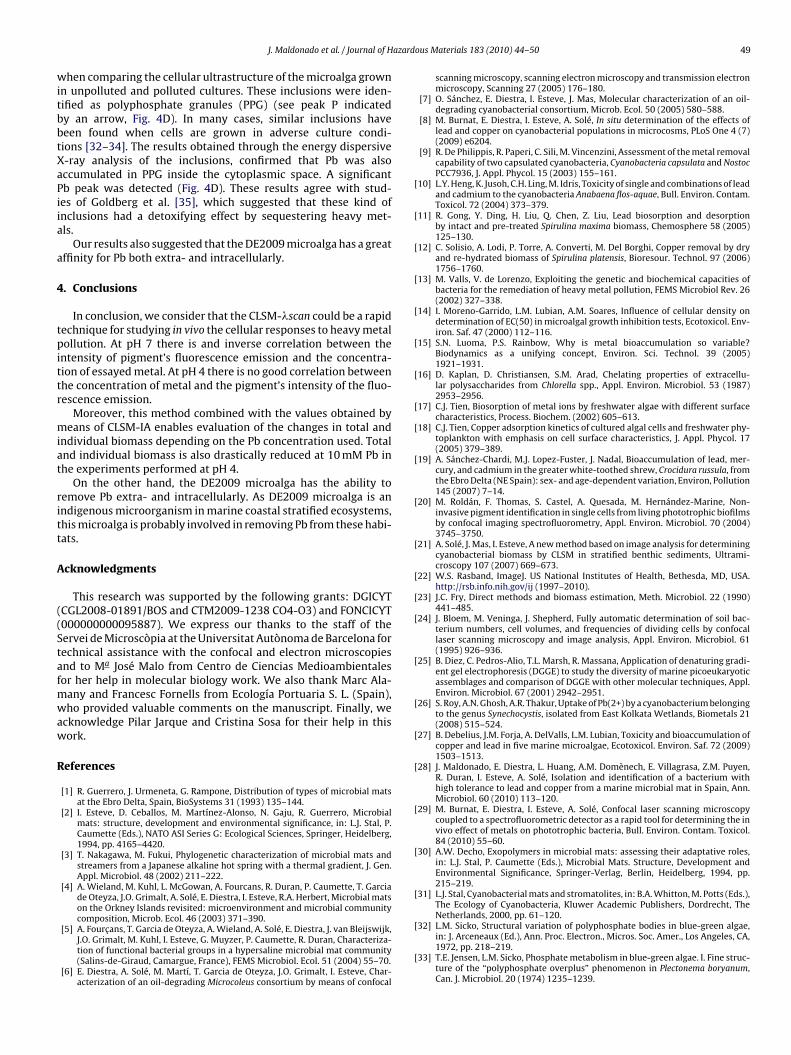
J. Maldonado et al. / Journal of Hazardous Materials 183 (2010) 44–50 49
when comparing the cellular ultrastructure of the microalga grownin unpolluted and polluted cultures. These inclusions were iden-tified as polyphosphate granules (PPG) (see peak P indicatedby an arrow, Fig. 4D). In many cases, similar inclusions havebeen found when cells are grown in adverse culture condi-tions [32–34]. The results obtained through the energy dispersiveX-ray analysis of the inclusions, confirmed that Pb was alsoaccumulated in PPG inside the cytoplasmic space. A significantPb peak was detected (Fig. 4D). These results agree with stud-ies of Goldberg et al. [35], which suggested that these kind ofinclusions had a detoxifying effect by sequestering heavy met-als.
Our results also suggested that the DE2009 microalga has a greataffinity for Pb both extra- and intracellularly.
4. Conclusions
In conclusion, we consider that the CLSM-!scan could be a rapidtechnique for studying in vivo the cellular responses to heavy metalpollution. At pH 7 there is and inverse correlation between theintensity of pigment’s fluorescence emission and the concentra-tion of essayed metal. At pH 4 there is no good correlation betweenthe concentration of metal and the pigment’s intensity of the fluo-rescence emission.
Moreover, this method combined with the values obtained bymeans of CLSM-IA enables evaluation of the changes in total andindividual biomass depending on the Pb concentration used. Totaland individual biomass is also drastically reduced at 10 mM Pb inthe experiments performed at pH 4.
On the other hand, the DE2009 microalga has the ability toremove Pb extra- and intracellularly. As DE2009 microalga is anindigenous microorganism in marine coastal stratified ecosystems,this microalga is probably involved in removing Pb from these habi-tats.
Acknowledgments
This research was supported by the following grants: DGICYT(CGL2008-01891/BOS and CTM2009-1238 CO4-O3) and FONCICYT(000000000095887). We express our thanks to the staff of theServei de Microscòpia at the Universitat Autònoma de Barcelona fortechnical assistance with the confocal and electron microscopiesand to Ma José Malo from Centro de Ciencias Medioambientalesfor her help in molecular biology work. We also thank Marc Ala-many and Francesc Fornells from Ecología Portuaria S. L. (Spain),who provided valuable comments on the manuscript. Finally, weacknowledge Pilar Jarque and Cristina Sosa for their help in thiswork.
References
[1] R. Guerrero, J. Urmeneta, G. Rampone, Distribution of types of microbial matsat the Ebro Delta, Spain, BioSystems 31 (1993) 135–144.
[2] I. Esteve, D. Ceballos, M. Martínez-Alonso, N. Gaju, R. Guerrero, Microbialmats: structure, development and environmental significance, in: L.J. Stal, P.Caumette (Eds.), NATO ASI Series G: Ecological Sciences, Springer, Heidelberg,1994, pp. 4165–4420.
[3] T. Nakagawa, M. Fukui, Phylogenetic characterization of microbial mats andstreamers from a Japanese alkaline hot spring with a thermal gradient, J. Gen.Appl. Microbiol. 48 (2002) 211–222.
[4] A. Wieland, M. Kuhl, L. McGowan, A. Fourcans, R. Duran, P. Caumette, T. Garciade Oteyza, J.O. Grimalt, A. Solé, E. Diestra, I. Esteve, R.A. Herbert, Microbial matson the Orkney Islands revisited: microenvironment and microbial communitycomposition, Microb. Ecol. 46 (2003) 371–390.
[5] A. Fourcans, T. Garcia de Oteyza, A. Wieland, A. Solé, E. Diestra, J. van Bleijswijk,J.O. Grimalt, M. Kuhl, I. Esteve, G. Muyzer, P. Caumette, R. Duran, Characteriza-tion of functional bacterial groups in a hypersaline microbial mat community(Salins-de-Giraud, Camargue, France), FEMS Microbiol. Ecol. 51 (2004) 55–70.
[6] E. Diestra, A. Solé, M. Martí, T. Garcia de Oteyza, J.O. Grimalt, I. Esteve, Char-acterization of an oil-degrading Microcoleus consortium by means of confocal
scanning microscopy, scanning electron microscopy and transmission electronmicroscopy, Scanning 27 (2005) 176–180.
[7] O. Sánchez, E. Diestra, I. Esteve, J. Mas, Molecular characterization of an oil-degrading cyanobacterial consortium, Microb. Ecol. 50 (2005) 580–588.
[8] M. Burnat, E. Diestra, I. Esteve, A. Solé, In situ determination of the effects oflead and copper on cyanobacterial populations in microcosms, PLoS One 4 (7)(2009) e6204.
[9] R. De Philippis, R. Paperi, C. Sili, M. Vincenzini, Assessment of the metal removalcapability of two capsulated cyanobacteria, Cyanobacteria capsulata and NostocPCC7936, J. Appl. Phycol. 15 (2003) 155–161.
[10] L.Y. Heng, K. Jusoh, C.H. Ling, M. Idris, Toxicity of single and combinations of leadand cadmium to the cyanobacteria Anabaena flos-aquae, Bull. Environ. Contam.Toxicol. 72 (2004) 373–379.
[11] R. Gong, Y. Ding, H. Liu, Q. Chen, Z. Liu, Lead biosorption and desorptionby intact and pre-treated Spirulina maxima biomass, Chemosphere 58 (2005)125–130.
[12] C. Solisio, A. Lodi, P. Torre, A. Converti, M. Del Borghi, Copper removal by dryand re-hydrated biomass of Spirulina platensis, Bioresour. Technol. 97 (2006)1756–1760.
[13] M. Valls, V. de Lorenzo, Exploiting the genetic and biochemical capacities ofbacteria for the remediation of heavy metal pollution, FEMS Microbiol Rev. 26(2002) 327–338.
[14] I. Moreno-Garrido, L.M. Lubian, A.M. Soares, Influence of cellular density ondetermination of EC(50) in microalgal growth inhibition tests, Ecotoxicol. Env-iron. Saf. 47 (2000) 112–116.
[15] S.N. Luoma, P.S. Rainbow, Why is metal bioaccumulation so variable?Biodynamics as a unifying concept, Environ. Sci. Technol. 39 (2005)1921–1931.
[16] D. Kaplan, D. Christiansen, S.M. Arad, Chelating properties of extracellu-lar polysaccharides from Chlorella spp., Appl. Environ. Microbiol. 53 (1987)2953–2956.
[17] C.J. Tien, Biosorption of metal ions by freshwater algae with different surfacecharacteristics, Process. Biochem. (2002) 605–613.
[18] C.J. Tien, Copper adsorption kinetics of cultured algal cells and freshwater phy-toplankton with emphasis on cell surface characteristics, J. Appl. Phycol. 17(2005) 379–389.
[19] A. Sánchez-Chardi, M.J. Lopez-Fuster, J. Nadal, Bioaccumulation of lead, mer-cury, and cadmium in the greater white-toothed shrew, Crocidura russula, fromthe Ebro Delta (NE Spain): sex- and age-dependent variation, Environ, Pollution145 (2007) 7–14.
[20] M. Roldán, F. Thomas, S. Castel, A. Quesada, M. Hernández-Marine, Non-invasive pigment identification in single cells from living phototrophic biofilmsby confocal imaging spectrofluorometry, Appl. Environ. Microbiol. 70 (2004)3745–3750.
[21] A. Solé, J. Mas, I. Esteve, A new method based on image analysis for determiningcyanobacterial biomass by CLSM in stratified benthic sediments, Ultrami-croscopy 107 (2007) 669–673.
[22] W.S. Rasband, ImageJ. US National Institutes of Health, Bethesda, MD, USA.http://rsb.info.nih.gov/ij (1997–2010).
[23] J.C. Fry, Direct methods and biomass estimation, Meth. Microbiol. 22 (1990)441–485.
[24] J. Bloem, M. Veninga, J. Shepherd, Fully automatic determination of soil bac-terium numbers, cell volumes, and frequencies of dividing cells by confocallaser scanning microscopy and image analysis, Appl. Environ. Microbiol. 61(1995) 926–936.
[25] B. Diez, C. Pedros-Alio, T.L. Marsh, R. Massana, Application of denaturing gradi-ent gel electrophoresis (DGGE) to study the diversity of marine picoeukaryoticassemblages and comparison of DGGE with other molecular techniques, Appl.Environ. Microbiol. 67 (2001) 2942–2951.
[26] S. Roy, A.N. Ghosh, A.R. Thakur, Uptake of Pb(2+) by a cyanobacterium belongingto the genus Synechocystis, isolated from East Kolkata Wetlands, Biometals 21(2008) 515–524.
[27] B. Debelius, J.M. Forja, A. DelValls, L.M. Lubian, Toxicity and bioaccumulation ofcopper and lead in five marine microalgae, Ecotoxicol. Environ. Saf. 72 (2009)1503–1513.
[28] J. Maldonado, E. Diestra, L. Huang, A.M. Domènech, E. Villagrasa, Z.M. Puyen,R. Duran, I. Esteve, A. Solé, Isolation and identification of a bacterium withhigh tolerance to lead and copper from a marine microbial mat in Spain, Ann.Microbiol. 60 (2010) 113–120.
[29] M. Burnat, E. Diestra, I. Esteve, A. Solé, Confocal laser scanning microscopycoupled to a spectrofluorometric detector as a rapid tool for determining the invivo effect of metals on phototrophic bacteria, Bull. Environ. Contam. Toxicol.84 (2010) 55–60.
[30] A.W. Decho, Exopolymers in microbial mats: assessing their adaptative roles,in: L.J. Stal, P. Caumette (Eds.), Microbial Mats. Structure, Development andEnvironmental Significance, Springer-Verlag, Berlin, Heidelberg, 1994, pp.215–219.
[31] L.J. Stal, Cyanobacterial mats and stromatolites, in: B.A. Whitton, M. Potts (Eds.),The Ecology of Cyanobacteria, Kluwer Academic Publishers, Dordrecht, TheNetherlands, 2000, pp. 61–120.
[32] L.M. Sicko, Structural variation of polyphosphate bodies in blue-green algae,in: J. Arceneaux (Ed.), Ann. Proc. Electron., Micros. Soc. Amer., Los Angeles, CA,1972, pp. 218–219.
[33] T.E. Jensen, L.M. Sicko, Phosphate metabolism in blue-green algae. I. Fine struc-ture of the “polyphosphate overplus” phenomenon in Plectonema boryanum,Can. J. Microbiol. 20 (1974) 1235–1239.

50 J. Maldonado et al. / Journal of Hazardous Materials 183 (2010) 44–50
[34] S.E. Stevens Jr., S.A. Nierzwicki-Bauer, D.L. Balkwill, Effect ofnitrogen starvation on the morphology and ultrastructure of thecyanobacterium Mastigocladus laminosus, J. Bacteriol. 161 (1985)1215–1218.
[35] J. Goldberg, H. González, T.E. Jensen, W.A. Corpe, Quantitativeanalysis of the elemental composition and the mass of bacte-rial polyphosphate bodies using STEM EDX, Microbios 106 (2001)177–188.
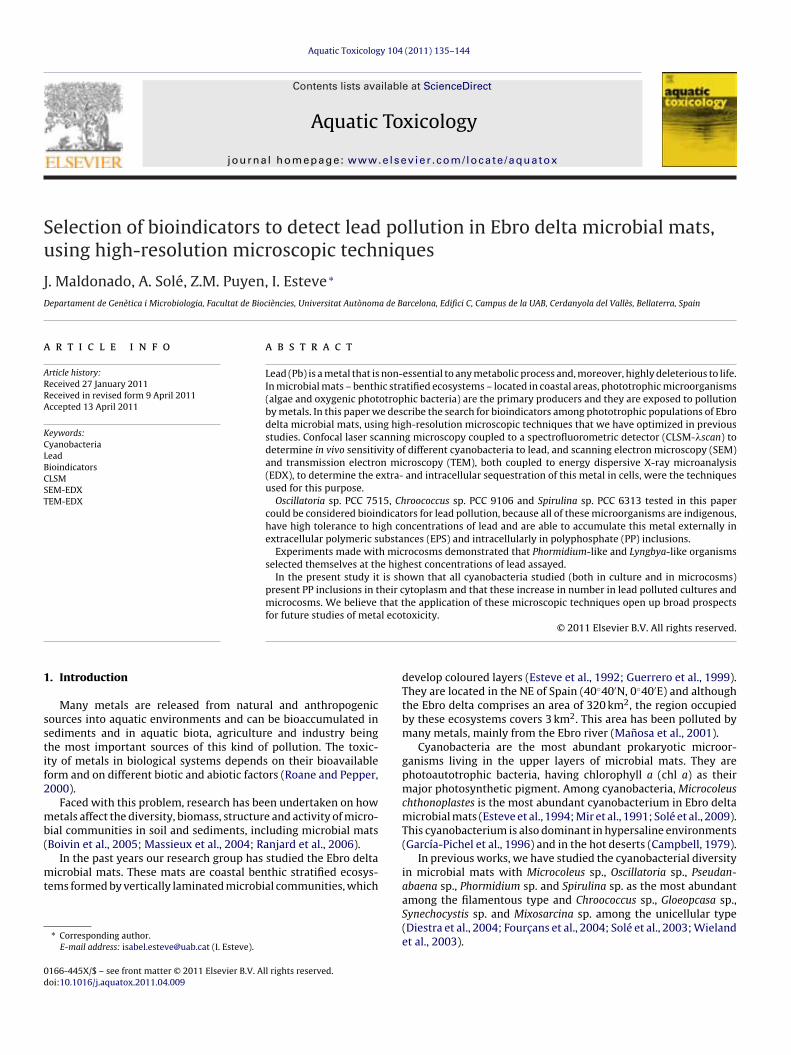
Aquatic Toxicology 104 (2011) 135–144
Contents lists available at ScienceDirect
Aquatic Toxicology
journa l homepage: www.e lsev ier .com/ locate /aquatox
Selection of bioindicators to detect lead pollution in Ebro delta microbial mats,using high-resolution microscopic techniques
J. Maldonado, A. Solé, Z.M. Puyen, I. Esteve !
Departament de Genètica i Microbiologia, Facultat de Biociències, Universitat Autònoma de Barcelona, Edifici C, Campus de la UAB, Cerdanyola del Vallès, Bellaterra, Spain
a r t i c l e i n f o
Article history:Received 27 January 2011Received in revised form 9 April 2011Accepted 13 April 2011
Keywords:CyanobacteriaLeadBioindicatorsCLSMSEM-EDXTEM-EDX
a b s t r a c t
Lead (Pb) is a metal that is non-essential to any metabolic process and, moreover, highly deleterious to life.In microbial mats – benthic stratified ecosystems – located in coastal areas, phototrophic microorganisms(algae and oxygenic phototrophic bacteria) are the primary producers and they are exposed to pollutionby metals. In this paper we describe the search for bioindicators among phototrophic populations of Ebrodelta microbial mats, using high-resolution microscopic techniques that we have optimized in previousstudies. Confocal laser scanning microscopy coupled to a spectrofluorometric detector (CLSM-!scan) todetermine in vivo sensitivity of different cyanobacteria to lead, and scanning electron microscopy (SEM)and transmission electron microscopy (TEM), both coupled to energy dispersive X-ray microanalysis(EDX), to determine the extra- and intracellular sequestration of this metal in cells, were the techniquesused for this purpose.
Oscillatoria sp. PCC 7515, Chroococcus sp. PCC 9106 and Spirulina sp. PCC 6313 tested in this papercould be considered bioindicators for lead pollution, because all of these microorganisms are indigenous,have high tolerance to high concentrations of lead and are able to accumulate this metal externally inextracellular polymeric substances (EPS) and intracellularly in polyphosphate (PP) inclusions.
Experiments made with microcosms demonstrated that Phormidium-like and Lyngbya-like organismsselected themselves at the highest concentrations of lead assayed.
In the present study it is shown that all cyanobacteria studied (both in culture and in microcosms)present PP inclusions in their cytoplasm and that these increase in number in lead polluted cultures andmicrocosms. We believe that the application of these microscopic techniques open up broad prospectsfor future studies of metal ecotoxicity.
© 2011 Elsevier B.V. All rights reserved.
1. Introduction
Many metals are released from natural and anthropogenicsources into aquatic environments and can be bioaccumulated insediments and in aquatic biota, agriculture and industry beingthe most important sources of this kind of pollution. The toxic-ity of metals in biological systems depends on their bioavailableform and on different biotic and abiotic factors (Roane and Pepper,2000).
Faced with this problem, research has been undertaken on howmetals affect the diversity, biomass, structure and activity of micro-bial communities in soil and sediments, including microbial mats(Boivin et al., 2005; Massieux et al., 2004; Ranjard et al., 2006).
In the past years our research group has studied the Ebro deltamicrobial mats. These mats are coastal benthic stratified ecosys-tems formed by vertically laminated microbial communities, which
! Corresponding author.E-mail address: [email protected] (I. Esteve).
develop coloured layers (Esteve et al., 1992; Guerrero et al., 1999).They are located in the NE of Spain (40"40#N, 0"40#E) and althoughthe Ebro delta comprises an area of 320 km2, the region occupiedby these ecosystems covers 3 km2. This area has been polluted bymany metals, mainly from the Ebro river (Manosa et al., 2001).
Cyanobacteria are the most abundant prokaryotic microor-ganisms living in the upper layers of microbial mats. They arephotoautotrophic bacteria, having chlorophyll a (chl a) as theirmajor photosynthetic pigment. Among cyanobacteria, Microcoleuschthonoplastes is the most abundant cyanobacterium in Ebro deltamicrobial mats (Esteve et al., 1994; Mir et al., 1991; Solé et al., 2009).This cyanobacterium is also dominant in hypersaline environments(García-Pichel et al., 1996) and in the hot deserts (Campbell, 1979).
In previous works, we have studied the cyanobacterial diversityin microbial mats with Microcoleus sp., Oscillatoria sp., Pseudan-abaena sp., Phormidium sp. and Spirulina sp. as the most abundantamong the filamentous type and Chroococcus sp., Gloeopcasa sp.,Synechocystis sp. and Mixosarcina sp. among the unicellular type(Diestra et al., 2004; Fourcans et al., 2004; Solé et al., 2003; Wielandet al., 2003).
0166-445X/$ – see front matter © 2011 Elsevier B.V. All rights reserved.doi:10.1016/j.aquatox.2011.04.009
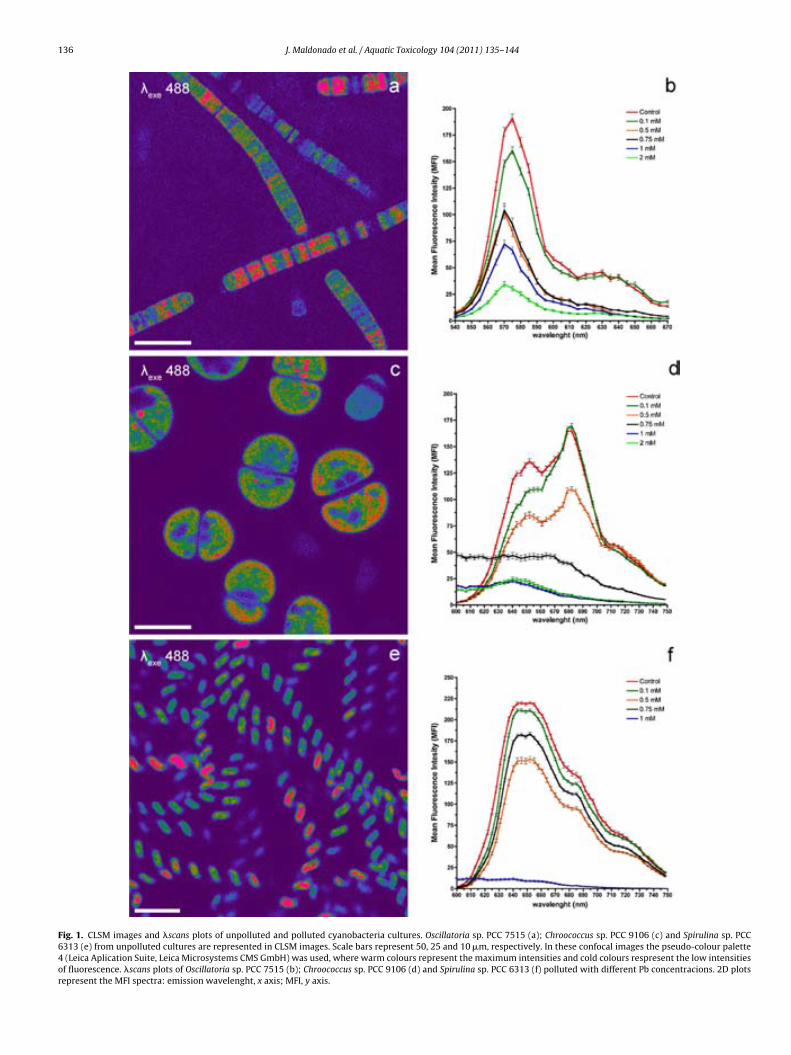
136 J. Maldonado et al. / Aquatic Toxicology 104 (2011) 135–144
Fig. 1. CLSM images and !scans plots of unpolluted and polluted cyanobacteria cultures. Oscillatoria sp. PCC 7515 (a); Chroococcus sp. PCC 9106 (c) and Spirulina sp. PCC6313 (e) from unpolluted cultures are represented in CLSM images. Scale bars represent 50, 25 and 10 "m, respectively. In these confocal images the pseudo-colour palette4 (Leica Aplication Suite, Leica Microsystems CMS GmbH) was used, where warm colours represent the maximum intensities and cold colours respresent the low intensitiesof fluorescence. !scans plots of Oscillatoria sp. PCC 7515 (b); Chroococcus sp. PCC 9106 (d) and Spirulina sp. PCC 6313 (f) polluted with different Pb concentracions. 2D plotsrepresent the MFI spectra: emission wavelenght, x axis; MFI, y axis.
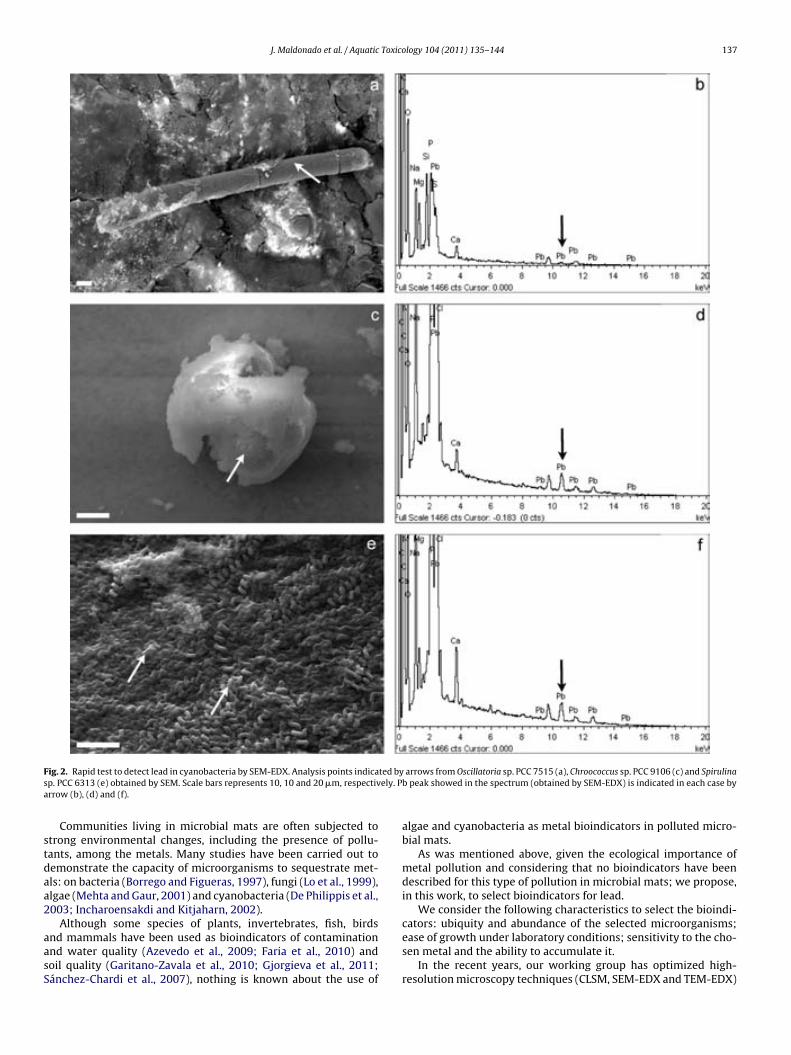
J. Maldonado et al. / Aquatic Toxicology 104 (2011) 135–144 137
Fig. 2. Rapid test to detect lead in cyanobacteria by SEM-EDX. Analysis points indicated by arrows from Oscillatoria sp. PCC 7515 (a), Chroococcus sp. PCC 9106 (c) and Spirulinasp. PCC 6313 (e) obtained by SEM. Scale bars represents 10, 10 and 20 !m, respectively. Pb peak showed in the spectrum (obtained by SEM-EDX) is indicated in each case byarrow (b), (d) and (f).
Communities living in microbial mats are often subjected tostrong environmental changes, including the presence of pollu-tants, among the metals. Many studies have been carried out todemonstrate the capacity of microorganisms to sequestrate met-als: on bacteria (Borrego and Figueras, 1997), fungi (Lo et al., 1999),algae (Mehta and Gaur, 2001) and cyanobacteria (De Philippis et al.,2003; Incharoensakdi and Kitjaharn, 2002).
Although some species of plants, invertebrates, fish, birdsand mammals have been used as bioindicators of contaminationand water quality (Azevedo et al., 2009; Faria et al., 2010) andsoil quality (Garitano-Zavala et al., 2010; Gjorgieva et al., 2011;Sánchez-Chardi et al., 2007), nothing is known about the use of
algae and cyanobacteria as metal bioindicators in polluted micro-bial mats.
As was mentioned above, given the ecological importance ofmetal pollution and considering that no bioindicators have beendescribed for this type of pollution in microbial mats; we propose,in this work, to select bioindicators for lead.
We consider the following characteristics to select the bioindi-cators: ubiquity and abundance of the selected microorganisms;ease of growth under laboratory conditions; sensitivity to the cho-sen metal and the ability to accumulate it.
In the recent years, our working group has optimized high-resolution microscopy techniques (CLSM, SEM-EDX and TEM-EDX)
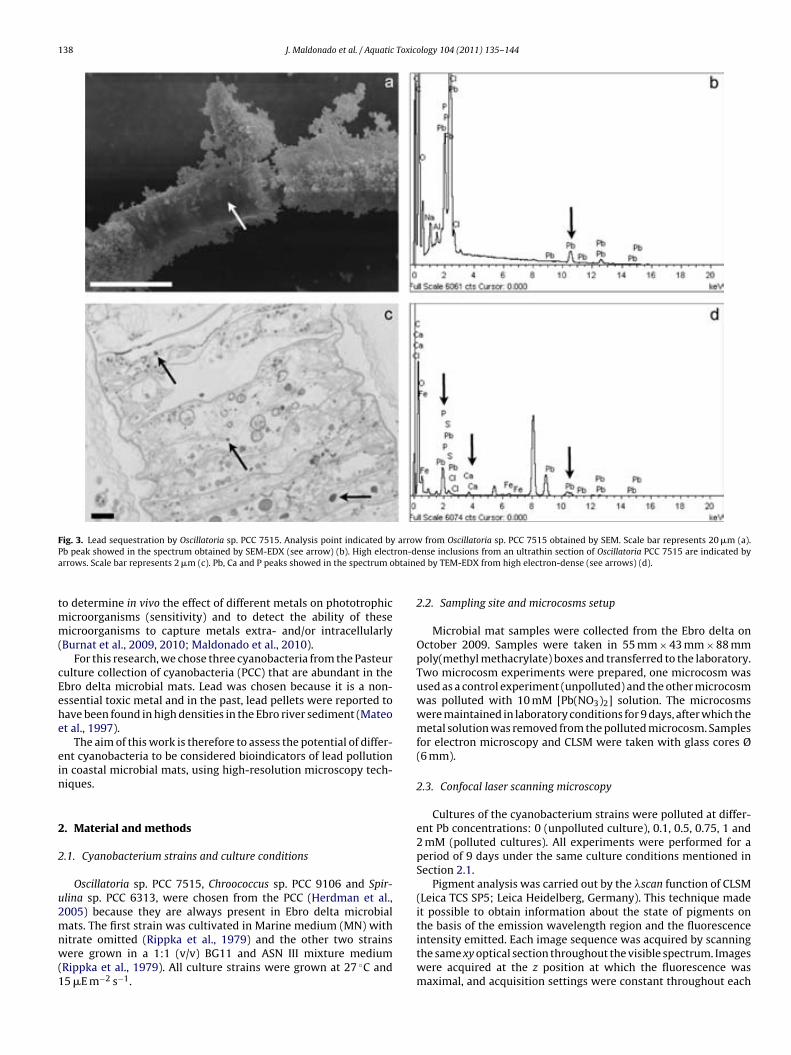
138 J. Maldonado et al. / Aquatic Toxicology 104 (2011) 135–144
Fig. 3. Lead sequestration by Oscillatoria sp. PCC 7515. Analysis point indicated by arrow from Oscillatoria sp. PCC 7515 obtained by SEM. Scale bar represents 20 !m (a).Pb peak showed in the spectrum obtained by SEM-EDX (see arrow) (b). High electron-dense inclusions from an ultrathin section of Oscillatoria PCC 7515 are indicated byarrows. Scale bar represents 2 !m (c). Pb, Ca and P peaks showed in the spectrum obtained by TEM-EDX from high electron-dense (see arrows) (d).
to determine in vivo the effect of different metals on phototrophicmicroorganisms (sensitivity) and to detect the ability of thesemicroorganisms to capture metals extra- and/or intracellularly(Burnat et al., 2009, 2010; Maldonado et al., 2010).
For this research, we chose three cyanobacteria from the Pasteurculture collection of cyanobacteria (PCC) that are abundant in theEbro delta microbial mats. Lead was chosen because it is a non-essential toxic metal and in the past, lead pellets were reported tohave been found in high densities in the Ebro river sediment (Mateoet al., 1997).
The aim of this work is therefore to assess the potential of differ-ent cyanobacteria to be considered bioindicators of lead pollutionin coastal microbial mats, using high-resolution microscopy tech-niques.
2. Material and methods
2.1. Cyanobacterium strains and culture conditions
Oscillatoria sp. PCC 7515, Chroococcus sp. PCC 9106 and Spir-ulina sp. PCC 6313, were chosen from the PCC (Herdman et al.,2005) because they are always present in Ebro delta microbialmats. The first strain was cultivated in Marine medium (MN) withnitrate omitted (Rippka et al., 1979) and the other two strainswere grown in a 1:1 (v/v) BG11 and ASN III mixture medium(Rippka et al., 1979). All culture strains were grown at 27 !C and15 !E m"2 s"1.
2.2. Sampling site and microcosms setup
Microbial mat samples were collected from the Ebro delta onOctober 2009. Samples were taken in 55 mm # 43 mm # 88 mmpoly(methyl methacrylate) boxes and transferred to the laboratory.Two microcosm experiments were prepared, one microcosm wasused as a control experiment (unpolluted) and the other microcosmwas polluted with 10 mM [Pb(NO3)2] solution. The microcosmswere maintained in laboratory conditions for 9 days, after which themetal solution was removed from the polluted microcosm. Samplesfor electron microscopy and CLSM were taken with glass cores Ø(6 mm).
2.3. Confocal laser scanning microscopy
Cultures of the cyanobacterium strains were polluted at differ-ent Pb concentrations: 0 (unpolluted culture), 0.1, 0.5, 0.75, 1 and2 mM (polluted cultures). All experiments were performed for aperiod of 9 days under the same culture conditions mentioned inSection 2.1.
Pigment analysis was carried out by the !scan function of CLSM(Leica TCS SP5; Leica Heidelberg, Germany). This technique madeit possible to obtain information about the state of pigments onthe basis of the emission wavelength region and the fluorescenceintensity emitted. Each image sequence was acquired by scanningthe same xy optical section throughout the visible spectrum. Imageswere acquired at the z position at which the fluorescence wasmaximal, and acquisition settings were constant throughout each
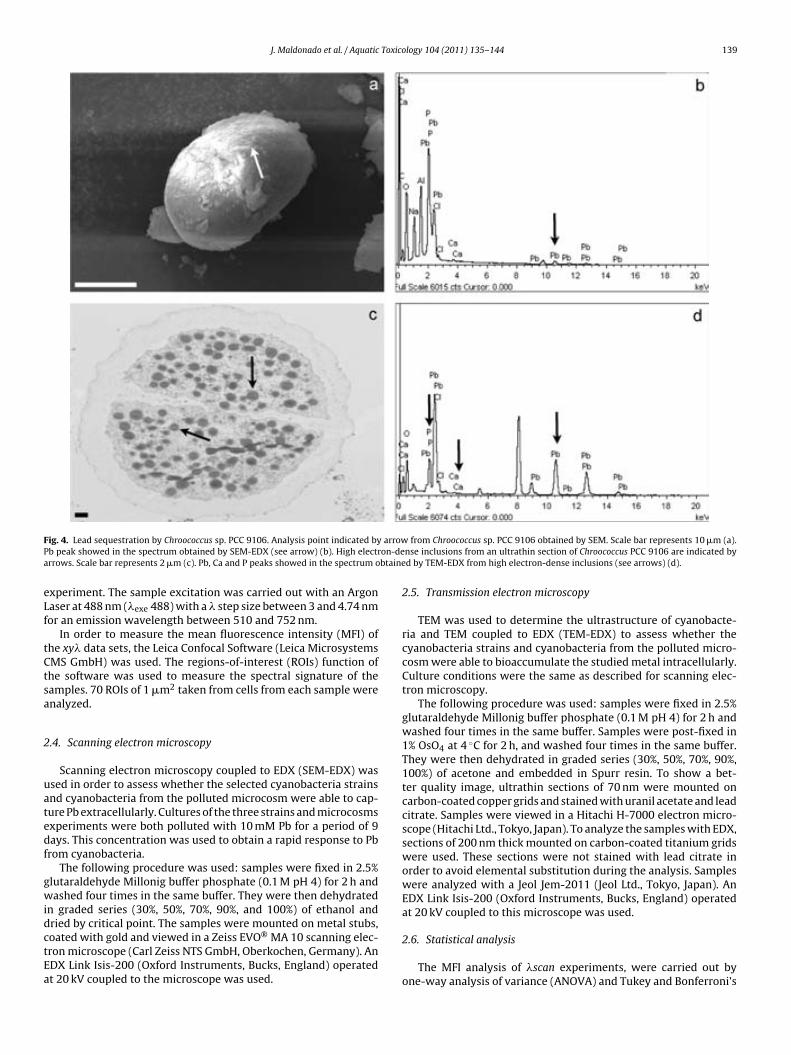
J. Maldonado et al. / Aquatic Toxicology 104 (2011) 135–144 139
Fig. 4. Lead sequestration by Chroococcus sp. PCC 9106. Analysis point indicated by arrow from Chroococcus sp. PCC 9106 obtained by SEM. Scale bar represents 10 !m (a).Pb peak showed in the spectrum obtained by SEM-EDX (see arrow) (b). High electron-dense inclusions from an ultrathin section of Chroococcus PCC 9106 are indicated byarrows. Scale bar represents 2 !m (c). Pb, Ca and P peaks showed in the spectrum obtained by TEM-EDX from high electron-dense inclusions (see arrows) (d).
experiment. The sample excitation was carried out with an ArgonLaser at 488 nm (!exe 488) with a ! step size between 3 and 4.74 nmfor an emission wavelength between 510 and 752 nm.
In order to measure the mean fluorescence intensity (MFI) ofthe xy! data sets, the Leica Confocal Software (Leica MicrosystemsCMS GmbH) was used. The regions-of-interest (ROIs) function ofthe software was used to measure the spectral signature of thesamples. 70 ROIs of 1 !m2 taken from cells from each sample wereanalyzed.
2.4. Scanning electron microscopy
Scanning electron microscopy coupled to EDX (SEM-EDX) wasused in order to assess whether the selected cyanobacteria strainsand cyanobacteria from the polluted microcosm were able to cap-ture Pb extracellularly. Cultures of the three strains and microcosmsexperiments were both polluted with 10 mM Pb for a period of 9days. This concentration was used to obtain a rapid response to Pbfrom cyanobacteria.
The following procedure was used: samples were fixed in 2.5%glutaraldehyde Millonig buffer phosphate (0.1 M pH 4) for 2 h andwashed four times in the same buffer. They were then dehydratedin graded series (30%, 50%, 70%, 90%, and 100%) of ethanol anddried by critical point. The samples were mounted on metal stubs,coated with gold and viewed in a Zeiss EVO® MA 10 scanning elec-tron microscope (Carl Zeiss NTS GmbH, Oberkochen, Germany). AnEDX Link Isis-200 (Oxford Instruments, Bucks, England) operatedat 20 kV coupled to the microscope was used.
2.5. Transmission electron microscopy
TEM was used to determine the ultrastructure of cyanobacte-ria and TEM coupled to EDX (TEM-EDX) to assess whether thecyanobacteria strains and cyanobacteria from the polluted micro-cosm were able to bioaccumulate the studied metal intracellularly.Culture conditions were the same as described for scanning elec-tron microscopy.
The following procedure was used: samples were fixed in 2.5%glutaraldehyde Millonig buffer phosphate (0.1 M pH 4) for 2 h andwashed four times in the same buffer. Samples were post-fixed in1% OsO4 at 4 !C for 2 h, and washed four times in the same buffer.They were then dehydrated in graded series (30%, 50%, 70%, 90%,100%) of acetone and embedded in Spurr resin. To show a bet-ter quality image, ultrathin sections of 70 nm were mounted oncarbon-coated copper grids and stained with uranil acetate and leadcitrate. Samples were viewed in a Hitachi H-7000 electron micro-scope (Hitachi Ltd., Tokyo, Japan). To analyze the samples with EDX,sections of 200 nm thick mounted on carbon-coated titanium gridswere used. These sections were not stained with lead citrate inorder to avoid elemental substitution during the analysis. Sampleswere analyzed with a Jeol Jem-2011 (Jeol Ltd., Tokyo, Japan). AnEDX Link Isis-200 (Oxford Instruments, Bucks, England) operatedat 20 kV coupled to this microscope was used.
2.6. Statistical analysis
The MFI analysis of !scan experiments, were carried out byone-way analysis of variance (ANOVA) and Tukey and Bonferroni’s
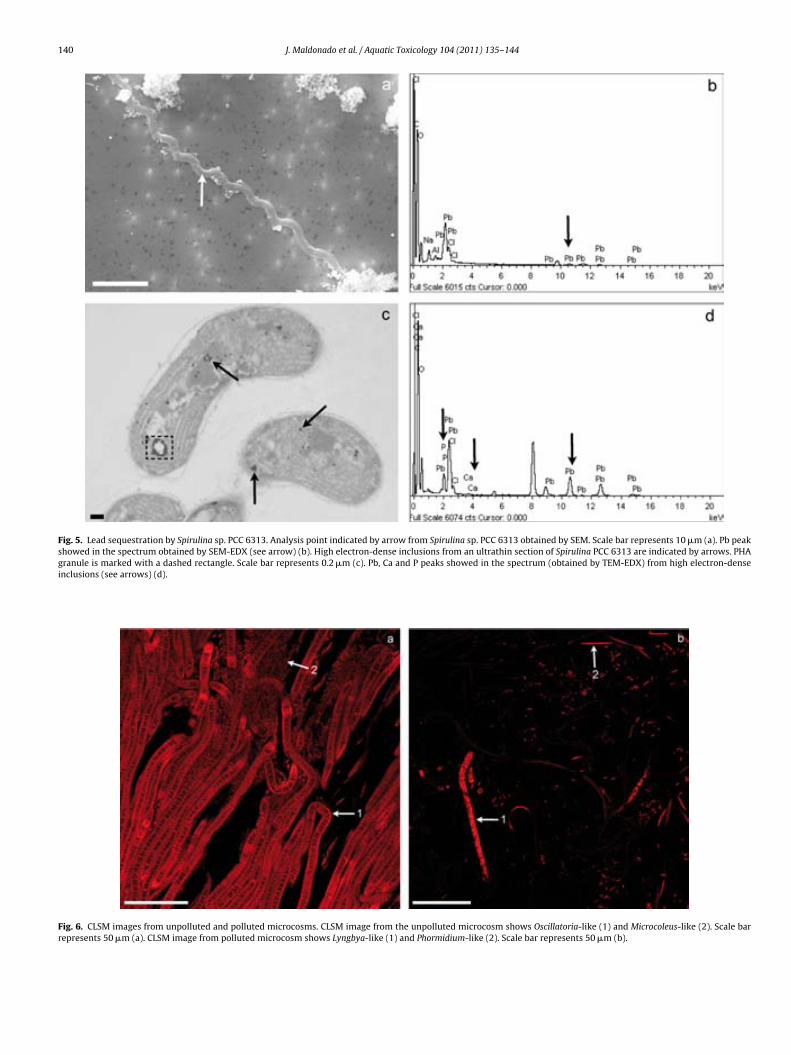
140 J. Maldonado et al. / Aquatic Toxicology 104 (2011) 135–144
Fig. 5. Lead sequestration by Spirulina sp. PCC 6313. Analysis point indicated by arrow from Spirulina sp. PCC 6313 obtained by SEM. Scale bar represents 10 !m (a). Pb peakshowed in the spectrum obtained by SEM-EDX (see arrow) (b). High electron-dense inclusions from an ultrathin section of Spirulina PCC 6313 are indicated by arrows. PHAgranule is marked with a dashed rectangle. Scale bar represents 0.2 !m (c). Pb, Ca and P peaks showed in the spectrum (obtained by TEM-EDX) from high electron-denseinclusions (see arrows) (d).
Fig. 6. CLSM images from unpolluted and polluted microcosms. CLSM image from the unpolluted microcosm shows Oscillatoria-like (1) and Microcoleus-like (2). Scale barrepresents 50 !m (a). CLSM image from polluted microcosm shows Lyngbya-like (1) and Phormidium-like (2). Scale bar represents 50 !m (b).
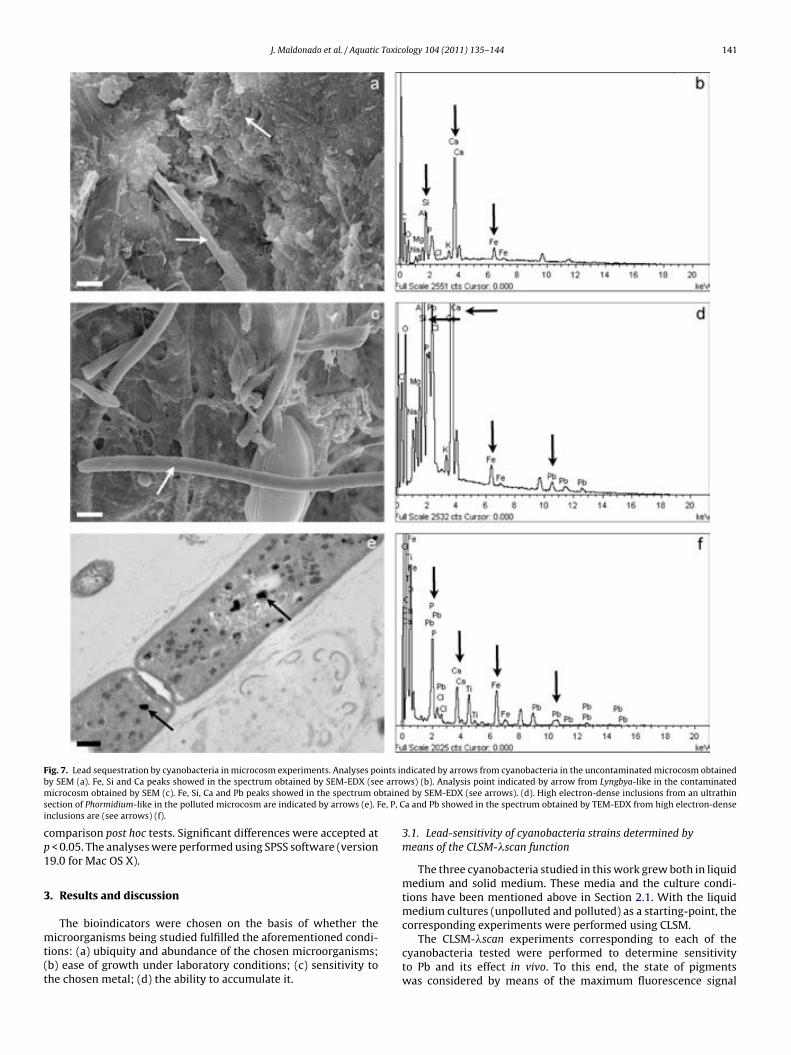
J. Maldonado et al. / Aquatic Toxicology 104 (2011) 135–144 141
Fig. 7. Lead sequestration by cyanobacteria in microcosm experiments. Analyses points indicated by arrows from cyanobacteria in the uncontaminated microcosm obtainedby SEM (a). Fe, Si and Ca peaks showed in the spectrum obtained by SEM-EDX (see arrows) (b). Analysis point indicated by arrow from Lyngbya-like in the contaminatedmicrocosm obtained by SEM (c). Fe, Si, Ca and Pb peaks showed in the spectrum obtained by SEM-EDX (see arrows). (d). High electron-dense inclusions from an ultrathinsection of Phormidium-like in the polluted microcosm are indicated by arrows (e). Fe, P, Ca and Pb showed in the spectrum obtained by TEM-EDX from high electron-denseinclusions are (see arrows) (f).
comparison post hoc tests. Significant differences were accepted atp < 0.05. The analyses were performed using SPSS software (version19.0 for Mac OS X).
3. Results and discussion
The bioindicators were chosen on the basis of whether themicroorganisms being studied fulfilled the aforementioned condi-tions: (a) ubiquity and abundance of the chosen microorganisms;(b) ease of growth under laboratory conditions; (c) sensitivity tothe chosen metal; (d) the ability to accumulate it.
3.1. Lead-sensitivity of cyanobacteria strains determined bymeans of the CLSM-!scan function
The three cyanobacteria studied in this work grew both in liquidmedium and solid medium. These media and the culture condi-tions have been mentioned above in Section 2.1. With the liquidmedium cultures (unpolluted and polluted) as a starting-point, thecorresponding experiments were performed using CLSM.
The CLSM-!scan experiments corresponding to each of thecyanobacteria tested were performed to determine sensitivityto Pb and its effect in vivo. To this end, the state of pigmentswas considered by means of the maximum fluorescence signal
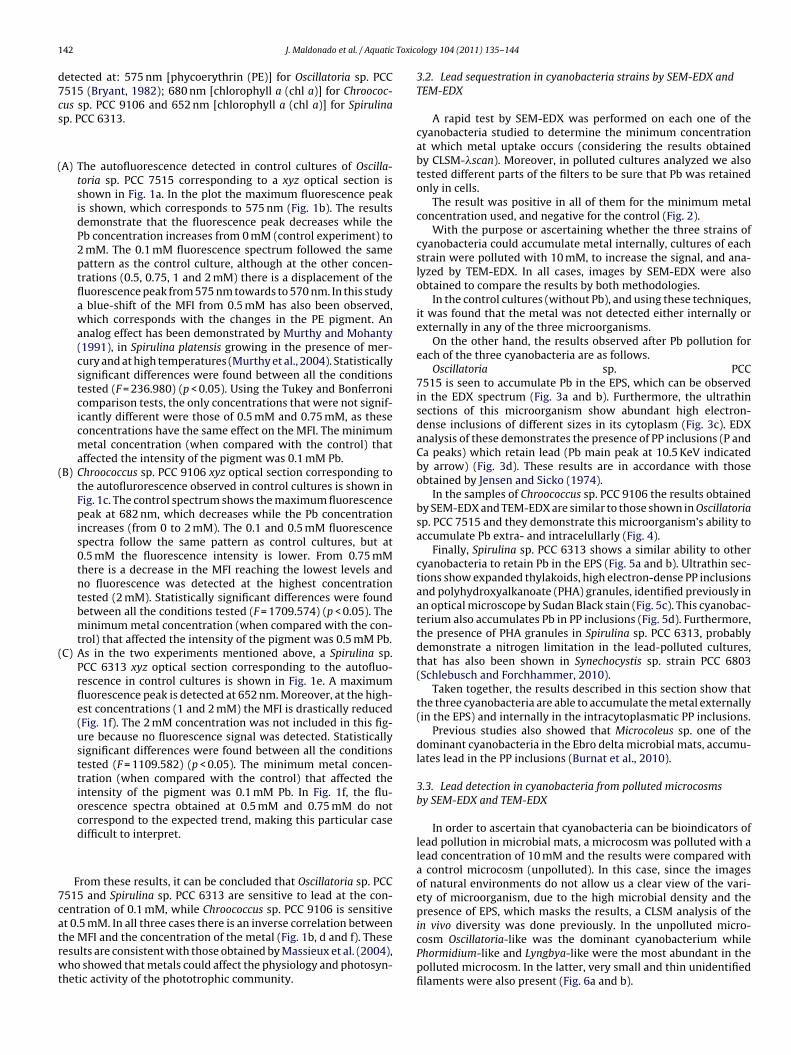
142 J. Maldonado et al. / Aquatic Toxicology 104 (2011) 135–144
detected at: 575 nm [phycoerythrin (PE)] for Oscillatoria sp. PCC7515 (Bryant, 1982); 680 nm [chlorophyll a (chl a)] for Chroococ-cus sp. PCC 9106 and 652 nm [chlorophyll a (chl a)] for Spirulinasp. PCC 6313.
(A) The autofluorescence detected in control cultures of Oscilla-toria sp. PCC 7515 corresponding to a xyz optical section isshown in Fig. 1a. In the plot the maximum fluorescence peakis shown, which corresponds to 575 nm (Fig. 1b). The resultsdemonstrate that the fluorescence peak decreases while thePb concentration increases from 0 mM (control experiment) to2 mM. The 0.1 mM fluorescence spectrum followed the samepattern as the control culture, although at the other concen-trations (0.5, 0.75, 1 and 2 mM) there is a displacement of thefluorescence peak from 575 nm towards to 570 nm. In this studya blue-shift of the MFI from 0.5 mM has also been observed,which corresponds with the changes in the PE pigment. Ananalog effect has been demonstrated by Murthy and Mohanty(1991), in Spirulina platensis growing in the presence of mer-cury and at high temperatures (Murthy et al., 2004). Statisticallysignificant differences were found between all the conditionstested (F = 236.980) (p < 0.05). Using the Tukey and Bonferronicomparison tests, the only concentrations that were not signif-icantly different were those of 0.5 mM and 0.75 mM, as theseconcentrations have the same effect on the MFI. The minimummetal concentration (when compared with the control) thataffected the intensity of the pigment was 0.1 mM Pb.
(B) Chroococcus sp. PCC 9106 xyz optical section corresponding tothe autoflurorescence observed in control cultures is shown inFig. 1c. The control spectrum shows the maximum fluorescencepeak at 682 nm, which decreases while the Pb concentrationincreases (from 0 to 2 mM). The 0.1 and 0.5 mM fluorescencespectra follow the same pattern as control cultures, but at0.5 mM the fluorescence intensity is lower. From 0.75 mMthere is a decrease in the MFI reaching the lowest levels andno fluorescence was detected at the highest concentrationtested (2 mM). Statistically significant differences were foundbetween all the conditions tested (F = 1709.574) (p < 0.05). Theminimum metal concentration (when compared with the con-trol) that affected the intensity of the pigment was 0.5 mM Pb.
(C) As in the two experiments mentioned above, a Spirulina sp.PCC 6313 xyz optical section corresponding to the autofluo-rescence in control cultures is shown in Fig. 1e. A maximumfluorescence peak is detected at 652 nm. Moreover, at the high-est concentrations (1 and 2 mM) the MFI is drastically reduced(Fig. 1f). The 2 mM concentration was not included in this fig-ure because no fluorescence signal was detected. Statisticallysignificant differences were found between all the conditionstested (F = 1109.582) (p < 0.05). The minimum metal concen-tration (when compared with the control) that affected theintensity of the pigment was 0.1 mM Pb. In Fig. 1f, the flu-orescence spectra obtained at 0.5 mM and 0.75 mM do notcorrespond to the expected trend, making this particular casedifficult to interpret.
From these results, it can be concluded that Oscillatoria sp. PCC7515 and Spirulina sp. PCC 6313 are sensitive to lead at the con-centration of 0.1 mM, while Chroococcus sp. PCC 9106 is sensitiveat 0.5 mM. In all three cases there is an inverse correlation betweenthe MFI and the concentration of the metal (Fig. 1b, d and f). Theseresults are consistent with those obtained by Massieux et al. (2004),who showed that metals could affect the physiology and photosyn-thetic activity of the phototrophic community.
3.2. Lead sequestration in cyanobacteria strains by SEM-EDX andTEM-EDX
A rapid test by SEM-EDX was performed on each one of thecyanobacteria studied to determine the minimum concentrationat which metal uptake occurs (considering the results obtainedby CLSM-!scan). Moreover, in polluted cultures analyzed we alsotested different parts of the filters to be sure that Pb was retainedonly in cells.
The result was positive in all of them for the minimum metalconcentration used, and negative for the control (Fig. 2).
With the purpose or ascertaining whether the three strains ofcyanobacteria could accumulate metal internally, cultures of eachstrain were polluted with 10 mM, to increase the signal, and ana-lyzed by TEM-EDX. In all cases, images by SEM-EDX were alsoobtained to compare the results by both methodologies.
In the control cultures (without Pb), and using these techniques,it was found that the metal was not detected either internally orexternally in any of the three microorganisms.
On the other hand, the results observed after Pb pollution foreach of the three cyanobacteria are as follows.
Oscillatoria sp. PCC7515 is seen to accumulate Pb in the EPS, which can be observedin the EDX spectrum (Fig. 3a and b). Furthermore, the ultrathinsections of this microorganism show abundant high electron-dense inclusions of different sizes in its cytoplasm (Fig. 3c). EDXanalysis of these demonstrates the presence of PP inclusions (P andCa peaks) which retain lead (Pb main peak at 10.5 KeV indicatedby arrow) (Fig. 3d). These results are in accordance with thoseobtained by Jensen and Sicko (1974).
In the samples of Chroococcus sp. PCC 9106 the results obtainedby SEM-EDX and TEM-EDX are similar to those shown in Oscillatoriasp. PCC 7515 and they demonstrate this microorganism’s ability toaccumulate Pb extra- and intracelullarly (Fig. 4).
Finally, Spirulina sp. PCC 6313 shows a similar ability to othercyanobacteria to retain Pb in the EPS (Fig. 5a and b). Ultrathin sec-tions show expanded thylakoids, high electron-dense PP inclusionsand polyhydroxyalkanoate (PHA) granules, identified previously inan optical microscope by Sudan Black stain (Fig. 5c). This cyanobac-terium also accumulates Pb in PP inclusions (Fig. 5d). Furthermore,the presence of PHA granules in Spirulina sp. PCC 6313, probablydemonstrate a nitrogen limitation in the lead-polluted cultures,that has also been shown in Synechocystis sp. strain PCC 6803(Schlebusch and Forchhammer, 2010).
Taken together, the results described in this section show thatthe three cyanobacteria are able to accumulate the metal externally(in the EPS) and internally in the intracytoplasmatic PP inclusions.
Previous studies also showed that Microcoleus sp. one of thedominant cyanobacteria in the Ebro delta microbial mats, accumu-lates lead in the PP inclusions (Burnat et al., 2010).
3.3. Lead detection in cyanobacteria from polluted microcosmsby SEM-EDX and TEM-EDX
In order to ascertain that cyanobacteria can be bioindicators oflead pollution in microbial mats, a microcosm was polluted with alead concentration of 10 mM and the results were compared witha control microcosm (unpolluted). In this case, since the imagesof natural environments do not allow us a clear view of the vari-ety of microorganism, due to the high microbial density and thepresence of EPS, which masks the results, a CLSM analysis of thein vivo diversity was done previously. In the unpolluted micro-cosm Oscillatoria-like was the dominant cyanobacterium whilePhormidium-like and Lyngbya-like were the most abundant in thepolluted microcosm. In the latter, very small and thin unidentifiedfilaments were also present (Fig. 6a and b).
J. Maldonado et al. / Aquatic Toxicology 104 (2011) 135–144 143
SEM image of the control microcosm shows a community ofmicroorganisms covered by polysaccharides (Fig. 7a). No Pb isdetected by EDX in these samples. The detected elements are: iron(Fe) from metal sulfides, silicon (Si) from diatoms and calcium (Ca)from photosynthetic bacteria. These elements are always presentin microcosms from Ebro delta microbial mats (Fig. 7b).
In the polluted microcosm, a great cellular lysis of Oscillatoria-like organisms was evident, probably due to the high leadconcentrations. On the other hand, in these conditions the Lyngbya-like and Phormidium-like cyanobacteria are selected (Fig. 7c), inaccordance to the images obtained by CLSM. EDX analysis of thesemicroorganisms gives similar results (Fe, Si and Ca peaks), to thoseobtained in the control microcosm, but in this case Pb is alsodetected (Fig. 7d).
The ultrathin sections obtained by TEM of Phormidium-like andLyngbya-like cyanobacteria from the polluted microcosm show, asin the cyanobacteria cultures studied in this work, an increase inPP inclusions. An ultrathin section of Phormidium-like cyanobacte-ria is shown in Fig. 7e. TEM-EDX microanalysis also detects Pb aswell as the elements P and Ca that can already be seen in the con-trol microcosm. No other toxic metals that could be polluting theoriginal mat are detected in the PP inclusions (Fig. 7f).
4. Conclusions
Considering all the results presented in this paper, it can beconcluded that the three cyanobacteria studied could be goodbioindicators of pollution by Pb. Furthermore, if these results arecompared to those obtained in the polluted microcosm, at a higherconcentration than the tested in the cultures, we observe a positiveselection of Lyngbya-like and Phormidium-like cyanobacteria withrespect to Oscillatoria-like organisms, in the control experiment.
All cyanobacteria studied in this work – both cultures and micro-cosms – accumulate PP inclusions that increase with stress, due tolead pollution and the fact that all these inclusions retain this metal.
On the other hand, according to the results obtained, it is possi-ble to link bioaccumulation processes to the toxicological effects ofthe lead, since this metal is toxic at any concentration. Lead also, ashas been demonstrated in microcosm experiments, causes changesin the diversity, thus the ecological importance of metal pollution.
We believe that the application of these techniques open upbroad prospects for future studies of metal ecotoxicity, as they willallow us to determine whether pollution by other metals could haveoccurred in natural environments.
Acknowledgments
This research was supported by the following grants: DGI-CYT (CGL2008-01891/BOS) and FONCICYT (95887). We expressour thanks to the staff of the Servei de Microscòpia at the Uni-versitat Autònoma de Barcelona for technical assistance with theconfocal and electron microscopies. We also thank Marc Ala-many and Francesc Fornells from Ecología Portuaria S. L. (Spain),who provided valuable comments on the manuscript. Finally, weacknowledge, Elia Diestra, Gemma Prats-Munoz, Pilar Jarque andCristina Sosa for their help in this work.
References
Azevedo, J.S., Fernandez, W.S., Farias, L.A., Favaro, D.T., Braga, E.S., 2009. Use ofCathorops spixii as bioindicator of pollution of trace metals in the Santos Bay.Braz. Ecotoxicol. 18, 577–586.
Boivin, M.E., Massieux, B., Breure, A.M., van den Ende, F.P., Greve, G.D., Rutgers,M., Admiraal, W., 2005. Effects of copper and temperature on aquatic bacterialcommunities. Aquat. Toxicol. 71, 345–356.
Borrego, J.J., Figueras, M.J., 1997. Microbiological quality of natural waters. Microbi-ologia 13, 413–426.
Bryant, D.A., 1982. Phycoerythrocyanin and Phycoerythrin: properties and occur-rence in cyanobacteria. J. Gen. Microbiol. 128, 835–844.
Burnat, M., Diestra, E., Esteve, I., Solé, A., 2009. In situ determination of the effectsof lead and copper on cyanobacterial populations in microcosms. PLoS One 4,e6204.
Burnat, M., Diestra, E., Esteve, I., Solé, A., 2010. Confocal laser scanning microscopycoupled to a spectrofluorometric detector as a rapid tool for determining thein vivo effect of metals on phototrophic bacteria. Bull. Environ. Contam. Toxicol.84, 55–60.
Campbell, S.E., 1979. Soil stabilization by a prokaryotic desert crust: implications forPrecambrian land biota. Orig. Life 9, 335–348.
De Philippis, R., Paperi, R., Sili, C., Vincenzini, M., 2003. Assessment of the metalremoval capability of two capsulated cyanobacteria Cyanobacteria capsulataand Nostoc PCC7936. J. Appl. Phycol. 15, 155–161.
Diestra, E., Solé, A., Esteve, I., 2004. A comparative study of cyanobacterial diver-sity in polluted and unpolluted microbial mats by means of CLSM. Ophelia 58,151–156.
Esteve, I., Martínez-Alonso, M., Mir, J., 1992. Distribution, typology and structure ofmicrobial mat communities in Spain Preliminary studies. Limnetica 8, 185–195.
Esteve, I., Ceballos, D., Martínez-Alonso, M., Gaju, N., Guerrero, R., 1994. Devel-opment of versicolored microbial mats: succession of microbial communites.Microbial mats: structure development and environmental significance. In: Stal,L.J., Caumette, P. (Eds.), NATO ASI Series G: Ecological Sciences. Springer, Hei-delberg, pp. 4165–4420.
Faria, M., López, M.A., Diez, S., Barata, C., 2010. Are native naiads more tolerant topollution than exotic freshwater bivalve species? An hypothesis tested usingphysiological responses of three species transplanted to mercury contaminatedsites in the Ebro River (NE Spain). Chemosphere 81, 1218–1226.
Fourcans, A., de Oteyza, T.G., Wieland, A., Solé, A., Diestra, E., van Bleijswijk, J.,Grimalt, J.O., Kuhl, M., Esteve, I., Muyzer, G., Caumette, P., Duran, R., 2004.Characterization of functional bacterial groups in a hypersaline microbial matcommunity (Salins-de-Giraud, Camargue France), 2004. FEMS Microbiol. Ecol.51, 55–70.
García-Pichel, F., Prufert-Bebout, L., Muyzer, G., 1996. Phenotypic and phylogeneticanalyses show Microcoleus chthonoplastes to be a cosmopolitan cyanobacterium.Appl. Environ. Microbiol. 62, 3284–3291.
Garitano-Zavala, A., Cotín, J., Borràs, M., Nadal, J., 2010. Trace metal concentrationsin tissues of two tinamou species in mining areas of Bolivia and their potentialas environmental sentinels. Environ. Monit. Assess. 168, 629–644.
Gjorgieva, D., Kadifkova-Panovska, T., Baceva, K., Stafilov, T., 2011. Assessment ofheavy metal pollution in republic of macedonia using a plant assay. Arch. Envi-ron. Contam. Toxicol. 60, 233–240.
Guerrero, R., Haselton, A., Solé, M., Margulis, L., 1999. Titanospirillum velox: a huge,speedy, sulfur-storing spirillum from Ebro Delta microbial mats. Proc. Natl. Acad.Sci. U.S.A. 96, 11584–11588.
Herdman, M., Iteman, I., Rippka, R., 2005. Catalogue of Cyanobacterial Strains, seconded. Institut Pasteur, Paris.
Incharoensakdi, A., Kitjaharn, P., 2002. Zinc biosorption from aqueous solution bya halotolerant cyanobacterium Aphanothece halophytica. Curr. Microbiol. 45,261–264.
Jensen, T.E., Sicko, L.M., 1974. Phosphate metabolism in blue-green algae I. Finestructure of the “PP overplus” phenomenon in Plectonema boryanum. Can. J.Microbiol. 20, 1235–1239.
Lo, W., Chua, H., Lam, K.H., Bi, S.P., 1999. A comparative investigation onthe biosorption of lead by filamentous fungal biomass. Chemosphere 39,2723–2736.
Maldonado, J., de los Rios, A., Esteve, I., Ascaso, C., Puyen, Z.M., Brambilla, C., Solé,A., 2010. Sequestration and in vivo effect of lead on DE2009 microalga, usinghigh-resolution microscopic techniques. J. Hazard. Mater. 183, 44–50.
Manosa, S., Mateo, R., Guitart, R., 2001. A review of the effects of agricultural andindustrial contamination on the Ebro delta biota and wildlife. Environ. Monit.Assess. 71, 187–205.
Massieux, B., Boivin, M.E., Van Den Ende, F.P., Langenskiold, J., Marvan, P., Barranguet,C., Admiraal, W., Laanbroek, H.J., Zwart, G., 2004. Analysis of structural and phys-iological profiles to assess the effects of Cu on biofilm microbial communities.Appl. Environ. Microbiol. 70, 4512–4521.
Mateo, R., Martinez-Vilalta, A., Guitart, R., 1997. Lead shot pellets in the Ebro deltaSpain: densities in sediments and prevalence of exposure in waterflow. Environ.Pollut. 96, 335–341.
Mehta, S.K., Gaur, J.P., 2001. Concurrent sorption of Ni2+ and Cu2+ by Chlorella vulgarisfrom a binary metal solution. Appl. Microbiol. Biotechnol. 55, 379–382.
Mir, J., Martínez-Alonso, M., Esteve, I., Guerrero, R., 1991. Vertical stratification andmicrobial assemblage of a microbial mat in the Ebro Delta (Spain). FEMS Micro-biol. Ecol. 86, 59–68.
Murthy, S.D.S., Mohanty, P., 1991. Mercury induces alteration of energy transfer inphycobilisome by selectively affecting the pigment protein, phycocyanin, in thecyanobacterium, Spirulina platensis. Plant Cell Physiol. 32, 231–237.
Murthy, S.D.S., Ramanaiah, V.V., Sudhir, P., 2004. High temperature induced alter-ations in energy transfer in phycobilisomes of the cyanobacterium Spirulinaplatensis. Photosynthetica 42, 615–617.
Ranjard, L., Lignier, L., Chaussod, R., 2006. Cumulative effects of short-term polymetalcontamination on soil bacterial community structure. Appl. Environ. Microbiol.72, 1684–1687.
Roane, T.M., Pepper, I.L., 2000. Microorganisms and metal pollutants. In: Maier, R.M.,Pepper, I.L., Gerba, C.P. (Eds.), Environmental Microbiology. Academic, New York,pp. 403–423.

144 J. Maldonado et al. / Aquatic Toxicology 104 (2011) 135–144
Rippka, R., Deruelles, J., Waterbury, J.B., Herdman, M., Stanier, R.Y., 1979. Genericassignments, strain histories and properties of pure cultures of cyanobacteria. J.Gen. Microbiol. 111, 1–61.
Sánchez-Chardi, A., López-Fuster, M.J., Nadal, J., 2007. Bioaccumulation of lead, mer-cury, and cadmium in the greater white-toothed shrew, Crocidura russula, fromthe Ebro Delta (NE Spain): sex- and age-dependent variation. Environ. Pollut.145, 7–14.
Schlebusch, M., Forchhammer, K., 2010. Requirement of the nitrogen starvation-induced protein Sll0783 for polyhydroxybutyrate accumulation in Synechocystissp. strain PCC 6803. Appl. Environ. Microbiol. 76, 6101–6107.
Solé, A., Gaju, N., Esteve, I., 2003. The biomass dynamics of cyanobacteria in anannual cycle determined by confocal laser scanning microscopy. Scanning 1,1–7.
Solé, A., Diestra, E., Esteve, I., 2009. Cyanobacterial biomasa determined at microscalelevel in unpolluted and polluted microbial mats CLSM image analysis. Microb.Ecol. 57, 649–656.
Wieland, A., Kuhl, M., McGowan, L., Fourcans, A., Duran, R., Caumette, P., Garcia deOteyza, T., Grimalt, J.O., Solé, A., Diestra, E., Esteve, I., Herbert, R.A., 2003. Micro-bial mats on the Orkney Islands revisited: microenvironment and microbialcommunity composition. Microb. Ecol. 46, 371–390.