Embed Size (px)
Citation preview
Assenagon Asset Management S.A.
Selective Dispersion Creating an affordable Long Volatility Exposure in an Equity Portfolio
Assenagon Asset Management S.A. 2
Contents
1. Single Stocks Volatilities versus Index Volatilities
2. Volatility Flows and their Impact on Correlation
3. How to invest in Dispersion?
4. From a Pair Trade to a Selective Dispersion Portfolio
– Pair Properties
– What about the Skew?
5. Dispersion Portfolio
– An Example
– Cost of Carry
6. A "small" Digression
7. Summary
Contacts
Disclaimer
Assenagon Asset Management S.A. 3
1. Single Stocks Volatilities versus Index Volatilities
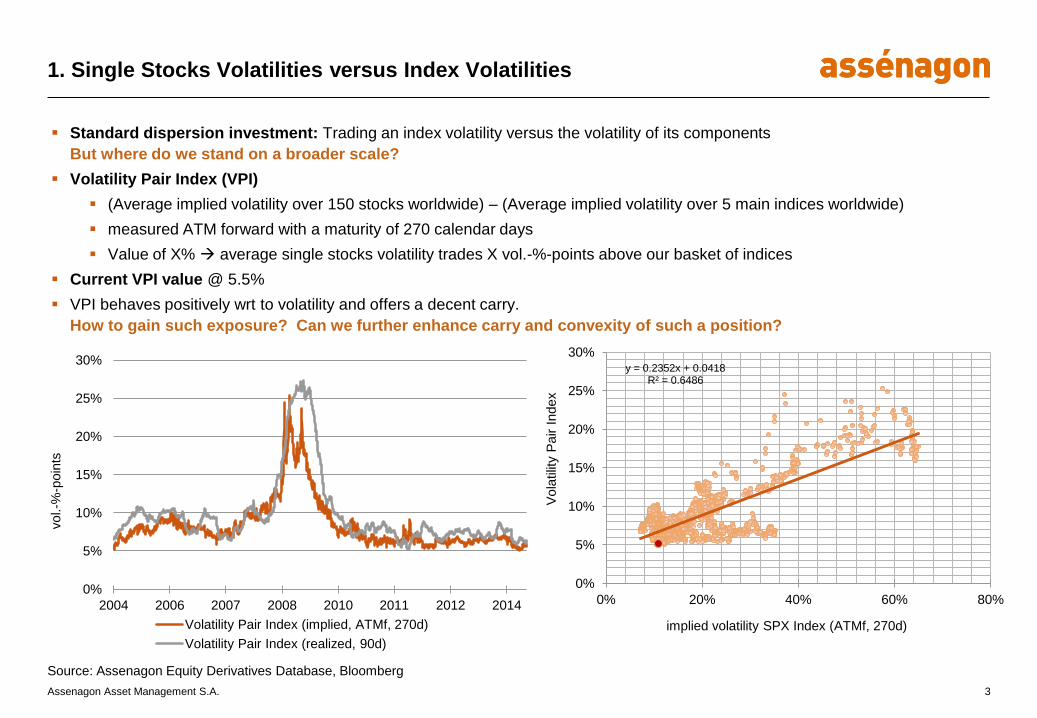
Standard dispersion investment: Trading an index volatility versus the volatility of its components
But where do we stand on a broader scale?
Volatility Pair Index (VPI)
(Average implied volatility over 150 stocks worldwide) – (Average implied volatility over 5 main indices worldwide)
measured ATM forward with a maturity of 270 calendar days
Value of X% average single stocks volatility trades X vol.-%-points above our basket of indices
Current VPI value @ 5.5%
VPI behaves positively wrt to volatility and offers a decent carry.
How to gain such exposure? Can we further enhance carry and convexity of such a position?
Source: Assenagon Equity Derivatives Database, Bloomberg
0%
5%
10%
15%
20%
25%
30%
2004 2006 2007 2008 2010 2011 2012 2014
Volatility Pair Index (implied, ATMf, 270d)
Volatility Pair Index (realized, 90d)
vol.-%
-poin
ts
y = 0.2352x + 0.0418 R² = 0.6486
0%
5%
10%
15%
20%
25%
30%
0% 20% 40% 60% 80%
Vola
tilit
y P
air I
ndex
implied volatility SPX Index (ATMf, 270d)
Assenagon Asset Management S.A. 4
2. Volatility Flows and their Impact on Correlation
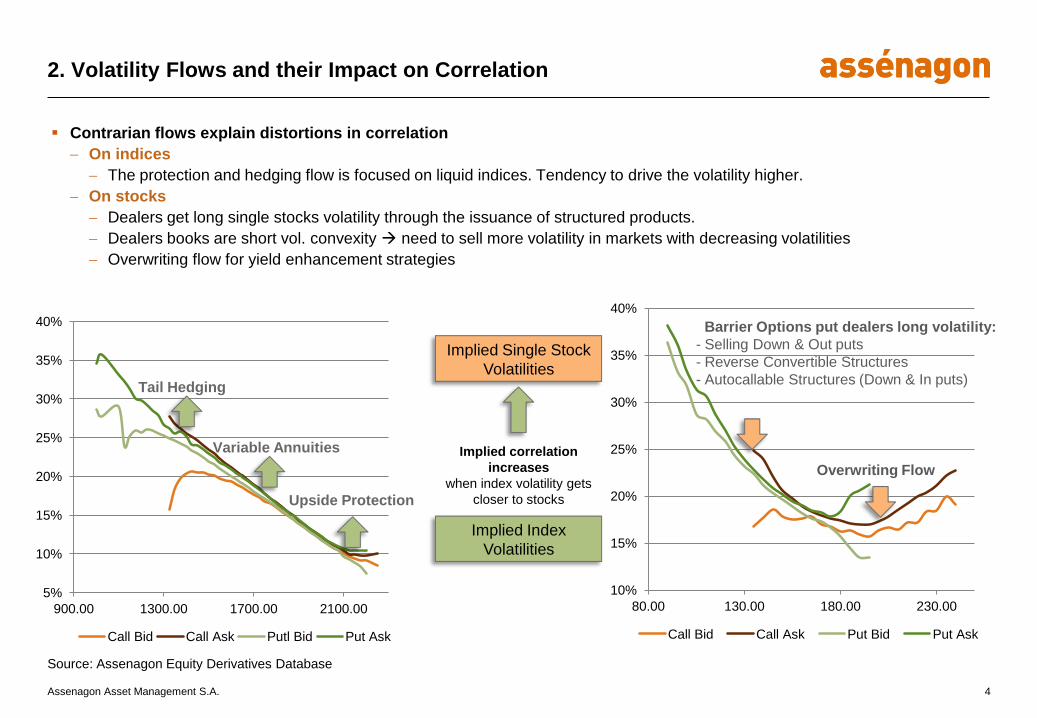
Contrarian flows explain distortions in correlation
On indices
The protection and hedging flow is focused on liquid indices. Tendency to drive the volatility higher.
On stocks
Dealers get long single stocks volatility through the issuance of structured products.
Dealers books are short vol. convexity need to sell more volatility in markets with decreasing volatilities
Overwriting flow for yield enhancement strategies
Source: Assenagon Equity Derivatives Database
Implied Single Stock
Volatilities
Implied Index
Volatilities
Implied correlation
increases
when index volatility gets
closer to stocks
5%
10%
15%
20%
25%
30%
35%
40%
900.00 1300.00 1700.00 2100.00
Call Bid Call Ask Putl Bid Put Ask
Upside Protection
Tail Hedging
Variable Annuities
10%
15%
20%
25%
30%
35%
40%
80.00 130.00 180.00 230.00
Call Bid Call Ask Put Bid Put Ask
Barrier Options put dealers long volatility:
- Selling Down & Out puts
- Reverse Convertible Structures
- Autocallable Structures (Down & In puts)
Overwriting Flow
Assenagon Asset Management S.A. 5
3. How to invest in Dispersion?
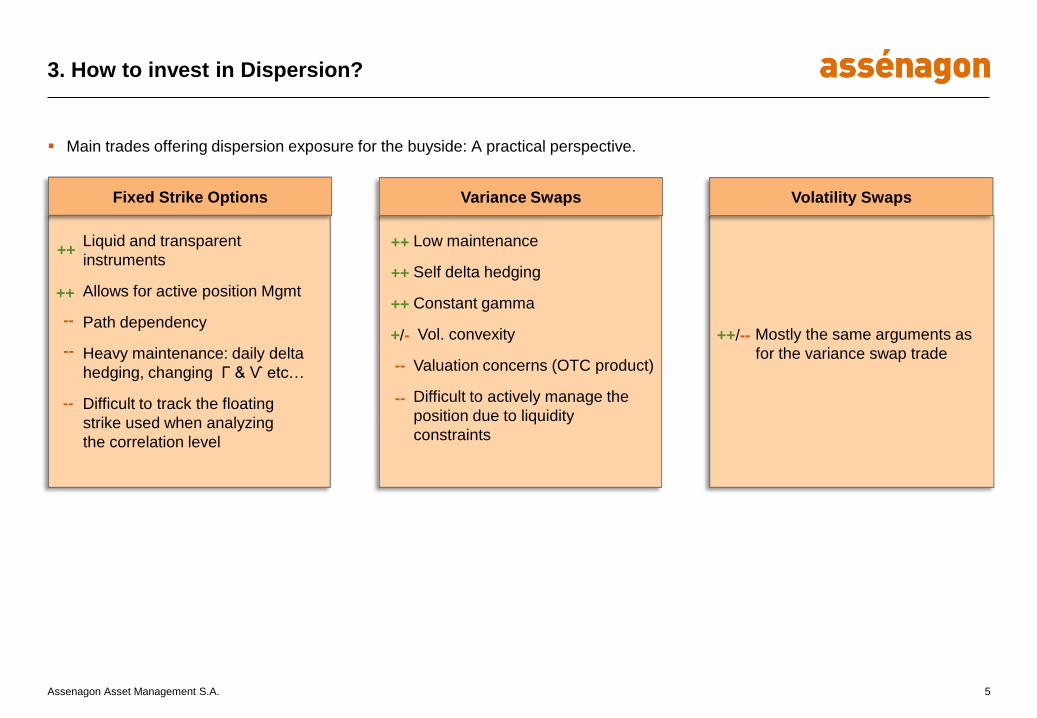
Main trades offering dispersion exposure for the buyside: A practical perspective.
Liquid and transparent
instruments
Allows for active position Mgmt
Path dependency
Heavy maintenance: daily delta
hedging, changing Γ & Ѵ etc…
Difficult to track the floating
strike used when analyzing
the correlation level
Mostly the same arguments as
for the variance swap trade
Fixed Strike Options Volatility Swaps
--
--
--
++ Low maintenance
Self delta hedging
Constant gamma
Vol. convexity
Valuation concerns (OTC product)
Difficult to actively manage the
position due to liquidity
constraints
Variance Swaps
++
++
++
--
--
++/-- +/-
++
Assenagon Asset Management S.A. 6
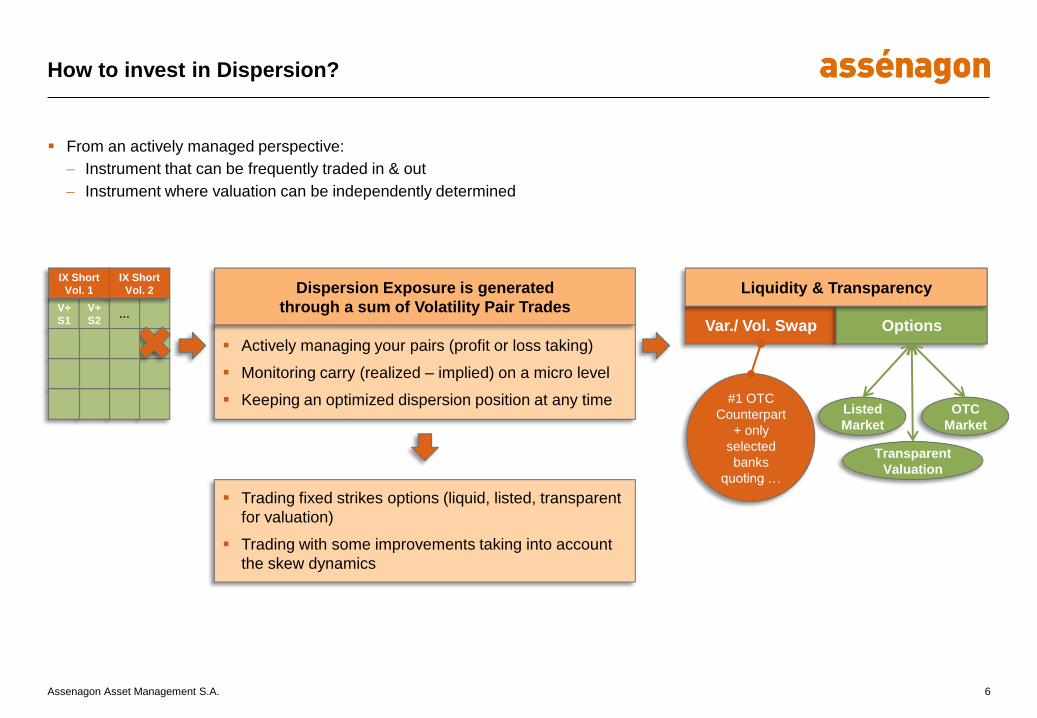
How to invest in Dispersion?
Actively managing your pairs (profit or loss taking)
Monitoring carry (realized – implied) on a micro level
Keeping an optimized dispersion position at any time
Dispersion Exposure is generated
through a sum of Volatility Pair Trades
Trading fixed strikes options (liquid, listed, transparent
for valuation)
Trading with some improvements taking into account
the skew dynamics
Var./ Vol. Swap Options
Liquidity & Transparency
#1 OTC
Counterpart
+ only
selected
banks
quoting …
Listed
Market
OTC
Market
Transparent
Valuation
… V+
S2
V+
S1
IX Short
Vol. 2
IX Short
Vol. 1
From an actively managed perspective:
Instrument that can be frequently traded in & out
Instrument where valuation can be independently determined
Assenagon Asset Management S.A. 7
4. From a Pair Trade to a Selective Dispersion Portfolio
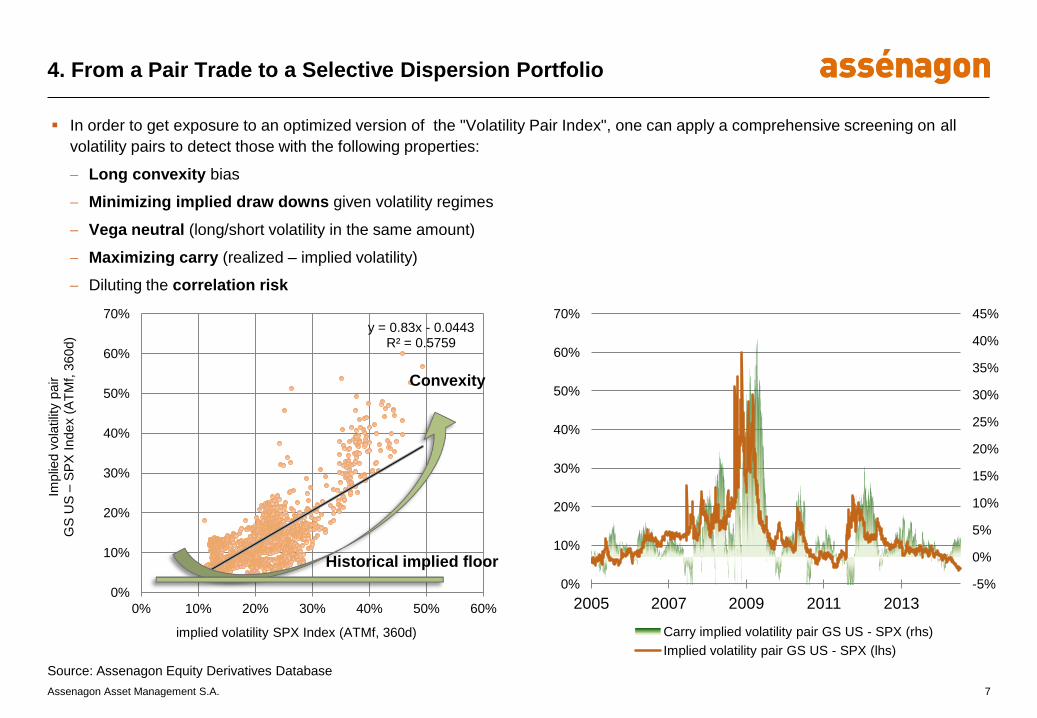
In order to get exposure to an optimized version of the "Volatility Pair Index", one can apply a comprehensive screening on all
volatility pairs to detect those with the following properties:
Long convexity bias
Minimizing implied draw downs given volatility regimes
Vega neutral (long/short volatility in the same amount)
Maximizing carry (realized – implied volatility)
Diluting the correlation risk
Source: Assenagon Equity Derivatives Database
y = 0.83x - 0.0443 R² = 0.5759
0%
10%
20%
30%
40%
50%
60%
70%
0% 10% 20% 30% 40% 50% 60%
Implie
d v
ola
tilit
y p
air
GS
US
– S
PX
Index (
AT
Mf,
360d)
implied volatility SPX Index (ATMf, 360d)
Convexity
Historical implied floor
-5%
0%
5%
10%
15%
20%
25%
30%
35%
40%
45%
0%
10%
20%
30%
40%
50%
60%
70%
2005 2007 2009 2011 2013
Carry implied volatility pair GS US - SPX (rhs)
Implied volatility pair GS US - SPX (lhs)
Assenagon Asset Management S.A. 8
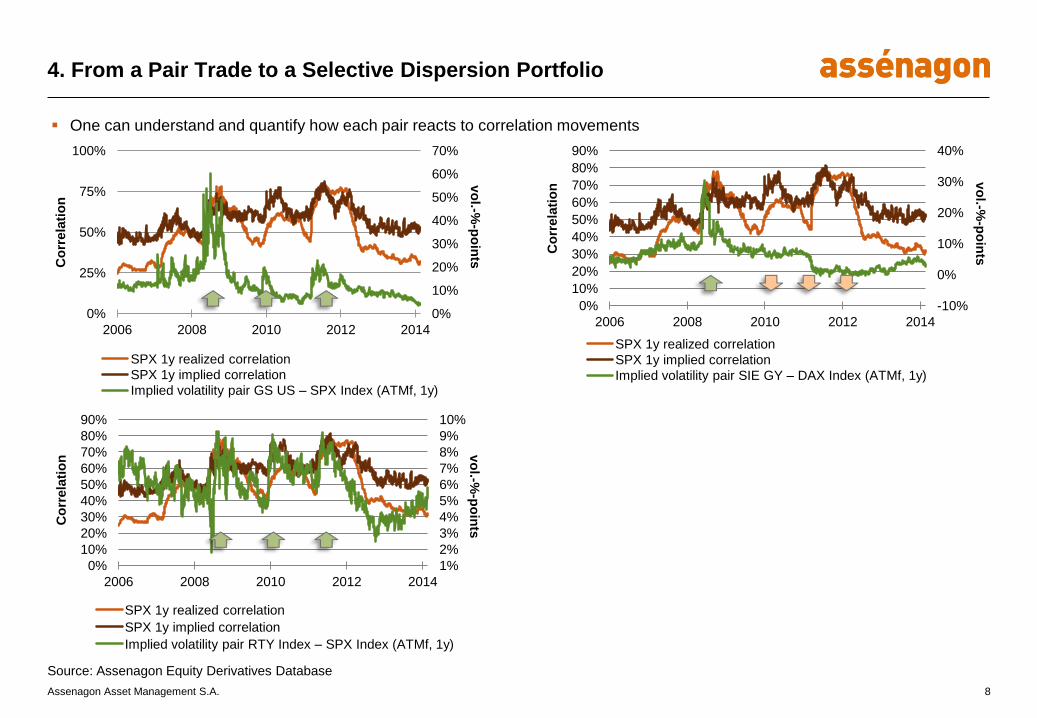
4. From a Pair Trade to a Selective Dispersion Portfolio
One can understand and quantify how each pair reacts to correlation movements
0%
10%
20%
30%
40%
50%
60%
70%
0%
25%
50%
75%
100%
2006 2008 2010 2012 2014
vo
l.-%-p
oin
ts C
orr
ela
tio
n
SPX 1y realized correlation
SPX 1y implied correlation
Implied volatility pair GS US – SPX Index (ATMf, 1y)
-10%
0%
10%
20%
30%
40%
0%
10%
20%
30%
40%
50%
60%
70%
80%
90%
2006 2008 2010 2012 2014
vo
l.-%-p
oin
ts
Co
rrela
tio
n
SPX 1y realized correlation
SPX 1y implied correlation
Implied volatility pair SIE GY – DAX Index (ATMf, 1y)
1%
2%
3%
4%
5%
6%
7%
8%
9%
10%
0%
10%
20%
30%
40%
50%
60%
70%
80%
90%
2006 2008 2010 2012 2014
vo
l.-%-p
oin
ts
Co
rrela
tio
n
SPX 1y realized correlation
SPX 1y implied correlation
Implied volatility pair RTY Index – SPX Index (ATMf, 1y)
Source: Assenagon Equity Derivatives Database
Assenagon Asset Management S.A. 9
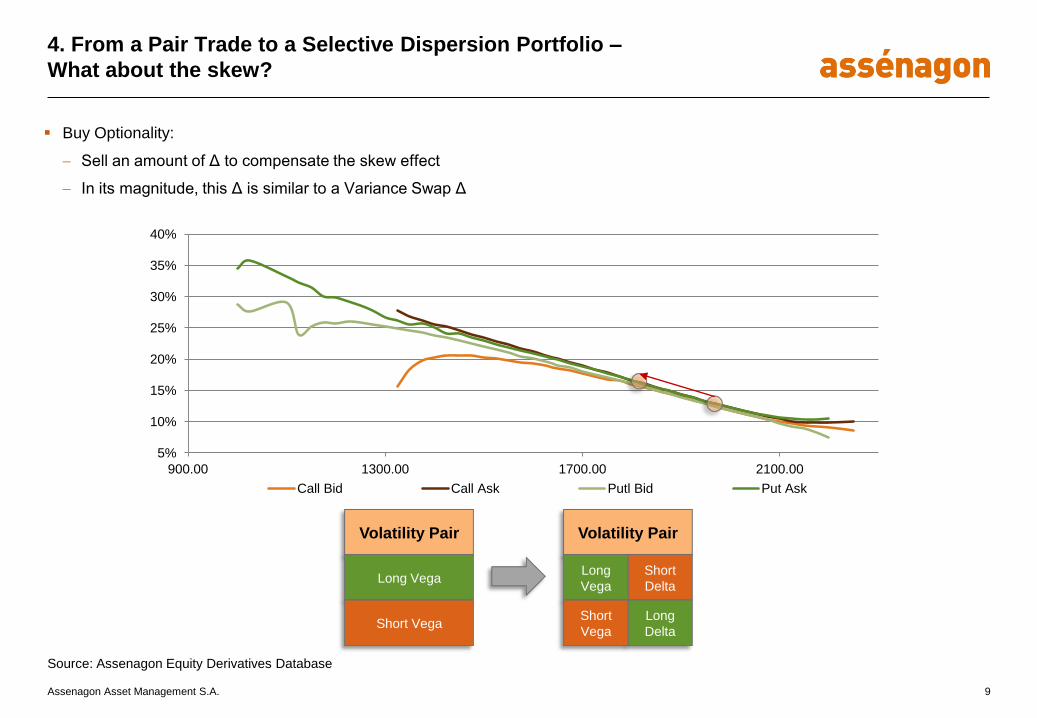
4. From a Pair Trade to a Selective Dispersion Portfolio –
What about the skew?
Buy Optionality:
Sell an amount of Δ to compensate the skew effect
In its magnitude, this Δ is similar to a Variance Swap Δ
Source: Assenagon Equity Derivatives Database
Volatility Pair
Short
Delta
Long
Delta
Long
Vega
Short
Vega
Volatility Pair
Long Vega
Short Vega
5%
10%
15%
20%
25%
30%
35%
40%
900.00 1300.00 1700.00 2100.00
Call Bid Call Ask Putl Bid Put Ask
Assenagon Asset Management S.A. 10
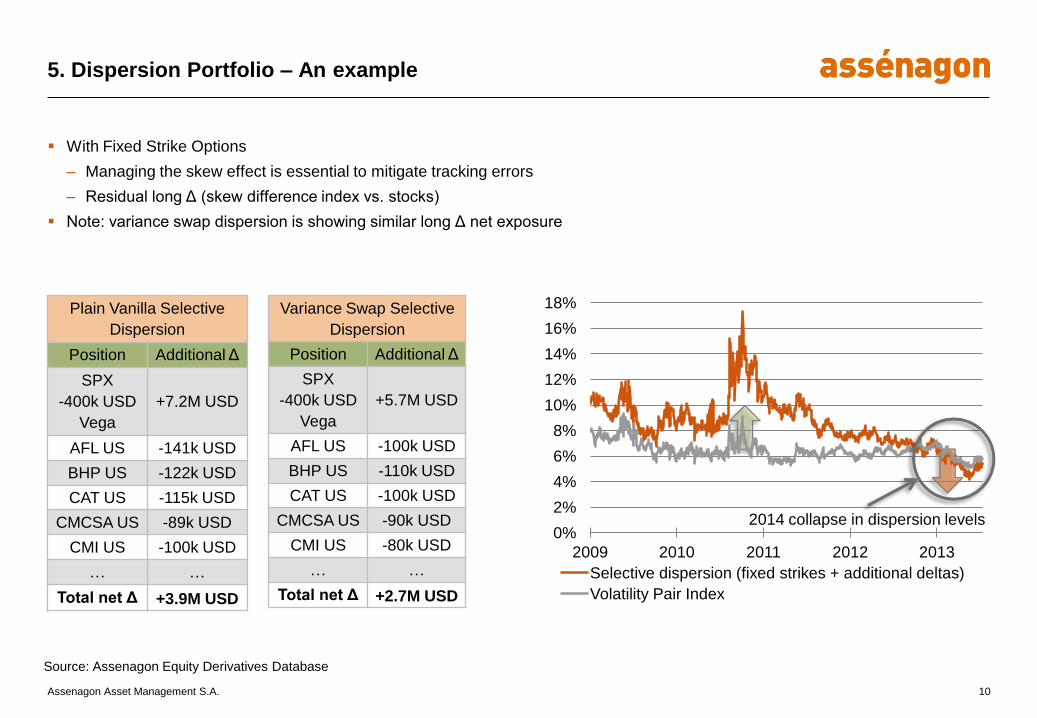
5. Dispersion Portfolio – An example
With Fixed Strike Options
– Managing the skew effect is essential to mitigate tracking errors
– Residual long Δ (skew difference index vs. stocks)
Note: variance swap dispersion is showing similar long Δ net exposure
0%
2%
4%
6%
8%
10%
12%
14%
16%
18%
2009 2010 2011 2012 2013
Selective dispersion (fixed strikes + additional deltas)
Volatility Pair Index
Source: Assenagon Equity Derivatives Database
2014 collapse in dispersion levels
Plain Vanilla Selective
Dispersion
Position Additional Δ
SPX
-400k USD
Vega
+7.2M USD
AFL US -141k USD
BHP US -122k USD
CAT US -115k USD
CMCSA US -89k USD
CMI US -100k USD
… …
Total net Δ +3.9M USD
Variance Swap Selective
Dispersion
Position Additional Δ
SPX
-400k USD
Vega
+5.7M USD
AFL US -100k USD
BHP US -110k USD
CAT US -100k USD
CMCSA US -90k USD
CMI US -80k USD
… …
Total net Δ +2.7M USD
Assenagon Asset Management S.A. 11
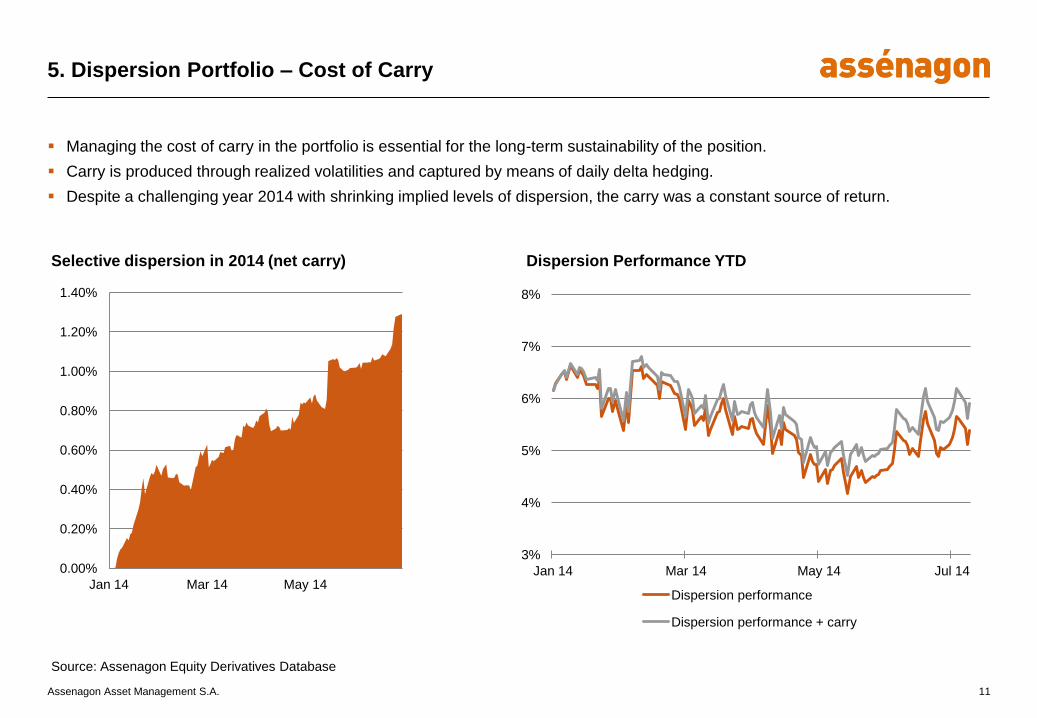
5. Dispersion Portfolio – Cost of Carry
Managing the cost of carry in the portfolio is essential for the long-term sustainability of the position.
Carry is produced through realized volatilities and captured by means of daily delta hedging.
Despite a challenging year 2014 with shrinking implied levels of dispersion, the carry was a constant source of return.
Source: Assenagon Equity Derivatives Database
Selective dispersion in 2014 (net carry) Dispersion Performance YTD
3%
4%
5%
6%
7%
8%
Jan 14 Mar 14 May 14 Jul 14
Dispersion performance
Dispersion performance + carry
0.00%
0.20%
0.40%
0.60%
0.80%
1.00%
1.20%
1.40%
Jan 14 Mar 14 May 14
Assenagon Asset Management S.A. 12
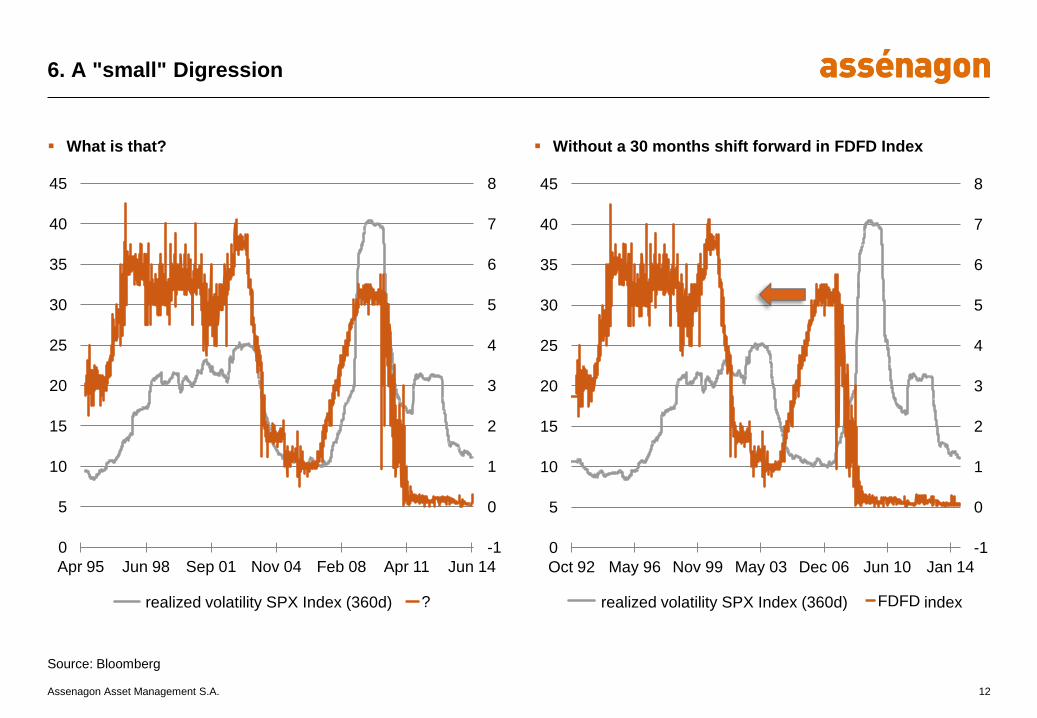
6. A "small" Digression
What is that? Without a 30 months shift forward in FDFD Index
Source: Bloomberg
-1
0
1
2
3
4
5
6
7
8
0
5
10
15
20
25
30
35
40
45
Apr 95 Jun 98 Sep 01 Nov 04 Feb 08 Apr 11 Jun 14
SPX 360 Days Realized Volatility ?
-1
0
1
2
3
4
5
6
7
8
0
5
10
15
20
25
30
35
40
45
Oct 92 May 96 Nov 99 May 03 Dec 06 Jun 10 Jan 14
SPX 360 Days Realized Volatility FDFD Index realized volatility SPX Index (360d) realized volatility SPX Index (360d) index
Assenagon Asset Management S.A. 13
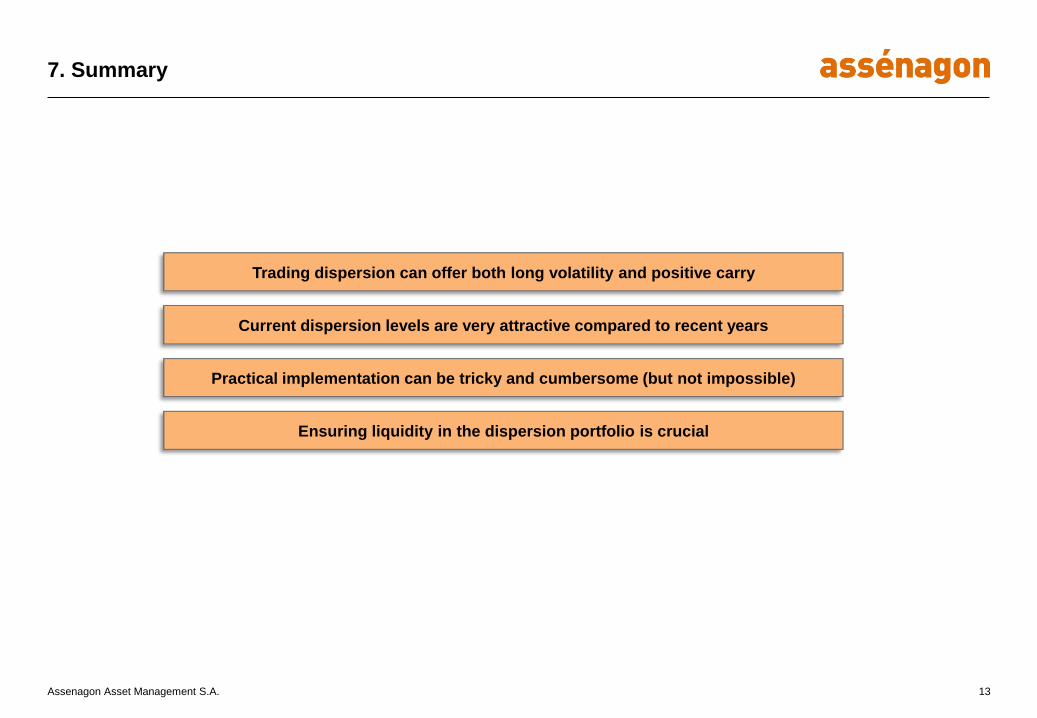
7. Summary
Trading dispersion can offer both long volatility and positive carry
Current dispersion levels are very attractive compared to recent years
Practical implementation can be tricky and cumbersome (but not impossible)
Ensuring liquidity in the dispersion portfolio is crucial
Assenagon Asset Management S.A. 14
Contacts
Customer Coverage
Hans Günther Bonk
Phone +49 89 519966-410
Michael Huber
Phone +49 89 519966-452
Matthias Kunze
Phone +49 89 519966-421
Michael van Riesen
Phone +49 89 519966-419
Ronald Siebel
Phone +49 89 519966-420
Marcus Steudner
Phone +49 89 519966-451
Scan for App
Sales Operations
Simone Alanne
Phone +49 89 519966-460
Carina Herz
Phone +49 89 519966-462
Senior Advisor
Christian Maria Kreuser
Phone +49 89 519966-378
Chief Economist
Dr. Martin W. Hüfner
Phone +49 89 519966-150
Imprint
Assenagon Asset Management S.A.
Aerogolf Center
1B, Heienhaff
1736 Senningerberg, Luxemburg
Assenagon Asset Management S.A.
Zweigniederlassung München
Prannerstraße 8
80333 München, Deutschland
Assenagon Schweiz GmbH
Paradeplatz 4
8001 Zürich, Schweiz
Assenagon Client Service GmbH
Prannerstraße 8
80333 München, Deutschland
www.assenagon.com
Assenagon Asset Management S.A. 15
Disclaimer
All information contained in this document is based on carefully selected sources which are considered to be reliable. However, Assenagon S.A., Luxembourg, Assenagon Asset Management S.A.,
Luxembourg and its branch offices as well as Assenagon Schweiz GmbH, Assenagon Client Service GmbH, Munich and Assenagon GmbH, Munich (hereinafter collectively referred to as "Assenagon
Group") cannot guarantee the correctness, completeness or accuracy of the information. Any liability or warranty arising from this document is therefore completely excluded, and the Assenagon
Group assumes no responsibility for, among other things, the completeness, correctness, timeliness and availability of the information, despite having compiled it with due care.
The information in this presentation on fund products, securities and financial services was examined only for compliance with Luxembourg and German law. In some jurisdictions, the dissemination
of such information may be subject to legal restrictions. The preceding information is thus not intended for natural or legal persons who have their residence or registered office in a jurisdiction that
restricts dissemination of information of this type. Natural or legal persons who have their residence or registered office in a foreign jurisdiction should seek information on such restrictions and
observe them accordingly.
In particular, the information contained in this document is not intended for citizens of the UK or the USA nor is it designed for such purpose.
This document is neither a public offer to sell nor a solicitation of an offer to buy securities, fund units or other financial instruments. An investment decision regarding any securities, fund units or other
financial instruments should be made on the basis of the relevant sales documents (e.g. prospectus and key investor information, available in German from the head office of Assenagon Asset
Management S.A. or at www.assenagon.com), but under no circumstances on the basis of this presentation. All opinions expressed in this presentation are based on the assessment of the
Assenagon Group at the time it was published, regardless of when you receive the information, and are subject to change without prior notice. The Assenagon Group thus expressly reserves the right
to change any opinions expressed in the presentation at any time and without prior notice. The content of this presentation may also be unsuitable or inapplicable for certain investors. It is simply
provided by the company as information for use at your own discretion and is no substitute for individual advice.
The value and return of the fund products, securities and financial services presented may decrease and increase, and in some cases investors may not receive back the full amount they invested.
Past performance is no indicator of future performance. The performance of fund products is calculated using the BVI method; simulations are based on historical returns. Front loads and individual
costs such as fees, commissions and other charges are not accounted for in this presentation, and would have a negative impact on performance were they to be included.
The Assenagon Group may have published other documents that contradict the information contained in this presentation or that come to other conclusions. These publications may reflect other
assumptions, statements of opinion and analysis methods. Past performance is neither an indicator nor a guarantee of future performance. Future performance is neither explicitly nor implicitly
guaranteed or promised.
The content of this document is protected and may not be copied, published, adopted or used for other purposes in any form whatsoever without the prior written permission of the Assenagon Group.
This document is only intended to be used by the persons at whom it is directed. It may neither be used by other persons nor made accessible to other persons by means of publication or
dissemination.
The tax information in this presentation is not intended to provide or replace binding tax advice, and does not claim to cover all tax aspects that may be relevant in connection with the acquisition,
holding or sale of fund units. The information is not exhaustive, nor does it take into account the individual circumstances affecting certain investors or groups of investors. It cannot replace advice
from a tax advisor based on your specific case.
12 August 2014