Embed Size (px)
Citation preview

Selective progressive Selective progressive transmission of vector datatransmission of vector data
Presented by:Presented by:Fangli Ying ( 2 nd year PhD student )
Supervised by:Supervised by:Peter Mooney,Padraig Corcoran 2, Adam C.Winstanley
Department of Computer ScienceNational University of Ireland, Maynooth
2.School of Electrical, Electronic and Mechanical E ngineeringUniversity College Dublin
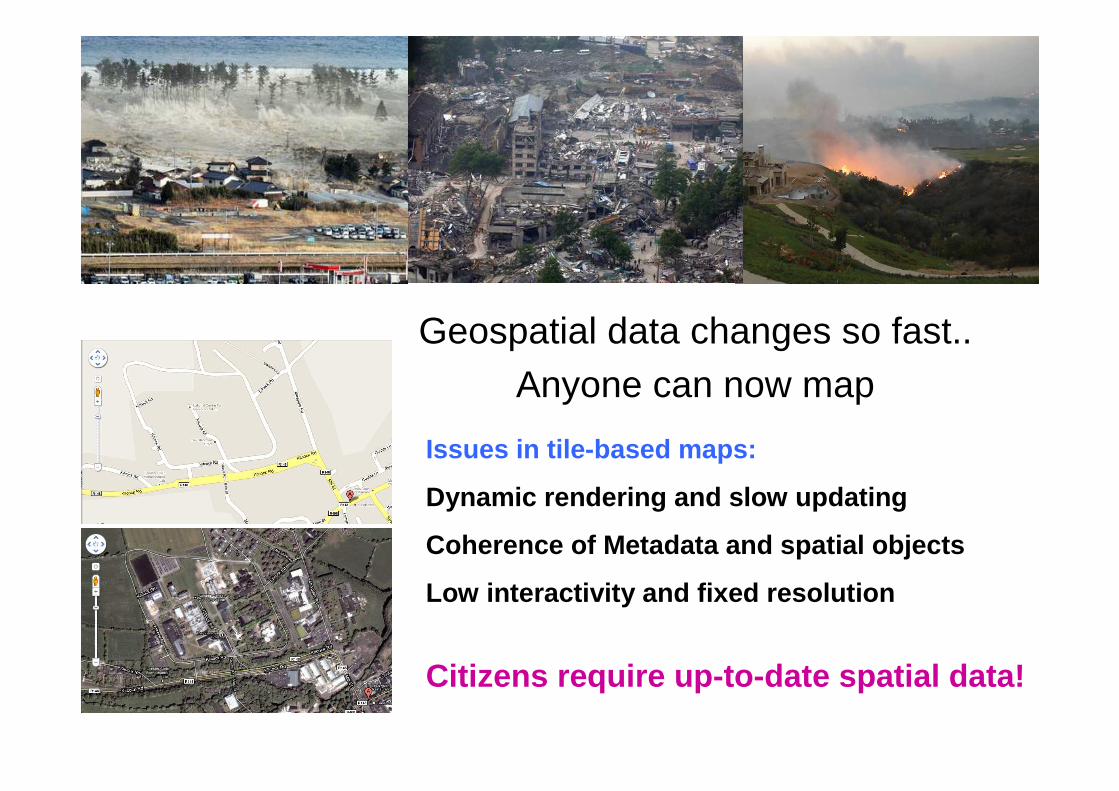
Geospatial data changes so fast..Anyone can now map
Issues in tile-based maps:
Dynamic rendering and slow updating
Coherence of Metadata and spatial objects
Low interactivity and fixed resolution
Citizens require up-to-date spatial data!
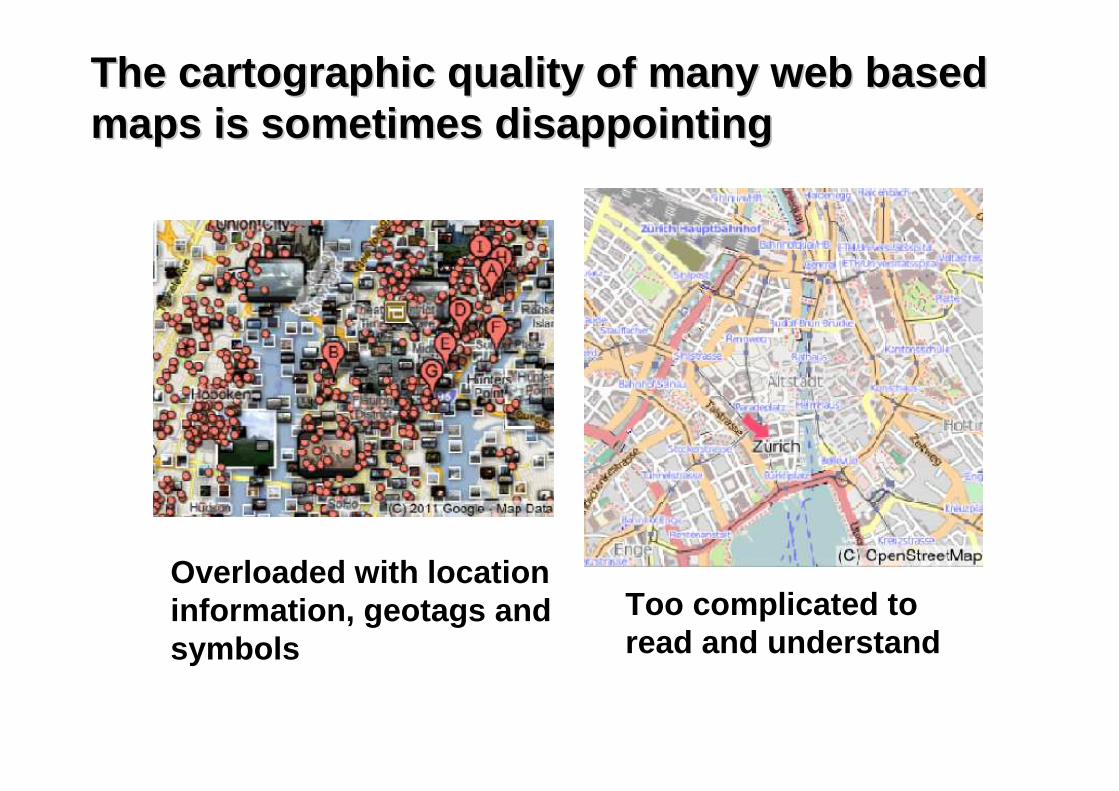
The cartographic quality of many web based The cartographic quality of many web based maps is sometimes disappointingmaps is sometimes disappointing
Overloaded with location information, geotags and symbols
Too complicated to read and understand
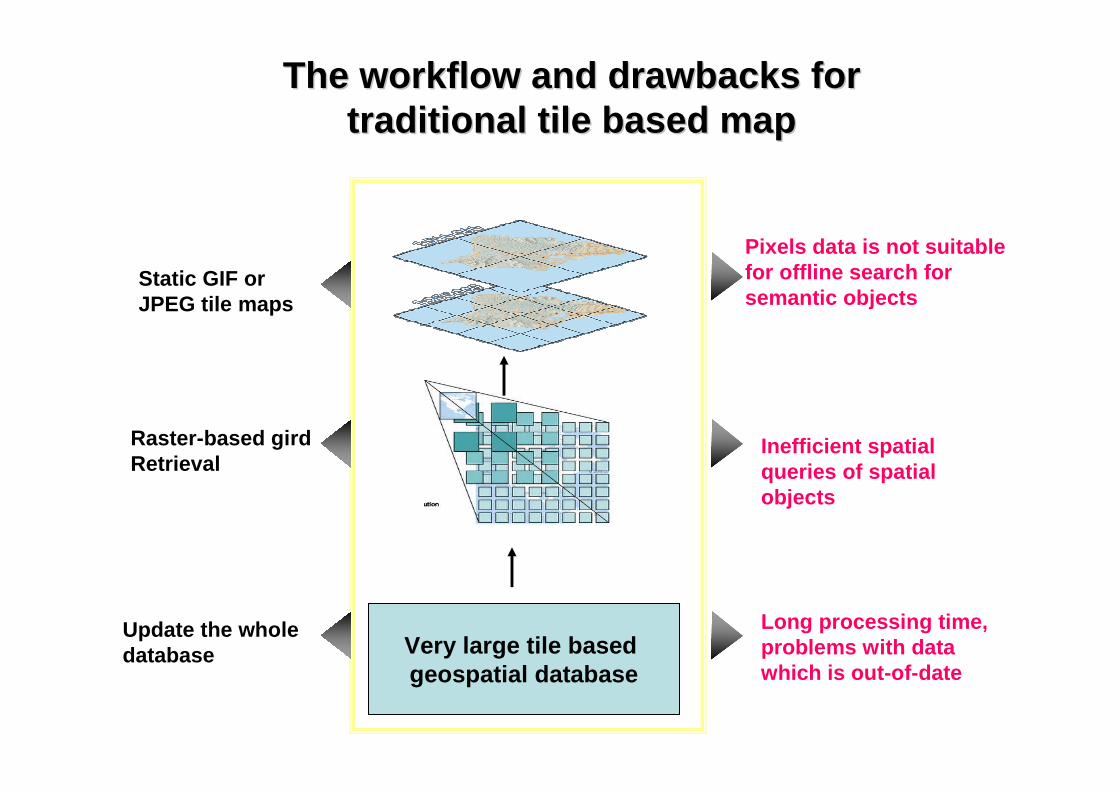
Very large tile based geospatial database
Static GIF or JPEG tile maps
Raster-based gird Retrieval
Pixels data is not suitable for offline search for semantic objects
Inefficient spatial queries of spatial objects
Long processing time, problems with data which is out-of-date
Update the whole database
The workflow and drawbacks for The workflow and drawbacks for traditional tile based maptraditional tile based map
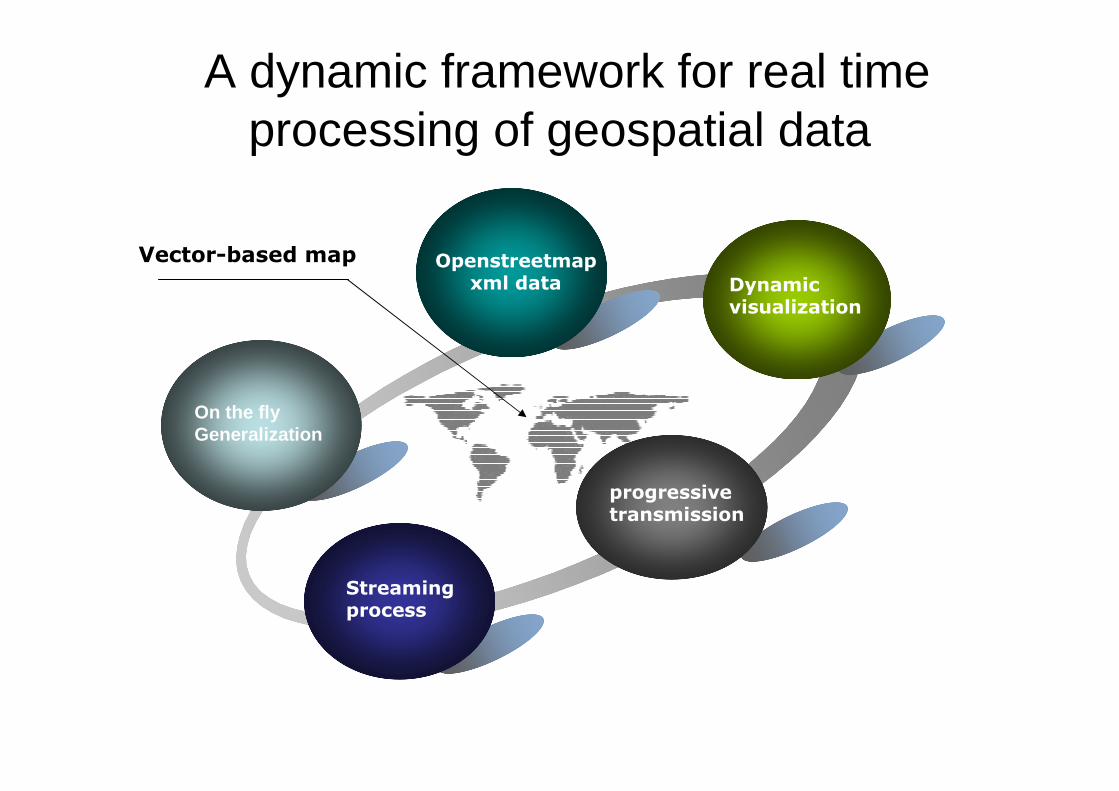
A dynamic framework for real time processing of geospatial data
Streaming process
Openstreetmapxml data Dynamic
visualization
progressive transmission
On the flyGeneralization
Vector-based map
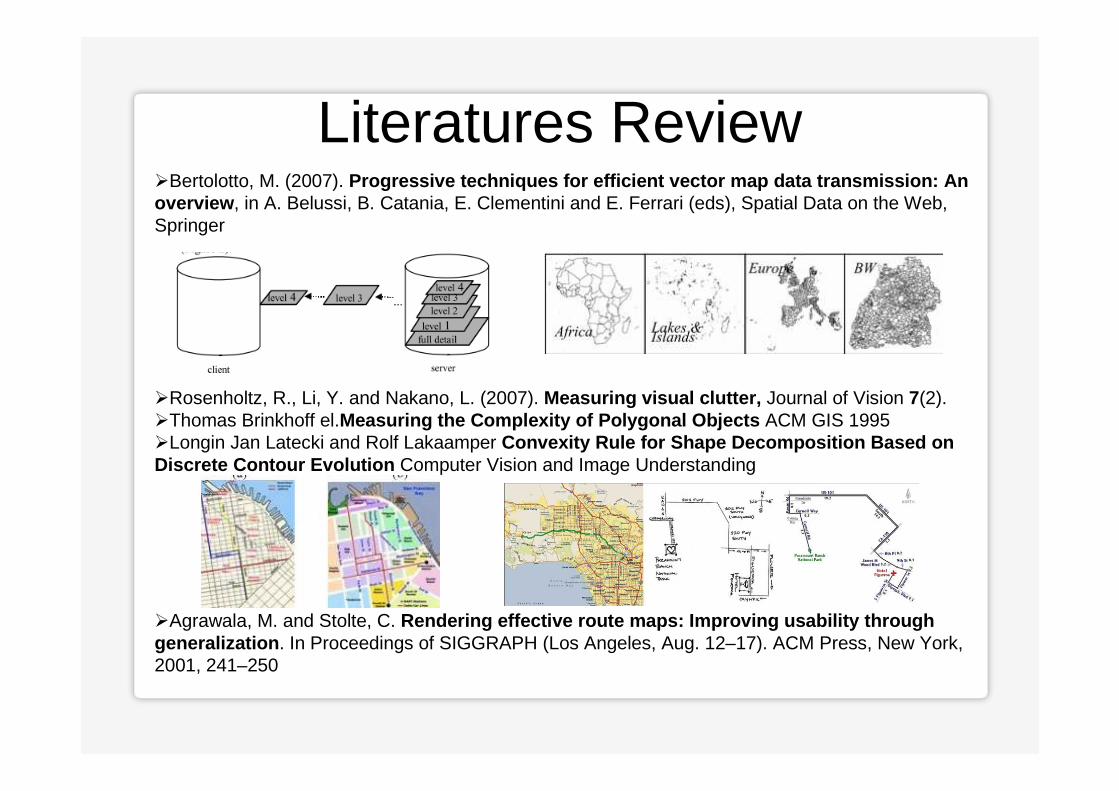
Literatures Review�Bertolotto, M. (2007). Progressive techniques for efficient vector map dat a transmission: An overview , in A. Belussi, B. Catania, E. Clementini and E. Ferrari (eds), Spatial Data on the Web, Springer
�Rosenholtz, R., Li, Y. and Nakano, L. (2007). Measuring visual clutter, Journal of Vision 7(2). �Thomas Brinkhoff el.Measuring the Complexity of Polygonal Objects ACM GIS 1995�Longin Jan Latecki and Rolf Lakaamper Convexity Rule for Shape Decomposition Based on Discrete Contour Evolution Computer Vision and Image Understanding
�Agrawala, M. and Stolte, C. Rendering effective route maps: Improving usability through generalization . In Proceedings of SIGGRAPH (Los Angeles, Aug. 12–17). ACM Press, New York, 2001, 241–250
Assumption to visualization Constraints of mobile devices
• Only a small area of OSM XML processed(<1km2)
• A mobile device is the target for visualization : small screen, low bandwidth, limited computing , Lower detail and less points is enough
• We do NOT write our own generalization technique
• OSM is a case study which is very dynamic data - static tile-based approaches are very slow
• Feature representation in OSM is very variable in some regions
• Only Open Source software/libraries are considered
WebMap
XMLFormat
VectorMap
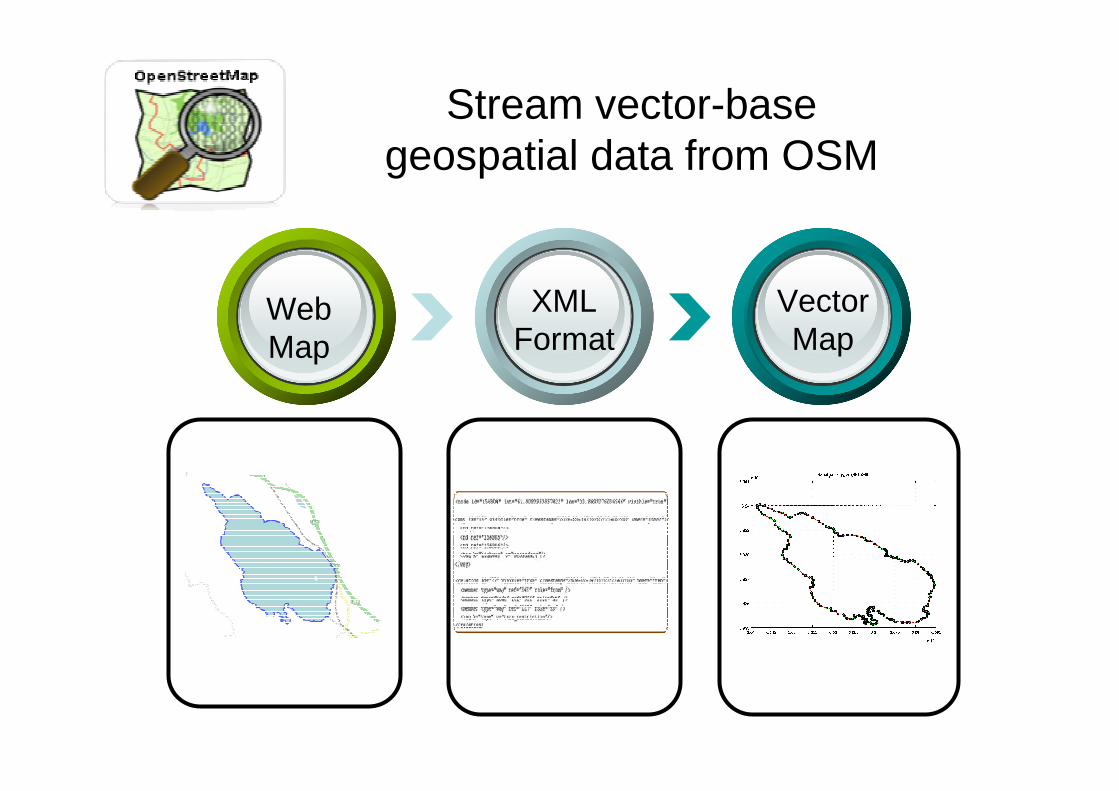
Stream vector-base geospatial data from OSM
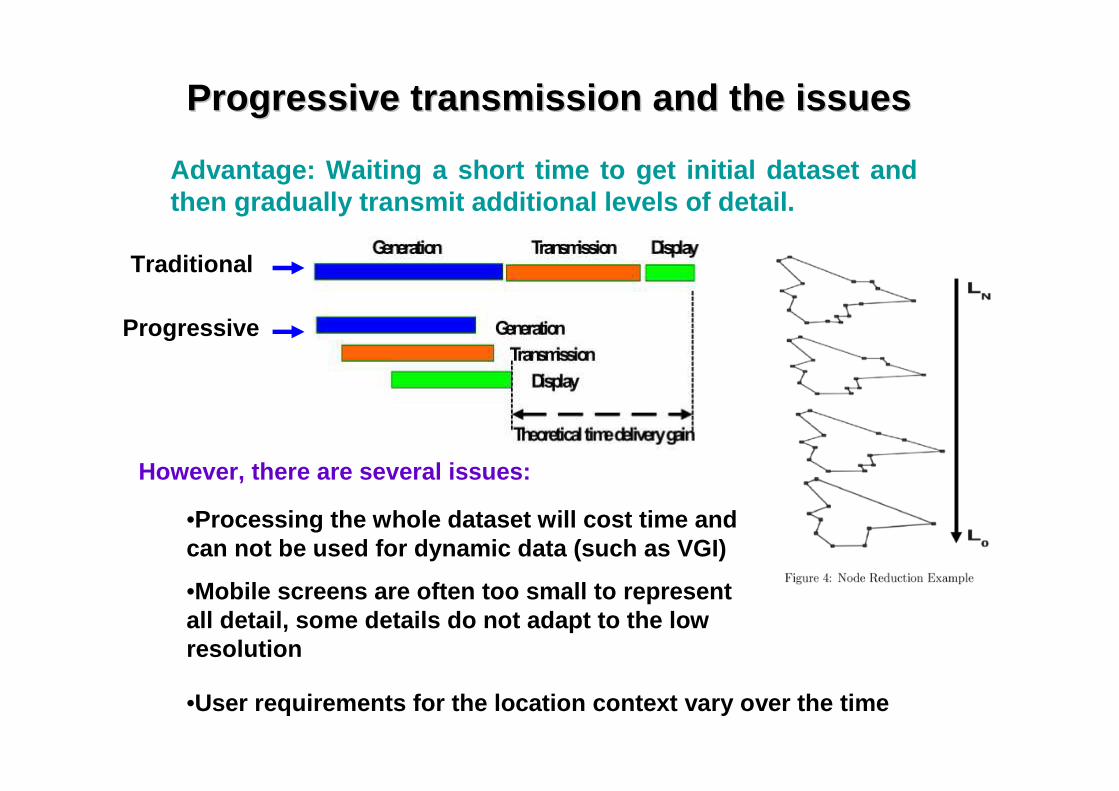
Progressive transmission and the issuesProgressive transmission and the issues
•Processing the whole dataset will cost time and can not be used for dynamic data (such as VGI)
•User requirements for the location context vary ove r the time
•Mobile screens are often too small to represent all detail, some details do not adapt to the low resolution
However, there are several issues:
Advantage: Waiting a short time to get initial datas et and then gradually transmit additional levels of detail.
Traditional
Progressive
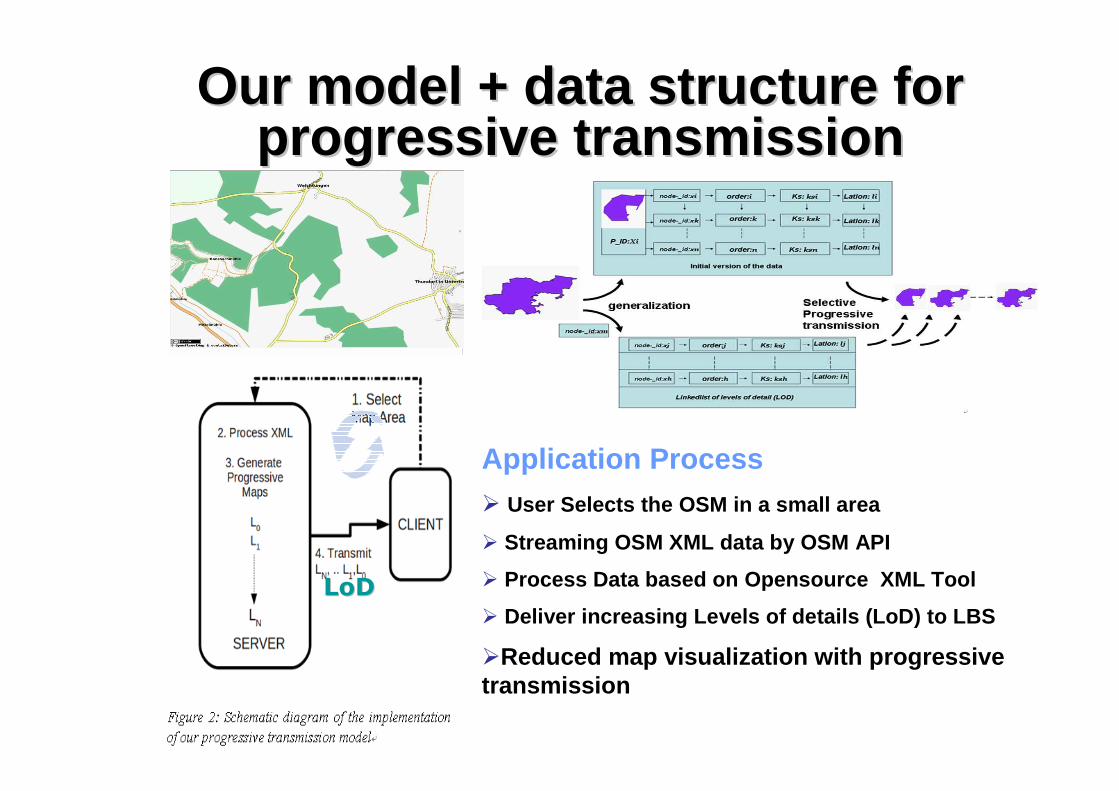
Our model + data structure for progressive transmission
Our model + data structure for Our model + data structure for progressive transmissionprogressive transmission
Application Process� User Selects the OSM in a small area
� Streaming OSM XML data by OSM API
� Process Data based on Opensource XML Tool
� Deliver increasing Levels of details (LoD) to LBS
�Reduced map visualization with progressive transmission
LoDLoD
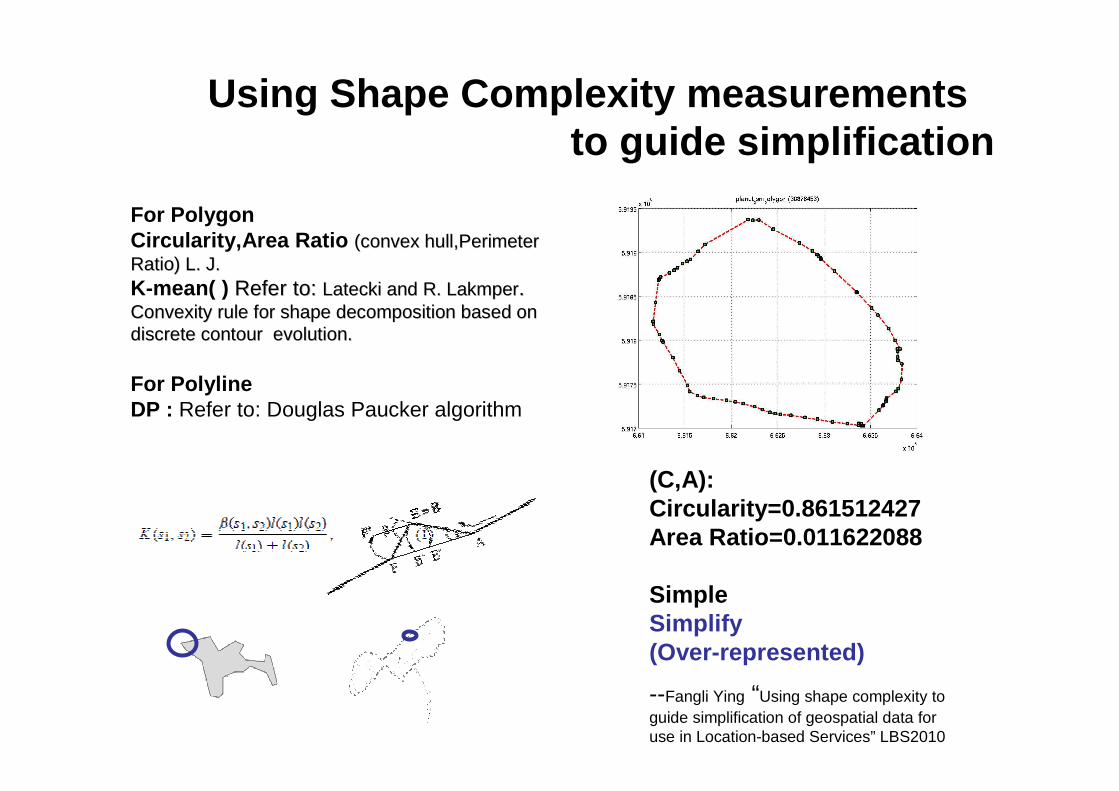
Using Shape Complexity measurementsto guide simplification
For PolygonCircularity,Area Ratio (convex (convex hull,Perimeterhull,PerimeterRatio) L. J. Ratio) L. J. K-mean( ) Refer to: Refer to: LateckiLatecki and R. and R. LakmperLakmper. . Convexity rule for shape decomposition based on Convexity rule for shape decomposition based on discrete contour evolutiondiscrete contour evolution..
For PolylineDP : Refer to: Douglas Paucker algorithm
(C,A):Circularity=0.861512427Area Ratio=0.011622088
SimpleSimplify (Over-represented)
--Fangli Ying “Using shape complexity to guide simplification of geospatial data for use in Location-based Services” LBS2010
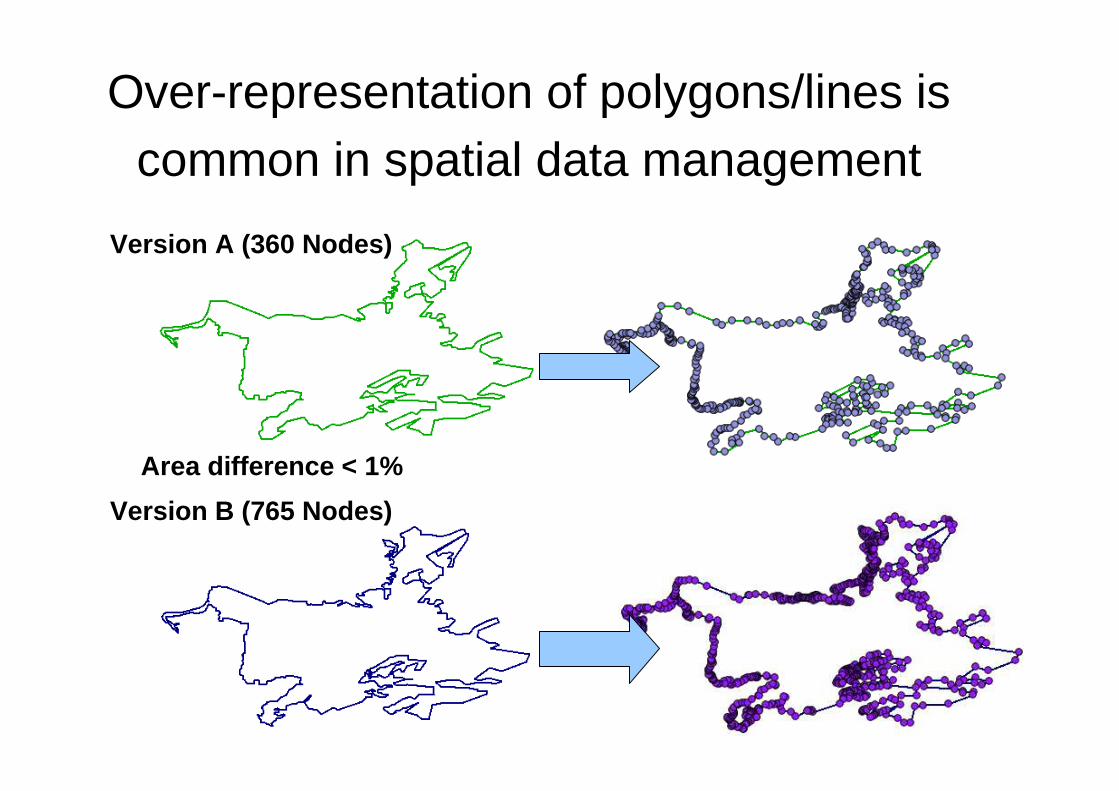
Over-representation of polygons/lines is common in spatial data management
Version A (360 Nodes)
Version B (765 Nodes)
Area difference < 1%

Com
plex
ity s
imila
rity
Increasing number of nodes
We found polygons which
contains large number of vertices.
However, only a few of these
vertices are really significant to
describe the overall shape when
progressively adding the details
--- Y. Fangli el. Paper in ACM SIGSPATIAL GIS 2010
Only few vertices are really significant for the sh ape
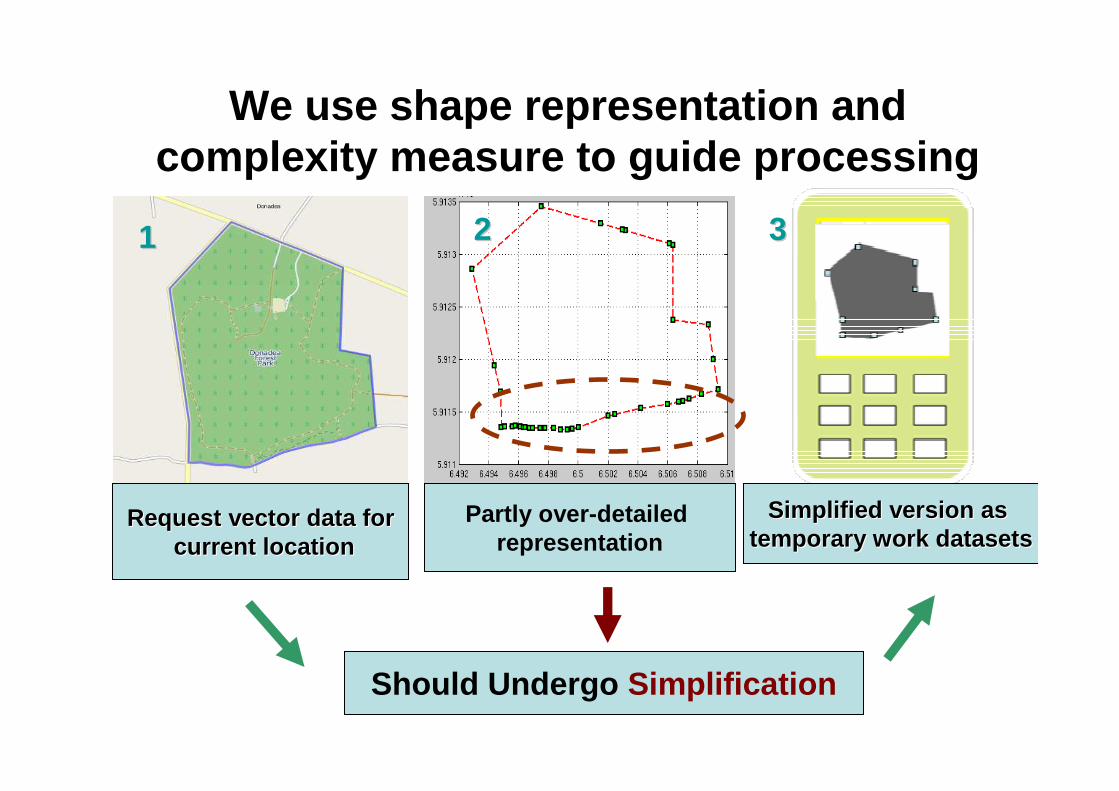
We use shape representation and complexity measure to guide processing
Request vector data forRequest vector data forcurrent locationcurrent location
Partly over-detailed representation
Simplified version as Simplified version as temporary work datasetstemporary work datasets
Should Undergo Simplification
11 22 33

Experimental Setup of user satisfaction test
�The 10 datasets selected include single polygon datasets and multi-polygon datasets.
� Users were given 10 sample maps in five levels, a ten point rank scale was used in the questionnaire from
�(1- ‘‘strongly disagree with the representation’’ to 10 -‘‘strongly satisfied with the map”).
�We ran our progressive transmission software for 10 input datasets. To ensure each user evaluated the same level Lk of the map we configured our client software to pause at 5 distinct levels.

Over-represented example – users liked all versions of the map
Final (mean score 7.9 out of 10)
Reduced by 40% (8.0 out of 10)
Reduced by 80% (8.1 out of 10)
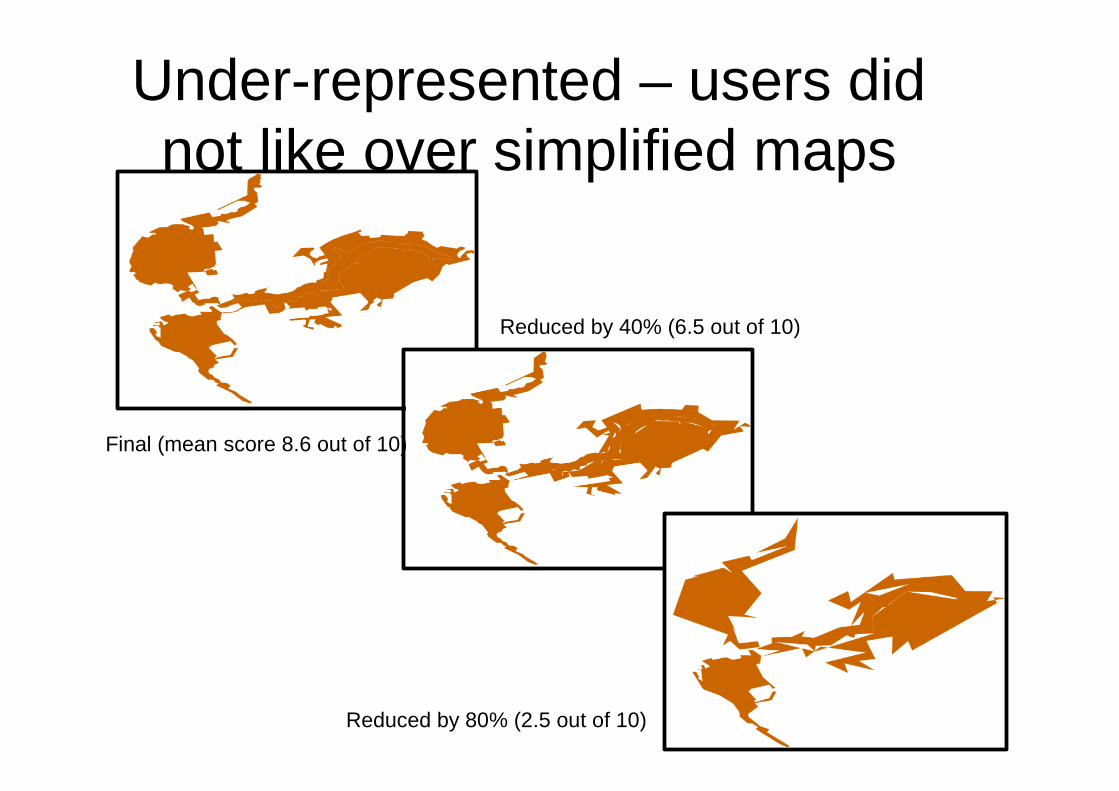
Under-represented – users did not like over simplified maps
Final (mean score 8.6 out of 10)
Reduced by 40% (6.5 out of 10)
Reduced by 80% (2.5 out of 10)
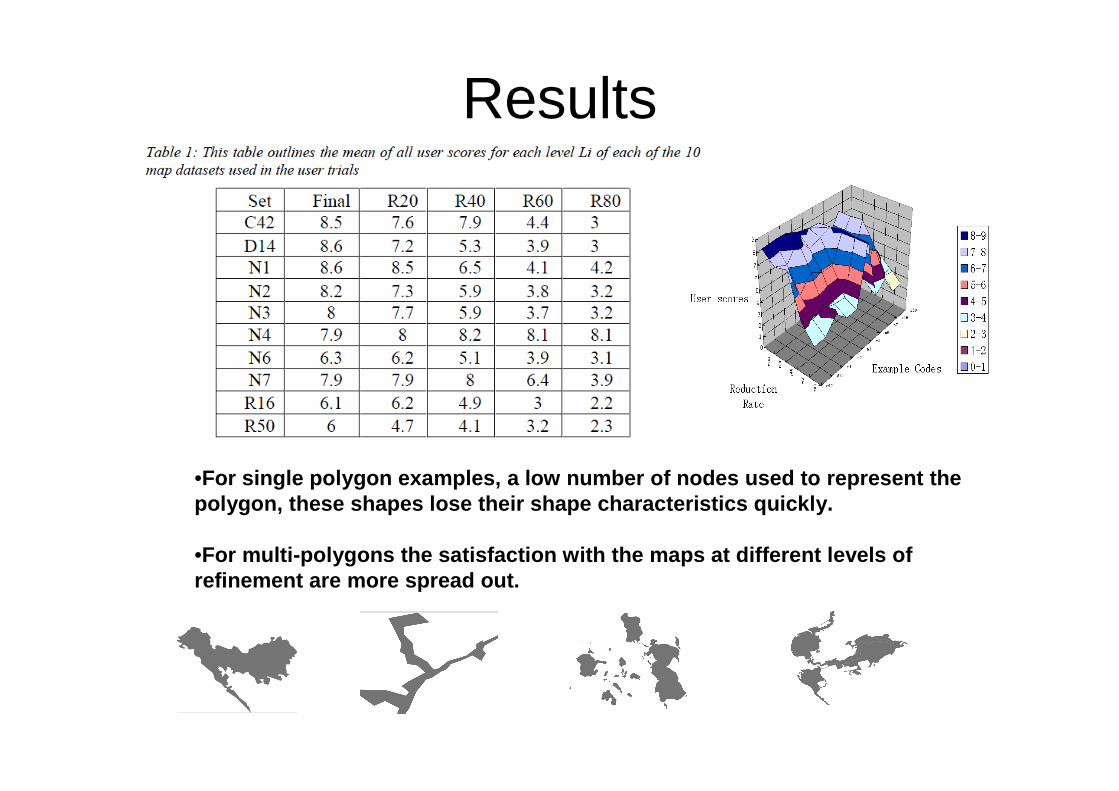
Results
•For single polygon examples, a low number of nodes used to represent the polygon, these shapes lose their shape characterist ics quickly.
•For multi-polygons the satisfaction with the maps a t different levels of refinement are more spread out.
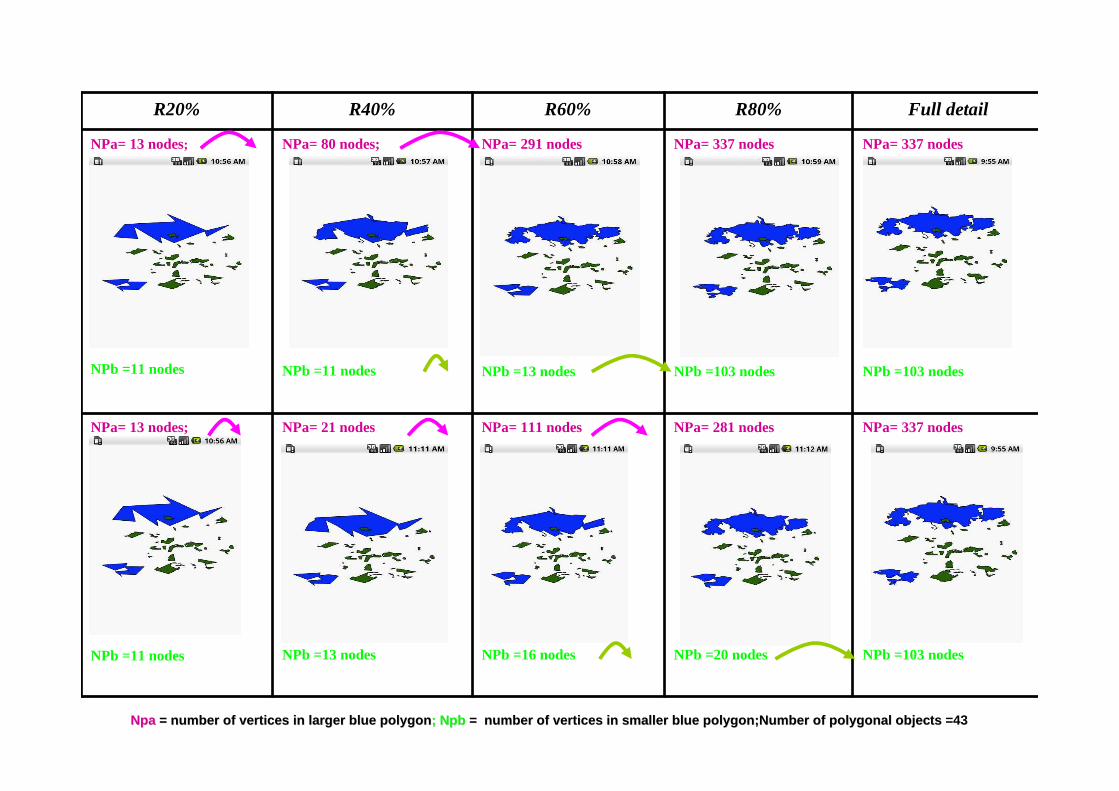
NPa= 337 nodes
NPb =103 nodes
NPa= 281 nodes
NPb =20 nodes
NPa= 111 nodes
NPb =16 nodes
NPa= 21 nodes
NPb =13 nodes
NPa= 13 nodes;
NPb =11 nodes
NPa= 337 nodes
NPb =103 nodes
NPa= 337 nodes
NPb =103 nodes
NPa= 291 nodes
NPb =13 nodes
NPa= 80 nodes;
NPb =11 nodes
NPa= 13 nodes;
NPb =11 nodes
Full detailR80%R60%R40%R20%
NpaNpa = number of vertices in larger blue polygon= number of vertices in larger blue polygon ; ; NpbNpb = number of vertices in smaller blue = number of vertices in smaller blue polygon;Numberpolygon;Number of polygonal objectsof polygonal objects =43
0
50
100
150
200
250
300
350
400
20% 40% 60% 80% 100%
NPa1
NPa2
NPb1
NPb2
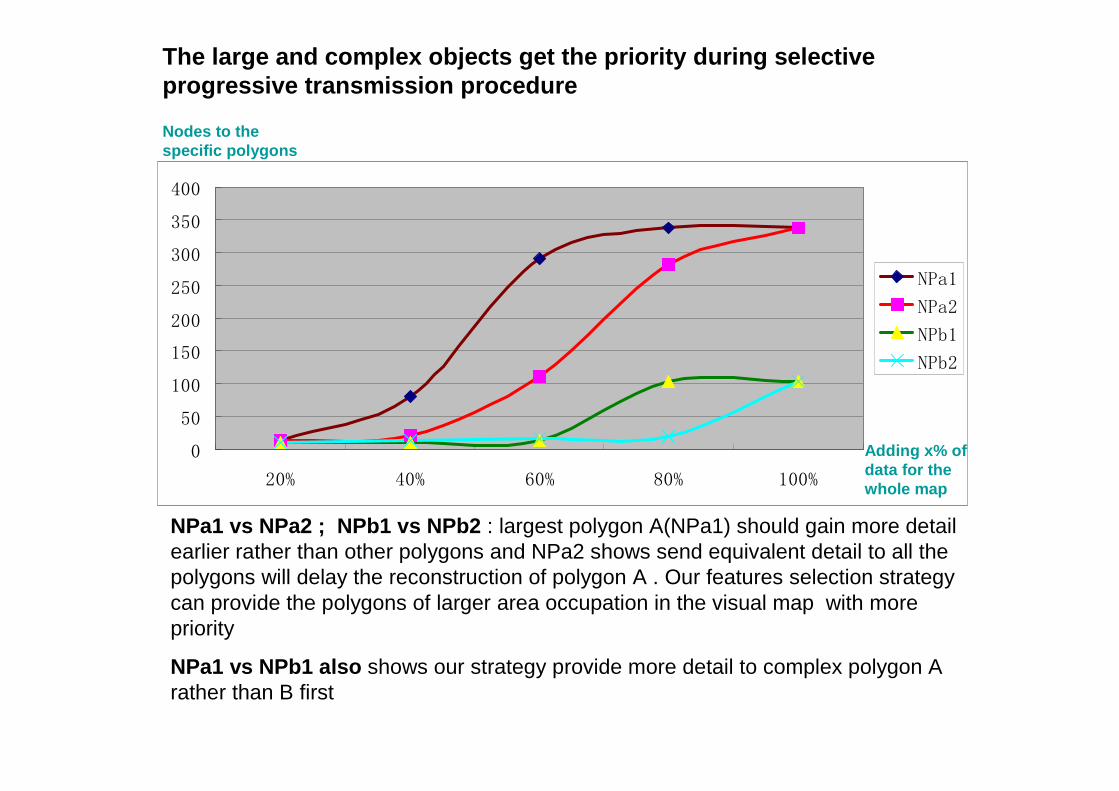
The large and complex objects get the priority duri ng selective progressive transmission procedure
NPa1 vs NPa2 ; NPb1 vs NPb2 : largest polygon A(NPa1) should gain more detail earlier rather than other polygons and NPa2 shows send equivalent detail to all the polygons will delay the reconstruction of polygon A . Our features selection strategy can provide the polygons of larger area occupation in the visual map with more priority
NPa1 vs NPb1 also shows our strategy provide more detail to complex polygon A rather than B first
Nodes to the specific polygons
Adding x% of data for the whole map
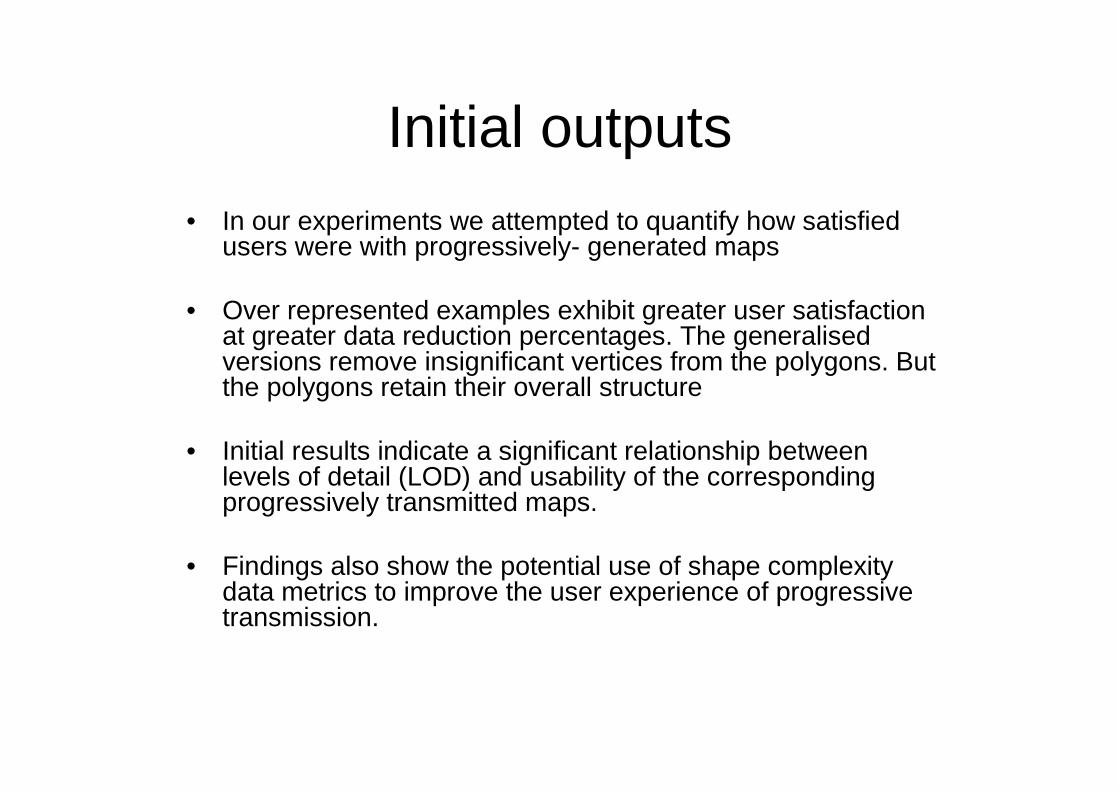
• In our experiments we attempted to quantify how satisfied users were with progressively- generated maps
• Over represented examples exhibit greater user satisfaction at greater data reduction percentages. The generalisedversions remove insignificant vertices from the polygons. But the polygons retain their overall structure
• Initial results indicate a significant relationship between levels of detail (LOD) and usability of the corresponding progressively transmitted maps.
• Findings also show the potential use of shape complexity data metrics to improve the user experience of progressive transmission.
Initial outputs
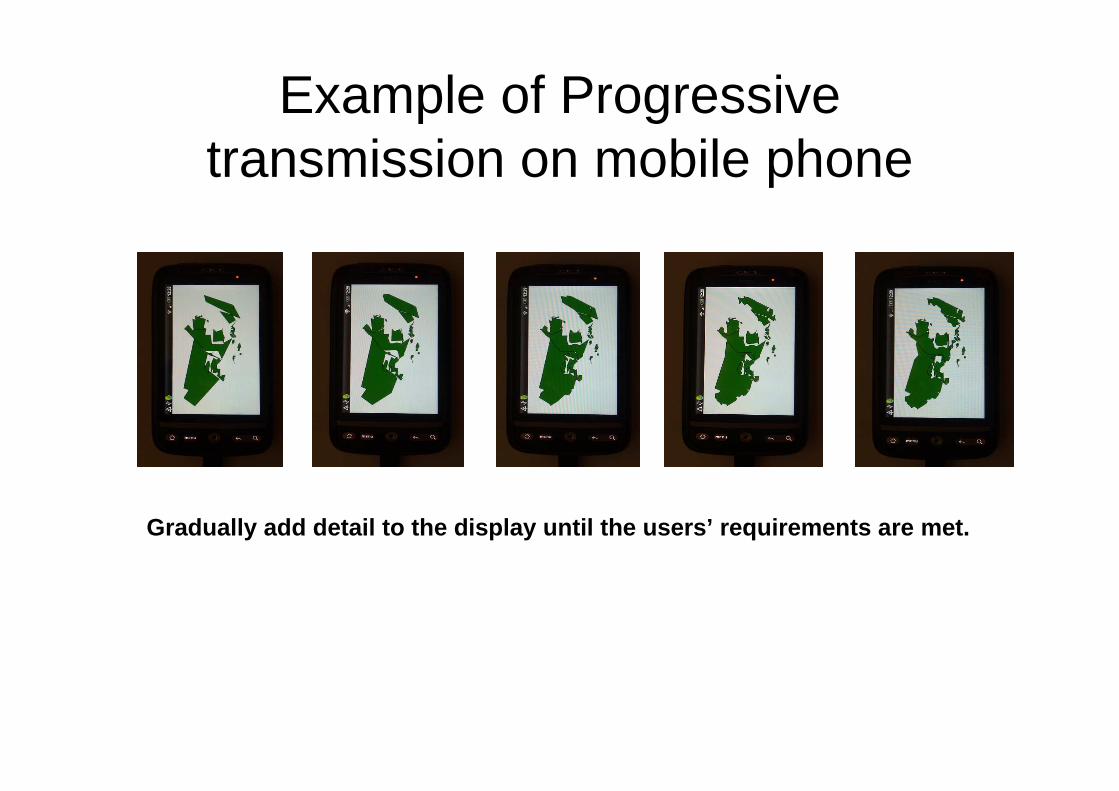
Example of Progressive transmission on mobile phone
Gradually add detail to the display until the users ’ requirements are met.
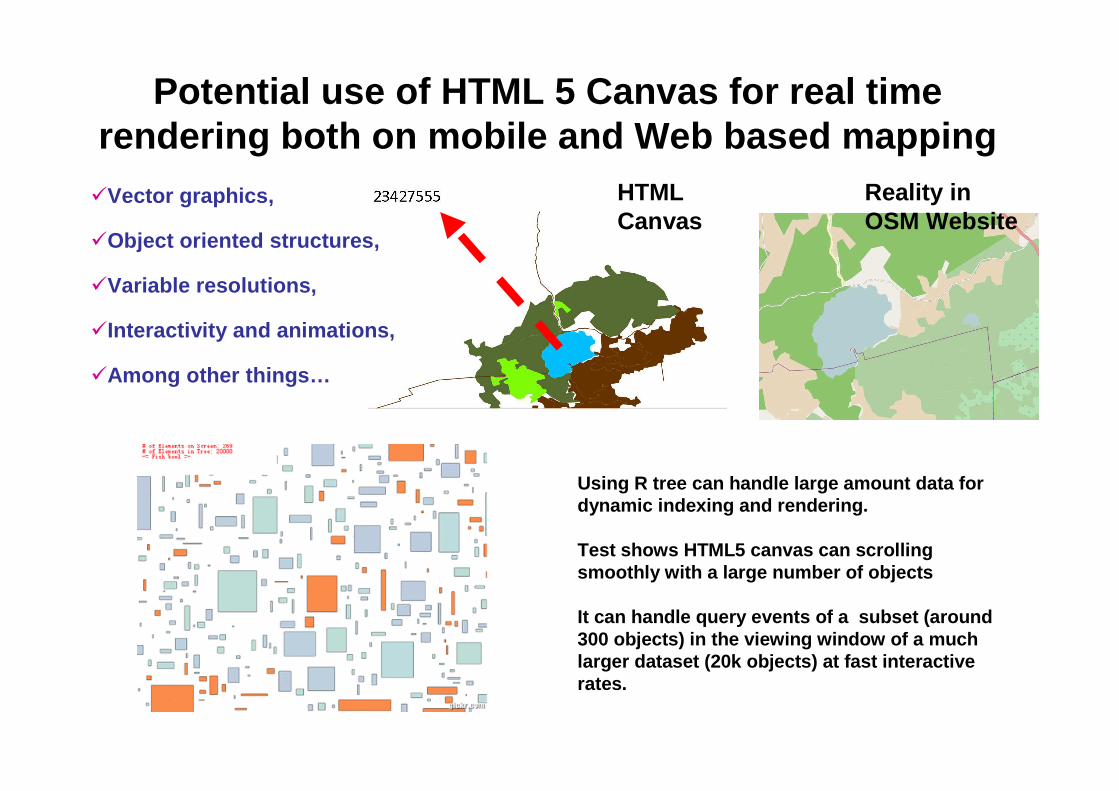
Potential use of HTML 5 Canvas for real time rendering both on mobile and Web based mapping
Reality in OSM Website
�Vector graphics,
�Object oriented structures,
�Variable resolutions,
�Interactivity and animations,
�Among other things…
HTML Canvas
Using R tree can handle large amount data for dynamic indexing and rendering.
Test shows HTML5 canvas can scrolling smoothly with a large number of objects
It can handle query events of a subset (around 300 objects) in the viewing window of a much larger dataset (20k objects) at fast interactive rates.
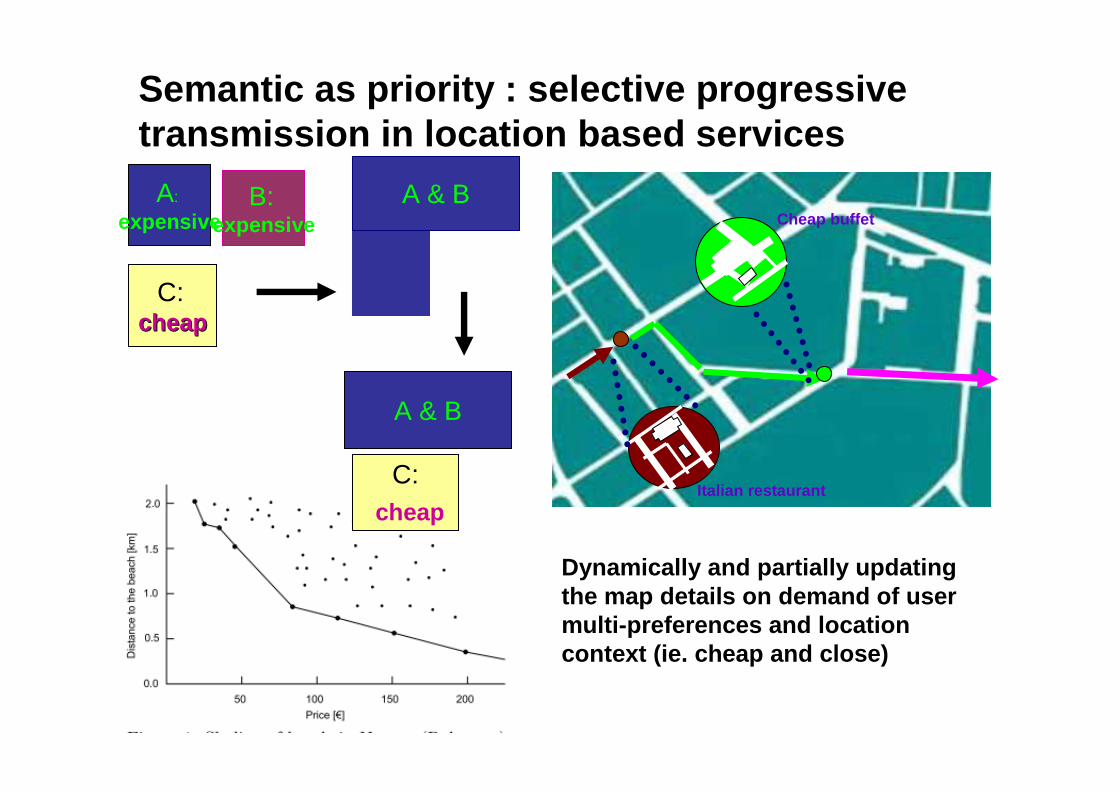
Semantic as priority : selective progressive transmission in location based services
C:cheapcheap
A:
expensiveB:
expensive
A & B
C:cheap
A & B
Dynamically and partially updating the map details on demand of user multi-preferences and location context (ie. cheap and close)
Italian restaurant
Cheap buffet
Future work• Additional user testing and statistics analysis
- Is there potential for user preference towards heavily generalized versions of the input dataset
---Ying, F. and Mooney, P. and Corcoran, P. and Winstanley, A.C. How little is enough? Evaluation of user satisfaction with maps generated by a progressive t ransmission scheme for geospatial data In proceedings of the 14th AGILE International Conference on Geographic Information Science, Utrecht, The Netherlands, April 18-21, 2011
• Perform best-first search and nearest search on skyline query for dynamic on-demand mapping - Map updating can adapt to user preferences and location changing
---Papadias, DimitrisFu, GregSeeger, Bernhard An Optimal and Progressive Algorithm for Skyline Queri es Proceedings of the 2003 ACM SIGMOD international conference on Management of data
• Dynamic rendering and effective mapping in LBS- How to identify, instantiate, and evaluate domain-specific design principles for creating more effective visualizations.
--- Agrawala, M. and Stolte, C. Rendering effective route maps: Improving usability through generalization . In Proceedings of SIGGRAPH (Los Angeles, Aug. 12–17). ACM Press, New York, 2001, 241–250