Embed Size (px)
Citation preview

In press, Journal of Gerontology: Psychological Sciences
Selectivity of attrition in longitudinal studies of cognitive functioning
Timothy A. Salthouse
Department of Psychology
University of Virginia
Charlottesville, VA 22904-4400
Email: [email protected]
Abstract
Objectives: Identify characteristics distinguishing people who do and do not continue to participate in a longitudinal study, and determine whether the longitudinal changes for people who continue are representative of the changes that would have occurred had longitudinal data been available from all of the initial participants. Method: Moderately large samples of returning (N = 2,082) and non-returning (N = 1,698) participants across a wide age range (i.e., 18 to 97 years of age) performed a battery of cognitive tests and completed personality and mood questionnaires. Differences between the groups were examined with multiple regression analyses with age, returner status, and their interaction as predictors. Results: Compared to participants who did not return, returning participants at the initial occasion had higher levels of each cognitive ability and of certain personality characteristics (e.g., agreeableness and openness), but many of the differences were only apparent among adults older than about 50 years of age. Importantly, there was no evidence that the longitudinal change for non-returning participants would have been different from that among the participants who did return. Discussion: The phenomenon of selective attrition is more complex than often assumed, and it may not necessarily limit the generalizability of longitudinal comparisons.
Consequences of selective attrition - 2
Selective attrition is widely recognized as a potential problem in longitudinal studies because if the people who continue to participate differ in relevant characteristics from the people who drop out, the longitudinal sample may no longer be representative of the initial sample (e.g., Baltes, Schaie & Nardi, 1971; Kennison & Zelinski, 2005; Lindenberger, Singer & Baltes, 1999; Riegel, Riegel & Meyer, 1968; Schaie, Labouvie & Barrett, 1973). Because they are sometimes confused, it is useful to distinguish four related, but conceptually separate, terms when discussing attrition: sample selectivity, magnitude of attrition, selectivity of attrition, and possible bias in the estimates of longitudinal change. Sample selectivity refers to the degree to which the research sample at the initial occasion is representative of a broader population. Magnitude of attrition refers to the proportion of participants in the initial sample who do not return for subsequent occasions, and selectivity of attrition refers to the difference between the returning and the non-returning participants in a relevant characteristic. Finally, bias in the estimates of change refers to the possibility that the estimates of longitudinal change might have been different had the non-returning participants continued to participate. Note that there is no necessary relation between representativeness of the initial sample and either the number or selectivity of the people who return for subsequent occasions, and regardless of the proportion who return, the attrition may not be selective, or the change estimates biased, if the people who continue to participate do not differ from those who discontinue participation either in their initial level of functioning, or in the longitudinal change they would have exhibited. Nevertheless, the phenomenon of selective attrition cannot be fully understood without considering each of these characteristics. The current project addressed five questions relevant to different aspects of selective attrition. First, which types of cognition differ between participants who do and do not return for subsequent longitudinal occasions? A number of studies have reported that individuals who return to participate in longitudinal assessments have higher levels of cognitive functioning at the initial occasion than the individuals who do not return (e.g., Baltes et al. 1971; Cooney, Schaie & Willis, 1988; Euser, Schram, Hofman, Westendorp & Breteler, 2008; Kennison & Zelinski, 2005; Lo & Jagust, 2012; Riegel, et al., 1968). However, the reports have been inconsistent about which particular cognitive abilities differ between returning and non-returning participants. For example, Cooney et al. (1988), Riegel et al. (1968), and Siegler and Botwinick (1979) reported larger selective attrition effects on measures of crystallized abilities than on measures of fluid abilities, but Riegel et al. (1968) and Schaie et al. (1973) found differences on all of their cognitive measures.
Second, are there non-cognitive characteristics that distinguish people who do and do not return for a subsequent occasion? As with the first question, the literature on this issue is inconsistent. To illustrate, Riegel et al. (1968) reported that returning participants had lower levels of rigidity than non-returning participants, but Schaie et al. (1973) found the reverse pattern, and different personality and mood characteristics were found to distinguish returning and non-returning participants in studies by Cooney et al. (1988), Kennison and Zelinski (2005) and Lindenberger, Singer and Baltes (1999). A recent review of attrition in longitudinal studies of older adults also revealed little consistency in the predictors of attrition (Chatfield, Brayne & Matthews, 2005).
Third, does the magnitude of selective attrition vary according to the reasons for attrition? Most reasons for attrition can be categorized as one of the Four M’s, i.e., mortality, morbidity, mobility, and motivation. Because the literature on terminal decline indicates that scores on a variety of cognitive measures are lower several years prior to death (see Backman & MacDonald, 2006, for a review), mortality-based attrition might be expected to be moderately large. Indeed, Cooney et al. (1988) found larger selective attrition for biological reasons (i.e., morbidity and mortality) than for psychological or sociological reasons (i.e., not interested and mobility) reasons. However, the question has not yet been definitively resolved because Van Beijsterveldt, van Boxtel, Bosma, Houx, Buntinx and Jolles (2002) found few differences at the

Consequences of selective attrition - 3
initial occasion between participants who did not return because they were not interested and participants who did not return because they were deceased.
Fourth, are there different patterns of selective attrition at different ages? Different patterns might be expected at different ages if the reasons for attrition vary with age, and if degree of selectivity varies according to reason. Only a few studies have included adults across a wide age range to examine the phenomenon at different ages, but each reported smaller differences between returners and non-returners among young adults than among older adults (e.g., Baltes et al. 1971; Reigel et al. 1968; Schaie et al. 1973).
And finally, does the presence of selective attrition necessarily lead to distorted estimates of longitudinal change? That is, regardless whether differences between returning and non-returning participants are found in the initial assessment, selective attrition may or may not be associated with differences in the direction or magnitude of longitudinal change. Obviously change cannot be directly examined in people with only a single measurement occasion, but at least two methods can be used to estimate change in people who do not return for subsequent occasions: (1) change can be examined in the returning participants at the levels of a relevant variable in non-returning participants at the first occasion; and (2) multiple imputation can be used to estimate scores at the second occasion for non-returning participants. The first method is based on the assumption that the critical difference between returners and non-returners is captured by a relevant variable at the first occasion, and the second method essentially treats the second occasion scores for non-returning participants as missing data, and estimates these values with multiple imputation (cf. Van Beijsterveldt et al., 2002).
With the exception of the question about age differences in selective attrition, in which the results do not appear to be widely known, the preceding questions either do not currently have an answer, or the relevant results have been inconsistent. At least some of the inconsistency may be attributable to relatively small samples of adults and limited assessment of cognitive abilities in the prior studies, and the current study was designed to overcome these limitations. The data were obtained from the Virginia Cognitive Aging Project (VCAP), which is an on-going longitudinal study involving adults between 18 and over 90 years of age (Salthouse, 2007; 2010b; Salthouse, Pink & Tucker-Drob, 2008).
Method Participants
Recruitment of new participants in VCAP has been continuous since 2001, and returning participants have been retested at variable intervals since 2004. However, new participants from 2011 and 2012 were not included in the current analyses because they have not yet had an opportunity to be invited to return for a second occasion. Of the participants whose first occasion was prior to 2011, 2,082 of them returned for one or more additional occasions, and 1,698 participated on only one occasion. The interval between the first and the second occasion ranged from 1 to 10 years, with an average of 2.9 years. However, because there was no relation between interval length and age, length of the interval between occasions was ignored in the current analyses.
Characteristics of the participants by age decade, with 18- and 19-year olds included in the decade of the 20s, are summarized in Table 1. It can be seen that increased age was associated with more years of education, but with slightly poorer self-ratings of health. Except for adults in their 90s, the average estimated IQ levels (see below) were above 100, and the correlation between age and estimated IQ was very close to zero. Cognitive Tests
A total of 16 cognitive tests, representing five cognitive abilities, were administered in the same order to all participants. Vocabulary was assessed by a provide-the-definition test, a picture naming test, and multiple-choice synonym and antonym tests. Reasoning was assessed by a matrix reasoning test, a letter sets test, and a series completion test. Spatial visualization

Consequences of selective attrition - 4
ability was assessed by a spatial relations test, a paper folding test, and a form boards test. Episodic memory was assessed by word recall, paired associates, and story (logical) memory tests. Perceptual speed ability was assessed by a digit symbol substitution test, and pattern comparison and letter comparison tests. Details of the tests, including reliabilities and results of factor analyses supporting the hypothesized ability structure, are reported in other publications (Salthouse, 2007, 2010a,b; Salthouse et al., 2008).
Cognitive functioning was examined with composite scores formed by averaging z-scores (based on the means and standard deviations from the first assessment in the complete sample) for the three or four measures representing each cognitive ability. A principal components analysis was conducted on all 16 measures, and because the first principal component (PC1) was associated with 43.7% of the variance, it was also used as a general measure of cognitive functioning in some analyses. Non-Cognitive measures
The participants completed a set of questionnaires at home, and thus the relations of these measures to attrition were also examined. The questionnaires included the IPIB Big Five personality inventory (Goldberg, 1999), the CES-D depressive symptoms inventory (Radloff, 1977), the Spielberger Trait Anxiety Scale (Spielberger, Gorsush, Lushene, Vagg & Jacobs, 1983), the Need for Cognition scale (Cacioppo, Petty, Feinstein & Jarvis, 1996) and the Life Satisfaction Scale (Diener, Emmons, Larsen & Griffin, 1985). Internal consistency reliabilities for these scales in a subset of the current sample ranged from .78 to .94 (Soubelet & Salthouse, 2011). Assessment of representativeness In a recent study (Salthouse, in press), both the VCAP test battery and the Wechsler Adult Intelligence Scale IV test battery were administered to 90 adults between 20 and 80 years of age, which allowed estimates of WAIS Full Scale IQ scores to be derived in the VCAP participants. This information about IQ referenced to the nationally representative normative sample is valuable to express representativeness of the initial sample (i.e., sample selectivity), as well as to characterize the selectivity of the returning sample (i.e., selective attrition) in a familiar metric.
Because IQ scores in the Wechsler battery are age-adjusted, the estimation procedure consisted of partialling age from the VCAP raw scores to create residual scores, determining the best prediction of WAIS IV IQ from the 16 residual scores, and then using the resulting regression equation to estimate IQ in the VCAP participants. The most parsimonious regression equation with good prediction of IQ (i.e., R2 = .86) was: = 109.32 + 2.47 (series completion residual) + 1.54 (antonym vocabulary residual) + 1.78 (paper folding residual). The estimated IQ had a correlation of .80 with the first principal component, but the two measures differed in terms of their correlations with age as the IQ measure had a correlation of .01 whereas the PC1 measure had a correlation of -.43.
Both the range of IQs, from 60 to 141, and the standard deviation of 13.9, were similar to the values in the nationally representative sample used to create the norms for the Wechsler IQ scores, and therefore the current sample can be inferred to have nearly the same degree of variability as that found in the U.S. population.
Results Attrition
The third column in Table 1 contains the proportions of the total sample of participants who did not return for a second longitudinal occasion. It can be seen that 60% or more of the participants between 40 and 80 years of age returned for a subsequent occasion, with somewhat smaller percentages at younger and older ages. The proportions of non-returning participants in the moved, not interested, demented, and deceased categories are reported in Table 2. The proportions do not sum to 1.0 because some participants were not reachable, or had expressed a willingness to participate but had not

Consequences of selective attrition - 5
yet been scheduled because of availability. Mortality was assessed from social security death records, and mobility was primarily determined from the return of first-class letters indicating a change of address outside of the local metropolitan area. The not interested category was probably comprised of a mixture of individuals who did not return because of low motivation or poor health (i.e., morbidity). The numbers in the dementia category are undoubtedly underestimates because they are based on reports from a spouse or other relative, and were not based on formal evaluations of all non-returners. Inspection of the entries in Table 2 reveals that mobility was greatest at the youngest ages. The proportions in the other categories were generally small, but were higher at older ages. Selectivity of Attrition
Figure 1 portrays the estimated IQs for participants who did and did not continue to participate as a function of age decade. It should be noted that the estimated IQs in both returning and non-returning groups were above 100 at all ages, which indicates that the initial sample was select relative to the general population. Also evident in Figure 1 is that returners had higher scores than non-returners for participants above about 50 years of age, but that the reverse was true for participants younger than about 40 years of age.
Characteristics associated with attrition were examined with regression analyses in which age, returner status (0 for not-return, 1 for return), and their interaction (after centering the age variable to minimize collinearity) were predictors of the cognitive composite scores, and of the mood and personality variables (in z-score units), at the first measurement occasion (T1). Unstandardized regression coefficients for these analyses are reported in Table 3.
The entries in the first two rows indicate that there were no differences between males and females with respect to returner status, and that the people who returned had better self-rated health (i.e., ratings closer to 1) than those who did not return. The significant interaction for education indicates that among young adults, individuals with higher levels of education were less likely to continue to participate than those with lower levels of education, but that no differences were evident among older adults. Rows 4 through 9 in Table 3 contain information about the cognitive ability measures. All cognitive measures are in z-score units, and thus the age coefficient reflects the difference in number of standard deviations associated with one year of age, and the coefficient for returner status reflects the standard deviation difference between returners and non-returners. As expected, the age relations on the cognitive abilities were all significant, in a positive direction for vocabulary and in a negative direction for other abilities. The positive effect of returner status indicates that the T1 scores for each cognitive ability were higher for the returning participants than for the non-returning participants.
Consistent with the pattern in Figure 1, all of the age-by-returner status interactions were in the direction of higher values for returning participants at older ages, but lower values for returners at younger ages. Analyses conducted at each decade generally revealed that the interactions were attributable to significantly higher values for non-returning participants in their 20s, but significantly higher values for returning participants among participants 50 years of age and older. The opposite pattern at younger ages was likely attributable to the higher mobility at this age (cf. Table 2). Indeed, comparison of the estimated IQs for the individuals who had or had not moved revealed a significant difference only at the youngest decade, in which the movers had an estimated IQ of 111 compared to 107 for non-movers. The remaining rows in Table 3 contain information about the non-cognitive variables. The analyses with the personality and mood characteristics indicated that returners had higher levels of openness and agreeableness than the non-returners, and among older participants, the returning participants were higher in extraversion and in Need for Cognition than non-returning participants. No differences were evident between those who did and did not return in the measures of anxiety, depressive symptoms, or emotional stability (i.e., reverse of neuroticism).

Consequences of selective attrition - 6
Estimating change in non-returning participants Two methods were used to determine whether the people who did not continue to
participate might have had a different pattern of longitudinal change than people who did continue. One method involved a two-step process in which the relation of change to overall cognitive ability was first determined in the returning participants, and then that relation was used to estimate the cognitive change corresponding to the initial ability levels of the returning and non-returning participants. Parameters of the regression equations predicting the T2-T1 differences in the composite cognitive scores from age, a measure of overall cognitive ability, and their interaction, are reported in Table 4. In order to facilitate comparisons across ability measures, the relations in Table 4 are expressed as standardized coefficients. It can be seen that the patterns were very similar when general cognitive ability was assessed with the estimated IQ measure and with the PC1 measure.
Increased age was associated with more negative longitudinal change in each cognitive ability, which is consistent with other reports based on subsets of these data (Salthouse, 2010a; b). There were also significant ability effects on the change in the vocabulary and reasoning composite scores, in the direction of more negative change at higher ability levels. However, the lack of interactions of general cognitive ability with age suggests that the ability-change relations were similar at each age for all five cognitive composite scores.
The parameters from the regression equations were next used to determine the change from T1 to T2 at the estimated IQ levels of the returning and non-returning participants. These values are portrayed as a function of age decade in the five panels of Figure 2. It can be seen that the functions for the estimated change at the T1 ability levels corresponding to the returning and non-returning participants were almost identical. Although not illustrated, a very similar pattern was evident when ability was assessed with the PC1 measure instead of estimated IQ.
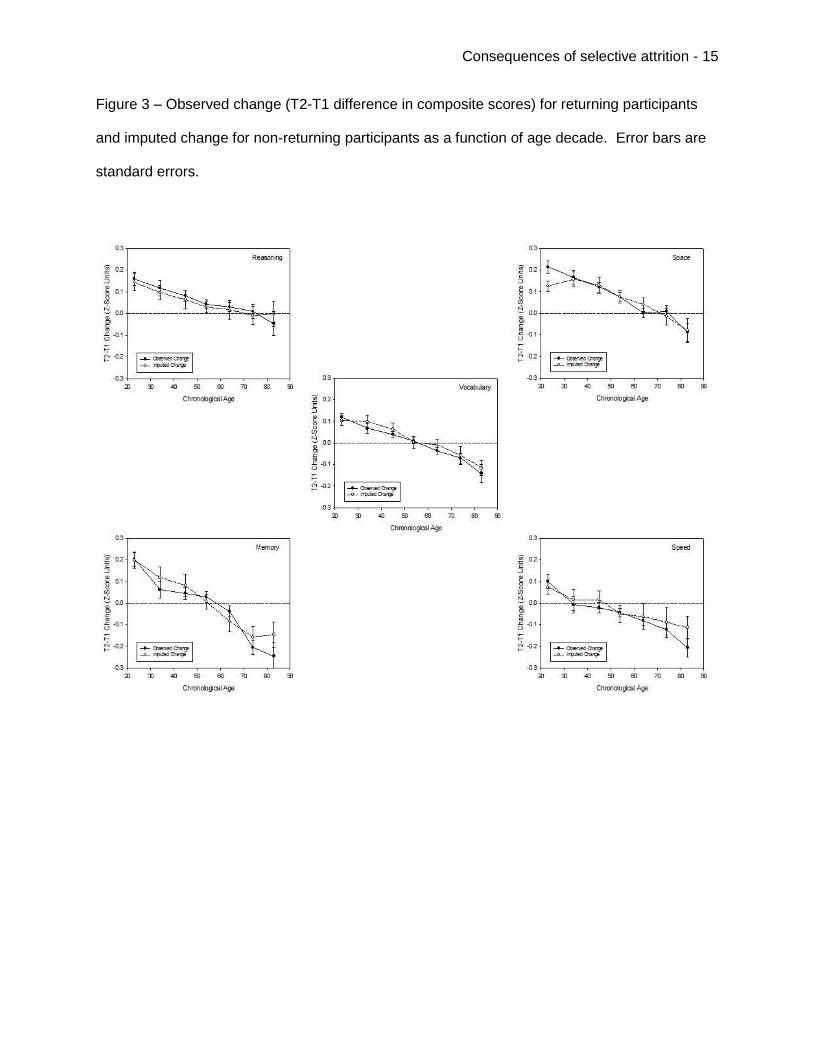
The second method used to estimate longitudinal change for non-returning participants was based on imputation of the T2 score. That is, multiple imputation was used to estimate the T2 composite scores for non-returners on the basis of data from all participants for age, composite cognitive scores at T1 and at T2 (only for returners), and values of openness, agreeableness, extraversion and Need for Cognition at T1. Five separate imputations were generated, and then pooled estimates of the T2 composite scores were created for each ability. These pooled T2 estimates were used to determine T2-T1 composite score differences for the non-returners, which are plotted together with the observed differences for returners in the five panels of Figure 3. Inspection of the figure reveals that the imputed changes were very similar to the observed changes in each ability and at each age decade.
Discussion The current study was conducted to investigate five questions related to selective
attrition. The first question was what aspects of cognitive functioning differ between individuals who do and do not return for a subsequent occasion in a longitudinal study. The results in Table 3 indicate that returning participants had higher levels of all five cognitive abilities, and of the 1st principal component representing variance that all cognitive variables had in common. Although some earlier studies reported larger differences for measures of crystallized intelligence or vocabulary, their representation of other abilities was limited and the sample sizes were small compared to the present study.
The second question was whether there were non-cognitive differences between returning and non-returning participants. Results relevant to this question are also presented in Table 3. Compared to individuals who did not return, those who returned had better self-rated health, and were higher in openness and agreeableness. Furthermore, among older adults, the returners were higher in extraversion and on the Need for Cognition scale. No differences between participants who did and did not return were apparent in measures of negative affect (i.e., depressive symptoms, trait anxiety, or emotional stability).
The third question was whether selectivity varied according to the reasons for attrition.

Consequences of selective attrition - 7
Very small proportions of participants in the sample had died or were identified as demented, and therefore only non-returning participants in the not interested and moved categories were compared. The only significant difference was at young ages, in which people who had moved had higher initial levels of cognitive ability than those who discontinued participation because they were not interested.
The fourth question addressed in the study was whether there were age differences in the selectivity of the attrition. The answer to this question was unequivocally positive, as pronounced age differences were apparent in Figure 1, and several interactions of age and returner status in Table 3 were significant. In each case, older returning participants had higher initial levels than the non-returning participants, but, probably because of the greater mobility among high functioning young adults, the reverse was true at younger ages. As mentioned in the introduction, several earlier studies have also reported little or no selective attrition among young adults (e.g., Baltes et al., 1971; Riegel et al., 1968; Schaie, et al., 1973). Those results, together with the results of the current study, indicate that selective attrition is not always in the direction of survival of the fittest, because this does not appear to be the case at younger ages where the direction of selectivity may even be reversed.
The fifth question investigated in the study was whether selectivity is also apparent in the direction or magnitude of longitudinal changes. Two methods were used to investigate this question. The first method was based on the assumption that the primary factor affecting longitudinal change is initial level of overall cognitive ability, and therefore cognitive change was examined in the sample of returning participants at the mean level of initial ability corresponding to the non-returning participants. Results of these analyses are portrayed in the five panels of Figure 2. Perhaps because none of the age-by-ability interactions in Table 4 were significant, the age-change relations for returning and non-returning participants in the five panels of Figure 2 were nearly identical.
The second method used to estimate change among non-returning participants relied on multiple imputation to derive the best estimate of what the score at T2 would have been had there been no missing data. That is, the cognitive scores at T1 and T2 and the non-cognitive variables at T1 that were associated with attrition in Table 3 were used as predictors of the imputed values of the cognitive composite scores at T2. The estimated mean T2-T1 differences derived from these imputed T2 scores are plotted by age decade in the five panels of Figure 3. Although there is clearly more variability in this figure than in Figure 2, the age-change functions for the observed changes in returning participants and for the estimated changes in non-returning participants were very similar in each panel. The results in Figures 2 and 3 therefore suggest that although the older individuals who participated in this longitudinal study had higher levels of cognitive abilities on the initial occasion than those who did not, there was little indication that the magnitude of cognitive change would have been different had there been no attrition.
It is important to recognize that the use of data from returning participants to predict the T2 scores (and T2-T1 changes) of non-returning participants is based on the missing at random (MAR) assumption that the T2 scores for non-returning participants are unrelated to returner status after controlling the values of other measured variables. It is therefore possible that the estimates of change in Figures 2 and 3 are inaccurate if the individuals who do not return differ from those who do return in aspects of T2 scores (and T2-T1 changes) that are not fully captured by the T1 scores (for the estimates in Figure 2), or by the variables found to differ between returning and non-returning participants (for the estimates in Figure 3). Unfortunately, because no T2 data are available from the non-returning participants, the validity of this assumption cannot be directly evaluated with the current data. To summarize, the current results indicate that the phenomenon of selective attrition is complex, as the direction and magnitude of selective attrition varies with the age of the individual, and according to the type of variable under consideration. Compared to people who

Consequences of selective attrition - 8
do not continue to participate, people who continue to participate had higher average levels of cognitive abilities, and higher values in personality characteristics such as openness and agreeableness. However, even when selective attrition is pronounced, the results of this study suggest that, at least among moderately healthy adults ranging from 18 to over 80 years of age, and assuming that the data from non-returning participants are missing at random, selective attrition does not necessarily lead to biases in the estimates of longitudinal change.

Consequences of selective attrition - 9
References Backman, L. & MacDonald, S.W.S. (2006). Death and cognition: Synthesis and outlook.
European Psychologist, 11, 224-235. http://dx.doi.org/10.1027/1016-9040.11.3.161 Baltes, P.B., Schaie, K.W., & Nardi, A.H. (1971). Age and experimental mortality in a
seven-year longitudinal study of cognitive behavior. Developmental Psychology, 5, 18-26. http://dx.doi.org/10.1037/h0031085
Cacioppo, J. T., Petty, R. E., Feinstein, J. A., & Jarvis, W. B. G. (1996). Dispositional differences in cognitive motivation: The life and times of individuals varying in Need for Cognition. Psychological Bulletin, 119, 197–253. http://dx.doi.org/10.1037/0033-2909.119.2.197
Chatfield, M.D., Brayne, C.E., & Matthews, F.E. (2005). A systematic literature review of attrition between waves in longitudinal studies in the elderly shows a consistent pattern of drop out between differing studies. Journal of Clinical Epidemiology, 58, 13-19. http://dx.doi.org/10.1016/j.jclinepi.2004.05.006
Cooney, T.M., Schaie, K.W., & Willis, S.L. (1988). The relationship between prior functioning on cognitive and personality dimensions and subject attrition in longitudinal research. Journal of Gerontology, 43, P12-P17. http://dx.doi.org/10.1093/geronj/43.1.P12
Diener, E., Emmons, R. A., Larsen, R. J., & Griffin, S. (1985). The Satisfaction With Life Scale. Journal of Personality Assessment, 49, 71–75. http://dx.doi.org/10.1207/s15327752jpa4901_13
Euser, S.M., Schram, M.T., Hofman, A., Westendorp, R.G.J., & Breteler, M.M.B. (2008). Measuring cognitive function with age: The influence of selection by health and survival. Epidemiology, 19, 440-447. http://dx.doi.org/10.1097/EDE.0b013e31816a1d31
Goldberg, L. R. (1999). A broad-bandwidth, public domain, personality inventory measuring the lower-level facets of several five-factor models. In I.Mervielde, I. Deary, F. De Fruyt, & F. Ostendorf (Eds.), Personality psychology in Europe (Vol. 7, pp. 7–28). Tilburg, The Netherlands: Tilburg University Press.
Kennison, R.F. & Zelinski, E.M. (2005). Estimating age change in list recall in Asset and Health Dynamics of the Oldest Old: The effects of attrition bias and missing data treatment. Psychology and Aging, 20, 460-475. http://dx.doi.org/10.1037/0882-7974.20.3.460
Lindenberger, U., Singer, T., & Baltes, P.B. (2002). Longitudinal selectivity in aging populations: Separating mortality-associated versus experimental components in the Berlin Aging Study (BASE). Journal of Gerontology: Psychological Sciences, 57B, P474-P482. http://dx.doi.org/10.1093/geronb/57.6.P474
Lo, R.Y. & Jagust, W.J. (2012) Predicting missing biomarker data in a longitudinal study of Alzheimer disease. Neurology, 78, 1376-1382. http://dx.doi.org/10.1212/WNL.0b013e318253d5b3
Radloff, L. S. (1977). The CES-D Scale: A self-report depression scale for research in the general population. Applied Psychological Measurement,1, 385–401. http://dx.doi.org/10.1177/014662167700100306
Riegel, K.F., Riegel, R.M. & Meyer, G. (1968). The prediction of retest resisters in research on aging. Journal of Gerontology, 23, 370-374. http://dx.doi.org/10.1093/geronj/23.3.370
Salthouse, T.A. (2007). Implications of within-person variability in cognitive and neuropsychological functioning on the interpretation of change. Neuropsychology, 21, 401-411. http://dx.doi.org/10.1037/0894-4105.21.4.401
Salthouse, T.A. (2010a). Does the meaning of neurocognitive change change with age? Neuropsychology, 24, 273-278. http://dx.doi.org/10.1037/a0017284
Salthouse, T.A. (2010b). Influence of age on practice effects in longitudinal neurocognitive change. Neuropsychology, 24, 563-572. http://dx.doi.org/10.1037/a0019026
Salthouse, T.A. (in press). Evaluating the correspondence of different cognitive batteries. Assessment.

Consequences of selective attrition - 10
Salthouse, T.A., Pink, J.E., & Tucker-Drob, E.M. (2008). Contextual analysis of fluid intelligence. Intelligence, 36, 464-486. http://dx.doi.org/10.1016/j.intell.2007.10.003
Schaie, K.W., Labouvie, G.V., & Barrett, T.J. (1973). Selective attrition effects in a fourteen-year study of adult intelligence. Journal of Gerontology, 28, 328-334. http://dx.doi.org/10.1093/geronj/28.3.328
Siegler, I.C. & Botwinick, J. (1979). A long-term longitudinal study of intellectual ability of older adults: The matter of selective subject attrition. Journal of Gerontology, 34, 242-245. http://dx.doi.org/10.1093/geronj/34.2.242
Siegler, I.C., McCarty, S.M., & Logue, P.E. (1982). Wechsler memory scale scores, selective attrition, and distance from death. Journal of Gerontology, 37, 176-181. http://dx.doi.org/10.1093/geronj/37.2.176
Soubelet, A. & Salthouse, T.A. (2011). Influence of social desirability on age differences in self reports of mood and personality. Journal of Personality, 79, 741-762. http://dx.doi.org/10.1111/j.1467-6494.2011.00700.x
Spielberger, C. D., Gorsush, R. L., Lushene, R., Vagg, P. R., & Jacobs, G. A. (1983). Manual of the State-Trait Anxiety Inventory (Form Y). Palo Alto, CA: Consulting Psychologists Press.
Van Beijsterveldt, C.E.M., van Boxtel, M.P.J., Bosma, H., Houx, P.J., Buntinx, F., & Jolles, J. (2002). Predictors of attrition in a longitudinal cognitive aging study: The Maastricht Aging Study (MAAS). Journal of Clinical Epidemiology, 55, 216-223. http://dx.doi.org/10.1016/S0895-4356(01)00473-5
Table 1 Sample characteristics (with standard deviations in parentheses) Group N Attrition Age Females Education Health Est. IQ 20s 688 .67 23.0 (3.1) .57 14.7 (2.1) 2.0 (0.9) 108.7 (11.8) 30s 351 .51 34.3 (2.8) .72 15.8 (2.8) 2.1 (0.8) 107.4 (14.6) 40s 601 .40 45.0 (2.9) .73 15.3 (2.6) 2.1 (0.9) 107.2 (15.5) 50s 848 .37 54.4 (2.8) .70 15.9 (2.6) 2.2 (0.9) 110.2 (14.6) 60s 597 .34 64.2 (2.9) .66 16.4 (2.8) 2.1 (0.9) 111.2 (13.3) 70s 463 .38 74.2 (2.8) .58 15.8 (2.8) 2.4 (0.9) 109.4 (13.3) 80s 209 .54 83.1 (2.6) .41 16.2 (3.2) 2.6 (0.8) 105.9 (13.9) 90s 23 .61 92.2 (1.9) .30 16.2 (3.2) 2.5 (0.9) 96.3 (11.9) Age Correlation -.02 .18* .15* .01 Note: Attrition refers to the proportion of participants at T1 who did not return at T2, Females refers to the proportion of females, Education is reported in years completed, and Health is on a scale from 1 (for excellent) to 5 (for poor). Est. IQ refers to the estimated full-scale IQ (see text for details.)

Consequences of selective attrition - 11
Table 2 Proportions of participants who did not return by reason and age decade Group N Moved Not Interest. Dementia Died 20s 461 .66 .05 .00 .00 30s 179 .57 .06 .00 .00 40s 241 .42 .09 .00 .01 50s 313 .41 .11 .00 .01 60s 203 .30 .24 .00 .03 70s 175 .34 .26 .01 .06 80s 112 .28 .18 .04 .11 90s 14 .07 .14 .00 .36

Consequences of selective attrition - 12
Table 3 Unstandardized regression coefficients predicting characteristics at T1 from age, returner status, and their interaction Age Returner (0,1) Age*Returner Interaction Sex (0=M) .000 .032 -.002 Health (1=Excellent, 5=poor) .009* -.085* -.004 Education .019* .052 .015* Vocabulary .007* .143* .007* Reasoning -.026* .133* .008* Spatial Visualization -.026* .042 .008* Memory -.024* .141* .008* Speed -.033* .113* .005* 1st Principal Component -.029* .165* .010* Emotional Stability .008* -.073 .003 Extraversion -.003 -.051 .006* Openness -.006* .105* .004 Agreeableness .001 .109* .005 Conscientiousness .008* .065 .002 CES-D (depressive symptoms) -.008* -.059 -.003 Trait Anxiety -.012* -.005 -.003 Need for Cognition -.007* .032 .008* Life Satisfaction .004* .019 .004 Note: All dependent variables except sex, health, and education are in z-score units. Table 4 Standardized (beta) coefficients predicting T2-T1 longitudinal difference in five cognitive abilities from age, initial ability, and their interaction Ability = Est.IQ Age Est.IQ Age*Est.IQ Vocabulary -.157* -.105* -.047 Reasoning -.105* -.124* -.007 Spatial Visualization -.178* -.040 -.056 Memory -.232* .042 -.042 Speed -.161* -.018 -.055 Ability = PC1 Age PC1 Age*PC1 Vocabulary -.196* -.094* -.026 Reasoning -.163* -.124* .000 Spatial Visualization -.187* -.029 -.031 Memory -.234* -.031 -.024 Speed -.192* -.065 -.036 *p<.01

Consequences of selective attrition - 13
Figure Captions
Figure 1 – Estimated IQ at the first occasion for adults who did and who did not return for a
second occasion as a function of age decade. Error bars are standard errors.

Consequences of selective attrition - 14
Figure 2 – Change (T2-T1 difference in composite scores) in returning participants at estimated
IQ levels at T1 corresponding to those for returning and non-returning participants as a function
of age decade.
Consequences of selective attrition - 15
Figure 3 – Observed change (T2-T1 difference in composite scores) for returning participants
and imputed change for non-returning participants as a function of age decade. Error bars are
standard errors.