Embed Size (px)
DESCRIPTION
Selectivity, Sensitivity, Signal to Noise, Detection Limit. Selectivity. This is an non-dimensional term, which can be expressed in %, that can quantify the selectivity of system for a specific target analyte. Let’s look at Example 1-2 in Skoog Holler Nieman (page 15). High. Low. Response. - PowerPoint PPT Presentation
Citation preview
Selectivity, Sensitivity,
Signal to Noise, Detection Limit
Selectivity
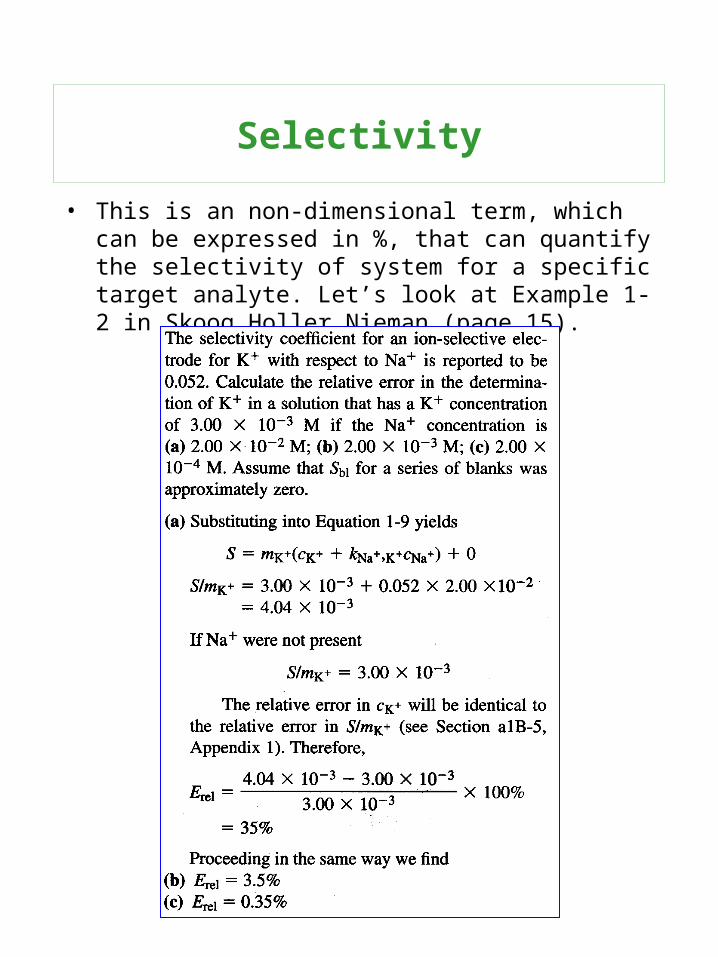
• This is an non-dimensional term, which can be expressed in %, that can quantify the selectivity of system for a specific target analyte. Let’s look at Example 1-2 in Skoog Holler Nieman (page 15).
Sensitivity...
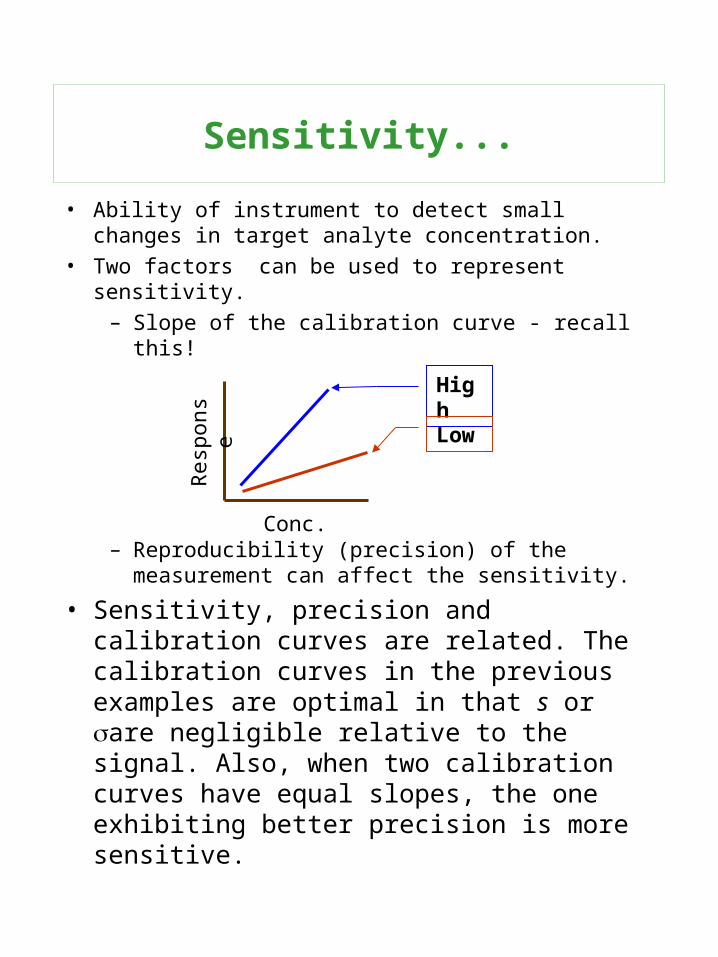
• Ability of instrument to detect small changes in target analyte concentration.
• Two factors can be used to represent sensitivity.
– Slope of the calibration curve - recall this!
– Reproducibility (precision) of the measurement can affect the sensitivity.
• Sensitivity, precision and calibration curves are related. The calibration curves in the previous examples are optimal in that s or are negligible relative to the signal. Also, when two calibration curves have equal slopes, the one exhibiting better precision is more sensitive.
High
Low
Res
pons
e
Conc.
...Sensitivity
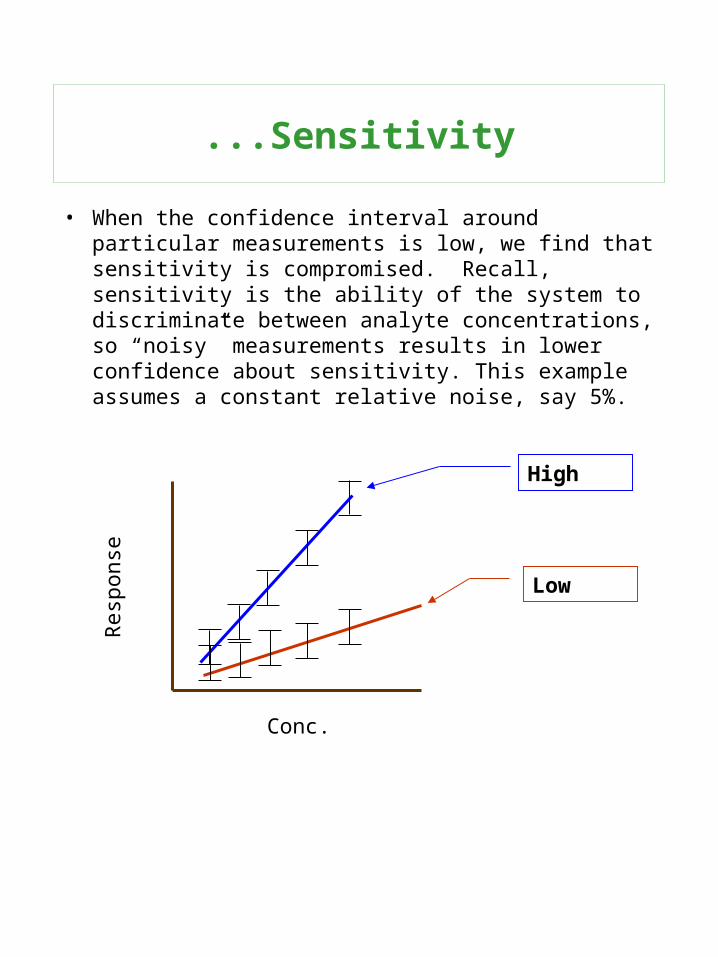
• When the confidence interval around particular measurements is low, we find that sensitivity is compromised. Recall, sensitivity is the ability of the system to discriminate between analyte concentrations, so “noisy” measurements results in lower confidence about sensitivity. This example assumes a constant relative noise, say 5%.
High
Low
Res
pons
e
Conc.
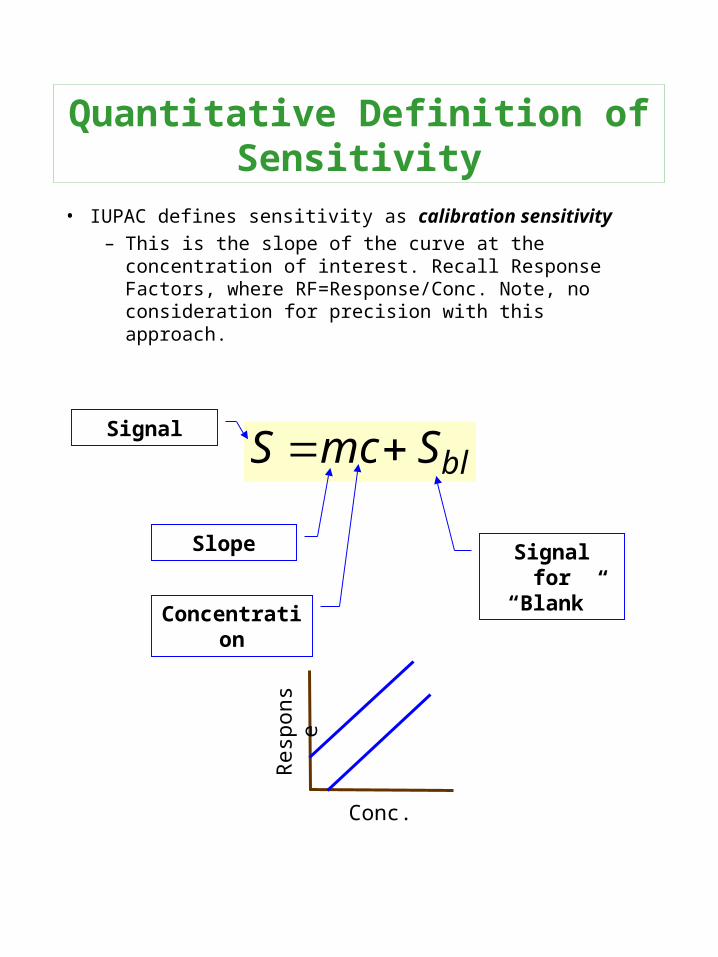
• IUPAC defines sensitivity as calibration sensitivity
– This is the slope of the curve at the concentration of interest. Recall Response Factors, where RF=Response/Conc. Note, no consideration for precision with this approach.
Quantitative Definition of Sensitivity
blSmcS
Signal for “Blank”
Slope
Concentration
Signal
Res
pons
e
Conc.
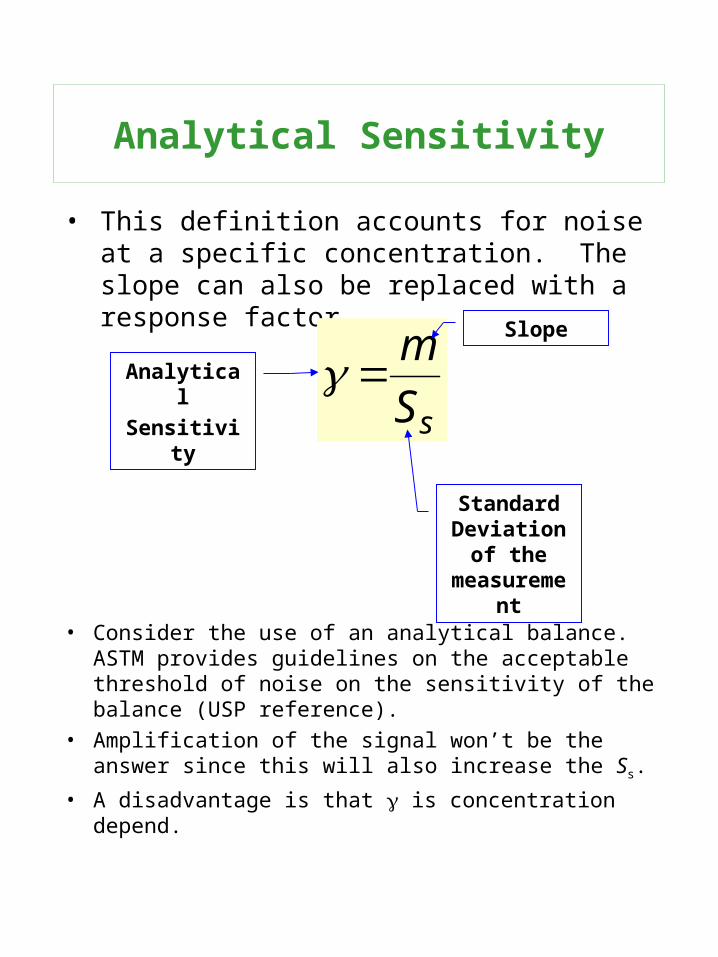
• This definition accounts for noise at a specific concentration. The slope can also be replaced with a response factor.
Analytical Sensitivity
sS
m
Standard Deviation of
the measurement
Slope
Analytical
Sensitivity
• Consider the use of an analytical balance. ASTM provides guidelines on the acceptable threshold of noise on the sensitivity of the balance (USP reference).
• Amplification of the signal won’t be the answer since this will also increase the Ss.
• A disadvantage is that is concentration depend.
• This definition accounts for noise at a specific concentration. The slope can also be replaced with a response factor.
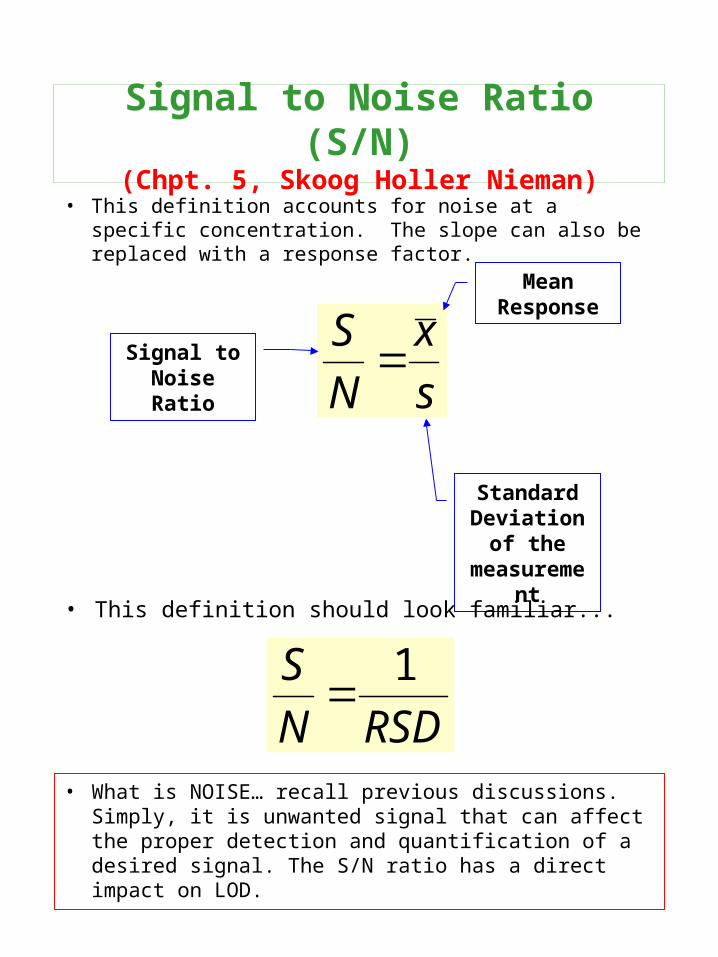
Signal to Noise Ratio (S/N)(Chpt. 5, Skoog Holler Nieman)
s
x
N
S
Standard Deviation of
the measurement
Mean Response
Signal to Noise Ratio
• This definition should look familiar...
RSDN
S 1
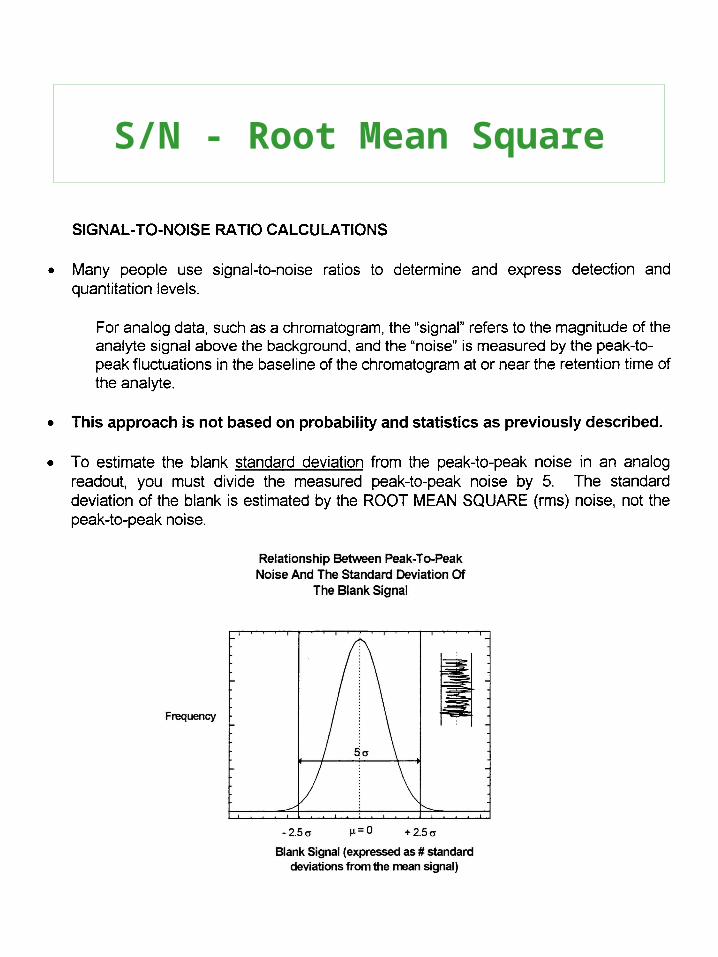
• What is NOISE… recall previous discussions. Simply, it is unwanted signal that can affect the proper detection and quantification of a desired signal. The S/N ratio has a direct impact on LOD.
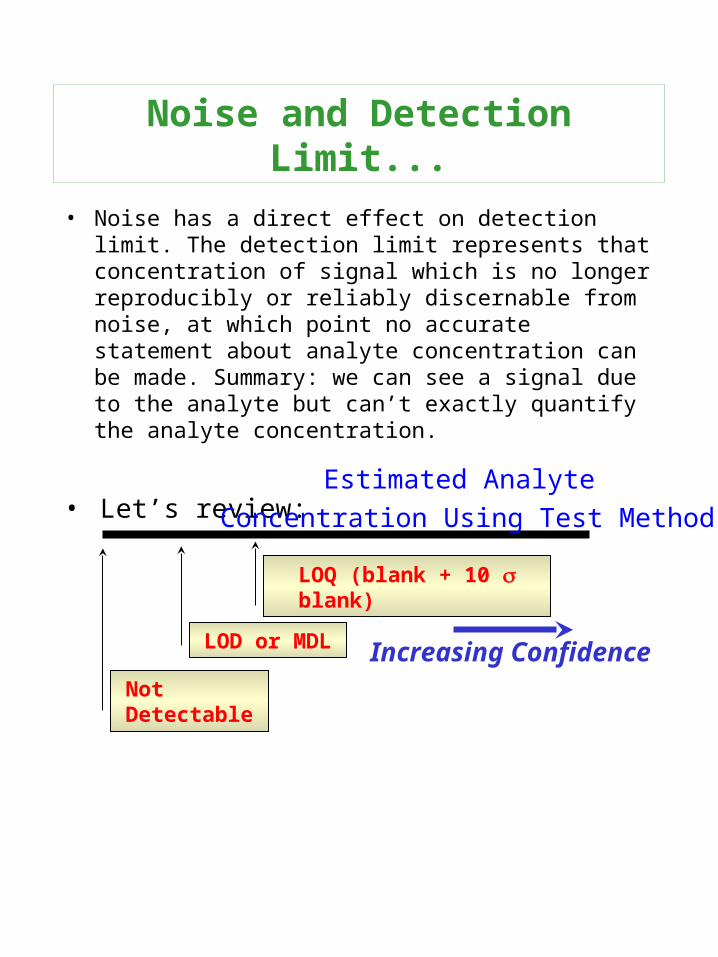
• Noise has a direct effect on detection limit. The detection limit represents that concentration of signal which is no longer reproducibly or reliably discernable from noise, at which point no accurate statement about analyte concentration can be made. Summary: we can see a signal due to the analyte but can’t exactly quantify the analyte concentration.
Noise and Detection Limit...
• Let’s review:
Not Detectable
LOD or MDL
LOQ (blank + 10 blank)
Estimated Analyte
Concentration Using Test Method
Increasing Confidence
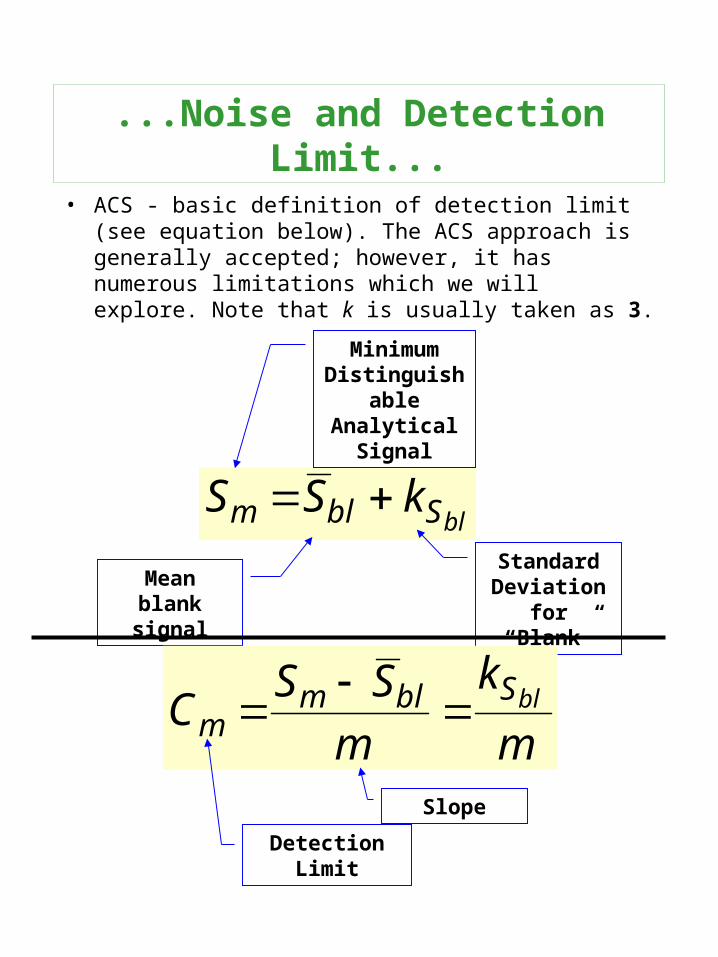
• ACS - basic definition of detection limit (see equation below). The ACS approach is generally accepted; however, it has numerous limitations which we will explore. Note that k is usually taken as 3.
...Noise and Detection Limit...
blSblm kSS Standard
Deviation for “Blank”
Mean blank signal
Minimum Distinguishable
Analytical Signal
m
k
m
SSC blSblmm
Slope
Detection Limit
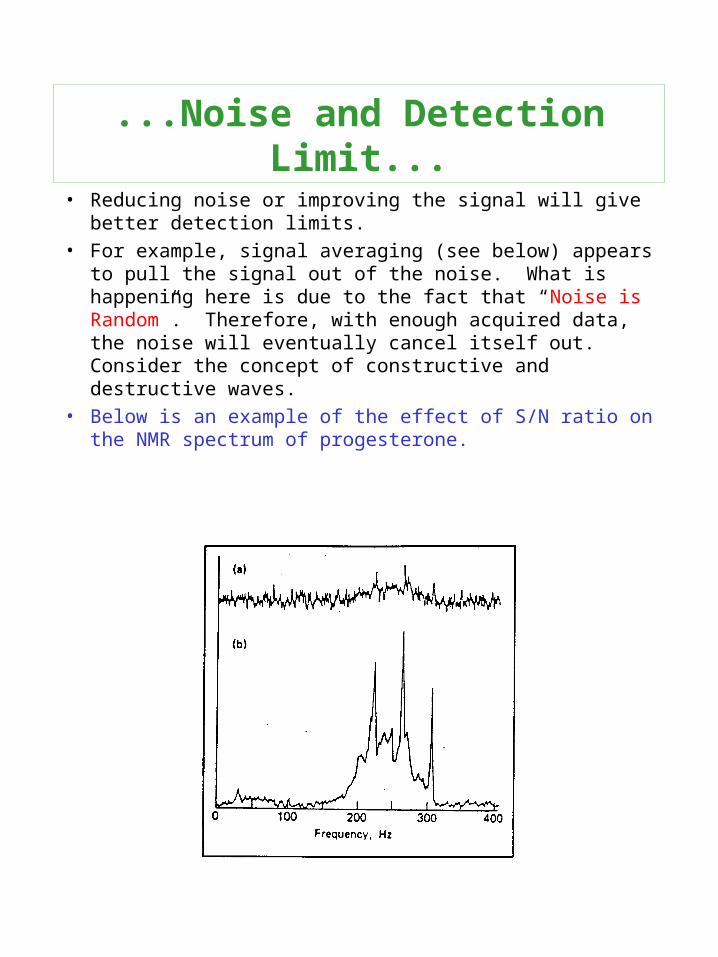
• Reducing noise or improving the signal will give better detection limits.
• For example, signal averaging (see below) appears to pull the signal out of the noise. What is happening here is due to the fact that “Noise is Random”. Therefore, with enough acquired data, the noise will eventually cancel itself out. Consider the concept of constructive and destructive waves.
• Below is an example of the effect of S/N ratio on the NMR spectrum of progesterone.
...Noise and Detection Limit...
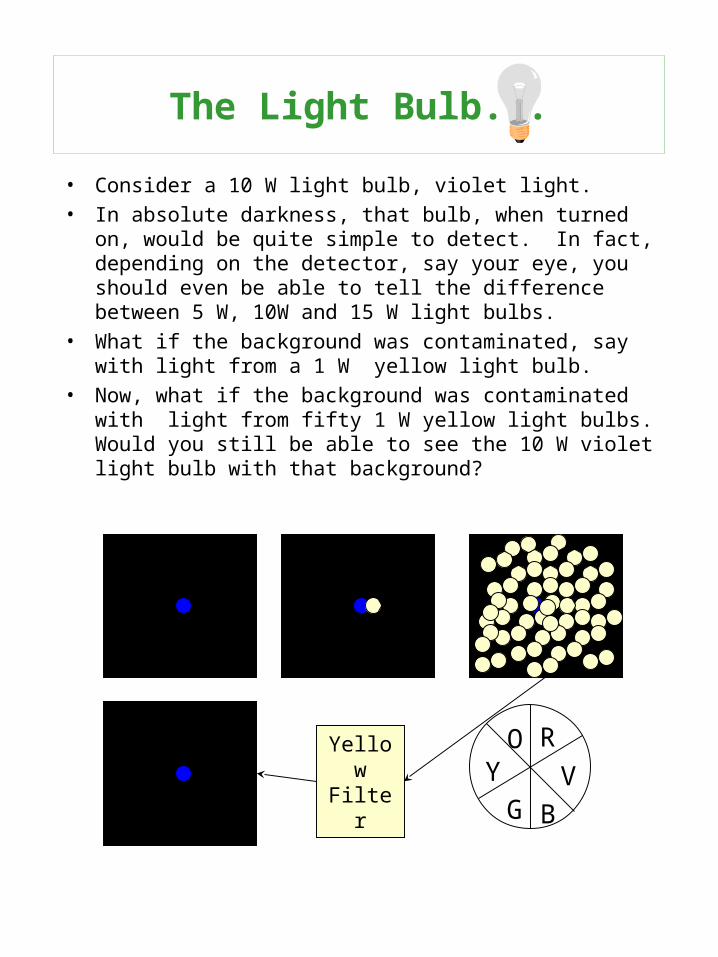
• Consider a 10 W light bulb, violet light.
• In absolute darkness, that bulb, when turned on, would be quite simple to detect. In fact, depending on the detector, say your eye, you should even be able to tell the difference between 5 W, 10W and 15 W light bulbs.
• What if the background was contaminated, say with light from a 1 W yellow light bulb.
• Now, what if the background was contaminated with light from fifty 1 W yellow light bulbs. Would you still be able to see the 10 W violet light bulb with that background?
The Light Bulb...
Yellow Filter
O R
V
BG
Y
• It must be appreciated that detection limits are not “fixed” values, and will change with time, analyst, equipment, etc.
• Detection limits require that we can distinguish between a background or blank signal and a signal from a target analyte.
• A quantitative determination is typically taken as a system with less than 10% RSD, less for more serious applications such as pharmaceutical.
• The ACS has defined three important levels for measurement of data
– LOD (blank signal+3blank)
– RDL (blank signal+6blank)
– LOQ (blank signal+10blank)
More on S/N & Detection Limits...

• It must be appreciated that detection limits are not “fixed” values, and will change with time, analyst, equipment, etc.
• Normally distributed data will allow you to better estimate the contribution of noise to your desired signal.
... More on S/N & Detection Limits
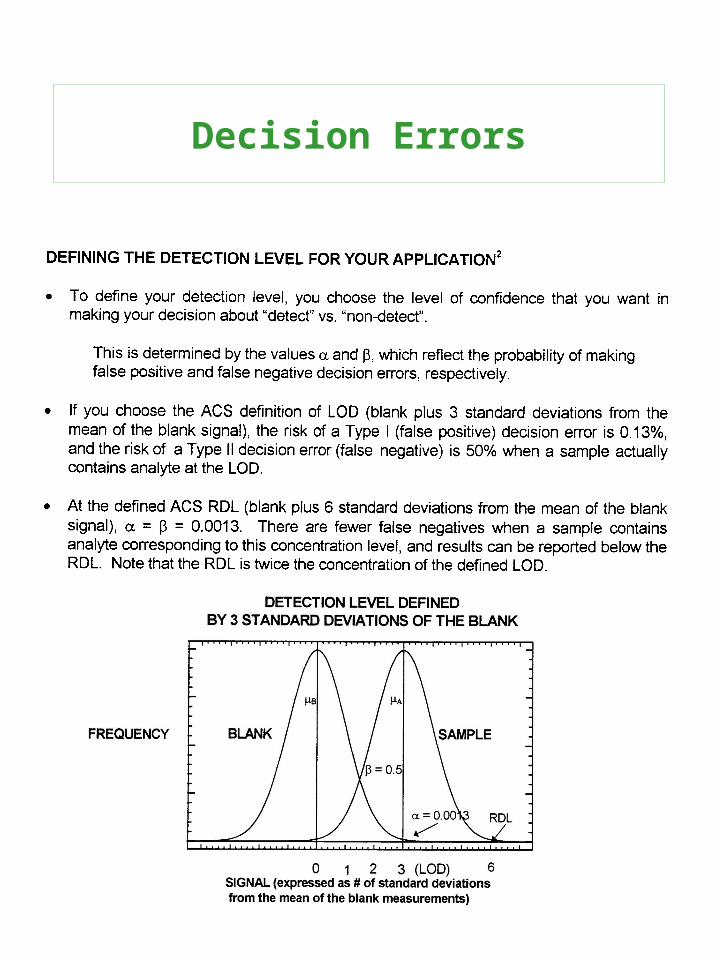
• The null hypothesis: No difference between the blank and sample (non-detect) (µA=µB).
• The alternative hypothesis: The sample response is greater than the blank (detection) (µA>µB).
• Type I Decision Error:– Rejecting the null hypothesis when it is true (false
positive) ()
• Type II Decision Error:– Accepting the hypothesis when it is false (false
negative) ()
• So, two errors are possible: False Positives and False Negatives depending on the hypothesis.
Type I and Type II Decision Errors
Decision Errors
Detection Limits - ACS vs. U.S.EPA
Detection Limits - U.S.EPA
S/N - Root Mean Square