Embed Size (px)
Citation preview
SELF-DETERMINATION THEORY OF MOTIVATION AND PERFORMANCE
MANAGEMENT SYSTEMS
By
LAN GUO
A dissertation submitted in partial fulfillment of the requirements for the degree of
DOCTOR OF PHILOSOPHY
WASHINGTON STATE UNIVERSITY COLLEGE OF BUSINESS
DECEMBER 2007
© Copyright by LAN GUO, 2007 All Rights Reserved

ii
© Copyright by LAN GUO, 2007 All Rights Reserved
ii
To the Faculty of Washington State University:
The members of the Committee appointed to examine the dissertation of LAN GUO find it satisfactory and recommend that it be accepted.
___________________________________ Chair ___________________________________ ___________________________________
iii
ACKNOWLEDGMENT
I wish to thank the Chair of my dissertation committee, Dr. Bernard Wong-On-
Wing, not only for his tremendous amount of help on this project, but also for his great
teaching and unconditional support throughout my four years of study. I also wish to
thank Gladie Lui for sharing data with me and helping me conduct the experiment. It is
hard to imagine how I could complete the dissertation without her generous help. I would
also love to thank the other members of my committee, Dr. John Sweeney and Dr. Jeffrey
Joireman for their very insightful comments and suggestions. I am very lucky to have
them both on my committee.
Special thanks are given to my dearest parents, Jiacheng Guo and Yi Wang, who
gave me a healthy body, a strong heart and a sense of humor, without which I could never
have gone so far. Deep appreciation is also given to Laura Wong-On-Wing and their
lovely children for their precious companionship. Lastly, I would like to thank all my
friends in Pullman, for the wonderful time we had together in the memorable four years
of my life.
iv
SELF-DETERMINATION THEORY OF MOTIVATION AND PERFORMANCE
MANAGEMENT SYSTEMS
Abstract
by Lan Guo, Ph.D.
Washington State University December 2007
Chair: Bernard Wong-On-Wing
According to self-determination theory (SDT, Ryan and Deci 2000) of
motivation, in order to create and maintain an innovative, proactive and happy workforce,
businesses ought to adopt organizational designs that cultivate employees’ autonomous
(vs. controlled) work motivation. This is because numerous SDT-based studies have
found that autonomous (controlled) motivation is associated with higher (lower) levels of
creativity, cognitive flexibility, persistence and psychological well-being.
The current research applies SDT to management control systems. Specifically, it
proposes and partially tests a motivational model where one aspect of organizational
design (i.e., performance management systems, PMS) is hypothesized to influence
autonomous and controlled work motivation, and in turn influences their job related
cognition, behaviors and affective experience. In particular, this model predicts that
characteristics of PMS (e.g., whether reward systems are aligned with performance
measurement systems, and the degree to which employees participate in the process of
target setting and performance appraisal) will impact employees’ autonomous and
controlled work motivation. It further predicts that autonomous and controlled work
motivation will affect various outcome variables such as employees’ willingness to
v
acquire new knowledge and skills, their attributional tendency for their performance, and
their proactivity at work.
The hypotheses derived from the proposed motivational model were tested using
two studies. Study 1 consists of structural equation modeling (SEM) analyses of survey
data available from a separate research project. The survey data were obtained from 135
lower-level managers and non-management employees in different organizations. Study 2
was a case-based experiment, where 74 experiment participants assumed the role of a
lower-level manager. The results from the two studies in general support the above-
mentioned hypotheses. Implications for both PMS and SDT literatures are discussed.
vi
TABLE OF CONTENTS Page ACKNOWLEDGEMENTS................................................................................................ iii ABSTRACT.........................................................................................................................iv LISTOF FIGURES ..............................................................................................................xi LIST OF TABLES............................................................................................................ xiii CHAPTER
CHAPTER ONE INTRODUCTION............................................................................... 1
1.1 Motivation and Theoretical Framework ................................................................ 1
1.2 Research Method ................................................................................................... 2
1.3 Major Findings....................................................................................................... 3
1.4 Significance............................................................................................................ 4
1.5 Overview................................................................................................................ 6
CHAPTER TWO LITERATURE REVIEW................................................................... 7
2.1 Performance Management Systems (PMS) ........................................................... 7
2.1.1. Definition ....................................................................................................... 7
2.1.2 A Strategic Focus of Studying Performance Management Systems (PMS)... 8
2.2 Work Motivation Theories................................................................................... 10
2.3 Self-Determination Theory (SDT) of Motivation................................................ 13
2.3.1 Cognitive Evaluation Theory (CET)............................................................. 14
2.3.2 Organismic Integration Theory (OIT) .......................................................... 16
2.3.2.1 Self-Determination Continuum and Different Forms of Extrinsic
Motivation............................................................................................................. 16
vii
2.3.2.2 Different Forms of Motivation and Work Related Outcomes ............... 19
2.3.2.3 Social Context that Promotes Autonomous Motivation ........................ 20
2.3.3 Basic needs Theory ....................................................................................... 24
2.3.4 Causality Orientation Theory........................................................................ 25
2.3.5 Summary ....................................................................................................... 26
2.4 SDT and Agency Theory: Their Differences....................................................... 27
2.4.1 Basic Assumptions about Human Nature ..................................................... 27
2.4.2 How to Improve Goal Congruencies?........................................................... 29
2.5 SDT, Expectancy Theory and Goal-Setting Theory: Their Differences.............. 33
2.6 Research on Motivational Effects of Performance Management Systems (PMS)
....................................................................................................................................... 35
2.7 Summary .............................................................................................................. 39
CHAPTER THREE MOTIVATIONAL MODEL AND HYPOTHESES
DEVELOPMENT............................................................................................................. 41
3. 1 A Motivational Model of Performance Management Systems (PMS)............... 41
3.1.1 Antecedents to Employees’ Autonomous and Controlled Motivation:
Characteristics of PMS ............................................................................................. 41
3.1.1.1 Alignment between Reward Systems and Performance Measurement
Systems: Performance-Reward Contingency ....................................................... 42
3.1.1.2 Participative Decision Making in PMS: Providing Choices and
Acknowledging Perspectives ................................................................................ 47
3.1.1.3 Communicating Business Objectives through PMS: Providing
Meaningful Rationales .......................................................................................... 49
viii
3.1.2 Consequences of Employees’ Autonomous and Controlled Motivation...... 50
3.1.2.1 Role Orientation..................................................................................... 51
3.1.2.2 Self-Serving Attribution......................................................................... 52
3.1.2.3 Proactive Work Behaviors ..................................................................... 53
3.1.2.4 Job Satisfaction ...................................................................................... 56
3.1.2.5 Organizational Commitment.................................................................. 57
3.2 The Hypotheses.................................................................................................... 58
CHAPTER FOUR METHODOLOGY.......................................................................... 62
4.1 Study 1: Structural Equation Modeling (SEM) Analysis of Survey Data ........... 62
4.1.1 Overview....................................................................................................... 62
4.1.2 Survey Respondents...................................................................................... 63
4.1.3 Measurement of Variables ............................................................................ 64
4.1.3.1 Characteristics of PMS (CPMS) Scale .................................................. 64
4.1.3.2 Confirmatory Factory Analysis of the CPMS Scale .............................. 66
4.1.3.3 Measurement of Other Variables ........................................................... 67
4.1.4 Theoretical Structural Model ........................................................................ 77
4.2 Study 2: Experiment ............................................................................................ 78
4.2.1 Overview and Procedure............................................................................... 78
4.2.2 Experiment Participants ................................................................................ 79
4.2.3 Case Material ................................................................................................ 79
4.2.4 Manipulation of the Independent Variables.................................................. 81
4.2.5 Measurement of the Dependent Measures.................................................... 83
4.2.6 Measurement of the Mediating Variables..................................................... 85
ix
4.2.7 Manipulation Check Questions..................................................................... 87
4.2.8 Summary of Study 2 ..................................................................................... 88
4.3 Summary .............................................................................................................. 88
CHAPTER FIVE RESULTS ......................................................................................... 90
5.1 Study 1 ................................................................................................................. 90
5.1.1 Descriptive Statistics..................................................................................... 90
5.1.2 Evaluation of Structural Models ................................................................... 93
5.1.3 Tests of H1, H2, H3, and H4 ........................................................................ 97
5.1.4. Tests of H5: Autonomous (vs. Controlled) Motivation and Self-Serving
Attribution................................................................................................................. 99
5.1.5 Supplemental Analyses: Moderating Effects of Task Uncertainty............. 100
5.1.6 Summary ..................................................................................................... 105
5.2 Study 2 ............................................................................................................... 105
5.2.1 Responses to Manipulation Check Question .............................................. 106
5.2.2 Descriptive Statistics................................................................................... 106
5.2.3 Tests of H1, H2 and H6 .............................................................................. 109
5.2.4 Supplemental Analyses............................................................................... 113
5.2.4.1 Effect of SPMS-Reward Linkage on Autonomous Motivation........... 113
5.2.4.2 Effect of SPMS-Reward Linkage on Middle Managers’ Issue Selling
Behavior.............................................................................................................. 113
5.2.4.3 Effect of SPMS-Reward Linkage on Strategy Implementation........... 114
5.2.5 Summary ..................................................................................................... 116
CHAPTER SIX DISCUSSION AND CONCLUSION............................................... 117
x
6.1. Summary of Results.......................................................................................... 117
6.1.1 Results of Hypotheses Tests ....................................................................... 117
6.1.2 Moderating Effects of Task Uncertainty..................................................... 122
6.1.3 Effects of Linking SPMS with Reward Systems ........................................ 122
6.2 Conclusions........................................................................................................ 123
6.3 Contributions...................................................................................................... 124
6.4 Limitations ......................................................................................................... 126
REFERECES ....................................................................................................................128
APPENDIX
FIGURES....................................................................................................................144 TABLES .....................................................................................................................164 EXPERIMENT INSTRUMENT ................................................................................176
xi
LIST OF FIGURES Figure 1: The Self-Determination Continuum and Various Types of Motivation 144
Figure 2: A Motivational Model of Performance Management Systems (PMS) 145
Figure 3: All Tested Hypotheses 146
Figure 4: Three-Factor CFA Model of Characteristics of Performance Management
Systems (CPMS) Scale 147
Figure 5: Factor Loadings for Characteristics of Performance Management Systems
(CPMS) Scale 148
Figure 6: Theoretical Structural Model (for Study 1) 150
Figure 7: Strategy Map of Shorthorn Corp 151
Figure 8: Predictions Tested by Study 2 152
Figure 9: Configuration of the Theoretical Model (Model A). 153
Figure 10: Configurations of the Constrained Model (Model B) 154
Figure 11: Configurations of the “Optimal” Model (Model C) for the Whole Sample 155
Figure 12: Path Coefficient Estimates for Model C (for the Whole Sample, ns=135) 156
Figure 13: Path Coefficient Estimates for Model C (for the High Task Uncertainty
Sample, ns=66) 157
Figure 14: Path Coefficient Estimates for Model C (for the Low Task Uncertainty Sample,
ns=68) 158
Figure 15: Configurations of the “Optimal” Model for the Low Task Uncertainty Sample
(Model D) 159
Figure 16: Path Coefficient Estimates for Model D (for the Low Task Uncertainty Sample,
ns=68) 160
Figure 17: Configurations of Path Model (Saturated) for Testing H6 161
xii
Figure 18: Path Model (Constrained) for Testing H6 162
Figure 19: Path Coefficient Estimates for the Constrained Model (for Testing H6, ns=70)
163
xiii
LIST OF TABLES
Table 1: Characteristics of Performance Management Systems (CPMS) Scale................164
Table 2: Work Climate Questionnaire (WCQ) that Measures Superior's Autonomy
Support...............................................................................................................................165
Table 3: Role Orientation (Knowledge) Scale...................................................................166
Table 4: Strategic Orientation Scale ..................................................................................167
Table 5: Description of Shorthorn's Balanced Scorecard (BSC) Measures.......................168
Table 6: Manipulation of SPMS-Reward Linkage ............................................................169
Table 7: Descriptive Statistics for Study 1 ........................................................................170
Table 8: Correlation (p value) Among Four Types of Motivation for Study 1 .................171
Table 9: Demographics and the Nature of Motivation for Study 1 ...................................172
Table 10: Effects of Performance and Relative Autonomy Index (RAI) on Internal
Attribution..........................................................................................................................173
Table 11: Descriptive Statistics from Study 2 ...................................................................174
Table 12: Correlation (p value) Among Four Types of Motivation for Study 2 ...............175
1
CHAPTER ONE
INTRODUCTION
1.1 Motivation and Theoretical Framework
Agency theory (Jensen and Meckling 1976) assumes that the employee (the
agent) is self-interested and effort-averse. Accordingly, agency theorists mainly rely
on incentives (or reward contingencies) to induce the employee to take actions that
are congruent with firm objectives. According to Self-Determination Theory (SDT,
Ryan and Deci 2000) of motivation, the sheer reliance on reward contingencies and
ignorance of other motivating mechanisms may lead to various negative outcomes
such as employees’ reluctance to innovate and learn new knowledge and skills, their
passiveness at work, and poor psychological well-being.
In contrast to agency theory, SDT presumes that human beings inherently
have the natural tendency to explore and fulfil their potentials and strive for
meaningful goals. Such innate tendency manifests itself as “autonomous motivation”,
as opposed to “controlled motivation”. The latter results from external forces such as
imposed reward contingencies and other people’s demand. Hundreds of SDT based
studies suggest that autonomous (controlled) motivation is associated with higher
(lower) levels of creativity, cognitive flexibility, persistence and psychological well-
being. This literature further demonstrates that social-contextual factors can either
unleash or restrain individuals’ autonomous motivation.
According to SDT, in order to create and maintain an innovative, proactive
and happy workforce, businesses ought to adopt organizational designs that cultivate
employees’ autonomous (vs. controlled) work motivation. The current research
2
applies SDT to management control systems. Specifically, it proposes and partially
tests a motivational model where one aspect of organizational design (i.e.,
performance management systems, PMS) is hypothesized to influence employees’
autonomous and controlled work motivation, and in turn influences their job related
cognition, behaviors and affective experience.
In particular, this model predicts that characteristics of PMS (e.g., whether
reward systems are aligned with performance measurement systems, and the degree
to which employees participate in the process of target setting and performance
appraisal) will impact employees’ autonomous and controlled work motivation. It
further predicts that autonomous and controlled work motivation will affect various
outcome variables including employees’ willingness to acquire new knowledge and
skills, their attributional tendency for their performance, their proactivity at work, and
their level of job satisfaction and organizational commitment.
1.2 Research Method
The hypotheses derived from the proposed motivational model were tested
using two studies. Study 1 consists of structural equation modeling (SEM) analyses of
survey data available from a separate research project. The survey data were obtained
from 135 lower-level managers and non-management employees in different
organizations. Study 2 was a case-based experiment, where 74 experiment
participants assumed the role of a lower-level manager. This paper thus improves our
understanding of the performance management practices among lower-level
3
employees, which is largely ignored by prior compensation literature (Ittner and
Larcker 2001).
1.3 Major Findings
The results from the two studies in general suggest the following
relationships:
(1) Employees are to a greater degree motivated by autonomous (vs. controlled)
motivation to work when:
a. the reward systems are well linked with performance measurement
systems than when they are not;
b. they participate in the processes of selecting performance measures,
setting performance targets and evaluating their own performance than
when they do not participate in such processes; and
c. PMS clearly communicate to them the business objectives than when they
do not.
(2) When they are to a greater degree motivated by autonomous (vs. controlled)
motivation to work, employees:
a. to a greater degree recognize the importance of acquiring new knowledge
and skills;
b. are less vulnerable to the self-serving attributional bias, i.e., are less likely
to make stronger attribution to personal factors for success than for failure;
and
c. are more proactive in influencing the organization’s strategy formation.
4
Additional analyses also suggest that task uncertainty moderates some of the
above-mentioned relations. However, due to the small sample sizes, caution must be
exercised in interpreting such moderating effects.
1.4 Significance
The paper has implications for both PMS research and SDT research. First,
Indjeikian (1999) notes that “it appears that the real agency conflict has less to do
with getting employees to work harder…, but more to do with getting them to choose
the right combination of actions and decisions that increases shareholder value” (p.
152). In other words, motivation researchers must not only study the level of
employees’ effort, but also investigate the direction of such effort (Bonner and
Sprinkle 2002). This paper focuses on the latter component of effort. Specifically,
among other outcome variables, it examines how PMS impact employees’
willingness to acquire new knowledge and skills as well as their likelihood to
proactively influence strategy development. Those variables have apparent strategic
significance and are crucial for firms’ long-term success (Sprinkle 2003).
Second, this paper explores the “black box” of employees’ motivational
processes. The current performance management practices such as budgeting process
have been broadly criticized for their control mindset, short-term perspectives and
other attributes (Hansen, Otley and Van der Stede 2003). Solutions such as strategic
performance management systems are proposed to address those issues. This paper
contends that both criticisms against the old practices and recommendations for the
new ones must be based on a better understanding of employees’ motivational
5
process. Based on SDT, this paper provides some insight in why negative effects of
PMS may exist and how new practices may help to change the status quo.
Third, this paper tests SDT in work settings and finds support for the
fundamental notion of SDT that not only the quantity or amount, but also the quality
or nature, of individuals’ motivation matters (Gagné and Deci 2005). For example,
the findings of Study 2 suggest that the relative strength of autonomous vs. controlled
motivation has a significant impact on employees’ proactive behavior beyond the
effect of the amount of their motivation. In addition, this paper also provides some
preliminary support for the proposition that autonomous motivation is important
“particularly if the task requires creativity, cognitive flexibility, or deep processing of
information” (Gagné and Deci 2005, p. 341). Specifically, preliminary analyses in
study 1 suggest that only when the job related tasks were viewed as uncertain and
novel, but not when they were viewed as structured and mundane, could autonomous
(vs. controlled) work motivation predict some of the outcome variables.
Fourth and more importantly, this paper extends SDT-based research on the
socio-contextual factors that enhance employees’ autonomous motivation. Extant
research in this area mainly focuses on two types of autonomy supporting factors, i.e.,
specific aspects in the job context (e.g., meaningful positive feedback) and
interpersonal style of superiors (Gagné and Deci 2005). Following Sheldon, Turban,
Brown, Barrick and Judge’s (2003, p. 381) suggestion, this paper goes "further back"
and investigates a “higher-order contextual factor,” i.e., the organization’s PMS. Such
investigation is important because higher-order contextual factors such as the design
of PMS could be longer lasting and possibly more pervasive in influencing
6
employees’ motivation than are specific job characteristics and superiors’
interpersonal style.
Last but not least, whether performance-contingent rewards forestall or foster
autonomous motivation at work is a question that has drawn a significant amount of
controversy. This paper sheds some light on this debate. Specifically, the results from
both Study 1 and Study 2 in general suggest that when rewards are well linked with
measured performance, compared with when they are not, employees are to a greater
degree motivated by autonomous work motivation.
1.5 Overview
The remainder of this research is organized as follows: Chapter Two reviews
four distinctive theories of work motivation, especially SDT, and the PMS literature.
Based on SDT, Chapter Three presents a motivational model of PMS and develops
specific research hypotheses. Chapter Four outlines the design of Study 1 and Study
2. Chapter Five reports the empirical results from both studies and Chapter Six the
conclusion.
7
CHAPTER TWO
LITERATURE REVIEW
This literature review begins by defining performance management systems
(PMS) and discussing the strategic focus for studying PMS. This section defines the
scope and focus of this paper. It then reviews four distinctive work motivation
theories, namely, expectancy theory, agency theory, goal setting theory, and self-
determination theory (SDT). SDT is discussed in more detail because it serves as the
major basis for predicting the impact of PMS on employees’ work related cognition,
behaviors and affect. The review further contrasts SDT with the other three theories,
both at the theoretical and practical levels. It ends with a review of extant research on
the motivational effect of PMS, followed by a discussion of limitations of this
literature.
2.1 Performance Management Systems (PMS)
2.1.1. Definition
Taking a broader perspective of management control system, Otley (1999)
argues that management accounting researchers should move beyond the traditional
focus of performance measurement and pay more attention to performance
management and strategy implementation. He proposed a framework for researching
management control systems wherein the focus is on managing an organization’s
performance and implementing its strategies. This research framework consists of
following five interrelated sets of issues:
8
1. “What are the key objectives that are central to the organization’s overall future success, and how does it go about evaluating its achievement for each of these objectives?
2. “What strategies and plans has the organization adopted and what are the
processes and activities that it has decided will be required for it to successfully implement these? How does it assess and measure the performance of these activities?
3. “What level of performance does the organization need to achieve in each
of the areas defined in the above two questions, and how does it go about setting appropriate performance targets for them?
4. “What rewards will managers and other employees gain by achieving these
performance targets or, conversely, what penalties will they suffer by failing to achieve them?
5. “What are the information flows feedback and feed-forward loops that are
necessary to enable the organization to learn from its experience, and to adapt its current behavior in the light of that experience? (pp. 365-366)”
Both management control systems in a traditional sense (e.g., budgeting
systems, performance measurement systems, and management and non-management
incentive systems) and systems that were once viewed as “beyond the scope” of
management control systems (e.g., strategy management systems, and information
systems that serve for human resource management purposes) address at least one of
the above questions. According to Otley (1999), those different systems can be
collectively labeled as PMS.
2.1.2 A Strategic Focus of Studying Performance Management Systems (PMS)
To study PMS, one first needs to define “performance” at the organizational
level. This paper adopts Otley’s (1999) view of organizational performance, which is
the level of success an organization has in attaining its strategic objectives and in
9
implementing an appropriate strategy. He further argues that studying PMS
necessitates a good understanding of its strategic aspects. Such strategic focus in
studying PMS reflects the recent development of managerial accounting practice. As
stated by Ittner and Larcker (2001), by the mid-1990s, managerial accounting had
moved away from a traditional focus on planning and control and evolved to its new
stage, where more emphasis is put on achieving strategic objectives such as
innovation and customer value. At this new stage, managerial accounting focuses on
the identification, measurement, and management of the key drivers to attain strategic
objectives. For example, strategic performance measurement systems, such as the
balanced scorecard (Kaplan and Norton 1992), were designed to present managers
with a broad set of performance measures, financial and non-financial, that together
reflect how well a company meets its strategic targets (Gates, 1999).
Adopting this strategic view of PMS, one can argue that the ultimate purpose
of PMS is to facilitate the achievement of the organization’s strategic objectives.
Accordingly, this paper assumes that desired PMS are the ones that effectively
motivate employees to achieve strategic objectives and to implement appropriate
strategies. Therefore, the focus of this paper is to examine how PMS characteristics
impact employees’ cognition and behaviors that have a direct effect on the attainment
of strategic objectives. For example, this paper examines how PMS characteristics
impact employees’ willingness to acquire new knowledge and skills as well as their
likelihood to proactively influence strategy development.
The strategic focus of this paper is in accordance with the changes in
emphasis observed in managerial accounting research in general. For example,
10
Chenhall and Langfield-Smith (1998) examine how different management accounting
practices (e.g., activity-based costing; balanced performance measures and strategic
planning) enhance organizational performance under particular strategies (i.e.,
product differentiation strategy, low price strategy or a combination of both). More
recently, Van der Stede, Chow and Lin (2006) examine the choice of performance
measures (whether including financial measures, objective nonfinancial measures,
and subjective nonfinancial measures) as a function of strategy being adopted, and
how the “fit” between strategy and performance measures impact firm performance.
Noteworthy, this paper differs from those studies in that it views strategy-
related variables (e.g., proactivity in influencing strategy formation) as endogenous
and thus examines how management control aspects impact those variables. In
contrast, the above-mentioned studies treat strategy as exogenous variable and
investigate how adopted strategies impact the design of management control systems
and the effect those design aspects have on performance.
2.2 Work Motivation Theories
To understand the mechanisms through which PMS impact employees’
motivation, cognition, behaviors and affect, four distinctive motivational theories are
reviewed as follows. The first three theories are briefly reviewed since they have
received significant attention in accounting research as well as in organizational
behavior research. The last theory, self-determination theory (SDT), is rarely seen in
accounting literature and has just started receiving attention from organizational
behavior researchers (for a review, see Gagné and Deci 2005). This paper uses SDT
11
as the main basis for predicting the impact of PMS on employees’ motivation, and in
turn on various outcome variables. SDT, thus, is discussed in more detail in section
2.3.
Expectancy theory (Vroom 1964), assumes that motivation is a function of the
effort-outcome expectancy and the valence (or attractiveness) of the outcome. In other
words, the more the individual expects to achieve certain outcome through his/her
effort, and the more attractive the outcome is to the individual, the more motivated
he/she is to work toward that outcome. According to this theory, three PMS aspects
have a multiplicative effect on employees’ motivation to work for performance: (1)
expectancy, or employees’ belief that their effort will lead to performance (i.e., the
sensitivity of performance measures to effort level); (2) instrumentality, or
employees’ belief that performance will lead to reward (i.e., the alignment between
performance measurement systems and reward systems); and (3) valence, or
anticipated satisfaction from obtaining the reward (i.e., the perceived attractiveness of
the reward). According to expectancy theory, reward can be tangible (e.g., bonus and
promotion) as well as intangible (e.g., fame and praise).
Agency theory (Jensen and Meckling 1976; Eisenhardt 1989) assumes that
individuals have a desire to increase personal wealth and to decrease the level of
effort. It also assumes that in an organization, the employee (the agent) has different
goals than does the employer (the principal), and it is expensive for the latter to verify
what the former is doing. Hence, agency theory mainly relies on incentives to induce
employees to take desired actions that are congruent with firm objectives. At the same
time, agency theory also assumes that the employee is risk averse; thus, it can be
12
expensive to pass risk to the employees. Therefore, when designing the incentive
system, a balance needs to be struck between maximizing the employees’ incentives
and minimizing the risk that they bear (Holmstrom 1989; Indjejikian 1999; Evans,
Kim and Nagarajan 2006).
Consistent with expectancy theory, agency theory advocates reward systems
that are sensitive to employees’ effort level. For example, agency theory proposes that
the more (less) the outcome is determined by employees’ effort, the more rewards
should be based on the outcome (behavior) (Eisenhardt 1989). As for the
attractiveness of rewards, because agency theory presumes that employees have the
desire to maximize their personal wealth, rewards should be always attractive to them.
In other words, rewards should always have a positive utility.
Influenced by Ryan’s (1970) belief that conscious goals affect human
behavior, goal-setting theory (Locke and Latham 1990) views personal goals as the
central stimuli of individuals’ behavior. According to this theory, certain attributes of
goals, such as their level of difficulty and specificity, are expected to impact
individuals’ performance. In particular, specific, and difficult but achievable goals
lead to optimal level of performance. Presumably, goals affect performance by
directing attention and effort toward goal-relevant activities, by enhancing the level of
effort as well as persistence, and by leading to greater use of task-relevant knowledge
and strategies (Locke and Latham 2002).
Goal-setting theory further identifies factors that moderate the above-
mentioned goal-performance relation (Locke and Latham 1990). One of the most
documented moderators is goal commitment. Specifically, when individuals are
13
committed to their goals, the effect of goals on performance is strongest (Locke and
Latham 2002) and when goal commitment is low, a goal cannot have motivational
effect (Locke and Latham 1990). Noteworthy, this theory does not differentiate
different contents of goals, or different motives behind the goal pursuits (Gagné and
Deci 2005).
Similar with goal setting theory, self-determination theory (SDT, Deci and
Ryan 2000; Ryan and Deci 2000) regards goal pursuits as one of the key elements for
understanding human motivation. However, different from goal setting theory, SDT
focuses on different motives behind the goal pursuits. Specifically, SDT research
suggests that holding goal characteristics constant, when individuals strive for certain
goals out of pressure or any other external force, rather than out of personal values or
simple enjoyment, negative outcomes such as low level of persistence and poor
psychological well-being may occur. Therefore, according to SDT, the nature or form
of motivation, not just the amount or magnitude of motivation, matters. SDT is
discussed in detail in the section that follows.
2.3 Self-Determination Theory (SDT) of Motivation
According to Ryan and Deci (2002), SDT consists of four interrelated “mini-
theories,” each of which focus on specific phenomenon. The following review
summarizes the basic propositions and findings of the four “mini-theories”: cognitive
evaluation theory (CET), organismic integration theory (OIT), basic needs theory,
and causality orientation theory. Those theories, especially the OIT, provide the basis
for the motivational model that is proposed in Chapter 3.
14
2.3.1 Cognitive Evaluation Theory (CET)
CET (Deci 1975; Deci and Ryan 1980) was formulated based on SDT’s early
work. In the early 1970’s, a series of experimental studies (e.g., Deci 1971, 1972a,
1972b; Kruglanski, Friedman and Zeevi 1971; Lepper, Greene and Nisbett 1973)
demonstrated that extrinsic rewards such as money and symbolic rewards leads to the
decrease in individual’s intrinsic motivation to engage in originally interesting
activities. Based on White’s (1959) conceptualization, individuals are intrinsically
motivated if they perform a certain activity for its own sake, and the pleasure and
satisfaction derived from engaging in the activity. On the other hand, they are
extrinsically motivated if they act in order to achieve some objective that is separable
from this activity. CET (Deci and Ryan 1980) was subsequently developed to explain
such “undermining” effect of extrinsic rewards on intrinsic motivation.
The theory asserts that the effect of rewards on intrinsic motivation depends
on how the recipients cognitively interpret the rewards. Specifically, every reward has
both a controlling aspect (i.e., the reward contingency separating desired from
undesired action) and an informational aspect (i.e., the feedback conveying
information about the actor’s competence). Its controlling aspect is believed to thwart
individuals’ need for autonomy, thus undermining intrinsic motivation, whereas its
informational aspect (assuming the reward is obtained) is believed to increase their
perceived competence, thus enhancing intrinsic motivation. Therefore, the relative
salience of these two aspects will determine whether a reward undermines or
enhances intrinsic motivation.
15
Based on those premises, CET further proposes that rewards that are given for
engaging in certain tasks (i.e., engagement-contingent rewards) and rewards that are
given for completing certain tasks (i.e., completion-contingent rewards) will
undermine intrinsic motivation. In contrast, rewards that are given for achieving
certain pre-defined standards (i.e., performance-contingent rewards) and verbal
rewards (i.e., positive feedback) can either undermine or increase intrinsic motivation
depending on whether the controlling or informational aspect of the reward is more
salient (Deci, Koestner and Ryan 1999).
A recent meta-analysis of 128 lab-experiment studies (Deci et al. 1999) was
conducted to examine the effect of various types of rewards on intrinsic motivation.
Those studies measured intrinsic motivation using free-choice persistence (i.e., the
time the actor spent on the task after he/she was told that the experiment was over)
and/or using self-reported interest or enjoyment. Consistent with CET’s prediction,
the meta-analysis results suggested that engagement-contingent rewards and
completion-contingent rewards negatively impacted intrinsic motivation as measured
by free-choice persistence (d=-0.40 and -0.36, respectively) and self-reported interest
(d=-0.15 and -0.17, respectively). Performance-contingent rewards also had a
negative impact on intrinsic motivation when the latter was measured by free-choice
persistence (d=-0.28), but not when it was measured by self-reported interest (d=-
0.01). This meta-analysis in general supported CET’s argument that tangible rewards,
if not implemented properly, can undermine individuals’ intrinsic motivation. In
contrast, verbal rewards enhanced intrinsic motivation as measured by both free-
choice persistence (d=0.33) and self-reported interest (d=0.31).
16
CET faced challenges when it was applied to organizational behavior
research. First, in work settings, extrinsic rewards are normally expected (Kunz and
Pfaff 2002). More importantly, many activities at work are not intrinsically
interesting. Therefore enhancing intrinsic motivation is not always practicable (Kunz
and Pfaff 2002; Gagné and Deci 2005). The next development of SDT, i.e., the
proposition of OIT (Deci and Ryan 1985a, 2000; Ryan and Deci 2000; Ryan and Deci
2002), reflects SDT researchers’ effort to address those challenges.
2.3.2 Organismic Integration Theory (OIT)
From the perspective of OIT, not all types of extrinsic motivation are harmful.
Rather, autonomous types of extrinsic motivation are associated with various positive
outcomes including effective performance, persistence and psychological well-being.
In contrast, controlled types of extrinsic motivation are found to be associated with a
variety of negative outcomes. Upon the formulation of OIT, the distinction between
autonomous and controlled motivation, rather than the distinction between intrinsic
and extrinsic motivation, became essential for understanding human motivation.
2.3.2.1 Self-Determination Continuum and Different Forms of Extrinsic
Motivation
The basic premise of OIT is that as long as the social environment provides
sufficient support, people have the natural tendency to integrate their life experiences.
In other words, people tend to “take in” and further internalize external regulations
such as social norms, cultural practices, and significant others’ demand (Ryan and
17
Deci 2002). To the extent they successfully internalize those external regulations and
even integrate them with the sense of self, individuals will act on them with a sense of
autonomy or volition, and will therefore be motivated autonomously by extrinsic
motivation. However, if individuals fail to internalize those regulations, they will act
on them feeling controlled by some external forces.
Deci and Ryan (2000) further propose a self-determination continuum to
describe different forms of extrinsic motivation that vary in their relative autonomy or
“self-determination.” From the least autonomous to the most autonomous, they are
external regulation, introjected regulation, identified regulation, and integrated
regulation (see Figure 1; Deci and Ryan 2000). The first two types of extrinsic
motivation fall into the category of controlled (non-autonomous) motivation, whereas
the latter two along with intrinsic motivation fall into the group of autonomous
motivation.
------------------------------ Insert Figure 1 Here
------------------------------
In the case of external regulation, the least autonomous form of motivation,
behavior is performed primarily to satisfy an external demand or to obtain an
externally imposed reward contingency. In the present context, if they pursue
strategic goals out of pressure from their superiors, only to obtain a bigger bonus or to
avoid a pay cut, employees would be motivated by external regulation. In the case of
introjected regulation, individuals internalize the reasons for their actions although
they have not accepted the regulation as their own. The external source of regulation
is simply replaced by an internal one. In the present context, employees strive for
18
strategic goals because they would otherwise feel guilty or anxious, or they do so in
order to attain ego enhancements (an internal source), and not because their superior
requires it (external source). Both external and introjected regulations are controlled
types of motivation since in both cases, individuals do not “identify with the value of
a behavior for their own self-selected goals” (Gagné and Deci, 2005, 334).
With identified regulation, behavior is performed out of choice because
individuals value the behavior. For instance, employees would be motivated by
identified regulation if they strive for strategic goals because they think they are
important and they truly endorse them. In integrated regulation, individuals not only
internalize the reasons for their behavior, but they also assimilate them to the “self”.
In the present context, employees would be motivated by integrated regulation if
striving for strategic goals is not only important to them personally, but it is also
congruent with “personally endorsed values, goals, and needs that are already part of
the self” (Ryan and Deci 2002, p. 18). In the case of intrinsic motivation, employees
experience pleasure and satisfaction from the mere process of working toward
strategic goals.
In summary, when a person engages in a behavior because he/she finds it
interesting (intrinsic motivation) or personally meaningful (identified and integrated
regulation), then he/she is motivated by autonomous types of motivation. In contrast,
if a person engages in a behavior because he/she feels pressured by an external force,
whether it is other people’s demand or threat, an imposed reward contingency
(external regulation), or his/her own sense of guilt, anxiety or ego-involvement
(introjected regulation), he/she is motivated by controlled types of motivation.
19
2.3.2.2 Different Forms of Motivation and Work Related Outcomes
The distinction between autonomous and controlled motivation is important
since research in both work (for a review, see Gagné and Deci 2005) and non-work
settings (for a review, see Deci and Ryan 2000) in general, provides evidence of
positive outcomes associated with autonomous motivation and negative outcomes
associated with controlled motivation.
For example, in educational settings, it is found that controlled motivation is
associated with less conceptual understanding of material and surface processing of
knowledge (Benware and Deci 1984; Elliot, McGregor and Gable 1999; Elliot and
McGregor 2001). In contrast, Vansteenkiste, Simons, Lens, Sheldon, and Deci (2004)
found that autonomous motivation predicts greater persistence and better performance
in learning. Controlled motivation is also found to lead to lower level of creativity
among both children and adults (Amabile, Hennessey and Grossman 1986; Amabile,
Godfarb, and Brackfield 1990). Lab experiments (Amabile 1982; Grolnick and Ryan
1987) also show that autonomous motivation leads to a higher level of performance
when the task requires a certain level of creativity, while when the task is relatively
mundane, controlled motivation does not lead to inferior performance.
In work settings, autonomous (vs. controlled) work motivation is found to be
beneficial both in terms of performance and in terms of employees’ psychological
well-being. For example, a survey conducted in a investment banking firm (Baard,
Deci, and Ryan 2004) shows that employees’ autonomous motivation as well as their
perceived autonomy support at work are positively associated with their self-reported
20
performance and vitality at work (i.e., feeling alive and energetic instead of feeling
“dead” and drained), and negatively associated with their level of anxiety.
As summarized by Gagné and Deci (2005), empirical evidence in general
suggests that autonomous (controlled) work motivation enhances (deteriorates)
effective performance “particularly if the task requires creativity, cognitive flexibility,
or deep processing of information” (p. 341). Although controlled motivation may be
less harmful to performance when work requires less creativity and cognitive
flexibility, studies conducted among blue-collar workers with mundane jobs (Illardi,
Leone, Kasser and Ryan 1993; Shirom, Westman, and Melamed 1999) demonstrate
other disadvantage of controlled motivation. For example, controlled motivation is
associated with employees’ lower level of job satisfaction and psychological well-
being. In contrast, individuals who are motivated to work by autonomous motivation
are more likely to possess higher level of self-esteem and job satisfaction, experience
higher degree of vitality, less likely to be depressed and stressed, and report better
physical health (e.g., Kasser and Ryan 1993, 1996).
2.3.2.3 Social Context that Promotes Autonomous Motivation
A logical follow-up question is how to promote autonomous motivation. OIT
maintains that social-contextual factors, including organizational designs and work
climate, can either enhance or forestall autonomous motivation. In general, a social
context that satisfies individuals’ basic psychological needs for autonomy,
competence and relatedness, will promote its members’ autonomous motivation
(Ryan and Deci 2000). The mechanism through which need satisfaction facilitates
21
internalization of external regulations and thus enhances autonomous motivation is
described as follows.
Very often, external regulation is initially brought about by significant others.
Just to name a few, parents demand children to behave at school, superiors reward
subordinates for achieving performance standards, or executives promotes newly
adopted strategies to lower-level employees. The target individuals, whether they are
the children, subordinates or lower-level employees, may perform desired activities
out of feeling connected with the significant others. Research has shown that
satisfaction of need for relatedness facilitates the process of internalization of external
regulation (e.g., Ryan, Stiller and Lynch 1994). Satisfying individuals’ need for
competence is also important because if they do not feel competent to perform well on
the target behavior, individuals are less likely to internalize regulation of such
behavior (Vallerand 1997).
According to OIT however, in order for individuals to fully internalize or
integrate external regulation, satisfying their need for autonomy is central. Recall that
internalization can take the form of introjected regulation (which is one type of
controlled motivation) when internalization is only partially achieved. OIT holds that
without satisfying individuals’ need for autonomy, the support for relatedness and
competence can only result in introjected regulation (Ryan and Deci 2000). To fully
internalize external regulation, autonomy support is needed to help individuals “grasp
its meaning and synthesize that meaning with respect to their other goals and values”
(Ryan and Deci 2000, p.74). A number of empirical studies support the crucial role of
autonomy support in facilitating the internalization and integration processes (e.g.,
22
Grolnick and Ryan 1989; Deci, Eghrari, Patrick and Leone 1994; Strahan 1995;
Williams and Deci 1996).
In summary, OIT maintains that social-contextual conditions that satisfy
individuals’ needs for autonomy, competence and relatedness will facilitate their
internalization of extrinsic motivation and thus enhance their autonomous motivation.
In contrast, when the social context hinders the satisfaction of individuals’ needs for
autonomy, competence and relatedness, individuals’ autonomous motivation can be
undermined (Ryan 1995; Reis, Sheldon, Gable, Roscoe and Ryan 2000).
As for the specific initiatives that facilitate employees’ internalization process
at work, at least three empirical studies must be mentioned. Using field experiment,
Deci, Connell, and Ryan (1989) demonstrate that when managers are trained to (1)
better acknowledge subordinates’ perspectives, (2) let subordinates take initiatives to
make choices and solve problems versus pressuring them to behave in certain ways,
and (3) provide positive feedback, compared to when they are not, their subordinates
report higher level of job satisfaction as well as trust in the corporate management.
Lynch, Plant, and Ryan (2005) conduct a survey in a psychiatric hospital when it is
undergoing a strategic change, i.e., adopting a new treatment milieu program. Their
study shows that when experiencing higher involvement in important decision making
that affects the hospital, staffs are more likely to internalize the motivation to carry
out the new strategy. Gagné, Koestner and Zuckerman (2000) conduct cross-sectional
and longitudinal studies in a telecommunications company that is going through a
strategic transformation. Their results show that when provided with rationales for the
tasks, when given choices about how to conduct the tasks, and when the feelings
23
about their work is acknowledged, employees are more likely to accept changes in the
organization.
At least two limitations are noticeable in the above-reviewed research on
internalization-facilitating measures at work. First, although the above studies are able
to demonstrate certain types of positive effect of different internalization-facilitating
initiatives, none of them directly measures the forms of employees’ work motivation.
In contrast, using lab experiment and student participants, Deci et al. (1994) are able
to show that when the following three contextual factors are in place, compared with
when they are not, individuals are more likely to internalize the motivation to engage
in an uninteresting computer task: (1) providing a meaningful rationale, (2)
acknowledging the individual’s feelings, and (3) conveying choice.
Second, the internalization-facilitating initiatives that are proposed are limited
to specific aspects in the job context (e.g., meaningful positive feedback) and
interpersonal style of superiors. When reviewing Deci et al.’s (1989) finding, Sheldon
et al. (2003, p. 368) argue that future research could go "further back" and investigate
“higher-order contextual factors” such as organizational culture and company
administration. Following Sheldon et al.’s (2003) suggestion, this paper examines the
impact of one “higher-order contextual factor,”( i.e., the organization’s PMS) on
employees’ motivation. Such an investigation is important because higher-order
contextual factors could be longer lasting and possibly more penetrating in
influencing employees’ motivation than are specific job characteristics and superiors’
interpersonal style.
24
2.3.3 Basic needs Theory
As mentioned in the previous sections, both CET and OIT employ the concept
of basic psychological needs (i.e., the needs for autonomy, competence and
relatedness) to explain relevant findings. Basic needs theory (Deci and Ryan 2000;
Ryan and Deci 2000) was recently formulated mainly to clarify the needs concept and
describe how various forms of motivation differentially influence effective
functioning and psychological well-being. The basic premise of this theory is that
these three psychological needs are innate, essential and universal to human beings
(Ryan and Deci 2002).
Two findings under this theory are of special interest in this paper. First,
satisfaction of these psychological needs has significant impact on individuals’ well-
being.1 For example, Sheldon, Reis, and Ryan (1996) find that at both the between-
person level and the within-person level, satisfaction of the three needs is positively
associated with positive affect and vitality, and negatively associated with negative
affect and symptomatology. Baard et al. (2004) find that need satisfaction among
employees is positively associated with their vitality at work and negatively
associated with their level of anxiety.
Second, the attainment of personal goals does not ensure the enhancement of
psychological well-being. Specifically, Sheldon and Kasser (1998), and Kasser and
Ryan (2001) find that well-being is enhanced when intrinsic goals (e.g., personal
growth and community contribution) are attained, but not when extrinsic goals (fame
1 Compared with some other research that takes a hedonic view of well-being (e.g., Kahneman, Diener, and Schwarz 1999), SDT takes a eudaimonic view of well-being. The former equates well-being with subjective happiness and experience of pleasure versus displeasure, whereas the latter describes well-being as striving for perfection, living in accordance with true self, and actualization of one’s true potentials (Ryan and Deci 2002; Sheldon, Ryan, Deci, and Kasser 2004).
25
and wealth) are attained. The reason is because the attainment of extrinsic goals does
not necessarily provide satisfaction of basic psychological needs. In addition, it is
found that not only the content of goals, but also the type of motivation underlying
the goal pursuits, matters. Sheldon and Elliot (1998, 1999) find that when they attain
goals (whether intrinsic or extrinsic) that have been well internalized, in contrast with
attaining goals that were imposed on them, individuals report higher level of well-
being from such goal attainment.
2.3.4 Causality Orientation Theory
The fourth mini-theory is causality orientation theory (Deci and Ryan 1985b).
Whereas CET and OIT focus on the influence of social contexts on motivation,
causality orientation theory focuses on the effect of stable individual differences on
motivation. This paper does not review this mini-theory in detail because this paper
examines the effect of situational factors (i.e., PMS characteristics), rather than that of
individual difference factors, on work motivation.
This theory is based on the premise that whether a social context is autonomy
supportive or controlling can be a matter of individuals’ perception, which differs
significantly among individuals. The general causality orientations scale (GCOS) was
developed to measure the degree to which individuals are in general autonomy
oriented, control oriented, and impersonally oriented. Individuals high in autonomy
orientation tend to experience social contexts as autonomy supportive while those
high in control orientation tend to experience the same contexts as controlling.
Individuals high in impersonal orientation tend to be amotivated.
26
Under causality orientation theory, individual differences in causality
orientation have a significant impact on individuals’ behaviors, personality aspects as
well as psychological well-being. For example, Neighbors and Knee (2003) find that
individuals scoring high on autonomy orientation, compared with those scoring low
on autonomy orientation, are less likely to experience a decrease in self-esteem and
affect when being compared with better performers. This finding is consistent with
the notion that a strong autonomy orientation leads to better adaptive ability to
negative feedback, openness to experience, low need for defensive behavior, and
stability of self-schemas (e.g., Koestner and Zuckerman 1994; Bober and Grolnick
1995; Hodgins and Knee 2002).
2.3.5 Summary
Self-determination theory (SDT) of motivation consists of a few mini-theories.
Originating from cognitive evaluation theory (CET), organismic integration theory
(OIT) focuses on the different forms of individuals’ motivation rather than on the total
amount of motivation. Specifically, it differentiates autonomous motivation from
controlled motivation. Such differentiation is important because autonomous
(controlled) motivation is found to be associated with higher (lower) level of effective
performance and individuals’ psychological well-being. Moreover, OIT maintains that
social context can be molded in a way that individuals’ autonomous motivation is
either fostered or forestalled. Basic needs theory of SDT provides a basis for
understanding the abovementioned motivational process.
27
This paper uses SDT, OIT in particular, as its major theoretical foundation.
Such choice of theory is based on the belief that SDT can provide unique insights to
work motivation that are distinct from that provided by other theories of work
motivation. In the sections that follow (section 2.4 and 2.5), discussions on theoretical
and practical differences between SDT and the three other motivation theories are
provided.
2.4 SDT and Agency Theory: Their Differences
SDT and agency theory hold different assumptions about basic human nature.
Partly due to these different assumptions, SDT and agency theory each provides
distinctive solution to a very fundamental question raised by the latter: how to
improve goal congruencies between the agent and the principal thereby mitigating
agency problems? Those differences are discussed in sequence.
2.4.1 Basic Assumptions about Human Nature
Agency theory (Jensen and Meckling 1976) assumes that the employee (the
agent) makes rational trade-offs between “effort costs” and expected utility from
his/her actions. The expected utility from his/her action can be both monetary reward
(e.g., bonus) and non-monetary reward (e.g., prestige). In other words, according to
this assumption, the agent views effort as cost, and monetary and non-monetary
rewards as benefit.
In contrast, SDT holds that human beings have the innate tendency to fulfil
their potentials and strive for meaningful goals (Deci and Ryan 2000); therefore, they
28
desire to work hard when the task is viewed as meaningful or interesting. Using
Maslow’s language, “duty is pleasant, and pleasure is the fulfilment of duty.”2 Thus,
individuals do not necessarily perceive effort as cost incurred; quite the contrary, the
mere process of fulfilling duties can be viewed as rewarding. As for monetary reward
and prestige, as reviewed in previous section, SDT holds that they themselves are not
necessarily beneficial because attaining extrinsic goals (such as momentary rewards
and prestige) per se cannot satisfy one’s innate psychological needs. They contribute
to individuals’ well-being only if they are delivered in a way that individuals’ basic
needs are satisfied (Deci and Ryan 2000).
However, experimental studies show that individuals do shirk when effort
level cannot be observed (e.g., Berg, Daley, Dickhaut, and O’Brien 1992). It is also
shown that individuals tend to exploit their private information when they anticipate
by doing so their personal wealth can be increased (e.g., Baiman and Lewis 1989). It
appears that agency theory’s assumption about human nature is supported by
empirical evidence.
Nevertheless, SDT may argue that if individuals tend to avoid hard work and
pursue extrinsic goals, it is not because they are inherently lazy (effort-averse) and
greedy (self-interested); rather, it is because the social context does not provide
sufficient support for their needs for autonomy, competence and relatedness. Two
streams of research lend support for this argument. First, studies show that when they
are deficient in sense of efficacy or sense of self-determination, people are more
2 SDT’s conceptualization of psychological needs is consistent with that of Maslow (1943) in that both theories view psychological needs as innate as opposed to learned (Deci and Ryan 2000).
29
likely to be amotivated, i.e., do not have the intention to act at all (Pelletier, Dion,
Tuson, and Green-Demers 1999).
Second, it is found that when social context provides insufficient support for
basic psychological needs, the members are more likely to pursue extrinsic (vs.
intrinsic) goals. Specifically, by surveying teenagers and their mothers, Kasser, Ryan,
Zax, and Sameroff (1995) find that when mothers are democratic, non-controlling and
warm, compared when they are controlling and distant, the teens are less likely to
value extrinsic goals. Williams, Cox, Hedberg, and Deci (2000) obtain similar
findings by studying the impact of parental styles on teenagers’ goal selection. As for
why need satisfaction has such an impact on what people pursue, Ryan and Deci
(2002) propose that when developmental conditions do not satisfy their basic
psychological needs, people may pursue extrinsic goals as “substitutes” for the basic
needs.
The debate on basic assumptions about human nature has its long history in
business research. For example, influenced by McGregor (1960) and Maslow (1970),
Argyris (1973) proposes a “self-actualizing” model of man. Contrary to the
proponents of “economic model of man” and consistent with SDT researchers,
Argyris (1973) assumes that individuals “have a need to grow beyond their current
state and reach higher levels of achievement and that the assumptions of the
economic view of man limit people from attaining their full potential” (Davis,
Schoorman, and Donaldson 1997, p. 27).
2.4.2 How to Improve Goal Congruencies?
30
Besides the assumptions it makes about human nature, agency theory further
assumes that the agent has different goals as does the principal, and it is expensive for
the latter to verify what the former is doing (Eisenhardt 1989). One of the primary
functions of management accounting systems is thus to align the goal of the agent and
that of the principal such that the agent will take cooperative actions that the principal
desires (Indjejikian 1999; Sprinkle 2003). To “induce” the agent to take actions that
benefit the principal rather than devoting their time to activities they prefer, agency
theory relies on designing various incentives and other contractual arrangements
(Covaleski, Evans, Luft, and Shields 2003). These contractual designs, such as piece
rates/commissions, profit sharing, efficiency wages, or possibility of firing and
promotion, create reward/punishment contingency for the agent. Those rewards are
often contingent on performance.
There are at least two limitations associated with solely relying on creating
performance-contingent rewards to align the goal of the agent with that of the
principal. First, performance indicators that are used in compensation contracts are
sometimes noisy and inaccurate, which may result in the mismatch between the
interests of the agent and those of the principal. If the agent possesses private
information, discretionary behaviours (moral hazard and adverse selection) may well
result. Undoubtedly agency theorists realize this problem and have designed various
contractual forms with the intention to more effectively achieve the alignment of
interests between the two parties (Kunz and Pfaff 2002).
Second, reward contingencies are often effective only within a limited
observable window, e.g., within the employment horizon or within compensation
31
contract window. In other words, only within that finite window, can the goal of the
agent be aligned with that of the principal or the firm objectives. In such a situation, if
solely motivated by the imposed reward contingency, the agent may not invest effort
to master new knowledge and skills that potentially leads to higher long-term firm
performance because he/she believes that such effort may not be compensated
(Dikolli 2001; Dutta and Reichelstein 2003). Moreover, the agent may not be willing
to take risks that are associated with innovation and other proactive behaviors that
benefit long-term firm performance, unless he/she can charge the firm for risk
premium (Sprinkle 2003).
As suggested by Davis et al. (1997), agent theorists focus on the question of
how to motivate agent to “strive for” goals that the principal desires, but tend to
ignore the question of why effort does not necessarily lead to high performance.
Agency theorists realize that low ability, lack of knowledge, poor information and
risk-aversion can be reasons for agents’ failing to deliver high performance for their
principals despite their effort, but they view these problems as exogenous.
This paper argues that problems such as agent’s lack of knowledge, poor
information, low ability, and even risk-aversion may precisely rise from the “wrong”
forms of motivation underlying the agent’s effort. As summarized in section 2.3.2.2,
controlled motivation is associated with surface processing of knowledge, lower level
of persistence (Benware and Deci 1984, Elliot et al. 1999, Elliot and McGregor
2001), lower level of creativity (Amabile et al. 1986, Amabile et al. 1990),
unwillingness to carry out new strategy (Lynch et al. 2005), and reluctance to accept
organizational change (Illardi et al. 1993). It is also found that among employees,
32
love of money (one type of extrinsic goal) is related to the propensity to perform
unethical behaviors (Tang and Chiu 2003). Therefore, significant negative
consequences may emerge if goal congruencies between the agent and principal are
achieved solely through imposing reward/punishment contingency upon the former.
SDT proposes an alternative way to achieve goal congruencies between the
agent and principal, i.e., to create an organizational environment that facilitates the
agent’s internalization of the organizational objectives. According to SDT, when such
internalization is accomplished, the agent will carry out cooperative behaviours
because he/she has grasped the meaning of those objectives and consequently
synthesized their meaning into his/her goal system or value structure (Ryan and Deci
2000). The benefits of achieving such internalization process are twofold: first, from
the standpoint of the principal, desired cooperation, such as continuous learning and
innovation, may be obtained at a lower cost. Second, the agent “moves away from
heteronomy to autonomy or from external to self-regulation (Ryan 1995, p. 405),”
which is also beneficial for the agent’s psychological well-being.
As stated in section 2.3.2.3, to facilitate the agent (employee)’s internalization
of firm objectives, organizational designs that satisfy the agent (employee)’s needs
for autonomy, competence and relatedness are crucial. Applying this notion to the
current context, it is necessary to design PMS that better satisfy the employees’ basic
psychological needs. This perspective is in accordance with the view of corporate
executives. A survey conducted among financial service firm executives shows that
executives do not view inducing employees to act in a desired manner as the sole
important goal to implement performance evaluation systems. Other goals such as
33
“fostering teamwork”, “enhancing communication of business objectives”, “attracting
and retaining employees”, are viewed as at least equally, if not more, important (Ittner
and Larcker 2001, pp.384-388).
2.5 SDT, Expectancy Theory and Goal-Setting Theory: Their Differences3
Given the significance of expectancy theory and goal-setting theory in both
work motivation research in general (Gagné and Deci 2005) and management
accounting research in particular (Sprinkle 2003), this paper contrasts these two goal-
based theories with SDT as follows.
As mentioned in section 2.2, under expectancy theory, the motivational effect
of goals is a function of the expectancy and the valence of goal attainment. Therefore,
all goals are believed to have indifferent motivational effect as long as the expectancy
and perceived attractiveness of goal attainment are the same. This premise has been
challenged by research that shows that significant variance in goal pursuit cannot be
explained by either expectancy or valence of goal attainment (Klein, Wesson,
Hollenbeck, and Alge 1999; Klein, Wesson, Hollenbeck, Wright, and DeShon 2001).
Goal-setting theory examines both the process of goal-setting (e.g. employee
involvement and participation) and certain characteristics of specific goals (e.g.
specificity and difficulty level of the goals) on performance. As argued by Merchant
and Manzoni (1989), when examining profit centers and when environmental
uncertainty/complexity is high, the explanatory power of goal-setting theory is
limited.
3 More detailed discussion on the difference between SDT and other goal-based motivation theories can be found in Deci and Ryan (2000), Sheldon, et al. (2003), and Gagné and Deci (2005).
34
Neither expectancy theory nor goal-setting theory differentiates the different
contents of goals and the different motives underlying goal pursuits (Gagné and Deci
2005). For example, goal-setting theory proposes various initiatives to enhance goal
commitment, including conveying to employees the superior’s legitimate authority
(Latham and Saari 1979), providing monetary incentives (Wright 1992), and
engaging employees in the goal setting process (Latham, Erez and Locke 1988). From
the perspective of SDT, those initiatives will each have differential effects on the
form of employees’ motivation and thereby on effective performance.
As mentioned in section 2.3, different from these two theories, SDT highlights
two critical factors that may impact the outcome and affective experience of goal
pursuit: the content of goals, and the motives behind the goal pursuits (Sheldon,
Ryan, Deci, and Kasser 2004). First, SDT differentiates intrinsic goals from extrinsic
goals. The former goals directly satisfy individuals’ innate psychological needs while
the latter do so less directly. Second, when individuals pursue personal goals in an
autonomous (vs. controlled) way, they tend to invest effort more persistently, and as a
result, are more likely to attain those goals. Moreover, when they attain goals that
have been well internalized, in contrast with attaining goals that were imposed on
them, individuals report higher level of need satisfaction from such goal attainment
(Sheldon and Elliot 1998, 1999).
Besides the above-mentioned difference, a more fundamental difference
seems to be that SDT examines the innate psychological needs as the basis for
studying goal pursuits, whereas other goal-based motivation theories do not build on
such analysis. According to Deci and Ryan (2000), two historical reasons contribute
35
to the lack of attention to need-based analysis in motivation research. First, influenced
by the prevailing cognitive paradigm in psychology, motivation research shifted its
primary research concept from needs to goals in 1960s. Second, influenced by
Vroom’s (1964) expectancy-valence framework, the valence of goal attainment is
defined functionally. In other words, goal attainment is viewed as attractive as long as
it bears utility, whether or not it actually satisfies individuals’ innate psychological
needs. As a result, the satisfaction of psychological needs associated with goal
attainment was largely ignored by goal-based motivation researchers (Deci and Ryan
2000).
In summary, a few features of SDT distinguish it from other motivation
theories that are popular in organizational behavior research and accounting research:
(1) it is based on the assumption that human beings are inherently self-motivated, but
that social contexts can forester as well as forestall such innate tendency; (2)
individuals’ motivation not only differ in its amount and quantity, but also in its
nature and quality; and (3) its analysis of motivational process is based on thorough
analyses of basic psychological needs of human beings.
2.6 Research on Motivational Effects of Performance Management Systems
(PMS)4
This section reviews extant research on motivational effects of PMS.
Limitations in this literature are then discussed to guide the design of the studies.
4 For a review of experimental research on the motivational effect of management accounting systems in general, see Sprinkle (2003, pp. 290-301).
36
A significant number of studies on the motivational effect of PMS are based
on agency theory (see Sprinkle 2003). Consistent with the classic agency model, great
attention has been given to the design of performance-contingent monetary rewards,
or incentives. Given the attention incentives have received in accounting literature,
this review is limited to the literature on incentives only. Specifically, it is limited to
agency theory based research on performance measurement systems and on reward
systems. Nevertheless, the author acknowledges that abundant studies have been
conducted to examine the motivational effects of other components of PMS such as
budgeting and performance appraisal. Those studies are based on various theories
besides agency theory (e.g., for budgeting research, see Covaleski, Evans III, Luft,
Shields 2003) and some of them are reviewed in Chapter 3 when a motivational
model of PMS is proposed.
Agency theory based research on performance measurement systems often
holds that if the (combination of) performance measures are not congruent with firm
objectives, they will “induce managers to do the wrong things” (Merchant, 2006, p.
909). For example, a few analytical studies (e.g., Sliwka 2002; Dutta and Reichelstein
2003) demonstrate that under certain conditions, performance measurement systems
that do not include nonfinancial measures or leading indicators can lead to managers’
myopic behaviors. Other than congruency, the risk-bearing effect of performance
measures is also considered by this literature. An important theme of this research is
thus to determine an optimal performance measurement system that maximizes
agent’s incentives while minimizing the risk that agent bears (Indjejikian 1999; Evans
et al. 2006). More specifically, a significant body of this literature focuses on
37
developing optimal (combination of) performance measures that represent the best
trade-offs among a few criteria of performance measures (most often, among
congruency, precision and sensitivity) so that the agent’s incentives to increase firm
value are maximized and the risk imposed on the agent is minimized (e.g., Banker
and Datar 1989; Feltham and Xie 1994; Datar, Kulp and Lambert 2001).
Agency theory based research on reward systems has focused on how
incentive scheme variables, such as the type of incentive schemes (e.g., piece-rate and
flat-rate schemes, budget-based schemes, and tournament schemes), the performance
dimension(s) being rewarded, and the magnitude of pay, impact task performance (for
a review, see Bonner and Sprinkle 2002).
For instance, whether and to what degree rewards should be given to multiple
dimensions of performance has received significant amount of attention in managerial
accounting literature (Bonner and Sprinkle 2002). On one hand, it is argued that
incentives lead to high levels of effort and thus linking rewards with all dimensions of
performance will result in employees’ optimal allocation of effort (Prendergast 1999).
Consistent with this notion, analytical studies based on agency theory demonstrate
that rewarding leading indicators (vs. only rewarding financial performance) is
crucial for solving moral hazard problems, especially when the employment horizon
is short (Dikolli 2001) and when the principal does not commit to a long-term
contract (Dutta and Reichelstein 2003). On the other hand however, agency theorists
also argue that rewarding all dimensions of performance can be harmful. For
example, not all dimensions of performance can be measured with equal precision. In
other words, some of the performance measures (e.g., innovation) are contaminated
38
with greater noise than are other measures (e.g., sales increase). If employees are risk
averse (as assumed by agency theory), rewarding all dimensions of performance can
thus lead to a suboptimal allocation of effort and a decrease in overall firm
performance (Holmstrom and Milgrom 1991). Some empirical studies (e.g., Jenkins,
Mitra, Gupta, and Shaw 1998) indirectly and partially test Holmstrom and Milgrom’s
(1991) prediction. In general the results show that incentives have a positive effect on
the performance of dimensions that are rewarded and have no effect on the
performance of dimensions that are not rewarded (Bonner and Sprinkle 2002). But
this finding’s implication for reward systems is not clear.
Some other studies examine how the magnitude of pay affects task
performance. Empirical studies in this area provide mixed results. Specifically, some
studies suggest that increasing the level of payments have mixed effects on
performance, some show that increasing the level of payments tend to decrease
performance, while others show that the level of payments has no effect on
performance (Bonner and Sprinkle 2002).
At least a couple of limitations are observed in the extant incentive literature.
First, merely “inducing” employees to extend their effort toward firm objectives does
not guarantee the achievement of those objectives. For example, employees’
readiness to take risks, to innovate, and to acquire new knowledge and skills is crucial
for firms’ long-term success. However, those variables are by and large unexplored in
this literature (Bonner and Sprinkle 2002; Sprinkle 2003). Upon reviewing agency
theory based research on incentive systems, Indjeikian (1999) made the following
remark: “it appears that the real agency conflict has less to do with getting employees
39
to work harder…, but more to do with getting them to choose the right combination
of actions and decisions that increases shareholder value” (p. 152). This paper
contributes to the existent PMS literature by applying SDT to this area of research to
examine how PMS characteristics impact the forms of employees’ work motivation,
which in turn impacts not the level of employees’ effort, but the direction of such
effort and the effort invested in learning. Specifically, it examines how employees
react to PMS features in terms of their tendency to take risks to sell critical issues to
executives and their willingness to acquire new knowledge and skills.
Second, this literature lacks studies that directly examine the motivational
mechanism through which incentives impact employees’ effort. As Bonner and
Sprinkle (2002) noted, the majority of studies on incentives only examine the effect
incentives have on task performance, and not the effect on employees’ effort (Bonner
and Sprinkle 2002), left alone the effect on employees’ motivation. Such lack of
attention to motivational processes may be due to the fact that this literature is based
on economic theories. Otley (1999) suggests researchers study PMS “not just from an
economic perspective, but from a social, behavioral and managerial perspective” (p.
381). This paper takes a behavioral approach rather than an economic one, and thus
explores a portion of the “black box” of employees’ motivational processes.
2.7 Summary
Self-determination theory (SDT) of motivation has received growing attention
in various domains such as education, sports management, psychotherapy, religion
and organizational behavior research. This theory differentiates autonomous
40
motivation from controlled motivation because these two types of motivation are
found to have differential effect on effective performance and individuals’
psychological well-being. Specific initiatives are further proposed to foster
individuals’ autonomous motivation.
Upon reviewing extant literature on the motivational effect of performance
management systems (PMS), incentives literature in particular, this chapter concludes
that by applying SDT to PMS research, this paper makes contribution to this
literature. In Chapter 3, a motivational model for studying PMS is proposed based on
SDT.
41
CHAPTER THREE
MOTIVATIONAL MODEL AND HYPOTHESES DEVELOPMENT
This chapter presents a SDT-based motivational model for studying PMS and
develops testable hypotheses based on this model.
3. 1 A Motivational Model of Performance Management Systems (PMS)
Based on SDT, this paper proposes a motivational model of PMS (see Figure 2).
In this model, characteristics of an organization’s PMS serve as antecedents to the nature
of its employees’ work motivation (i.e., autonomous vs. controlled work motivation),
which in turn has a significant impact on employees’ cognition, behaviors, as well as
affective experience. Those antecedent and consequence variables are discussed in detail
in section 3.1.1 and 3.1.2, respectively.
------------------------------ Insert Figure 2 Here
------------------------------
3.1.1 Antecedents to Employees’ Autonomous and Controlled Motivation:
Characteristics of PMS
The selection of antecedents is based on research from two major sources: the
accounting literature on PMS and the SDT literature on social-contextual conditions that
impact individuals’ autonomous and controlled motivation. As shown in Figure 2, the
present paper studies only three characteristics of PMS as potential antecedents to
employees’ autonomous and controlled motivation, but other antecedents can be certainly
identified. For example, the type of measures (outcome measures vs. process measures;
short-term measures vs. long-term measures) included in performance measurement
42
systems, and the frequency and nature of the feedback that employees receive about their
performance, may have significant effect on employees’ autonomous and controlled
motivation.
3.1.1.1 Alignment between Reward Systems and Performance Measurement
Systems: Performance-Reward Contingency
Very often, reward systems (including compensation plans and non-management
incentive plans) are not completely aligned with performance measurement systems. For
example, surveys and field studies (e.g., Kaplan and Norton 1996; Ittner and Larcker
2001; Ittner, Larcker, and Meyer 2003; Ittner, Larcker, and Randall 2003) show that
firms do not always link their strategic performance measurement systems (SPMS) with
their incentive plans. Instead, SPMS sometimes only serve as a strategy management
tool5. When reward systems are (not) aligned with performance measurement systems,
employees receive a reward that is (not) fully contingent on their measured performance.
This paper argues that one facet of PMS that potentially impacts employees’ autonomous
and controlled motivation is the alignment between reward systems and performance
measurement systems, i.e., the performance-reward contingency.
SDT’s early work, specifically CET, and the research conducted by Eisenberger
and his colleagues (e.g., Eisenberger and Cameron 1996, 1998; Eisenberger, Rhoades and
Cameron 1999; Eisenberger and Rhoades 2001) provide opposite predictions about how
performance-contingent rewards impact employees’ motivation. As reviewed in section
5 As a strategy management tool, SPMS can be used to clarify strategy, communicate strategy throughout the organization, align short-term actions at individual level with long-term strategic objectives at the organization level, and provide real-time feedback on strategy implementation in order to further revise strategy (Kaplan and Norton 1996).
43
2.3.1, CET (Deci 1975; Deci and Ryan 1980) argues that reward can be perceived as
controlling in nature. Thus, rewards can diminish employees’ sense of self-determination
and undermine their intrinsic motivation. The meta-analysis conducted by Deci, et al.
(1999) suggests that all task contingent rewards, including performance-contingent
reward, undermine intrinsic motivation as measured by free-choice persistence.
The “undermining” argument has been controversial since its first appearance
(Gagné and Deci 2005). Eisenberger and his colleagues (e.g., Eisenberger and Cameron
1996, 1998; Eisenberger, Rhoades and Cameron 1999; Eisenberger and Rhoades 2001)
are among its most well-known opponents. Their research suggests that performance-
contingent reward and high reward expectancy (i.e., employees’ belief that they would
get higher pay if they perform well) actually increase, rather than decrease, the sense of
self-determination and intrinsic motivation. This line of research (e.g., Eisenberger and
Rhoades 2001) also shows that performance-contingent reward actually increases
creativity among employees.
The key argument provided by Eisenberger and his colleagues is that
performance-contingent reward is not controlling; rather it increases the sense of self-
determination. This is because the existence of performance-contingent reward conveys
to the employees two pieces of important information: “(a) the organization has little
control over the employee’s daily job performance beyond minimally acceptable levels,
and (b) the employee has the opportunity to choose whether to pursue the reward by
altering performance” (Eisenberger et al. 1999 p. 1028). They further argue that
performance-contingent reward increases not only the sense of autonomy, but also the
sense of competence. Specifically, it is noted that performance-contingent rewards
44
provide employees with an indication of competence over and beyond that provided by
favorable performance feedback (Eisenberger et al. 1999).
Two concerns cast some doubt on conclusions made by Eisenberger and his
colleagues about how performance-contingent rewards affect work motivation. First, the
positive association between performance-contingent reward and perceived self-
determination among employees is observed in survey studies (Eisenberger et al. 1999;
Eisenberger and Rhoades 2001). The authors attribute such positive association to the
“enhancing” effect of performance-contingent rewards on self-determination. However,
this association may be equally well explained by economic mechanisms. For example,
for departments (e.g., sales department) where employees have great amount of private
information as to how to create firm value and where employees have relatively good
control over performance outcomes, agency theory would predict that in order to solve
agency problems, the company will grant employees with significant flexibility at work,
while adopting reward systems that are highly contingent on performance (Eisenhardt
1989). In other words, information asymmetry and outcome uncertainty/controllability
may well result in both high level of perceived self-determination at work and high level
of performance-reward contingency. In Eisenberger and Rhoades’ (2001) study 4 and
study 5, salespeople as well as their coworkers at support positions (e.g., cashiers and
clerks) are sampled, but job characteristics such as private information and outcome
uncertainty are not controlled for. Therefore, one may argue that the positive association
between performance-contingent rewards and employees’ perceived self-determination is
due to correlated third variables such as information asymmetry and outcome uncertainty,
rather than due to the motivational benefit of performance-contingent rewards. To reduce
45
the contamination of correlated third variables, Study 2 of current paper employs an
experiment to examine the effect of performance-reward contingency on employees’
motivation.
Second, even if employees do not always perceive performance-contingent
rewards as controlling, their controlling aspect may become more salient when SPMS is
adopted. More specifically, the controlling aspect may be more salient when rewards are
linked with SPMS than when they are linked with traditional financial measures. SPMS
are developed based on business causal models that describe how strategic drivers (e.g.,
investment in employee training and R&D) supposedly result in strategic outcomes (e.g.,
increase in sales). When rewards are linked with SPMS, reward contingencies are
therefore attached not only to the strategic outcome measures but also to strategic driver
measures. Under this situation, employees and middle managers may view the
hypothetical business models as being imposed on them and view SPMS-based reward
systems as means for top management to control the way they deliver on strategic
outcomes. As a result, they may feel little volition and sense of autonomy. This
speculation is consistent with Merchant (2006), who argues that compared with a reward
system that includes only strategic outcome (summary) performance measures, a reward
system that defines hypothesized causal links leaves less flexibility and freedom for
middle managers to pursue alternative value-creating actions.
Therefore, it is likely that when reward systems are linked with SPMS, compared
with when they are linked with traditional financial measures only, employees are more
likely to act out of controlled (vs. autonomous) motivation. Given the growing popularity
of SPMS in management accounting practice, Study 2 of current paper specifically
46
examines the effect SPMS-rewards linkage has on employees’ autonomous and
controlled motivation.
As mentioned in Chapter 2, whether and to what degree reward systems should be
linked with multiple dimensions of performance has received significant amount of
attention from agency based researchers. Specifically, it is argued that linking rewards
with all dimensions of performance will result in employees’ optimal allocation of effort
(Prendergast 1999). In the context of SPMS, Malina and Selto (2001) note that if
important strategic driver measures are not rewarded, employees may not be motivated to
act on those drivers; instead, they may allocate effort to actions that are rewarded but bear
no strategic importance. On the other hand however, Holmstrom and Milgrom (1991)
argue that due to the inaccuracy of some performance measures, rewarding all
dimensions of performance can lead to a suboptimal allocation of effort and a decrease in
overall firm performance.
SDT suggests another potential drawback of linking reward systems to
performance measurement systems. In particular, the linkage between reward systems
and performance measurement systems, especially the linkage between reward systems
and SPMS, may result in lower (higher) level of autonomous (controlled) work
motivation among employees.
Considering the two conflicting streams of research on performance-contingent
rewards on employees’ motivation (i.e., SDT and the research by Eisenberger and his
colleagues), this paper predicts that performance-reward contingency has a significant
impact on the form of employees’ motivation, but does not predict the direction of such
impact.
47
3.1.1.2 Participative Decision Making in PMS: Providing Choices and
Acknowledging Perspectives
As summarized in section 2.3.3, a social context that satisfies individuals’ needs
for autonomy, competence and relatedness can facilitate their internalization of extrinsic
motivation, which leads to higher level of autonomous (vs. controlled) motivation.
Specific initiatives that have been found to successfully facilitate individuals’
internalization process fall into three categories: (1) acknowledging individual’s feelings
and perspectives (Deci et al. 1989; Deci et al. 1994), (2) providing choices (Deci et al.
1994), letting individuals take initiatives to make decisions and solve problems relevant
to themselves (Deci et al. 1989;), or involving them in important decision making that
affects the organization (Lynch et al. 2005), (3) good communication (Gagné, et al.
2000), including providing meaningful rationales (Deci et al. 1994) and positive feedback
(Deci et al. 1989).
Consistent with this literature, especially the research on the above category (2),
this paper argues that involving employees in PMS related decision making will increase
their sense of autonomy. Those PMS related decision making include, but are not limited
to: (1) formulating and revising strategic plans that eventually lead to the attainment of
strategic goals, (2) selecting measures to gauge an organization’s performance in
achieving its strategic goals, (3) setting targets for each of the performance measures, and
(4) evaluating individual’s performance.
Noteworthy, prior studies on participative decision making suggest that
participative decision making not only better satisfies employees’ need for autonomy, but
48
also better satisfies their needs for competence and relatedness. First, at the instrumental
level, participation processes such as participative budgeting serve as a conduit for
information exchange between superior and subordinate (Covaleski et al. 2003; Shields
and Shields 1998), thereby improving subordinates’ understanding of their job. In
addition, participation provides employees with opportunity to influence the outcomes of
target setting and performance appraisal. These factors may lead to higher levels of
perceived competence among employees.
Second, a meta-analysis of studies on participation in performance appraisal
shows that the so-called “value-expressive participation” (i.e., participation solely for the
purpose of having one's "voice" heard) has a stronger effect on employees’ satisfaction
than does the “instrumental participation” (i.e., participation for the purpose of
influencing end results) (Cawley, Keeping and Levy 1998)6. Therefore, at a less
instrumental level, it appears that when individual’s feelings and perspectives are
acknowledged, i.e., when their “voice” is heard, the need for relatedness is better
satisfied. In accordance with this view, Hofstede (1967) contends that participation in
decision making can satisfy employees’ needs for affiliation, and Locke and Schweiger
(1979) also argue that the participative budgeting process increases employees’ trust in
the organization.
In summary, this paper proposes that the more employees are involved in PMS
related decision making, the more likely they will be motivated by autonomous (vs.
6 Interestingly, Fisher, Frederickson and Peffer’s (2000) experiment shows that when the negotiation between superior and subordinate fails and therefore the superior has to impose a budget on the subordinate, the latter’s performance significantly drops. This finding suggests that in participation, merely “having one’s voice heard” may not be sufficient if employees do not feel a real sense of choice and autonomy.
49
controlled) motivation to work. This is because such involvement supposedly helps to
satisfy employees’ needs for autonomy, competence and relatedness.
3.1.1.3 Communicating Business Objectives through PMS: Providing Meaningful
Rationales
As mentioned in the previous section, SDT based research has shown that
providing meaningful rationales for certain behavior also facilitates the internalization of
motivation to engage in such behavior thereby increasing autonomous motivation (Deci
et al. 1994; Reeve, Jang, Harde, and Omura 2002). This is because providing individuals
with information about the value or importance of such behavior aids individuals to
endorse this behavior and further incorporate it in their value systems (Deci and Ryan
2000).
In order to foster employees’ autonomous motivation to work, organizations need
to ensure that employees understand not only the organization’s objectives but also how
their effort can contribute to the ultimate attainment of those objectives. Unfortunately,
“businesses have become much more complex in recent years, making it more difficult
for individuals to comprehend organizational purpose and direction” (Simons 1995, p.
83). One important function of PMS is thus to communicate business objectives and
strategies to middle managers and employees (Ferreira and Otley 2005). Ferreira and
Otley (2005) further argue that such a communication process is as important as the
strategic planning. This paper thus proposes that when PMS (do not) effectively
communicate to employees the business objectives and how they can contribute to the
50
attainment of those objectives, employees are more (less) likely to be motivated by
autonomous motivation to work.
For instance, when employees understand well how various performance
measures relate to the final business objectives, they are more likely to be motivated by
autonomous motivation to work. On the contrary, if they do not see why performance
measures and targets are set the way they are, or if they view the target setting process as
arbitrary, then they are less likely to be motivated by autonomous motivation.
Compared with traditional performance measurement systems, SPMS appears to
be more effective in communicating business objectives to employees. As suggested by
Chenhall (2005, p. 396), one key characteristics of SPMS is it “provides an understanding
of cause-effect linkages between the operations and strategy and goals, and between
various aspects of the value chain including suppliers and customers.” The BSC literature
(e.g., Kaplan and Norton 1996) also maintains that when they develop SPMS based on
explicit business models, it is relatively easy for the organizations to communicate to
employees the missions and strategies and how they are to be achieved.
3.1.2 Consequences of Employees’ Autonomous and Controlled Motivation
This paper argues that employees’ willingness to extend their effort toward
prescribed behaviors does not guarantee the increase of firm value. Employees’ cognition
and behaviors such as the desire to acquire new knowledge and skills, tendency to take
the blame for inferior performance, and inclination to proactively influence strategy
formation, are at least as important. As shown in Figure 2, this paper thus includes the
above-mentioned cognitive and behavioral variables as consequences of employees’
51
autonomous and controlled motivation. In addition, following Gagné and Deci’s (2005)
SDT model of work motivation, this paper also includes affective variables as
consequences of employees’ motivation (see Figure 2). The conceptualization of those
consequence variables and how employees’ autonomous (vs. controlled) motivation
presumably impacts them are discussed as follows.
3.1.2.1 Role Orientation
Role orientation is one type of work orientation, which is a belief system
construed by employees about their work roles and work environment (Parker, Wall, and
Jackson 1997). Parker et al. (1997) identify two types of interrelated work orientations.
Strategic orientation is employees’ understanding, endorsement and internalization of the
organizations’ strategic objectives. Successful strategic transformation, such as the
adoption of Just-in-time (JIT) management, entails successful transformation of
employees’ strategic orientation (Parker et al. 1997). However, the change in strategic
orientation is not sufficient if the change of role orientation does not occur. The latter is
the instantiation of strategic orientation at the operational level. It includes first,
employees’ view of their work responsibilities (i.e., what problems or objectives they feel
that they are responsible for) and second, the degree to which they recognize the
importance of acquiring and employing new knowledge and skills.
Parker et al. (1997) further tests the effect of job autonomy support on the
transformation of employees’ strategic orientation and role orientation. Specifically, they
conducted field studies in two manufacturing companies that were going through
strategic changes. In the first company (study 2), training and communication were
52
provided to employees, but no initiatives were taken to enhance employees’ job
autonomy. Subsequently, only changes in strategic orientation, but not in role orientation,
were observed among the employees. In the second company (study 3), training was
provided coupled with autonomy-supportive initiatives (i.e., establishment of
autonomous work teams). Evidence shows that in the second company, employees not
only successfully transformed their strategic orientation but also broadened their role
orientation. Taking both studies together, Parker et al. (1997) conclude that work
autonomy is an important predictor of employees’ role orientation.
Based on Parker et al. (1997), this paper proposes that when employees are
motivated by autonomous (vs. controlled) motivation, they are more likely to develop
role orientation that keeps pace with the firm’s strategic changes. Specifically, when
motivated by autonomous (vs. controlled) motivation, they are more likely to broaden
their job responsibilities and to regard acquiring new knowledge and skills as an
important part of their job.
3.1.2.2 Self-Serving Attribution
Individuals can be vulnerable to the self-serving attributional bias, i.e., the
tendency to make greater attribution to personal factors for success than for failure (Ross
and Fletcher 1985; Pyszczynsk and Greeberg 1987). In other words, individuals tend to
take too much credit for superior performance and refute responsibility for poor
performance. In general, evidence supports the proposition that self-serving attribution is
mainly driven by the desire to protect one’s self-image (Pyszczynski, and Solomon 1982;
Greenberg 1991; Greenberg, Ditto and Lopez 1992). Self-serving attribution among
53
employees can be harmful to organizations’ performance. For example, it is found that
relationship conflict among coworkers occurs more often at times of low performance
(Peterson and Behfar 2003), and it is plausible that self-serving attribution is one
potential source of such conflict. Self-serving attributional bias may also lead to conflict
between subordinates and superiors. For instance, Wong-On-Wing, Guo, Li and Yang
(2007) find that executives and divisional managers differ in their attribution for the
latter’s poor performance.
Interestingly, Knee and Zuckerman (1996) find that individuals who are high in
autonomy causality orientation and low in control causality orientation are not vulnerable
to self-serving attributional bias. This result can be explained by an earlier finding that
those individuals tend to view unsolved problems as challenges to be mastered rather
than threats to their competence, i.e., they are to a lesser degree ego-involved (Koestner
and Zuckerman 1994). As a result, those individuals may feel a lesser need to make
biased attribution in order to protect their self-images.
Knee and Zuckerman’s (1996) study is limited to the effect of causality
orientation (which is a personality trait) on self-serving attribution. This paper extends
their study by examining the effect that autonomous (vs. controlled) work motivation
(which can be a motivational state) has on self-serving attribution. Specifically, it predicts
that employees’ autonomous (vs. controlled) work motivation is associated with a
relatively low tendency to make self-serving attribution for performance.
3.1.2.3 Proactive Work Behaviors
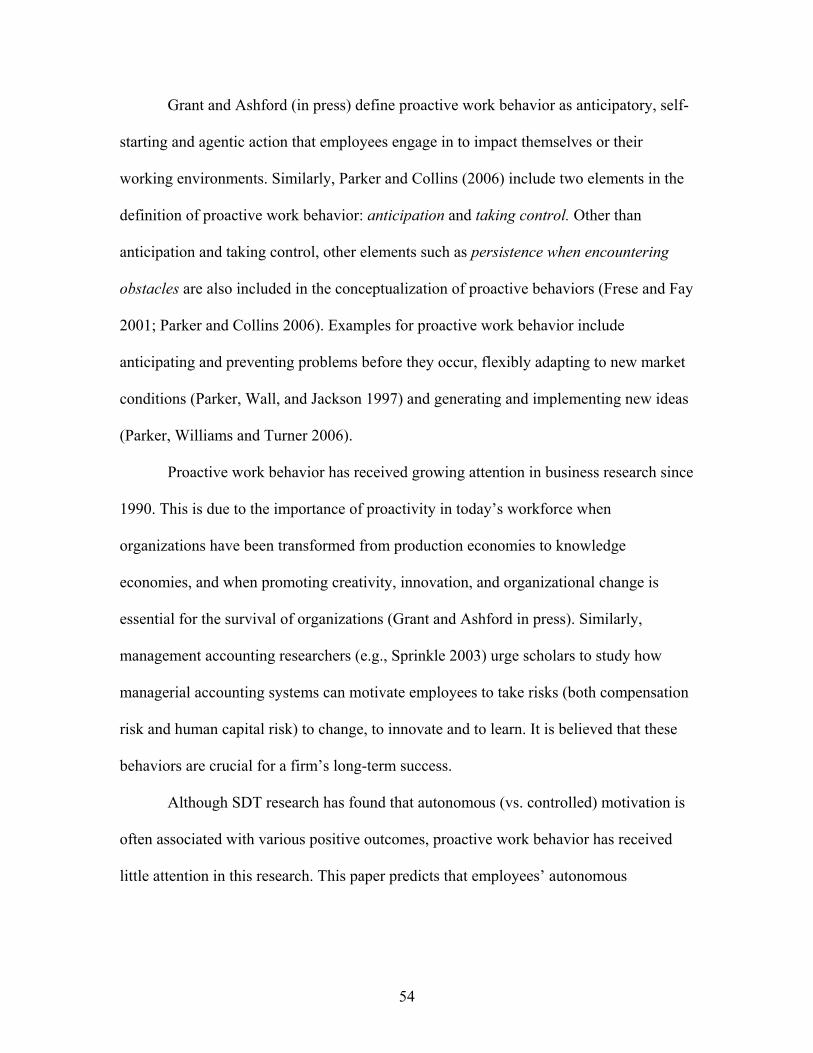
54
Grant and Ashford (in press) define proactive work behavior as anticipatory, self-
starting and agentic action that employees engage in to impact themselves or their
working environments. Similarly, Parker and Collins (2006) include two elements in the
definition of proactive work behavior: anticipation and taking control. Other than
anticipation and taking control, other elements such as persistence when encountering
obstacles are also included in the conceptualization of proactive behaviors (Frese and Fay
2001; Parker and Collins 2006). Examples for proactive work behavior include
anticipating and preventing problems before they occur, flexibly adapting to new market
conditions (Parker, Wall, and Jackson 1997) and generating and implementing new ideas
(Parker, Williams and Turner 2006).
Proactive work behavior has received growing attention in business research since
1990. This is due to the importance of proactivity in today’s workforce when
organizations have been transformed from production economies to knowledge
economies, and when promoting creativity, innovation, and organizational change is
essential for the survival of organizations (Grant and Ashford in press). Similarly,
management accounting researchers (e.g., Sprinkle 2003) urge scholars to study how
managerial accounting systems can motivate employees to take risks (both compensation
risk and human capital risk) to change, to innovate and to learn. It is believed that these
behaviors are crucial for a firm’s long-term success.
Although SDT research has found that autonomous (vs. controlled) motivation is
often associated with various positive outcomes, proactive work behavior has received
little attention in this research. This paper predicts that employees’ autonomous
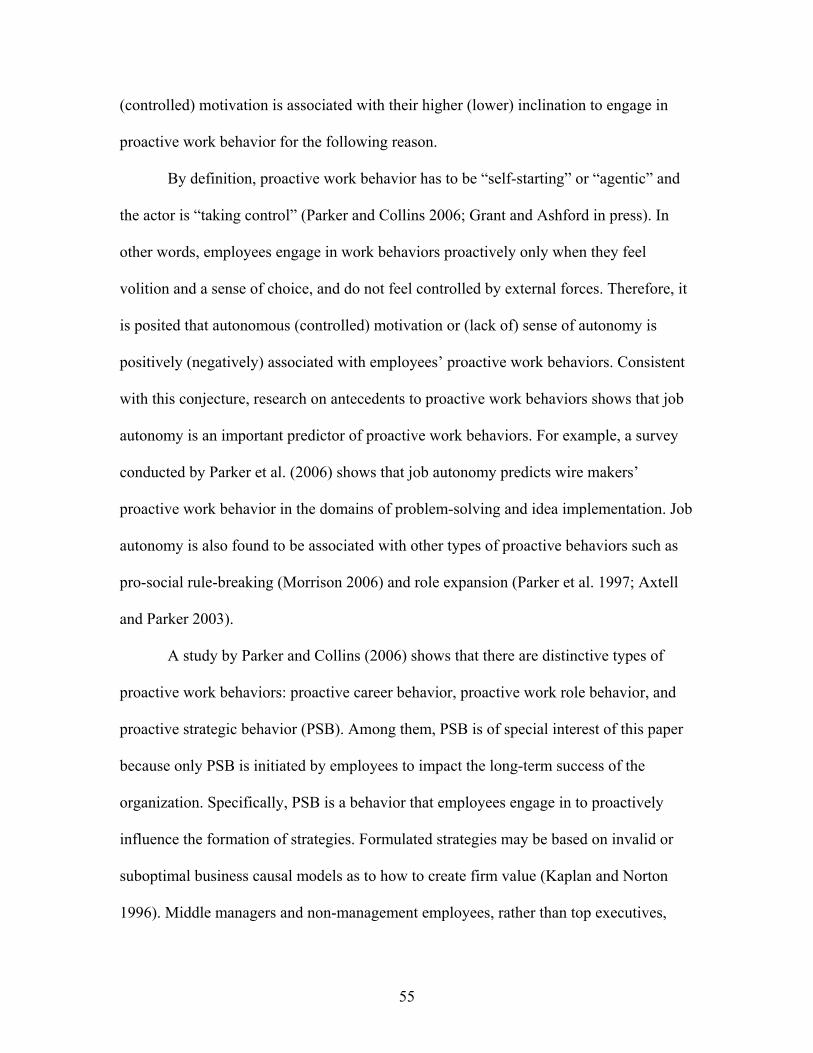
55
(controlled) motivation is associated with their higher (lower) inclination to engage in
proactive work behavior for the following reason.
By definition, proactive work behavior has to be “self-starting” or “agentic” and
the actor is “taking control” (Parker and Collins 2006; Grant and Ashford in press). In
other words, employees engage in work behaviors proactively only when they feel
volition and a sense of choice, and do not feel controlled by external forces. Therefore, it
is posited that autonomous (controlled) motivation or (lack of) sense of autonomy is
positively (negatively) associated with employees’ proactive work behaviors. Consistent
with this conjecture, research on antecedents to proactive work behaviors shows that job
autonomy is an important predictor of proactive work behaviors. For example, a survey
conducted by Parker et al. (2006) shows that job autonomy predicts wire makers’
proactive work behavior in the domains of problem-solving and idea implementation. Job
autonomy is also found to be associated with other types of proactive behaviors such as
pro-social rule-breaking (Morrison 2006) and role expansion (Parker et al. 1997; Axtell
and Parker 2003).
A study by Parker and Collins (2006) shows that there are distinctive types of
proactive work behaviors: proactive career behavior, proactive work role behavior, and
proactive strategic behavior (PSB). Among them, PSB is of special interest of this paper
because only PSB is initiated by employees to impact the long-term success of the
organization. Specifically, PSB is a behavior that employees engage in to proactively
influence the formation of strategies. Formulated strategies may be based on invalid or
suboptimal business causal models as to how to create firm value (Kaplan and Norton
1996). Middle managers and non-management employees, rather than top executives,
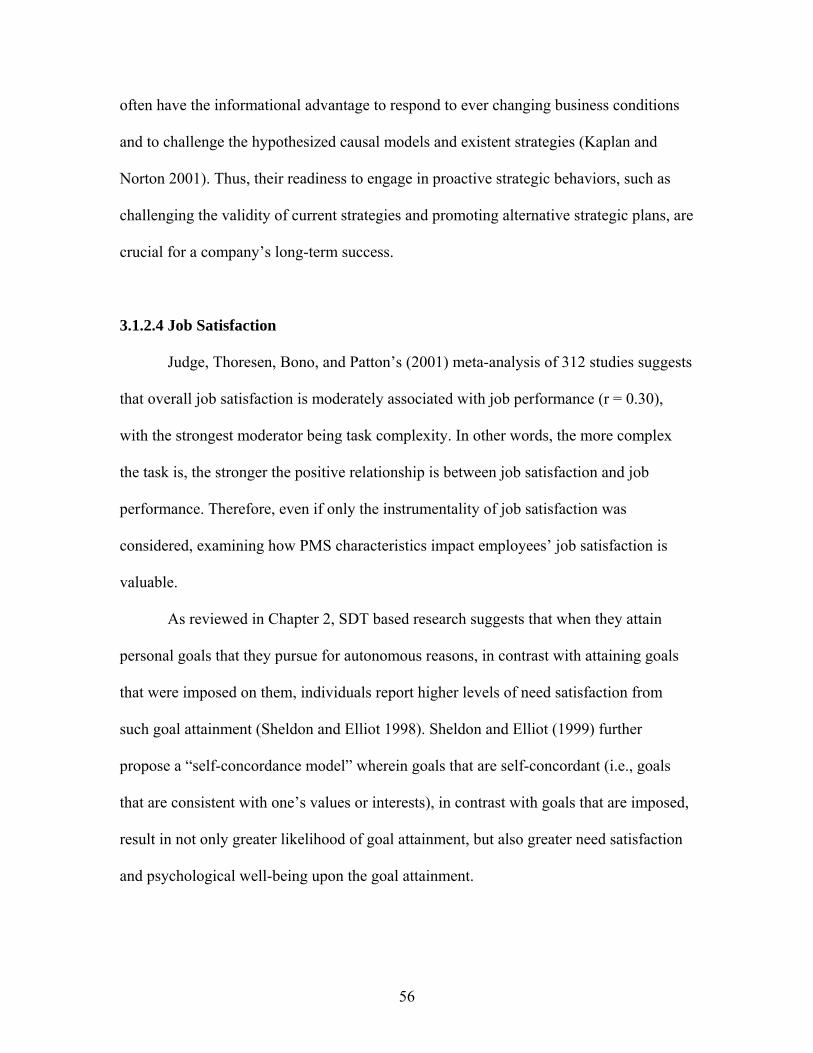
56
often have the informational advantage to respond to ever changing business conditions
and to challenge the hypothesized causal models and existent strategies (Kaplan and
Norton 2001). Thus, their readiness to engage in proactive strategic behaviors, such as
challenging the validity of current strategies and promoting alternative strategic plans, are
crucial for a company’s long-term success.
3.1.2.4 Job Satisfaction
Judge, Thoresen, Bono, and Patton’s (2001) meta-analysis of 312 studies suggests
that overall job satisfaction is moderately associated with job performance (r = 0.30),
with the strongest moderator being task complexity. In other words, the more complex
the task is, the stronger the positive relationship is between job satisfaction and job
performance. Therefore, even if only the instrumentality of job satisfaction was
considered, examining how PMS characteristics impact employees’ job satisfaction is
valuable.
As reviewed in Chapter 2, SDT based research suggests that when they attain
personal goals that they pursue for autonomous reasons, in contrast with attaining goals
that were imposed on them, individuals report higher levels of need satisfaction from
such goal attainment (Sheldon and Elliot 1998). Sheldon and Elliot (1999) further
propose a “self-concordance model” wherein goals that are self-concordant (i.e., goals
that are consistent with one’s values or interests), in contrast with goals that are imposed,
result in not only greater likelihood of goal attainment, but also greater need satisfaction
and psychological well-being upon the goal attainment.
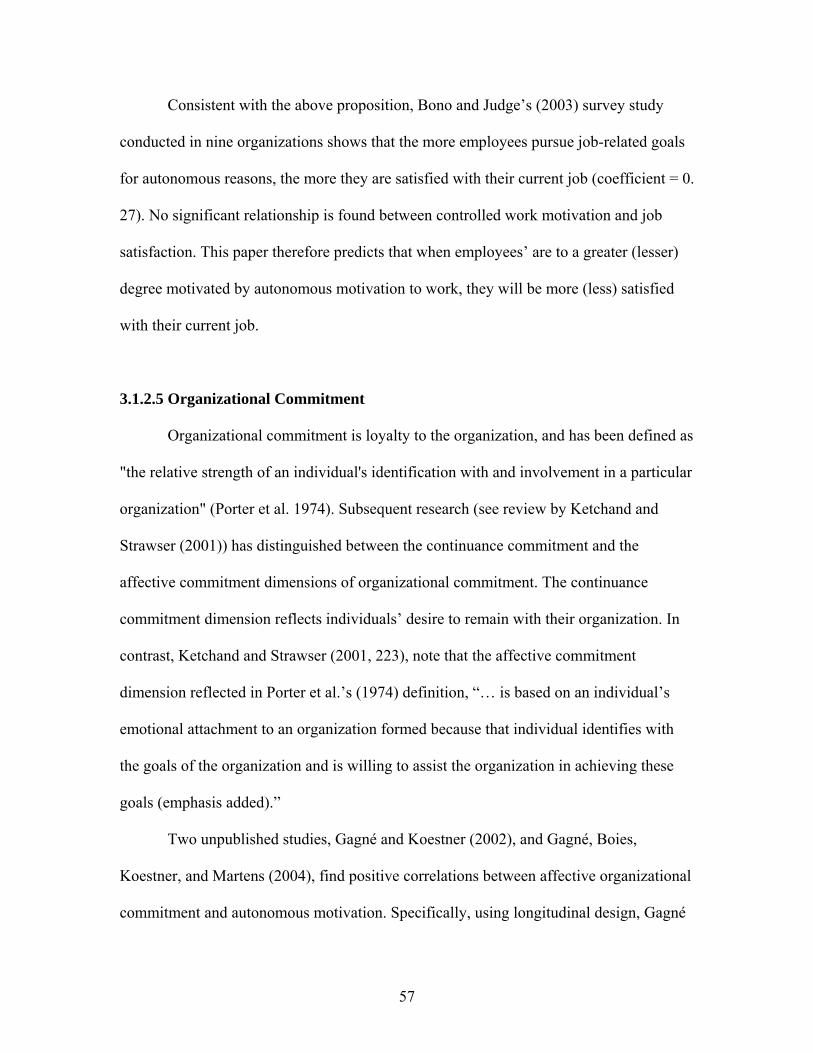
57
Consistent with the above proposition, Bono and Judge’s (2003) survey study
conducted in nine organizations shows that the more employees pursue job-related goals
for autonomous reasons, the more they are satisfied with their current job (coefficient = 0.
27). No significant relationship is found between controlled work motivation and job
satisfaction. This paper therefore predicts that when employees’ are to a greater (lesser)
degree motivated by autonomous motivation to work, they will be more (less) satisfied
with their current job.
3.1.2.5 Organizational Commitment
Organizational commitment is loyalty to the organization, and has been defined as
"the relative strength of an individual's identification with and involvement in a particular
organization" (Porter et al. 1974). Subsequent research (see review by Ketchand and
Strawser (2001)) has distinguished between the continuance commitment and the
affective commitment dimensions of organizational commitment. The continuance
commitment dimension reflects individuals’ desire to remain with their organization. In
contrast, Ketchand and Strawser (2001, 223), note that the affective commitment
dimension reflected in Porter et al.’s (1974) definition, “… is based on an individual’s
emotional attachment to an organization formed because that individual identifies with
the goals of the organization and is willing to assist the organization in achieving these
goals (emphasis added).”
Two unpublished studies, Gagné and Koestner (2002), and Gagné, Boies,
Koestner, and Martens (2004), find positive correlations between affective organizational
commitment and autonomous motivation. Specifically, using longitudinal design, Gagné
58
and Koestner (2002) demonstrate that autonomous motivation at the beginning of the
study predicts organizational commitment at the end of the study. In this study,
organizational commitment is operationalized as the “identification” and “internalization”
dimensions of organizational commitment introduced by O’Reilly and Chatman (1986)7.
Gagné et al. (2004) conduct three cross-sectional survey studies, all of which show that
autonomous motivation positively correlates with affective organizational commitment,
as defined by Allen and Meyer (1996).
In addition, Bono and Judge (2003) reviewed in the previous section show that the
more employees pursue job-related goals for autonomous reasons, the more they are
committed to their organization (coefficient = 0.23). Similar with Gagné et al. (2004), the
organizational commitment in this study is operationalized as affective organizational
commitment, as defined by Allen and Meyer (1996).
Consistent with the above-mentioned literature, this paper predicts that when
employees’ are to a greater (lesser) degree motivated by autonomous motivation to work,
they will demonstrate greater (lower) level of affective organizational commitment.
3.2 The Hypotheses
Six testable hypotheses are developed based on the motivational model of PMS
(see Figure 2). Those hypotheses are summarized in Figure 3. The sign beside each
hypothesis indicates the expected direction of the relationship. Note that compared with
the motivational model, the hypotheses are more specific and thus more narrow in terms
of research scope. In particular, only one dimension of role motivation (i.e., recognition
7 According to O’Reilly and Chatman (1986)’s conceptualization, the third dimension of organizational commitment is compliance. This dimension is believed to be related to controlled motivation rather than autonomous motivation, specifically, to be related to external regulation (Gagné and Deci 2005).
59
of the importance of acquiring new knowledge and skills), self-serving attribution, and
one form of proactive work behaviors (i.e., PSB) are examined as consequence variables
of employees’ autonomous (vs. controlled) motivation. Affective consequences such as
job satisfaction and organizational commitment are not examined empirically by this
paper.
------------------------------ Insert Figure 3 Here
------------------------------
The first three hypotheses (H1, H2 and H3) predict the relationship between PMS
characteristics and employees’ autonomous and controlled motivation to work. Based on
the conflicting predictions provided by CET on performance-contingent reward and
Eisenberger and his colleagues on the same topic, this paper proposes the following two
opposite hypotheses with regard to the effect of alignment between reward systems and
performance measurement systems.
H1a: The more (less) reward systems are aligned with performance measurement systems, the more (less) employees will be motivated by autonomous (vs. controlled) motivation to work. H1b: The more (less) reward systems are aligned with performance measurement systems, the less (more) employees will be motivated by autonomous (vs. controlled) motivation to work.
SDT research in both work and non-work settings suggests that when individuals
are provided with the opportunity to make important decisions and when their feelings
and perspectives are well acknowledged, they are more likely to act out of autonomous
motivation. Applying this literature to PMS research, this paper proposes H2 as follows.
H2: The more (less) involved employees are in PMS related decision making, the more (less) they will be motivated by autonomous (vs. controlled) motivation to work.
60
Based on research on how providing rationales for certain actions can facilitate
the internalization of extrinsic motivation, this paper proposes H3 as follows.
H3: The more (less) effective the PMS are in communicating business objectives to the employees, the more (less) they will be motivated by autonomous (vs. controlled) motivation to work.
The remaining three hypotheses (H4, H5, and H6) relate to the potential
consequences of employees’ autonomous and controlled motivation. Mainly based on
Parker and her colleagues’ research on role orientation, H4 predicts that autonomous (vs.
controlled) work motivation facilitates the transformation of one dimension of
employees’ role orientation (i.e., the degree to which they recognize the importance of
acquiring new knowledge and skills).
H4: When they are more (less) motivated by autonomous (vs. controlled) motivation to work, employees will to a greater (less) degree broaden their role orientation such that they to a greater (less) degree recognize the importance of acquiring new knowledge and skills.
Based on Knee and Zuckerman’s (1996) research on causality orientation and
self-serving attribution, H5 predicts that autonomous (vs. controlled) work motivation
results in employees’ lower vulnerability to self-serving attributional bias.
H5: When they are more (less) motivated by autonomous (vs. controlled) motivation to work, employees will be less (more) likely to make self-serving attribution for performance.
Based on SDT, H6 predicts that autonomous (vs. controlled) work motivation
leads to employees’ greater tendency to engage in one type of proactive work behavior,
i.e., PSB. Recall that among three types of proactive work behavior only PSB is initiated
by employees to impact the long-term success of the organization.
H6: When they are more (less) motivated by autonomous (vs. controlled) motivation to work, employees will be more (less) likely to engage in proactive strategic behavior.
61
In summary, this paper applies SDT to performance management systems (PMS)
research, and argues that characteristics of PMS can either foster or forestall employees’
autonomous work motivation. Those characteristics include but are not restricted to the
alignment between reward systems and performance measurement systems, the
employees’ participation in PMS related decision making, and the effectiveness of PMS
in communicating business objectives to the employees. These PMS characteristics will
in turn influence important variables such as employees’ role orientation, attribution
tendency, proactivity, job satisfaction and organizational commitment. A motivational
model of PMS (see Figure 2) is proposed to incorporate the abovementioned relations.
Based on this model, six testable hypotheses are developed (see Figure 3). In Chapter 4,
two studies are presented to test the hypotheses.
62
CHAPTER FOUR
METHODOLOGY
Chapter 4 presents two studies that were designed to test the six hypotheses
developed in Chapter 3. Study 1 tested H1, H2, H3, H4 and H5 by conducting structural
equation modeling (SEM) analyses of survey data available from a separate research
project. Study 2 contained a case-based experiment and tested H1, H2 and H6.
4.1 Study 1: Structural Equation Modeling (SEM) Analysis of Survey Data
4.1.1 Overview
The data used in Study 1 was from a separate research project conducted by Lui,
Wong-On-Wing, and Guo (2006). This research project consisted of a series of self-
reported questionnaires. Students enrolled in evening business classes at a university in
Hong Kong responded to those questionnaires. The variables that were of interest in the
study were a segment of the variables that were measured in that study. Specifically, the
current study used data on characteristics of PMS, autonomous and controlled work
motivation, and various outcome variables of autonomous and controlled motivation.
Other responses that were elicited but not included in the analyses of this study involved
internal controls and fraud related issues.
Self-report questionnaires have been criticized for their vulnerability to
contaminations such as social desirability and selective memory (Howard 1994).
However, as noted by Spector (1994), self-reports provide good insight in individuals’
feelings and perception about their job environment, and they are especially useful for
exploratory studies. In addition, there are serious problems that are associated with
63
alternative strategies such as physiological measures, behavioral measures and third-party
ratings (Howard 1994). For example, third-party raters, such as superiors and colleagues,
are vulnerable to observational bias and halo effect (Lance, 1994; Lance, Lapointe, and
Stewart 1994; Woehr, 1994). Frese, Fay, Hilburger, Leng, and Tag (1997) also argue that
since proactive work behavior is often viewed negatively by superiors and colleagues,
self-report may be a more accurate measure of proactive work behavior than third-party
rating. Therefore, it is believed that self-report questionnaire is appropriate for the type of
research questions this paper is to address.
Confirmatory factor analysis (CFA) was first conducted to confirm the factorial
structure of a newly developed scale that measured characteristics of PMS. CFA or
exploratory factor analysis (EFA, conducted for less established measures) were then
conducted to ensure the uni-dimensionality of the other measures. A structural model was
subsequently estimated to test the hypothesized relations between characteristics of PMS
and autonomous (vs. controlled) motivation, and between autonomous (vs. controlled)
motivation and consequence variables.
4.1.2 Survey Respondents
In management control systems research, there is a debate between drawing
respondents from different organizations (e.g. Merchant and Manzoni 1989) versus from
one organization (e.g., Otley and Pollanen 2000). Both methods have their strengths and
weaknesses. As noted by Otley and Pollanen (2000), drawing respondents from a wide
range of different organizations allows results to be generalized, whereas restricting
sampling to one organization better controls for the differences in management control
64
practices that exist in different organizations. This paper examines how management
control systems, PMS in particular, impact employees’ motivation and other
consequences. Therefore, the current study used data that was obtained from employees
of different organizations with the intention to capture variance in management control
systems rather than to control for it.
The survey responses used by the study were provided by 135 students enrolled in
evening business classes at a university of Hong Kong. The companies they worked for
were in different industries. Fifty two percent of the respondents were male, and the
average age was 32.6 years (SD=6.58). On average, they had worked at their current
positions for 4.2 years (SD=2.83), and the average length of job tenure was 6.4 years
(SD=4.17). Fifty five percent of them held management positions. The respondents
completed the survey as part of the class requirement and were not compensated.
4.1.3 Measurement of Variables
4.1.3.1 Characteristics of PMS (CPMS) Scale
A 10-item scale (i.e., the CPMS scale, see Table 1) developed by Lui et al. (2006)
was used to measure the characteristics of PMS. This scale consisted of three subscales:
(1) Participative decision making in PMS (Participation subscale), i.e., the degree to
which employees participate in the process of performance measure selection, goal
setting, and performance appraisal. (2) Communicating business objectives
(Communication subscale), i.e., the degree to which PMS provide employees with
information about how performance measures are related to business objectives and why
certain measures or targets are chosen to measure their performance. (3) Performance-
65
reward contingency (Contingency subscale), i.e., the degree to which the rewards
(punishment) employees receive are contingent on their measured performance. The
rewards include both financial (e.g., obtaining bigger bonus and departmental budget)
and non-financial (e.g., reputation and recognition) ones.
------------------------------ Insert Table 1 Here
------------------------------
Respondents indicated the extent to which they agreed with each item by
responding to a 7- point Likert scale ranging from 1 (strongly disagree) to 7 (strongly
agree). A sample item for the Participation subscale was “I am very frequently asked to
participate in choosing the criteria used to evaluate my performance”; a sample item for
the Communication subscale was “measures of my performance seem to be unrelated to
my department goals (reverse)”; and a sample item for the Contingency subscale was “it
is extremely important for me to achieve my performance targets if I want to obtain
financial rewards such as salary increases or bonuses.”
Based on a survey administered to a development sample, Lui et al. (2006) found
that the CPMS scale had adequate internal reliability, discriminant validity, and
predictive or criterion validity. Specifically, the standard Cronbach’s alpha for the
Participation, Communication, and Contingency subscales were 0.77, 0.84, and 0.80,
respectively. The three subscales measured distinct latent constructs that were different
from superiors’ autonomy support. The factor scores of the Communication and
Participation subscales positively predicted employees’ basic psychological need
satisfaction, while that of the Contingency subscale was negatively associated with the
satisfaction of their need for relatedness. Since the CPMS scale has not been used by
66
prior research, the current study validated the scale’s factorial structure before it was used
for hypotheses testing.
4.1.3.2 Confirmatory Factory Analysis of the CPMS Scale
A CFA was performed on a three-factor measurement model of the CPMS scale
(see Figure 4). The specification of this CFA model was based on the EFA results of this
scale obtained by Lui et al. (2006). The following indices were used to evaluate the fit of
this model: Chi-square significance (Bollen 1989), χ²/degree of freedom ratio (χ²/df;
Wheaton, Muthen, Alwin, and Summers 1977), normed fit index (NFI; Bentler and
Bonett 1980), comparative fit index (CFI; Bentler 1990), Tucker-Lewis index (TLI;
Tucker and Lewis 1973), and root mean square error of approximation (RMSEA; Steiger
and Lind 1980). An insignificant probability associated with Chi-square (Bollen 1989),
NFI, CFI and TLI close to or greater than 0.95 (Hu and Bentler 1999), and RMSEA value
less than 0.05 (Browne and Cudeck 1993) indicate a superior fit. However, as Hu and
Bentler (1999) noted, when sample size is small, the RMSEA value may over reject true
models. More liberal cutoff criteria for the RMSEA value were proposed. For example,
when the RMSEA value ranges from 0.05 to 0.08, the model is believed to provide a
reasonable fit (Browne and Cudeck 1993), and when it ranges from 0.08 to 0.10, the
model is believed to provide a mediocre fit (MacCallum, Browne, and Sugawara 1996).
AMOS program was used to conduct the CFA.
------------------------------ Insert Figure 4 Here
------------------------------
67
The initial model for CPMS did not provide a satisfactory fit (Chi-square [df=32]
=103.96, p<0.01; χ²/df=3.25; NFI=0.97; CFI=0.98; TLI=0.97; RMSEA=0.13) (see Figure
5A). To improve the overall model fit, item 10 was deleted from the model. The
rationale follows. The modification indices provided by AMOS program suggested that
by allowing item 10 to cross-load on the Communication factor (factor loading = -0.37),
and/or letting the error term associated with item 10 (i.e., e10) correlate with the error
term associated with item 7 (i.e., e7) (correlation = -0.69), the model fit could be
significantly improved. However, these suggested modifications appeared to be arbitrary
and not substantively meaningful. Therefore, item 10 was simply dropped. After
removing item 10, the revised model provided a better fit (Chi-square [df=24] =65.42;
p<0.01; χ²/df=2.73; NFI=0.98; CFI=0.99; TLI=0.98; RMSEA=0.11) (see Figure 5B).
------------------------------ Insert Figure 5 Here
------------------------------
As shown in Figure 5B, the item loadings were all over 0.50 and significant at the
0.01 level. The Participation factor score positively correlated with both the
Communication factor score (correlation=0.39, p<0.01) and the Contingency factor score
(correlation=0.44, p<0.01). The correlation between Communication and Contingency
factor scores was not significant (correlation=0.17, p=0.12). The standard Cronbach’s
alphas for the Participation subscale (item 1, 2, and 3), Communication subscale (item 4,
5, and 6), and Contingency subscale (item 7, 8, and 9) were 0.79, 0.72, and 0.77,
respectively.
4.1.3.3 Measurement of Other Variables
68
Superior’s Autonomy Support
To evaluate whether characteristics of the PMS had an effect on employees’
autonomous and controlled motivation beyond the effect of their Superiors’ Autonomy
Support, the responses to the latter were included in the data analysis. The six-item short
version of Work Climate Questionnaire (WCQ, Baard et al. 2004, see Table 2) measured
the degree to which employees perceived their superiors’ interpersonal style to be
autonomy supportive. On a 7- point Likert scale, respondents indicated the extent to
which they agreed with the description of their experience with their superior. A sample
item was “I feel that my manager provides me choices and options.” WCQ has been
found to be a reliable measure and it predicts satisfaction of employees’ needs for
autonomy, competence and relatedness, and in turn predicts employees’ performance as
well as their psychological well-being (Baard et al. 2004).
------------------------------ Insert Table 2 Here
------------------------------
The standard Cronbach’s alpha of this scale was 0.91. CFA conducted on a one-
factor measurement model indicated that all six items loaded on one factor and item
loadings were all over 0.65.
Autonomous and Controlled Motivation
Autonomous and controlled motivation were measured following the SDT
literature (e.g., Grolnick and Ryan 1987; Sheldon and Kasser 1998; and Sheldon and
Elliot 1999) with minor changes of wording specified as follows. Respondents indicated
69
on 9-point scales the extent to which they tried to achieve their departmental goal(s)8
because of the following four reasons: “somebody else wants you to or thinks you ought
to, or because you’ll get something from somebody if you do” (external regulation),
“because you would feel ashamed, guilty, or anxious if you didn’t” (introjected
regulation), “because you really believe that it’s an important goal to have” (identified
regulation), and “because of the fun and enjoyment which the goal provides you”
(intrinsic motivation). The first two types of regulations are controlled types of
motivation and the last two are autonomous types of motivation. The relative autonomy
index (RAI, Grolnick and Ryan, 1987) was derived to measure the strength of
autonomous motivation relative to controlled motivation. Specifically, RAI was a linear
function of the four scores, i.e., RAI = (-2)*external regulation + (-1)*introjected
regulation + (1)*identified regulation + (2)*intrinsic motivation.9
Goal Commitment
One fundamental notion of SDT is that not only the amount, but also the nature,
of individuals’ motivation matters (Gagné and Deci 2005). This paper thus argues that to
test the unique effect of the nature of work motivation (i.e., autonomous vs. controlled
motivation), the effect of the amount of motivation should be ruled out. In other words, it
is important to demonstrate autonomous (vs. controlled) work motivation predicts
outcome variables beyond the amount of motivation. This paper uses employees’ goal
8 Before the respondents answered the questions on autonomous and controlled motivation, they were asked to indicate the department they were working for, describe the major function(s) of their department, and to describe the most important goal(s) for their department to achieve during that year. 9 Noteworthy, Vansteenkiste, Zhou, Lens, and Soenens (2005) recommend breaking the overall measure of RAI into autonomous and controlled motivation because the two types of motivation are predictors of distinctive behavioral outcomes. But RAI is still the most common measure of autonomous (vs. controlled) motivation in the SDT literature. Study 2 of this paper used two separate measures to test the hypotheses, i.e., the Autonomous Motivation (AM) and the Controlled Motivation (CM). For details, see section 4.2.6.
70
commitment as the proxy for the amount of motivation (in contrast to the type of
motivation) for the following reasons.
Goal commitment is defined as an individual’s determination to achieve a certain
goal (Locke and Latham 1990). It has been viewed as one of the central concepts in the
goal-setting literature because numerous empirical studies have found that especially
when the goal is difficult, goal commitment is a strong predictor of performance (Klein et
al. 1999). As discussed in Chapter 2, goal-setting theory does not differentiate among the
various forms of motivation underlying goal pursuits (Gagné and Deci 2005). As a result,
under goal-setting theory, the conceptualization of goal commitment denotes mainly
individuals’ amount of determination to achieve goals without directly tapping the
motives behind such determination. According to Klein et al. (2001), this concept
embraces the following three elements: “the intention to extend effort toward goal
attainment,” “persistence in pursuing that goal over time,” and “an unwillingness to lower
or abandon that goal” (p. 34).
The meaning of goal commitment is more evident when one considers its
antecedents. Using an expectancy theory framework, Hollenbeck and Klein (1987)
propose that the central antecedents to goal commitment are the expectancy and the
attractiveness of goal attainment. The positive relations between these two antecedents
and goal commitment are later confirmed by a meta-analysis of 83 studies (Klein et al.
1999). Based on the above, this paper holds that goal commitment, as defined by goal-
setting theorists, mainly captures the amount of motivation to achieve a goal, and not the
form of such motivation.
71
Although it is believed that Goal Commitment is distinct from the type of
motivation, it is possible that positive association exists between the two constructs. First
of all, Sheldon and Kasser (1998) find that autonomous motivation leads to greater level
of persistence during goal pursuits. Second, volition in the goal setting process and
supervisor supportiveness are believed to be distal predictors of goal commitment
(Hollenbeck and Klein 1987). Based on SDT, volition at work and supervisor
supportiveness will result in higher level of autonomous (vs. controlled) work motivation.
Therefore, it is likely that volition and supervisor supportiveness increase the level of
goal commitment through the enhancement of autonomous (vs. controlled) motivation.
Based on the above reasoning, this study expects that autonomous (vs. controlled)
motivation is positively associated with Goal Commitment.
The five-item short version of the Goal Commitment scale developed by
Hollenbeck, Williams, and Klein (1989) was used. The short version was preferred over
the long version because it was found to be “unidimensional and equivalent across
measurement timing, goal origin, and task complexity” (Klein et al. 2001, p. 33). The
word “goal” in the original instrument was replaced by “department goal(s)” to fit with
the current context.
The standard Cronbach’s alpha of this 5-point Likert scale was 0.92 in the current
study. CFA conducted on a one-factor measurement model indicated that all five items
loaded on one factor and item loadings were all over 0.70.
Role Orientation: The Importance of Knowledge and Skills
Responses to a sixteen-item Role orientation (Knowledge) scale developed by
Parker et al. (1997) (see Table 3) were used to test H4. Respondents were asked to
72
evaluate on a 7-point Likert scale, how important certain skills and knowledge were in
order for them to do their job effectively. For example, item 2 was “being able to measure
and analyze problems in the production process,” and item 9 “knowing the root causes of
production problems that occur.” Since the original scale was developed for
manufacturing settings, it was reworded so that it could be used among respondents
working in various industries. Specifically, the word “production” was replaced by the
word “work” in item 1, 2, and 3, and the word “products” was replaced by “goods and/or
services” in item 13. In addition, in Parker et al. (1997), item 4 used in their Study 1 (i.e.,
“being able to make decisions as part of a group”) was different from item 4 used in their
study 3 (e.g., “knowing how to assess the performance of the work group”). Both items
were measured.
------------------------------ Insert Table 3 Here
------------------------------
The standard Cronbach’s alpha of this 16-item scale was 0.98 in this study. Given
that Parker et al. (1997) did not conduct factor analysis on this scale and it had not been
used by prior research, EFA was conducted to ensure its uni-dimensionality. Specifically,
principal component analysis with oblimin rotation was used. Two eigenvalues greater
than one (12.51 and 1.17) were derived. All items but item 12 (factor loading=0.03) and
item 15 (factor loading=-0.07) significantly loaded on the first factor with factor loadings
greater than 0.45. Item 12 and item 15 were therefore deleted. EFA was conducted again
on the remaining 14 items and only one eigenvalue greater than one (11.76) was derived
suggesting that the revised scale was uni-dimensional. After removing item 12 and 15,
the standard Cronbach’s alpha of the scale was 0.98.
73
Strategic Orientation
Besides Role orientation (Knowledge), Strategic Orientation was also included in
the SEM analysis. The reasons for including it in the analysis follow. First, as mentioned
in Chapter 3, Parker et al. (1997) found that job autonomy was critical for broadening
employees’ role orientation, but not for transforming their strategic orientation. Strategic
Orientation was thus included in the structural model to examine whether autonomous
(vs. controlled) motivation only had an effect on Role Orientation (Knowledge), but not
on Strategic Orientation. Second, Parker et al. (1997) also noted that successful
transformation of employees’ strategic orientation was a necessary but not sufficient
condition for broadening their role orientation. Supposedly, by including Strategic
Orientation as a predictor of Role Orientation, more variance of Role Orientation can be
explained by the model.
The 10-item Strategic Orientation scale developed by Parker et al. (1997, study 3,
see Table 4) was measured. Respondents indicated on 7-point Likert scales the degree to
which they agreed with various beliefs about work in general. All the items were reverse-
worded, i.e., lower responses indicated their beliefs about work that match modernized
organizations. For example, item 1 was “in the long run, work is more efficient if people
stick to what they already know, rather than learning new things (reverse),” and item 9
was “if I know what to do and how to do it, I am not concerned about why (reverse).”
Similar with the Role Orientation (Knowledge), the original scale of Strategic Orientation
was developed for manufacturing companies. It was reworded so that it could be used
among respondents working in different industries. Specifically, the word “production”
was replaced by the word “work” in item 1, and item 5 was changed from “it is important
74
to keep making products, even if they go into stock rather than directly to customers” to
“it is important for the company to maintain its productivity even when business is slow.”
------------------------------ Insert Table 4 Here
------------------------------
The standard Cronbach’s alpha of this scale was only 0.06 compared with 0.79
reported by Parker et al. (1997)10. To improve the internal reliability of this scale, item 5,
6 and 7 were first deleted due to their negative or zero item-total correlations (-0.78, -0.53
and 0 for item 5, 6, and 7, respectively)11. After the deletion, the standard Cronbach’s
alpha of the scale rose to 0.72.
To ensure the uni-dimensionality of this scale, EFA was conducted using
principal component analysis with oblimin rotation. Two eigenvalues greater than one
(2.88 and 1.33) were derived. Specifically, item 1, 2, 9 only loaded on the first factor;
item 4 and 10 only loaded on the second factor, and item 3 and 8 loaded on both factors.
It appears that this scale may not be uni-dimensional. A series of CFA’s were thus
conducted to compare variations of one-factor models with variations of two-factor
models. In all variations of two-factor models, a few item loadings were lower than the
10 Parker et al. (1997)’s strategic orientation scale was developed for manufacturing firms that are going through modernization such as implementing Just-In-Time production. However, by definition, strategic orientation is employees’ endorsement and internalization of the organization’s strategic objectives. Thus, in theory, the measure of strategic orientation should vary organization by organization because different organizations have different strategic objectives. The respondents in current study were from different organizations but only one measure of strategic orientation was used. This was possibly why the psychometrics of this scale was poor in this study. Besides the poor internal reliability, the item means and variances of the scale items were far from ideal. Specifically, most items tended to have small variances (lower than 0.9) with means near the lower end (lower than 3). 11 It seems reasonable to question the validity of item 6 (“I could do my job perfectly well without knowing the company’s overall objectives.”) and item 7 (“I find it reassuring if there is always a large pile of work waiting for me to work on.”) because Parker et al. (1997) used different item 6 and item 7 in study one compared with in study 1 and 2.
75
acceptable level of 0.4. One variation of the one-factor model12 appeared to be overall
superior to other models in terms of parsimony, model fit and factor loadings.
Specifically, this model provided a better fit (Chi-square [df=12] =34.65; p<0.01;
χ²/df=2.89; NFI=0.99; CFI=0.99; TLI=0.98; RMSEA=0.12) than did other models, and
factor loadings of all items, except for that of item 4 (factor loading = 0.24), were above
0.40.
Based on the above analyses, item 4 was then deleted so that the remained six-
item scale could be uni-dimensional. The standard Cronbach’s alpha of this 6-item scale
was 0.77.
Self-Serving Attribution
H5 predicts that employees who to a great degree are motivated by autonomous
(vs. controlled) motivation are less vulnerable to self-serving attributional bias, which is
the tendency to attribute more to internal factors for good performance and less to
internal factors for poor performance. Internal attribution was measured following
Weiner’s (1980, 1992) framework. Specifically, respondents first rated their recent
performance on a 9-point scale (1 to 3 represented below average, 4 to 6 represented
average, and 7 to 9 represented above average). Subsequently they attributed their
performance to two internal factors (i.e., ability and effort) and two external factors (i.e.,
luck and task difficulty). Specifically, they allocated 100 points among those four factors
according to their relative importance in determining their recent performance. The
percentage of points assigned to ability and effort represents one’s internal attribution.
12 In this model, the following two correlations were estimated: the correlation between the error term associated with item 2 and that associated with item 9, and the correlation between the error term associated with item 1 and that associated with item 3. The estimated correlations were 0.53 and -0.22, respectively.
76
When regressing the internal attribution score on self-rated performance, a positive and
significant (a negative or insignificant) standard coefficient for performance would
suggest the presence (absence) of self-serving attribution bias.
Task Uncertainty
Task Uncertainty was included in the analysis as a potential moderator on the
relation between autonomous (vs. controlled) motivation and various consequence
variables. The reason for doing so follows. After surveying scores of SDT based studies,
Gagné and Deci (2005) conclude that autonomous motivation enhances effective
performance and individuals’ well-being “particularly if the task requires creativity,
cognitive flexibility, or deep processing of information” (p. 341). In current context,
autonomous work motivation may be especially important for employees whose job
related tasks are novel and uncertain, rather than routine and structured. The moderating
effects of Task Uncertainty were therefore examined in this study.13
Task Uncertainty was measured using a 10-item scale developed by Withey
(1983). This scale has been used in multiple accounting studies such as Brownell and
Hirst (1986) and Lau, Low and Eggleton (1995). It included two subscales: exceptions
and analyzability, each of which consisted of five items. Respondents indicated on 7-
point Likert scales the degree to which they thought those items were descriptive of their
work. All items were reverse-worded so that the lower the responses, the more
respondents viewed their job related tasks as uncertain. A sample item for the exceptions
subscale was “to what extent would you say your work is routine (reverse),” and a sample
13 This research approach is consistent with prior studies that investigate how task uncertainty and/or job difficulty interact with participative budgeting and impact performance and other outcome variables (e.g., Brownell and Hirst 1986; Mia 1989; Brownell and Dunk 1991; Lau, Low and Eggleton 1995).
77
item for the analyzability subscale was “to what extent is there a clearly known way to do
the major types of work you normally encounter (reverse)”?
The standard Cronbach’s alpha of the scale was 0.86. A two-factor CFA model
was then estimated to confirm its factorial structure. The model reached a good fit and all
items loadings were over 0.60. Note that the uni-dimensionality was not important for the
Task Uncertainty scale because it was not included in the structure model (for the method
to test the moderating effects of Task Uncertainty, see section 5.1.4).
4.1.4 Theoretical Structural Model
The theoretical model presented in Figure 6 was evaluated using SEM analysis
and the results are presented in Chapter 5. In this model, Superior’s Autonomy Support
was included in order to examine the effect of the characteristics of PMS on RAI over
and beyond the effect of Superiors’ Autonomy Support. Similarly, Goal Commitment
was included in order to test the effect of RAI on consequence variables over and beyond
the effect of Goal Commitment. In addition, Strategic Orientation was included to
demonstrate that RAI only impacts Role Orientation but not Strategic Orientation.
Moreover, although not hypothesized, as mentioned in previous section, Strategic
Orientation was expected to predict Role Orientation (Knowledge), and RAI was also
anticipated to predict Goal Commitment. In Figure 6, hypothesized paths are presented in
solid lines, whereas not hypothesized paths (e.g. the one from Superior’s Autonomy
Support to RAI) appear in dotted lines.
------------------------------ Insert Figure 6 Here
------------------------------
78
4.2 Study 2: Experiment
A cross-sectional method, such as the one used in Study 1, does not allow causal
inferences to be drawn (Shadish, Cook and Campbell 2002). Study 2 therefore conducted
a case-based experiment to test selected hypotheses (i.e., H1, H2 and H6) among middle
managers. Another difference between the two studies was that a stronger “strategy
flavor” was incorporated in the design of Study 2. Specifically, three features of the
experiment demonstrate its strategic focus: first, to test H1, performance measurement
system was operationalized as a strategic performance measurement system (SPMS), the
balanced scorecard (BSC) in particular. Second, to test H2, participative decision making
was operationalized as middle managers’ participation in the so-called “strategic validity
control” procedure. Third, the measured dependent variable was proactive strategic
behavior (PSB), which was initiated by middle managers to influence strategy
formulation.
4.2.1 Overview and Procedure
A 2 (SPMS-reward linkage: not-linked condition vs. linked condition) by 2
(participative decision making: control condition vs. participation condition) between-
subject design was used. Participants assumed the role of a middle manager and were
randomly assigned to one of the four combinations of the two factors. Their autonomous
and controlled motivation to achieve the company’s strategic goal were measured to test
H1 and H2, and their tendency to engage in PSB was measured to test H6.
The case described a hypothetical restaurant chain which used a BSC as its
performance measurement system to manage its new strategy. Participants were asked to
79
assume the role of one of its store managers. They were presented first with the BSC, and
then the incentive plan based on which store managers’ annual cash bonuses were
determined. The incentive plan was either not linked with the BSC (not-linked condition)
or linked with the BSC (linked condition). Half of the participants (participation
condition) were then informed about a meeting that was intended for them to participate
in the strategic validity control procedure. The rest of the participants (control condition)
did not receive any information about the meeting. All participants then indicated their
propensity to engage in one type of PSB, i.e., issue selling behavior, in two different
scenarios. Mediating variables (i.e., autonomous and controlled motivation to achieve the
strategic goal, and the Goal Commitment) were then measured. A manipulation check
was performed and demographic data were requested at the end of the experiment.
The experiment instrument is presented in the Appendix.
4.2.2 Experiment Participants
A total of 74 students enrolled in evening business classes at a university in Hong
Kong participated in this experiment. The participants completed the experiment as part
of the class requirement and therefore, were not compensated. Sixty one percent were
male, and the average age was 32.4 years. The participants had an average of 8.2 years of
full-time work experience, and 64% of them held management positions.
4.2.3 Case Material
The case used in the current study was adapted from multiple published cases in
80
the restaurant industry14, Kaplan and Norton (2001), and the prospectus of a public
company (Ruth’s Chris Inc. 2005). The case was reviewed by two experts in restaurant
management to ensure its realism and changes were made according to their comments.
The case described one steakhouse chain, named “Shorthorn,” that owned eight stores
and recently adopted a new strategy that stresses improving customer retention. In order
to attain this strategic goal, Shorthorn planed to focus on the following initiatives: (1)
providing customers with excellent dining experiences, (2) adding new dishes to the
menu faster than its competitors, and (3) serving orders in a speedy way. Along with the
description of the strategy, the participants were also presented with a strategy map (see
Figure 7) that presented in graphical format how Shorthorn expected to achieve its
strategic goal by delivering on the strategic drivers.
------------------------------ Insert Figure 7 here
------------------------------
Following Kaplan and Norton (1996), the BSC used by Shorthorn to monitor
strategy implementation included measures across four categories: financial, customer,
internal process and learning & growth. These measures were described as being
carefully chosen to represent important aspects of the strategic drivers and outcomes. A
description of eight BSC measures was subsequently presented (see Table 5) to
participants in all conditions.
------------------------------ Insert Table 5 here
------------------------------
Participants were told that the store’s performance on the eight BSC measures 14 The cases being used include Denton and White (2000) and Sullivan (2005).
81
would be used to evaluate how well the strategy had been implemented in their store.
Participants in all conditions were also told that their annual cash bonus, which was about
25% of their base salary15, was determined by a separate system, i.e., the “incentive
plan.” The incentive plan consisted of five criteria and their bonus varied depending on
the degree to which their store’s performance achieved the targets along these five
criteria. The manipulation of both independent variables is described in the next section.
4.2.4 Manipulation of the Independent Variables
SPMS – Reward Linkage
The SPMS-reward linkage factor was manipulated by varying the criteria
contained in the above-mentioned incentive plan. In the not-linked condition, none of the
five criteria in the incentive plan were from the BSC, and they were either financial
measure (e.g., sales per $ of assets) or non-financial summary measure (e.g., number of
entrees sold per month). In contrast, in the linked condition, all five criteria (e.g.,
“Mystery diner” audit rating) in the incentive plan were from the BSC. The incentive
plans for both conditions are presented in Table 6. To increase the effectiveness of this
manipulation and to ensure that the participants understand the incentive plan,
participants were subsequently asked to practice calculating the bonus for a different
store manager. All 74 participants correctly calculated the bonus.
------------------------------ Insert Table 6 here
------------------------------
15 A 25% bonus scheme was in general consistent with prior experimental research in this area. For example, Tuttle and Harrell (2001), and Ullrich and Tuttle (2004) used 20% bonus in their experiments, and Kershaw and Harrell (1999) used a 30% bonus.
82
Participative Decision Making: Involvement in Strategic Validity Control
This study used so-called “strategic validity control” procedure to operationalize
participative decision making. Strategic validity control is a procedure where the
organization actively monitors its strategic assumptions and anticipates any need for
revising strategic plans (Ferreira and Otley 2005). Actively monitoring strategic validity
was first proposed by Simons’ (1995) as one component of “interactive” control systems,
and it was later identified by Ferreira and Otley (2005) as a distinct control procedure and
included in their comprehensive framework of management control systems. This study
argues that whether the organization involves middle managers in such procedure will
impact their types of motivation to achieve strategic goals16. This is because first, the
existence of such a procedure sends managers a strong message that existent strategies
are to be continuously evaluated and modified, and that managers’ critical thinking and
innovative ideas can shape future strategies. As a result, managers’ needs for autonomy
and competence should be better satisfied. According to SDT, a social environment that
satisfies individuals’ psychological needs promotes autonomous motivation among its
members. Second, this procedure provides a formal arena for higher-level managers to
acknowledge lower-level mangers’ perspectives. As mentioned in Chapter 2, prior
research (e.g., Gagné et al. 2000) shows that acknowledging subordinates’ perspectives
facilitates their internalization of firm policies.
The manipulation of participative decision making follows. In the participation
condition, participants were informed that Shorthorn’s top management met with all store
16 Similar with this conjecture, Westley (1990) argues that top management opening up to middle managers’ perspectives can help to increase the latter’s commitment to the company’s strategic goals. However, Westley (1990) does not examine the nature of motivation (autonomous vs. controlled motivation) underlying middle managers’ goal commitment.
83
managers at a bi-monthly meeting, which was to provide store managers with opportunity
to participate in the strategic validity control. Specifically, the participants were told that
the primary goal of the meeting was for store managers to evaluate the soundness of
Shorthorn’s current strategy, because the executives believed that store managers knew
best about the current business conditions and how to get the job done. Participants were
further informed that at this meeting, store managers critically examined and even
questioned the soundness of Shorthorn’s current strategy and foresaw the need for
revising it.
To increase the effectiveness of this manipulation, participants were then asked to
imagine that at one of the bi-monthly meetings, another store manager brought up a
concern about the strategy (i.e., streamlining the food preparation process made some
dishes less tasty). Participants were subsequently asked to indicate how they would
consider revising Shorthorn’s strategy in response to this concern. In the control
condition, participants did not receive any information about the bi-monthly meeting.
4.2.5 Measurement of the Dependent Measures
Proactive Strategic Behavior (PSB): Issue Selling Behavior (ISB)
This study measured one of the most documented PSB, i.e., issue selling behavior
(ISB, Parker and Collins 2006). Issue selling occurs when middle managers proactively
influence the formation of strategy by making others, especially top management, aware
of critical issues (Dutton and Ashford 1993).
Decisions in two scenarios were used to measure the participant’s propensity to
undertake ISB. The first set of decisions measured middle managers’ likelihood to sell an
84
issue that potentially challenged the validity of the current strategy. Specifically,
participants were asked to imagine that they observed that contrary to the strategic map,
employee training did not effectively improve customers’ dining experiences. They were
asked to indicate, on separate 9-point scales, their likelihood of reporting to the
executives their concern about the strategy at the following three different stages: (1)
when they did not know why the training was not working and what could be done to
better improve customers’ dining experiences (stage 1); (2) when they had discovered
why the training program was not working but still had not come up with a solution
(stage 2); (3) when they had come up with an alternative plan to improve customer dining
experiences (stage 3).
The reason for asking participants to indicate their likelihood to sell the issue at
different stages is because research in ISB suggests that middle managers sell issues at
different stages. Specifically, an issue can be sold before or after a solution is developed.
Although selling an issue with a solution attached is normally associated with lower
human capital risk for the “seller,” firms often benefit more if an issue is brought up at an
earlier stage so that top management can get multiple inputs and in a timely manner
(Dutton and Ashford 1993).
The second decision measured participant’s propensity to sell an issue that does
not directly challenge the current strategy but did suggest an alternative strategic plan. In
particular, participants were presented with a piece of information that revealed a new
trend of customers’ tastes (i.e., “many customers mentioned to you that they would like
to dine outside when the weather allows”). This information provided clues for a possible
alternative plan that might help to achieve the strategic goal of improving customer

85
retention. Participants were asked to rate on a 9-point scale their likelihood of suggesting
Shorthorn’s top management revise its strategy in response to this information.
The responses in both scenarios were used to test H6. Supposedly, the more likely
the participants were to sell the issues to the executives, and the earlier on they were to
sell the first issue, the more proactive they were in influencing strategy formation.
Resource Allocation Decision
Besides their PSB, middle managers’ willingness to carry out a new strategy is
also of interest. Therefore, before being exposed to any information that suggested the
need for revising the newly adopted strategy, the participants were asked to make a
resource allocation decision. This decision was elicited to examine whether they allocated
resources in a way that facilitates the implementation of the newly adopted strategy.
Specifically, after being presented with the incentive plan, participants were asked
to allocate discretionary funds to four alternative projects. Two of these projects (e.g.,
sending the chefs to culinary workshops to stimulate their creativity in innovating new
dishes) were consistent with the strategy, and two (e.g., promoting the sales of beverage
and desserts) did not bear explicit strategic importance although they were expected to
improve the store’s short-term financial performance. Participants ranked the four
projects based on their priorities for funding. Presumably, the higher (lower) priorities the
participants assigned to the two strategy-consistent projects, the more (less) inclined they
were to allocate limited resources in a way that strategy implementation was facilitated.
4.2.6 Measurement of the Mediating Variables
86
Similar with Study 1, Study 2 measured Goal Commitment in order to rule out the
effect of the amount of motivation on outcome variables. Specifically, managers’
commitment to the strategic goal (i.e., to improve customer retention) was measured
upon completion of the issue selling decision tasks. As in Study 1, the five-item short
version of the Goal Commitment scale developed by Hollenbeck et al. (1989) was used.
The forms of participants’ motivation to achieve the strategic goal were measured
subsequent to the measure of Goal Commitment. Similar with Study 1 but with minor
changes, participants were asked to indicate on 9-point scales the extent to which they
would try to achieve the strategic goal because of the following four reasons: “because
top management wants me to, or because I’ll get reward, praise, or approval for achieving
this goal” (external regulation), “because I would feel ashamed, guilty, or anxious if I
didn’t” (introjected regulation), “because I really believe that it is an important goal to
have and I endorse it freely and value it wholeheartedly” (identified regulation), and
“because of the challenge and enjoyment pursuing the goal would provide me” (intrinsic
motivation).
In the pilot test conducted prior to the formal experiment, a few participants
commented that the intrinsic motivation question did not seem sensible to them. This was
possibly because the case was hypothetical, and participants were thus less likely to feel
the “enjoyment” or “challenge” while “striving for” the strategic goal.17 The intrinsic
motivation score was therefore excluded from the analysis. Because RAI is a linear
function of the four motivation scores, it could not be calculated in this study.
Vansteenkiste et al.’s (2005) argue that the overall measure of RAI should be
17 In the real business world however, middle managers could well be motivated by intrinsic motivation to strive for strategic goals.
87
broken into autonomous and controlled motivation because the two types of motivation
are predictors of distinctive behavioral outcomes. The following two measures were thus
derived to test the hypotheses: (1) autonomous motivation (AM), which was the score of
identified regulation; and (2) controlled motivation (CM), which was the sum score of
extrinsic regulation and introjected regulation.
4.2.7 Manipulation Check Questions
A manipulation check question on the first manipulated variable (SPMS-reward
linkage) was performed at the end of the experiment. Specifically, the participants were
asked to indicate on a 9-point scale to what extent they felt that the reward system (i.e.,
the incentive plan) used to determine store managers’ cash bonuses was consistent with
the performance measurement system (i.e., the BSC) (1: not at all consistent; 9: to a great
extent consistent). No manipulation check was performed on the second independent
variable (participative decision making) because participants in the control condition
were simply not provided with any information about the bi-monthly meeting.
In addition to the manipulation check, participants were also asked to indicate on
a 9-point scale to what extent they believed that they would be fairly rewarded by the
incentive plan if they performed well on the BSC (1: not at all; 9: to a great extent).
Subsequently, they were asked to indicate on separate nine-point scales the perceived
realism (1: extremely unrealistic; 9: extremely realistic), the level of difficulty (1:
extremely easy; 9: extremely difficult) of the decision making task, and their familiarity
with the BSC prior to the experiment (1: not familiar at all; 9: very familiar).
88
4.2.8 Summary of Study 2
The specific predictions that were tested by Study 2, including the hypothesized
and not hypothesized ones, are summarized in Figure 8. As shown in this figure, the
nature of work motivation was measured by two separate measures, i.e., Autonomous
Motivation (AM) and Controlled Motivation (CM), rather than by relative autonomy
index (RAI). In addition, performance-reward contingency was operationalized as the
linkage between SPMS and rewards, participative decision making was operationalized
as participation in strategic validity control, and proactive strategic behavior (PSB) was
measured as issue selling behavior (ISB).
------------------------------ Insert Figure 8 Here
------------------------------
Similar to Study 1, Goal Commitment was measured in order to test the effect of
the nature of motivation on ISB over and beyond the effect of Goal Commitment.
Resource allocation decision was measured to test the effect of SPMS-reward linkage on
middle managers’ willingness to carry out strategies. In Figure 8, the hypothesized paths
are presented in solid lines, whereas not hypothesized paths (e.g. the one from Goal
Commitment to ISB) appear in dotted lines.
4.3 Summary
This chapter presents two studies that tested the hypotheses developed in Chapter
3. Study 1 consisted of SEM analyses on data available from a survey that was
administered to 135 employees from different organizations. It tested the majority of the
hypotheses by estimating a structural model (see Figure 6). Study 2 tested H1, H2 and

89
H6 (see Figure 8) using a case-based experiment, where participants assumed the role of
a lower-level manager. Compared with Study 1, Study 2 by design had a stronger
strategic “flavor”. The results of both studies are presented in Chapter 4.
90
CHAPTER FIVE
RESULTS
5.1 Study 1
Study 1 tested H1, H2, H3, H4, and H5. Descriptive statistics are presented first in
section 5.1.1 followed by the tests of the hypotheses. Before formally testing the
hypotheses, a series of structural equation models were evaluated and the “optimal”
model was identified in section 5.1.2. H1, H2, H3, and H4 were then tested based on the
path coefficient estimates from the “optimal” structural model, and the results are
presented in section 5.1.3. Section 5.1.4 reports a preliminary test for the moderating
effects of task uncertainty. Specifically, tests were performed to examine whether the
optimal model fit the data equally well with the high task uncertainty sample and the low
task uncertainty sample. H5 could not be tested using SEM analysis; thus, the tests of H5
are presented separately in section 5.1.5.
5.1.1 Descriptive Statistics
Descriptive statistics of measured variables are presented in Table 718. For each
variable, a theoretical range and an actual range are presented, along with the mean,
median and standard deviation. Table 7 also presents the Standardized Cronbach’s alpha
of the scale that measures each variable.
------------------------------ Insert Table 7 about here ------------------------------
18 To facilitate the interpretation of descriptive statistics, in Table 7, the ranges, mean, median and standard deviation of each variable are based on the average score of the scale if a scale measure is used. However, in section 4.1.2 and 4.1.3, the specification of error variances in the SEM models, the evaluation of those models, and the estimation of path coefficients are based on the sum scores of the scales. Results are not expected to differ if average scores are used.
91
As shown in Table 7, on 7-point scales, the means of the Contingency,
Participation, and Communication subscales of the CPMS scale were 4.92 (sd=1.03),
3.79 (sd=0.77), and 4.24 (sd=1.11), respectively. The statistics on Superior’s Autonomy
Support showed that on average, the respondents did not view their superiors as either
autonomy supportive or not autonomy supportive (mean=4.27, sd=0.98).
Table 7 also suggests that the respondents were in general moderately committed
to their departmental goal(s) (mean=3.45, sd=0.89). As for the type of motivation
underlying their goal pursuits, they were on average to a greater degree motivated by
autonomous motivation (mean=6.04, sd=1.59) than by controlled motivation (mean=4.76,
sd=1.51) (t=7.05, p<0.01). As a result, on average, the relative autonomy index (RAI)
(mean=3.77, sd=7.77) was significantly greater than zero (t=5.64, p<0.01).
The mean of Strategic Orientation (mean=5.13, sd=0.69) was significantly greater
than the middle point of 4 (t=19.16, p<0.01), suggesting that in general the respondents
had developed strategic orientation appropriate to modern organizations. In contrast, the
mean of Role Orientation (Knowledge) (mean=4.00, sd=1.28) was not different from the
middle point of 4 (t=0.02, p=0.98), indicating that the respondents to a lesser degree
recognized the importance of acquiring new knowledge and skills. This is consistent with
Parker et al.’s (1997) finding that employees’ strategic orientation was more easily
transformed than their role orientation. In terms of attribution tendency, overall the
respondents attributed their performance more to internal factors (i.e., to their own ability
and/or effort) than to external factors (i.e., to luck and/or task difficulty). Specifically, on
average, they allocated 57.17% of the points to internal factors versus 42.83% to external
factors.
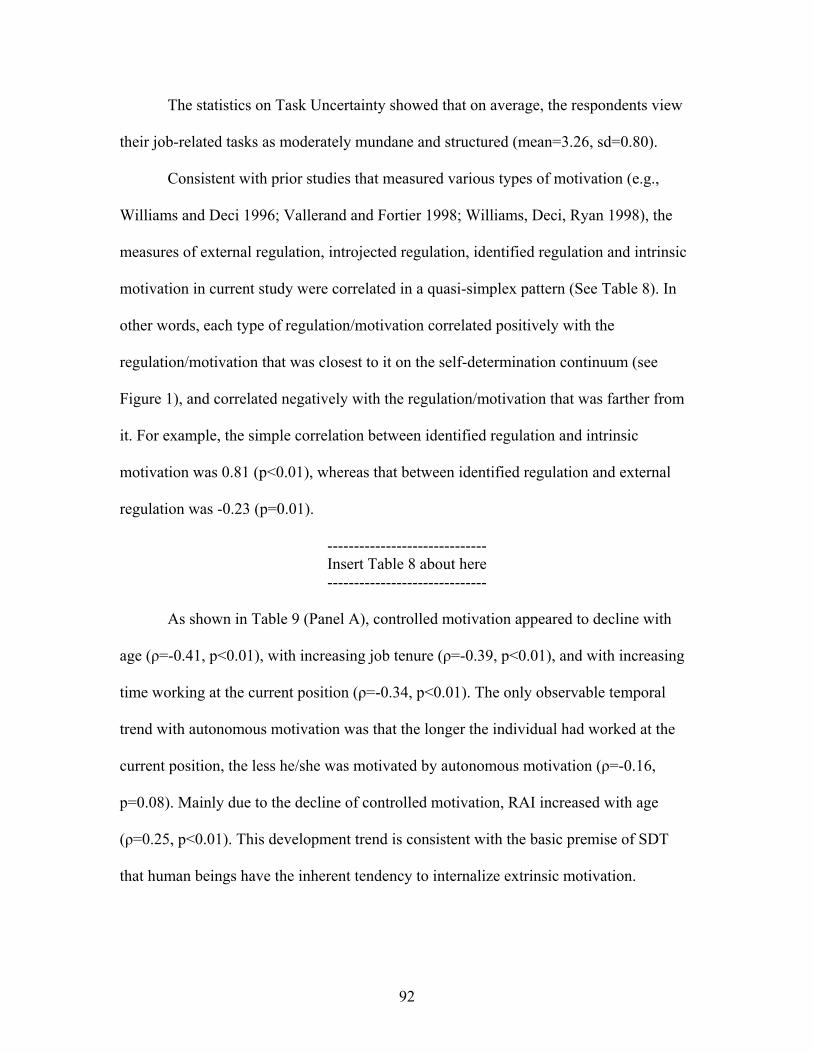
92
The statistics on Task Uncertainty showed that on average, the respondents view
their job-related tasks as moderately mundane and structured (mean=3.26, sd=0.80).
Consistent with prior studies that measured various types of motivation (e.g.,
Williams and Deci 1996; Vallerand and Fortier 1998; Williams, Deci, Ryan 1998), the
measures of external regulation, introjected regulation, identified regulation and intrinsic
motivation in current study were correlated in a quasi-simplex pattern (See Table 8). In
other words, each type of regulation/motivation correlated positively with the
regulation/motivation that was closest to it on the self-determination continuum (see
Figure 1), and correlated negatively with the regulation/motivation that was farther from
it. For example, the simple correlation between identified regulation and intrinsic
motivation was 0.81 (p<0.01), whereas that between identified regulation and external
regulation was -0.23 (p=0.01).
------------------------------ Insert Table 8 about here ------------------------------
As shown in Table 9 (Panel A), controlled motivation appeared to decline with
age (ρ=-0.41, p<0.01), with increasing job tenure (ρ=-0.39, p<0.01), and with increasing
time working at the current position (ρ=-0.34, p<0.01). The only observable temporal
trend with autonomous motivation was that the longer the individual had worked at the
current position, the less he/she was motivated by autonomous motivation (ρ=-0.16,
p=0.08). Mainly due to the decline of controlled motivation, RAI increased with age
(ρ=0.25, p<0.01). This development trend is consistent with the basic premise of SDT
that human beings have the inherent tendency to internalize extrinsic motivation.
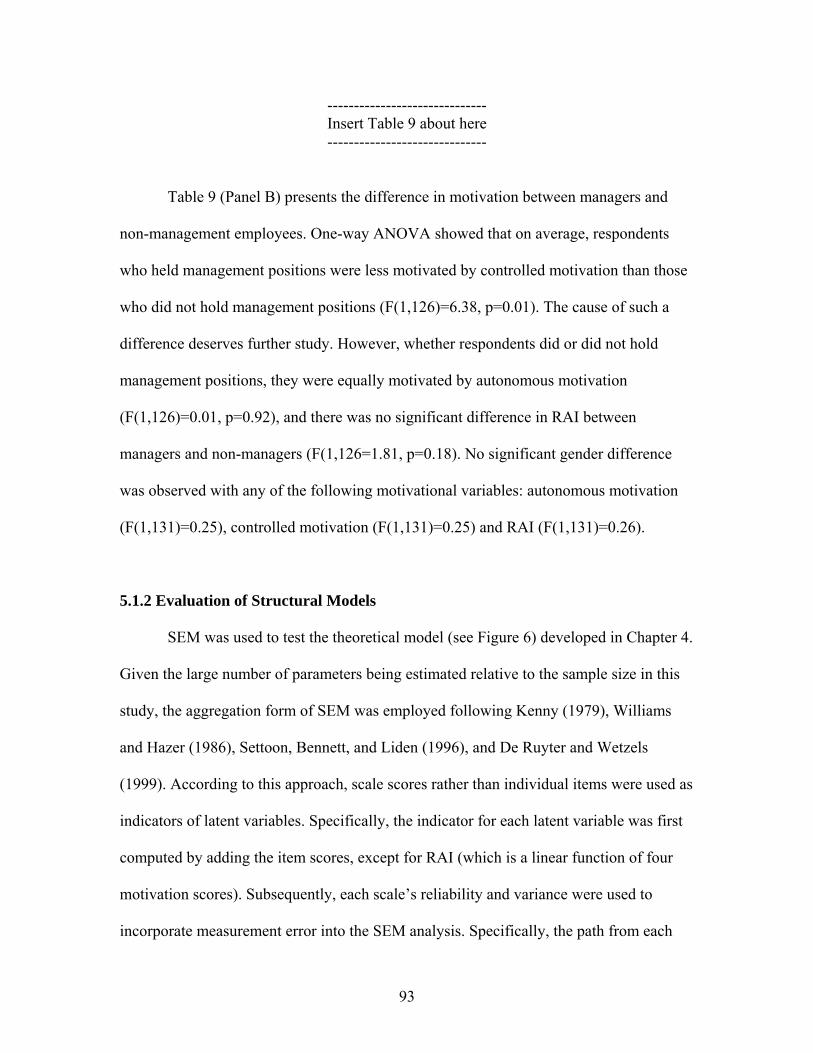
93
------------------------------ Insert Table 9 about here ------------------------------
Table 9 (Panel B) presents the difference in motivation between managers and
non-management employees. One-way ANOVA showed that on average, respondents
who held management positions were less motivated by controlled motivation than those
who did not hold management positions (F(1,126)=6.38, p=0.01). The cause of such a
difference deserves further study. However, whether respondents did or did not hold
management positions, they were equally motivated by autonomous motivation
(F(1,126)=0.01, p=0.92), and there was no significant difference in RAI between
managers and non-managers (F(1,126=1.81, p=0.18). No significant gender difference
was observed with any of the following motivational variables: autonomous motivation
(F(1,131)=0.25), controlled motivation (F(1,131)=0.25) and RAI (F(1,131)=0.26).
5.1.2 Evaluation of Structural Models SEM was used to test the theoretical model (see Figure 6) developed in Chapter 4.
Given the large number of parameters being estimated relative to the sample size in this
study, the aggregation form of SEM was employed following Kenny (1979), Williams
and Hazer (1986), Settoon, Bennett, and Liden (1996), and De Ruyter and Wetzels
(1999). According to this approach, scale scores rather than individual items were used as
indicators of latent variables. Specifically, the indicator for each latent variable was first
computed by adding the item scores, except for RAI (which is a linear function of four
motivation scores). Subsequently, each scale’s reliability and variance were used to
incorporate measurement error into the SEM analysis. Specifically, the path from each
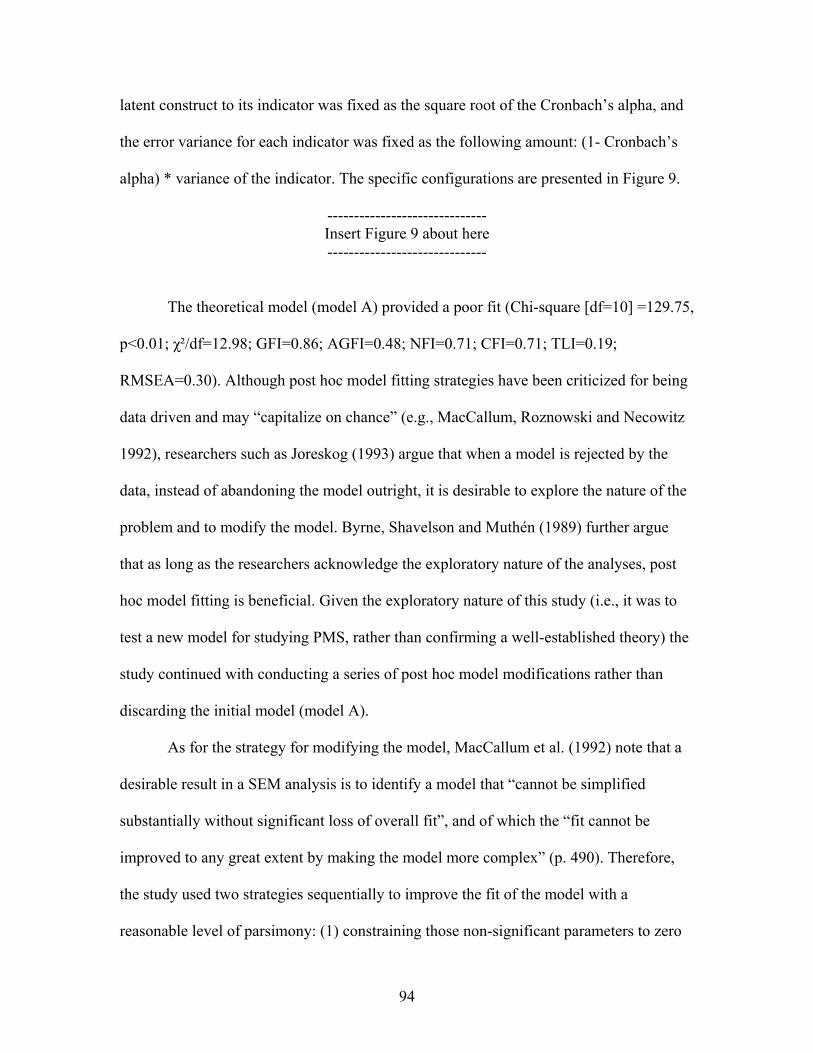
94
latent construct to its indicator was fixed as the square root of the Cronbach’s alpha, and
the error variance for each indicator was fixed as the following amount: (1- Cronbach’s
alpha) * variance of the indicator. The specific configurations are presented in Figure 9.
------------------------------ Insert Figure 9 about here ------------------------------
The theoretical model (model A) provided a poor fit (Chi-square [df=10] =129.75,
p<0.01; χ²/df=12.98; GFI=0.86; AGFI=0.48; NFI=0.71; CFI=0.71; TLI=0.19;
RMSEA=0.30). Although post hoc model fitting strategies have been criticized for being
data driven and may “capitalize on chance” (e.g., MacCallum, Roznowski and Necowitz
1992), researchers such as Joreskog (1993) argue that when a model is rejected by the
data, instead of abandoning the model outright, it is desirable to explore the nature of the
problem and to modify the model. Byrne, Shavelson and Muthén (1989) further argue
that as long as the researchers acknowledge the exploratory nature of the analyses, post
hoc model fitting is beneficial. Given the exploratory nature of this study (i.e., it was to
test a new model for studying PMS, rather than confirming a well-established theory) the
study continued with conducting a series of post hoc model modifications rather than
discarding the initial model (model A).
As for the strategy for modifying the model, MacCallum et al. (1992) note that a
desirable result in a SEM analysis is to identify a model that “cannot be simplified
substantially without significant loss of overall fit”, and of which the “fit cannot be
improved to any great extent by making the model more complex” (p. 490). Therefore,
the study used two strategies sequentially to improve the fit of the model with a
reasonable level of parsimony: (1) constraining those non-significant parameters to zero
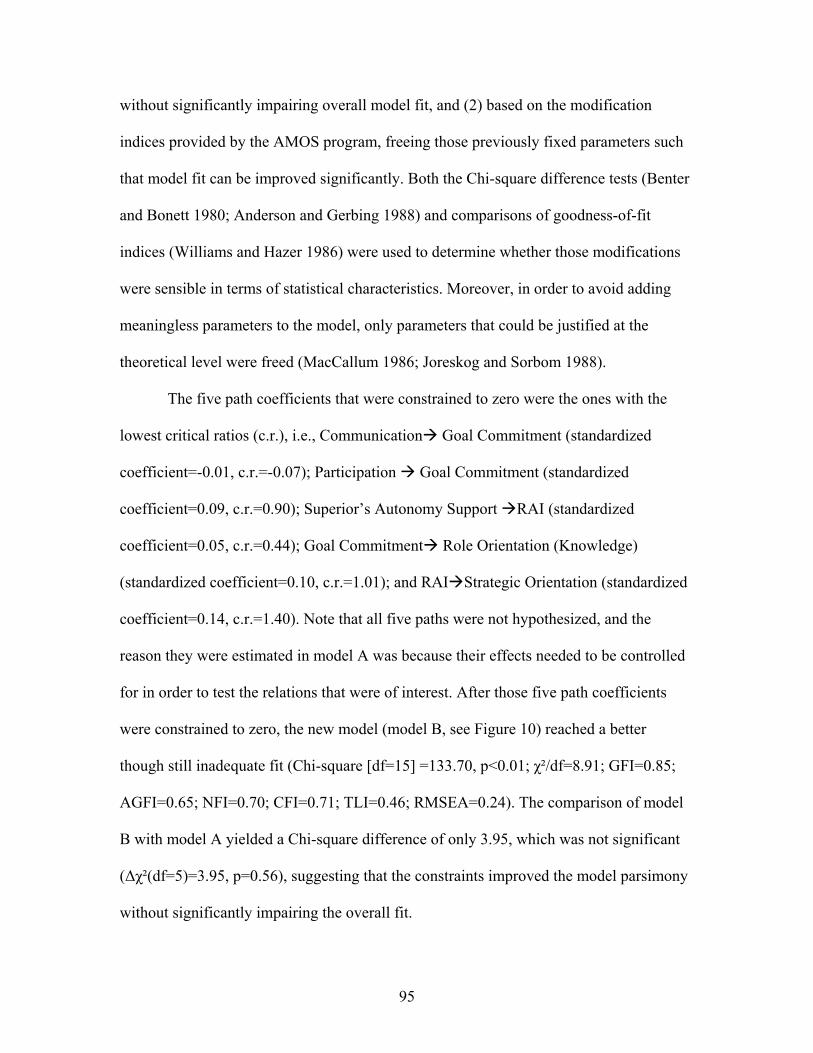
95
without significantly impairing overall model fit, and (2) based on the modification
indices provided by the AMOS program, freeing those previously fixed parameters such
that model fit can be improved significantly. Both the Chi-square difference tests (Benter
and Bonett 1980; Anderson and Gerbing 1988) and comparisons of goodness-of-fit
indices (Williams and Hazer 1986) were used to determine whether those modifications
were sensible in terms of statistical characteristics. Moreover, in order to avoid adding
meaningless parameters to the model, only parameters that could be justified at the
theoretical level were freed (MacCallum 1986; Joreskog and Sorbom 1988).
The five path coefficients that were constrained to zero were the ones with the
lowest critical ratios (c.r.), i.e., Communication Goal Commitment (standardized
coefficient=-0.01, c.r.=-0.07); Participation Goal Commitment (standardized
coefficient=0.09, c.r.=0.90); Superior’s Autonomy Support RAI (standardized
coefficient=0.05, c.r.=0.44); Goal Commitment Role Orientation (Knowledge)
(standardized coefficient=0.10, c.r.=1.01); and RAI Strategic Orientation (standardized
coefficient=0.14, c.r.=1.40). Note that all five paths were not hypothesized, and the
reason they were estimated in model A was because their effects needed to be controlled
for in order to test the relations that were of interest. After those five path coefficients
were constrained to zero, the new model (model B, see Figure 10) reached a better
though still inadequate fit (Chi-square [df=15] =133.70, p<0.01; χ²/df=8.91; GFI=0.85;
AGFI=0.65; NFI=0.70; CFI=0.71; TLI=0.46; RMSEA=0.24). The comparison of model
B with model A yielded a Chi-square difference of only 3.95, which was not significant
(∆χ²(df=5)=3.95, p=0.56), suggesting that the constraints improved the model parsimony
without significantly impairing the overall fit.
96
------------------------------ Insert Figure 10 about here ------------------------------
The modification indices (m.i.) suggested that the overall fit of model B could be
improved if the flowing three parameters were freed: (1) Superior’s Autonomy Support
Strategic Orientation (m.i.=41.48); (2) Communication Strategic Orientation
(m.i.=6.67); and (3) e3 e4 (m.i.=10.86). The theoretical rationale for freeing the
abovementioned three parameters follows. First, strategic orientation by definition is
employees’ endorsement and internalization of the organization’s strategic objective
(Parker et al. 1997). SDT-based research such as Williams and Deci (1996) find that
when instructors are autonomy supportive, medical students show greater internalization
of the values presented in class. This suggests that a direct relation may exist between
Superior’s Autonomy Support and Strategic Orientation. Second, Study 2 in Parker et al.
(1997) finds that when initiatives such as training and communication are in place,
employees successfully change their strategic orientation, but not their role orientation.
Thus, a direct link can be expected between Communication and Strategic Orientation.
Last, both Strategic Orientation and Role Orientation (Knowledge) are facets of work
orientation, and both constructs capture the cognitive component (vs. affective
component) of work attitude (Parker et al. 1997). Therefore, one may reasonably suspect
that the error terms associated with the indicators of these two constructs are associated.
Since the modification indices provided by AMOS were derived univariately
rather than multivariately (Byrne 2001)19, each time one of the above three parameters
was freed, a Chi-square difference test was conducted to determine whether the model fit
19 Lagrange multiplier test statistics provided by EQS program are derived multivariately.
97
was indeed improved. The results suggest that by freeing each of the three parameters,
the Chi-square was significantly reduced (∆χ²(df=1)=76.50, p<0.01 for freeing the above
parameter (1); ∆χ²(df=1)=11.40, p<0.01 for freeing the above parameter (2);
∆χ²(df=1)=22.90, p<0.01 for freeing the above parameter (3)). After freeing all three
parameters, a new model (model C, see Figure 11) was derived and it reached an
adequate fit (Chi-square [df=12] =22.90, p<0.03; χ²/df=1.91; GFI=0.96; AGFI=0.88;
NFI=0.95; CFI=0.97; TLI=0.94; RMSEA=0.08). It appeared that model C was “optimal”
in terms of parsimony, model fitting and substantive meaningfulness. H1, H2, H3 and H4
were thus tested based on the path coefficient estimates derived from model C.
------------------------------ Insert Figure 11 about here ------------------------------
5.1.3 Tests of H1, H2, H3, and H4
The testing of H1, H2, H3 and H4 was based on the path coefficient estimates
derived from model C. As shown in Figure 12, all three PMS characteristics, namely,
Contingency (standardized coefficient=0.34, p<0.01), Participation (standardized
coefficient=0.26, p<0.01) and Communication (standardized coefficient=0.36, p<0.01),
positively predicted RAI. Superior’s Autonomy Support was not an important predictor
of RAI. Based on the above findings, H1a, H2 and H3 were supported. In other words,
employees were to a greater degree motivated by autonomous (vs. controlled) motivation
to work when the reward systems were linked with measured performance (H1a), when
they were engaged in PMS related decision making (H2), and when the PMS were
effective in communicating business objectives to the employees (H3).
------------------------------
98
Insert Figure 12 about here ------------------------------
H4 proposed that autonomous (vs. controlled) work motivation positively
predicted one dimension of role orientation, i.e., the degree to which employees
recognized the importance of new knowledge and skills. As shown in Figure 12, RAI
significantly predicted Role Orientation-Knowledge (standardized coefficient=0.30,
p<0.01). H4 was therefore supported. In other words, the more they were motivated by
autonomous (vs. controlled) motivation to work, the more employees regarded acquiring
new knowledge and skills as an important part of their job.
As expected, the path coefficient between RAI and Strategic Orientation was
insignificant, suggesting that autonomous (vs. controlled) motivation only facilitated the
transformation of role orientation, but not that of strategic orientation. Interestingly,
Superior’s Autonomy Support (standardized coefficients=0.81, p<0.01) was the strongest
predictor of Strategic Orientation. It appeared that superior’s autonomy support
facilitated the transformation of employees’ strategic orientation, but it did so directly
and not through the enhancement of autonomous motivation. Again as expected,
Strategic Orientation positively predicted Role Orientation (Knowledge) (standardized
coefficients=0.36, p<0.01), which is consistent with Parker et al.’s (1997) notion that the
broadening of employees’ role orientation occurs after the successful transformation of
their strategic orientation.
Although the predictors of Goal Commitment were not the foci of this paper, the
path estimates presented in Figure 12 revealed some interesting patterns. Specifically,
RAI (standardized coefficient=0.43, p<0.01) positively predicted Goal Commitment after
99
the effects of performance-reward contingency and Superior’s autonomy support were
controlled. In other words, employees were more committed to their departmental goal(s)
when they were to a greater degree motivated by autonomous (vs. controlled) motivation
to work. This finding provides evidence of another benefit of enhancing employees’
autonomous (vs. controlled) work motivation, i.e., increasing the level of goal
commitment.
5.1.4. Tests of H5: Autonomous (vs. Controlled) Motivation and Self-Serving
Attribution
Multiple regression analyses were used to test H5. The regression models and
results are presented in Table 10. As mentioned in Chapter 4, when Internal-Attribution
score (measured as a percentage of weight assigned to ability and/or effort) was regressed
on performance, a positive coefficient for performance would be expected if self-serving
attribution was present. Model 1 was first estimated with the whole sample (ns=12320).
The positive coefficient for Performance (standardized coefficient=0.33, p<0.01)
suggests that overall, the better the performance, the more the respondents attributed their
recent performance to internal factors.
------------------------------ Insert Table 10 here
------------------------------ To test H5, model 2 was estimated with the whole sample. In model 2, the
criterion variable was Internal-Attribution and predictors included Performance, RAI-
Median, and the interaction between Performance and RAI-Median. As predicted by H5,
20 In total, 12 respondents did not rate their recent performance. Their responses were thus excluded from the tests of H5.
100
the coefficient for the interaction term was significant and negative (standard coefficient
= -1.27, p<0.01), suggesting RAI moderated the relation between Performance and
Internal-Attribution.
To further examine the nature of the moderating effect, a median split on RAI was
then conducted and the sample was divided to two sub-samples: the high RAI sample and
the low RAI sample. As shown in Table 10, when Model 1 was estimated with the low
RAI sample, Performance positively predicted Internal-Attribution (standardized
coefficient=0.51, p<0.01). But when Model 1 was estimated with the high RAI sample,
the coefficient for Performance was not significant (standardized coefficient=0.01,
p=0.92). This finding supports that for respondents scoring high on RAI, the attribution
to internal (vs. external) factors was not influenced by their performance level. H5 is
therefore supported.
5.1.5 Supplemental Analyses: Moderating Effects of Task Uncertainty
As noted in Chapter 4, autonomous (vs. controlled) work motivation may be
especially important when job related tasks are novel and uncertain, versus routine and
structured. To examine the moderating effect of Task Uncertainty (TU) on the proposed
relations, a median split was first conducted to divide the whole sample into two sub-
samples: high TU sample (ns=66) and low TU sample (ns=68). Subsequently, the
“optimal” model derived for the whole sample (model C) was estimated on the two
samples separately to see whether it fit both samples equally well. Subsequently, an
invariance test of causal structure was conducted following Byrne (2001). This test was
to formally test whether the causal structure was equivalent across the high TU and the
101
low TU samples. It is important to note that given the small sample sizes after the median
split, the analyses presented in this section were preliminary in nature.
When estimated using the high TU sample, model C reached a very good fit (Chi-
square [df=12] =9.94, p=0.62; χ²/df=0.83; GFI=0.96; AGFI=0.89; NFI=0.97; CFI=1.00;
TLI=1.02; RMSEA=0.00). A couple of observations could be made from the path
coefficient estimates derived from the high TU sample (see Figure 13): (1) similar to the
results for the whole sample, RAI was important in predicting both Goal Commitment
(standardized coefficient=0.57, p<0.01) and Role Orientation (Knowledge) (standardized
coefficient=0.21, p=0.01). (2) As predicted by H1, H2 and H3, all three PMS
characteristics, namely, Contingency (standardized coefficient=0.32, p=0.02),
Participation (standardized coefficient=0.32, p=0.02) and Communication (standardized
coefficient=0.42, p<0.01) positively predicted RAI, whereas Superior’s Autonomy
Support did not.
------------------------------ Insert Figure 13 about here ------------------------------
In contrast, when estimated using the low TU sample, the fit of model C was not
satisfactory (Chi-square [df=12] =36.04, p<0.01; χ²/df=3.00; GFI=0.89; AGFI=0.89;
NFI=0.83; CFI=0.87; TLI=0.69; RMSEA=0.17). In addition, there are many insignificant
paths (see Figure 14). For example, RAI were not significantly associated with Goal
Commitment or Role Orientation (Knowledge), and Strategy Orientation did not predict
Role Orientation (Knowledge). Based the above findings, significant inequivalence in
causal structure existed between the high and low TU samples.
------------------------------
102
Insert Figure 14 about here ------------------------------
Invariance test of causal structure was conducted following Byrne (2001) to
provide additional evidence for the above-mentioned inequivalence. First, model C was
estimated on the two samples simultaneously but with no equality constraints imposed.
This unconstrained model served as a baseline for the invariance test (Chi-square [df=24]
=45.97, p<0.01; χ²/df=1.92; GFI=0.92; AGFI=0.77; NFI=0.91; CFI=0.95; TLI=0.88;
RMSEA=0.08). Second, Model C was then estimated on the two groups with equality
constraints imposed on all structural paths. In other words, all the path regression weights
were specified as being equivalent across the two groups21. This fully constrained model
significantly increased the Chi-square value (∆χ²(df=11)=32.63, p<0.01) and achieved a
poorer model fit (Chi-square [df=35] =78.61, p<0.01; χ²/df=2.25; GFI=0.87; AGFI=0.73;
NFI=0.84; CFI=0.90; TLI=0.84; RMSEA=0.10) compared with the based line model.
This finding suggests that the causal structure (Model C) was not invariant across the two
groups.
Since model C did not fit well the low TU sample data, the same post hoc
modification strategies that were used to derive the “optimal” model for the whole
sample were used to identify the “optimal” model for the low TU sample. Specifically,
the following modifications were made in sequence. Starting from model C, the non-
significant parameters with the lowest critical ratios (i.e., RAI Goal Commitment,
c.r.=0.02; Communication Superior’s Autonomy Support, c.r.=0.66; and
21 Note that all error variances and paths from latent variable to indicators were automatically equivalent because they were fixed at the same values across the two groups (see Figure 11). But correlations among exogenous variables (e.g., correlation between Participation and Contingency) and the correlation between e3 and e4 were not specified as being equivalent. Constraining those parameters to be equivalent was not necessary since only the invariance of the causal structure was of interest.
103
Participation RAI, c.r.=0.824) were first constrained to zero. The change in Chi-square
as a result of such constraints was not significant (∆χ²(df=3)=0.96, p=0.81). Based on the
modification indices, the following previously constrained parameters were freed
sequentially: (1)Superior’s Autonomy Support RAI (m.i.=6.09), (2)δ2 (error term
associated with Participation) δ3 (error term associated with Communication)
(m.i.=5.65) , and (3)Communication Role Orientation (Knowledge) (m.i.=5.09). After
freeing each of those parameters, the Chi-square value significantly dropped
(∆χ²(df=1)=10.40, p<0.01 for freeing the above parameter (1), ∆χ²(df=1)=6.23, p<0.01
for freeing the above parameter (2), and ∆χ²(df=1)=6.96, p<0.01 for freeing the above
parameter (3)). Finally, the path coefficient between Participation and RAI was
constrained to zero due to its low critical ratio (c.r.=0.02, standardized coefficient=0.00),
and such deletion led to an insignificant change in Chi-square (∆χ²(df=1)=0.00, p=1.00).
The new model (model D) achieved a good fit on the low TU sample (Chi-square [df=13]
=13.40, p=0.42; χ²/df=1.03; GFI=0.95; AGFI=0.87; NFI=0.94; CFI=1.00; TLI=1.00;
RMSEA=0.02). The configurations of model D are presented in Figure 15 and the path
coefficient estimates are presented in Figure 16.
------------------------------ Insert Figure 15 about here ------------------------------ ------------------------------
Insert Figure 16 about here ------------------------------
Comparing the path coefficient estimates from model D (for the low TU sample)
(see Figure 16) and those from model C (for the high TU sample) (see Figure 13), a few
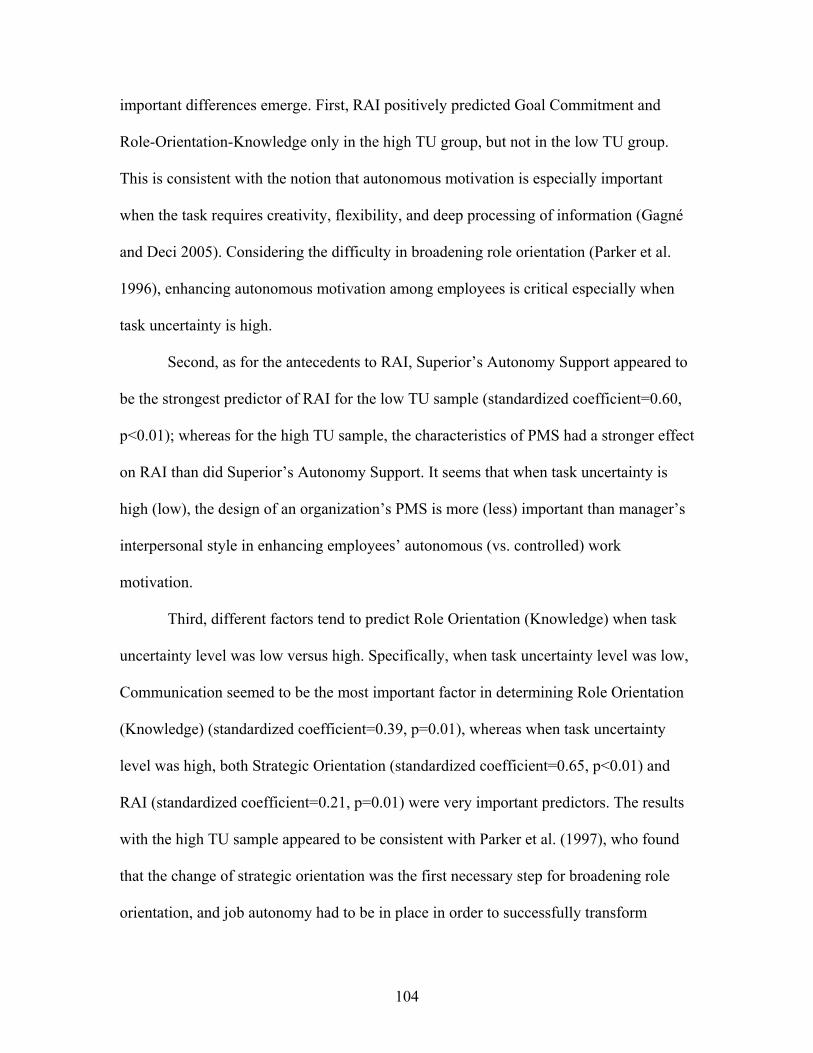
104
important differences emerge. First, RAI positively predicted Goal Commitment and
Role-Orientation-Knowledge only in the high TU group, but not in the low TU group.
This is consistent with the notion that autonomous motivation is especially important
when the task requires creativity, flexibility, and deep processing of information (Gagné
and Deci 2005). Considering the difficulty in broadening role orientation (Parker et al.
1996), enhancing autonomous motivation among employees is critical especially when
task uncertainty is high.
Second, as for the antecedents to RAI, Superior’s Autonomy Support appeared to
be the strongest predictor of RAI for the low TU sample (standardized coefficient=0.60,
p<0.01); whereas for the high TU sample, the characteristics of PMS had a stronger effect
on RAI than did Superior’s Autonomy Support. It seems that when task uncertainty is
high (low), the design of an organization’s PMS is more (less) important than manager’s
interpersonal style in enhancing employees’ autonomous (vs. controlled) work
motivation.
Third, different factors tend to predict Role Orientation (Knowledge) when task
uncertainty level was low versus high. Specifically, when task uncertainty level was low,
Communication seemed to be the most important factor in determining Role Orientation
(Knowledge) (standardized coefficient=0.39, p=0.01), whereas when task uncertainty
level was high, both Strategic Orientation (standardized coefficient=0.65, p<0.01) and
RAI (standardized coefficient=0.21, p=0.01) were very important predictors. The results
with the high TU sample appeared to be consistent with Parker et al. (1997), who found
that the change of strategic orientation was the first necessary step for broadening role
orientation, and job autonomy had to be in place in order to successfully transform
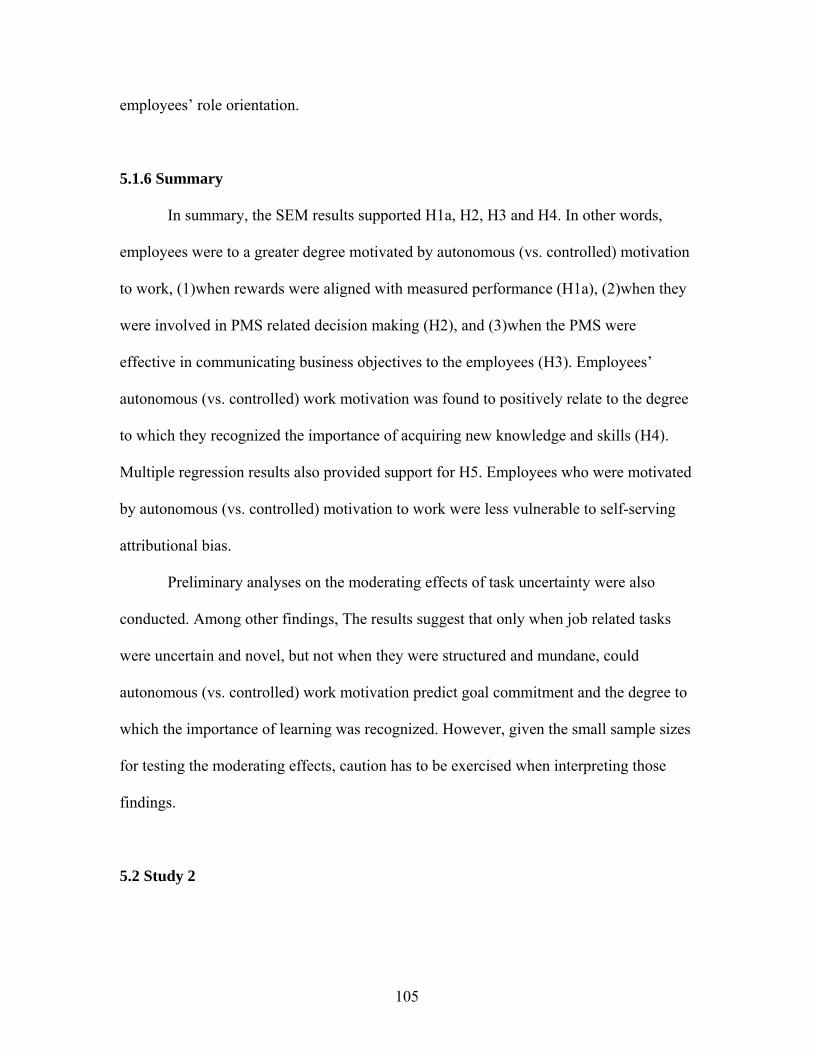
105
employees’ role orientation.
5.1.6 Summary
In summary, the SEM results supported H1a, H2, H3 and H4. In other words,
employees were to a greater degree motivated by autonomous (vs. controlled) motivation
to work, (1)when rewards were aligned with measured performance (H1a), (2)when they
were involved in PMS related decision making (H2), and (3)when the PMS were
effective in communicating business objectives to the employees (H3). Employees’
autonomous (vs. controlled) work motivation was found to positively relate to the degree
to which they recognized the importance of acquiring new knowledge and skills (H4).
Multiple regression results also provided support for H5. Employees who were motivated
by autonomous (vs. controlled) motivation to work were less vulnerable to self-serving
attributional bias.
Preliminary analyses on the moderating effects of task uncertainty were also
conducted. Among other findings, The results suggest that only when job related tasks
were uncertain and novel, but not when they were structured and mundane, could
autonomous (vs. controlled) work motivation predict goal commitment and the degree to
which the importance of learning was recognized. However, given the small sample sizes
for testing the moderating effects, caution has to be exercised when interpreting those
findings.
5.2 Study 2
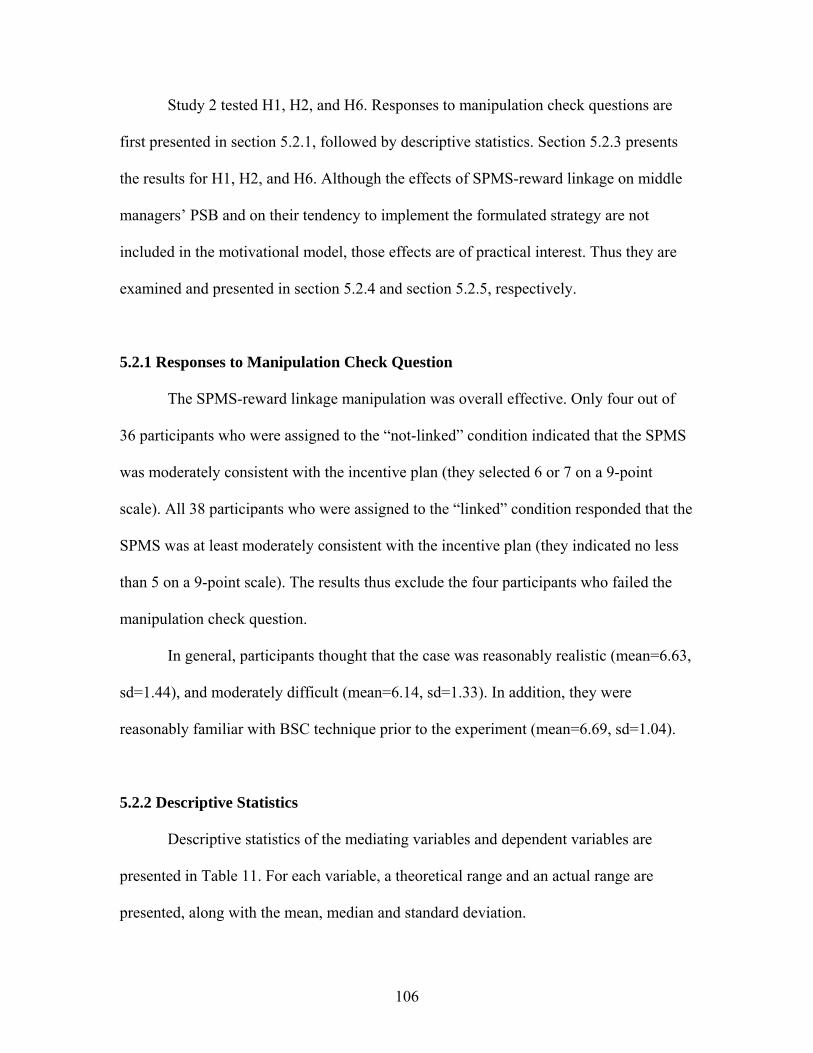
106
Study 2 tested H1, H2, and H6. Responses to manipulation check questions are
first presented in section 5.2.1, followed by descriptive statistics. Section 5.2.3 presents
the results for H1, H2, and H6. Although the effects of SPMS-reward linkage on middle
managers’ PSB and on their tendency to implement the formulated strategy are not
included in the motivational model, those effects are of practical interest. Thus they are
examined and presented in section 5.2.4 and section 5.2.5, respectively.
5.2.1 Responses to Manipulation Check Question
The SPMS-reward linkage manipulation was overall effective. Only four out of
36 participants who were assigned to the “not-linked” condition indicated that the SPMS
was moderately consistent with the incentive plan (they selected 6 or 7 on a 9-point
scale). All 38 participants who were assigned to the “linked” condition responded that the
SPMS was at least moderately consistent with the incentive plan (they indicated no less
than 5 on a 9-point scale). The results thus exclude the four participants who failed the
manipulation check question.
In general, participants thought that the case was reasonably realistic (mean=6.63,
sd=1.44), and moderately difficult (mean=6.14, sd=1.33). In addition, they were
reasonably familiar with BSC technique prior to the experiment (mean=6.69, sd=1.04).
5.2.2 Descriptive Statistics
Descriptive statistics of the mediating variables and dependent variables are
presented in Table 11. For each variable, a theoretical range and an actual range are
presented, along with the mean, median and standard deviation.
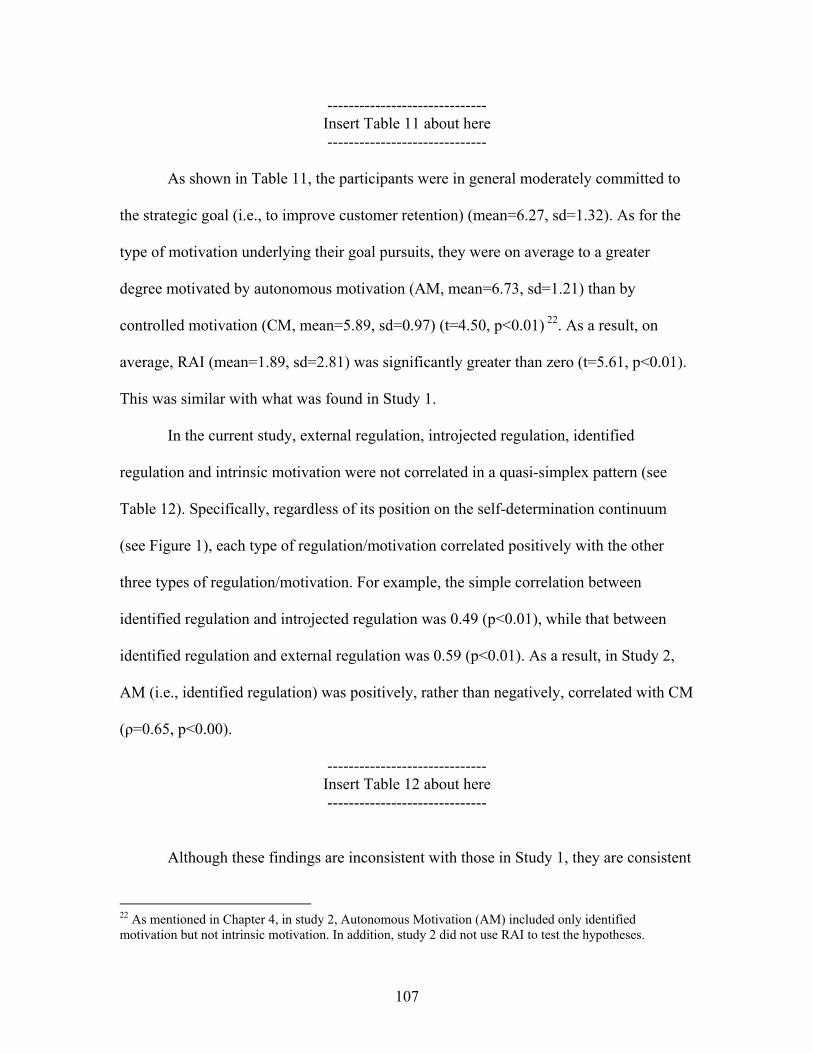
107
------------------------------ Insert Table 11 about here ------------------------------
As shown in Table 11, the participants were in general moderately committed to
the strategic goal (i.e., to improve customer retention) (mean=6.27, sd=1.32). As for the
type of motivation underlying their goal pursuits, they were on average to a greater
degree motivated by autonomous motivation (AM, mean=6.73, sd=1.21) than by
controlled motivation (CM, mean=5.89, sd=0.97) (t=4.50, p<0.01) 22. As a result, on
average, RAI (mean=1.89, sd=2.81) was significantly greater than zero (t=5.61, p<0.01).
This was similar with what was found in Study 1.
In the current study, external regulation, introjected regulation, identified
regulation and intrinsic motivation were not correlated in a quasi-simplex pattern (see
Table 12). Specifically, regardless of its position on the self-determination continuum
(see Figure 1), each type of regulation/motivation correlated positively with the other
three types of regulation/motivation. For example, the simple correlation between
identified regulation and introjected regulation was 0.49 (p<0.01), while that between
identified regulation and external regulation was 0.59 (p<0.01). As a result, in Study 2,
AM (i.e., identified regulation) was positively, rather than negatively, correlated with CM
(ρ=0.65, p<0.00).
------------------------------ Insert Table 12 about here ------------------------------
Although these findings are inconsistent with those in Study 1, they are consistent
22 As mentioned in Chapter 4, in study 2, Autonomous Motivation (AM) included only identified motivation but not intrinsic motivation. In addition, study 2 did not use RAI to test the hypotheses.
108
with those of other studies (e.g., Ryan & Connell, 1989; Pelletier, Fortier, Vallerand, and
Brière 2001; Levesque and Pelletier, 2003). For example, Ryan and Connell (1989) found
positive associations between intrinsic motivation and the introjected and identified
regulation. More recently, research by Levesque and Pelletier (2003) found that a
significant percentage of their study participants could not clearly be classified as
motivated by autonomous or “heteronomous” (non-self-determined) motivation because
they were both. Together, the findings of SDT-based studies suggest that individuals can
be motivated by both autonomous and controlled motivation simultaneously.
Recall that four measures of issue selling behavior (ISB) were used to measure
managers’ tendency to engage in PSB. Those four measures were: the indicated
likelihood to “sell” to the executives an issue that challenged the validity of the current
strategy at stage 1 (ISB1), at stage 2 (ISB2) and at stage 3 (ISB3), and the likelihood to
suggest to the executives an alternative strategic plan (ISB4). The means of all four ISB
measures (means=6.90, 7.23, 8.17, and 7.50 for ISB1, ISB2, ISB3 and ISB4,
respectively) were significantly greater than the middle point of 5 (p<0.01 for all four
measures), suggesting that, in general, managers were more likely than not to bring those
critical issues to the awareness of the top management.
More importantly, the means of ISB measures suggest that on average participants
were more likely to sell an issue at a later stage (i.e., at stage 3) than at earlier stages (i.e.,
at stage 1 and stage 2). Repeated measures Analyses of Variance (ANOVA) were then
conducted to test such pattern. Planned comparison results suggested that in general,
participants were indeed more likely to sell the issue at stage 2 than at stage 1 (t=2.20,
p=0.02), and were more likely to sell the issue at stage 3 than at stage 2 (t=8.52, p<0.01).
109
This pattern provides support for what has been argued by Dutton and Ashford (1993).
Specifically, to avoid human capital risk, the issue “seller” tends to sell issues at a later
stage when solutions can be attached, rather than selling them at an earlier stage when top
management can get multiple inputs. Hence, initiatives that enhance employees’
proactivity in issue selling are necessary.
5.2.3 Tests of H1, H2 and H6
H1a predicted that when performance measurement systems are linked with
reward systems, compared with when they are not, employees are to a greater degree
motivated by autonomous (vs. controlled) motivation. H1b predicts the same relationship
but in the opposite direction. To test H1a and H1b, a 2 X 2 Multivariate Analysis of
Variance (MANOVA) was first conducted with the two manipulated factors as
independent variables, and the following as dependent variables: Goal Commitment, AM
and CM. The results suggested that when SPMS was linked with the reward system,
middle managers were more committed to the strategic goal (F(1,66)=43.10, p<0.01) and
were to a greater degree motivated by CM (F(1,66)=2.66, p=0.05, one-tailed).
Meanwhile, when SPMS was linked with reward systems, middle managers were also to
a greater degree motivated by AM (F(1,66)=5.25, p=0.03). In other words, linking SPMS
with incentives enhanced not only managers’ controlled but also their autonomous
motivation. Therefore, the results provided mixed support for both H1a and H1b.23
23 As a sensitivity test, RAI was used as a measure of autonomous (vs. controlled) motivation and included as dependent variable in the MANOVA. In other words, Goal Commitment and RAI were regressed on the two manipulated variables. The results of this analysis showed that the effect of SPMS-reward linkage on RAI was not significant (F(1,66)=0.53, p=0.47). However, as noted before, RAI was not a good measure of autonomous (vs. controlled) motivation in study 2 because the intrinsic motivation question did not make much sense to the participants.
110
Supplementary analysis (see section 5.2.4.1) was performed to explore why the linkage
between rewards and performance measures led to higher level of autonomous
motivation.
H2 predicted that the more employees are involved in PMS related decision
making processes, the more they are motivated by autonomous (vs. controlled)
motivation. The results from the above-mentioned MANOVA showed that the main
effect of participative decision making (or more specifically, the main effect of
participation in the strategic validity control) on all three dependent variables were
insignificant (for Goal Commitment, F(1, 66)=0.1, p=0.82; for AM, F(1, 66)=1.3,
p=0.27; and for CM, F(1,66)=0.1, p=0.73). Therefore, H2 was not supported. ISB
measures were further included in the MANOVA to examine whether the manipulation
of participative decision making had any impact on ISB. Results showed that for all four
measures of ISB, the main effect of strategic validity control procedure was insignificant
(F(1,66)<0.50, p > 0.50). The interaction effect between participative decision making
and SPMS-reward linkage was also insignificant. It appears that the manipulation of
participative decision making did not have an effect on any of the dependent variables.
H6 predicted that the more employees were motivated by autonomous (vs.
controlled) motivation, the more likely they were to engage in PSB. To test H6, path
analysis was conducted. Specifically, Goal Commitment, AM and CM were used to
predict four inter-correlated measures of ISB, i.e., IS1, IS2, IS3 and IS4. As mentioned in
Chapter 4, Goal Commitment was included in the model in order to examine the impact
of the type of motivation on ISB over and beyond the effect of Goal Commitment. A
saturated structure model (see Figure 17) was first estimated. In this saturated model, all
111
the residual terms associated with the four ISB measures were allowed to correlate
among each other and the correlation among the three predictors were also estimated.
These configurations provide a just identified model, i.e., the degree of freedom equals
zero.
------------------------------ Insert Figure 17 about here ------------------------------
To increase the degrees of freedom so that the model could be rejected and the
model fit could be evaluated (Byrne 2001), the only insignificant correlation between the
residual terms (i.e. r2 and r3) was first constrained to zero. The following insignificant
path coefficients were then constrained to zero in sequence to further improve the
parsimony of the model: (1)CM ISB4 (c.r.=0.38), (2)AM ISB2 (c.r.=0.10), (3)Goal
Commitment ISB1 (c.r.=1.18). The Chi-square difference tests showed that the above
constraints did not lead to inferior model fits (∆χ²=1.27, p=0.26 for constraining the
correlation between r2 and r3; ∆χ²=0.15, p=0.70 for constraining the above path (1);
∆χ²=0.01, p=0.92 for constraining the above path (2); ∆χ²=1.39, p=0.24 for constraining
the above path (3)). The constrained model (see Figure 18) provided an adequate fit (Chi-
square [df=4] =2.82, p=0.59; χ²/df=0.71; NFI=1.00; CFI=1.00; TLI=1.00;
RMSEA=0.08). The path coefficient estimates from the constrained model (see Figure
19) were used to test H6.
------------------------------ Insert Figure 18 about here ------------------------------ ------------------------------
Insert Figure 19 about here ------------------------------
112
Based on the path coefficient estimates from the constrained model, H6 was in
general supported. As predicted, AM was positively associated with all measures of ISB
except for ISB2. Specifically, AM positively predicted ISB1 (standardized
coefficient=0.86, p<0.01), ISB3 (standardized coefficient=0.62, p<0.01) and ISB4
(standardized coefficient=0.31, p=0.01). This suggests that the more middle managers
were motivated by autonomous motivation to achieve the strategic goal, the more likely
they were to challenge the validity of the current strategy and in a timely manner, and the
more likely they were to suggest alternative strategic plans. In contrast, CM was
negatively associated with ISB1 (standardized coefficient=-0.22, p=0.02) and ISB 2
(standardized coefficient=-0.24, p=0.08), positively associated with ISB3 (standardized
coefficient =0.23, p<0.01), and was not associated with ISB 4. It appeared that the more
middle managers were motivated by controlled motivation to achieve the strategic goal,
the more likely they were to withhold their knowledge about potential problems from top
management untill they figured out solutions to solve them.
In addition, Goal Commitment was positively associated with all measures of ISB
except for ISB1. Specifically, Goal Commitment positively predicted ISB2 (standardized
coefficient=0.44, p<0.01), ISB3 (standardized coefficient=0.21, p<0.01) and ISB4
(standardized coefficient=0.43, p<0.01). Therefore, goal commitment was important in
predicting the tendency to challenge the validity of strategy at later stages (i.e., stage 2
and stage 3), but not important in predicting it at the earliest stage (i.e., stage 1). Goal
Commitment was also important in predicting middle managers’ tendency to suggest
alternative plans to top management.
113
5.2.4 Supplemental Analyses
5.2.4.1 Effect of SPMS-Reward Linkage on Autonomous Motivation
Following Baron and Kenny (1986), a mediation test was conducted and
suggested that the positive effect of SPMS-reward linkage on participants’ autonomous
motivation was fully mediated by their perceived fairness in the reward system24.
Specifically, the SPMS-reward linkage significantly increased the perceived fairness
(standardized coefficient=0.69, p<0.01), and it significantly increased autonomous
motivation in the absence of the perceived fairness (standardized coefficient=0.27,
p=0.02). Moreover, the perceived fairness had a significant effect on autonomous
motivation (standardized coefficient=0.50, t=4.71, p<0.01). When regressing autonomous
motivation on both SPMS-reward linkage and the perceived fairness, the coefficient for
SPMS-reward linkage was no longer significant (standardized coefficient=-0.14, t=-0.97,
p=0.33). An alternative strategy for testing the mediating effect was the Sobel test (Sobel
1982), of which the result also indicated that perceived fairness significantly mediated the
relation between SPMS-reward linkage and autonomous motivation (t=4.04, p<0.01).
Therefore, linking SPMS with rewards increased middle manager’s perceived fairness in
the reward system, which in turn improved their autonomous motivation to achieve
strategic goals.
5.2.4.2 Effect of SPMS-Reward Linkage on Middle Managers’ Issue Selling
Behavior
24 The perceived fairness in the reward system was measured subsequent to the manipulation check question (see Chapter 4). Specifically, participants were asked to indicate on a 9-point scale the extent to which they believed that they would be fairly rewarded by the Incentive Plan if they performed well on the BSC measures.
114
Recall that in this experiment, the SPMS-reward linkage increased not only
autonomous motivation but also controlled motivation among middle managers. Since
autonomous motivation was found to enhance middle managers’ proactivity in selling
critical issues whereas controlled motivation appeared to weaken such a tendency, the
effect of SPMS-reward linkage on middle managers’ ISB was indeterminate. Given that
how the linkage between SPMS and rewards may impact middle managers’ PSB has
significant practical implication, additional analysis was conducted to explicitly examine
such an effect.
A two-way MANOVA was conducted with the two manipulated factors as
independent variables and the four measures of ISB as dependent variables. Results show
that when the SPMS was linked with the reward (versus when it was not), middle
managers were more likely to challenge the current strategy at stage 2 (F(1,68)=4.4,
p=0.04) and stage 3 (F(1,68)=6.3, p=0.01), but not more so at stage 1 (F(1,68)=1.1,
p=0.29). Moreover, SPMS-reward linkage did increase the likelihood for middle
managers to suggest alternative plans to the executives (F(1,68)=7.3, p<0.01). Therefore,
similar with goal commitment, linking rewards with SPMS was important in increasing
middle managers’ tendency to challenge strategies at later stages (i.e., stage 2 and stage
3), but not important in increasing such a tendency at the earliest stage (i.e., stage 1).
Such linkage was also important in enhancing middle managers’ tendency to suggest
alternative plans to top management.
5.2.4.3 Effect of SPMS-Reward Linkage on Strategy Implementation
This experiment also tested the impact of SPMS-reward linkage on middle
115
managers’ intention to implement the strategy. Recall that before being exposed to any
information that suggested the need for revising the strategy, the participants were asked
to rank the priority for funding among four projects. Supposedly, the higher (lower)
priorities the participants assigned to the two strategy-consistent projects, the more (less)
inclined they were to allocate limited resources in a way that strategy implementation
was facilitated.
A weight measure was created to proxy for the resources allocated to the two
strategy-consistent projects (i.e., project #1 and #4) relative to the two strategy-
inconsistent projects (i.e., project #2 and #3). The weight was calculated as follows. If a
project was ranked as first in terms of priority for funding, the weight assigned to this
project was 0.4; if ranked as second, the weight was 0.3; if ranked as third, the weight
was 0.2; and if ranked as fourth, the weight was 0.1. Therefore, the higher (lower) the
strategy-consistent projects were ranked, the more (less) resources or “weight” was
allocated to implement them, which indicated that the more (less) willing the manager
was to implement the formulated strategy.
As shown in Table 7, in general participants divided the discretionary funds
equally between the strategy-consistent projects (on average 51.9% of the weight) and the
strategy-inconsistent projects (on average 48.1% of the weight). A one-way ANOVA25
was conducted with SPMS-reward linkage as the independent variable and the weight
assigned to the two strategy-consistent projects as dependent variable. The results showed
that participants in the linked condition (mean=65%, sd=0.09) allocated significantly
more weight to the strategy-consistent projects than did those in the not-linked condition
25 Note that resource allocation decision was made prior to the strategic validity control manipulation; thus, the strategic validity control factor should not have an impact on resource allocation decision. Therefore, a one-way, rather than two-way ANOVA, was conducted.
116
(mean=36%, sd=0.10) (F(1,68) =165.5, p<0.00). This suggests that when reward systems
were linked with SPMS, middle managers allocated resources in a way that facilitated the
implementation of the strategy. In contrast, when the two systems were not aligned, they
might allocate significant amount of resources to activities that did not carry strategic
importance.
5.2.5 Summary
In summary, results from Study 2 provide mixed support for both H1a and H1b.
Specifically, the link between SPMS and reward systems enhanced not only middle
managers’ autonomous but also their controlled motivation to strive for strategic
objectives. Such a linkage also increased the level of middle managers’ commitment to
strategic goals. The results also provide support for H6. In particular, middle managers’
autonomous motivation was positively associated with their tendency to carry out one
type of proactive strategic behavior, i.e., issue selling behavior. In contrast, controlled
motivation in general was negatively associated with such a tendency. H2 was not
supported by the results possibly due to the ineffective manipulation of participative
decision making. Chapter 6 provides detailed post hoc explanation for the failure to
support H2.
117
CHAPTER SIX
DISCUSSION AND CONCLUSION 6.1. Summary of Results 6.1.1 Results of Hypotheses Tests
Six hypotheses were tested in two studies. Study 1 consisted of structural equation
modeling (SEM) analyses of survey data that was collected among non-management
employees and lower-level managers. It tested H1, H2, H3, H4 and H5 based on the path
coefficients estimates derived from the SEM analyses (see Figure 12). Study 2 consisted
of a case-based experiment with participants assuming the role of lower-level managers.
It tested H1, H2 and H6. This section summarizes the results of the hypotheses tests and
discusses their implications.
H1 predicted that when reward systems were aligned with performance
measurement systems, compared with when they were not, employees would be more
(H1a) or less (H1b) motivated by autonomous (vs. controlled) motivation to work. The
results were mixed. Study 1 supported H1a, whereas Study 2 partially supported H1a and
H1b. Specifically, Study 1 showed that the linkage between rewards and measured
performance was positively associated with employees’ autonomous (vs. controlled)
work motivation. Study 2 suggested that the linkage between rewards and strategic
performance measurement systems (SPMS) led to both a higher level of autonomous
motivation and a higher level of controlled motivation (at the 0.10 level for the latter
relation).
In general, the findings appeared to be inconsistent with cognitive evaluation
theory (CET)’s argument that performance-contingent reward is often perceived as
118
controlling in nature and therefore undermines individual’s self motivation. Additional
analysis was therefore performed to explore why the linkage between rewards and
performance measures led to higher level of autonomous motivation. The mediation test
conducted on Study 2 data suggested that the positive effect of SPMS-reward linkage on
participants’ autonomous motivation was fully mediated by their perceived fairness in the
reward system. Therefore, the post hoc evidence suggested that when rewards were
linked with measured performance, compared with when they were not, employees
would view the reward systems as more fair, which in turn might result in a higher level
of autonomous motivation.
An alternative explanation for the mixed results on H1a and H1b is provided by
CET. Recall that CET argues that every reward has both a controlling aspect and an
informational aspect and the relative salience of these two aspects will determine whether
a reward undermines or enhances intrinsic motivation (Deci 1975; Deci and Ryan 1980).
It is likely that, in Study 1 and Study 2, the survey respondents and experiment
participants viewed the informational aspect of the performance-contingent rewards as
salient as or even more salient than their controlling aspect. Yet, further research is
needed before any conclusion can be drawn.
H2 predicted that the more they participated in performance management systems
(PMS) related decision making, the more employees were motivated by autonomous (vs.
controlled) motivation to work. The results again were mixed. Study 1 supported H2,
whereas Study 2 did not support it. Specifically, Study 1 showed that employees were to
a greater (lesser) degree motivated by autonomous (vs. controlled) work motivation when
they were to a greater (lesser) degree involved in the following decision making
119
processes: the performance measure selection, goal setting, and performance appraisal. In
other words, participative decision making in the PMS domain enhanced employees’
autonomous motivation. This finding is in contrast to the argument that the primary
benefit of participative decision making is cognitive rather than motivational (e.g., Locke,
Alavi, and Wagner 1997).
Study 2 did not support the prediction that middle managers’ autonomous (vs.
controlled) motivation would be enhanced by their involvement in a specific decision
making process, i.e., the strategic validity control. Specifically, when middle managers
were engaged in the process of monitoring the validity of strategies and suggesting ways
to revise them if necessary, compared to when they were not involved in this process,
they were not more motivated by autonomous (vs. controlled) motivation to strive for
strategic goals. One possible cause for failure to support H2 was the ineffectiveness of
the manipulation. Recall that the manipulation involved informing the participants about
the bi-monthly strategic validity control procedure and asking them to consider revising
the strategy in response to another manager’s concern. This manipulation was possibly
not engaging enough to satisfy participants’ needs for autonomy and competence as
predicted. An alternative manipulation is to encourage the participants to critique the
strategy freely, and then provide them with feedback from the “executives” showing how
their opinions have significantly influenced strategy formulation.
H3 predicted that the more effective PMS were in communicating business
objectives to employees, the more employees were motivated by autonomous (vs.
controlled) motivation to work. This hypothesis was supported by Study 1. In particular,
employees were to a greater degree motivated by autonomous (vs. controlled) motivation
120
if PMS communicated to them clearly how performance measures were related to
business objectives and why the performance targets were set the way there were.
As noted in Chapter 3, when implemented properly, SPMS presents employees
with business causal linkages that clearly explain how various operations and
performance measures relate to the ultimate strategic objectives (Kaplan and Norton
1996). Based on the results of H3, one may argue that by providing employees with
business causal linkages, SPMS not only have informational benefit as demonstrated by
Chenhall (2005), but also have motivational benefits in that ceteris paribus, the adoption
of SPMS may enhance employees’ autonomous (vs. controlled) work motivation.
H4 predicted that autonomous (vs. controlled) work motivation positively
predicted one dimension of role orientation, i.e., the degree to which employees view
learning as an important part of their job. H4 was supported by Study 1. In particular, the
more they were motivated by autonomous (vs. controlled) motivation to work, the more
employees recognized the importance of acquiring new knowledge and skills. Therefore,
given the difficulty for transforming employees’ role orientation (Parker et al. 1997),
measures that enhance employees’ autonomous work motivation are critical.
H5 predicted that when they were to a greater degree motivated by autonomous
(vs. controlled) motivation, employees were less vulnerable to self-serving attribution
bias, i.e., a tendency to take credit for good performance and deny responsibility for poor
performance. The results from Study 1 provided support for H5. In particular, employees
whose relative autonomy score was higher than the median did not demonstrate self-
serving attributional bias. In other words, among those employees, the level of internal
attribution they made was not influenced by their performance level.
121
As argued in Chapter 3, self-serving attribution bias can be harmful in that it may
result in conflicts among coworkers and conflicts between subordinates and superiors. In
addition, the inclination to deny responsibility at times of failure may also hinder
effective learning from mistakes. The results of H5 thus suggest a potential way to
overcome such bias, i.e., enhancing employees’ autonomous (vs. controlled) work
motivation.
H6 predicted a positive effect of autonomous (vs. controlled) work motivation on
employees’ proactive strategic behavior (PSB). This hypothesis was in general supported
by Study 2. This study tested the effect of autonomous (vs. controlled) motivation on
middle managers’ tendency to engage in a specific type of PSB, i.e., issue selling
behavior (ISB). The results showed that the more middle managers were motivated by
autonomous motivation, the more likely they were to sell critical issues to top
management and in a timely manner. In contrast, the more middle managers were
motivated by controlled motivation, the more likely they were to withhold their
knowledge about potential problems until they figured out solutions to solve them.
Importantly, the effect of autonomous and controlled motivation on middle
managers’ ISB was significant after the effect of goal commitment was controlled for.
Indeed, a higher level of goal commitment did not lead to middle managers’ greater
tendency to sell critical issues at the earliest stage, although it did lead to their greater
tendency to do so at later stages. Therefore, compared with the level of commitment to
strategic goals, the type of motivation underlying such commitment is a stronger
predictor of employees’ proactivity in influencing strategy formation. This finding is
consistent with SDT’s fundamental notion that not only the amount, but also the nature,
122
of motivation matters.
6.1.2 Moderating Effects of Task Uncertainty
Gagné and Deci (2005) argue that autonomous motivation enhances effective
performance and individuals’ well-being “particularly if the task requires creativity,
cognitive flexibility, or deep processing of information” (p. 341). Thus, in working
settings, autonomous motivation may be especially important for employees whose job
related tasks are novel and uncertain, instead of routine and structured. Study 1 conducted
additional analyses to examine the moderating effects of task uncertainty (TU).
To test such moderating effects, a median split was conducted on the score of TU,
and the SEM model was estimated separately on the high TU sample and the low TU
sample. Results showed that the “optimal” model for the whole sample (model C) fit the
high TU sample well, which suggested that the above-mentioned results on H1, H2, H3,
and H4 held among employees whose job related tasks were relatively novel and
uncertain. However, this model did not fit the low TU sample well. A series of model
modifications were then performed and an optimal model for the low TU sample (model
D) was derived. A comparison between the path coefficient estimates from model D for
the low TU sample and those from model C for the high TU sample suggested the
moderating effects of TU on some of the proposed relations. However, given the small
sample sizes in testing the moderating effects, the findings should be interpreted with
care.
6.1.3 Effects of Linking SPMS with Reward Systems
123
As mentioned in Chapter 3, whether or not reward systems should be linked with
multiple dimensions of performance is controversial in the accounting literature. Both
advantages and disadvantages of making such linkages have been demonstrated.
Additional analyses were conducted in Study 2 to examine the effects the SPMS-reward
linkage has on variables other than autonomous and controlled motivation.
The results showed that linking the bonus plan with the SPMS increased middle
managers’ propensity to challenge current strategies at later stages although not at the
earliest stage. Such linkage also increased their tendency to suggest alternative strategic
plans to the top management. Moreover, when the bonus plan was linked with the SPMS,
compared with when it was not, middle managers prioritized the funding of projects that
bear strategic importance over projects that did not. Recall that the SPMS-reward linkage
enhanced middle managers’ autonomous as well as their controlled motivation to achieve
strategic goals, and also increased their commitment to those goals. Taking all the above-
mentioned findings together, it appeared that aligning reward systems with SPMS was
overall beneficial.
6.2 Conclusions
This research applies self-determination theory (SDT) of motivation to
performance management systems (PMS) and proposes a motivational model for
studying PMS. In this model, the design characteristics of PMS influence the nature of
employees’ motivation, which in turn affects their job related cognition, behaviors and
affective experience. Data from both a survey (Study 1) and an experiment (Study 2)
were used to test hypotheses derived from the proposed motivation-based model.
124
The results from the two studies in general suggest that employees were to a
greater degree motivated by autonomous (vs. controlled) motivation to work, (a) when
reward systems were aligned with performance measurement systems including strategic
performance measurement systems (SPMS); (b) when employees participated in PMS
related decision making such as selecting performance measures and setting performance
targets; and (c) when the PMS clearly communicated business objectives to the
employees. The results also demonstrate a few important benefits of employees’
autonomous (vs. controlled) work motivation. Specifically, autonomous (vs. controlled)
work motivation was positively associated with the degree to which employees
recognized the importance of new knowledge and skills, was positively related with their
proactivity in influencing strategy formation, and was negatively associated with their
self-serving attribution bias.
6.3 Contributions The paper contributes to both the PMS literature and the SDT literature. First,
Bonner and Sprinkle (2002) urge researchers to examine the effect that motivators
(incentives) have on multiple components of employees’ effort. Specifically, following
prior studies’ (Kahneman 1973; Bettman, Johnson, and Payne 1990; Kanfer 1990; and
Locke and Latham 1990) conceptualization of effort, Bonner and Sprinkle (2002) urge
researchers to examine how incentives impact not only the effort duration and intensity,
but also the effort direction and the effort directed toward learning. This paper extends
the management control literature by studying how PMS designs may impact the
direction of employees’ effort as well as their effort directed toward learning. In
particular, this paper examines how employees react to PMS characteristics in terms of
125
their tendency to proactively influence strategy formation and to acquire new knowledge
and skills.
Second, this paper contributes to the PMS literature by exploring the “black box”
of employees’ motivational processes. As argued in Chapter 2, the current agency theory
based incentives literature lacks studies that directly examine the motivational
mechanism through which incentives impact employees’ effort and performance. In
addition, current performance management practices such as budgeting processes have
been broadly criticized for their control mindset and other attributes (Hansen et al. 2003),
and solutions such as SPMS are proposed to address those issues. Therefore, at the
practical level, by adopting a behavioral approach this paper provides some insight in
why negative effects of PMS may exist and how proposed initiatives may help to
improve the situation.
Third, this paper contributes to the SDT literature in a few ways. First, it finds
support for a couple of important notions of SDT at work settings: (1) not only the
quantity or amount, but also the quality or nature, of individuals’ motivation matters; (2)
autonomous motivation is important especially when the task requires creativity,
flexibility and deep processing of information. (Gagné and Deci 2005)
More importantly, it extends SDT-based research on the contextual factors that
foster/forestall employees’ autonomous motivation. Extant research in this area focuses
on two types of contextual factors: specific job characteristics and superior’s
interpersonal style (Gagné and Deci 2005). Following Sheldon, et al.’s (2003) suggestion,
this paper goes "further back" and investigates “higher-order contextual factor,” i.e., the
organization’s PMS design. Such an endeavor is important because higher-order
126
contextual factors such as the design of PMS could be longer lasting and possibly more
pervasive in influencing employees’ motivation than are specific job characteristics and
superiors’ interpersonal style.
Last but not least, this paper sheds some light on the debate on whether
performance-contingent rewards forestall or foster autonomous motivation at work.
Results from both studies tend to support Eisenberger and his colleagues’ view that
performance-contingent reward enhances rather than undermines employees’ self-
determination.
6.4 Limitations
The findings of this paper should be interpreted in conjunction with its
limitations. First, since cross-sectional data was used by Study 1 to test the majority of
the hypotheses, one may feel less confident in drawing causal inferences from the results
(Spector 1994). The causality problem was partially addressed by Study 2, which
employed an experiment to test some but not all the hypotheses.
Second, in terms of measurement, variables measured by self-reports may be
subject to self-perception biases. For example, if participants indicated that they would
engage in issue selling behavior, they might not actually do so in a real situation. In
addition, Kunz and Pfaff (2002) argue that individuals may not have direct knowledge of
their motives; thus using self-reports to determine the type of work motivation can be
problematic. Moreover, the scales used to measure role orientation and strategic
orientation (Parker et al. 1997) were developed for manufacturing companies, and may
not be suitable for employees in other industries.
127
Third, post hoc modifications of structural models were used to derive the
“optimal” models in Study 1. According to MacCallum et al. (1992), “optimal” models
derived through post hoc modifications may not be replicable in a different sample
especially when sample size is small. Therefore, the results from Study 1 need to be
validated using other samples.
Finally, in Study 2, the participative decision making (i.e., participation in
strategic validity control) manipulation did not impact middle managers’ motivation and
their issue selling behavior. It is possible that in this experimental setting, the
manipulation was not effective in enhancing participants’ autonomous (vs. controlled)
motivation. Future research is needed to examine other procedures that potentially
enhance middle managers’ autonomous motivation.
6.5 Future Research
The present paper inspects only three characteristics of PMS as potential
antecedents to employees’ autonomous and controlled motivation. Other characteristics
of PMS can be examined by future research. One example is the use of relative
performance evaluation and competitively contingent reward, i.e., evaluating employees
by ranking them with their peers. Economics-based research (e.g., Frederickson 1992;
Matsumura and Shin 2006) argues that if common uncertainties are high, relative
performance information helps the principal filter out noise in measuring the agent’s
effort level. As a result, the performance evaluation will be more accurate, and the agent
will be to a lesser degree exposed to common risks. However, SDT based research
suggests that competitively contingent reward may forestall autonomous work motivation.
128
Specifically, it is hold that both competition and contingent evaluation can forestall
autonomous motivation (Ryan and Deci 2000). Vansteenkiste and Deci’s (2003)
empirical study suggests that the use of competitively contingent rewards hurts
individuals’ intrinsic motivation.
According to SDT based research, other characteristics of PMS, such as the type
of measures (outcome measures vs. process measures; and short-term measures vs. long-
term measures) that are included in the performance measurement systems and the nature
of the feedback that employees receive about their performance, may also have
significant effect on autonomous and controlled work motivation.
In addition, preliminary evidence presented in Study 1 suggests that task
uncertainty may moderate the relation between characteristics of PMS and autonomous
(vs. controlled) work motivation. Further research on such moderating effect has
implications for both theory and practice.
128
REFERENCES Allen, N. J., and J. P. Meyer. 1996. Affective, continuance, and normative commitment
to the organization: An examination of construct validity. Journal of Vocational Behavior 49: 252–276.
Amabile, T. M. 1982. Children’s artistic creativity: Detrimental effects of competition in
a field setting. Personality and Social Psychology Bulletin 8: 573-578. Amabile, T. M., P. Godfarb, and S. C. Brackfield. 1990. Social influences on creativity:
evaluation, coaction, and surveillance. Creativity Research Journal (3): 6-21. Amabile, T. M., B. A. Hennessey, and B. S. Grossman. 1986. Social influences on
creativity: The effects of contracted-for reward. Journal of Personality and Social Psychology 50 (1):14-23.
Anderson, J. C., and D. W. Gerbing. 1988. Structural equation modeling in practice: A
review and recommended two-step approach. Psychological Bulletin 103: 411-423.
Argyris, C. 1973. Organization man: Rational and self-actualizing. Public Administration
Review 33 (July/August): 354-357. Axtell, C. M., and S. K. Parker. 2003. Promoting role breadth self-efficacy through
involvement, work design, and training. Human Relations 56: 112-131. Baard, P. P., E. L. Deci, and R. M. Ryan. 2004. The relation of intrinsic need satisfaction
to performance and wellbeing in two work settings. Journal of Applied Social Psychology 34: 2045–2068.
Baiman, S., and B.L. Lewis. 1989. An experiment testing the behavioral equivalence of
strategically equivalent employment contracts. Journal of Accounting Research 27: 1-20.
Banker, R. D., S. M. Datar. 1989. Sensitivity, precision, and linear aggregation of signals
for performance evaluation. Journal of Accounting Research 27(1): 21-39. Baron, R. M., and D. A. Kenny. 1986. The moderator-mediator variable distinction in
social psychological research: Conceptual, strategic, and statistical considerations. Journal of Personality and Social Psychology 51: 1173-1182.
Bentler, P. M. 1990. Comparative fit indexes in structural models. Psychological Bulletin
107: 238-246. Bentler, P. M., and D. G. Bonett. 1980. Significance tests and goodness of fit in the
analysis of covariance structures. Psychological Bulletin 88: 588-606.
129
Benware, C., and E. L. Deci. 1984. Quality of learning with an active versus passive
motivational set. American Educational Research Journal 21: 755–765. Berg, J. E., L. A. Daley, J. W. Dickhaut, and J. O’Brien. 1992. Moral hazard and risk
sharing: Experimental evidence. Research in Experimental economics 5: 1-34. Bettman, J. R., E. J. Johnson, and J. W. Payne. 1990. A com-potential analysis of
cognitive effort in choice. Organizational Behavior and Human Development Processes 45: 111-139.
Bober, S., and W. Grolnick. 1995. Motivational factors related to differences in self-
schemas. Motivation and Emotion 19: 307–327. Bollen, K. A. 1989. A new incremental fit index for general structural models.
Sociological Methods and Research 17: 303-316. Bonner, S. E., and G. B. Sprinkle. 2002. The effects of monetary incentives on effort and
task performance: Theories, evidence, and a framework for research. Accounting, Organizations and Society 27: 303-345.
Bono, J. E., and T. A. Judge. 2003. Self-concordance at work: Understanding the
motivational effects of transformational leaders. Academy of Management Journal 46: 554–571.
Browne, M. W., and R. Cudeck. 1993. Alternative ways of assessing model fit. In K. A.
Bollen and J. S. Long (Eds.), Testing Structural Equation Models (445-455). Newbury Park, CA: Sage.
Brownell, P., and A. Dunk. 1991. Task uncertainty and its interaction with budgetary
participation and budget emphasis: Some methodological issues and empirical investigation. Accounting, Organizations and Society 16: 693-703.
Brownell, P. and M. Hirst. 1986. Reliance on accounting information, budgetary
participation, and task uncertainty: Tests of a three-way interaction. Journal of Accounting Research 24(2): 241-249.
Byrne, B. M. 2001. Structural Equation Modeling with AMOS: Basic Concepts,
Applications, and Programming. Mahwah, NJ: Lawrence Erlbaum Associates Inc. Byrne, B. M., R. J. Shavelson, and B. Muthén. 1989. Testing for the equivalence of factor
covariance and mean structures: The issue of partial measurement invariance. Psychological Bulletin 88: 456-466.
130
Cawley, B. D., L. M. Keeping, and P. E. Levy. 1998. Participation in the performance appraisal process and employee reactions: A meta-analytic review of field investigations. Journal of Applied Psychology 83(4): 615-633.
Chenhall, R. H. 2005. Integrative strategic performance measurement systems, strategic
alignment of manufacturing, learning and strategic outcomes: An exploratory study. Accounting, Organizations and Society 30: 395-422.
Chenhall, R. H., and K. Langfield-Smith. 1998. The relationship between strategic
priorities, management techniques and management accounting: An empirical investigation using a systems approach. Accounting, Organizations and Society 23(3): 243-264.
Covaleski, M., J. Evans III, J. Luft, and M. Shields. 2003. Budgeting research: Three
theoretical perspectives and criteria for elective integration. Journal of Management Accounting Research 15: 3-49.
Datar, S., S. C. Kulp, R. A. Lambert. 2001. Balancing performance measures. Journal of
Accounting Research 39(1):75-92. Davis, J. H., Schoorman, F. D., and L. Donaldson. 1997. Toward a stewardship theory of
management. Academy of Management Review 22(1): 20-47. Deci, E. L. 1971. Effects of externally mediated rewards on intrinsic motivation. Journal
of Personality and Social Psychology 18: 105–115. Deci, E. L. 1972a. Effects of contingent and non-contingent rewards and controls on
intrinsic motivation. Organizational Behavior and Human Performance 8: 217-229.
Deci, E. L. 1972b. Intrinsic motivation, extrinsic reinforcement, and inequity. Journal of
Personality and Social Psychology 22: 113-120. Deci, E. L. 1975. Intrinsic Motivation. New York: Plenum. Deci, E. L., W. F. Cascio, and J. Krusell. 1975. Cognitive evaluation theory and some
comments on the Calder and Staw critique. Journal of Personality and Social Psychology 31: 81–85.
Deci, E. L., J. P. Connell, and R. M. Ryan. 1989. Self-determination in a work
organization. Journal of Applied Psychology 74: 580–590. Deci, E. L., H. Eghrari, B. C. Patrick, and D. R. Leone 1994. Facilitating internalization:
The self-determination theory perspective. Journal of Personality 62: 119–142.
131
Deci, E. L., R. Koestner, and R. M. Ryan. 1999. A meta-analytic review of experiments examining the effects of extrinsic rewards on intrinsic motivation. Psychological Bulletin 125: 627–668.
Deci, E. L., and R. M. Ryan 1980. The empirical exploration of intrinsic motivational
processes. In L. Berkowitz (Ed.), Advances in Experimental Social Psychology (13: 39–80). New York: Academic Press.
Deci, E. L., and R. M. Ryan 1985a. Intrinsic Motivation and Self-Determination in
Human Behavior. New York: Plenum. Deci, E. L., and R. M. Ryan 1985b. The general causality orientations scale: Self-
determination in personality. Journal of Research in Personality 19: 109–134. Deci, E. L., and R. M. Ryan. 2000. The "what" and "why" of goal pursuits: Human needs
and the self-determination of behavior. Psychological Inquiry 11: 227-268. Denton, G. A., and B. White. 2000. Implementing a balanced-scorecard approach to
managing hotel operations: The case of White Lodging Services. Cornell Hotel and Restaurant Administration Quarterly 41(1): 94-107.
De Ruyter, K., and M. Wetzels. 1999. Commitment in auditor-client relationships:
Antecedents and consequences. Accounting, Organizations and Society 24: 57-75. Dikolli, S.S. 2001. Agent employment horizons and contracting demand for forward-
looking performance measures. Journal of Accounting Research 39(3): 481-494. Ditto, P. H., and D. F. Lopez. 1992. Motivated skepticism: Use of decision criteria for
preferred and nonpreferred conclusions. Journal of Personality and Social Psychology 63: 568–584.
Dutta, S. and S. Reichelstein. 2003. Leading indicator variables, performance
measurement, and long-term versus short-term contracts. Journal of Accounting Research 41(5): 837-866.
Eisenberger, R., and J. Cameron. 1996. The detrimental effects of reward: Myth or
reality? American Psychologist 51: 1153-1166. Eisenberger, R., and J. Cameron. 1998. Rewards, intrinsic interest and creativity: New
findings. American Psychologist 53: 676-679. Eisenberger, R., and L. Rhoades. 2001. Incremental effects of reward on creativity.
Journal of Personality and Social Psychology 81(4): 728-41.
132
Eisenberger, R., L. Rhoades, and J. Cameron. 1999. Does pay for performance increase or decrease perceived self-determination and intrinsic motivation? Journal of Personality and Social Psychology 77(5): 1026-1040.
Eisenhardt, K. M. 1989. Agency theory: An assessment and review. Academy of
Management Review 14(1): 57-74. Elliot, A. J., and H. A. McGregor. 2001. A 2 X 2 achievement goal framework. Journal
of Personality and Social Psychology 80: 501-519. Elliot, A. J., H. A. McGregor and S. Gable. 1999. Achievement goals, study strategies,
and exam performance: A mediational analysis. Journal of educational psychology 91(33): 549-563.
Evans III, J. H., K. Kim, N. J. Nagarajan. 2006. Uncertainty, legal liability, and incentive
contracts. The Accounting Review 81(5): 1045-1071. Feltham, G. A., J. Xie. 1994. Performance measure congruity and diversity in multi-task
principal/agent relations. The Accounting Review 69(3): 429-453. Ferreira, A., and D. Otley. 2005. The design and use of management control systems: An
extended framework for analysis. Working paper, Monash University. Frese, M., and D. Fay. 2001. Personal initiative: An active performance concept for work
in the 21st century. In B. M. Staw and R. I. Sutton (Eds.), Research in organizational behavior (23: 133-187).
Frese, M., D. Fay, T. Hilburger, K. Leng, and A. Tag. 1997. The concept of personal
initiative: Operationalization, reliability and validity in two German samples. Journal of Occupational and Organizational Psychology 70: 139-161.
Gagné, M., K. Boies, R. Koestner, and M. Martens. 2004. How work motivation is
related to organizational commitment: A series of organizational studies. Manuscript, Concordia University.
Gagné, M., and E. Deci. 2005. Self-determination theory and work motivation. Journal of
Organizational Behavior 26: 331-362. Gagné, M., and R. Koestner. 2002. Self-determination theory as a framework for
understanding organizational commitment. Paper presented at the annual meeting of the Society for Industrial and Organizational Psychology, Toronto, Canada.
Gagné, M., R. Koestner, and M. Zuckerman. 2000. Facilitating the acceptance of
organizational change: The importance of self-determination. Journal of Applied Social Psychology 30: 1843–1852.
133
Gates, S. 1999. Aligning Strategic Performance Measures and Results. New York, NY: The Conference Board.
Grant, A. M., and S. J. Ashford. In press. The dynamics of proactivity at work. Research
in Organizational Behavior. Greenberg, J. 1991. Motivation to inflate performance ratings: Perceptual bias or
response bias? Motivation and Emotion 15: 81–97. Greenberg, J., T. Pyszczynski, and S. Solomon. 1982. The self-serving attributional basis:
Beyond self-presentation. Journal of Experimental Social Psychology 18: 56–67. Grolnick, W. S., and R. M. Ryan. 1987. Autonomy in children's learning: An
experimental and individual difference investigation. Journal of Personality and Social Psychology 52: 890-898.
Grolnick, W. S., and R. M. Ryan. 1989. Parent styles associated with children’s self-
regulation and competence in school. Journal of Educational Psychology 81: 143–154.
Hansen, S. C., D. T. Otley, W. A. Van der Stede. 2003. Practice developments in
Budgeting: An overview and research perspective. Journal of Management Accounting Research 15(1): 95-116.
Hodgins, H. S., and C. R. Knee. 2002. The integrating self and conscious experience. In
E. L. Deci and Ryan, R. M. (Eds.), Handbook of Self-Determination Research (87–100). Rochester, NY: University of Rochester Press.
Hofstede, G., 1967. The Game of Budget Control, Tavistock. Hollenbeck, J. R., and H. J. Klein. 1987. Goal commitment and the goal-setting process:
Problems, prospects, and proposals for future research. Journal of Applied Psychology 72: 212-220.
Hollenbeck, J. R., C. L. Williams, and H. J. Klein. 1989. An empirical examination of the
antecedents of commitment to difficult goals. Journal of Applied Psychology 74, 18-23.
Holmstrom, B. 1989. Agency costs and innovation. Journal of Economics, Behavior and
Organization 12: 305-328. Holmstrom, B., and P. Milgrom. 1991. Multitask principal-agent analyses: Incentive
contracts, asset ownership, and job design. Journal of Law, Economics, and Organization 7: 24–52.
134
Howard, G. S. 1994. Why do people say nasty things about self-reports? Journal of Organizational Behavior 15(5): 399-404.
Hu, L.-T. and P. M. Bentler. 1999. Cutoff criteria for fit indexes in covariance structure
analysis: Conventional criteria versus new alternatives. Structural Equation Modeling: A Multidisciplinary Journal 6: 1-55.
Illardi, B. C., D. Leone, T. Kasser, and R. M. Ryan. 1993. Employee and supervisor
ratings of motivation: Main effects and discrepancies associated with job satisfaction and adjustment in a factory setting. Journal of Applied Social Psychology 23: 1789–1805.
Indjejikian, R.J. 1999. Performance evaluation and compensation research: An agency
perspective. Accounting Horizons 13(2): 147-157. Ittner, C. and D. Larcker. 2001. Assessing empirical research in managerial accounting:
A value-based management perspective. Journal of Accounting and Economics: 349-410.
Ittner, C., D. Larcker, and M. Meyer. 2003. Subjectivity and the weighting of
performance measures: Evidence from a balanced scorecard. The Accounting Review 78 (3): 725-758.
Ittner, C., D. Larcker, and T. Randall 2003. Performance implications of strategic
performance measurement in financial services firms. Accounting, Organizations and Society 28: 715-741.
Jenkins, G. D. Jr., A. Mitra, N. Gupta, and J. D. Shaw. 1998. Are financial incentives
related to performance? A meta-analytic review of empirical research. Journal of Applied Psychology 83: 777–787.
Jensen, M., and W. Meckling. 1976. Theory of the firm: Managerial behavior, agency
costs, and ownership structure. Journal of Financial Economics 3: 305-360. Joreskog, K. G. 1993. Testing structural equation models. In K. A. Bollen and J. S. Long
(Eds.), Testing Structural Equation Models (294-316). Newbury Park, CA: Sage. Joreskog, K. G., and D. Sorbom. 1988. LISREL 7: A Guide to the Program and
Applications. Chicago: SPSS, Inc. Judge, T. A., C. J. Thoresen, J. E. Bono, and G. K. Patton. 2001. The job satisfaction job
performance relationship: A qualitative and quantitative review. Psychological Bulletin 127: 376–407.
Kahneman, D. 1973. Attention and Effort. Englewood Cliffs, NJ: Prentice-Hall.
135
Kahneman D., E. Diener, and N. Schwarz, eds. 1999. Well-being: The foundations of Hedonic Psychology. New York: Russell Sage Found.
Kanfer, R. 1990. Motivation theory and industrial and organizational psychology. In M.
D. Dunnette, and L. M. Hough (Eds.), Handbook of Industrial and Organizational Psychology (75-170). Palo Alto, CA: Consulting Psychologists Press.
Kaplan, R. S., and D. P. Norton 1992. The balanced scorecard: Measures that drive
performance. Harvard Business Review (Jan/Feb): 71-79. Kaplan, R. S., and D. P. Norton. 1996. Using the balanced scorecard as a strategic
management system. Harvard Business Review (Jan/Feb): 75-85. Kaplan, R. S., and D. P. Norton. 2001. The Strategy Focused Organization: How
Balanced Scorecard Companies Thrive in the New Business Environment. Boston, MA: Harvard Business School Press.
Kasser, T., and R. M. Ryan. 1993. A dark side of the American dream: Correlates of
financial success as a central life aspiration. Journal of Personality and Social Psychology 65: 410–422.
Kasser, T., and R. M. Ryan. 1996. Further examining the American dream: Differential
correlates of intrinsic and extrinsic goals. Personality and Social Psychology Bulletin 22: 80–87.
Kasser, T., and R. M. Ryan. 2001. Be careful what you wish for: Optimal functioning and
the relative attainment of intrinsic and extrinsic goals. In P. Schmuck and K. M. Sheldon (Eds.), Life Goals and Well-being: Towards a Positive Psychology of Human Striving (116-131). Gottingen: Hogrefe and Huber.
Kasser, T., R. M. Ryan, M. Zax, and A. J. Sameroff. 1995. The relations of maternal and
social environments to late adolescents’ materialistic and prosocial values. Developmental Psychology 31: 907–914.
Kenny, D. A. 1979. Correlation and Causality. New York: Wiley. Kershaw, R., and A. Harrell. 1999. Strategic control systems and managers’ quality effort
decisions: An agency theory perspective. Advances in Management Accounting 7: 151-168.
Ketchand, A. A. and J. R. Strawser. 2001. Multiple dimensions of organizational
commitment: Implications for future accounting research. Behavioral Research in Accounting 13: 221-251.
136
Klein, H. J., M. J. Wesson, J. R. Hollenbeck, and B. J. Alge. 1999. Goal commitment and the goal setting process: Conceptual clarification and empirical synthesis. Journal of Applied Psychology 84: 885–896.
Klein, H.J., M. J. Wesson, J. R. Hollenbeck, P. M. Wright, and R. P. DeShon. 2001. The
assessment of goal commitment: A measurement model meta-analysis. Organizational Behavior and Human Decision Processes 85(1): 32-55.
Knee, C. R., and M. Zuckerman. 1996. Causality orientations and the disappearance of
the self-serving bias. Journal of Research in Personality 30: 76–87. Koestner, R., and M. Zuckerman. 1994. Causality orientations, failure, and achievement.
Journal of Personality 62: 321–346. Kruglanski, A. W., I. Friedman, and G. Zeevi. 1971. The effects of extrinsic incentive on
some qualitative aspects of task performance. Journal of Personality 39 (4): 606-617.
Kunz, A. H., D. Pfaff. 2002. Agency theory, performance evaluation, and the
hypothetical construct of intrinsic motivation. Accounting, Organizations and Society 27: 275-295.
Lance, C. E. 1994. Test of a latent structure of performance ratings derived from
Wherry’s (1952) theory of rating. Journal of Management 20(4): 757-771. Lance, C. E., J. A. Lapointe, and A. M. Stewart. 1994. A test of the context dependency
of three causal models of halo rater error. Journal of Applied Psychology 79(3): 332-340.
Latham, G. P., M. Erez, and E. Locke. 1988. Resolving scientific disputes by the joint
design of crucial experiments by the antagonists: Application to the Erez–Latham dispute regarding participation in goal setting. Journal of Applied Psychology 73: 753–772.
Latham, G. P., and L. M. Saari. 1979. The importance of supportive relationships in goal
setting. Journal of Applied Psychology 64: 151–156. Lau, C., L. Low, and I. Eggleton. 1995. The impact of reliance on accounting
performance measures on job related tension and managerial performance: Additional evidence. Accounting, Organizations and Society 20: 359-382.
Lepper, M. R., D. Greene, and R. E. Nisbett 1973. Undermining children’s intrinsic
interest with extrinsic rewards: A test of the overjustification hypothesis. Journal of Personality and Social Psychology 28: 129–137.
137
Levesque, C. and L. G. Pelletier. 2003. On the investigation of primed and chronic autonomous and heteronomous motivational orientations. Personality and Social Psychology Bulletin 29: 1570 - 1584.
Locke, E. A., M. Alavi, and J. Wagner. 1997. Participation in decision-making: An
information exchange perspective. In G. Ferris (Ed.), Research in Personnel and Human Resources Management (15: 293–331). Greenwich, CT: JAI Press.
Locke, E. A., and G. P. Latham. 1990. A Theory of Goal Setting and Task Performance.
Englewood Cliffs, NJ: Prentice-Hall. Locke, E. A., and G. P. Latham. 2002. Building a practically useful theory of goal setting
and task motivation. American Psychologist 57(9): 705-717. Locke, E. A., and D. M. Schweiger. 1979. Participation in decision-making: One more
look. In B. Staw (Ed.), Research in Organizational Behavior (1:265-339). Greenwich, CT: JAI Press.
Lui, G., B. Wong-On-Wing, and L. Guo. 2006. Work motivation and management
control systems: A series of organizational studies. Manuscript, Chinese University of Hong Kong.
Lynch, M. F., R. W. Plant and R. M. Ryan. 2005. Psychological needs and threat to
safety: Implications for staff and patients in a psychiatric hospital for youth. Professional psychology, Research and Practice 36 (44): 415-425.
MacCallum, R. C. 1986. Specification searches in covariance structure modeling.
Psychological Bulletin 100: 107-120. MacCallum, R. C., M. W. Browne, and H. M. Sugawara. 1996. Power analysis and
determination of sample size for covariance structure modeling. Psychological Methods 1: 130-149.
MacCallum, R. C., M. Roznowski, and L. B. Necowitz. 1992. Model modification in
covariance structure analysis: The problem of capitalization on chance. Psychological Bulletin 111(3): 490-504.
Malina, M., and F. Selto. 2001. Communicating and controlling strategy: an empirical
study of the effectiveness of the balanced scorecard. Journal of Management Accounting Research 13: 47-90.
Maslow, A. H. 1943. A theory of human motivation. Psychological Review 50: 370–396. Maslow, A. H. 1970. Motivation and Personality. New York: Harper & Row. McGregor, D. 1960. The Human Side of the Enterprise. New York: McGraw-Hill.
138
Merchant, K.A. 2006. Measuring general managers' performances: Market, accounting
and combination-of-measures systems. Accounting, Auditing & Accountability Journal 19 (6): 893-917.
Merchant, K. A., and J. Manzoni. 1989. The achievability of budget targets in profit
centers: A field study. The Accounting Review 64(3): 539-558. Mia, L. 1989. The impact of participation in budgeting and job difficulty on managerial
performance and work motivation: A research note. Accounting, Organizations and Society 14: 347-358.
Morrison, E. W. 2006. Doing the job well: An investigation of pro-social rule breaking.
Journal of Management 32: 5-28. O’Reilly, C., and J. Chatman. 1986. Organizational commitment and psychological
adjustment: The effects of compliance, identification, and internalization on pro-social behavior. Journal of Applied Psychology 71: 492–499.
Otley, D. T. 1999. Performance management: a framework for management control
systems research. Management Accounting Research 10: 363-382. Otley, D, and R. M. Pollanen. 2000. Budgetary criteria in performance evaluation: a
critical appraisal using new evidence. Accounting, Organizations and Society 25(4): 483-496.
Parker, S. K., and C. G. Collins. 2006. Taking stock of proactivity: Integrating and
differentiating multiple forms of proactive behavior. Working paper, Australia Graduate School of Management.
Parker, S. K., T. D. Wall, and P. R. Jackson. 1997. ‘That’s not my job’: Developing
flexible employee work orientations. Academy of Management Journal 40: 899-929.
Parker, S. K., H. M. Williams, and N. Turner. 2006. Modeling the antecedents of
proactive behavior at work. Journal of Applied Psychology 91: 636-652. Pelletier, L. G., S. Dion, K. M. Tuson, and I. Green-Demers. 1999. Why do people fail to
adopt environmental behaviors? Towards a taxonomy of environmental amotivation. Journal of Applied Social Psychology 29: 2481–2504.
Pelletier, L. G., M. S. Fortier, R. J. Vallerand, and N. M. Brière. 2001. Associations
among perceived autonomy support, forms of self-regulation, and persistence: A prospective study. Motivation and Emotion 25(4): 279-306.
139
Peterson, R. S., and K. J. Behfar. 2003. The dynamic relationship between performance feedback, trust, and conflict in groups: A longitudinal study. Organizational Behavior and Human Decision Processes 92: 102–112.
Porter, L. W., R. M. Steers, R. T. Mowday, and P. V. Boulian. 1974. Organizational
commitment, job satisfaction, and turnover among psychiatric technicians. Journal of Applied Psychology 59: 603- 609.
Prendergast, C. 1999. The provision of incentives in firms. Journal of Economic
Literature 37: 7–63. Pyszczynski, T., and J. Greenberg. 1987. Toward an integration of cognitive and
motivational perspectives on social inference: A biased hypothesis-testing model. In L. Berkowitz (Ed.), Advances in Experimental Social Psychology (20: 297–340). Orlando, FL: Academic Press.
Reeve, J., H. Jang, P. Harde, and M. Omura. 2002. Providing a rationale in an autonomy-
supportive way as a strategy to motivate others during an uninteresting activity. Motivation and Emotion 26: 183-207.
Reis, H. T., K. M. Sheldon, S. L. Gable, J. Roscoe, and R. M. Ryan. 2000. Daily well-
being: The role of autonomy, competence, and relatedness. Personality and Social Psychology Bulletin 26: 419–435.
Ross, M., and G. J. O. Fletcher. 1985. Attribution and social perception. In G. Lindzey
and E. Aronson (Eds.), The Handbook of Social Psychology (3rd ed.: 73–122). Reading, MA: Addison-Wesley.
Ryan, T. A. 1970. Intentional Behavior. New York: Ronald Press. Ryan, R. M. 1995. Psychological needs and the facilitation of integrative processes.
Journal of Personality 63: 397-427. Ryan, R. M. and J. P. Connell. 1989. Perceived locus of causality and internalization:
Examining reasons for acting in two domains. Journal of Personality and Social Psychology 57: 749-761.
Ryan, R. M., and E. L. Deci. 2000. Self-determination theory and the facilitation of
intrinsic motivation, social development, and well-being. American Psychologist 55(1): 68-78.
Ryan, R. M., and E. L. Deci. 2002. Overview of self-determination theory: An
organismic dialectical perspective. In E. L. Deci and Ryan, R. M. (Eds.), Handbook of Self-Determination Research (3-33). Rochester, NY: University of Rochester Press.
140
Ryan, R. M., J. Stiller, and J. H. Lynch. 1994. Representations of relationships to teachers, parents, and friends as predictors of academic motivation and self-esteem. Journal of Early Adolescence 14: 226–249.
Ruth’s Chris Steak House, Inc.. 2005. The Prospectus of Ruth’s Chris Steak House, Inc.
(Common Stock). Resource: www.ruthschris.com. Settoon, R. P., N. Bennett, and R. C. Liden. 1996. Social exchange in organizations:
Perceived organizational support, leader-member exchange, and employee reciprocity. Journal of Applied Psychology 81 (3): 219-227.
Shadish, W., T. Cook, D. Campbell. 2002. Experimental and Quasi-Experimental
Designs. Boston: Haoghton Mifflin Company. Sheldon, K. M., and A. J. Elliot. 1998. Not all personal goals are personal: Comparing
autonomous and controlled reasons for goals as predictors of effort and attainment. Personality and Social Psychology Bulletin 24:546-557.
Sheldon, K. M., and A. J. Elliot. 1999. Goal striving, need-satisfaction, and longitudinal
well-being: The Self-Concordance Model. Journal of Personality and Social Psychology 76: 482-497.
Sheldon, K. M., and T. Kasser. 1998. Pursuing personal goals: Skills enable progress but
not all progress is beneficial. Personality and Social Psychology Bulletin 24: 1319-1331.
Sheldon, K. M., R. M. Ryan, E. L. Deci, and T. Kasser. 2004. The independent effects of
goal contents and motives on well-being: It’s both what you pursue and why you pursue it. Personality and Social Psychology Bulletin 30: 475–486.
Sheldon, K. M., R. M. Ryan, and H. R. Reis. 1996. What makes for a good day?
Competence and autonomy in the day and in the person. Personality and Social Psychology Bulletin 22: 1270-1279.
Sheldon, K. M., D. B. Turban, K. G. Brown, M. R. Barrick, and T. A. Judge. 2003.
Applying self-determination theory to organizational research. Research in Personnel and Human Resources Management 22: 357-393.
Shields, J. F., and M. D. Shields. 1998. Antecedents of participative budgeting.
Accounting, Organizations and Society 23: 49-76. Shirom, A., M. Westman, and S. Melamed. 1999. The effects of pay systems on blue-
collar employees’ emotional distress: The mediating effects of objective and subjective work monotony. Human Relations 52: 1077–1097.
141
Simons, R. 1995. Levers of Control: How Managers Use Innovative Control Systems to Drive Strategic Renewal. Boston, Mass: Harvard Business School.
Sliwka, D. 2002. On the use of nonfinancial performance measures in management
compensation. Journal of Economics & Management Strategy 11(3): 487-511. Sobel, M. E. 1982. Asymptotic intervals for indirect effects in structural equations
models. In S. Leinhart (Ed.), Sociological methodology (290-312). San Francisco: Jossey-Bass.
Spector, P. E. 1994. Using self-report questionnaires in OB research: A comment on the
use of a controversial method. Journal of Organizational Behavior 15(5): 385-392.
Sprinkle, G. B. 2003. Perspectives on experimental research in managerial accounting.
Accounting, Organizations and Society 28: 287-318. Steiger, J. H., and J. C. Lind. 1980. Statistically based tests for the number of common
factors. Paper presented at the Psychometric Society Annual Meeting, Iowa City, IA.
Strahan, B. J., and B. Craig. 1995. Marriage, Family and Religion. Sydney, Australia:
Adventist Institute of Family Relations. Sullivan, C. T. 2005. A stake in the business. Harvard Business Review (September). Tang, T. L., and R. K. Chiu. 2003. Income, money ethic, pay satisfaction, commitment,
and unethical behavior: Is the love of money the root of evil for Hong Kong employees? Journal of Business Ethics 46(August): 13-30.
Tucker, L. R., and C. Lewis. 1973. A reliability coefficient for maximum likelihood
factor analysis. Psychometrika 38: 1-10. Tuttle, B. M., and Harrell, A. 2001. The impact of unit goal priorities, economic
incentives, and interim feedback on the planned effort of information systems professionals. Journal of Information Systems 15(2): 81-98.
Ullrich, M.J., B. M. Tuttle. 2004. The effects of comprehensive information reporting
systems and economic incentives on managers' time-planning decisions. Behavioral Research in Accounting 16: 89-105.
Vallerand, R. J. (1997). Toward a hierarchical model of intrinsic and extrinsic
motivation. In M. P. Zanna (Ed.), Advances in Experimental Social Psychology (29: 271–360). San Diego: Academic.
142
Vallerand, R. J., and M. S. Fortier. 1998. Measures of intrinsic and extrinsic motivation in sport and physical activity: a review and critique. In J. Duda (Ed.), Advancements in Sport and Exercise Psychology Measurement (83–100). Morgantown, WV: Fitness Information Technology.
Van der Stede, W. A., C. W. Chow, and T. W. Lin. 2006. Strategy, choice of
performance measures, and performance. Behavioral Research in Accounting 18: 185-205.
Vansteenkiste, M., J. Simons, W. Lens, K. M. Sheldon, and E. L. Deci. 2004. Motivating
learning, performance, and persistence: The synergistic effects of intrinsic goal contents and autonomy-supportive contexts. Journal of Personality and Social Psychology 87: 246–260.
Vansteenkiste, M., M. Zhou, W. Lens, and B. Soenens. 2005. Experiences of autonomy
and control among Chinese learners: Vitalizing or immobilizing? Journal of Educational Psychology 97(3): 468-483.
Vroom, V. H. 1964. Work and Motivation. New York: Wiley. Weiner, B. 1980. Human Motivation. New York: Holt, Rinehart and Winston. Weiner, B. 1992. Human Motivation. Newbury Park, CA: Sage. Westley, F. 1990. Middle managers and strategy: Microdynamics of inclusion. Strategic
Management Journal 11: 337-352. Wheaton, B., B. Muthén, D. F. Alwin, and G. F. Summers. 1977. Assessing reliablility
and stability in panel models. In D. R. Heise (Ed.), Sociological Methodology (84-136). San Francisco: Jossey-Bass.
White, R. W. (1959). Motivation reconsidered: The concept of competence.
Psychological Review 66: 297–333. Williams, G. C., E. M. Cox, V. A. Hedberg, and E. L. Deci. 2000. Extrinsic life goals and
health risk behaviors in adolescents. Journal of Applied Social Psychology 30: 1756–1771.
Williams, G. C. and E. L. Deci. 1996. Internalization of biopsychosoical values by
medical students: A test of self-determination theory. Journal of Personality and Social Psychology 70: 767-779.
Williams, G. C., E. L. Deci, and R. M. Ryan. 1998. Building health-care partnerships by
supporting autonomy: Promoting maintained behavior change and positive health outcomes. In A. L. Suchman, P. Hinton-Walker, and R. Botelho (Eds.),
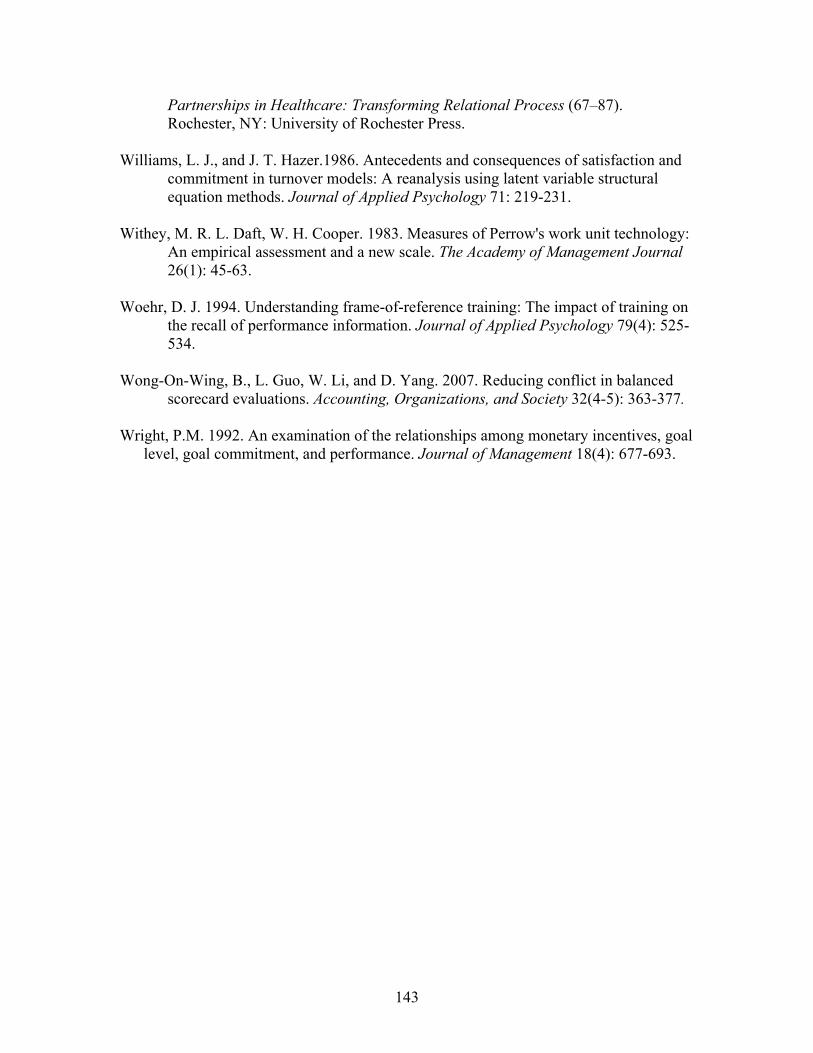
143
Partnerships in Healthcare: Transforming Relational Process (67–87). Rochester, NY: University of Rochester Press.
Williams, L. J., and J. T. Hazer.1986. Antecedents and consequences of satisfaction and
commitment in turnover models: A reanalysis using latent variable structural equation methods. Journal of Applied Psychology 71: 219-231.
Withey, M. R. L. Daft, W. H. Cooper. 1983. Measures of Perrow's work unit technology:
An empirical assessment and a new scale. The Academy of Management Journal 26(1): 45-63.
Woehr, D. J. 1994. Understanding frame-of-reference training: The impact of training on
the recall of performance information. Journal of Applied Psychology 79(4): 525-534.
Wong-On-Wing, B., L. Guo, W. Li, and D. Yang. 2007. Reducing conflict in balanced
scorecard evaluations. Accounting, Organizations, and Society 32(4-5): 363-377. Wright, P.M. 1992. An examination of the relationships among monetary incentives, goal
level, goal commitment, and performance. Journal of Management 18(4): 677-693.
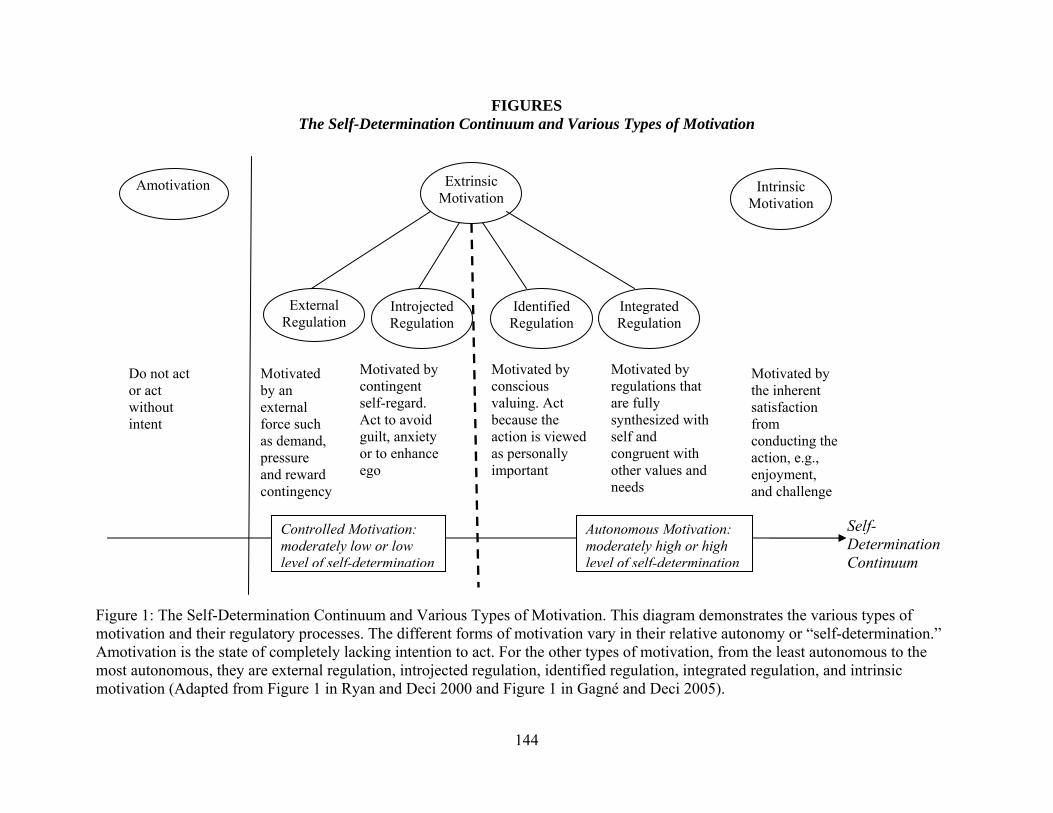
144
FIGURES The Self-Determination Continuum and Various Types of Motivation
Figure 1: The Self-Determination Continuum and Various Types of Motivation. This diagram demonstrates the various types of motivation and their regulatory processes. The different forms of motivation vary in their relative autonomy or “self-determination.” Amotivation is the state of completely lacking intention to act. For the other types of motivation, from the least autonomous to the most autonomous, they are external regulation, introjected regulation, identified regulation, integrated regulation, and intrinsic motivation (Adapted from Figure 1 in Ryan and Deci 2000 and Figure 1 in Gagné and Deci 2005).
Intrinsic Motivation
Extrinsic Motivation
Amotivation
External Regulation
Introjected Regulation
Identified Regulation
Integrated Regulation
Do not act or act without intent
Motivated by an external force such as demand, pressure and reward contingency
Motivated by regulations that are fully synthesized with self and congruent with other values and needs
Motivated by conscious valuing. Act because the action is viewed as personally important
Motivated by contingent self-regard. Act to avoid guilt, anxiety or to enhance ego
Motivated by the inherent satisfaction from conducting the action, e.g., enjoyment, and challenge
Self-Determination Continuum
Controlled Motivation: moderately low or low level of self-determination
Autonomous Motivation: moderately high or high level of self-determination
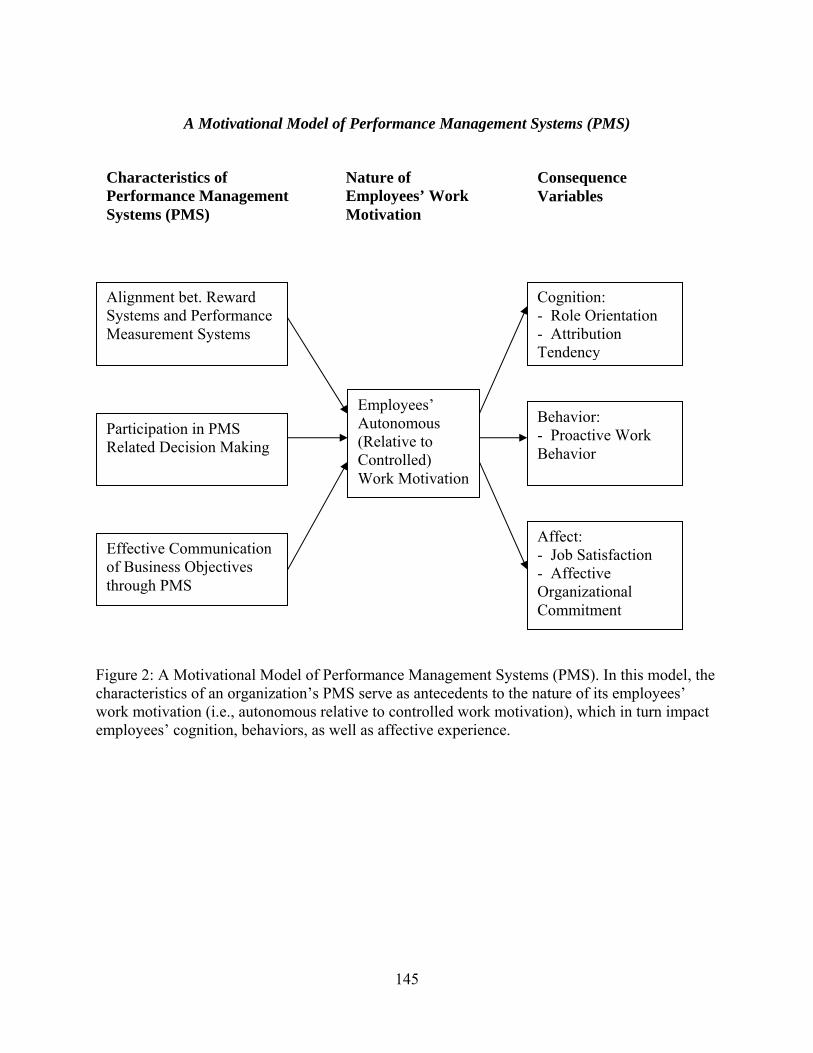
145
A Motivational Model of Performance Management Systems (PMS)
Figure 2: A Motivational Model of Performance Management Systems (PMS). In this model, the characteristics of an organization’s PMS serve as antecedents to the nature of its employees’ work motivation (i.e., autonomous relative to controlled work motivation), which in turn impact employees’ cognition, behaviors, as well as affective experience.
Characteristics of Performance Management Systems (PMS)
Nature of Employees’ Work Motivation
Consequence Variables
Alignment bet. Reward Systems and Performance Measurement Systems
Participation in PMS Related Decision Making
Effective Communication of Business Objectives through PMS
Employees’ Autonomous (Relative to Controlled) Work Motivation
Cognition: - Role Orientation - Attribution Tendency
Affect: - Job Satisfaction - Affective Organizational Commitment
Behavior: - Proactive Work Behavior
146
All Tested Hypotheses
Figure 3: All Tested Hypotheses. In total six hypotheses are developed. They are tested by Study 1 and 2. Specifically, Study 1 (SEM analysis of survey data) tests H1, H2, H3, H4 and H5, and Study 2 (experiment) tests H1, H2 and H6. The sign beside each hypothesis indicates the expected direction of the relationship. Note that compared with the motivational model presented in Figure 2, the hypotheses are more specific and thus more narrow in terms of research scope.
Alignment bet. Reward Systems and Performance Measurement Systems
Participation in PMS Related Decision Making
Effective Communication of Business Objectives through PMS
Employees’ Autonomous (Relative to Controlled) Work Motivation
Role Orientation (the importance of new knowledge and skills)
Proactive Strategic Behaviors
Self-Serving Attribution
H1; +/- H4; +
H3; +
H2; +
H6; +
H5; -
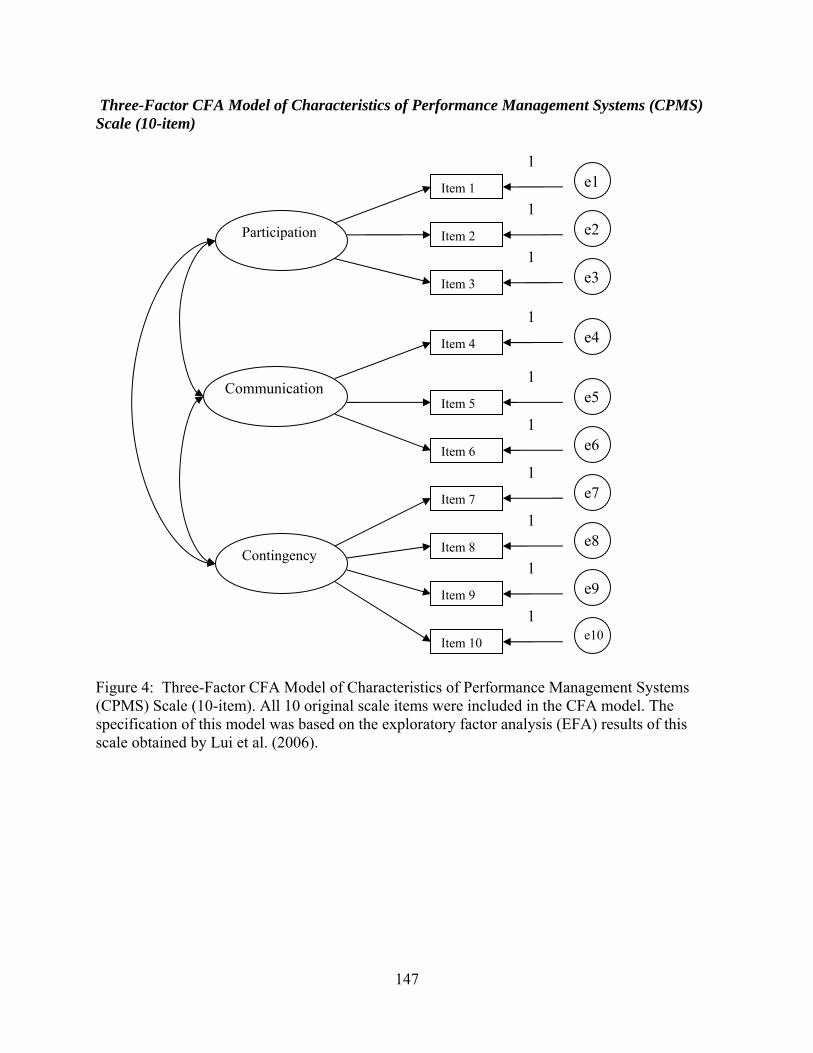
147
Three-Factor CFA Model of Characteristics of Performance Management Systems (CPMS) Scale (10-item)
Figure 4: Three-Factor CFA Model of Characteristics of Performance Management Systems (CPMS) Scale (10-item). All 10 original scale items were included in the CFA model. The specification of this model was based on the exploratory factor analysis (EFA) results of this scale obtained by Lui et al. (2006).
Participation
Communication
Contingency
Item 1
Item 2
Item 3
Item 4
Item 5
Item 6
Item 7
Item 8
Item 9
Item 10
e1
e6
e7
e8
e9
e10
e2
e3
e5
e4
1
1
1
1
1
1
1
1
1
1
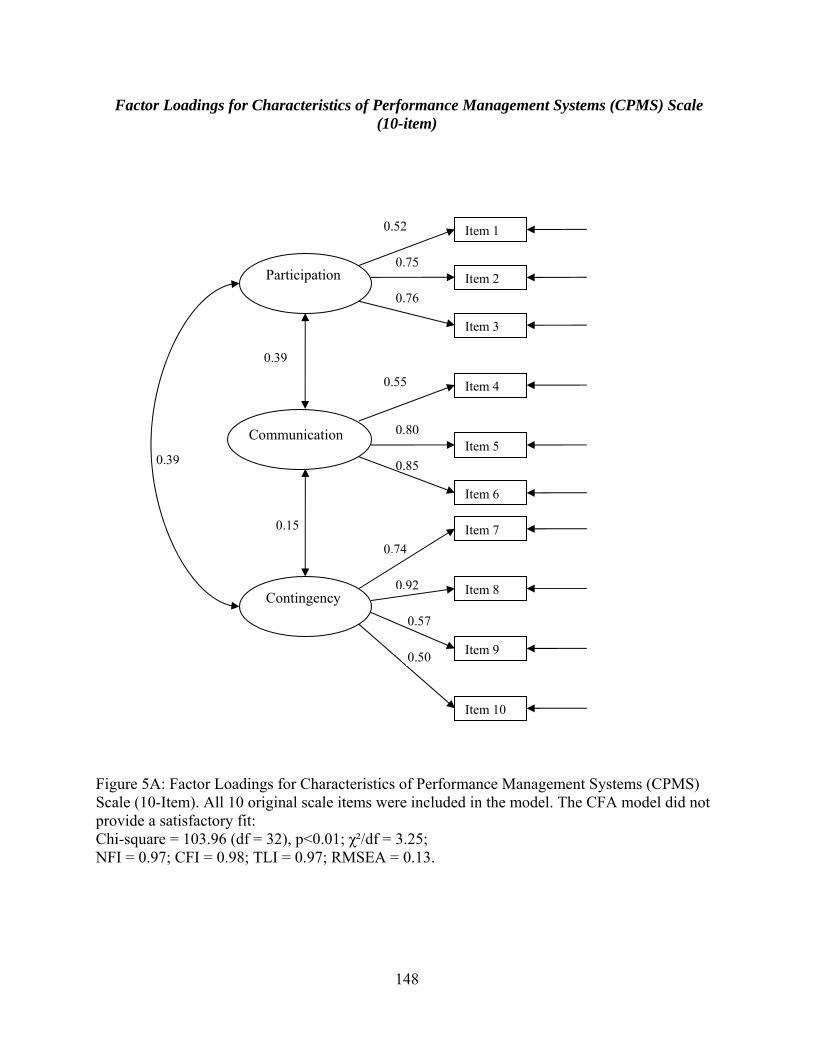
148
Factor Loadings for Characteristics of Performance Management Systems (CPMS) Scale (10-item)
Figure 5A: Factor Loadings for Characteristics of Performance Management Systems (CPMS) Scale (10-Item). All 10 original scale items were included in the model. The CFA model did not provide a satisfactory fit: Chi-square = 103.96 (df = 32), p<0.01; χ²/df = 3.25; NFI = 0.97; CFI = 0.98; TLI = 0.97; RMSEA = 0.13.
0.52
0.75
0.76
0.55
0.80
0.85
0.74
0.57
0.39
0.15
0.39
Participation
Contingency
Item 2
Item 3
Item 4
Item 5
Item 6
Item 7
Item 8
Item 9
Item 10
0.50
0.92
Item 1
Communication
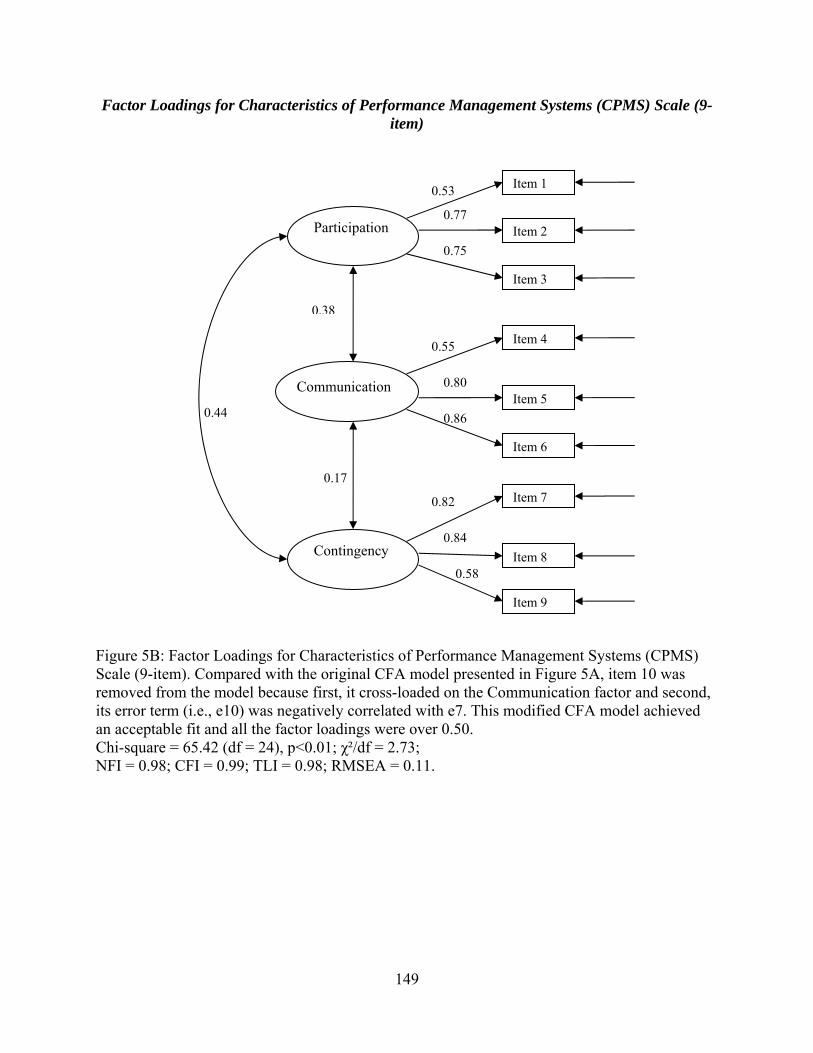
149
Factor Loadings for Characteristics of Performance Management Systems (CPMS) Scale (9-item)
Figure 5B: Factor Loadings for Characteristics of Performance Management Systems (CPMS) Scale (9-item). Compared with the original CFA model presented in Figure 5A, item 10 was removed from the model because first, it cross-loaded on the Communication factor and second, its error term (i.e., e10) was negatively correlated with e7. This modified CFA model achieved an acceptable fit and all the factor loadings were over 0.50. Chi-square = 65.42 (df = 24), p<0.01; χ²/df = 2.73; NFI = 0.98; CFI = 0.99; TLI = 0.98; RMSEA = 0.11.
0.53
0.77
0.75
0.55
0.80
0.86
0.82
0.58
0.38
0.17
0.44
Participation
Communication
Contingency
Item 2
Item 3
Item 4
Item 5
Item 6
Item 7
Item 8
Item 9
0.84
Item 1
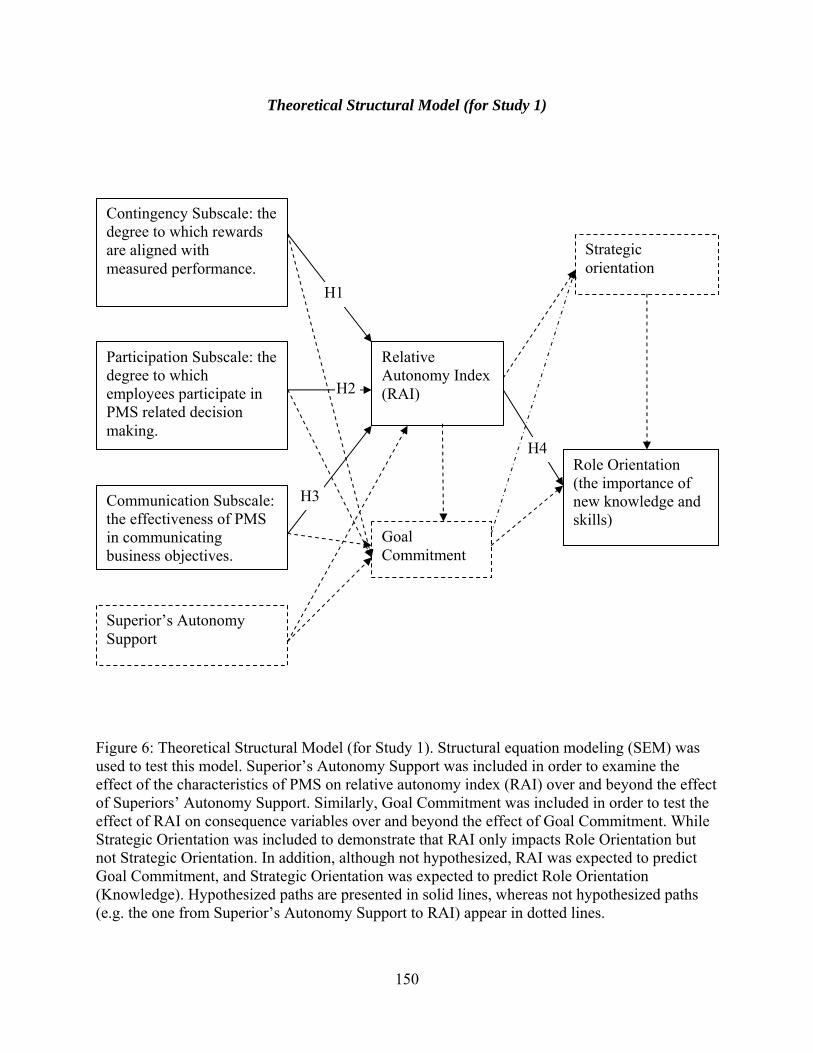
150
Theoretical Structural Model (for Study 1)
Figure 6: Theoretical Structural Model (for Study 1). Structural equation modeling (SEM) was used to test this model. Superior’s Autonomy Support was included in order to examine the effect of the characteristics of PMS on relative autonomy index (RAI) over and beyond the effect of Superiors’ Autonomy Support. Similarly, Goal Commitment was included in order to test the effect of RAI on consequence variables over and beyond the effect of Goal Commitment. While Strategic Orientation was included to demonstrate that RAI only impacts Role Orientation but not Strategic Orientation. In addition, although not hypothesized, RAI was expected to predict Goal Commitment, and Strategic Orientation was expected to predict Role Orientation (Knowledge). Hypothesized paths are presented in solid lines, whereas not hypothesized paths (e.g. the one from Superior’s Autonomy Support to RAI) appear in dotted lines.
Contingency Subscale: the degree to which rewards are aligned with measured performance.
Participation Subscale: the degree to which employees participate in PMS related decision making.
Communication Subscale: the effectiveness of PMS in communicating business objectives.
Relative Autonomy Index (RAI)
Strategic orientation
Role Orientation (the importance of new knowledge and skills)
Goal Commitment
Superior’s Autonomy Support
H1
H3
H4
H2
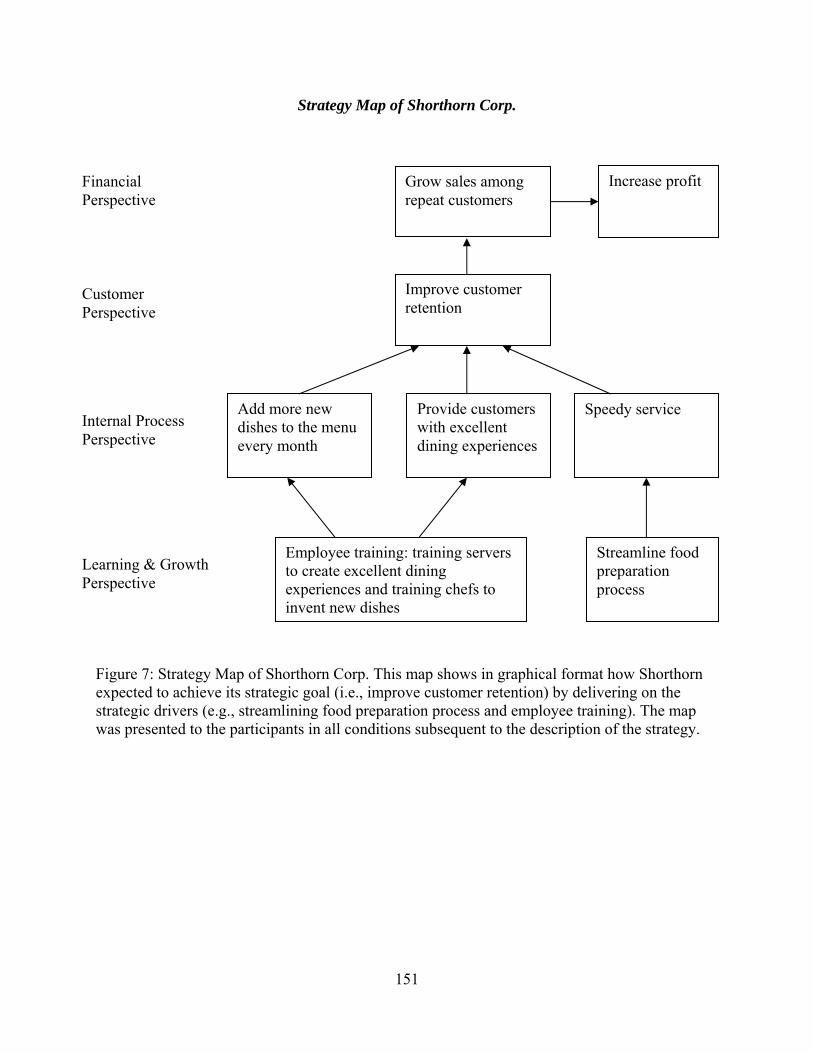
151
Strategy Map of Shorthorn Corp.
Figure 7: Strategy Map of Shorthorn Corp. This map shows in graphical format how Shorthorn expected to achieve its strategic goal (i.e., improve customer retention) by delivering on the strategic drivers (e.g., streamlining food preparation process and employee training). The map was presented to the participants in all conditions subsequent to the description of the strategy.
Employee training: training servers to create excellent dining experiences and training chefs to invent new dishes
Streamline food preparation process
Add more new dishes to the menu every month
Provide customers with excellent dining experiences
Improve customer retention
Grow sales among repeat customers
Financial Perspective
Customer Perspective
Internal Process Perspective
Learning & Growth Perspective
Speedy service
Increase profit
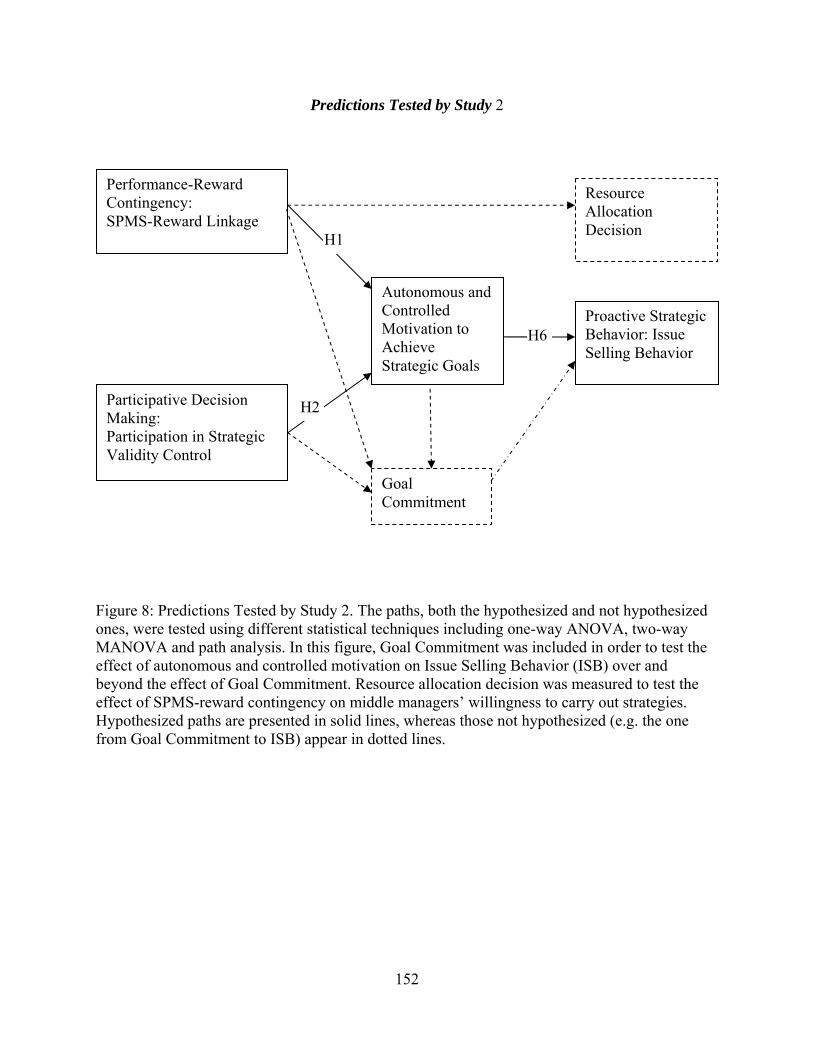
152
Predictions Tested by Study 2
Figure 8: Predictions Tested by Study 2. The paths, both the hypothesized and not hypothesized ones, were tested using different statistical techniques including one-way ANOVA, two-way MANOVA and path analysis. In this figure, Goal Commitment was included in order to test the effect of autonomous and controlled motivation on Issue Selling Behavior (ISB) over and beyond the effect of Goal Commitment. Resource allocation decision was measured to test the effect of SPMS-reward contingency on middle managers’ willingness to carry out strategies. Hypothesized paths are presented in solid lines, whereas those not hypothesized (e.g. the one from Goal Commitment to ISB) appear in dotted lines.
Performance-Reward Contingency: SPMS-Reward Linkage
Participative Decision Making: Participation in Strategic Validity Control
Autonomous and Controlled Motivation to Achieve Strategic Goals
Proactive Strategic Behavior: Issue Selling Behavior
Goal Commitment
H1
H2
H6
Resource Allocation Decision
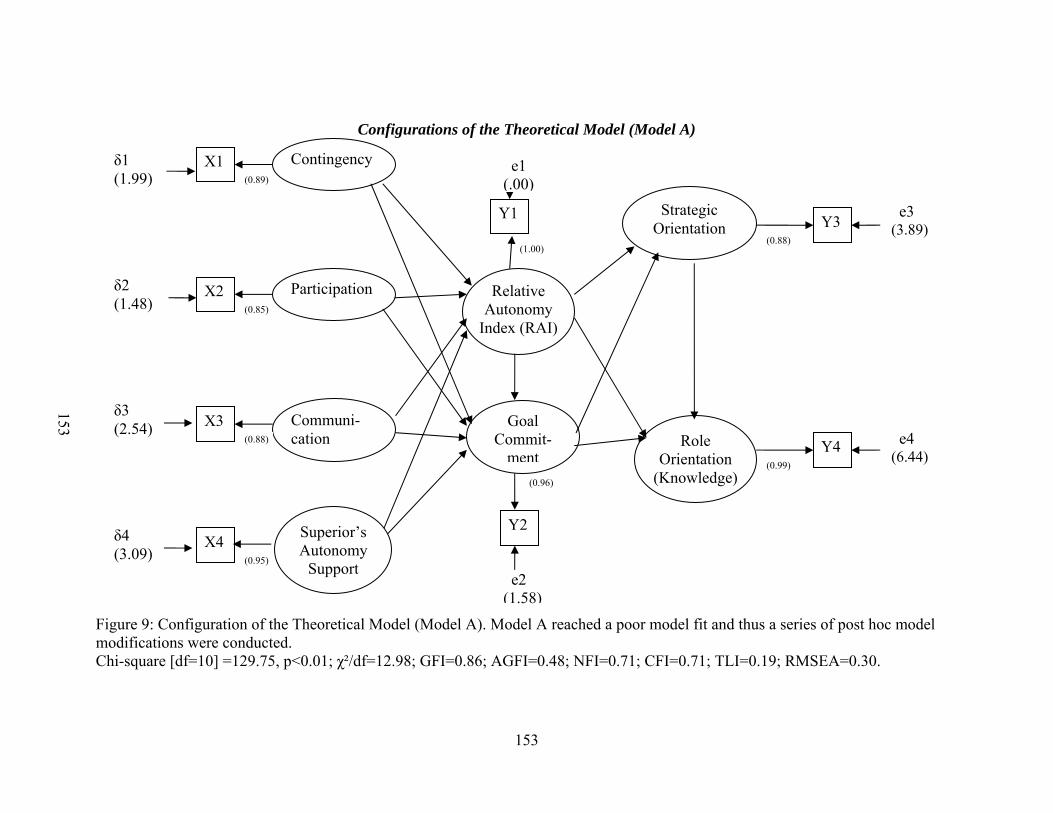
153
Configurations of the Theoretical Model (Model A)
Figure 9: Configuration of the Theoretical Model (Model A). Model A reached a poor model fit and thus a series of post hoc model modifications were conducted. Chi-square [df=10] =129.75, p<0.01; χ²/df=12.98; GFI=0.86; AGFI=0.48; NFI=0.71; CFI=0.71; TLI=0.19; RMSEA=0.30.
Contingency
Participation
Communi-cation Role
Orientation(Knowledge)
Strategic Orientation
Relative Autonomy
Index (RAI)
Goal Commit-
ment
X1
Y4
Y3
X4
X3
X2
Y2
Y1
(0.89)
(0.85)
(0.88)
(0.95)
e2 (1.58)
(0.96)
(1.00)
(0.99)
(0.88)
e3 (3.89)
e4 (6.44)
Superior’s Autonomy
Support
δ2 (1.48)
δ3 (2.54)
δ4 (3.09)
δ1 (1.99)
e1 (.00)
153
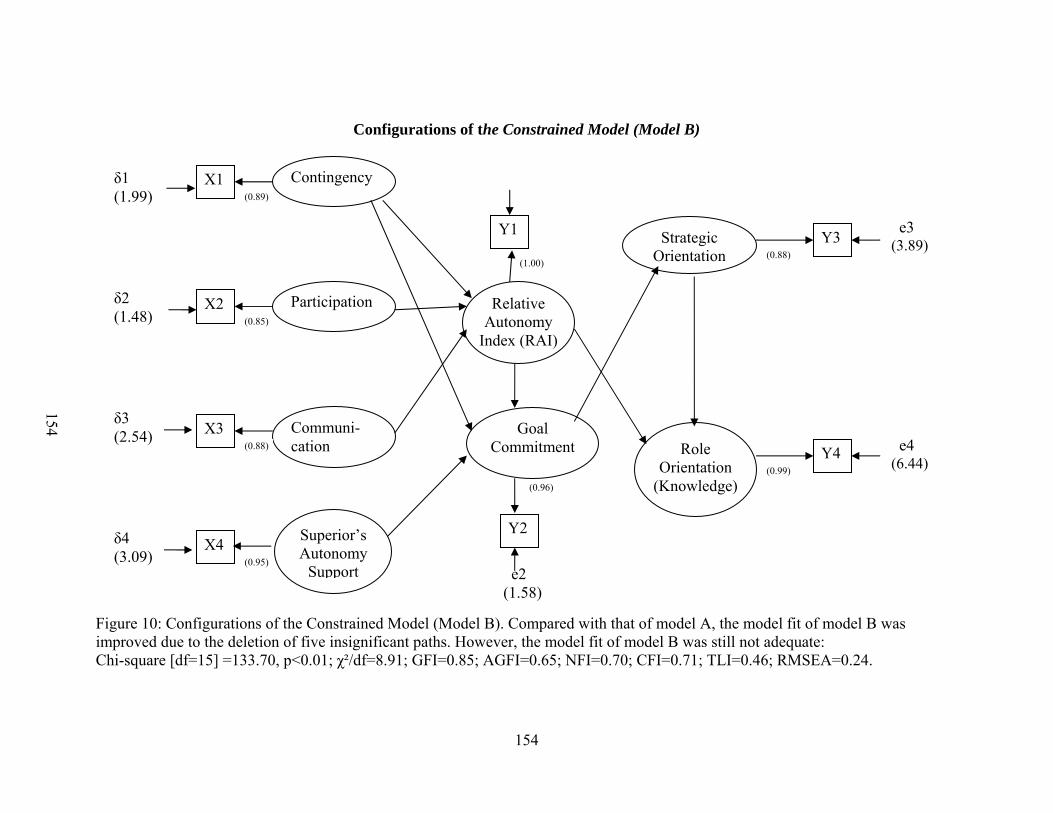
154
Configurations of the Constrained Model (Model B)
Figure 10: Configurations of the Constrained Model (Model B). Compared with that of model A, the model fit of model B was improved due to the deletion of five insignificant paths. However, the model fit of model B was still not adequate: Chi-square [df=15] =133.70, p<0.01; χ²/df=8.91; GFI=0.85; AGFI=0.65; NFI=0.70; CFI=0.71; TLI=0.46; RMSEA=0.24.
Contingency
Participation
Communi-cation Role
Orientation(Knowledge)
Strategic Orientation
Relative Autonomy
Index (RAI)
Goal Commitment
X1
Y4
Y3
X4
X3
X2
Y2
Y1
(0.89)
(0.85)
(0.88)
(0.95) e2 (1.58)
(0.96)
(1.00)
(0.99)
(0.88)
e3 (3.89)
e4 (6.44)
Superior’s Autonomy
Support
δ2 (1.48)
δ3 (2.54)
δ4 (3.09)
δ1 (1.99)
154
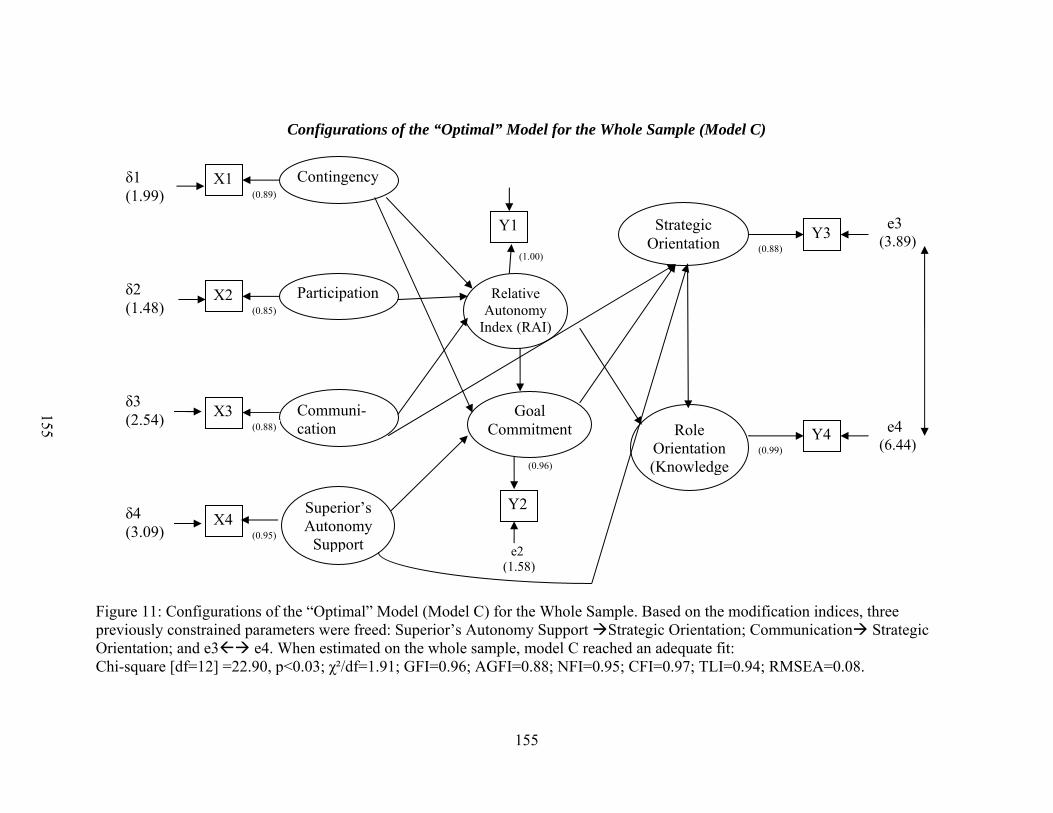
155
Configurations of the “Optimal” Model for the Whole Sample (Model C)
Figure 11: Configurations of the “Optimal” Model (Model C) for the Whole Sample. Based on the modification indices, three previously constrained parameters were freed: Superior’s Autonomy Support Strategic Orientation; Communication Strategic Orientation; and e3 e4. When estimated on the whole sample, model C reached an adequate fit: Chi-square [df=12] =22.90, p<0.03; χ²/df=1.91; GFI=0.96; AGFI=0.88; NFI=0.95; CFI=0.97; TLI=0.94; RMSEA=0.08.
Contingency
Participation
Communi-cation Role
Orientation(Knowledge
Strategic Orientation
Relative Autonomy
Index (RAI)
Goal Commitment
X1
Y4
Y3
X4
X3
X2
Y2
Y1
(0.89)
(0.85)
(0.88)
(0.95)
e2 (1.58)
(0.96)
(1.00)
(0.99)
(0.88)
e3 (3.89)
e4 (6.44)
Superior’s Autonomy
Support
δ2 (1.48)
δ3 (2.54)
δ4 (3.09)
δ1 (1.99)
155
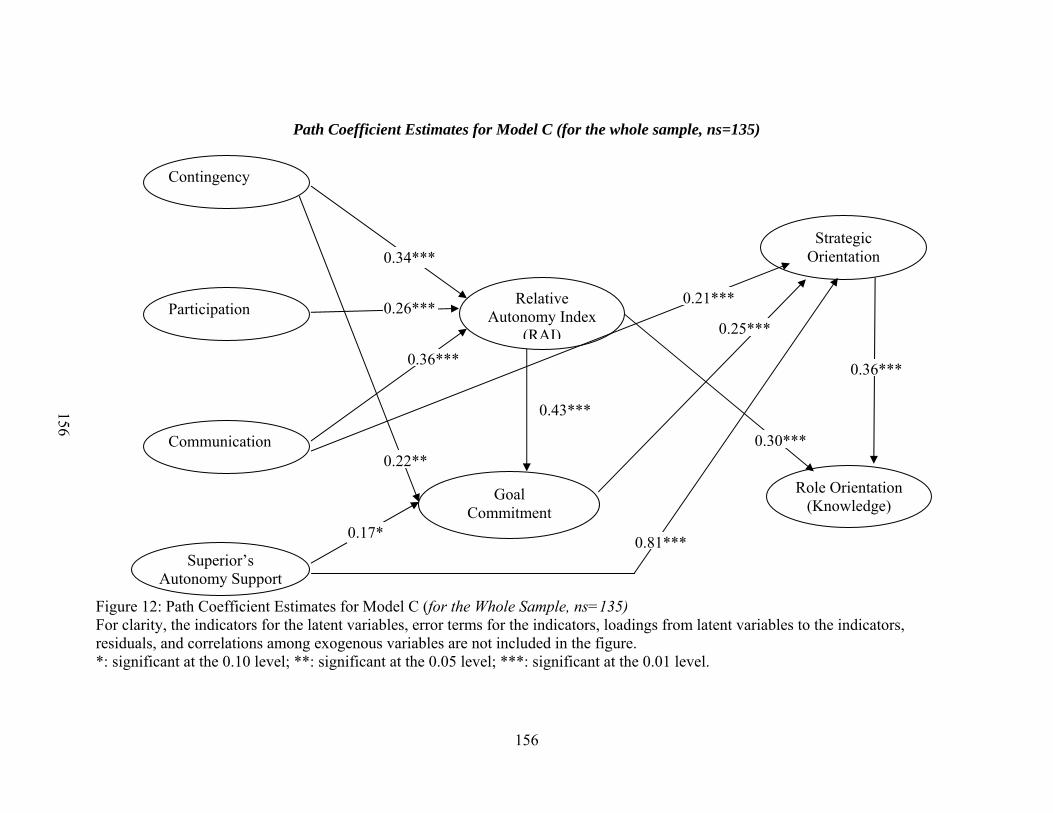
156
Path Coefficient Estimates for Model C (for the whole sample, ns=135)
Figure 12: Path Coefficient Estimates for Model C (for the Whole Sample, ns=135) For clarity, the indicators for the latent variables, error terms for the indicators, loadings from latent variables to the indicators, residuals, and correlations among exogenous variables are not included in the figure. *: significant at the 0.10 level; **: significant at the 0.05 level; ***: significant at the 0.01 level.
Contingency
Participation
Communication
Role Orientation(Knowledge)
Strategic Orientation
Relative Autonomy Index
(RAI)
Goal Commitment
0.34***
0.36***
0.26***
0.81***0.17*
0.22**
0.21***
0.25***
0.36***
0.43***
0.30***
Superior’s Autonomy Support
156
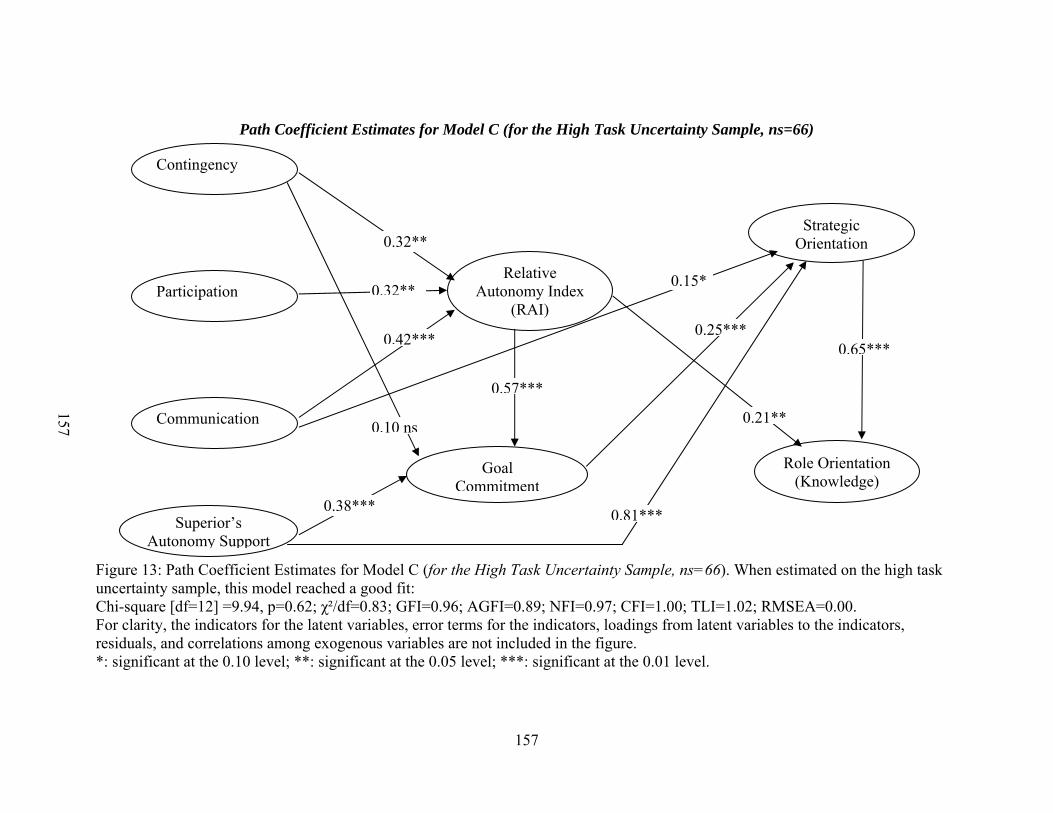
157
Path Coefficient Estimates for Model C (for the High Task Uncertainty Sample, ns=66)
Figure 13: Path Coefficient Estimates for Model C (for the High Task Uncertainty Sample, ns=66). When estimated on the high task uncertainty sample, this model reached a good fit: Chi-square [df=12] =9.94, p=0.62; χ²/df=0.83; GFI=0.96; AGFI=0.89; NFI=0.97; CFI=1.00; TLI=1.02; RMSEA=0.00. For clarity, the indicators for the latent variables, error terms for the indicators, loadings from latent variables to the indicators, residuals, and correlations among exogenous variables are not included in the figure. *: significant at the 0.10 level; **: significant at the 0.05 level; ***: significant at the 0.01 level.
Contingency
Participation
Communication
Role Orientation(Knowledge)
Strategic Orientation
Relative Autonomy Index
(RAI)
Goal Commitment
0.32**
0.42***
0.32**
0.81***0.38***
0.10 ns
0.15*
0.25***0.65***
0.57***
0.21**
Superior’s Autonomy Support
157
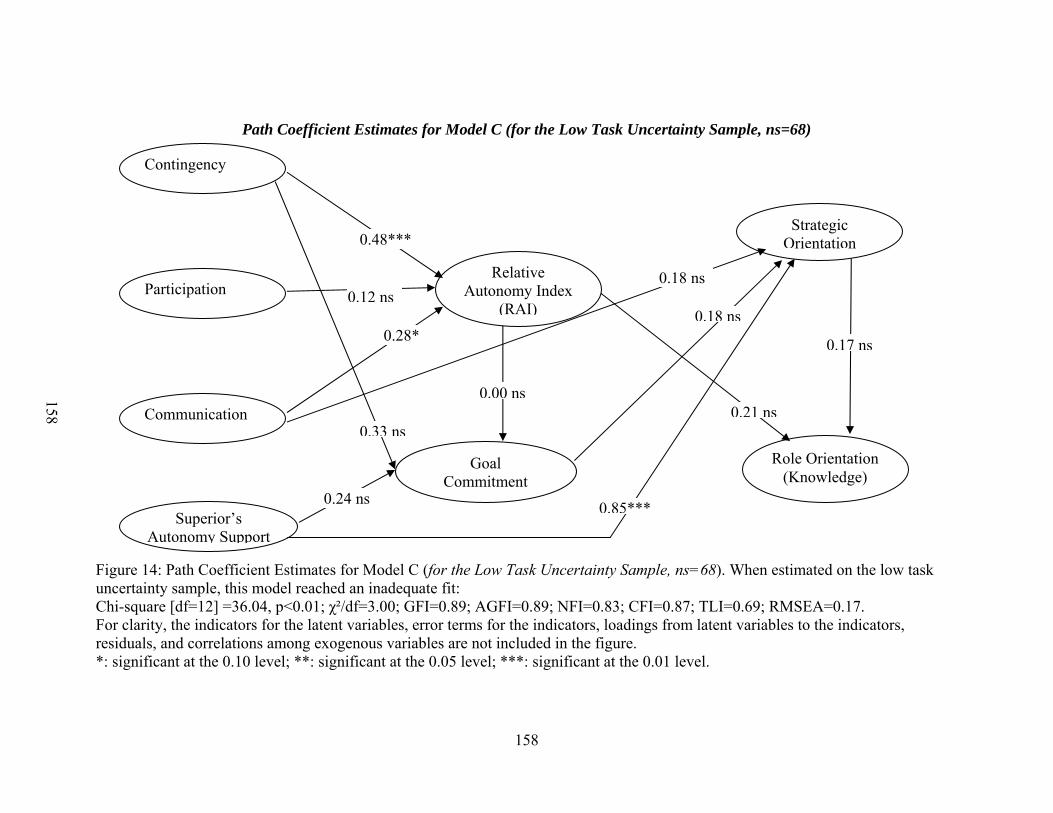
158
Path Coefficient Estimates for Model C (for the Low Task Uncertainty Sample, ns=68)
Figure 14: Path Coefficient Estimates for Model C (for the Low Task Uncertainty Sample, ns=68). When estimated on the low task uncertainty sample, this model reached an inadequate fit: Chi-square [df=12] =36.04, p<0.01; χ²/df=3.00; GFI=0.89; AGFI=0.89; NFI=0.83; CFI=0.87; TLI=0.69; RMSEA=0.17. For clarity, the indicators for the latent variables, error terms for the indicators, loadings from latent variables to the indicators, residuals, and correlations among exogenous variables are not included in the figure. *: significant at the 0.10 level; **: significant at the 0.05 level; ***: significant at the 0.01 level.
Contingency
Participation
Communication
Superior’s Autonomy Support
Role Orientation(Knowledge)
Strategic Orientation
Relative Autonomy Index
(RAI)
Goal Commitment
0.48***
0.28*
0.12 ns
0.85***0.24 ns
0.33 ns
0.18 ns
0.18 ns
0.17 ns
0.00 ns0.21 ns
158
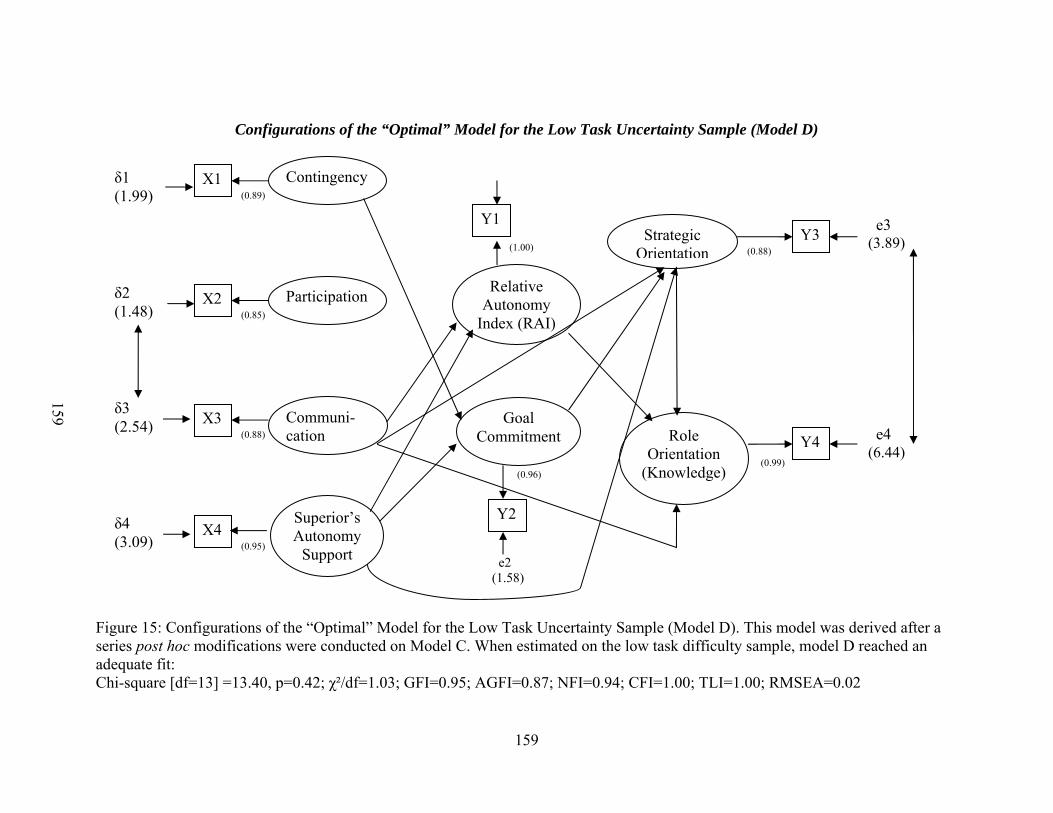
159
Configurations of the “Optimal” Model for the Low Task Uncertainty Sample (Model D)
Figure 15: Configurations of the “Optimal” Model for the Low Task Uncertainty Sample (Model D). This model was derived after a series post hoc modifications were conducted on Model C. When estimated on the low task difficulty sample, model D reached an adequate fit: Chi-square [df=13] =13.40, p=0.42; χ²/df=1.03; GFI=0.95; AGFI=0.87; NFI=0.94; CFI=1.00; TLI=1.00; RMSEA=0.02
Contingency
Participation
Communi-cation Role
Orientation (Knowledge)
Strategic Orientation
Relative Autonomy
Index (RAI)
Goal Commitment
X1
Y4
Y3
X4
X3
X2
Y2
Y1 (0.89)
(0.85)
(0.88)
(0.95)
e2 (1.58)
(0.96)
(1.00)
(0.99)
(0.88)
e3 (3.89)
e4 (6.44)
Superior’s Autonomy
Support
δ2 (1.48)
δ3 (2.54)
δ4 (3.09)
δ1 (1.99)
159
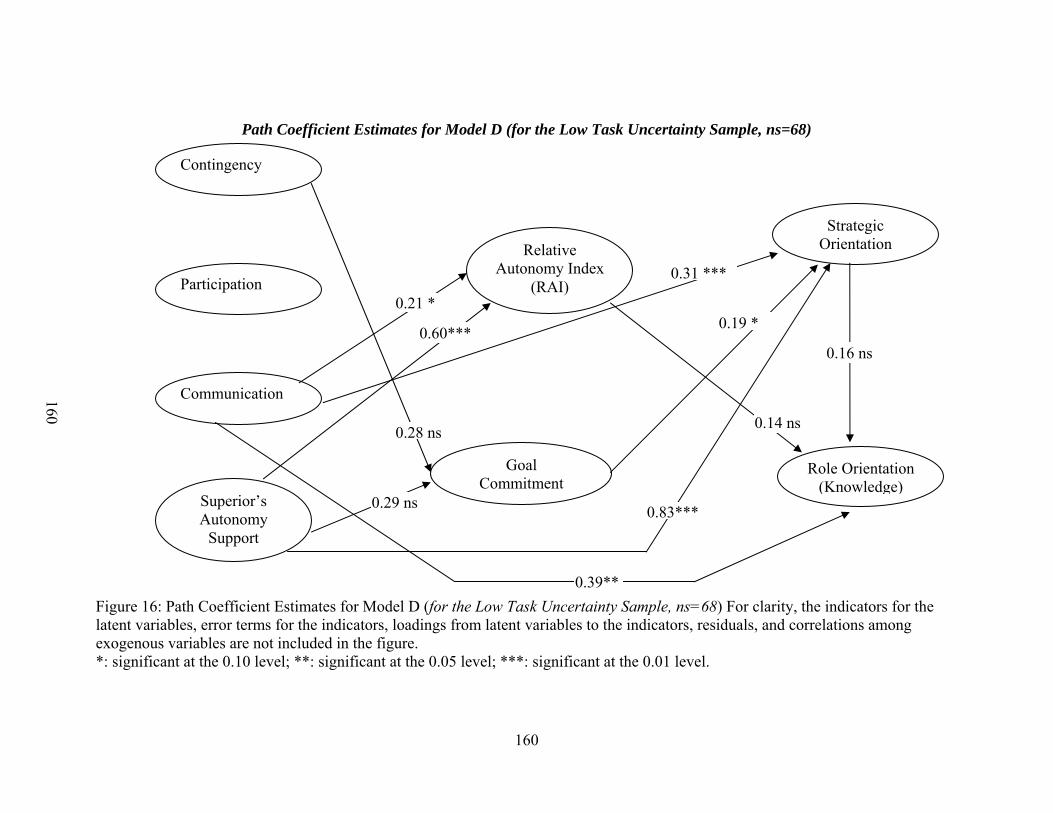
160
Path Coefficient Estimates for Model D (for the Low Task Uncertainty Sample, ns=68)
Figure 16: Path Coefficient Estimates for Model D (for the Low Task Uncertainty Sample, ns=68) For clarity, the indicators for the latent variables, error terms for the indicators, loadings from latent variables to the indicators, residuals, and correlations among exogenous variables are not included in the figure. *: significant at the 0.10 level; **: significant at the 0.05 level; ***: significant at the 0.01 level.
Contingency
Participation
Communication
Superior’s Autonomy
Support
Role Orientation(Knowledge)
Strategic OrientationRelative
Autonomy Index (RAI)
Goal Commitment
0.21 *
0.83***0.29 ns
0.28 ns
0.19 *0.60*** 0.16 ns
0.39**
0.31 ***
0.14 ns
160
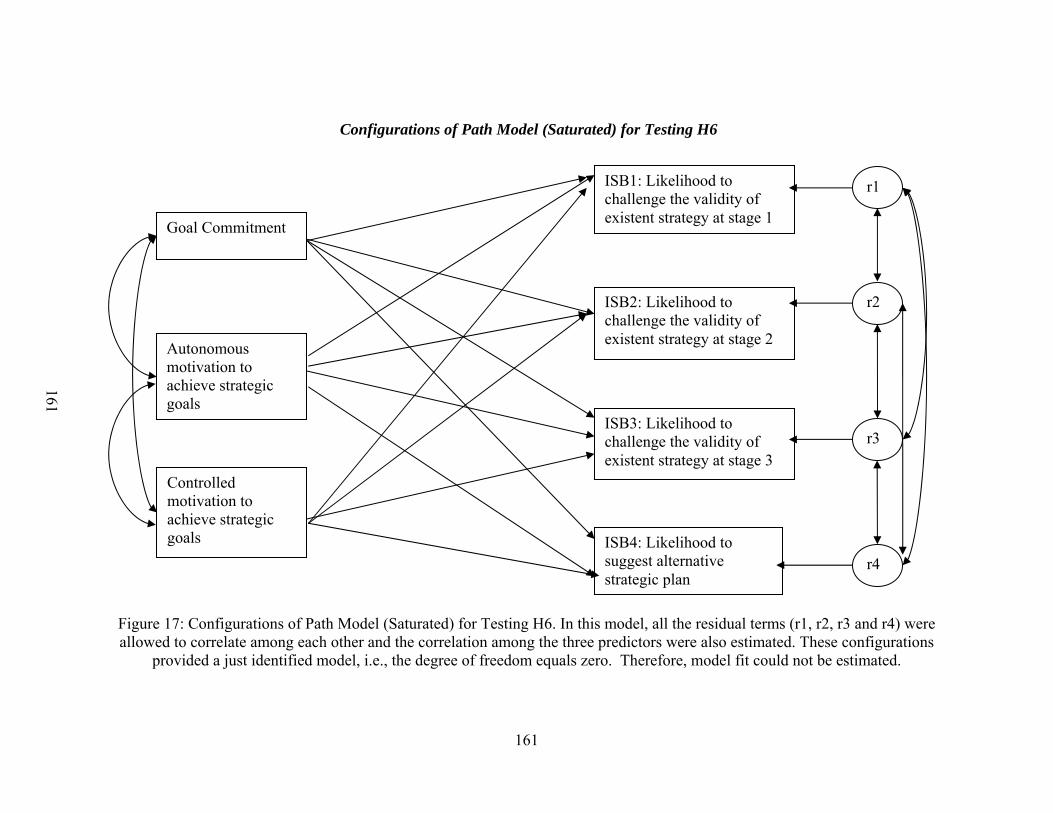
161
Configurations of Path Model (Saturated) for Testing H6
Figure 17: Configurations of Path Model (Saturated) for Testing H6. In this model, all the residual terms (r1, r2, r3 and r4) were allowed to correlate among each other and the correlation among the three predictors were also estimated. These configurations
provided a just identified model, i.e., the degree of freedom equals zero. Therefore, model fit could not be estimated.
Goal Commitment
Autonomous motivation to achieve strategic goals
Controlled motivation to achieve strategic goals
ISB1: Likelihood to challenge the validity of existent strategy at stage 1
ISB2: Likelihood to challenge the validity of existent strategy at stage 2
ISB3: Likelihood to challenge the validity of existent strategy at stage 3
ISB4: Likelihood to suggest alternative strategic plan
r1
r2
r3
r4
161
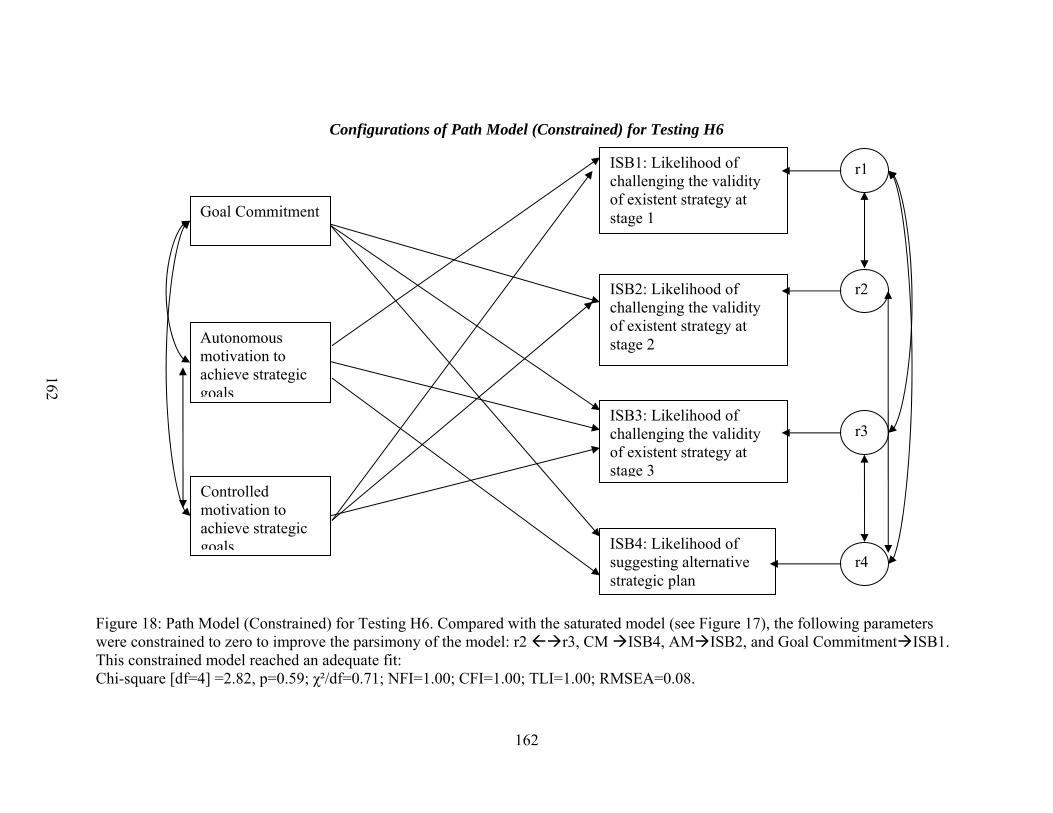
162
Configurations of Path Model (Constrained) for Testing H6
Figure 18: Path Model (Constrained) for Testing H6. Compared with the saturated model (see Figure 17), the following parameters were constrained to zero to improve the parsimony of the model: r2 r3, CM ISB4, AM ISB2, and Goal Commitment ISB1. This constrained model reached an adequate fit: Chi-square [df=4] =2.82, p=0.59; χ²/df=0.71; NFI=1.00; CFI=1.00; TLI=1.00; RMSEA=0.08.
Goal Commitment
Autonomous motivation to achieve strategic goals
Controlled motivation to achieve strategic goals
ISB1: Likelihood of challenging the validity of existent strategy at stage 1
ISB2: Likelihood of challenging the validity of existent strategy at stage 2
ISB3: Likelihood of challenging the validity of existent strategy at stage 3
ISB4: Likelihood of suggesting alternative strategic plan
r1
r2
r3
r4
162
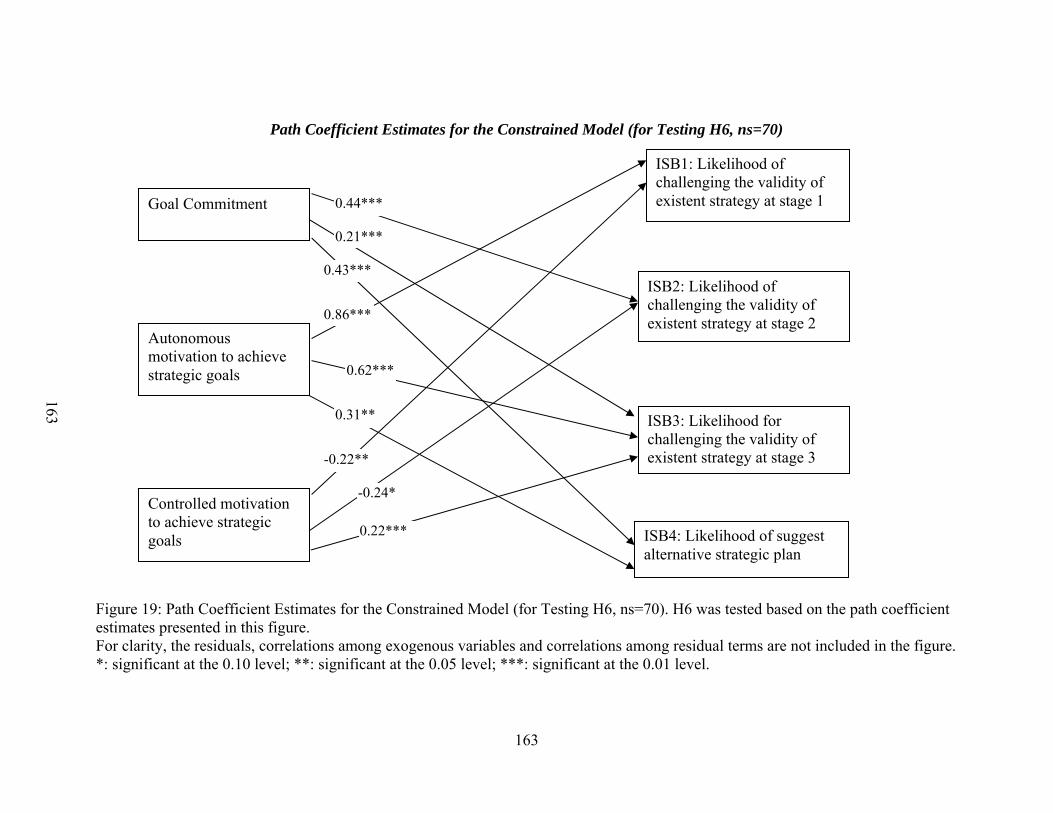
163
Path Coefficient Estimates for the Constrained Model (for Testing H6, ns=70)
Figure 19: Path Coefficient Estimates for the Constrained Model (for Testing H6, ns=70). H6 was tested based on the path coefficient estimates presented in this figure. For clarity, the residuals, correlations among exogenous variables and correlations among residual terms are not included in the figure. *: significant at the 0.10 level; **: significant at the 0.05 level; ***: significant at the 0.01 level.
Goal Commitment
Autonomous motivation to achieve strategic goals
Controlled motivation to achieve strategic goals
ISB1: Likelihood of challenging the validity of existent strategy at stage 1
ISB2: Likelihood of challenging the validity of existent strategy at stage 2
ISB3: Likelihood for challenging the validity of existent strategy at stage 3
ISB4: Likelihood of suggest alternative strategic plan
0.86***
0.22***
0.62***
0.21***
0.44***
0.43***
0.31**
-0.24*
-0.22**
163
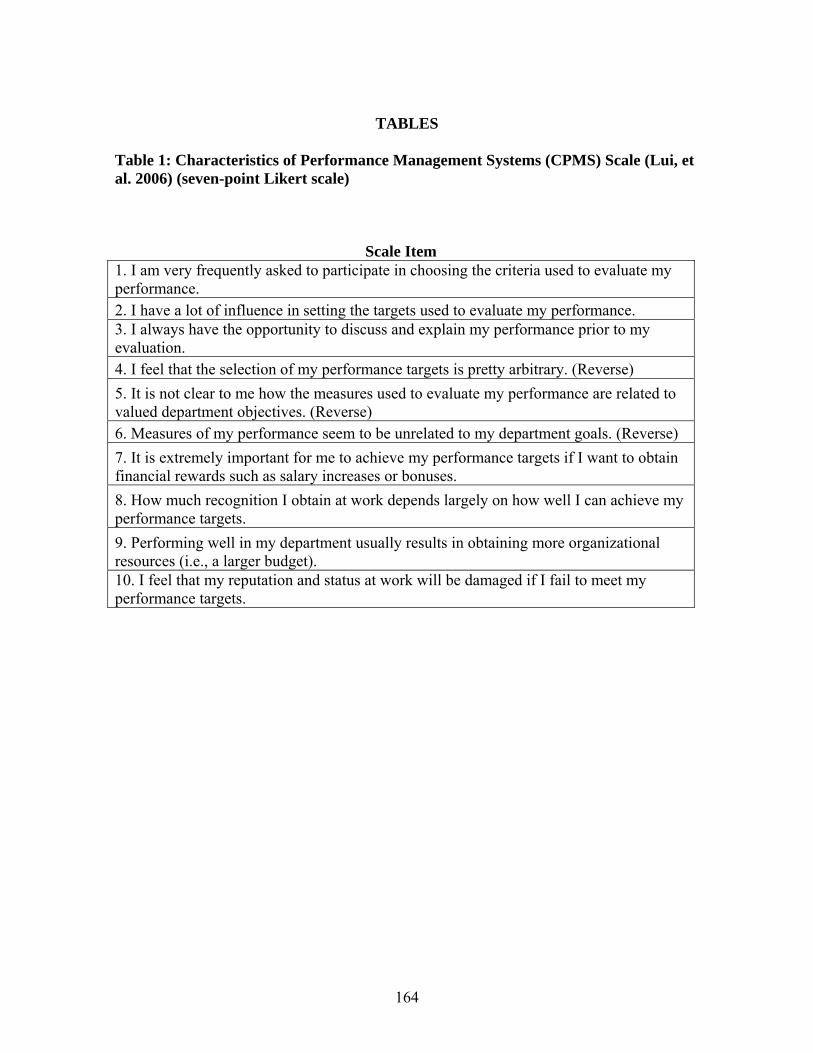
164
TABLES
Table 1: Characteristics of Performance Management Systems (CPMS) Scale (Lui, et al. 2006) (seven-point Likert scale)
Scale Item 1. I am very frequently asked to participate in choosing the criteria used to evaluate my performance. 2. I have a lot of influence in setting the targets used to evaluate my performance. 3. I always have the opportunity to discuss and explain my performance prior to my evaluation. 4. I feel that the selection of my performance targets is pretty arbitrary. (Reverse) 5. It is not clear to me how the measures used to evaluate my performance are related to valued department objectives. (Reverse) 6. Measures of my performance seem to be unrelated to my department goals. (Reverse) 7. It is extremely important for me to achieve my performance targets if I want to obtain financial rewards such as salary increases or bonuses. 8. How much recognition I obtain at work depends largely on how well I can achieve my performance targets. 9. Performing well in my department usually results in obtaining more organizational resources (i.e., a larger budget). 10. I feel that my reputation and status at work will be damaged if I fail to meet my performance targets.
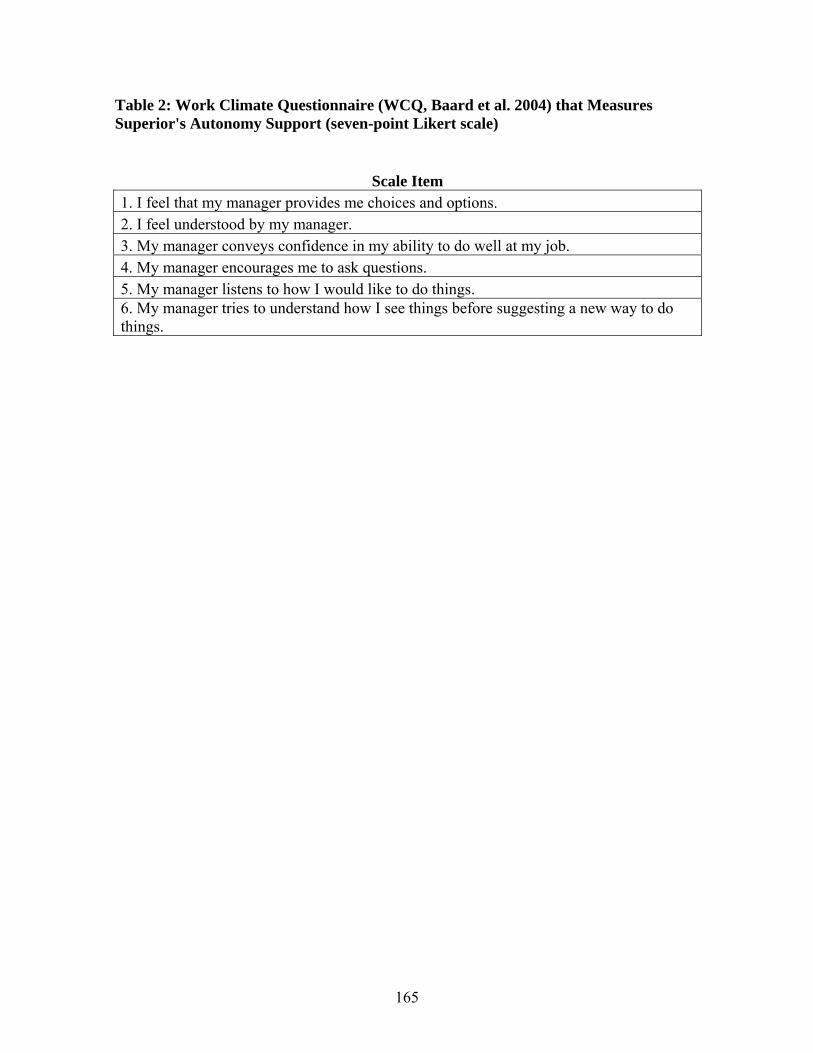
165
Table 2: Work Climate Questionnaire (WCQ, Baard et al. 2004) that Measures Superior's Autonomy Support (seven-point Likert scale)
Scale Item 1. I feel that my manager provides me choices and options. 2. I feel understood by my manager. 3. My manager conveys confidence in my ability to do well at my job. 4. My manager encourages me to ask questions. 5. My manager listens to how I would like to do things. 6. My manager tries to understand how I see things before suggesting a new way to do things.
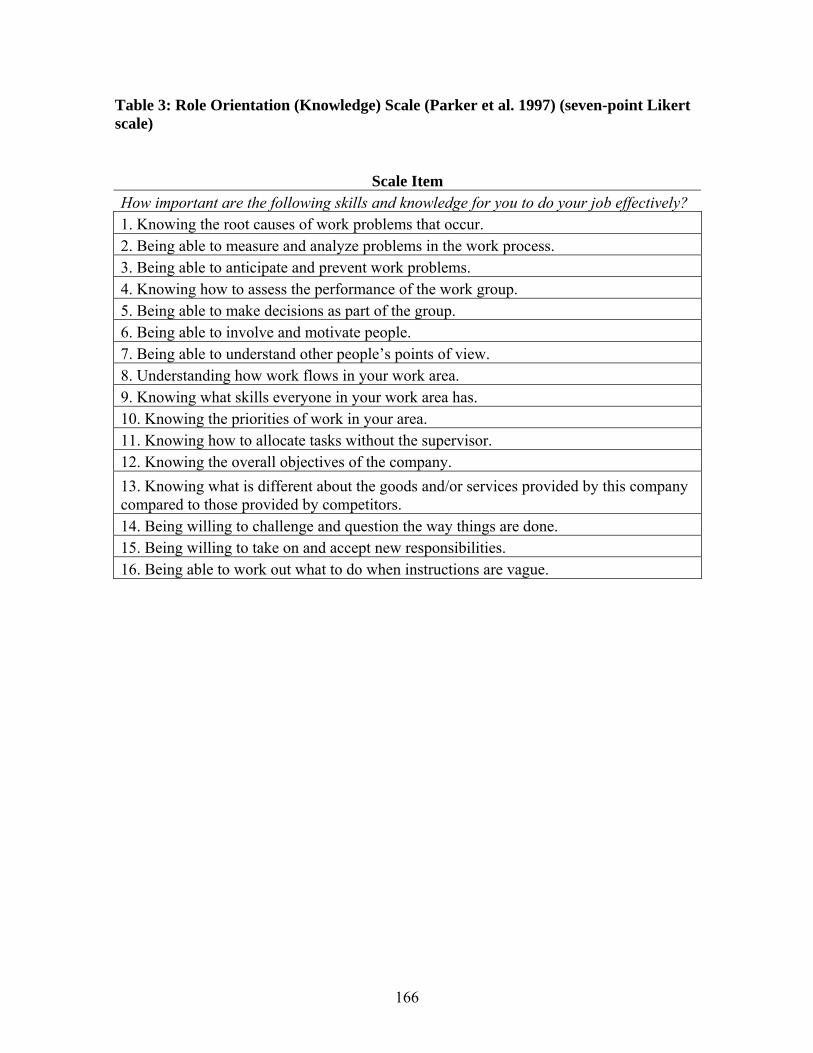
166
Table 3: Role Orientation (Knowledge) Scale (Parker et al. 1997) (seven-point Likert scale)
Scale Item How important are the following skills and knowledge for you to do your job effectively? 1. Knowing the root causes of work problems that occur. 2. Being able to measure and analyze problems in the work process. 3. Being able to anticipate and prevent work problems. 4. Knowing how to assess the performance of the work group. 5. Being able to make decisions as part of the group. 6. Being able to involve and motivate people. 7. Being able to understand other people’s points of view. 8. Understanding how work flows in your work area. 9. Knowing what skills everyone in your work area has. 10. Knowing the priorities of work in your area. 11. Knowing how to allocate tasks without the supervisor. 12. Knowing the overall objectives of the company. 13. Knowing what is different about the goods and/or services provided by this company compared to those provided by competitors. 14. Being willing to challenge and question the way things are done. 15. Being willing to take on and accept new responsibilities. 16. Being able to work out what to do when instructions are vague.
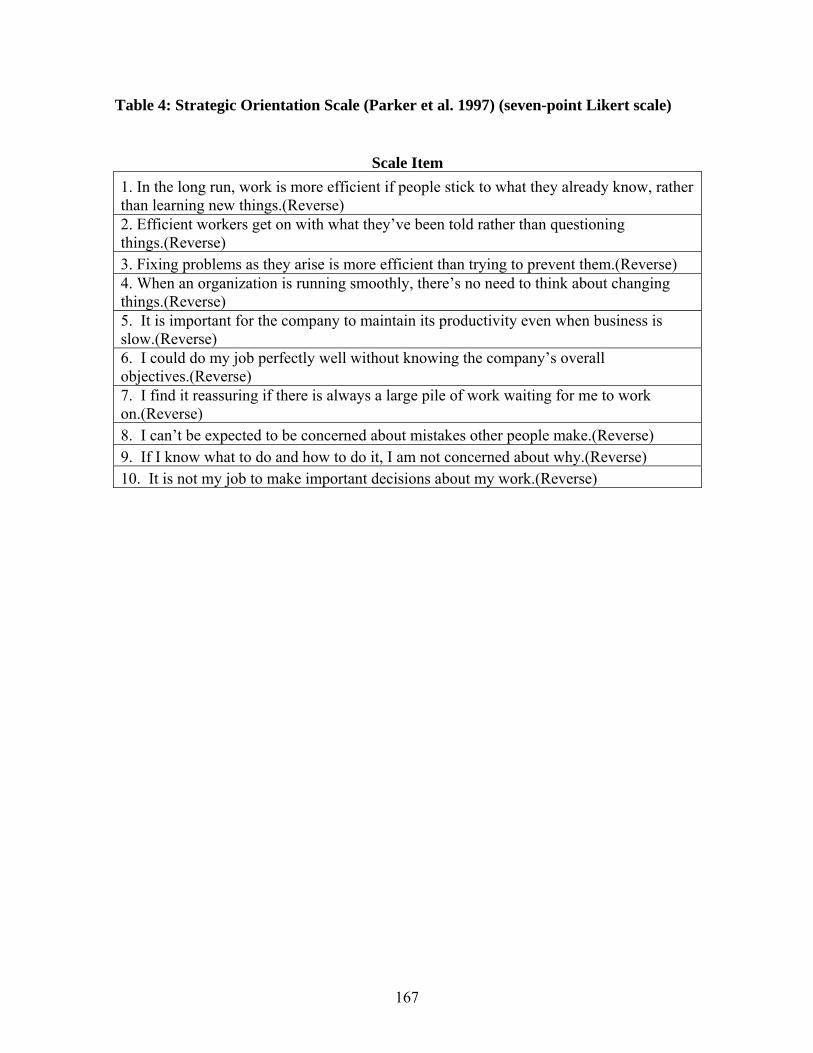
167
Table 4: Strategic Orientation Scale (Parker et al. 1997) (seven-point Likert scale)
Scale Item 1. In the long run, work is more efficient if people stick to what they already know, rather than learning new things.(Reverse) 2. Efficient workers get on with what they’ve been told rather than questioning things.(Reverse) 3. Fixing problems as they arise is more efficient than trying to prevent them.(Reverse) 4. When an organization is running smoothly, there’s no need to think about changing things.(Reverse) 5. It is important for the company to maintain its productivity even when business is slow.(Reverse) 6. I could do my job perfectly well without knowing the company’s overall objectives.(Reverse) 7. I find it reassuring if there is always a large pile of work waiting for me to work on.(Reverse) 8. I can’t be expected to be concerned about mistakes other people make.(Reverse) 9. If I know what to do and how to do it, I am not concerned about why.(Reverse) 10. It is not my job to make important decisions about my work.(Reverse)
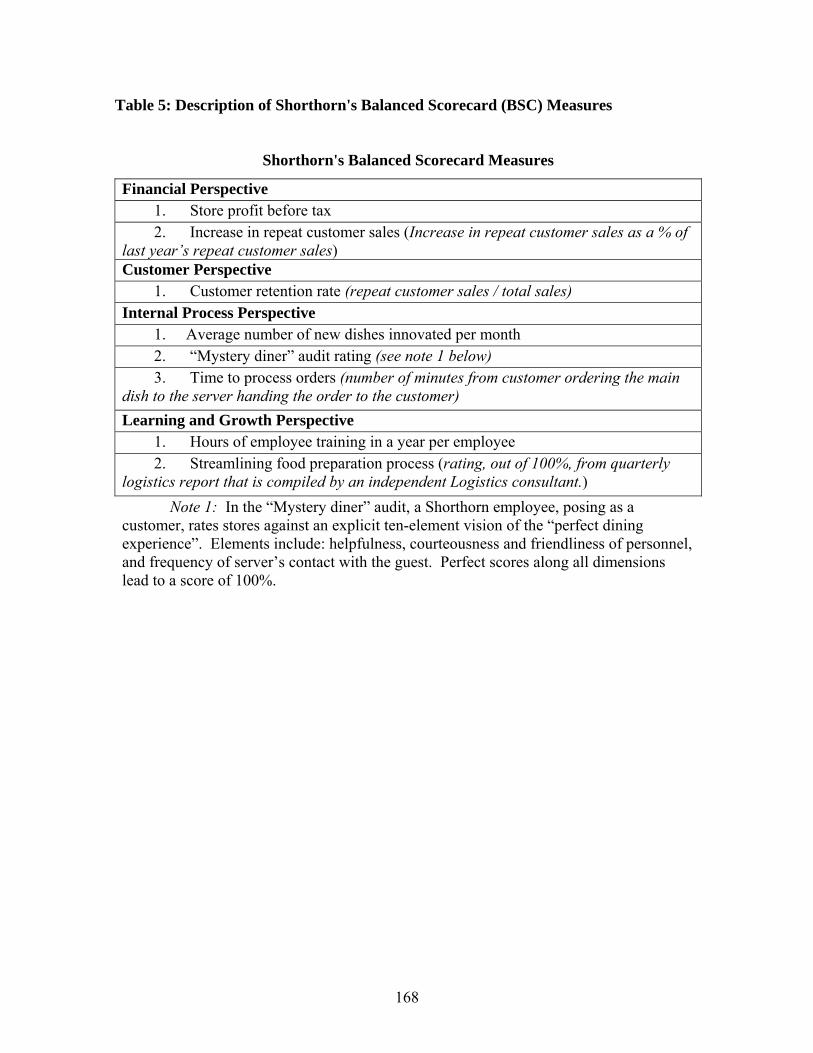
168
Table 5: Description of Shorthorn's Balanced Scorecard (BSC) Measures
Shorthorn's Balanced Scorecard Measures
Financial Perspective 1. Store profit before tax 2. Increase in repeat customer sales (Increase in repeat customer sales as a % of
last year’s repeat customer sales) Customer Perspective
1. Customer retention rate (repeat customer sales / total sales) Internal Process Perspective
1. Average number of new dishes innovated per month 2. “Mystery diner” audit rating (see note 1 below) 3. Time to process orders (number of minutes from customer ordering the main
dish to the server handing the order to the customer) Learning and Growth Perspective
1. Hours of employee training in a year per employee 2. Streamlining food preparation process (rating, out of 100%, from quarterly
logistics report that is compiled by an independent Logistics consultant.) Note 1: In the “Mystery diner” audit, a Shorthorn employee, posing as a
customer, rates stores against an explicit ten-element vision of the “perfect dining experience”. Elements include: helpfulness, courteousness and friendliness of personnel, and frequency of server’s contact with the guest. Perfect scores along all dimensions lead to a score of 100%.
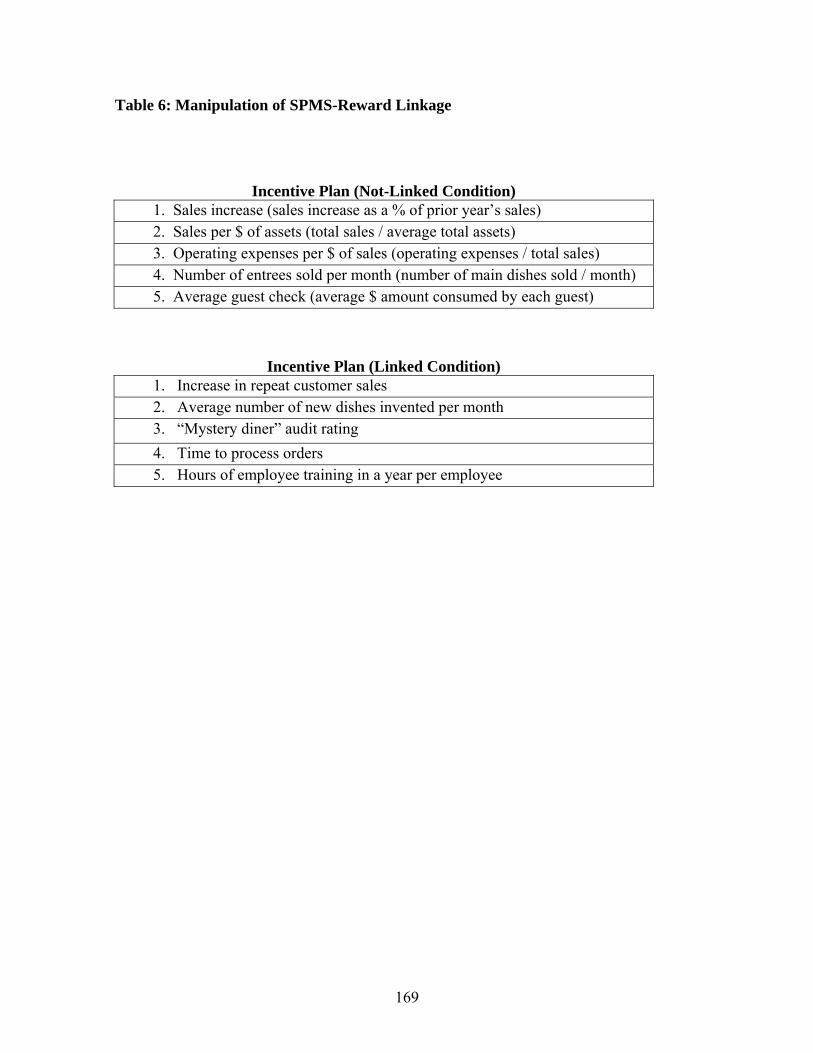
169
Table 6: Manipulation of SPMS-Reward Linkage
Incentive Plan (Not-Linked Condition) 1. Sales increase (sales increase as a % of prior year’s sales) 2. Sales per $ of assets (total sales / average total assets) 3. Operating expenses per $ of sales (operating expenses / total sales) 4. Number of entrees sold per month (number of main dishes sold / month) 5. Average guest check (average $ amount consumed by each guest)
Incentive Plan (Linked Condition) 1. Increase in repeat customer sales 2. Average number of new dishes invented per month 3. “Mystery diner” audit rating 4. Time to process orders 5. Hours of employee training in a year per employee
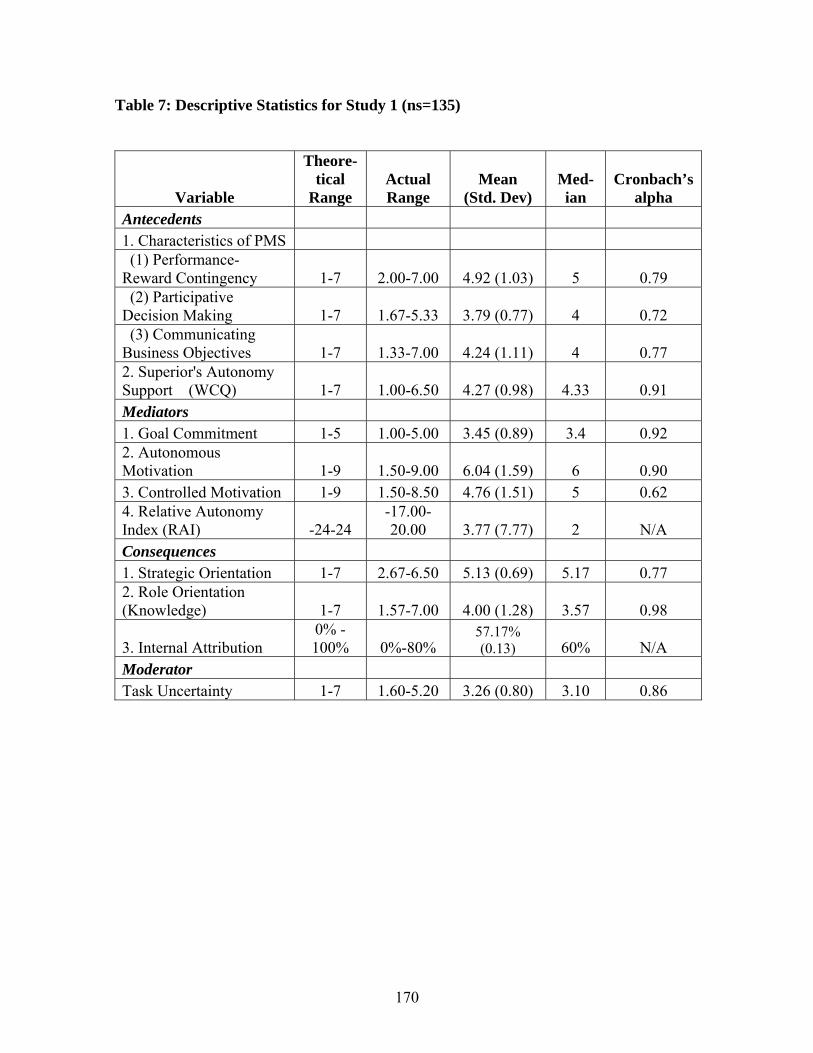
170
Table 7: Descriptive Statistics for Study 1 (ns=135)
Variable
Theore-tical
Range Actual Range
Mean (Std. Dev)
Med-ian
Cronbach’s alpha
Antecedents 1. Characteristics of PMS (1) Performance-Reward Contingency 1-7 2.00-7.00 4.92 (1.03) 5 0.79 (2) Participative Decision Making 1-7 1.67-5.33 3.79 (0.77) 4 0.72 (3) Communicating Business Objectives 1-7 1.33-7.00 4.24 (1.11) 4 0.77 2. Superior's Autonomy Support (WCQ) 1-7 1.00-6.50 4.27 (0.98) 4.33 0.91 Mediators 1. Goal Commitment 1-5 1.00-5.00 3.45 (0.89) 3.4 0.92 2. Autonomous Motivation 1-9 1.50-9.00 6.04 (1.59) 6 0.90 3. Controlled Motivation 1-9 1.50-8.50 4.76 (1.51) 5 0.62 4. Relative Autonomy Index (RAI) -24-24
-17.00-20.00 3.77 (7.77) 2 N/A
Consequences 1. Strategic Orientation 1-7 2.67-6.50 5.13 (0.69) 5.17 0.77 2. Role Orientation (Knowledge) 1-7 1.57-7.00 4.00 (1.28) 3.57 0.98
3. Internal Attribution 0% - 100% 0%-80%
57.17% (0.13) 60% N/A
Moderator Task Uncertainty 1-7 1.60-5.20 3.26 (0.80) 3.10 0.86

171
Table 8: Correlation (p value) Among Four Types of Motivation for Study 1 (ns=135) 1 2 3 4 1. External Regulation 1.00 (0.00) 2. Introjected Regulation 0.45 (0.00) 1.00 (0.00) 3. Identified Regulation -0.23 (0.01) -0.15 (0.08) 1.00 (0.00) 4. Intrinsic Motivation -0.40 (0.00) -0.20 (0.02) 0.81 (0.00) 1.00 (0.00)
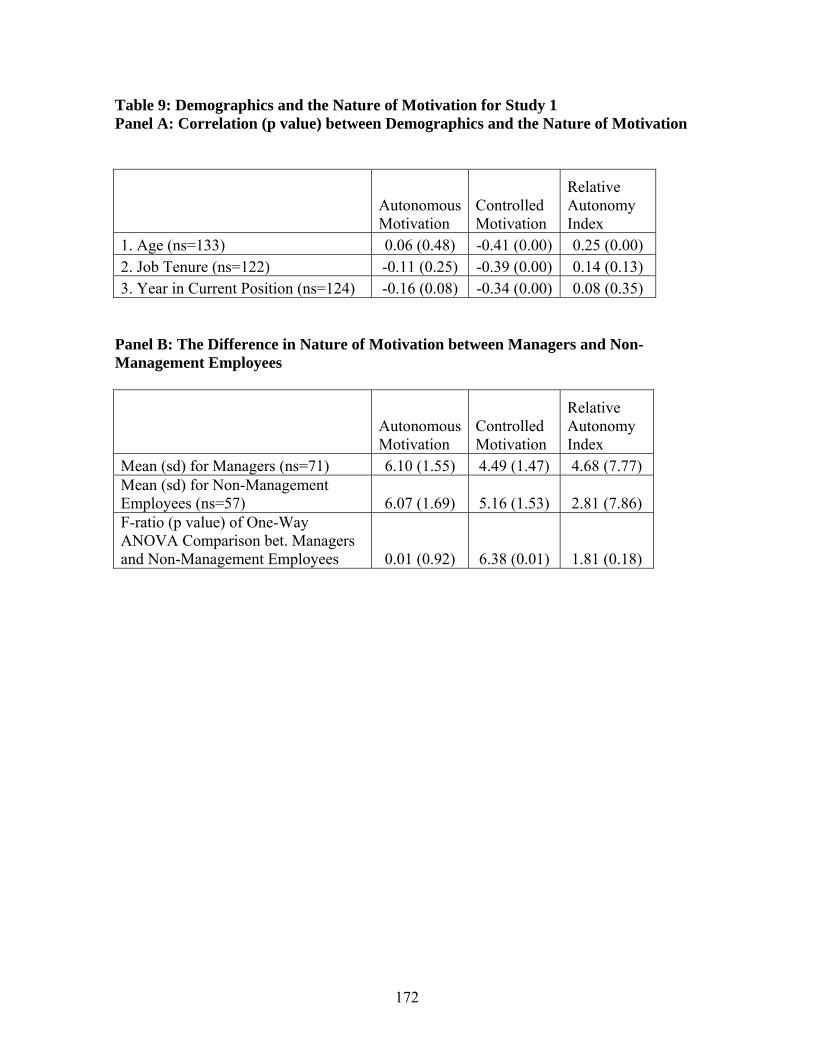
172
Table 9: Demographics and the Nature of Motivation for Study 1 Panel A: Correlation (p value) between Demographics and the Nature of Motivation
Autonomous Motivation
Controlled Motivation
Relative Autonomy Index
1. Age (ns=133) 0.06 (0.48) -0.41 (0.00) 0.25 (0.00) 2. Job Tenure (ns=122) -0.11 (0.25) -0.39 (0.00) 0.14 (0.13) 3. Year in Current Position (ns=124) -0.16 (0.08) -0.34 (0.00) 0.08 (0.35)
Panel B: The Difference in Nature of Motivation between Managers and Non-Management Employees
Autonomous Motivation
Controlled Motivation
Relative Autonomy Index
Mean (sd) for Managers (ns=71) 6.10 (1.55) 4.49 (1.47) 4.68 (7.77) Mean (sd) for Non-Management Employees (ns=57) 6.07 (1.69) 5.16 (1.53) 2.81 (7.86) F-ratio (p value) of One-Way ANOVA Comparison bet. Managers and Non-Management Employees 0.01 (0.92) 6.38 (0.01) 1.81 (0.18)
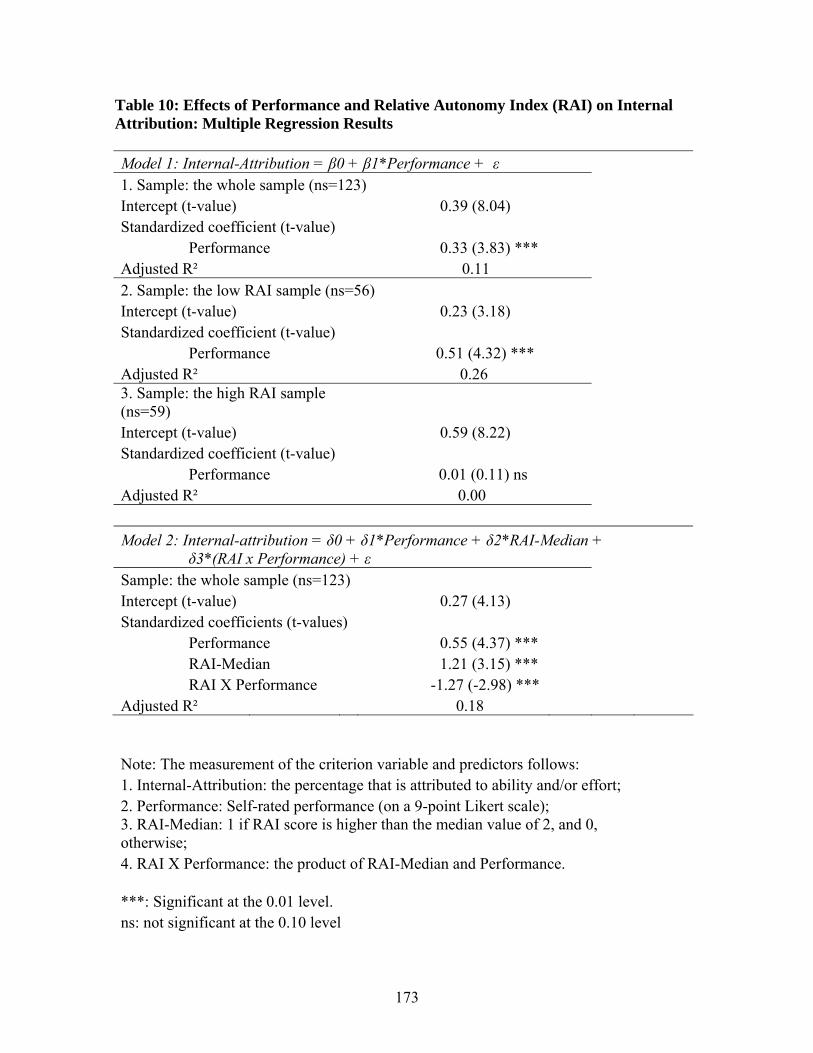
173
Table 10: Effects of Performance and Relative Autonomy Index (RAI) on Internal Attribution: Multiple Regression Results Model 1: Internal-Attribution = β0 + β1*Performance + ε 1. Sample: the whole sample (ns=123) Intercept (t-value) 0.39 (8.04) Standardized coefficient (t-value) Performance 0.33 (3.83) *** Adjusted R² 0.11 2. Sample: the low RAI sample (ns=56) Intercept (t-value) 0.23 (3.18) Standardized coefficient (t-value) Performance 0.51 (4.32) *** Adjusted R² 0.26 3. Sample: the high RAI sample (ns=59) Intercept (t-value) 0.59 (8.22) Standardized coefficient (t-value) Performance 0.01 (0.11) ns Adjusted R² 0.00
Model 2: Internal-attribution = δ0 + δ1*Performance + δ2*RAI-Median + δ3*(RAI x Performance) + ε Sample: the whole sample (ns=123) Intercept (t-value) 0.27 (4.13) Standardized coefficients (t-values) Performance 0.55 (4.37) *** RAI-Median 1.21 (3.15) *** RAI X Performance -1.27 (-2.98) *** Adjusted R² 0.18
Note: The measurement of the criterion variable and predictors follows: 1. Internal-Attribution: the percentage that is attributed to ability and/or effort; 2. Performance: Self-rated performance (on a 9-point Likert scale); 3. RAI-Median: 1 if RAI score is higher than the median value of 2, and 0, otherwise; 4. RAI X Performance: the product of RAI-Median and Performance. ***: Significant at the 0.01 level. ns: not significant at the 0.10 level
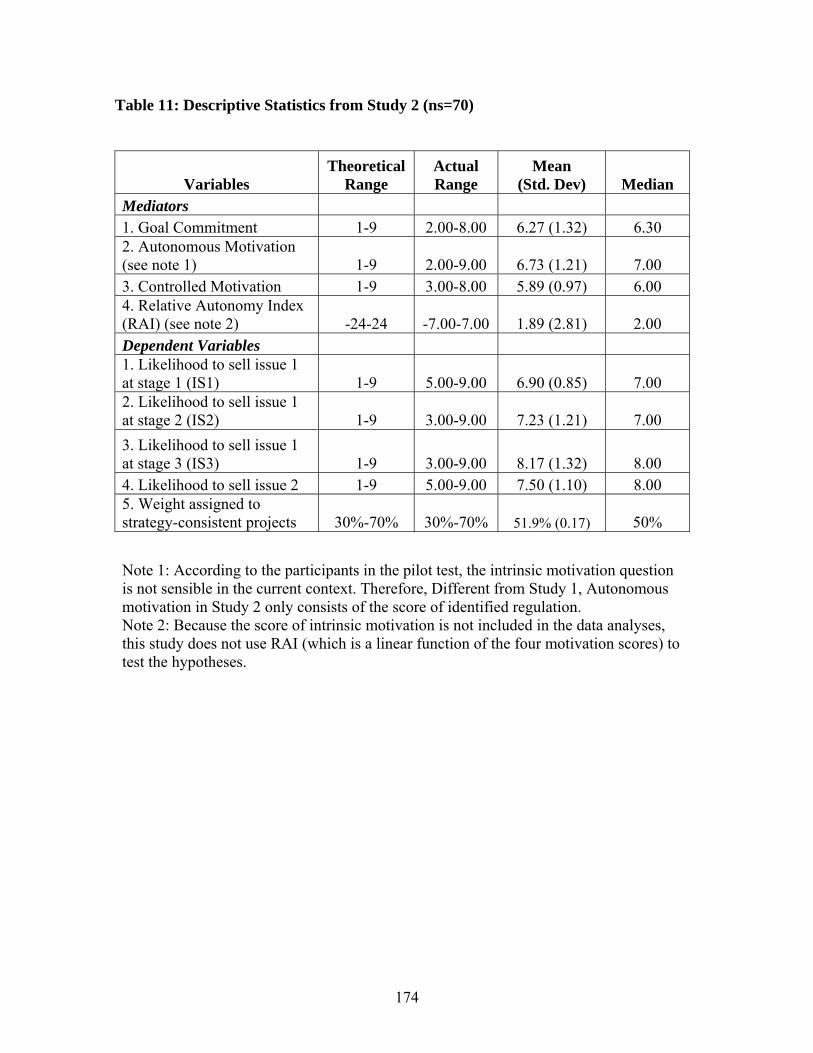
174
Table 11: Descriptive Statistics from Study 2 (ns=70)
Variables Theoretical
Range Actual Range
Mean (Std. Dev) Median
Mediators 1. Goal Commitment 1-9 2.00-8.00 6.27 (1.32) 6.30 2. Autonomous Motivation (see note 1) 1-9 2.00-9.00 6.73 (1.21) 7.00 3. Controlled Motivation 1-9 3.00-8.00 5.89 (0.97) 6.00 4. Relative Autonomy Index (RAI) (see note 2) -24-24 -7.00-7.00 1.89 (2.81) 2.00 Dependent Variables 1. Likelihood to sell issue 1 at stage 1 (IS1) 1-9 5.00-9.00 6.90 (0.85) 7.00 2. Likelihood to sell issue 1 at stage 2 (IS2) 1-9 3.00-9.00 7.23 (1.21) 7.00 3. Likelihood to sell issue 1 at stage 3 (IS3) 1-9 3.00-9.00 8.17 (1.32) 8.00 4. Likelihood to sell issue 2 1-9 5.00-9.00 7.50 (1.10) 8.00 5. Weight assigned to strategy-consistent projects 30%-70% 30%-70% 51.9% (0.17) 50% Note 1: According to the participants in the pilot test, the intrinsic motivation question is not sensible in the current context. Therefore, Different from Study 1, Autonomous motivation in Study 2 only consists of the score of identified regulation. Note 2: Because the score of intrinsic motivation is not included in the data analyses, this study does not use RAI (which is a linear function of the four motivation scores) to test the hypotheses.
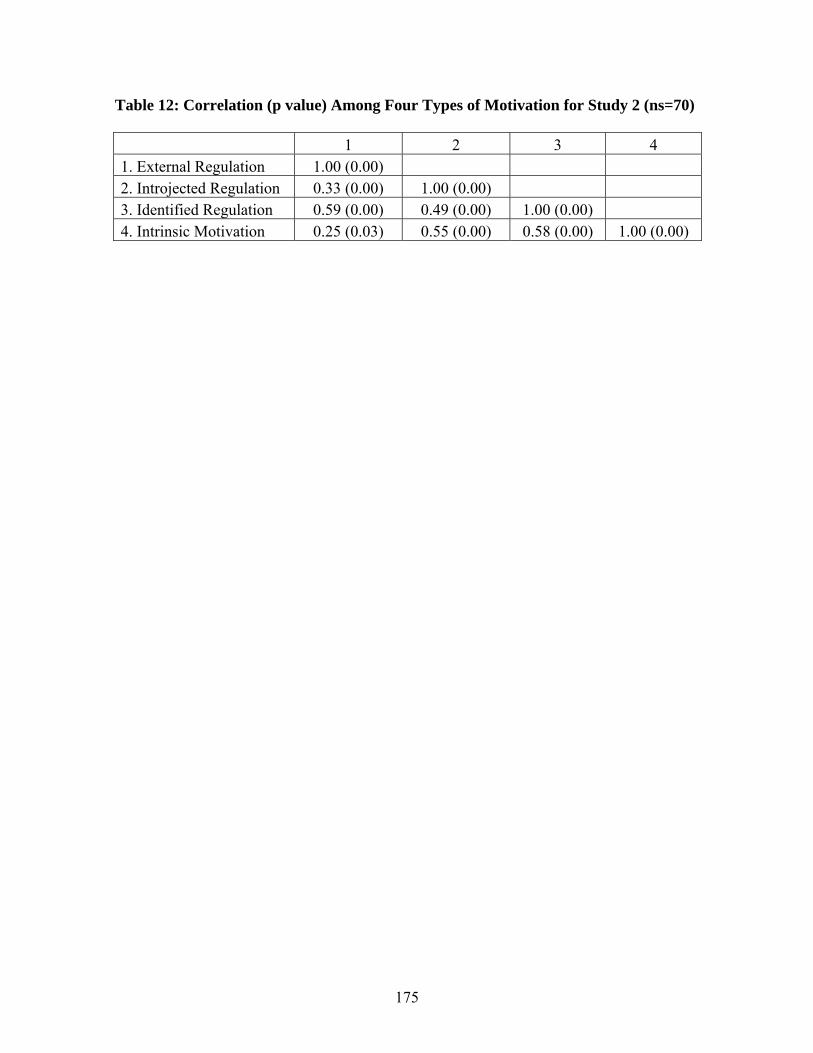
175
Table 12: Correlation (p value) Among Four Types of Motivation for Study 2 (ns=70) 1 2 3 4 1. External Regulation 1.00 (0.00) 2. Introjected Regulation 0.33 (0.00) 1.00 (0.00) 3. Identified Regulation 0.59 (0.00) 0.49 (0.00) 1.00 (0.00) 4. Intrinsic Motivation 0.25 (0.03) 0.55 (0.00) 0.58 (0.00) 1.00 (0.00)
177
EXPERIMENT INSTRUMENT A 2 (SPMS-Reward Linkage: not-linked condition vs. linked condition) by 2 (Participative Decision Making: control condition vs. participation condition) between-subject design was used. Participants were randomly assigned to one of the four combinations of the two factors. (Note: Italicized parts are not shown to the experiment participants.) Case 1 (Not-linked X Control Condition) Ms. Sullivan and her three friends opened the first Shorthorn Steakhouse in March 1990. Since then, their Australia-themed Steakhouse has grown to a restaurant chain that owns 8 stores. Shorthorn aims to provide its customers with generous portions of food at moderate prices, as well as a casual and comfortable dining atmosphere. Please imagine that you are the manager of one of Shorthorn’s stores. Your task today is to read the following information about Shorthorn and make a few management decisions. Shorthorn’s New Strategy Recently Shorthorn’s top management shifted its strategic focus from serving tourists to retaining local customers. Shorthorn expects to grow its sales mainly by increasing sales among repeat customers. Shorthorn adopted this new strategy in order to adapt itself to an important change in the local economy. Specifically, a report provided by Bureau of Statistics predicts that the number of tourists in the region will drop significantly (25%-40%) in the next few years. In order to attain the goal of improving customer retention, Shorthorn plans to take the following actions: (1) providing customers with excellent dining experiences, (2) adding new dishes to the menu faster than its competitors, and (3) serving orders in a speedy way. Shorthorn’s management firmly believes that two key foundations for ensuring the success of the above strategic plans are well-trained employees and a streamlined and efficient food preparation process. Figure 1 shows Shorthorn’s strategy map, which depicts how Shorthorn plans to achieve its strategic goal (i.e., improve customer retention) by performing well on the above actions (e.g., train employees and streamline food preparation process).
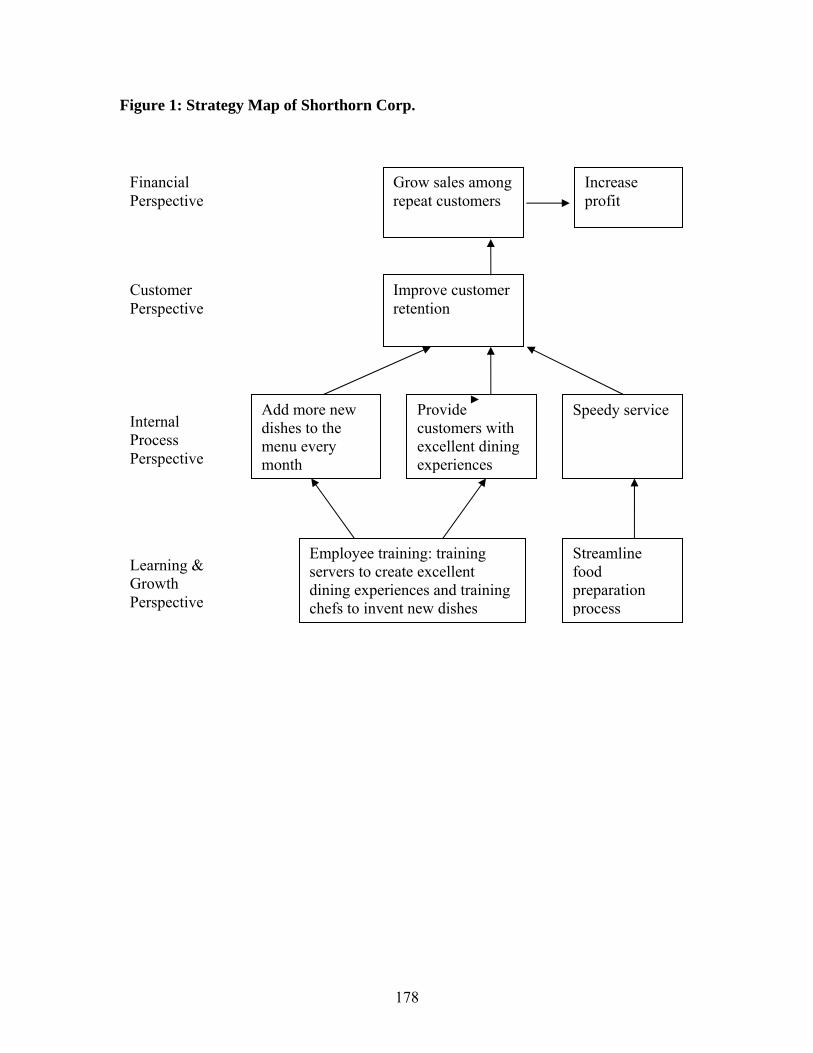
178
Figure 1: Strategy Map of Shorthorn Corp.
Employee training: training servers to create excellent dining experiences and training chefs to invent new dishes
Streamline food preparation process
Add more new dishes to the menu every month
Provide customers with excellent dining experiences
Improve customer retention
Grow sales among repeat customers
Financial Perspective
Customer Perspective
Internal Process Perspective
Learning & Growth Perspective
Speedy service
Increase profit

179
Balanced Scorecard (BSC) To monitor its strategy implementation, Shorthorn uses a management tool called the Balanced Scorecard (BSC) to measure the performance of each of its eight stores. Consistent with the strategy map (Figure 1), the Balanced Scorecard (Table 1) contains a set of performance measures carefully chosen to represent important aspects in four areas. The four areas are financial performance, customer relations, internal business processes, and learning and growth. These measures together reflect both the drivers and the outcomes of the strategy implementation. Your store’s performance on the eight BSC measures is used to evaluate how successfully the strategy has been implemented in your store. The BSC measures are described below in Table 1.
Table 1: Shorthorn's Balanced Scorecard Measures
Financial Perspective 1. Store profit before tax 2. Increase in repeat customer sales (Increase in repeat customer sales as a % of
last year’s repeat customer sales) Customer Perspective
1. Customer retention rate (repeat customer sales / total sales) Internal Process Perspective
1. Average number of new dishes innovated per month 2. “Mystery diner” audit rating (see note 1 below) 3. Time to process orders (number of minutes from customer ordering the main
dish to the server handing the order to the customer) Learning and Growth Perspective
1. Hours of employee training in a year per employee 2. Streamlining food preparation process (rating, out of 100%, from quarterly
logistics report that is compiled by an independent Logistics consultant.) Note 1: In the “Mystery diner” audit, a Shorthorn employee, posing as a
customer, rates stores against an explicit ten-element vision of the “perfect dining experience”. Elements include: helpfulness, courteousness and friendliness of personnel, and frequency of server’s contact with the guest. Perfect scores along all dimensions lead to a score of 100%.

180
Incentive Plan Your annual cash bonus, which could be as high as HK$80,000, or 25% of your base salary, is determined by a separate system: the incentive plan. This incentive plan consists of five criteria that are listed below in Table 2. At the beginning of each year, top management and the individual store managers together decide the targets for the five criteria. If the store successfully reaches the targets on all five criteria, the store manager gets 100% of the bonus (i.e., HK$ 80,000). Failure to achieve each of the five targets will lead to a deduction of 20% from the total possible bonus. For example, if the store achieved three out of five targets, then the store manager will get 60% of the bonus (i.e., HK$48,000). Thus, no bonus will be earned if the store fails to achieve all five targets. Manipulation of the SPMS-Reward Linkage:
Table 2: Incentive Plan 1. Sales increase (sales increase as a % of prior year’s sales) 2. Sales per $ of assets (total sales / average total assets) 3. Operating expenses per $ of sales (operating expenses / total sales) 4. Number of entrees sold per month (number of main dishes sold / month) 5. Average guest check (average $ amount consumed by each guest)

181
Practice on Calculating Bonus for a Different Store Manager Bonus Computation To make sure that you fully understand this incentive plan, please calculate the bonus for a store manager assuming the following performance for his/her store.
Shorthorn's Balanced Scorecard Measures Performance Financial Perspective
1. Sales increase Target reached 2. Increase in repeat customer sales Target not reached
Customer Perspective 1. Customer retention rate Target reached
Internal Process Perspective 1. Average number of new dishes innovated per month Target reached 2. “Mystery diner” audit rating Target not reached 3. Time to process orders Target reached
Learning and Growth Perspective 1. Hours of employee training in a year per employee Target not reached 2. Streamlining food preparation process Target reached
In addition, the financial statements also show the following: 1. Store profit before tax: Target not reached 2. Sales per $ of assets: Target reached 3. Operating expenses per $ of sales: Target not reached 4. Average guest check: Target not reached This store manager will get an annual bonus of HK$ _______________.
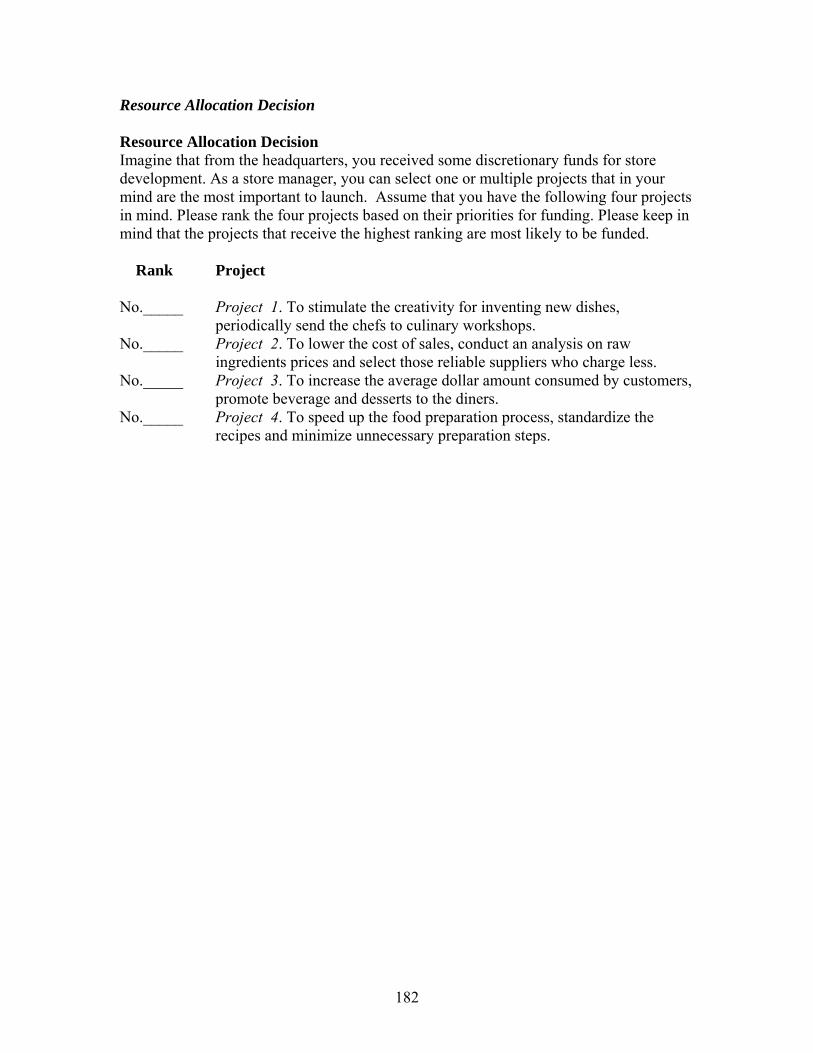
182
Resource Allocation Decision Resource Allocation Decision Imagine that from the headquarters, you received some discretionary funds for store development. As a store manager, you can select one or multiple projects that in your mind are the most important to launch. Assume that you have the following four projects in mind. Please rank the four projects based on their priorities for funding. Please keep in mind that the projects that receive the highest ranking are most likely to be funded. Rank Project No._____ Project 1. To stimulate the creativity for inventing new dishes,
periodically send the chefs to culinary workshops. No._____ Project 2. To lower the cost of sales, conduct an analysis on raw
ingredients prices and select those reliable suppliers who charge less. No._____ Project 3. To increase the average dollar amount consumed by customers,
promote beverage and desserts to the diners. No._____ Project 4. To speed up the food preparation process, standardize the
recipes and minimize unnecessary preparation steps.
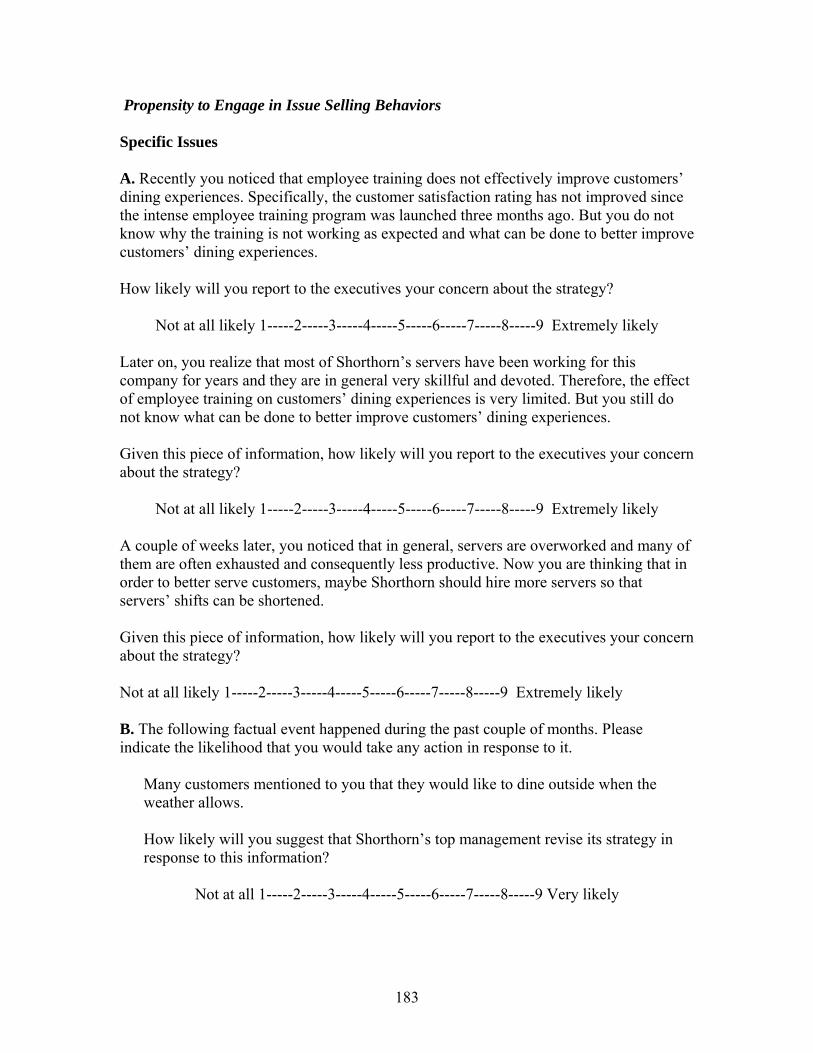
183
Propensity to Engage in Issue Selling Behaviors Specific Issues A. Recently you noticed that employee training does not effectively improve customers’ dining experiences. Specifically, the customer satisfaction rating has not improved since the intense employee training program was launched three months ago. But you do not know why the training is not working as expected and what can be done to better improve customers’ dining experiences. How likely will you report to the executives your concern about the strategy?
Not at all likely 1-----2-----3-----4-----5-----6-----7-----8-----9 Extremely likely Later on, you realize that most of Shorthorn’s servers have been working for this company for years and they are in general very skillful and devoted. Therefore, the effect of employee training on customers’ dining experiences is very limited. But you still do not know what can be done to better improve customers’ dining experiences. Given this piece of information, how likely will you report to the executives your concern about the strategy?
Not at all likely 1-----2-----3-----4-----5-----6-----7-----8-----9 Extremely likely A couple of weeks later, you noticed that in general, servers are overworked and many of them are often exhausted and consequently less productive. Now you are thinking that in order to better serve customers, maybe Shorthorn should hire more servers so that servers’ shifts can be shortened. Given this piece of information, how likely will you report to the executives your concern about the strategy? Not at all likely 1-----2-----3-----4-----5-----6-----7-----8-----9 Extremely likely B. The following factual event happened during the past couple of months. Please indicate the likelihood that you would take any action in response to it.
Many customers mentioned to you that they would like to dine outside when the weather allows. How likely will you suggest that Shorthorn’s top management revise its strategy in response to this information?
Not at all 1-----2-----3-----4-----5-----6-----7-----8-----9 Very likely

184
Goal Commitment About the Strategic Goals Imagine yourself as one of Shorthorn’s store managers. Please respond to each of the following items as it relates to the strategic goal of improving customer retention. 1--------2--------3--------4--------5--------6--------7--------8--------9 Not all true Somewhat true Very true
1. _____ As a restaurant manager, it would be hard to take this goal seriously. 2. _____ Quite frankly, as a restaurant manager, I would not care if I achieved this
goal or not. 3. _____ As a restaurant manager, I would be strongly committed to pursuing this
goal. 4. _____ As a restaurant manager, it wouldn’t take much to make me abandon this
goal. 5. _____ As a restaurant manager, I think this goal would be a good goal to shoot
for.
Autonomous and Controlled Motivation Individuals try to achieve goals for a variety of reasons. For each of the reasons described below, indicate the extent to which it is representative of your motive for trying to achieve Shorthorn’s strategic goal of improving customer retention.
1 2 3 4 5 6 7 8 9 Not at all Completely for for this reason this reason 1. ______ I would try to achieve Shorthorn’s strategic goal because the top management wants me to, or because I’ll get reward, praise, or approval for achieving this goal. 2. ______ I would try to achieve Shorthorn’s strategic goal because I would feel ashamed, guilty, or anxious if I didn’t. 3. ______ I would try to achieve Shorthorn’s strategic goal because I really believe that it is an important goal to have and I endorse it freely and value it wholeheartedly. 4. ______ I would try to achieve Shorthorn’s strategic goal because of the challenge and enjoyment pursuing the goal would provide me.

185
Manipulation Check Question and Demographic Questions
Demographic and Other questions
1. To what extent do you think that the Incentive Plan used to determine store managers’ cash bonuses is in general consistent with the Balanced Scorecard?
Not at all consistent 1-----2-----3-----4-----5-----6-----7-----8-----9 To a great extent consistent
2. To what extent do you believe that if you performed well on the Balance Scorecard, you would be fairly rewarded by the Incentive Plan?
Not at all 1-----2-----3-----4-----5-----6-----7-----8-----9 To a great extent 3. How realistic do you think the case is?
Extremely unrealistic 1-----2-----3-----4-----5-----6-----7-----8-----9 Very realistic
4. How difficult was it to answer the questions in the case?
Extremely easy 1-----2-----3-----4-----5-----6-----7-----8-----9 Very difficult 5. Prior to this survey, to what extent were you familiar with the Balanced Scorecard? Not familiar at all 1-----2-----3-----4-----5-----6-----7-----8-----9 Very familiar 6. Gender: Male ____ Female ____
7. Age: ____ years
8. Number of years of full time work experience: __________
9. Your current position
_______________________________________________________
Thank you for participating in this survey!
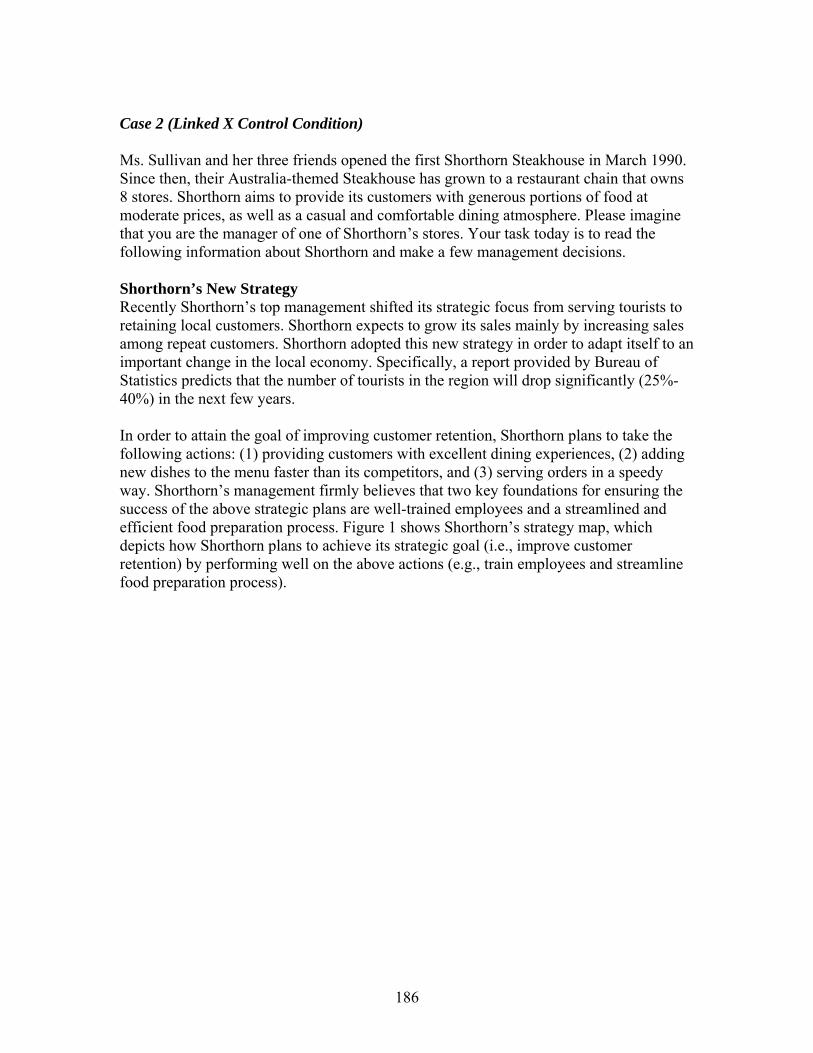
186
Case 2 (Linked X Control Condition) Ms. Sullivan and her three friends opened the first Shorthorn Steakhouse in March 1990. Since then, their Australia-themed Steakhouse has grown to a restaurant chain that owns 8 stores. Shorthorn aims to provide its customers with generous portions of food at moderate prices, as well as a casual and comfortable dining atmosphere. Please imagine that you are the manager of one of Shorthorn’s stores. Your task today is to read the following information about Shorthorn and make a few management decisions. Shorthorn’s New Strategy Recently Shorthorn’s top management shifted its strategic focus from serving tourists to retaining local customers. Shorthorn expects to grow its sales mainly by increasing sales among repeat customers. Shorthorn adopted this new strategy in order to adapt itself to an important change in the local economy. Specifically, a report provided by Bureau of Statistics predicts that the number of tourists in the region will drop significantly (25%-40%) in the next few years. In order to attain the goal of improving customer retention, Shorthorn plans to take the following actions: (1) providing customers with excellent dining experiences, (2) adding new dishes to the menu faster than its competitors, and (3) serving orders in a speedy way. Shorthorn’s management firmly believes that two key foundations for ensuring the success of the above strategic plans are well-trained employees and a streamlined and efficient food preparation process. Figure 1 shows Shorthorn’s strategy map, which depicts how Shorthorn plans to achieve its strategic goal (i.e., improve customer retention) by performing well on the above actions (e.g., train employees and streamline food preparation process).

187
Figure 1: Strategy Map of Shorthorn Corp.
Employee training: training servers to create excellent dining experiences and training chefs to invent new dishes
Streamline food preparation process
Add more new dishes to the menu every month
Provide customers with excellent dining experiences
Improve customer retention
Grow sales among repeat customers
Financial Perspective
Customer Perspective
Internal Process Perspective
Learning & Growth Perspective
Speedy service
Increase profit
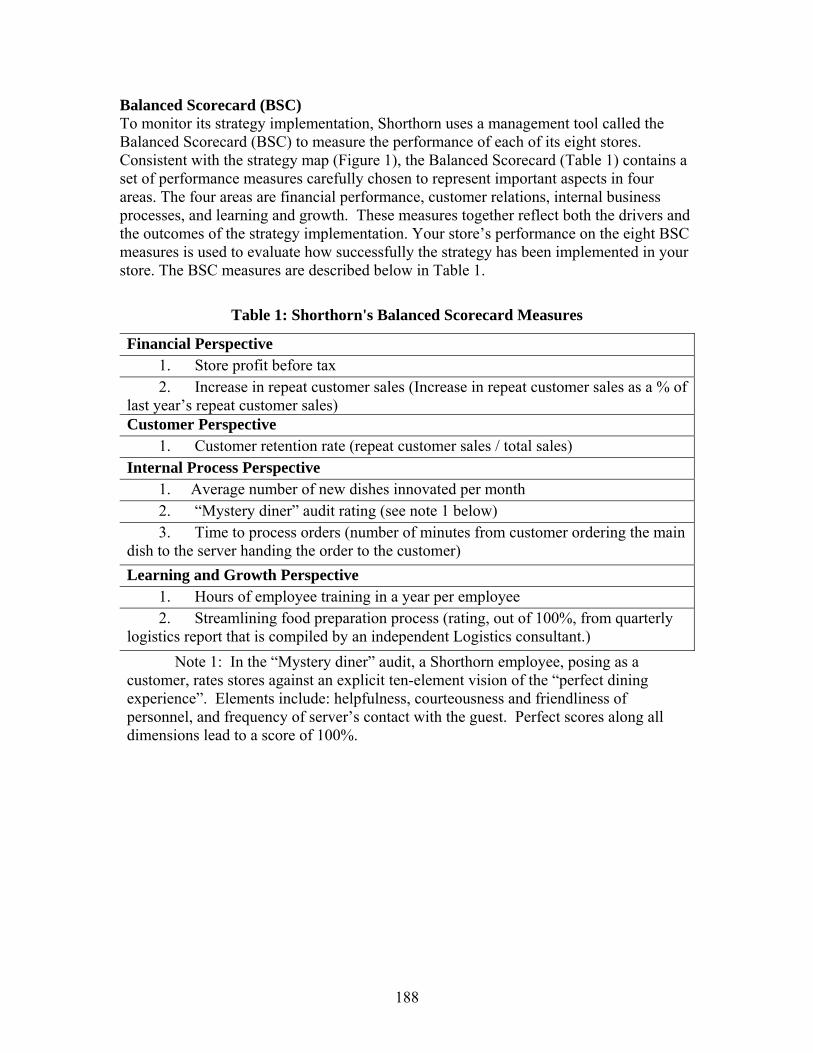
188
Balanced Scorecard (BSC) To monitor its strategy implementation, Shorthorn uses a management tool called the Balanced Scorecard (BSC) to measure the performance of each of its eight stores. Consistent with the strategy map (Figure 1), the Balanced Scorecard (Table 1) contains a set of performance measures carefully chosen to represent important aspects in four areas. The four areas are financial performance, customer relations, internal business processes, and learning and growth. These measures together reflect both the drivers and the outcomes of the strategy implementation. Your store’s performance on the eight BSC measures is used to evaluate how successfully the strategy has been implemented in your store. The BSC measures are described below in Table 1.
Table 1: Shorthorn's Balanced Scorecard Measures
Financial Perspective 1. Store profit before tax 2. Increase in repeat customer sales (Increase in repeat customer sales as a % of
last year’s repeat customer sales) Customer Perspective
1. Customer retention rate (repeat customer sales / total sales) Internal Process Perspective
1. Average number of new dishes innovated per month 2. “Mystery diner” audit rating (see note 1 below) 3. Time to process orders (number of minutes from customer ordering the main
dish to the server handing the order to the customer) Learning and Growth Perspective
1. Hours of employee training in a year per employee 2. Streamlining food preparation process (rating, out of 100%, from quarterly
logistics report that is compiled by an independent Logistics consultant.) Note 1: In the “Mystery diner” audit, a Shorthorn employee, posing as a
customer, rates stores against an explicit ten-element vision of the “perfect dining experience”. Elements include: helpfulness, courteousness and friendliness of personnel, and frequency of server’s contact with the guest. Perfect scores along all dimensions lead to a score of 100%.
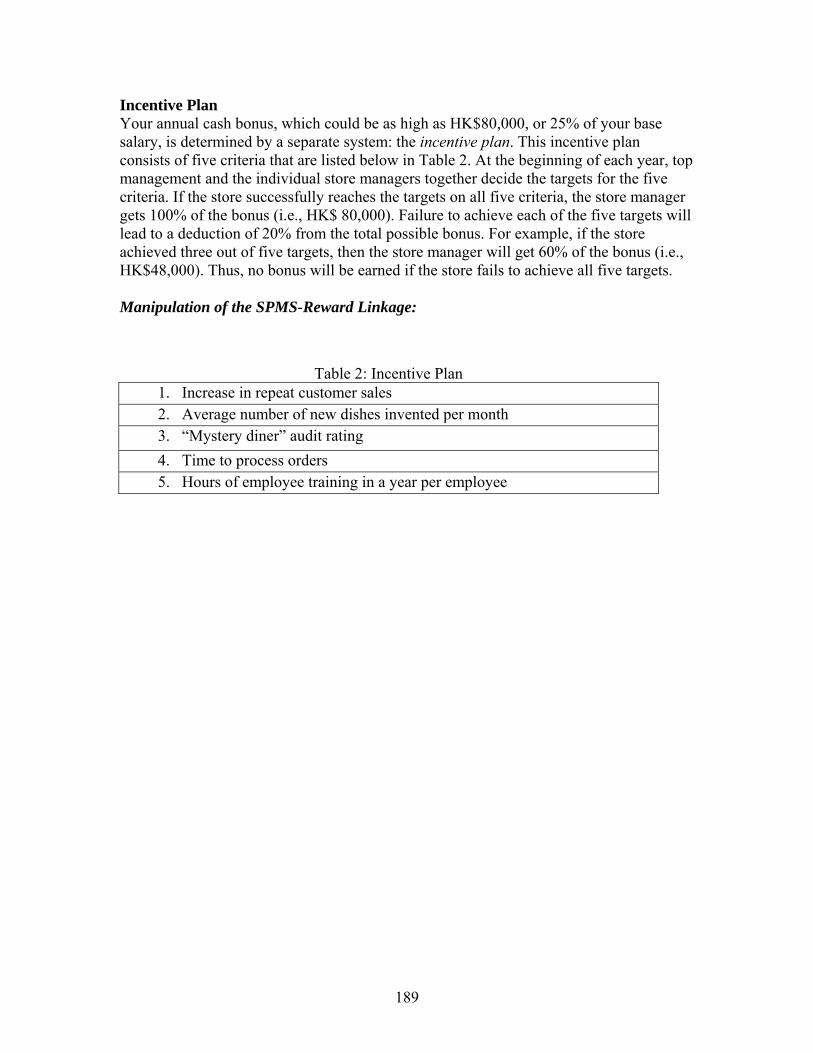
189
Incentive Plan Your annual cash bonus, which could be as high as HK$80,000, or 25% of your base salary, is determined by a separate system: the incentive plan. This incentive plan consists of five criteria that are listed below in Table 2. At the beginning of each year, top management and the individual store managers together decide the targets for the five criteria. If the store successfully reaches the targets on all five criteria, the store manager gets 100% of the bonus (i.e., HK$ 80,000). Failure to achieve each of the five targets will lead to a deduction of 20% from the total possible bonus. For example, if the store achieved three out of five targets, then the store manager will get 60% of the bonus (i.e., HK$48,000). Thus, no bonus will be earned if the store fails to achieve all five targets. Manipulation of the SPMS-Reward Linkage:
Table 2: Incentive Plan 1. Increase in repeat customer sales 2. Average number of new dishes invented per month 3. “Mystery diner” audit rating 4. Time to process orders 5. Hours of employee training in a year per employee

190
Practice on Calculating Bonus for a Different Store Manager Bonus Computation To make sure that you fully understand this incentive plan, please calculate the bonus for a store manager assuming the following performance for his/her store.
Shorthorn's Balanced Scorecard Measures Performance Financial Perspective
1. Sales increase Target reached 2. Increase in repeat customer sales Target not reached
Customer Perspective 1. Customer retention rate Target reached
Internal Process Perspective 1. Average number of new dishes innovated per month Target reached 2. “Mystery diner” audit rating Target not reached 3. Time to process orders Target reached
Learning and Growth Perspective 1. Hours of employee training in a year per employee Target not reached 2. Streamlining food preparation process Target reached
In addition, the financial statements also show the following: 1. Store profit before tax: Target not reached 2. Sales per $ of assets: Target reached 3. Operating expenses per $ of sales: Target not reached 4. Average guest check: Target not reached This store manager will get an annual bonus of HK$ _______________.

191
Resource Allocation Decision Resource Allocation Decision Imagine that from the headquarters, you received some discretionary funds for store development. As a store manager, you can select one or multiple projects that in your mind are the most important to launch. Assume that you have the following four projects in mind. Please rank the four projects based on their priorities for funding. Please keep in mind that the projects that receive the highest ranking are most likely to be funded. Rank Project No._____ Project 1. To stimulate the creativity for inventing new dishes,
periodically send the chefs to culinary workshops. No._____ Project 2. To lower the cost of sales, conduct an analysis on raw
ingredients prices and select those reliable suppliers who charge less. No._____ Project 3. To increase the average dollar amount consumed by customers,
promote beverage and desserts to the diners. No._____ Project 4. To speed up the food preparation process, standardize the
recipes and minimize unnecessary preparation steps.

192
Propensity to Engage in Issue Selling Behaviors Specific Issues A. Recently you noticed that employee training does not effectively improve customers’ dining experiences. Specifically, the customer satisfaction rating has not improved since the intense employee training program was launched three months ago. But you do not know why the training is not working as expected and what can be done to better improve customers’ dining experiences. How likely will you report to the executives your concern about the strategy?
Not at all likely 1-----2-----3-----4-----5-----6-----7-----8-----9 Extremely likely Later on, you realize that most of Shorthorn’s servers have been working for this company for years and they are in general very skillful and devoted. Therefore, the effect of employee training on customers’ dining experiences is very limited. But you still do not know what can be done to better improve customers’ dining experiences. Given this piece of information, how likely will you report to the executives your concern about the strategy?
Not at all likely 1-----2-----3-----4-----5-----6-----7-----8-----9 Extremely likely A couple of weeks later, you noticed that in general, servers are overworked and many of them are often exhausted and consequently less productive. Now you are thinking that in order to better serve customers, maybe Shorthorn should hire more servers so that servers’ shifts can be shortened. Given this piece of information, how likely will you report to the executives your concern about the strategy? Not at all likely 1-----2-----3-----4-----5-----6-----7-----8-----9 Extremely likely B. The following factual event happened during the past couple of months. Please indicate the likelihood that you would take any action in response to it.
Many customers mentioned to you that they would like to dine outside when the weather allows. How likely will you suggest that Shorthorn’s top management revise its strategy in response to this information?
Not at all 1-----2-----3-----4-----5-----6-----7-----8-----9 Very likely
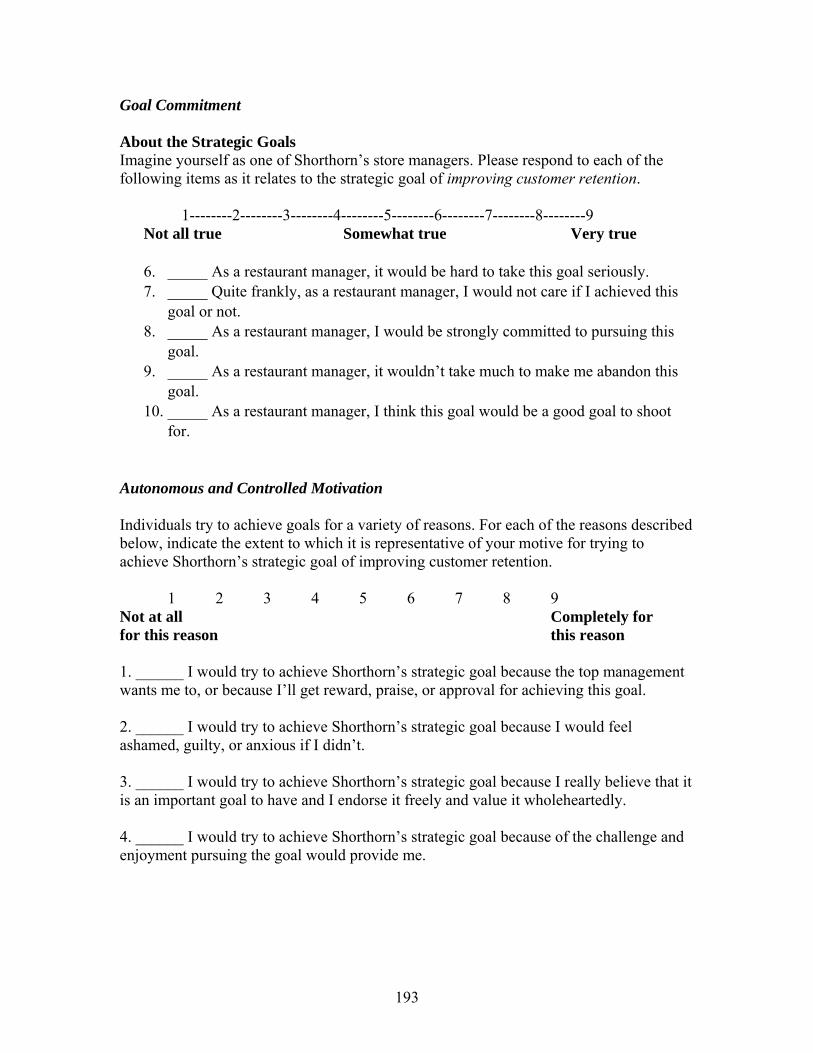
193
Goal Commitment About the Strategic Goals Imagine yourself as one of Shorthorn’s store managers. Please respond to each of the following items as it relates to the strategic goal of improving customer retention. 1--------2--------3--------4--------5--------6--------7--------8--------9 Not all true Somewhat true Very true
6. _____ As a restaurant manager, it would be hard to take this goal seriously. 7. _____ Quite frankly, as a restaurant manager, I would not care if I achieved this
goal or not. 8. _____ As a restaurant manager, I would be strongly committed to pursuing this
goal. 9. _____ As a restaurant manager, it wouldn’t take much to make me abandon this
goal. 10. _____ As a restaurant manager, I think this goal would be a good goal to shoot
for.
Autonomous and Controlled Motivation Individuals try to achieve goals for a variety of reasons. For each of the reasons described below, indicate the extent to which it is representative of your motive for trying to achieve Shorthorn’s strategic goal of improving customer retention.
1 2 3 4 5 6 7 8 9 Not at all Completely for for this reason this reason 1. ______ I would try to achieve Shorthorn’s strategic goal because the top management wants me to, or because I’ll get reward, praise, or approval for achieving this goal. 2. ______ I would try to achieve Shorthorn’s strategic goal because I would feel ashamed, guilty, or anxious if I didn’t. 3. ______ I would try to achieve Shorthorn’s strategic goal because I really believe that it is an important goal to have and I endorse it freely and value it wholeheartedly. 4. ______ I would try to achieve Shorthorn’s strategic goal because of the challenge and enjoyment pursuing the goal would provide me.
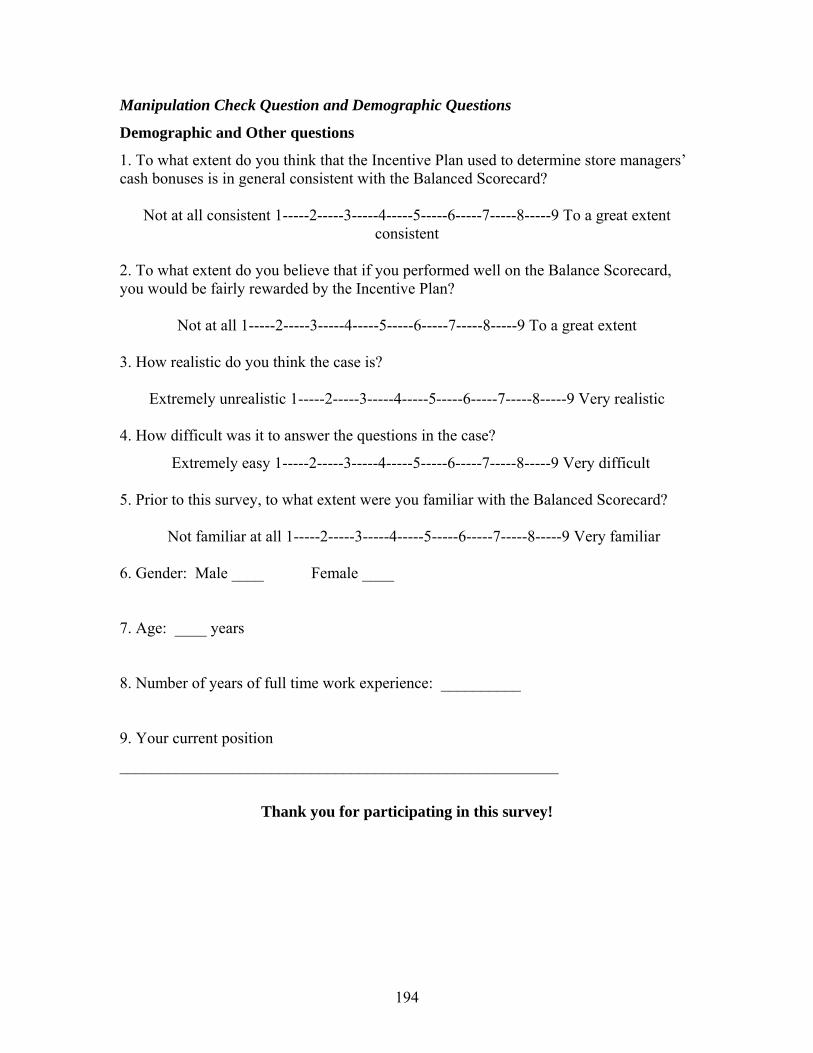
194
Manipulation Check Question and Demographic Questions
Demographic and Other questions
1. To what extent do you think that the Incentive Plan used to determine store managers’ cash bonuses is in general consistent with the Balanced Scorecard?
Not at all consistent 1-----2-----3-----4-----5-----6-----7-----8-----9 To a great extent consistent
2. To what extent do you believe that if you performed well on the Balance Scorecard, you would be fairly rewarded by the Incentive Plan?
Not at all 1-----2-----3-----4-----5-----6-----7-----8-----9 To a great extent 3. How realistic do you think the case is?
Extremely unrealistic 1-----2-----3-----4-----5-----6-----7-----8-----9 Very realistic
4. How difficult was it to answer the questions in the case?
Extremely easy 1-----2-----3-----4-----5-----6-----7-----8-----9 Very difficult 5. Prior to this survey, to what extent were you familiar with the Balanced Scorecard? Not familiar at all 1-----2-----3-----4-----5-----6-----7-----8-----9 Very familiar 6. Gender: Male ____ Female ____
7. Age: ____ years
8. Number of years of full time work experience: __________
9. Your current position
_______________________________________________________
Thank you for participating in this survey!
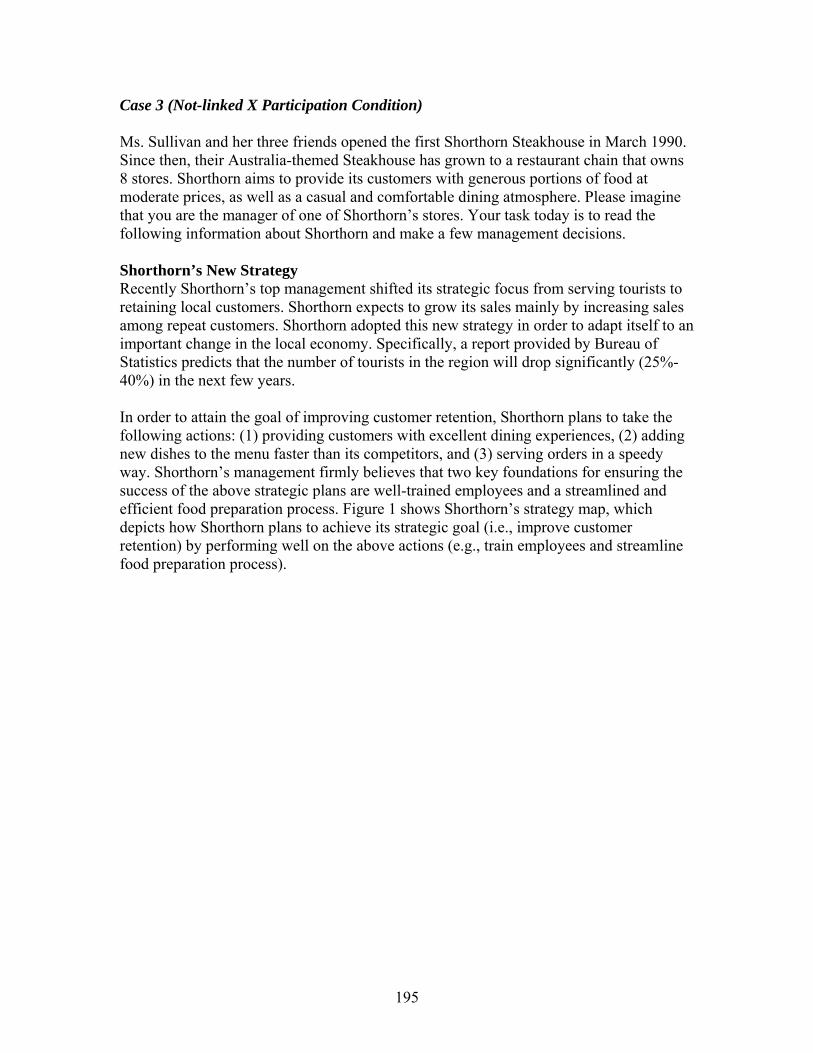
195
Case 3 (Not-linked X Participation Condition) Ms. Sullivan and her three friends opened the first Shorthorn Steakhouse in March 1990. Since then, their Australia-themed Steakhouse has grown to a restaurant chain that owns 8 stores. Shorthorn aims to provide its customers with generous portions of food at moderate prices, as well as a casual and comfortable dining atmosphere. Please imagine that you are the manager of one of Shorthorn’s stores. Your task today is to read the following information about Shorthorn and make a few management decisions. Shorthorn’s New Strategy Recently Shorthorn’s top management shifted its strategic focus from serving tourists to retaining local customers. Shorthorn expects to grow its sales mainly by increasing sales among repeat customers. Shorthorn adopted this new strategy in order to adapt itself to an important change in the local economy. Specifically, a report provided by Bureau of Statistics predicts that the number of tourists in the region will drop significantly (25%-40%) in the next few years. In order to attain the goal of improving customer retention, Shorthorn plans to take the following actions: (1) providing customers with excellent dining experiences, (2) adding new dishes to the menu faster than its competitors, and (3) serving orders in a speedy way. Shorthorn’s management firmly believes that two key foundations for ensuring the success of the above strategic plans are well-trained employees and a streamlined and efficient food preparation process. Figure 1 shows Shorthorn’s strategy map, which depicts how Shorthorn plans to achieve its strategic goal (i.e., improve customer retention) by performing well on the above actions (e.g., train employees and streamline food preparation process).
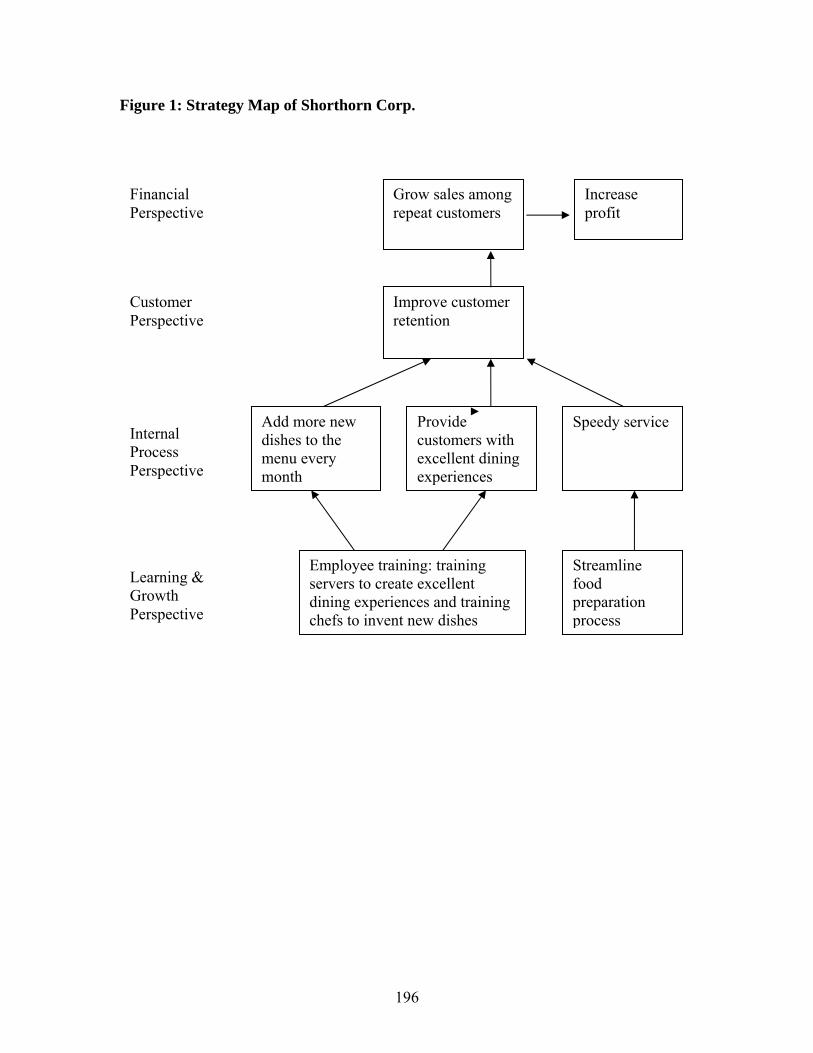
196
Figure 1: Strategy Map of Shorthorn Corp.
Employee training: training servers to create excellent dining experiences and training chefs to invent new dishes
Streamline food preparation process
Add more new dishes to the menu every month
Provide customers with excellent dining experiences
Improve customer retention
Grow sales among repeat customers
Financial Perspective
Customer Perspective
Internal Process Perspective
Learning & Growth Perspective
Speedy service
Increase profit

197
Balanced Scorecard (BSC) To monitor its strategy implementation, Shorthorn uses a management tool called the Balanced Scorecard (BSC) to measure the performance of each of its eight stores. Consistent with the strategy map (Figure 1), the Balanced Scorecard (Table 1) contains a set of performance measures carefully chosen to represent important aspects in four areas. The four areas are financial performance, customer relations, internal business processes, and learning and growth. These measures together reflect both the drivers and the outcomes of the strategy implementation. Your store’s performance on the eight BSC measures is used to evaluate how successfully the strategy has been implemented in your store. The BSC measures are described below in Table 1.
Table 1: Shorthorn's Balanced Scorecard Measures
Financial Perspective 1. Store profit before tax 2. Increase in repeat customer sales (Increase in repeat customer sales as a % of
last year’s repeat customer sales) Customer Perspective
1. Customer retention rate (repeat customer sales / total sales) Internal Process Perspective
1. Average number of new dishes innovated per month 2. “Mystery diner” audit rating (see note 1 below) 3. Time to process orders (number of minutes from customer ordering the main
dish to the server handing the order to the customer) Learning and Growth Perspective
1. Hours of employee training in a year per employee 2. Streamlining food preparation process (rating, out of 100%, from quarterly
logistics report that is compiled by an independent Logistics consultant.) Note 1: In the “Mystery diner” audit, a Shorthorn employee, posing as a
customer, rates stores against an explicit ten-element vision of the “perfect dining experience”. Elements include: helpfulness, courteousness and friendliness of personnel, and frequency of server’s contact with the guest. Perfect scores along all dimensions lead to a score of 100%.
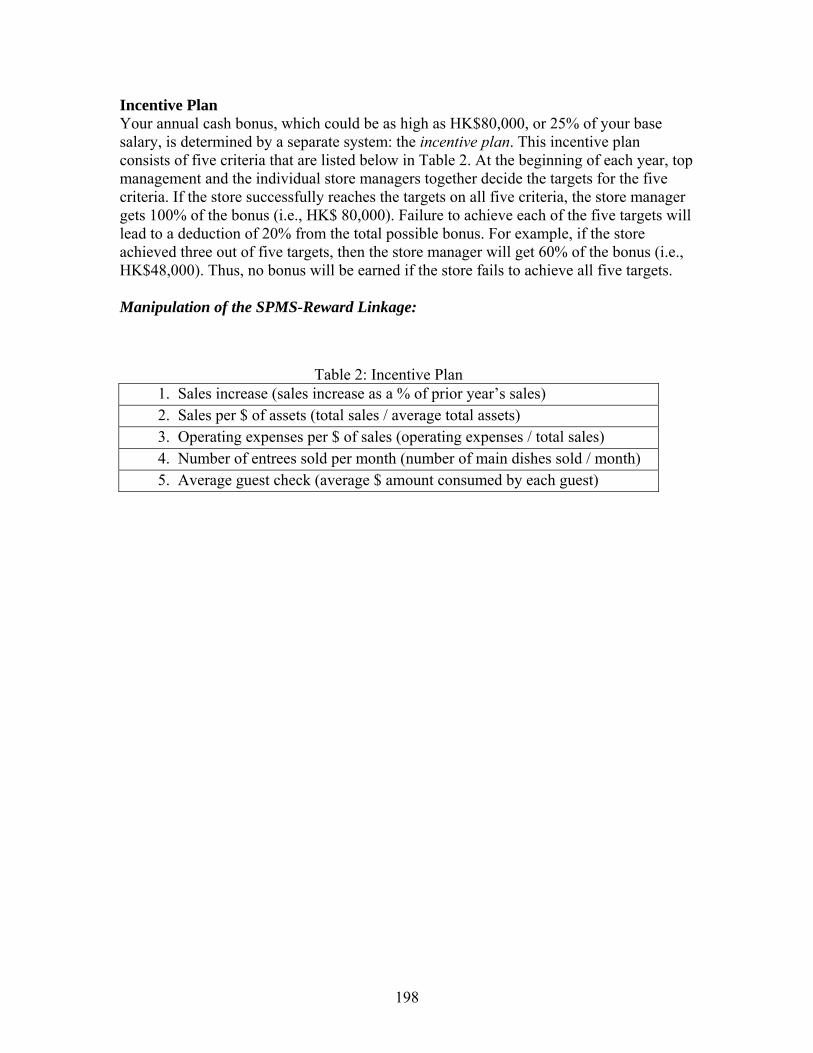
198
Incentive Plan Your annual cash bonus, which could be as high as HK$80,000, or 25% of your base salary, is determined by a separate system: the incentive plan. This incentive plan consists of five criteria that are listed below in Table 2. At the beginning of each year, top management and the individual store managers together decide the targets for the five criteria. If the store successfully reaches the targets on all five criteria, the store manager gets 100% of the bonus (i.e., HK$ 80,000). Failure to achieve each of the five targets will lead to a deduction of 20% from the total possible bonus. For example, if the store achieved three out of five targets, then the store manager will get 60% of the bonus (i.e., HK$48,000). Thus, no bonus will be earned if the store fails to achieve all five targets. Manipulation of the SPMS-Reward Linkage:
Table 2: Incentive Plan 1. Sales increase (sales increase as a % of prior year’s sales) 2. Sales per $ of assets (total sales / average total assets) 3. Operating expenses per $ of sales (operating expenses / total sales) 4. Number of entrees sold per month (number of main dishes sold / month) 5. Average guest check (average $ amount consumed by each guest)

199
Practice on Calculating Bonus for a Different Store Manager Bonus Computation To make sure that you fully understand this incentive plan, please calculate the bonus for a store manager assuming the following performance for his/her store.
Shorthorn's Balanced Scorecard Measures Performance Financial Perspective
1. Sales increase Target reached 2. Increase in repeat customer sales Target not reached
Customer Perspective 1. Customer retention rate Target reached
Internal Process Perspective 1. Average number of new dishes innovated per month Target reached 2. “Mystery diner” audit rating Target not reached 3. Time to process orders Target reached
Learning and Growth Perspective 1. Hours of employee training in a year per employee Target not reached 2. Streamlining food preparation process Target reached
In addition, the financial statements also show the following: 1. Store profit before tax: Target not reached 2. Sales per $ of assets: Target reached 3. Operating expenses per $ of sales: Target not reached 4. Average guest check: Target not reached This store manager will get an annual bonus of HK$ _______________.

200
Resource Allocation Decision Resource Allocation Decision Imagine that from the headquarters, you received some discretionary funds for store development. As a store manager, you can select one or multiple projects that in your mind are the most important to launch. Assume that you have the following four projects in mind. Please rank the four projects based on their priorities for funding. Please keep in mind that the projects that receive the highest ranking are most likely to be funded. Rank Project No._____ Project 1. To stimulate the creativity for inventing new dishes,
periodically send the chefs to culinary workshops. No._____ Project 2. To lower the cost of sales, conduct an analysis on raw
ingredients prices and select those reliable suppliers who charge less. No._____ Project 3. To increase the average dollar amount consumed by customers,
promote beverage and desserts to the diners. No._____ Project 4. To speed up the food preparation process, standardize the
recipes and minimize unnecessary preparation steps.

201
Manipulation of the Participative Decision Making Bi-Monthly Meeting Shorthorn’s top management meets with all the store managers at a bi-monthly meeting. The primary goal of this meeting is for store managers to evaluate the soundness of shorthorn’s current strategy. The executives recognize that the current strategy (as shown in Figure 1) may not be optimal, and at the same time, they believe that individual store managers know best about the current business conditions and how to get the job done. Consequently, at this meeting, store managers critically examine and even question the soundness of Shorthorn’s current strategy and foresee the need for revising it. Specifically, store managers share information that they believe is significant to Shorthorn’s strategy. They then decide whether any component of the strategy should be questioned for its soundness and whether the strategy should be revised accordingly. Imagine that you are at a bi-monthly meeting. One of the store managers makes the following comment: “two of my kitchen managers told me that streamlining the food preparation process makes some dishes less tasty.” How would you consider revising shorthorn’s strategy in response to this store manager’s concern?
________________________________________________________________________ ________________________________________________________________________ ________________________________________________________________________ ________________________________________________________________________

202
Propensity to Engage in Issue Selling Behaviors Specific Issues A. Recently you noticed that employee training does not effectively improve customers’ dining experiences. Specifically, the customer satisfaction rating has not improved since the intense employee training program was launched three months ago. But you do not know why the training is not working as expected and what can be done to better improve customers’ dining experiences. How likely will you report to the executives your concern about the strategy?
Not at all likely 1-----2-----3-----4-----5-----6-----7-----8-----9 Extremely likely Later on, you realize that most of Shorthorn’s servers have been working for this company for years and they are in general very skillful and devoted. Therefore, the effect of employee training on customers’ dining experiences is very limited. But you still do not know what can be done to better improve customers’ dining experiences. Given this piece of information, how likely will you report to the executives your concern about the strategy?
Not at all likely 1-----2-----3-----4-----5-----6-----7-----8-----9 Extremely likely A couple of weeks later, you noticed that in general, servers are overworked and many of them are often exhausted and consequently less productive. Now you are thinking that in order to better serve customers, maybe Shorthorn should hire more servers so that servers’ shifts can be shortened. Given this piece of information, how likely will you report to the executives your concern about the strategy? Not at all likely 1-----2-----3-----4-----5-----6-----7-----8-----9 Extremely likely B. The following factual event happened during the past couple of months. Please indicate the likelihood that you would take any action in response to it.
Many customers mentioned to you that they would like to dine outside when the weather allows. How likely will you suggest that Shorthorn’s top management revise its strategy in response to this information?
Not at all 1-----2-----3-----4-----5-----6-----7-----8-----9 Very likely

203
Goal Commitment About the Strategic Goals Imagine yourself as one of Shorthorn’s store managers. Please respond to each of the following items as it relates to the strategic goal of improving customer retention. 1--------2--------3--------4--------5--------6--------7--------8--------9 Not all true Somewhat true Very true
11. _____ As a restaurant manager, it would be hard to take this goal seriously. 12. _____ Quite frankly, as a restaurant manager, I would not care if I achieved this
goal or not. 13. _____ As a restaurant manager, I would be strongly committed to pursuing this
goal. 14. _____ As a restaurant manager, it wouldn’t take much to make me abandon this
goal. 15. _____ As a restaurant manager, I think this goal would be a good goal to shoot
for.
Autonomous and Controlled Motivation Individuals try to achieve goals for a variety of reasons. For each of the reasons described below, indicate the extent to which it is representative of your motive for trying to achieve Shorthorn’s strategic goal of improving customer retention.
1 2 3 4 5 6 7 8 9 Not at all Completely for for this reason this reason 1. ______ I would try to achieve Shorthorn’s strategic goal because the top management wants me to, or because I’ll get reward, praise, or approval for achieving this goal. 2. ______ I would try to achieve Shorthorn’s strategic goal because I would feel ashamed, guilty, or anxious if I didn’t. 3. ______ I would try to achieve Shorthorn’s strategic goal because I really believe that it is an important goal to have and I endorse it freely and value it wholeheartedly. 4. ______ I would try to achieve Shorthorn’s strategic goal because of the challenge and enjoyment pursuing the goal would provide me.

204
Manipulation Check Question and Demographic Questions
Demographic and Other questions
1. To what extent do you think that the Incentive Plan used to determine store managers’ cash bonuses is in general consistent with the Balanced Scorecard?
Not at all consistent 1-----2-----3-----4-----5-----6-----7-----8-----9 To a great extent consistent
2. To what extent do you believe that if you performed well on the Balance Scorecard, you would be fairly rewarded by the Incentive Plan?
Not at all 1-----2-----3-----4-----5-----6-----7-----8-----9 To a great extent 3. How realistic do you think the case is?
Extremely unrealistic 1-----2-----3-----4-----5-----6-----7-----8-----9 Very realistic
4. How difficult was it to answer the questions in the case?
Extremely easy 1-----2-----3-----4-----5-----6-----7-----8-----9 Very difficult 5. Prior to this survey, to what extent were you familiar with the Balanced Scorecard? Not familiar at all 1-----2-----3-----4-----5-----6-----7-----8-----9 Very familiar 6. Gender: Male ____ Female ____
7. Age: ____ years
8. Number of years of full time work experience: __________
9. Your current position
_______________________________________________________
Thank you for participating in this survey!
205
Case 4 (Linked X Participation Condition) Ms. Sullivan and her three friends opened the first Shorthorn Steakhouse in March 1990. Since then, their Australia-themed Steakhouse has grown to a restaurant chain that owns 8 stores. Shorthorn aims to provide its customers with generous portions of food at moderate prices, as well as a casual and comfortable dining atmosphere. Please imagine that you are the manager of one of Shorthorn’s stores. Your task today is to read the following information about Shorthorn and make a few management decisions. Shorthorn’s New Strategy Recently Shorthorn’s top management shifted its strategic focus from serving tourists to retaining local customers. Shorthorn expects to grow its sales mainly by increasing sales among repeat customers. Shorthorn adopted this new strategy in order to adapt itself to an important change in the local economy. Specifically, a report provided by Bureau of Statistics predicts that the number of tourists in the region will drop significantly (25%-40%) in the next few years. In order to attain the goal of improving customer retention, Shorthorn plans to take the following actions: (1) providing customers with excellent dining experiences, (2) adding new dishes to the menu faster than its competitors, and (3) serving orders in a speedy way. Shorthorn’s management firmly believes that two key foundations for ensuring the success of the above strategic plans are well-trained employees and a streamlined and efficient food preparation process. Figure 1 shows Shorthorn’s strategy map, which depicts how Shorthorn plans to achieve its strategic goal (i.e., improve customer retention) by performing well on the above actions (e.g., train employees and streamline food preparation process).

206
Figure 1: Strategy Map of Shorthorn Corp.
Employee training: training servers to create excellent dining experiences and training chefs to invent new dishes
Streamline food preparation process
Add more new dishes to the menu every month
Provide customers with excellent dining experiences
Improve customer retention
Grow sales among repeat customers
Financial Perspective
Customer Perspective
Internal Process Perspective
Learning & Growth Perspective
Speedy service
Increase profit

207
Balanced Scorecard (BSC) To monitor its strategy implementation, Shorthorn uses a management tool called the Balanced Scorecard (BSC) to measure the performance of each of its eight stores. Consistent with the strategy map (Figure 1), the Balanced Scorecard (Table 1) contains a set of performance measures carefully chosen to represent important aspects in four areas. The four areas are financial performance, customer relations, internal business processes, and learning and growth. These measures together reflect both the drivers and the outcomes of the strategy implementation. Your store’s performance on the eight BSC measures is used to evaluate how successfully the strategy has been implemented in your store. The BSC measures are described below in Table 1.
Table 1: Shorthorn's Balanced Scorecard Measures
Financial Perspective 1. Store profit before tax 2. Increase in repeat customer sales (Increase in repeat customer sales as a % of
last year’s repeat customer sales) Customer Perspective
1. Customer retention rate (repeat customer sales / total sales) Internal Process Perspective
1. Average number of new dishes innovated per month 2. “Mystery diner” audit rating (see note 1 below) 3. Time to process orders (number of minutes from customer ordering the main
dish to the server handing the order to the customer) Learning and Growth Perspective
1. Hours of employee training in a year per employee 2. Streamlining food preparation process (rating, out of 100%, from quarterly
logistics report that is compiled by an independent Logistics consultant.) Note 1: In the “Mystery diner” audit, a Shorthorn employee, posing as a
customer, rates stores against an explicit ten-element vision of the “perfect dining experience”. Elements include: helpfulness, courteousness and friendliness of personnel, and frequency of server’s contact with the guest. Perfect scores along all dimensions lead to a score of 100%.
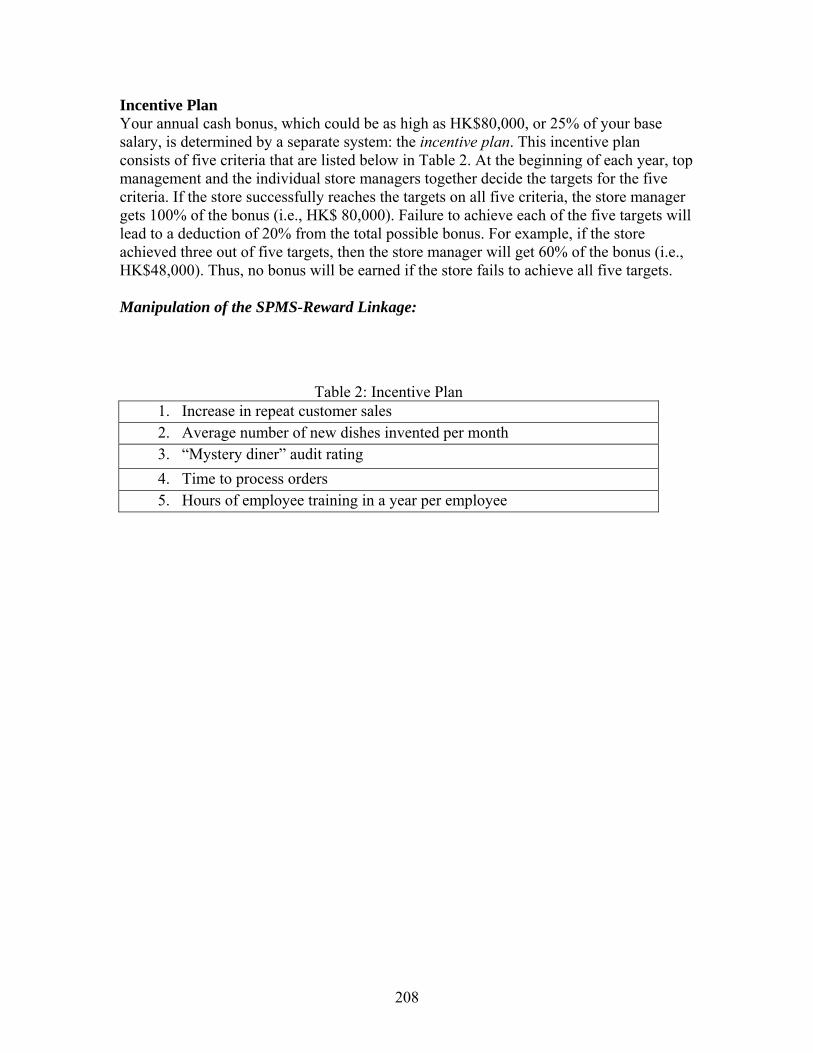
208
Incentive Plan Your annual cash bonus, which could be as high as HK$80,000, or 25% of your base salary, is determined by a separate system: the incentive plan. This incentive plan consists of five criteria that are listed below in Table 2. At the beginning of each year, top management and the individual store managers together decide the targets for the five criteria. If the store successfully reaches the targets on all five criteria, the store manager gets 100% of the bonus (i.e., HK$ 80,000). Failure to achieve each of the five targets will lead to a deduction of 20% from the total possible bonus. For example, if the store achieved three out of five targets, then the store manager will get 60% of the bonus (i.e., HK$48,000). Thus, no bonus will be earned if the store fails to achieve all five targets. Manipulation of the SPMS-Reward Linkage:
Table 2: Incentive Plan 1. Increase in repeat customer sales 2. Average number of new dishes invented per month 3. “Mystery diner” audit rating 4. Time to process orders 5. Hours of employee training in a year per employee
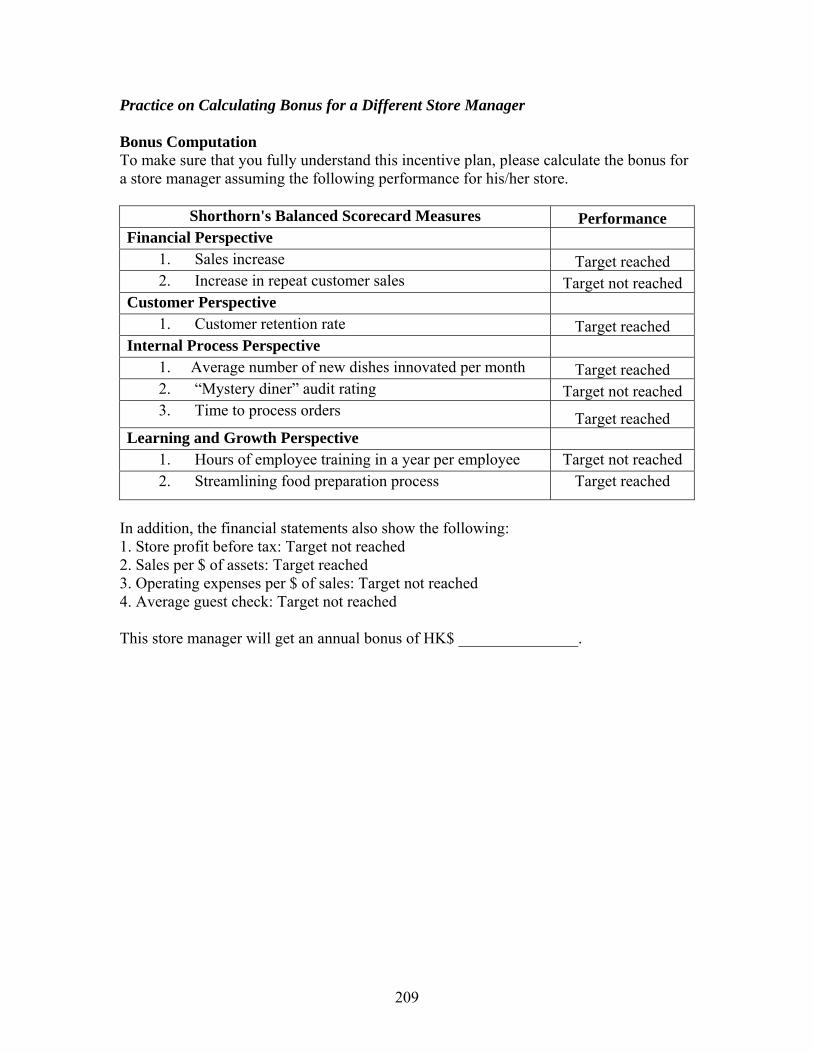
209
Practice on Calculating Bonus for a Different Store Manager Bonus Computation To make sure that you fully understand this incentive plan, please calculate the bonus for a store manager assuming the following performance for his/her store.
Shorthorn's Balanced Scorecard Measures Performance Financial Perspective
1. Sales increase Target reached 2. Increase in repeat customer sales Target not reached
Customer Perspective 1. Customer retention rate Target reached
Internal Process Perspective 1. Average number of new dishes innovated per month Target reached 2. “Mystery diner” audit rating Target not reached 3. Time to process orders Target reached
Learning and Growth Perspective 1. Hours of employee training in a year per employee Target not reached 2. Streamlining food preparation process Target reached
In addition, the financial statements also show the following: 1. Store profit before tax: Target not reached 2. Sales per $ of assets: Target reached 3. Operating expenses per $ of sales: Target not reached 4. Average guest check: Target not reached This store manager will get an annual bonus of HK$ _______________.

210
Resource Allocation Decision Resource Allocation Decision Imagine that from the headquarters, you received some discretionary funds for store development. As a store manager, you can select one or multiple projects that in your mind are the most important to launch. Assume that you have the following four projects in mind. Please rank the four projects based on their priorities for funding. Please keep in mind that the projects that receive the highest ranking are most likely to be funded. Rank Project No._____ Project 1. To stimulate the creativity for inventing new dishes,
periodically send the chefs to culinary workshops. No._____ Project 2. To lower the cost of sales, conduct an analysis on raw
ingredients prices and select those reliable suppliers who charge less. No._____ Project 3. To increase the average dollar amount consumed by customers,
promote beverage and desserts to the diners. No._____ Project 4. To speed up the food preparation process, standardize the
recipes and minimize unnecessary preparation steps.
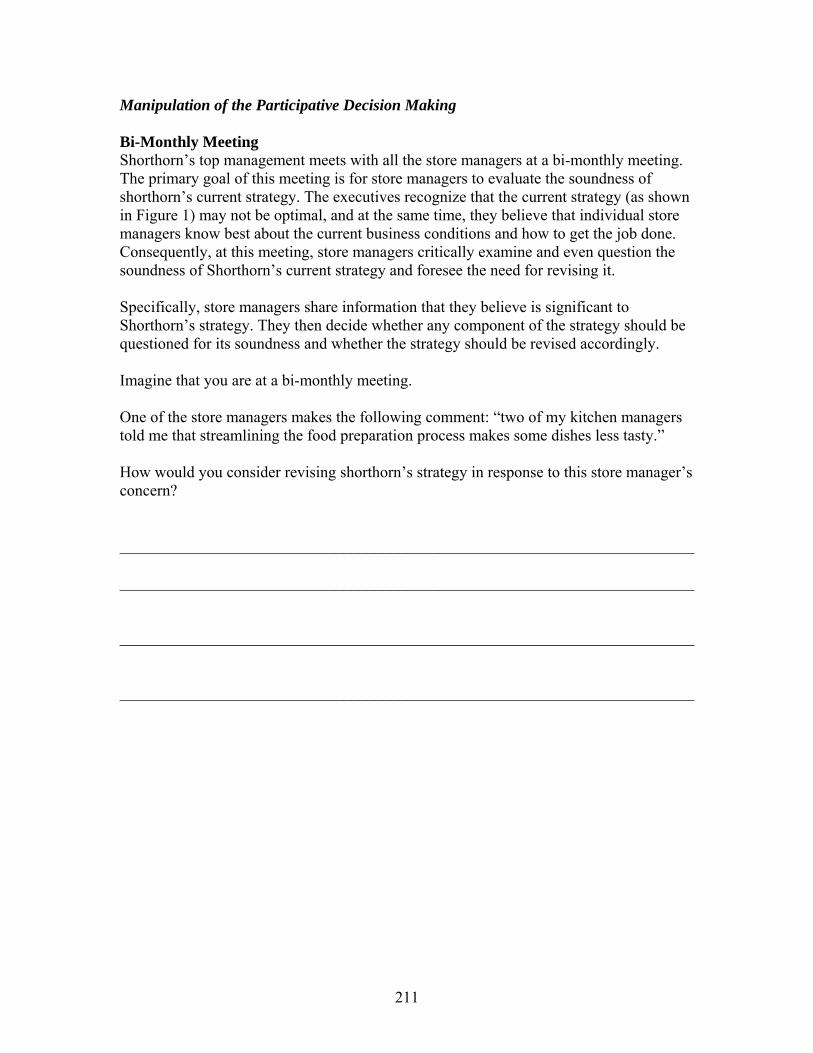
211
Manipulation of the Participative Decision Making Bi-Monthly Meeting Shorthorn’s top management meets with all the store managers at a bi-monthly meeting. The primary goal of this meeting is for store managers to evaluate the soundness of shorthorn’s current strategy. The executives recognize that the current strategy (as shown in Figure 1) may not be optimal, and at the same time, they believe that individual store managers know best about the current business conditions and how to get the job done. Consequently, at this meeting, store managers critically examine and even question the soundness of Shorthorn’s current strategy and foresee the need for revising it. Specifically, store managers share information that they believe is significant to Shorthorn’s strategy. They then decide whether any component of the strategy should be questioned for its soundness and whether the strategy should be revised accordingly. Imagine that you are at a bi-monthly meeting. One of the store managers makes the following comment: “two of my kitchen managers told me that streamlining the food preparation process makes some dishes less tasty.” How would you consider revising shorthorn’s strategy in response to this store manager’s concern?
________________________________________________________________________ ________________________________________________________________________ ________________________________________________________________________ ________________________________________________________________________

212
Propensity to Engage in Issue Selling Behaviors Specific Issues A. Recently you noticed that employee training does not effectively improve customers’ dining experiences. Specifically, the customer satisfaction rating has not improved since the intense employee training program was launched three months ago. But you do not know why the training is not working as expected and what can be done to better improve customers’ dining experiences. How likely will you report to the executives your concern about the strategy?
Not at all likely 1-----2-----3-----4-----5-----6-----7-----8-----9 Extremely likely Later on, you realize that most of Shorthorn’s servers have been working for this company for years and they are in general very skillful and devoted. Therefore, the effect of employee training on customers’ dining experiences is very limited. But you still do not know what can be done to better improve customers’ dining experiences. Given this piece of information, how likely will you report to the executives your concern about the strategy?
Not at all likely 1-----2-----3-----4-----5-----6-----7-----8-----9 Extremely likely A couple of weeks later, you noticed that in general, servers are overworked and many of them are often exhausted and consequently less productive. Now you are thinking that in order to better serve customers, maybe Shorthorn should hire more servers so that servers’ shifts can be shortened. Given this piece of information, how likely will you report to the executives your concern about the strategy? Not at all likely 1-----2-----3-----4-----5-----6-----7-----8-----9 Extremely likely B. The following factual event happened during the past couple of months. Please indicate the likelihood that you would take any action in response to it.
Many customers mentioned to you that they would like to dine outside when the weather allows. How likely will you suggest that Shorthorn’s top management revise its strategy in response to this information?
Not at all 1-----2-----3-----4-----5-----6-----7-----8-----9 Very likely
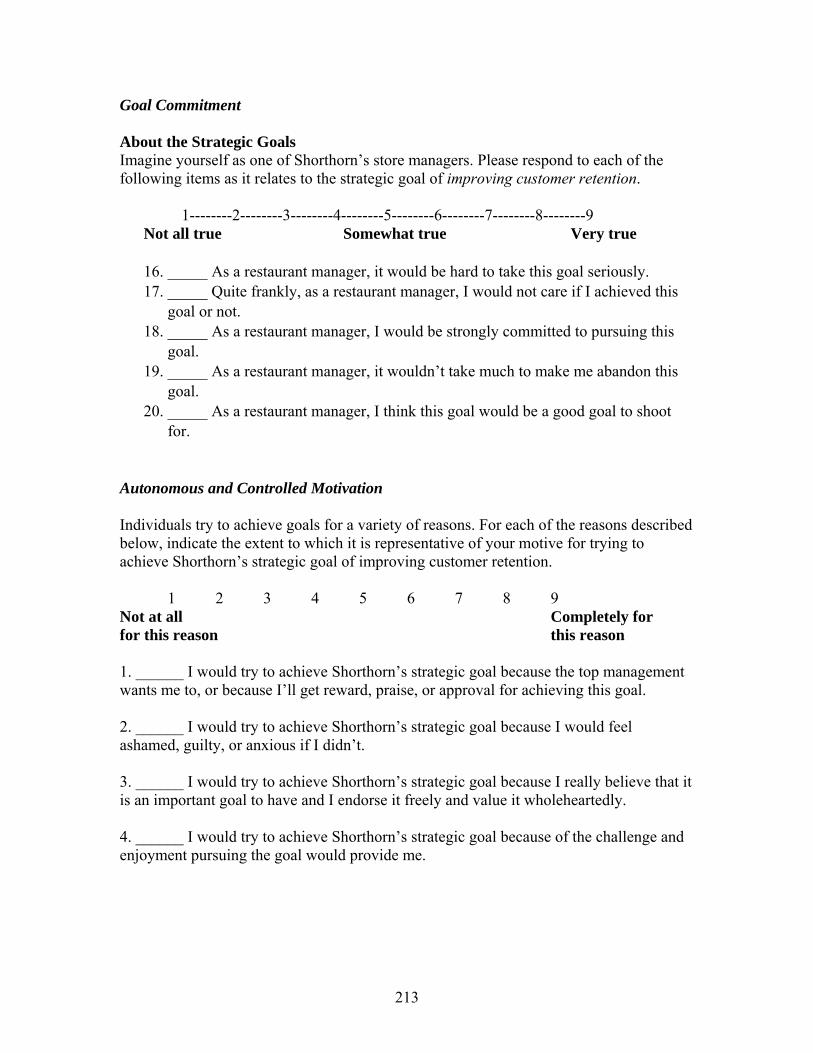
213
Goal Commitment About the Strategic Goals Imagine yourself as one of Shorthorn’s store managers. Please respond to each of the following items as it relates to the strategic goal of improving customer retention. 1--------2--------3--------4--------5--------6--------7--------8--------9 Not all true Somewhat true Very true
16. _____ As a restaurant manager, it would be hard to take this goal seriously. 17. _____ Quite frankly, as a restaurant manager, I would not care if I achieved this
goal or not. 18. _____ As a restaurant manager, I would be strongly committed to pursuing this
goal. 19. _____ As a restaurant manager, it wouldn’t take much to make me abandon this
goal. 20. _____ As a restaurant manager, I think this goal would be a good goal to shoot
for.
Autonomous and Controlled Motivation Individuals try to achieve goals for a variety of reasons. For each of the reasons described below, indicate the extent to which it is representative of your motive for trying to achieve Shorthorn’s strategic goal of improving customer retention.
1 2 3 4 5 6 7 8 9 Not at all Completely for for this reason this reason 1. ______ I would try to achieve Shorthorn’s strategic goal because the top management wants me to, or because I’ll get reward, praise, or approval for achieving this goal. 2. ______ I would try to achieve Shorthorn’s strategic goal because I would feel ashamed, guilty, or anxious if I didn’t. 3. ______ I would try to achieve Shorthorn’s strategic goal because I really believe that it is an important goal to have and I endorse it freely and value it wholeheartedly. 4. ______ I would try to achieve Shorthorn’s strategic goal because of the challenge and enjoyment pursuing the goal would provide me.

214
Manipulation Check Question and Demographic Questions
Demographic and Other questions
1. To what extent do you think that the Incentive Plan used to determine store managers’ cash bonuses is in general consistent with the Balanced Scorecard?
Not at all consistent 1-----2-----3-----4-----5-----6-----7-----8-----9 To a great extent consistent
2. To what extent do you believe that if you performed well on the Balance Scorecard, you would be fairly rewarded by the Incentive Plan?
Not at all 1-----2-----3-----4-----5-----6-----7-----8-----9 To a great extent 3. How realistic do you think the case is?
Extremely unrealistic 1-----2-----3-----4-----5-----6-----7-----8-----9 Very realistic
4. How difficult was it to answer the questions in the case?
Extremely easy 1-----2-----3-----4-----5-----6-----7-----8-----9 Very difficult 5. Prior to this survey, to what extent were you familiar with the Balanced Scorecard? Not familiar at all 1-----2-----3-----4-----5-----6-----7-----8-----9 Very familiar 6. Gender: Male ____ Female ____
7. Age: ____ years
8. Number of years of full time work experience: __________
9. Your current position
_______________________________________________________
Thank you for participating in this survey!