Embed Size (px)
Citation preview

DECEMBER
2011Self-Employment Assistance ProgramLegislative Report

Employment Security Department • 2011 Self-Employment Assistance Program Legislative Report2
2011 Self-Employment Assistance (SEAP) ReportPublished December 2011
Washington State Employment Security Department Paul Trause, commissioner
Greg Weeks, Ph.D., directorLabor Market and Economic Analysis
This program performance report was prepared in accordance with the Revised Code of Washington, section 50.20.250.
Report prepared by Graeme Friedrich, economic analyst, and Greg Morgan, economic analyst
Contributions made by Nathan Hathaway, Bruce Parrish, Charlie Saibel, Jeff Zahir and Ernst Stromsdorfer, Ph.D.
Survey and data collection supervised by Robert Haglund, research analyst
For more information or to get this report in an alternative format, call the Employment Security Department Labor Market Information Center at 800-215-1617.
The Employment Security Department is an equal-opportunity employer and provider of programs and services. Auxiliary aids and services are available upon request to people with
disabilities.

3Employment Security Department • 2011 Self-Employment Assistance Program Legislative Report
Contents
Executive summary 5
Background on the Self-Employment Assistance Program (SEAP) 7
Findings 9
Survey summary 9
Self-employment impacts 9
Wage and salary outcomes 10
Unemployment benefits payment outcomes 11
Program analysis 13
What SEAP participants say about the program 15
Appendix 1. Demographics of SEAP participants 17
Appendix 2. Methodology 27
Appendix 3. Survey questions 33

Employment Security Department • 2011 Self-Employment Assistance Program Legislative Report4
This word cloud was created using comments received in a survey of Self-Employment Assistance Program (SEAP) participants. Words that occurred more often in the comments are larger. Some of the most frequently used words in the survey comments were help, start, great and good.

5Employment Security Department • 2011 Self-Employment Assistance Program Legislative Report
Executive summaryThe Self-Employment Assistance Program (SEAP) allows unemployment recipients who are likely to exhaust their benefits to create new businesses and job opportunities in Washington state. Program participants are waived from work-search requirements and are allowed to enroll in approved entrepreneurial/business training programs while collecting unemployment benefits. The legislature created the program in 2007 and the first participants enrolled in 2008. The program is scheduled to expire July 1, 2012.
In accordance with RCW 50.20.250, this report provides an analysis of program impacts, wage and salary outcomes, unemployment benefits payment outcomes, and analyzes costs and benefits for all SEAP participants since the start of the program. With only two years of program data, performance and follow-up measures for SEAP are limited.
Information sources for this report Data in this report are primarily from two sources. The first is unemployment insurance program administrative data. These data provide demographic information and tell us the occupations and wages of program participants prior to becoming unemployed and the amount of unemployment benefits collected during and after participation in SEAP. This database was also used to build a matched comparison group of unemployment claimants who were eligible for SEAP but who did not enroll in the program.
The second data source is a survey of program participants conducted by Employment Security. This self-reported dataset provides information about the number of businesses started and business characteristics, as well as feedback on the administration and function of the program. The survey was sent to all 1,141 program participants at the time the survey was issued; 582 respondents returned the survey. The survey questions are in Appendix 3.
Survey data was also used to create estimates. These estimates were derived from survey responses and were weighted to reflect program outcomes for all program participants, not just those who responded to the survey. More information on the method used to develop the estimates can be found in Appendix 2.
Key findings
Program participation and businesses startedLess than 1 percent of unemployment claimants eligible for SEAP chose to enroll. As of the second quarter of 2011, there were 1,141 SEAP participants. As noted below, SEAP participants were different from SEAP-eligible claimants in that they were older, more educated and earned more money prior to becoming unemployed.
Survey respondents reported starting 244 businesses. When weighted to represent the entire group of SEAP participants, an estimated 370 businesses were created. An estimated 184 full- and part-time employees were employed by SEAP business owners.
Earnings for business owners Approximately 68 percent of SEAP participants who reported starting a business said they did not pay themselves a wage. Notably, some of the zero wage values were from participants who reported starting a business that did not become viable. Of survey respondents who did report paying themselves a wage, the median was $1,950 per month.

Employment Security Department • 2011 Self-Employment Assistance Program Legislative Report6
Increased unemployment benefits paid to SEAP participants Examining total unemployment benefits paid, SEAP participants collected more unemployment benefits than the matched comparison group. The additional payments to SEAP participants decreased between the first year and second year after the effective date of claim.1 To date, SEAP has operated during a time when unemployment claimants had access to up to 99 weeks of benefits. Under normal circumstances, unemployment claimants can receive up to 26 weeks of benefits. The additional weeks of benefits may affect the program outcomes.
In the first year after filing for unemployment, on average, SEAP participants with an EDC in 2008 drew an additional 10.7 weeks of unemployment benefits and $6,652 more in benefits.2
In the second year after effective date of claim the same group, on average, drew an additional 8.5 weeks of unemployment benefits and received $5,276 more in benefits.
It should be noted that SEAP participants earned more money than the matched comparison group prior to becoming unemployed. These higher wages while working translate to higher unemployment benefit payments after becoming unemployed. An unknown portion of the increased unemployment benefits received by SEAP participants could be attributed to this wage difference.
Early analysis shows large profits for a small number of business owners Survey data show the majority of SEAP participants did not start a business. There were 1,141 program participants and an estimated 370 businesses created. This is only an estimate of businesses started. Some of these businesses may be closed, and it is unknown how long those that are open will remain open. Also, it is not known if some SEAP participants may have started a business regardless of participation in SEAP, or if profits may have been different if the owners were not SEAP participants.
Of the total survey responses, 10 percent reported a positive quarterly profit and 1 percent reported a negative quarterly profit. For the 10 percent of businesses that showed a positive profit, the cumulative profits were relatively large. Based on survey responses, businesses started by SEAP participants generated estimated gross profits of nearly $972,000 in the first quarter of 2011.
SEAP participants were different from SEAP-eligible claimants who chose not to enter the program Breaking down SEAP participants by age, education and income prior to becoming unemployed reveals SEAP participants were different from other unemployment claimants who were eligible for the program, but did not participate.
»» Age: About 43 percent of SEAP participants were in the 46 to 64 age group while only 32 percent of SEAP-eligible claimants were in this age group.
»» Education: Almost 50 percent of SEAP participants had at least a bachelor’s degree, whereas only 25 percent of SEAP-eligible claimants had a bachelor’s degree.
»» Income: SEAP participants had significantly higher yearly pre-tax earnings than SEAP-eligible claimants before filing for unemployment. More than 26 percent of SEAP participants had yearly earnings of more than $86,748, compared to 12 percent of SEAP-eligible claimants who earned more than $86,748.
Most SEAP participants came from professional fields such as computer and mathematical occupations, management occupations, engineering and architecture occupations. A complete analysis of SEAP-participant demographics is in Appendix 1.
1 The effective date of claim (EDC) is the Sunday of the week a claimant applied for unemployment benefits.
2 Throughout this report amounts are adjusted to 2011 dollars using the Consumer Price Index.

7Employment Security Department • 2011 Self-Employment Assistance Program Legislative Report
1 The effective date of claim (EDC) is the Sunday of the week a claimant applied for unemployment benefits.
2 Throughout this report amounts are adjusted to 2011 dollars using the Consumer Price Index.
Background on the Self-Employment Assistance Program (SEAP)In 2007, the state legislature passed and the Governor signed into law SSB 5653 (RCW 50.20.250), creating the Self-Employment Assistance Program (SEAP). The SEAP program was specifically created to help unemployed workers start a new business. The program is scheduled to expire July 1, 2012.
Under the program, unemployment claimants determined likely to run out of benefits are allowed to collect to benefits without having to look for work while participating in an approved entrepreneurial/business training program. The program does not provide funding for training, supplies or fees, nor does it provide financing to start a business. SEAP does not provide additional weeks of unemployment benefits, and the law states that participants may not set up their business in the same geographic location or directly compete with their last employer for one year.
To date, SEAP has operated during a time when unemployment claimants had access to up to 99 weeks of benefits. Under normal circumstances, unemployment claimants can receive up to 26 weeks of benefits. The additional weeks of benefits may affect the program outcomes.
SEAP Program requirements
Eligible participants must:
» Qualify for unemployment benefits.
» Be identified as “likely to exhaust” under Employment Security’s worker-profiling system.
» Enroll in a full time self-employment training program approved by Employment Security.
» Make satisfactory progress in the approved program.
» Agree to not compete with his/her last employer for one year after the program.
» Notify Employment Security if they discontinue training, suspend training or reduce training enrollment to less than full-time.
All approved self-employment training programs include:
» Entrepreneurial training.
» Business counseling.
» Technical assistance.
» Requirements to engage in activities relating to setting up a business and becoming self-employed.

Employment Security Department • 2011 Self-Employment Assistance Program Legislative Report8

9Employment Security Department • 2011 Self-Employment Assistance Program Legislative Report
FindingsSurvey summary
Of the 1,141 SEAP participants surveyed to gain data for this report, 582 returned the survey, a response rate of about 53 percent. Figure 1 provides a summary of survey responses.
Figure 1 - SEAP survey resultsSource: Employment Security Department, Spring 2011 Survey of SEAP Participants
Self-employment impacts
The majority of SEAP participants did not start a business. Survey respondents reported starting 244 businesses. To generate estimates accounting for SEAP participants who did not respond to the survey and develop an estimate of the total number businesses started, survey responses were weighted. The weighted number of SEAP participants who started a business is estimated at 370.
Using the same method of weighting survey responses, an estimated 91 SEAP participants worked another job (Figure 2). A more detailed explanation of the estimation process is in Appendix 2.
This is only an estimate of businesses started. Some of these businesses may be closed, and it is unknown how long those that are open will remain open. Additionally, the number of total businesses started was not only a count of those who claimed to start a business; it was a count of survey respondents who claimed to start a business and provided information for all necessary fields used in the analysis and estimating process.
Estimated count Estimated percent of total
Did not work another job 279 75.4%
Worked another job 91 24.6%
Estimated total businesses started 370 100.0%
Figure 2 - Estimated self-employment of SEAP participants who started a businessSource: Employment Security Department, Spring 2011 Survey of SEAP Participants
Count Percent of total
Sample (minus 46 no contacts) 1,095 -
Responses – complete survey 565 51.6%
Responses – incomplete survey 17 1.6%
Total responses 582 53.2%
Refusals 3 0.3%

Employment Security Department • 2011 Self-Employment Assistance Program Legislative Report10
Wage and salary outcomes
Based on survey responses, Figure 3 shows average and median wages for SEAP business owners and the employees of those businesses.
SEAP business owners’ wages are small because of the large amount of owners who paid themselves no wages, a common practice in the start-up years of a new business. However, some of the zero wage values were SEAP participants who reported starting a business but the business did not become viable. The median monthly wage was $0 because so many SEAP business owners reported paying themselves no wages.
Of SEAP business owners who did pay themselves, the average monthly wage was $2,553 and the median monthly wages was $1,950 per month.
Figure 3 - Average and median wages of SEAP business owners and employees Source: Employment Security Department, Spring 2011 Survey of SEAP Participants
Figure 4 shows the estimated number of full- and part-time employees employed by SEAP business owners. Based on the relatively low monthly wage shown in Figure 3, it can be assumed that many employees were working only a few hours monthly, not full-time.
Wages Employees
Wages of all SEAP
business owners
Wages of SEAP
business owners
who reported
drawing a wage
Average monthly wage $1,025 $804 $2,553
Median monthly wage $1,761 $0 $1,950
Figure 4 - Estimated number of employees at SEAP-participant businesses Source: Employment Security Department, Spring 2011 Survey of SEAP Participants
Estimated number of
employees Estimated employees Percent of total
Part-time employees 87 47.3%
Full-time employees 97 52.7%
Total employees 184 100.0%

11Employment Security Department • 2011 Self-Employment Assistance Program Legislative Report
Unemployment benefits payment outcomes
To determine the effect of SEAP on unemployment benefits payments, SEAP participants were matched to a comparison group of SEAP-eligible unemployment claimants with similar characteristics who did not enroll in the program.3
It is expected that a training program will not yield positive results in the early years because of the initial costs of training. As more time elapses between the training period and evaluation, more can be learned about the performance of SEAP. At this time, there are only two years of data available to evaluate. As shown below, though the amount of unemployment benefits paid and the number of weeks of benefits due seem to be decreasing, it is not possible to predict if SEAP will ultimately cause a decrease in the total amount of unemployment paid to individuals.
To date, SEAP has operated during a time when unemployment claimants had access to up to 99 weeks of benefits. As previously mentioned, it is important to note that under normal circumstances, unemployment claimants can receive up to 26 weeks of benefits. The additional weeks of benefits may affect the program outcomes.
Total unemployment benefits As shown in Figure 5, on average, in the first year after the effective date of claim (EDC)4 for those who started the program in 2008, male SEAP participants collected $8,580 more in unemployment benefits5 than males in the comparison group. Female SEAP participants on average collected $5,276 more in unemployment benefits than females in the comparison group.
For the same group between one and two years after the effective date of claim, there was a significant decrease in unemployment benefits paid. In the second year after the effective date of claim, male SEAP participants collected $7,352 more unemployment benefits than the matched comparison group and females collected $3,759 more unemployment benefits.
For those who had an effective date of claim in 2009, males received $5,260 more unemployment benefits and females received $5,036 more unemployment benefits. There were substantially more SEAP participants with an effective date of claim in 2009 than in 2008, males having 154 individuals in 2008 and 560 in 2009, and females having 156 in 2008 and 396 in 2009.
It’s important to note in this comparison that even though base-period wages were used to match SEAP participants to the comparison group, the SEAP participants on average earned a higher amount in the base year than did the matched comparison group. These higher wages while working translate to higher unemployment benefit payments after becoming unemployed. An unknown portion of the increased unemployment benefits received by SEAP participants could be attributed to this wage difference.
3 The comparison group was constructed using propensity score matching. For more information on our methodology, see Appendix 2. 4 The effective date of claim (EDC) is the Sunday of the week a claimant applied for unemployment benefits. 5 Throughout this report amounts are adjusted to 2011 dollars using the Consumer Price Index.

Employment Security Department • 2011 Self-Employment Assistance Program Legislative Report12
Weeks of benefits To further investigate the higher benefit amounts paid to SEAP participants, the number of weeks of unemployment benefits paid to SEAP participants and the matched comparison group were analyzed. The evaluation of additional weeks on the program shows the effects of SEAP on total unemployment collected without the issue of pre-layoff wage differences (Figure 5).
In the first year after the effective date of claim (EDC), male SEAP participants received benefits for an additional 11.9 weeks for the group starting in 2008 and an additional 7.4 weeks for the group starting in 2009. Females collected an additional 9.7 weeks of benefits for the group starting in 2008 and 8 weeks for the group starting in 2009.
There was a decrease in the additional weeks of benefits between years one and two after the effective date of claim (Figure 5). For males in the 2008 group, weeks on unemployment decreased to 10.5 additional weeks. For females in the 2008 group, weeks on unemployment decreased to 6.9 additional weeks. The difference for males and females in weeks of benefits was significantly different for the 2008 group between one and two years after the effective date of claim.
Data are not yet available for the 2009 cohort in the second year after the effective date of claim. However, no significant differences were detected between the 2008 cohort in the first year after the effective date of claim and the 2009 cohort in the first year after the effective date of claim. For more information on significance tests, see Appendix 2.
To date, SEAP has operated during a time when unemployment claimants had access to up to 99 weeks of benefits. As previously noted, under normal circumstances, unemployment claimants can receive up to 26 weeks of benefits. The additional weeks of benefits may affect the program outcomes.
Increase due to participation in SEAP
Average additional
unemployment collected in Year
1 after EDC
Average additional
unemployment collected in Year
2 after EDC*
Average additional weeks of unemployment
in Year 1 after EDC
Average additional weeks of unemployment
in Year 2 after EDC*
2008 All Participants $6,652 $5,276 10.7 8.5
2008 Males $8,580 $7,352 11.9 10.5
2008 Females $5,276 $3,759 9.7 6.9
2009 All Participants
$5,183 - 7.6 -
2009 Males $5,260 - 7.4 -
2009 Females $5,036 - 8.0 -
*Data are not yet available for the second year after effective date of claim (EDC) for the 2009 group.
Figure 5 - Additional unemployment and weeks of benefits collected by SEAP participantsSource: Employment Security Department, Unemployment Insurance Data Warehouse

13Employment Security Department • 2011 Self-Employment Assistance Program Legislative Report
Program analysis
Program benefits Self-reported profits were not evenly distributed, and not all respondents who said they started a business reported data on gross profits. After removing data outliers, 11 firms reported profits greater than $20,000 in the first quarter of 2011. The largest reported quarterly profit was $40,942. The largest quarterly loss reported was $21,000. There were three reports of negative profits, 58 reports of positive quarterly profits, and the remaining survey respondents reported zero profits.6 Figure 6 shows the responses to the survey question on gross profits earned in the first quarter of 2011.
Figure 7 shows the estimated quarterly profits of businesses started by SEAP participants. These estimates were created using data from survey responses, weighted for nonresponders and excluding outliers. These data are self-reported, and for only one quarter, so the results should be taken in context to the source.
Quarterly profits of firms represent a social benefit. Benefits to the government may include taxes collected from businesses created by SEAP participants and eventual savings on unemployment benefits, if they occur.
Survey response Count of responses Percent of responses
No business or no profit data 398 72%
Zero profit reported 95 17%
Profit reported 58 10%
Loss reported 3 1%
Figure 6 - Survey responses on gross profits earned in first quarter of 2011Source: Employment Security Department, Spring 2011 Survey of SEAP Participants
Figure 7 - Gross profits of businesses started by SEAP participants in first quarter2011Source: Employment Security Department, Spring 2011 Survey of SEAP Participants
Average (of firms reporting) $3,020
Median (of firms reporting)* $0
Standard deviation (of firms reporting) $8,159
Estimated quarterly profits of firms (cumulative) $971,763 *The median is the 50th percentile, or middle value, of all reported values. Because so many SEAP business owners reported $0 profits, the median profit was $0.
6 Since data are not available for total revenues of firms, no calculation can be made of taxes collected. If such data were available then the calculation would consist of revenues multiplied by a weighted average of the business and occupation tax rate.

Employment Security Department • 2011 Self-Employment Assistance Program Legislative Report14
Program costs Figure 8 shows the average government and tax-payer cost of the program, which is comprised of the quarterly administrative costs (staff and mailings).
Unemployment benefits are not included in costs because the data on unemployment benefits and profits cannot be appropriately compared. Unemployment benefits paid are a regression from a data time series (one type of data collected over a recurring time period, in this case years). Information from the survey is cross-sectional data (data collected from many people for one time period, in this case all survey respondents for the first quarter of 2011).
Figure 8 - Average quarterly costs of administration to the stateSource: Employment Security Department
Staff $12,805
Mailings $3,314
Total average quarterly costs of SEAP administration $16,119

15Employment Security Department • 2011 Self-Employment Assistance Program Legislative Report
What SEAP participants say about the programSEAP survey respondents had a lot to say about the program, good and bad. However, most respondents said they found the program to be very “helpful” in starting their business.
The word cloud below was created using the comments received in the SEAP survey.7 Words that occurred more often in the comments appear larger in the word cloud. Some of the most frequently used words in the survey comments were help, start, great and good.
7 This word cloud was created using www.wordle.net.
More than 70 percent of survey respondents indicated they thought SEAP was helpful (a rating of 4 or greater). Comments of satisfied participants included:
» “Good advice, good financial support, got me working again on my own business.”
» “I think the SEAP program is wonderful and I can’t think of anything at the moment to improve it. I really appreciate the opportunity it offers.”
» “Program was amazing! Really walking me through all aspect in setting up business plan.”
Comments of less satisfied participants and suggestions from all participants for improvements frequently mentioned the need for better coordination among agencies involved in providing services, and the need to improve awareness and training of program staff. Comments from dissatisfied participants included:
» “It would be a lot more helpful if more staff knew what the program was and how to assist someone like myself in the application and approval process. This was quite a laborious process because there were so few people who actually knew how it operated.”
» “Have your staff keep in contact with us and lay out the program and requirements more clearly and in a reminder email.”
» “I would like to have had more one on one follow up. Have someone call once a month to see how things are going and what I needed additional help with. It would also have been nice to have the option of partnering with a mentor in the same type of business.”

Employment Security Department • 2011 Self-Employment Assistance Program Legislative Report16
» “Better communications with other parts of Employment Security. There was confusion in applying for UI benefits around being in SEAP.”
Figure 9 shows how participants felt about the helpfulness of the program. The table is based on a 1 to 5 rating scale, with a rating of 5 as “very helpful.” There were 366 survey respondents who added comments about the program. Of these, more than 70 percent said the program was helpful.
Figure 9 - Was SEAP helpful?Source: Employment Security Department, Spring 2011 Survey If SEAP Participants
17Employment Security Department • 2011 Self-Employment Assistance Program Legislative Report
Appendix 1. Demographics of SEAP participants
Gender
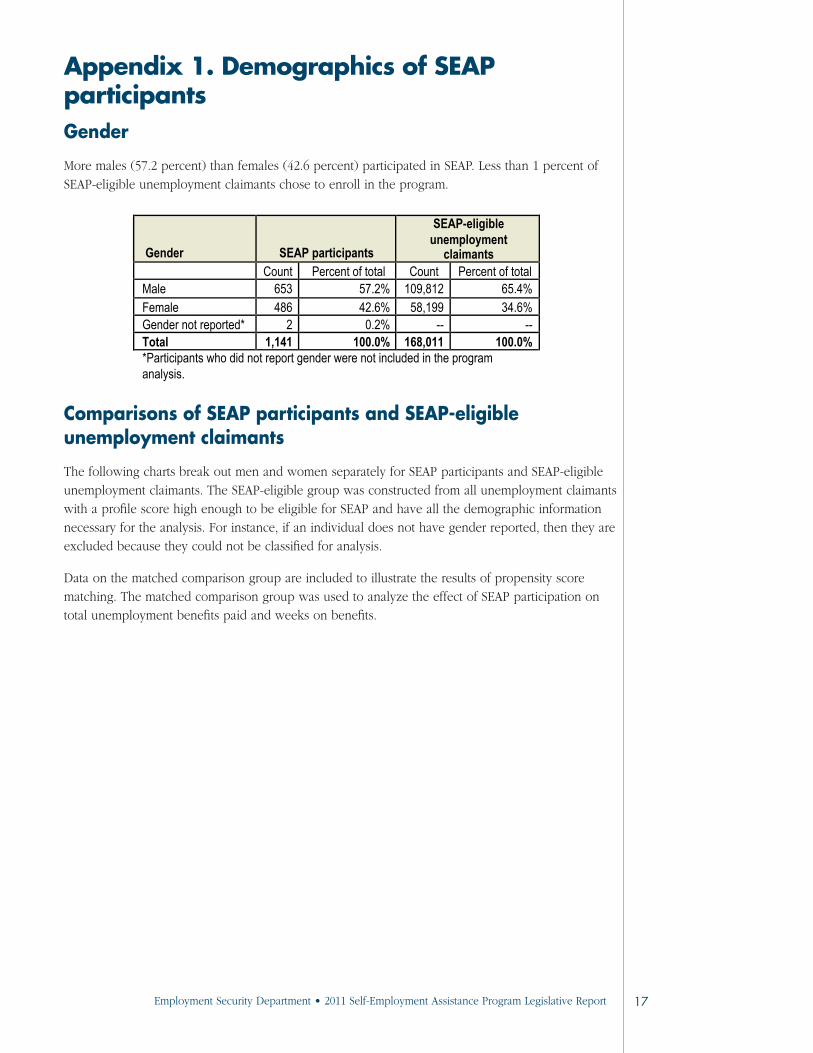
More males (57.2 percent) than females (42.6 percent) participated in SEAP. Less than 1 percent of SEAP-eligible unemployment claimants chose to enroll in the program.
Comparisons of SEAP participants and SEAP-eligible unemployment claimants
The following charts break out men and women separately for SEAP participants and SEAP-eligible unemployment claimants. The SEAP-eligible group was constructed from all unemployment claimants with a profile score high enough to be eligible for SEAP and have all the demographic information necessary for the analysis. For instance, if an individual does not have gender reported, then they are excluded because they could not be classified for analysis.
Data on the matched comparison group are included to illustrate the results of propensity score matching. The matched comparison group was used to analyze the effect of SEAP participation on total unemployment benefits paid and weeks on benefits.
Gender SEAP participants
SEAP-eligible
unemployment claimants
Count Percent of total Count Percent of total
Male 653 57.2% 109,812 65.4%
Female 486 42.6% 58,199 34.6%
Gender not reported* 2 0.2% -- --
Total 1,141 100.0% 168,011 100.0%
*Participants who did not report gender were not included in the program
analysis.

Employment Security Department • 2011 Self-Employment Assistance Program Legislative Report18
Age
As a group, SEAP participants are older than the population of SEAP-eligible unemployment claimants. Approximately 42 percent of male SEAP participants and 44 percent of female SEAP Participants were between the ages of 46 and 64 years old. In contrast, only 31 percent of male and 34 percent of female SEAP-eligible unemployment claimants were in this age bracket.

19Employment Security Department • 2011 Self-Employment Assistance Program Legislative Report
Race and ethnicity
The race and ethnic distribution of SEAP participants closely matches the race and ethnic distribution of SEAP-eligible unemployment claimants. Most SEAP participants were Caucasian (81 percent of males and 79 percent of females).
Employment Security Department • 2011 Self-Employment Assistance Program Legislative Report20
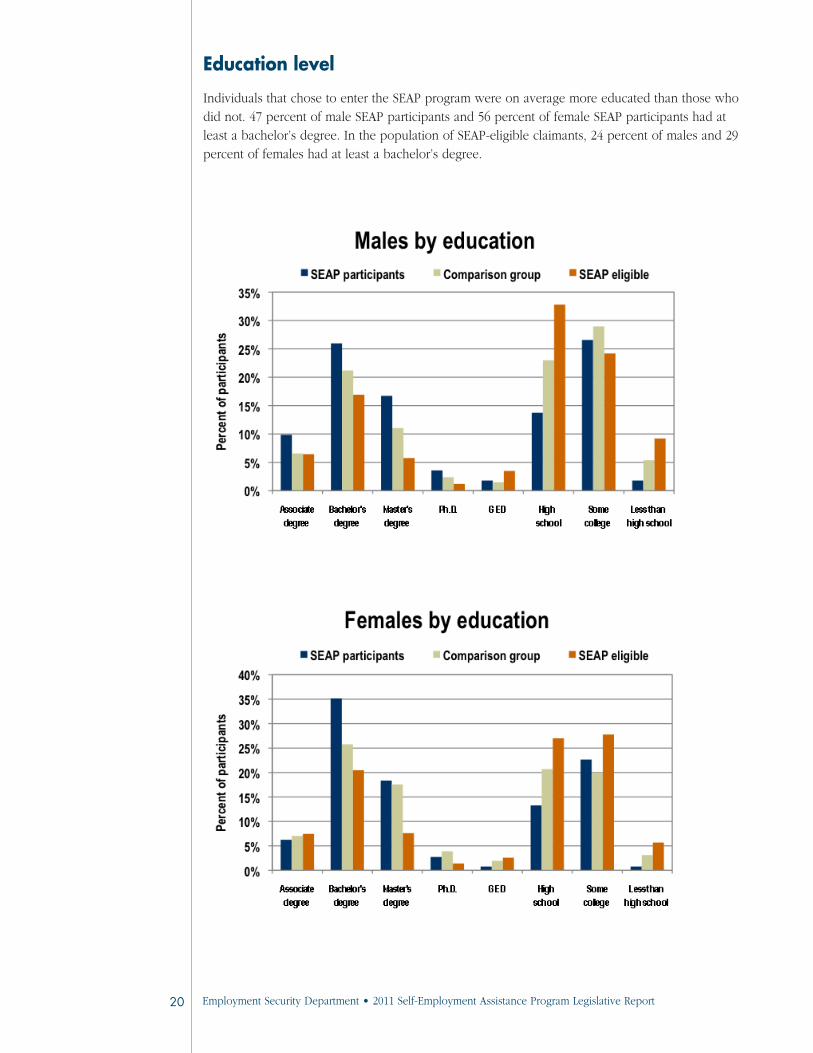
Education level
Individuals that chose to enter the SEAP program were on average more educated than those who did not. 47 percent of male SEAP participants and 56 percent of female SEAP participants had at least a bachelor’s degree. In the population of SEAP-eligible claimants, 24 percent of males and 29 percent of females had at least a bachelor’s degree.

21Employment Security Department • 2011 Self-Employment Assistance Program Legislative Report
Wages
SEAP participants made more money prior to becoming unemployed than did the SEAP-eligible population of unemployment claimants. These data are consistent with data that show SEAP participants have more education and are older.

Employment Security Department • 2011 Self-Employment Assistance Program Legislative Report22
Geographical location
By percentage, there is a relatively even geographic distribution of SEAP participants and SEAP eligible-claimants. The only exception is workforce development area (WDA) 5, the King County Workforce Development Area, where there were more SEAP participants compared to SEAP-eligible claimants.

23Employment Security Department • 2011 Self-Employment Assistance Program Legislative Report
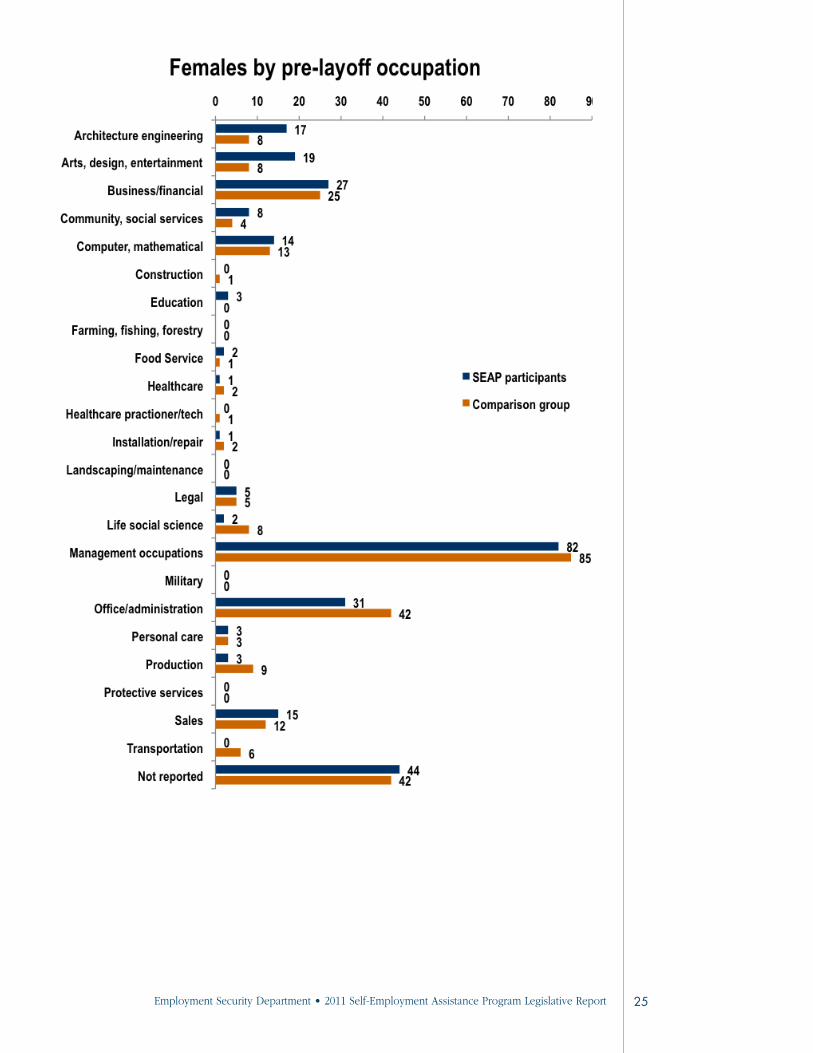
Pre-layoff occupations of SEAP participants and the matched comparison group
About 30 percent of both male and female SEAP participants (105 males and 82 females) were laid off from management occupations. Another 12 percent of males and 5 percent of females were laid off from computer and mathematical occupations and 12 percent of males and 6 percent of females were laid off from architecture and engineering occupations. Occupational groups with the fewest SEAP participants were protective services; healthcare practitioners and technical; and food preparation and serving-related.
Higher SEAP participation rates from unemployed workers in these professional occupations make sense. Those who have previously managed a company are more likely to be confident in their ability to own and operate a business. Also the computer, mathematical, architecture and engineering fields have comparatively low barriers to entry for individuals already possessing the qualifications and experience.
Conversely, there are many more regulations for businesses providing healthcare. The combination of increased barriers to entry and higher demand for labor could explain why there were fewer SEAP participants from healthcare support occupations, healthcare practitioners and technical occupations and personal care service occupations.

Employment Security Department • 2011 Self-Employment Assistance Program Legislative Report24
25Employment Security Department • 2011 Self-Employment Assistance Program Legislative Report

Employment Security Department • 2011 Self-Employment Assistance Program Legislative Report26
27Employment Security Department • 2011 Self-Employment Assistance Program Legislative Report
Appendix 2. MethodologyData sources
Unemployment insurance data warehouse These data are collected from various sources during the unemployment claim process, including data from the initial intake of a claimant and data from employer tax records.
Survey In the spring of 2011, the Employment Security Department’s Labor Market and Economic Analysis (LMEA) branch conducted a survey of all SEAP participants from January 2008 through March 2011. LMEA received survey responses from 582 of the 1,141 Washington SEAP program participants. The survey was conducted using Survey Monkey, an online survey service.
Cleaning self-reported data
The data used for this study are primarily self-reported survey data. As a result, data cleaning is needed to reduce error inherent in this type of data source. Data were cleaned to address two primary issues: missing data and data outliers.
Handling missing data The most common method of handling missing data was list-wise deletion, which was simply deleting the entry. If all the fields used for calculation were blank, the entry was deleted. If employee wages were reported with no employees, or vice versa, the entry was deleted. If gross profits or employer earnings were missing but other usable fields were reported, a zero value was assumed for the missing data, which is the median for both of these categories. This is not the most preferred method to handle missing data, but there was little additional information to model any of the parameters necessary for a more complex approach.
Treatment of data outliers Several methods for investigating outliers were examined, but the presence of so many zero values in all categories made traditional analysis difficult. Using inner quartile range, for instance, any profit reported of less than $0 and greater than $8,000 would be excluded. Since that range is not likely to fairly represent the profits of firms created by this program, the decision was made to determine outliers independently. Any profit reported more than $44,999 was deemed an outlier. There were only three negative values listed for profit; the lowest of these was -$21,000. Since there were so few negative revenues, and none drastically skewed the sample, none of the negative reports were determined to be outliers.
Overwriting data outliers Washington state keeps records on businesses that pay unemployment insurance taxes; the interface with this database is called WIN 202. In some cases, individuals reporting extreme values were able to be located in this database.
If WIN 202 data could be found that offered a logical alternative, the reported data was overwritten with the data from WIN 202. For instance, if wages of $120,000 were reported but WIN 202 showed wages of $30,000, it could be assumed the survey respondent mistakenly reported annual wages instead of quarterly wages. If no logical connection between reported data and the data in WIN 202 could be identified, then the observation was deleted.

Employment Security Department • 2011 Self-Employment Assistance Program Legislative Report28
Adjusting for non-responders Weights were assigned to responders based on gender, age, ethnicity, education level and pre-layoff wages (base period wages). Age and pre-layoff wage values were grouped into brackets.
A weight was calculated by dividing the total number of SEAP participants with the number of people with that same characteristic who responded to the survey (excluding those who were deleted for missing data and outliers). For instance, there were 346 males who responded to the survey (after outliers were taken out), and there were 653 males in the SEAP program. So the weight was calculated as:
653/346=1.887283=Weight for males
A weight like this was calculated for each demographic, then an average of all the characteristics is taken by individual. All outcomes were calculated by multiplying the weight for the individual by the reported value.
Error
Responder bias There are two significant sources of responder bias with the approaches used in this analysis. First, a significant amount of error is generated from the assumption that responders and nonresponders are identical. This bias was reduced by adjusting by demographic information. Second, it is not possible to adjust for the responder bias of those who started businesses and those who did not, and it is logical to assume that those who responded were more likely to have started a business.
Self-reported data There is an inherent danger in using self-reported data. Respondents may guess at an answer they don’t know rather than not responding, they may inflate their earnings, or other inaccuracies may be present in the data. In this survey, a small amount of the data could be corroborated, the rest could not. It is a risk that cannot be avoided with this survey methodology.
Outlier determination By dismissing a piece of data as an outlier, it is possible to dismiss important data points. It is expected that a small amount of new firms will outperform their peers, and it is theorized that these outperforming firms generate a substantial part of new employment. Given that the survey data were self-reported, it was more likely that observations showing extreme values were bad data and should not be used.
Creating a matched comparison group To determine the effects of SEAP on the amount of unemployment benefits collected and the number of weeks unemployment benefits collected, a matched comparison group was created using propensity score matching. The entrance into the SEAP program, like most government assistance programs, is not random. In order create a group that can be compared to the treatment group, additional steps beyond randomized selection had to be taken.
The treatment group was SEAP participants. The matched comparison group was constructed from similar unemployment claimants eligible for, but not participating in SEAP. This group is in the hundreds of thousands, while the number of SEAP participants used for analysis is in the hundreds. A random sample of 1,000 SEAP-eligible claimants was taken for both males and females in order to
29Employment Security Department • 2011 Self-Employment Assistance Program Legislative Report
eliminate differences from matching two groups of such different magnitudes. Because a full year after effective date of claim (EDC) was needed for analysis, participants with EDCs in 2010 could not be used, and only one year of analysis was available for participants with an EDC in 2009.
Propensity score matching uses logistic regression to match individuals based on characteristics that are relevant to the likelihood of entering the program. A dichotomous variable D is created. If the individual was in the treatment group (in the SEAP program) then the value of D was one; if not, the value was zero. In this case, the variables regressed against D were wages earned in the base period used for each individual’s unemployment claim, age of individuals, the year each person initially filed for unemployment, the year the individual filed for benefits, and whether or not the individual was in a management occupation. This produced the likelihood estimate discussed above. Each participant is matched to an individual in the comparison group based on the likelihood estimate assigned by this model.
It is not important that the model accurately predicts who is in the program, but that it predicts likelihood of being in the program evenly for both those who entered the program and those who did not. Ideally, the functions produced should be normally distributed, and the curve for entrants should match the curve for non-entrants. Following are histograms for males and females comparing the participants of SEAP (bottom) to the randomly selected group from the SEAP-eligible unemployment claimant population (top).

Employment Security Department • 2011 Self-Employment Assistance Program Legislative Report30
Females
Propensity Score of SEAP Participants09:50 Tuesday, November 29, 2011 8
The UNIVARIATE ProcedureVariable: IP_1 (Individual Probability: D=1)
Treatment = Treated
Propensity Score of SEAP Participants09:50 Tuesday, November 29, 2011 8
The UNIVARIATE ProcedureVariable: IP_1 (Individual Probability: D=1)
Treatment = Treated
Propensity Score of SEAP Participants09:50 Tuesday, November 29, 2011 5
The UNIVARIATE ProcedureVariable: IP_1 (Individual Probability: D=1)
Treatment = Treated
Propensity Score of SEAP Participants09:50 Tuesday, November 29, 2011 5
The UNIVARIATE ProcedureVariable: IP_1 (Individual Probability: D=1)
Treatment = Treated
Males

31Employment Security Department • 2011 Self-Employment Assistance Program Legislative Report
Start date estimation Values for the start date of the program, used in determining which cohort the individual was in, are problematic in this analysis. There would not be any data on the comparison group, since they never started the program. To account for this, the effective date of claim of an individual’s most recent unemployment claim was substituted for start date. This had some problems as well, since an individual can become unemployed months before he or she decides to start on the SEAP program, but since this risk was inherit with both the treatment and comparison groups, it was chosen over other methods.
T statistics T statistics were used to determine statistical significant of differences between cohorts. A t-value greater than 1.96 indicates that a difference is significant.
Values calculated no significant differences between 2008 and 2009 cohorts one year after effective date of claim (EDC) for unemployment benefits.
Males
Weeks on UI
Males 2008
Weeks on UI
Males 2009
UI paid one year
after EDC Males 2008
UI paid one year
after EDC Males 2009
Mean 40.36 38.92 21665.25 22906.37
Stdev 14.12 12.98 7834.35 8157.45
Count 53.00 304.00 53.00 304.00
Variance 199.43 168.48 61377099.51 66543928.64
T test 0.74 -1.15
Females
Weeks on UI
Females 2008
Weeks on UI
Females 2009
UI paid one year
after EDC Females 2008
UI paid one year
after EDC Females 2009
Mean 39.94 39.40 20145.16 22282.13
Stdev 13.57 13.07 7680.91 8333.11
Count 71.00 204.00 71.00 204.00
Variance 184.03 170.74 58996329.98 69440803.72
T test 0.33 -2.34
Values calculated all differences statistically significant for the 2008 cohort one and two years after the effective date of claim.
Mean
Standard deviation
Count
Variance
T-value
Mean
Standard deviation
Count
Variance
T-value

Employment Security Department • 2011 Self-Employment Assistance Program Legislative Report32
Males
Weeks on UI 1
year after EDC
Weeks on UI 2
years after EDC
UI paid 1 year
after EDC
UI paid 1 to 2
years after EDC
Mean 40.36 25.68 21665.25 14507.47
Stdev 14.12 18.21 7834.35 10404.21
Var 199.43 331.53 61377099.51 108247528.65
Count 53.00 53.00 53.00 53.00
T test 4.64 4.00
Females Weeks on UI 1 year after EDC
Weeks on UI 2 years after EDC
UI paid 1 year after EDC
UI paid 1 to 2 years after EDC
Mean 39.94 24.61 20145.16 12788.57
Stdev 13.57 20.09 7680.91 10827.47
Var 184.03 403.59 58996329.98 117234039.05
Count 71.00 71.00 71.00 71.00
T test 5.33 4.67
108247528.7
17234039.1
Mean
Standard deviation
Count
Variance
T-value
Mean
Standard deviation
Count
Variance
T-value
33Employment Security Department • 2011 Self-Employment Assistance Program Legislative Report
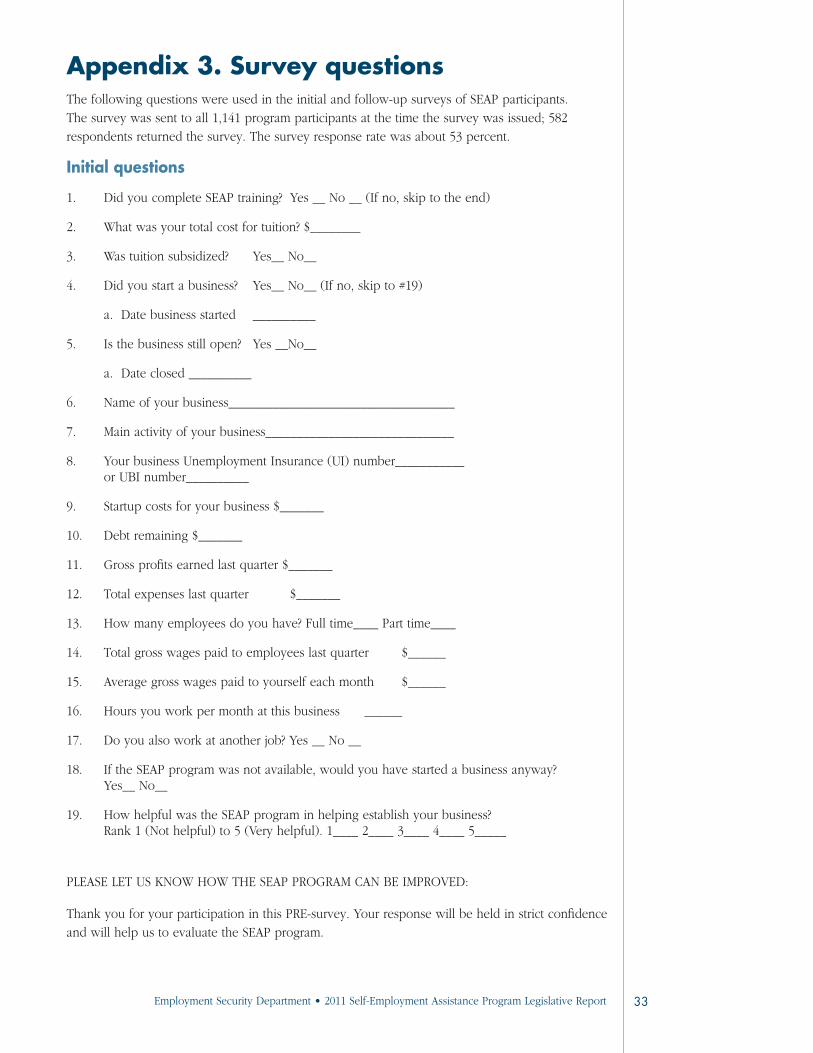
Appendix 3. Survey questions The following questions were used in the initial and follow-up surveys of SEAP participants. The survey was sent to all 1,141 program participants at the time the survey was issued; 582 respondents returned the survey. The survey response rate was about 53 percent.
Initial questions
1. Did you complete SEAP training? Yes __ No __ (If no, skip to the end)
2. What was your total cost for tuition? $________
3. Was tuition subsidized? Yes__ No__
4. Did you start a business? Yes__ No__ (If no, skip to #19)
a. Date business started __________
5. Is the business still open? Yes __No__
a. Date closed __________
6. Name of your business____________________________________
7. Main activity of your business______________________________
8. Your business Unemployment Insurance (UI) number___________ or UBI number__________
9. Startup costs for your business $_______
10. Debt remaining $_______
11. Gross profits earned last quarter $_______
12. Total expenses last quarter $_______
13. How many employees do you have? Full time____ Part time____
14. Total gross wages paid to employees last quarter $______
15. Average gross wages paid to yourself each month $______
16. Hours you work per month at this business ______
17. Do you also work at another job? Yes __ No __
18. If the SEAP program was not available, would you have started a business anyway? Yes__ No__
19. How helpful was the SEAP program in helping establish your business? Rank 1 (Not helpful) to 5 (Very helpful). 1____ 2____ 3____ 4____ 5_____
PLEASE LET US KNOW HOW THE SEAP PROGRAM CAN BE IMPROVED:
Thank you for your participation in this PRE-survey. Your response will be held in strict confidence and will help us to evaluate the SEAP program.

Employment Security Department • 2011 Self-Employment Assistance Program Legislative Report34
1. Are you currently self employed? Yes__ No__
a. If yes, when did you begin your self-employment? ___________
2. What is the main activity of your self-employment business? _______________________
3. Does your business employ others? Yes__ No__
a. If yes, how many employees does your self-employed business have? ___________
4. Have you incurred any debt as a result of your self-employment business? Yes__ No__
5. How much total debt have you incurred as a result of your self-employment business? $_____________________
a. How much debt remains outstanding? $_____________________
6. How much did your business earn before taxes in 3rd quarter 2009 (July, August, and September 2009)? $_____________________
7. Do you pay yourself a salary? Yes__ No__
8. What is the salary you make at your self-employment business? $_____________________
9. On average do you work 40 hours per week at your self-employed business? Yes__ No__
10. What could we do to improve the Self-Employment Assistance Program for customers like yourself?
Follow-up survey questions

35Employment Security Department • 2011 Self-Employment Assistance Program Legislative Report
Appendix 4. Works cited Heckman, James, Hidehiko Ichimura, J. Smith, and Petra Todd. “Characterizing Selection Bias Using Experimental Data (1998).” Econimetrica 66 (1998). Print.
Heckman, James J., Hidehiko Ichimura, and Petra Todd. “Matching As An Econometric Evaluation Estimator.” Review of Economic Studies 65.2 (1998): 261-94. Print.
Keeley, Michael C. Labor Supply and Public Policy: a Critical Review. New York: Academic, 1981. Print.
“Self-Employment Assistance Program (SEAP) Washington State Employment Security Department. Web. 10 Nov. 2011. www.esd.wa.gov/uibenefits/specialservices/training/self-employment-assistance-program.php.
Thornton, Jennifer. “Self-Employment Assistance Program (SEAP) Early Results.” Employment Security Department Internal Briefing Paper (2010). Jan. 2010. Web. June 2011.
Van, Belle Gerald. Statistical Rules of Thumb. New York: Wiley-Interscience, 2002. Print.


![DOCUMENTATIE SEAP[1]](https://img.pdfslide.net/doc/110x75/5571fe1349795991699a92a8/documentatie-seap1.jpg)