Embed Size (px)
Citation preview

Institute for Public Policy Research
Izzy Hatfield
January 2015 © IPPR 2015
REPORT
SELF-EMPLOYMENT IN EUROPE

IDEAS to CHANGE POLICY
ABOUT IPPRIPPR, the Institute for Public Policy Research, is the UK’s leading progressive thinktank. We are an independent charitable organisation with more than 40 staff members, paid interns and visiting fellows. Our main office is in London, with IPPR North, IPPR’s dedicated thinktank for the North of England, operating out of offices in Newcastle and Manchester.
The purpose of our work is to conduct and publish the results of research into and promote public education in the economic, social and political sciences, and in science and technology, including the effect of moral, social, political and scientific factors on public policy and on the living standards of all sections of the community.
IPPR 4th Floor 14 Buckingham Street London WC2N 6DF T: +44 (0)20 7470 6100 E: [email protected] www.ippr.org Registered charity no. 800065
This paper was first published in January 2015. © 2015
ABOUT THE PROGRAMMEThe JPMorgan Chase New Skills at Work programme aims to identify strategies and support solutions that help improve labour market infrastructure and develop the skilled workforce globally. The initiative brings together leading policymakers, academics, business leaders, educators, training providers and nonprofits with the goal of connecting labour market policy with practice, supply with demand and employers with the workforce – all to strengthen the global economy.
ABOUT JPMORGAN CHASEJPMorgan Chase & Co (NYSE: JPM) is a leading global financial services firm with assets of $2.5 trillion and operations worldwide. The firm is a leader in investment banking, financial services for consumers and small businesses, commercial banking, financial transaction processing, asset management and private equity. More information is available at www.jpmorganchase.com.
While this report has been supported by the JPMorgan Chase Foundation, the contents and opinions in this paper are those of IPPR alone and do not reflect the views of the JPMorgan Chase Foundation, JPMorgan Chase & Co, or any of its affiliates.

IPPR | Self-employment in Europe1
CONTENTS
Summary ............................................................................................................3
1. Introduction ....................................................................................................6
2. Self-employment ............................................................................................8
2.1 Overview ......................................................................................................... 8
2.2 Recent changes in the rate of self-employment across Europe ......................... 9
2.3 Self-employed employers ............................................................................... 11
3. The characteristics of the self-employed ..................................................... 13
3.1 Older workers ................................................................................................ 13
3.2 Young workers ............................................................................................... 15
3.3 Female self-employment ................................................................................ 16
3.4 Migrants ........................................................................................................ 18
3.5 Part-time workers .......................................................................................... 19
3.6 Qualifications ................................................................................................. 20
3.7 Training .......................................................................................................... 22
3.8 Occupation .................................................................................................... 24
3.9 Industry ......................................................................................................... 25
4. The quality of self-employed work ............................................................... 27
4.1 Job satisfaction ............................................................................................. 27
4.2 Resilience and adaptability ............................................................................. 28
4.3 Earnings ........................................................................................................ 28
4.4 Underemployment ......................................................................................... 30
4.5 ‘Bogus’ self-employment ............................................................................... 32
5. Conclusions: Supporting living standards and quality of work among the self-employed ............................................................................. 33
References ....................................................................................................... 34
Appendix: Total employment and self-employment by occupation and industry .......................................................................... 36

IPPR | Self-employment in Europe2
ABOUT THE AUTHORIzzy Hatfield is a researcher at IPPR.
ACKNOWLEDGMENTSThe author would like to thank IPPR colleagues for their input and support, in particular Spencer Thompson, Dalia Ben-Galim and Tony Dolphin.
DownloadThis document is available to download as a free PDF and in other formats at:
http://www.ippr.org/publications/self-employment-in-europe
CitationIf you are using this document in your own writing, our preferred citation is:
Hatfield I (2014) Self-employment in Europe, IPPR. http://www.ippr.org/publications/self-employment-in-europe
Permission to shareThis document is published under a creative commons licence: Attribution-NonCommercial-NoDerivs 2.0 UK http://creativecommons.org/licenses/by-nc-nd/2.0/uk/ For commercial use, please contact [email protected]

IPPR | Self-employment in Europe3
SUMMARY
Just under 14 per cent of European workers are self-employed. They are a varied group, ranging from freelance professionals to household cleaners, and play a multitude of roles in economies across Europe. In southern and eastern Europe, the self-employment rate tends to be high, while northern and western European economies tend to have a far lower rate of self-employment in their workforce.
Global trends, including globalisation and technological change, have had a disruptive effect on worldwide labour markets. In Europe, this impact has eliminated the need for some jobs, and the private sector has struggled to create new ones. This pattern, combined with the effects of the ‘great recession’, has brought high levels of unemployment, but a labour market recovery is now beginning to set in.
This paper examines the state of self-employment in Europe today – have global forces shaped the role of self-employment within European labour markets? In the UK, for one, the jobs recovery has been underpinned by a well-documented growth in self-employment. Since 2010, 40 per cent of the rise in jobs here has been in self-employment, prompting a complex debate about the extent to which this should be celebrated. Some commentators have heralded it as a sign of entrepreneurial spirit, innovation and future economic growth, while others fear it is primarily indicative of a rise in precarious, insecure work.
Within Europe, however, the UK’s self-employment-led recovery has been singular. In southern and eastern Europe, self-employment remains relatively high, but these countries are yet to see a growth in total employment. In northern and western Europe, Germany, Sweden and Norway are beginning to see rising employment, but these jobs have been for employees, while the number of self-employed workers has fallen.
Analysis of the characteristics of self-employed workers provides some insight into the uneven pattern of self-employment in Europe.1 Key findings from our research include:
Age, gender, occupations and industries• The likelihood of an individual in employment being self-employed increases
dramatically with age. In the UK one in five older workers (aged 55–65) is self-employed, compared to one in seven of the total workforce and one in 20 young workers (15–24).
• The youth self-employment rate has seen a lot of fluctuation, with 170,000 young people currently being self-employed in the UK. Youth self-employment in Spain and the Netherlands has risen sharply, but overall the youth self-employment rate has been volatile across Europe.
• Across Europe, working men are 90 per cent more likely to be self-employed than working women, although in the UK the number of women entering self-employment in the UK is growing faster than the number of men. The number of self-employed workers educated to degree level or higher has been rising steadily since 2007, reflecting general changes in the population in the UK.
1 Unless otherwise noted, ‘Europe’ refers to the Europe-24 nations, that is, European countries which are also members of the OECD. Specifically, this includes: Austria, Belgium, Czech Republic, Denmark, Estonia, Finland, France, Germany, Greece, Hungary, Iceland, Ireland, Italy, Luxembourg, Netherlands, Norway, Poland, Portugal, Slovakia, Slovenia, Spain, Sweden, Switzerland.

IPPR | Self-employment in Europe4
The concentration of self-employed workers with degree-level or higher qualifications is actually lower than it is in the total workforce.
• Over 60 per cent of the German self-employed work in high-skill occupations, while southern and eastern economies tend to have higher proportions of self-employed workers engaged in low- and mid-skill occupations, largely due to the prevalence of agriculture and retail work. Just under half of the British self-employed work in a high-skilled occupation, including 24 per cent in professional occupations.
• A higher proportion of self-employed workers than employees are in managerial, skilled agricultural, forestry and fishery, and craft and related trades occupations. Spain has a particularly high concentration of service and sales workers in self-employment.
• Self-employed workers are more likely than the economy-wide average to work in the following industries: agriculture, forestry and fishing; construction; and professional, scientific, technical, administration and support service activities. More than one-fifth of the British self-employed work in the construction industry (830,000), nearly three times the proportion of employees.
Pay and structure• In the UK, in 2011, the median self-employed worker earned over 40 per
cent less than the median employee. Across Europe, the median self-employed worker’s earnings have been falling at a faster rate than the median employee’s earnings.
• Twice as many self-employed workers in the UK were looking for another job in 2012 as in 2007. The main reason cited for this was to try to secure more hours’ work.
• Only 17 per cent of the UK self-employed have any employees – this is the lowest proportion in Europe. This partly reflects the different occupational and industrial structures of the self-employed in the UK.
While self-employment is more common in older, male workers, in many countries the female self-employment rate is rising faster than the male self-employment rate. There is evidence to suggest that individuals facing labour market disadvantage are more likely to become self-employed as they struggle to find an employee job. As such, self-employment can provide a route into work for many disadvantaged unemployed groups, including women and mothers as well as migrants. Institutional factors play an important part in determining how strong this effect will be. Spain, for example, has much higher rates of female self-employment than Denmark, which has higher social security payments and greater female attachment to the labour market.
In a survey, 45 per cent of EU citizens expressed a preference for self-employment over being an employee, and there is a lot of supporting evidence to suggest that job satisfaction is very high among the self-employed. However, the rise in self-employment in the UK has caused widespread concern about the living standards of self-employed workers. Our data analysis suggests that the earnings of the self-employed across Europe are falling relative to employee earnings, while more and more workers are looking for more hours or another job.
Self-employment, while offering greater freedom and flexibility, can also present significant challenges, particularly within economies where it is becoming a more significant part of the labour market, like the UK. Self-employed workers often don’t have basic employment rights, and are subject to greater financial instability, particularly when starting out or when businesses are not performing well. They are also less likely to have paid into a private pension, and work can be irregular and insecure.

IPPR | Self-employment in Europe5
Entrepreneurship is a key driver of economic growth, and self-employment is an integral part of the European labour market, but if low pay and financial insecurity abound, it may be driving both a rise in in-work poverty and the jobs recovery. In countries like the UK where the share of self-employment is rising, managing the quality of the jobs recovery could prove to be as important as the quantity.

IPPR | Self-employment in Europe6
1. INTRODUCTION
The recent rise in self-employment has made a large contribution to the labour market recovery in the UK. In fact, 40 per cent of the growth in UK employment since the second quarter of 2010 is accounted for by the rise in the number of self-employed workers. This is a startlingly high proportion, given that in 2010 just 13 per cent of workers were self-employed.
Evidence from across Europe indicates that the UK is an anomaly in this respect. While some countries, including the Netherlands and Belgium, have seen a rise in the self-employment rate, this has not been part of a large overall rise in total employment. Other countries that have experienced an increase in jobs have not seen growth in self-employment on a similar scale to the UK. In Germany, for example, employment has risen by over 1.6 million people, but this has been entirely driven by the creation of employee jobs,2 and between the second quarter of 2010 and the second quarter of 2014 the number of German self-employed workers actually fell.
In the UK there is an ongoing debate as to whether the recent rise in self-employment is indicative of a strong labour market recovery or a lack of alternative employment choices. Self-employment has many advantages, allowing workers much greater freedom in the type of work they do and when they do it. Many have heralded the growth in UK self-employment as a sign of flourishing entrepreneurship, hypothesising that workers who lost their jobs during the recession have set up their own businesses, showing initiative and resilience amid poor labour market conditions (see for example Swinford 2014). Greater creativity and innovation in the labour market can lead to economic growth, and hence this is taken by some as a signal of the underlying strength of the UK recovery.
On the other hand, many commentators have expressed concern that not all self-employed workers have chosen this path freely (see for example Clark 2014a). Workers unable to find employee jobs may be forced to go it alone in the labour market, without any real desire to start a sustainable business. Some claim that employers are encouraging their staff to become self-employed in order to avoid tax and employment responsibilities (Clark 2014b), while others suggest that unemployed people are being pressured into self-employment in order to get them off the books at Jobcentre Plus (Barnes 2013).
Self-employed workers across Europe have traditionally reported higher levels of job satisfaction than employees, citing the greater autonomy and flexibility of ‘being your own boss’. However, self-employment can be unpredictable. Recent evidence from the Resolution Foundation, for example, suggests that self-employed earnings may have fallen by as much as 20 per cent in the UK between 2006 and 2012 (D’Arcy and Gardiner 2014), and earnings can be very irregular, particularly in the early stages of a business. On top of this, self-employed workers have little recourse to basic employment rights, such as paid sick leave, holiday and maternity leave, which means that self-employed workers can easily find themselves financially unstable or otherwise vulnerable.
2 That is, persons who work for a public or private employer and who receive compensation in the form of wages, salaries, payment by results or payment in kind; non-conscript members of the armed forces are also included.

IPPR | Self-employment in Europe7
This report examines self-employment across Europe.3 Chapter 2 focusses on the size and importance of self-employment in different economies, identifying the UK as the only western European country for which self-employment growth has played a very significant part in the overall employment recovery. The UK also stands out as the country with the lowest percentage of self-employed workers who are themselves employing staff.
Chapter 3 identifies the typical characteristics of self-employed workers across Europe. In every country we have analysed, a self-employed worker is more likely than an employee to be male and in an older age-group. Migrants are also more likely to be self-employed than non-migrants. We also consider the skill levels of self-employed workers across Europe, examining the distribution of occupations, industries and highest qualifications.
Chapter 4 attempts to assess the quality of self-employed work. Using data from the European Social Survey, EU Statistics on Income and Living Conditions, and the EU Labour Force Survey, we look at a range of factors affecting the quality of self-employed work, including both the advantages and challenges.
3 Unless otherwise noted, in this report ‘Europe’ refers to the Europe-24 nations, that is, European countries which are also members of the OECD. Specifically, this includes: Austria, Belgium, Czech Republic, Denmark, Estonia, Finland, France, Germany, Greece, Hungary, Iceland, Ireland, Italy, Luxembourg, Netherlands, Norway, Poland, Portugal, Slovakia, Slovenia, Spain, Sweden, Switzerland.

IPPR | Self-employment in Europe8
2. SELF-EMPLOYMENT
2.1 OverviewJust under 14 per cent of workers in the European countries we studied are self-employed. The economies of southern and eastern Europe have the greatest share of self-employed workers, with the highest rate occurring in Greece, where over 30 per cent of workers are self-employed. Greece, Italy, Poland and Spain have traditionally had a high proportion of self-employed workers, due to the prominence of agricultural, service-based and informal work in these countries. Self-employment can also represent a route out of unemployment in countries with poor labour market conditions (EEOR 2010).
At the other end of the spectrum, northern European countries – including Norway, Estonia, Denmark and Sweden – have the lowest proportion of self-employed workers. Packard et al (2012) suggest that countries with more active labour market policies have a lower incidence of informal work, which may be one of the reasons why self-employment is lower in northern and western European countries.
As figure 2.1 shows, the UK, the Netherlands and Ireland are the only north/western European economies to sit above the European average, with self-employment rates of around 14 to 15 per cent.
Figure 2.1Self-employment rates, Europe-24 countries, Q2 2014
0% 5% 10% 15% 20% 25% 30% 35%
Norway
Estonia
Luxembourg
Denmark
Sweden
Germany
Hungary
France
Austria
Switzerland
Iceland
Finland
Slovenia
Belgium
EU24
UK
Ireland
Slovakia
Netherlands
Portugal
Spain
Czech Rep.
Poland
Italy
Greece
12.3%
6.6%
8.0%
8.2%
8.3%
9.0%
9.8%
10.5%
10.6%
10.6%
10.9%
11.9%
12.6%
13.4%
13.5%
14.1%
15.1%
15.2%
15.3%
15.3%
10.0%
17.1%
17.7%
21.9%
30.4%
Source: Eurostat Labour Market Database (Eurostat 2014a) Base: Total employment

IPPR | Self-employment in Europe9
2.2 Recent changes in the rate of self-employment across EuropeSince the recession, the self-employment rate has been steadily rising in the Netherlands and the UK. The self-employment rate in the Netherlands has risen from a pre-recession rate of around 12 per cent to over 15 per cent in 2014. In the UK, the self-employment rate has also risen steadily since 2007: there are now over 4 million self-employed workers in the UK, and the self-employment rate has risen by 1.3 percentage points in the last four years. This growth in self-employment has not been replicated across Europe – many countries have seen little change in the relative share of the self-employed in the workforce, while some countries have seen a decline in the proportion of self-employed workers. Poland, for example, has seen a sharp fall, while Spain experienced an initial decline, before a rise at the end of 2011.
France, Germany and Sweden all have relatively low levels of self-employment that have not changed much over time. Their labour markets have experienced small fluctuations in the proportion of self-employed workers, but the self-employment rate has remained consistently under 11 per cent of the total workforce.
If the current growth in self-employment continues in the UK and the Netherlands then in 10 years’ time they could have self-employment rates approaching those of Poland, Spain and other south/eastern European nations. It seems likely that the recent growth in self-employment has, at least to some extent, been a genuine compositional shift rather than merely a cyclical effect.
Figure 2.2 Self-employment rates across selected Europe-24 countries, 2005–2014
Poland
Spain
Netherlands
UK
France
Germany
Sweden
6%
8%
10%
12%
14%
16%
18%
20%
22%
Q1 201
4
Q3 2
013
Q1 2
013
Q3 2
012
Q1 201
2
Q3 201
1
Q1 2
011
Q3 201
0
Q1 2
010
Q3 2
009
Q1 200
9
Q3 2
008
Q1200
8
Q3 200
7
Q1 200
7
Q3 200
6
Q1 200
6
Q3 200
5
Q1 200
5
Source: Eurostat Labour Market Database (Eurostat 2014a) Note: The self-employment rate is presented as a backwards-looking four-quarter moving average. Dates refer to the final quarter of the moving average.

IPPR | Self-employment in Europe10
The self-employment rate is affected by the number of people both entering and leaving self-employment. This means that a rise in the self-employment rate could be caused by a rise in the inflow rate (the number of people entering self-employment, as a share of the total in self-employment) or a decline in the outflow rate (the number of people leaving self-employment, as a share of total self-employment) – or, as is most likely, by a combination of these two factors.
In the UK, the Office for National Statistics [ONS] notes the impact which the lowest self-employment outflow rate in 20 years has had on the rise in British self-employment, pointing both to people who are choosing to work for longer and to a reduction in employee jobs during the recession as underlying factors (ONS 2014). D’Arcy and Gardiner (2014) compare the trends of self-employment inflows and outflows between the pre-and post-recession periods, attributing 72 per cent of the rise in self-employment to growth in the inflow rate, and 28 per cent of the rise in self-employment to the decline in the outflow rate.
Figure 2.3 shows the percentage change in the numbers of employees and self-employed workers between 2010 and 2014 in European countries which have seen overall employment growth. Of these, the UK has seen the third largest rise in self-employment (15 per cent), behind only Luxembourg and Estonia. Furthermore, the rise in employee jobs during the same period has been relatively subdued, at only 5 per cent. In fact, 40 per cent of the rise in employment in the UK since 2010 has been in self-employment.
Figure 2.3 Percentage change in the number of self-employed and employee jobs in selected Europe-24 countries, Q2 2010 – Q2 2014
15%
20%
-10%
-5%
0%
5%
10%
25%
30%
35%
40%
Norway
Sweden
Poland
Hunga
ry
German
y
Slovak
ia
Switzerl
and
Austria
Czech
Rep
.
Belgium
Icelan
dUK
Estonia
Luxe
mbour
g
Employees
Self-employed
Source: Eurostat Labour Market Database (Eurostat 2014a)
In contrast to the UK, Germany has seen jobs growth of 1.5 million since 2010, all of which has occurred in employee jobs. In fact, there are now fewer self-employed workers in Germany than there were in 2010. This is most likely because Germany did not suffer such a deep recession, and was able to restructure businesses

IPPR | Self-employment in Europe11
to adjust to lower aggregate demand. German firms’ use of measures as such as ‘mini-jobs’ and short-time working resulted in fewer redundancies and lower unemployment rates than were seen in the UK (Silim 2013).
Here, the recession was felt more deeply and the Coalition government instead directed funding towards encouraging entrepreneurship, as part of a strategy to reduce the budget deficit through business growth. Many policy initiatives – including the extension of the 10 per cent entrepreneurial tax relief rate, the introduction of the Enterprise Finance Guarantee scheme and the creation of the New Enterprise Allowance – were directed at supporting self-employment rather than employee jobs. This context suggests that self-employment may have been a more appealing prospect to workers in the UK, while employment has remained more appealing to those in the German labour market. Insecure employment has risen in both countries, although in the UK this has manifested itself in self-employed work, while in Germany it has been in less secure employee jobs (Weinkopf 2014).
The southern European countries, by comparison, have not seen much of a jobs recovery so far: Spain, Greece and Italy are all yet to experience employment growth. Of the eastern European countries that have seen some employment growth, Poland and Hungary have seen self-employment fall, while employee jobs have delivered overall employment growth. Much like Germany, in the Nordic countries which have seen jobs growth, self-employment has declined, and the recovery has been fuelled by growth in the number of employees. Self-employment has traditionally played less of a role in these economies, and different institutional factors (such as the use of more activation policies) has been linked with lower rates of informal self-employment in these countries.
2.3 Self-employed employersThe impact of self-employment in a given labour market is not dependent solely on the number of people classified as self-employed. Self-employment is ‘an important driver of entrepreneurship and job creation’ in Europe (EEOR 2010).
Figure 2.4 Percentage of self-employed workers with employees in Europe-24 countries, 2013
0%
10%
20%
30%
40%
50%
60%
UK
Czech
Rep
.
Slovak
ia
Greece
Poland
Netherl
ands
Sloven
ia
Norway
Irelan
dIta
ly
Portug
al
Spain
Belgium
Finlan
d
Luxe
mbour
g
Icelan
d
Sweden
Denmark
Fran
ce
Austria
Estonia
German
y
Switzerl
and
Hunga
ry
Source: Eurostat Labour Market Database (Eurostat 2014a)

IPPR | Self-employment in Europe12
In the UK, just 17 per cent of self-employed workers themselves employ staff of their own. This is the lowest rate in Europe and around half the average across the European countries in our study. This lowers the impact that self-employment has on the wider economy, as there are fewer other workers dependent on self-employed workers for their jobs. In Germany, by contrast, less than 10 per cent per cent of workers are self-employed, but nearly half (44 per cent) of self-employed workers have one or more employee.
In part, the variation in the proportion of self-employed workers with employees is probably due to the prevalence of different occupations and industries in each country, which is discussed in greater detail in chapter 3. It is clear, for example, that a freelance journalist is less likely to hire employees than an entrepreneur setting up a small business.
The term self-employment also covers those who have been coined the ‘bogus self-employed’ (see section 4.5). This type of self-employed worker is also very unlikely to hire employees of their own.

IPPR | Self-employment in Europe13
3. THE CHARACTERISTICS OF THE SELF-EMPLOYED
The self-employment rate of older workers is higher than for other age-groups. Older workers tend to have more experience and higher levels of human capital, as well as larger capital reserves and better access to credit with which to start a business. In all, only 3 per cent of European self-employed workers are aged 15–24, compared with 42 per cent who are over the age of 50, and 56 per cent aged 25–49.
Figure 3.1 Age distribution of self-employed workers in selected Europe-24 countries, 2013
15–24 25–49 50–64 65+
0%
20%
40%
60%
80%
100%
UKSwedenPolandFranceSpainGermany
Source: Eurostat Labour Market Database (Eurostat 2014a)
3.1 Older workersAlthough the largest block of self-employed people are in the 25–49 age-group, the self-employment rate of 50–65-year-old workers is notably higher than for other age-groups. In the UK, this rate is 19 per cent, four percentage points higher than the self-employment rate for the total workforce and up by 2 percentage points since the second quarter of 2007. The Netherlands has seen a similar rise in the self-employment rate of older workers, an increase which has been even more pronounced since the third quarter of 2009. In part, this may reflect the tough labour market conditions older workers face (Ben-Galim and Silim 2013). Labour market discrimination is often associated with a higher rate of self-employment, and the lack of employee jobs after the recession may have compounded this.

IPPR | Self-employment in Europe14
Figure 3.2 Proportion of self-employed workers among 50–64-year-olds in work in selected Europe-24 countries, 2005–2014
Poland
Spain
Netherlands
UK
France
Germany
Sweden
0%
5%
10%
15%
20%
25%
30%
Q1 201
4
Q1 201
3
Q1 201
2
Q1 201
1
Q1 201
0
Q1 200
9
Q1 200
8
Q1 200
7
Q1 200
6
Q1 200
5
Source: Eurostat Labour Market Database (Eurostat 2014a) Note: The self-employment rate is presented as a backwards-looking four-quarter moving average. Dates refer to the final quarter of the moving average.
The self-employment rate of 50–64-year-olds in Poland and Spain is much higher than in north/western Europe, at almost a quarter of the age-group, but this has been steadily falling since 2006. The high levels of older self-employment in these countries mainly reflect the higher share of the overall workforce in self-employment.
In France, Germany and Sweden the share of self-employed 50–64-year-olds is much lower than in south/eastern Europe, which again is largely a reflection of lower self-employment rates across the piece.
In addition, there is also a high number of workers over the age of 65 (which is often over the state retirement age4) in self-employment (see figure 3.3).
The UK has the lowest self-employment rate for over-65s, at just 39 per cent of total 65-plus employment, but this has grown by five percentage points since the second quarter of 2008. The recession has led to many older households experiencing largely unanticipated drops in household wealth, as a result of large falls in the value of financial assets (Banks et al 2012). These ‘wealth shocks’ may have encouraged older workers to delay retirement, or to move from employment to self-employment after retirement age, contributing to the so-called ‘silver economy’.
Additionally, self-employed workers are less likely to have made contributions to a private pension scheme: in 2010/11, only 21 per cent had done so, compared to 50 per cent of employees. This may also impact on the decision of older self-employed workers to keep working for longer, and thus (as discussed in chapter 2) contribute to the large fall in the outflow rate from self-employment in the UK. The relatively low value of the state pension in the UK may be another reason why the outflow rate from self-employment has declined, as more workers find they need to
4 Virtually all developed OECD countries have a normal pension age of at least 65, or plan to reach that level in the future (OECD 2013).
IPPR | Self-employment in Europe15
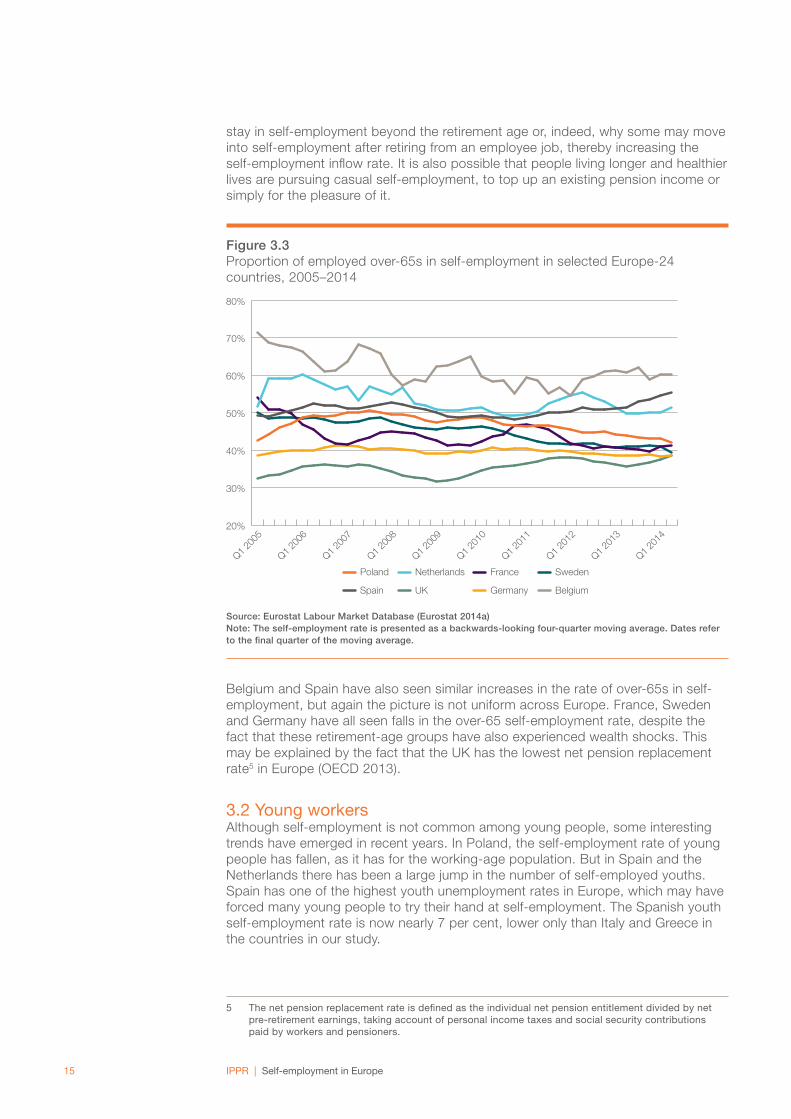
stay in self-employment beyond the retirement age or, indeed, why some may move into self-employment after retiring from an employee job, thereby increasing the self-employment inflow rate. It is also possible that people living longer and healthier lives are pursuing casual self-employment, to top up an existing pension income or simply for the pleasure of it.
Figure 3.3 Proportion of employed over-65s in self-employment in selected Europe-24 countries, 2005–2014
20%
30%
40%
50%
60%
70%
80%
Q1 2
014
Q1 201
3
Q1 201
2
Q1 201
1
Q1 201
0
Q1 200
9
Q1 200
8
Q1 200
7
Q1 200
6
Q1 200
5
Poland
Spain
Netherlands
UK
France
Germany
Sweden
Belgium
Source: Eurostat Labour Market Database (Eurostat 2014a) Note: The self-employment rate is presented as a backwards-looking four-quarter moving average. Dates refer to the final quarter of the moving average.
Belgium and Spain have also seen similar increases in the rate of over-65s in self-employment, but again the picture is not uniform across Europe. France, Sweden and Germany have all seen falls in the over-65 self-employment rate, despite the fact that these retirement-age groups have also experienced wealth shocks. This may be explained by the fact that the UK has the lowest net pension replacement rate5 in Europe (OECD 2013).
3.2 Young workersAlthough self-employment is not common among young people, some interesting trends have emerged in recent years. In Poland, the self-employment rate of young people has fallen, as it has for the working-age population. But in Spain and the Netherlands there has been a large jump in the number of self-employed youths. Spain has one of the highest youth unemployment rates in Europe, which may have forced many young people to try their hand at self-employment. The Spanish youth self-employment rate is now nearly 7 per cent, lower only than Italy and Greece in the countries in our study.
5 The net pension replacement rate is defined as the individual net pension entitlement divided by net pre-retirement earnings, taking account of personal income taxes and social security contributions paid by workers and pensioners.

IPPR | Self-employment in Europe16
Figure 3.4Proportion of self-employed workers among employed 15–24-year-olds in selected Europe-24 countries, 2005–2014
0%
1%
2%
3%
4%
5%
6%
7%
8%
Q1 201
4
Q1 201
3
Q1 2
012
Q1 201
1
Q1 201
0
Q1 2
009
Q1 200
8
Q1 200
7
Q1 200
6
Q1 200
5
Poland
Spain
Netherlands
UK
France
Germany
Sweden
Source: Eurostat Labour Market Database (Eurostat 2014a) Note: The self-employment rate is presented as a backwards-looking four-quarter moving average. Dates refer to the final quarter of the moving average.
The proportion of young people who work for themselves across Europe is very low; in the UK it is less than 5 per cent. The UK youth self-employment rate has increased by about 1 percentage point since the second quarter of 2008, although this rise includes a dip in late 2012 and 2013. The rate is now rising again but has not yet reached its previous level.
3.3 Female self-employmentAcross Europe, men are 90 per cent more likely to be self-employed than women. In the UK, there are twice as many self-employed men as women, and the female self-employment rate is eight percentage points lower than the male self-employment rate.
In every country the female self-employment rate lags behind the male rate, with the difference at its greatest in Ireland, Sweden and Denmark, and lowest in Luxembourg, Switzerland and Portugal (see figure 3.5).
Female self-employment tends to be higher in south/eastern European countries, roughly mirroring the overall self-employment levels (see figure 3.6). In large part, this is due to institutional factors. Carrasco and Ejrnaes (2012) suggest that in Spain, for example, marginalised groups, including mothers, are forced to search for an alternative to waged employment to a greater extent than in other countries, as the social security system is much less generous than in, say, Denmark. Thus in Spain, which has much higher unemployment rates, individuals at the bottom of the wage distribution, unemployed people without unemployment benefits and mothers with small children start their own businesses far more often than is the case in Denmark.

IPPR | Self-employment in Europe17
Women in Denmark, by contrast, are more likely to be well-integrated into the labour market, which also means they will be more likely to find an employee job rather than being compelled to explore the alternative of self-employment (ibid).
Figure 3.5Female and male self-employment rates in Europe-24 countries, 2013
0%
5%
10%
15%
20%
25%
30%
35%
40%
Norway
Denmark
Estonia
Sweden
Fran
ce
Irelan
d
German
y
Luxe
mbour
g
Sloven
ia
Hunga
ry
Finlan
d
Icelan
d
AustriaUK
Belgium
Switzerl
and
Slovak
ia
Netherl
ands
Czech
Rep
.
Spain
Poland
Portug
alIta
ly
Greece
Female
Male
Source: Eurostat Labour Market Database (Eurostat 2014a)
Figure 3.6Proportion of employed women in self-employment in selected Europe-24 countries, 2005–2014
0%
2%
4%
6%
8%
10%
12%
14%
16%
18%
Q1
2014
Q1 2
013
Q1 2
012
Q1 2
011
Q1 201
0
Q1 2
009
Q1 200
8
Q1 200
7
Q1 200
6
Q1 200
5
Poland
Spain
Netherlands
UK
France
Germany
Sweden
Source: Eurostat Labour Market Database (Eurostat 2014a) Note: The self-employment rate is presented as a backwards-looking four-quarter moving average. Dates refer to the final quarter of the moving average.

IPPR | Self-employment in Europe18
In the UK, the percentage of women in work choosing self-employment has risen steadily over the last few years. Two industries in particular – administrative and support service activities, and human health and social work activities – have seen large self-employment growth (37 per cent and 20 per cent respectively (ESS 2010)). Female workers are concentrated in these industries, which may have contributed to the rise in overall female self-employment.
Whatever their reasons for taking up self-employment, female workers can gain a number of benefits from it. For mothers starting up a business – sometimes known as ‘mumtrepreneurs’ – self-employment can offer flexibility in when and where they work, allowing them to create a better work-life balance. However, there is reason to be concerned about the rise in female self-employment. Lechmann and Schnabel (2012) find that the German gender earnings gap is larger in self-employment than in paid employment, while reports suggest that the self-employed earnings gap may be as high as 40 per cent in the UK (Fisher 2014).
3.4 MigrantsMigrants often face barriers to entering employment in their host countries. Figure 3.7 shows that in the UK the self-employment rate of migrants is three percentage points higher than for the native population; in Germany it is five percentage points higher.
Kangasniemi and Kauhanen (2013) find that immigrants are more likely to work as self-employed or in temporary jobs. This may be due to the lack of employee options available to immigrants and the relative opportunity of self-employed work. Much like in the case of younger, older and female workers, self-employment can offer groups which are disadvantaged in the labour market in some countries a route into work.
Figure 3.7Proportion of migrants and native workers in self-employment, Germany and UK, 2012
Migrant Non-migrant
0%
2%
4%
6%
8%
10%
12%
14%
16%
18%
UKGermany
Source: IPPR calculations using EULFS (Eurostat 2014b) Note: Migrants are all those who were both not born in the country of current residence and self-report a nationality that differs from their country of current residence.
IPPR | Self-employment in Europe19
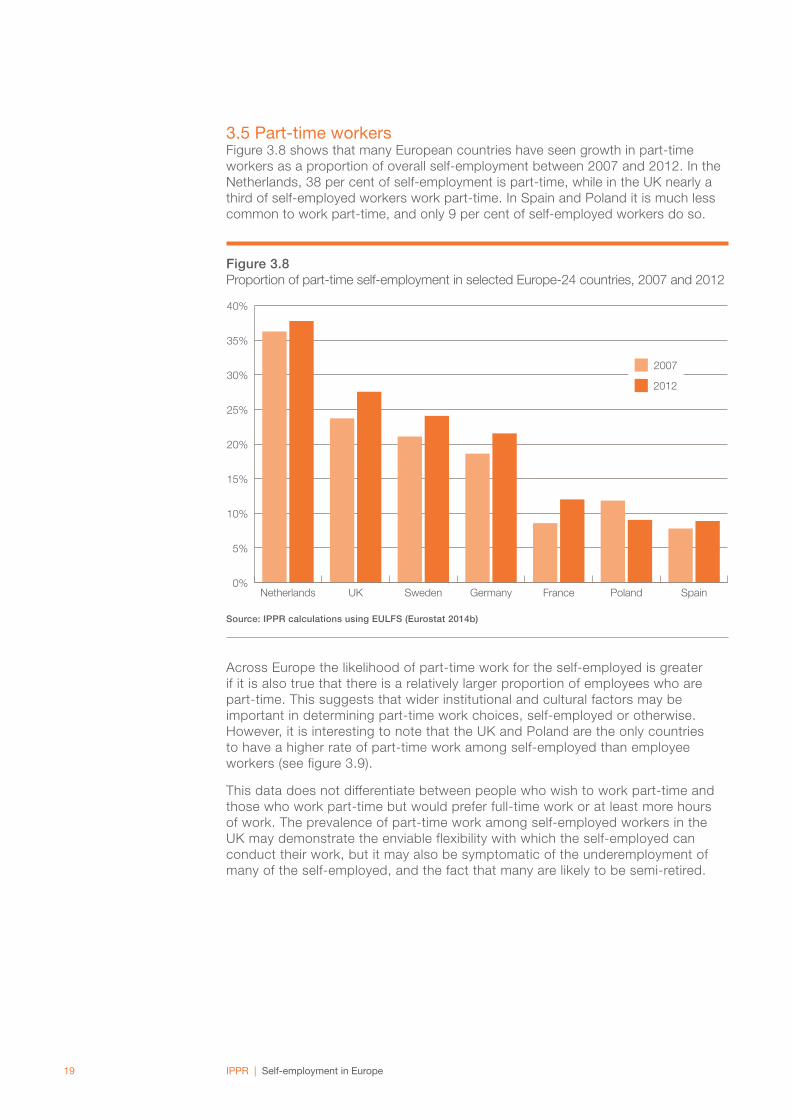
3.5 Part-time workersFigure 3.8 shows that many European countries have seen growth in part-time workers as a proportion of overall self-employment between 2007 and 2012. In the Netherlands, 38 per cent of self-employment is part-time, while in the UK nearly a third of self-employed workers work part-time. In Spain and Poland it is much less common to work part-time, and only 9 per cent of self-employed workers do so.
Figure 3.8Proportion of part-time self-employment in selected Europe-24 countries, 2007 and 2012
0%
5%
10%
15%
20%
25%
30%
35%
40%
SpainPolandFranceGermanySwedenUKNetherlands
2007
2012
Source: IPPR calculations using EULFS (Eurostat 2014b)
Across Europe the likelihood of part-time work for the self-employed is greater if it is also true that there is a relatively larger proportion of employees who are part-time. This suggests that wider institutional and cultural factors may be important in determining part-time work choices, self-employed or otherwise. However, it is interesting to note that the UK and Poland are the only countries to have a higher rate of part-time work among self-employed than employee workers (see figure 3.9).
This data does not differentiate between people who wish to work part-time and those who work part-time but would prefer full-time work or at least more hours of work. The prevalence of part-time work among self-employed workers in the UK may demonstrate the enviable flexibility with which the self-employed can conduct their work, but it may also be symptomatic of the underemployment of many of the self-employed, and the fact that many are likely to be semi-retired.

IPPR | Self-employment in Europe20
Figure 3.9Percentage of part-time employees and self-employed in selected Europe-24 countries, 2012
0%
10%
20%
30%
40%
50%
60%
Spain
Poland
Fran
ce
German
y
SwedenUK
Netherl
ands
Self-employed
Employees
Source: IPPR calculations using EULFS micro-data (Eurostat 2014b)
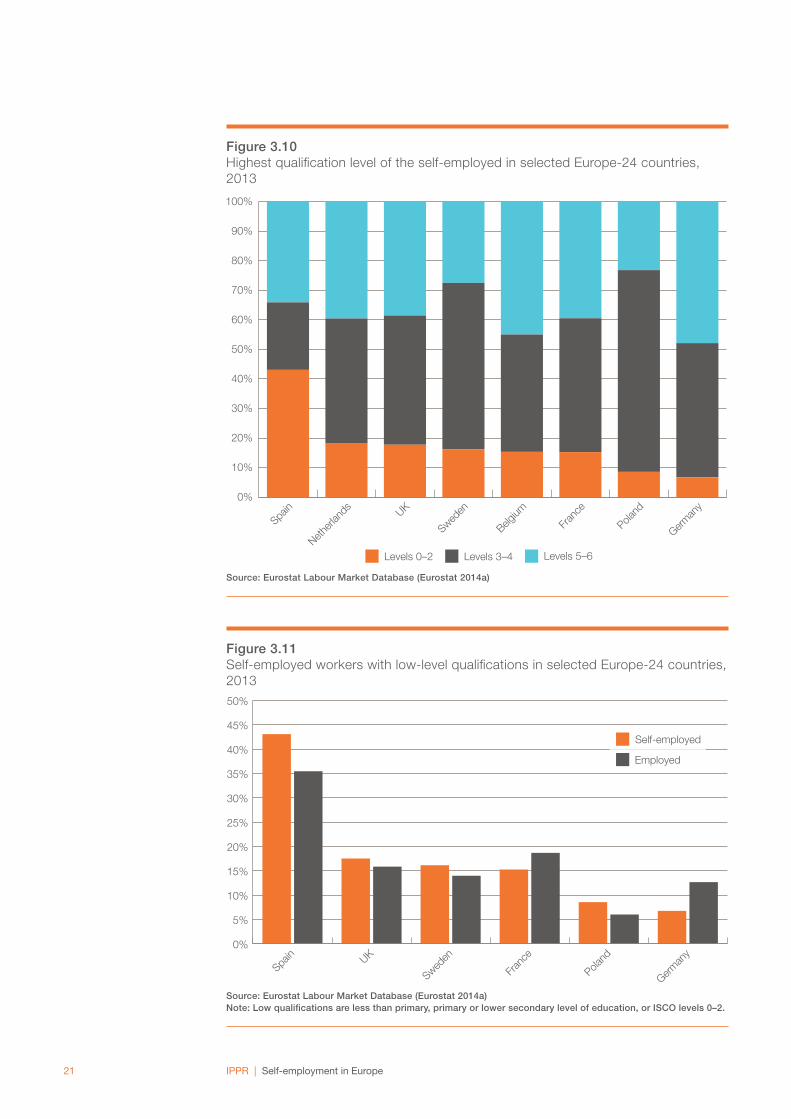
3.6 QualificationsThe qualification level of self-employed workers is of interest because it sheds light on some characteristics of people who opt for self-employment (see figure 3.10). On one hand, we might expect self-employed workers to be highly skilled workers entering new and creative businesses. But on the other hand, as has been covered already in this chapter, there is evidence to suggest that those with some kind of labour market disadvantage, such as migrants with few contacts or unemployed people in countries with few activation policies, become self-employed because it presents an easier route into the labour market. This effect may also apply to people with low-level or no qualifications.
Germany has the greatest proportion of highly educated self-employed workers; this group is over 50 per cent more likely to be highly educated (to hold a level 5 or 6 qualification) than the total workforce. Self-employed workers in France and the Netherlands are also slightly more likely than the workforce to be highly educated.
In the UK, 38 per cent of self-employed workers are highly qualified, which is a slightly smaller proportion than in the overall workforce. Self-employed workers in the UK are more likely to have low-level qualifications. The opposite is true in Germany, where self-employed workers are less likely to have qualifications at this level than employees (see figures 3.11 and 3.12).
IPPR | Self-employment in Europe21
Figure 3.10Highest qualification level of the self-employed in selected Europe-24 countries, 2013
Levels 0–2 Levels 3–4 Levels 5–6
0%
10%
20%
30%
40%
50%
60%
70%
80%
90%
100%
German
y
Poland
Fran
ce
Belgium
SwedenUK
Netherl
ands
Spain
Source: Eurostat Labour Market Database (Eurostat 2014a)
Figure 3.11Self-employed workers with low-level qualifications in selected Europe-24 countries, 2013
0%
5%
10%
15%
20%
25%
30%
35%
40%
45%
50%
Self-employed
Employed
German
y
Poland
Fran
ce
SwedenUK
Spain
Source: Eurostat Labour Market Database (Eurostat 2014a) Note: Low qualifications are less than primary, primary or lower secondary level of education, or ISCO levels 0–2.

IPPR | Self-employment in Europe22
Figure 3.12Self-employed workers with higher-level qualifications in selected Europe-24 countries, 2013
Self-employed
Employed
0%
10%
20%
30%
40%
50%
PolandSwedenSpainUKFranceGermany
Source: Eurostat Labour Market Database (Eurostat 2014a) Note: Higher-level qualifications are short-cycle tertiary, bachelor or equivalent, master or equivalent and doctoral or equivalent level of education, or ISCO levels 5–8.
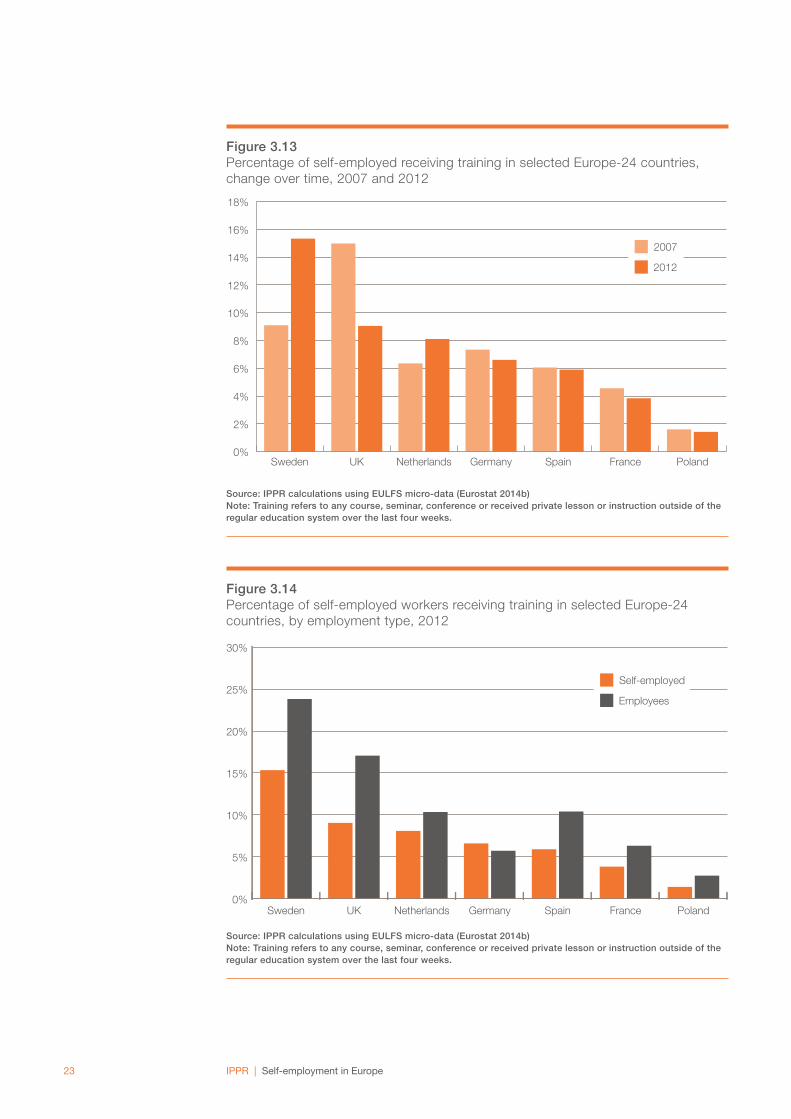
3.7 TrainingAccess to training and development is a big challenge for self-employed workers. Figure 3.13 shows that, in the UK, there has been a sharp fall of six percentage points since 2007 in the proportion of self-employed workers who have had training in the last four weeks.
In Sweden, the proportion of self-employed workers receiving training has increased by six percentage points between 2007 and 2012. Several measures have been adopted there to foster entrepreneurship among women and immigrants, including the introduction of advisory services, training advisers and mentor programmes, individually tailored guidance to non-native speakers who would like to set up a business, and help for established businesses to develop their companies (EEOR 2010).
Previous analysis shows that Sweden saw an increase of eight percentage points in the proportion of the working-age population receiving training between 2007 and 2012 (see Dolphin et al 2014). In the UK, the same figure fell by four percentage points, suggesting that the trends shown in figure 3.13 may reflect the different priorities of European governments with regard to in-work training and education.
IPPR | Self-employment in Europe23
Figure 3.13Percentage of self-employed receiving training in selected Europe-24 countries, change over time, 2007 and 2012
0%
2%
4%
6%
8%
10%
12%
14%
16%
18%
PolandFranceSpainGermanyNetherlandsUKSweden
2007
2012
Source: IPPR calculations using EULFS micro-data (Eurostat 2014b) Note: Training refers to any course, seminar, conference or received private lesson or instruction outside of the regular education system over the last four weeks.
Figure 3.14Percentage of self-employed workers receiving training in selected Europe-24 countries, by employment type, 2012
0%
5%
10%
15%
20%
25%
30%
PolandFranceSpainGermanyNetherlandsUKSweden
Self-employed
Employees
Source: IPPR calculations using EULFS micro-data (Eurostat 2014b) Note: Training refers to any course, seminar, conference or received private lesson or instruction outside of the regular education system over the last four weeks.

IPPR | Self-employment in Europe24
In the UK, 17 per cent of employees received taught learning activities, compared to just 9 per cent of self-employed workers. In every country except Germany employees were more likely to receive training than the self-employed. Given the compositional change towards self-employment in countries such as the UK and the Netherlands, limited access to training could become a real concern for self-employed workers and contribute to the problem of low pay and poor progression rates for self-employed workers and across the labour market more widely.
3.8 OccupationThe distribution of occupations among the self-employed gives an indication of their relative skill-level in different countries. The largest occupational group in the UK is professionals, who make up 24 per cent of British self-employed workers, followed by craft and related trades workers at 22 per cent.
Figure 3.15Occupational distribution of self-employment in selected Europe-24 countries, 2013
Elementary occupations
Service & sales workers
Plant & machine operators, & assemblers
Craft & related trades workers
Skilled agricultural, forestry & fishery workers
Clerical support workers
Technicians & associateprofessionals
Professionals
Managers
0%
10%
20%
30%
40%
50%
60%
70%
80%
90%
100%
PolandGermanySwedenFranceUKNetherlandsSpain
Source: Eurostat Labour Market Database (Eurostat 2014a) Note: Skill levels have been grouped by occupation as follows: High-skill: managers, professionals, and technicians and associate professionals Mid-skill: clerical support workers, skilled agricultural, forestry and fishery workers, craft and related trades workers and plant and machine operators, and assemblers Low-skill: service and sales workers and elementary occupations.
In the UK, 46 per cent of self-employed workers belong to a highly skilled occupation, while 36 per cent are mid-skilled and the remaining 19 per cent are in low-skilled occupations.
Northern European economies, such as the Netherlands, Germany and Sweden, tend to have a higher proportion of highly skilled self-employed workers and a

IPPR | Self-employment in Europe25
smaller number of self-employed workers in mid-skill occupations, such as plant and machine operators, and assemblers or clerical support workers.
Contrary to this, south/eastern European economies are more likely to have a larger proportion of self-employed workers in low- or mid-skilled occupations. Spain, for example, has a very large service and sales sector, accounting for 29 per cent of all Spanish self-employed workers, while in Poland 41 per cent of self-employed workers are in the skilled agricultural, forestry and fishery workers occupational group.
Differences in the occupational distribution of the self-employed may simply reflect differences in the overall structure of occupations in the economy, so we have compared the proportion of self-employed workers with the proportion of employees in each occupational group (see table A1.1 in the appendix). In the six countries for which we drew this comparison, a greater proportion of self-employed workers were in the following occupational groups in every country: managers, and skilled agricultural, forestry and fishery workers.
3.9 IndustryThe industries in which the self-employed work vary substantially across Europe (see figure 3.16). In the UK, the largest proportion work in the construction industry, followed closely by the wholesale and retail trade, transportation and storage, accommodation and food services sector and the professional, scientific, technical, administration and support service activities sector. Relatively few self-employed people work in the agriculture, forestry and fishing industries – just 3 per cent, which contrasts markedly with, for example, Poland’s 42 per cent. Spain has the largest proportion of self-employed in the wholesale and retail industry (as noted below, this is a significant characteristic of Spanish self-employment). By industry, the UK and Germany have very similar distributions of self-employed workers.
As with occupational categories, we compared the proportion of self-employed workers and total employment in each industry to see whether the industrial composition of the workforce represents general patterns within the national labour market or if the industrial composition of the self-employed workforce is different (see table A1.2 in the appendix). In the six countries we examined the following sectors had higher proportions of self-employed workers than total employment in every country:
• agriculture, forestry and fishing
• construction
• professional, scientific, technical, administration and support service activities
• other services.
Also, in Spain, a significantly greater proportion of self-employed workers are in the wholesale and retail industry. In general, the development of information and communication technologies has also allowed freelancing to expand into more sectors (Pedersini and Coletto 2010).

IPPR | Self-employment in Europe26
Figure 3.16Industry distribution of the self-employed in selected Europe-24 countries, 2013
0% 10% 20% 30% 40% 50% 60% 70% 80% 90% 100%
Poland
France
Spain
Sweden
Netherlands
Germany
UK
Agriculture, forestry & fishing
Manufacturing, mining & quarrying & other industry
Construction
Wholesale & retail trade, transportation & storage, accommodation & food storage activities
Information & communication
Financial & insurance activities
Real estate activities
Professional, scientific, technical, administration & support service activitiesPublic administration, defence, education, human health & social work activities
Other services
Source: Eurostat Labour Market Database (Eurostat 2014a)

IPPR | Self-employment in Europe27
4. THE QUALITY OF SELF-EMPLOYED WORK
Self-employment has long been considered a way for workers to take control of their work-life balance, allowing room for greater flexibility, autonomy and creativity in the way individuals work. The concern in the UK surrounding the recent rise in self-employment, however, is that some work may be insecure and low-paid – self-employed workers don’t always have basic employment rights, and analysis suggests that in the UK the earnings of the self-employed may have fallen by as much as a fifth between 2006 and 2012 (D’Arcy and Gardiner 2014). There is a very real concern that the self-employment figures may be concealing workers who have been forced to go it alone by a lack of viable alternatives – these are the ‘hidden unemployed’, with no real desire to take on the challenges of self-employment, and enjoying few if any of its potential benefits.
4.1 Job satisfactionTraditionally, self-employed workers have enjoyed the dividends of being their own boss – greater freedom and flexibility over their own work. Thus self-employed workers have typically reported very high levels of satisfaction with their work. The European Social Survey reveals evidence which supports this: in 2010, 37 per cent of self-employed workers in Europe rated their job satisfaction as a 9 or 10, on a scale of zero to 10. This compares with just 26 per cent of those in employee jobs.
Figure 4.1Self-employed and employee level of satisfaction in main job, Europe-27, 2010
0%
5%
10%
15%
20%
25%
30%
109876543210(extremely dissatisfied) (extremely satisfied)
Self-employed
Employed
Source: European Social Survey (ESS 2010) Note: Europe-27 refers to the Europe-24 with the inclusion of Bulgaria, Cyprus, Croatia, Israel, Lithuania, the Russian Federation and Ukraine, and the exclusion of Austria, Iceland, Italy and Luxembourg.

IPPR | Self-employment in Europe28
As figure 4.1 shows, there are relatively few workers – self-employed or otherwise – who are extremely dissatisfied with their main job. Employees, on the other hand, tend to be more likely than self-employed workers to report middling levels of satisfaction (rated 2–8 on the scale).
Just over three in five self-employed workers (61 per cent) agreed or agreed strongly with the statement ‘I would enjoy working in my current job even if I did not need the money’; only 45 per cent of employees said the same (ESS 2010). This suggests that there are significant advantages to self-employment beyond financial reward. Self-employed workers are often able to manage their own time, allowing them to manage their own work-life balance. They can also take advantage of working from home, removing the stress of commuting from their daily routine.
In a 2009 Eurobarometer survey, 45 per cent of EU citizens stated a preference for being self-employed, while 49 per cent preferred to work as an employee (Flash Eurobarometer 2009). Those who preferred self-employment cited greater freedoms, such as personal independence, self-fulfillment and the chance to do something of personal interest, as well as the ability to choose their own place and time of work. Those preferring employee jobs noted the stability of employment and a regular, fixed income.
4.2 Resilience and adaptabilityDuring the economic recession, many businesses faced a fall in demand for their goods and services. For the self-employed, this often translates to a reduction in their working hours. In some respects, this is an advantage for the self-employed – during periods of low demand, they can scale back and hopefully ride out a downturn on lower earnings until demand returns. Employees in businesses facing the same challenges are often faced with the risk of redundancy and unemployment.
Obviously, however, this does not mean that the self-employed are unaffected by a lack of demand. It is often the case that self-employed workers would like more work and to bring in a greater income, and they are forced against their will to reduce income and output during a downturn. Underemployment6 among self-employed workers grew by three percentage points between 2007 and 2012, although it is still less common than for employees (Dolphin et al 2014).
4.3 EarningsAnalysis by the Resolution Foundation has shown that weekly self-employed earnings in the UK were 20 per cent lower in 2011/12 than in 2006/07. Extending this analysis to five more European countries allows us to compare the collapse of self-employed earnings in the UK to the changes in earnings in other countries (D’Arcy and Gardiner 2014).
The earnings of self-employed workers tend to be more volatile than the earnings of employees. In part, this illustrates the greater resilience of self-employed workers during a downturn, as we have discussed. However, self-employed workers are not guaranteed a national or sectoral minimum wage, unlike employees in most European countries, and may even have a negative income in the early stages of setting up or when their business is performing poorly. Furthermore, self-employed workers are much less likely to have contributed to a national pension than employees (see section 3.1), and often don’t have access to the same employment rights as employees. For these reasons, self-employed workers are at greater risk of financial insecurity than their employee counterparts.
6 That is, those who report they would like to work more hours.

IPPR | Self-employment in Europe29
Figure 4.2 shows the change in the median gross weekly earnings of the self-employed, expressed as a proportion of the median employee’s gross weekly earnings. That is, it shows how much of the median employee’s wage a median self-employed worker earns. We have used this ratio in order to be able to compare incomes between European countries.
Figure 4.2Change in median gross weekly earnings of the self-employed as a proportion of median employee earnings in selected Europe-24 countries, 2005–2011
0%
20%
40%
60%
80%
100%
120%
2011201020092008200720062005
Poland
Spain
Netherlands
UK
France
Germany
Source: IPPR calculations using the European Union Statistics on Income and Living Conditions (EUSILC 2012)
The chart confirms that in the UK the relative position of self-employed worker’s earnings has weakened. A median self-employed worker now earns 55 per cent of what the median employee earns, a fall of 22 percentage points since 2007.
Of the countries in our study for which there was available data, France has seen the sharpest relative fall in the relative earnings of the self-employed. However, uniquely among this group of countries, in France the median self-employed worker was actually earning 17 per cent more than the median employee in 2007. In the other featured countries, self-employed workers earned less than employees even before the recession.
In Germany, the earnings of the median self-employed worker dipped to 54 per cent of the median employee’s earnings in 2009, but have since been increasing slowly, so that the most recent data (for 2011) shows that the median self-employed worker now earns a slightly higher share of the median employee wage than in the UK.
More generally, the fact that employee earnings growth has been poor through this period gives added significance to this fall in self-employed earnings relative to employee earnings. While over the long run self-employed earnings are usually poorer than employee earnings, the recent trend may indicate a significant fall in living standards for the self-employed, and in countries such as the UK, which have seen a marked rise in the proportion of self-employed workers, this may have serious implications.

IPPR | Self-employment in Europe30
It is worth noting, however, that the labour market resilience of self-employed workers, mentioned earlier in this chapter, means that each self-employed worker who earns less drags down the median value, whereas in the case of employees the median earnings value is not dragged down when an employee becomes unemployed. In terms of median earnings, the effects of economic downturn are not the same for employee and self-employed groups.
4.4 UnderemploymentFigure 4.3 shows the proportion of self-employed workers who were looking for another job in 2007 and in 2012. In the UK, the percentage looking for another job has almost doubled to 6 per cent over this period, and the same has been seen, to a lesser extent, in Spain, the Netherlands, Sweden and France. Some of the workers who became self-employed or remained in self-employment throughout the downturn may now be looking to find an employee job.
Figure 4.3Percentage of self-employed workers looking for another job in selected Europe-24 countries, 2007 and 2012
0%
1%
2%
3%
4%
5%
6%
7%
FrancePolandGermanySwedenNetherlandsSpainUK
2007
2012
Source: IPPR calculations using EULFS micro-data (Eurostat 2014b)
By contrast, Germany and Poland have seen a decrease in the proportion of self-employed workers looking for another job; in Poland the percentage has almost halved. Germany and Poland did not see a rise in self-employment over this period, so there are numerically fewer self-employed workers looking for another job. Nonetheless, self-employed workers in all of these countries are less likely to be looking for another job than employees are; in the UK, for example, over 8 per cent of employees are looking for another job, while less than 6 per cent of self-employed workers are (Eurostat 2014b).
In the UK, by far the most common reason for self-employed workers looking for another job was ‘seeking an additional job to add more hours’. This reason was given by 48 per cent of self-employed workers, compared to just 12 per cent of employees, which suggests that underemployment is a significant problem for those working for themselves. On the other hand, ‘risk or certainty of loss of present job’ is much less of a problem for self-employed workers than for employees, perhaps supporting the idea that the self-employed have the ability to be more resilient during difficult labour market conditions.

IPPR | Self-employment in Europe31
Table 4.1Reasons for looking for another job in the UK, 2011
Person is looking for another job because: Self-employed Employees
of risk or certainty of loss or termination of present job
9% 19%
actual job is considered as a transitional job
7% 6%
seeking an additional job to add more hours to those worked in present job
48% 12%
seeking a job with more hours worked than in present job
6% 11%
seeking a job with less hours worked than in present job
5% 3%
of wish to have better working conditions (eg pay, working or travel time, quality of work)
15% 39%
of other reasons 10% 8%
Source: IPPR calculations using EULFS micro-data (Eurostat 2014b)
Strikingly, 39 per cent of employees cited a ‘wish to have better working conditions (eg pay, working or travel time, quality of work)’ as the reason for looking for another job, compared to only 15 per cent of self-employed workers. This supports the conclusion (in section 4.1) that many self-employed workers are very satisfied with their labour market status, and that the key driver to look for more work is the desire to work more hours.
Figure 4.4Percentage of self-employed wishing to work more hours in selected Europe-24 countries, 2007 and 2012
0%
2%
4%
6%
8%
10%
12%
14%
SwedenPolandGermanyFranceSpainUKNetherlands
2007
2012
Source: IPPR calculations using EULFS micro-data (Eurostat 2014b)

IPPR | Self-employment in Europe32
In 2012, around 11 per cent of British self-employed workers wanted more hours, compared to around 8 per cent in 2007. This growth fits well with what we would expect to happen to self-employed workers during an economic downturn. Self-employed workers have greater resilience to labour market shocks and during the recession were able to reduce hours when employees may have been losing their jobs altogether. The self-employment exit rate fell during the same period, which reinforces this conclusion. The fall in earnings experienced by the self-employed in the last five years means it is natural that the UK self-employed would like to work more hours to make up the difference.
In the UK, a lower proportion of employees are looking for more hours than self-employed workers. This is also the case in the Netherlands, but the opposite is true in Spain, France, Germany, Poland and Sweden, where employees (amid jobs growth dominated by part-time or insecure work) are far more likely to be seeking more hours than the self-employed.
4.5 ‘Bogus’ self-employmentIn the UK, there is increasing suspicion that many self-employed workers are effectively employees by another name. ‘Bogus’ or ‘false’ self-employment refers to the phenomenon of workers who would usually meet the legal definition of an employee but instead are registered as self-employed. Measuring the number of self-employed workers in this position across Europe is extremely difficult, but this is of particular concern in the UK construction industry, where some estimates have put ‘false’ self-employment at between 375,000 and 433,000 workers (Harvey and Behling, no date).
One imperfect indicator of the level of bogus self-employment is to consider the level of dependent self-employed workers (DSEWs). The OECD Employment Outlook (2014) defines DSEWs as ‘independent contractors with no employees, who either autonomously produce and sell goods or engage with their clients in contract for services, regulated by commercial law, with limited autonomy and often closely integrated into its organisational structure’. In the UK nearly 1 per cent of dependent workers are DSEWs.

IPPR | Self-employment in Europe33
5. CONCLUSIONS: SUPPORTING LIVING STANDARDS AND QUALITY OF WORK AMONG THE SELF-EMPLOYED
This report has given an overview of self-employment in Europe, finding it to be an important part of the labour market. The UK is something of an outlier, with regards to the rapid rise in the self-employment rate driving its overall growth in total employment. While self-employment is high in southern and eastern Europe, the jobs recovery has not started there – and while employment is growing in northern and western European economies, they have not seen a similar rise in the proportion of self-employed workers.
Across Europe, however, self-employment is a significant source of jobs – both for those who struggle to access employee jobs, as well as those requiring a greater degree of control over when and where they work. Self-employment and entrepreneurship have been identified as key drivers of economic growth too. However, the living standards of self-employed workers appear to have fallen further than for employees.
Policymakers need to consider self-employment carefully in order to help support economic growth, as well as the living standards of this group. This is particularly relevant in the UK, where self-employment has become a greater part of the labour market since the recession. Self-employment can present a route to the labour market for disadvantaged groups, but it should be presented as part of a range of options for those looking for work, rather than a catch-all solution.
The significance of self-employment in Europe means that policymakers need to confront some of the many challenges faced by the self-employed, including access to training, pensions and in-work benefits.
The self-employed are integral to the European labour market, but to sustain a strong jobs recovery we need to focus on supporting the living standards and quality of work of the self-employed. If self-employment is to be a key driver of economic growth then we need the living standards of the self-employed to rise with the quantity.

IPPR | Self-employment in Europe34
REFERENCES
Banks J, Crawford R, Crossley T and Emmerson C (2012) ‘The effect of the financial crisis on older households in England’, IFS working paper W12/09, Institute for Fiscal Studies. http://www.ifs.org.uk/wps/wp1209.pdf
Ben-Galim D and Silim A (2013) The sandwich generation: Older women balancing work and care, IPPR. http://www.ippr.org/publications/the-sandwich-generation-older-women-balancing-work-and-care
Barnes H (2013) ‘Work advisers ‘pushing jobless into self-employment’, BBC News website, 3 February 2013. http://www.bbc.co.uk/news/uk-politics-21260331
Carrasco R and Ejrnæs M (2012) ‘Labor market conditions and self-employment: a Denmark-Spain comparison’, IZA Journal of Labor Policy, 1(13): 1–16. http://www.izajolp.com/content/pdf/2193-9004-1-13.pdf
Clark T (2014a) ‘Self-employment surge across UK hides real story behind upbeat jobs figures’, Guardian, 6 May 2014. http://www.theguardian.com/society/2014/may/06/self-employment-uk-job-figures-analysis
Clark T (2014b) ‘Unwilling freelancers give the lie to unemployment statistics’, Guardian, 28 October 2014. http://www.theguardian.com/society/2014/oct/28/unwilling-freelancers-lie-unemployment-statistics
D’Arcy C and Gardiner L (2014) Just the job – or a working compromise? Resolution Foundation. http://www.resolutionfoundation.org/publications/just-the-job-or-a-working-compromise-the-changing-nature-of-self-employment/
Dolphin T, Gottfried G, Raikes L, Silim A and Thompson S (2014) European jobs and skills: A comprehensive review, 2014, IPPR. http://www.ippr.org/publications/european-jobs-and-skills-a-comprehensive-review,-2014
Eurostat (2014a) ‘Eurostat Labour Market Database’, accessed 15 December 2014. http://ec.europa.eu/eurostat/data/database
Eurostat (2014b) ‘EU Labour Force Survey [EULFS]’, micro-data database, accessed 15 December 2014. http://epp.eurostat.ec.europa.eu/portal/page/portal/microdata/lfs
European Employment Observatory Review [EEOR] (2010) ‘Self-employment in Europe’, European Commission. http://ec.europa.eu/social/main.jsp?catId=738&langId=en&pubId=576
European Social Survey [ESS] (2010) ‘Round 5 Data, edition 3.1’, Norwegian Social Science Data Services. http://nesstar.ess.nsd.uib.no/webview/index.jsp?v=2&submode=abstract&study=http%3A%2F%2F129.177.90.83%3A80%2Fobj%2FfStudy%2FESS5e03.2&mode=documentation&top=yes
Fisher L (2014) ‘Many ‘self-employed’ women get by on less than £10,000 a year’, Guardian, 8 March 2014. http://www.theguardian.com/society/2014/mar/08/women-self-employed-gender-pay-gap-jobs
Flash Eurobarometer (2009) ‘Entrepreneurship in the EU and beyond’, Flash Eurobarometer 283, European Commission. http://ec.europa.eu/public_opinion/flash/fl_283_en.pdf
Harvey M and Behling F (no date) The Evasion Economy: False Self-employment in the UK Construction Industry, UCATT. http://ucatt.infobo.co.uk/sites/default/files/uploaded/publications/Evasion-Economy-UCATT.pdf

IPPR | Self-employment in Europe35
Kangasniemi M and Kauhanen M (2013) ‘Characteristics and labour market performance of the new member state immigrants in Finland, Germany, the Netherlands and the United Kingdom after the enlargement of 2004’, discussion paper no 2013-02, Norface Migration. http://www.norface-migration.org/publ_uploads/NDP_02_13.pdf
OECD (2013) Pensions at a Glance 2013: OECD and G20 indicators, OECD Publishing. http://www.oecd.org/pensions/public-pensions/OECDPensionsAtAGlance2013.pdf
Office for National Statistics [ONS] (2014) Self-employed workers in the UK, 2014, statistical release. http://www.ons.gov.uk/ons/rel/lmac/self-employed-workers-in-the-uk/2014/index.html
Packard T, Koettl J and Montenegro CE (2012) In from the Shadow: Integrating Europe’s Informal Labor, World Bank. https://openknowledge.worldbank.org/bitstream/handle/10986/9377/706020PUB0EPI0067902B09780821395493.pdf?sequence=1
Pedersini R and Coletto D (2010) Self-employed workers: industrial relations and working condition, European Foundation for the Improvement of Living and Working Conditions. http://eurofound.europa.eu/sites/default/files/ef_files/docs/comparative/tn0 801018s/tn0801018s.pdf
Silim A (2013) Job Creation: Lessons from Abroad, Trades Union Congress [TUC]. http://www.tuc.org.uk/economic-issues/touchstone-pamphlets/job-creation-lessons-abroad-touchstone-extras-pamphlet
Swinson S (2014) ‘Benefit cuts creating new generation of entrepreneurs, Bank of England suggests’, Telegraph, 23 April 2014. http://www.telegraph.co.uk/news/politics/conservative/10783556/Benefit-cuts-creating-new-generation-of-entrepreneurs-Bank-of-England-suggests.html
Weinkopf C (2014) Germany: Precarious employment and the rise of mini-jobs, University of Duisburg-Essen. http://www.researchgate.net/publication/261358207_Germany_Precarious_employment_and_the_rise_of_mini-jobs
IPPR | Self-employment in Europe36
APPENDIX: TOTAL EMPLOYMENT AND SELF-EMPLOYMENT BY OCCUPATION AND INDUSTRY
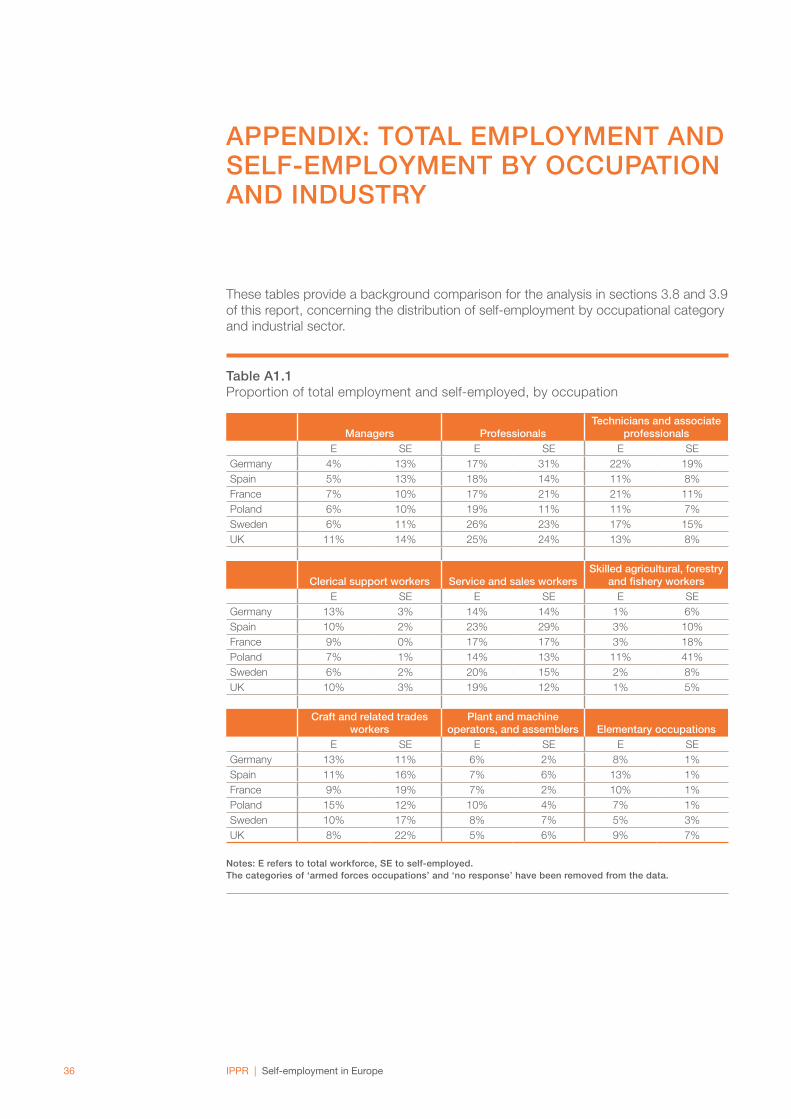
These tables provide a background comparison for the analysis in sections 3.8 and 3.9 of this report, concerning the distribution of self-employment by occupational category and industrial sector.
Table A1.1 Proportion of total employment and self-employed, by occupation
Managers ProfessionalsTechnicians and associate
professionalsE SE E SE E SE
Germany 4% 13% 17% 31% 22% 19%Spain 5% 13% 18% 14% 11% 8%France 7% 10% 17% 21% 21% 11%Poland 6% 10% 19% 11% 11% 7%Sweden 6% 11% 26% 23% 17% 15%UK 11% 14% 25% 24% 13% 8%
Clerical support workers Service and sales workersSkilled agricultural, forestry
and fishery workersE SE E SE E SE
Germany 13% 3% 14% 14% 1% 6%Spain 10% 2% 23% 29% 3% 10%France 9% 0% 17% 17% 3% 18%Poland 7% 1% 14% 13% 11% 41%Sweden 6% 2% 20% 15% 2% 8%UK 10% 3% 19% 12% 1% 5%
Craft and related trades workers
Plant and machine operators, and assemblers Elementary occupations
E SE E SE E SEGermany 13% 11% 6% 2% 8% 1%Spain 11% 16% 7% 6% 13% 1%France 9% 19% 7% 2% 10% 1%Poland 15% 12% 10% 4% 7% 1%Sweden 10% 17% 8% 7% 5% 3%UK 8% 22% 5% 6% 9% 7%
Notes: E refers to total workforce, SE to self-employed. The categories of ‘armed forces occupations’ and ‘no response’ have been removed from the data.

IPPR | Self-employment in Europe37
Table A1.2 Proportion of total employment and self-employed, by industry
Agriculture, forestry and
fishing
Manufacturing, mining and
quarrying and other industry Construction
Wholesale and retail trade,
transportation and storage,
accommodation and food service
activitiesInformation and communication
E SE E SE E SE E SE E SE
Germany 1% 5% 22% 8% 7% 12% 23% 22% 3% 5%
Spain 4% 10% 15% 8% 6% 11% 30% 41% 3% 2%
France 3% 17% 15% 6% 7% 13% 22% 23% 3% 2%
Poland 12% 42% 23% 7% 7% 10% 22% 23% 2% 2%
Sweden 2% 9% 13% 7% 7% 14% 20% 24% 4% 6%
UK 1% 3% 12% 6% 7% 22% 23% 19% 4% 5%
Financial and insurance activities
Real estate activities
Professional, scientific, technical,
administration and support
service activities
Public administration,
defence, education,
human health and social work
activities Other servicesE SE E SE E SE E SE E SE
Germany 3% 3% 1% 1% 10% 20% 28% 18% 3% 6%
Spain 3% 1% 1% 1% 11% 13% 26% 7% 3% 5%
France 3% 2% 1% 2% 9% 12% 33% 17% 3% 6%
Poland 2% 2% 1% 1% 6% 7% 22% 5% 2% 3%
Sweden 2% 1% 1% 2% 13% 20% 35% 10% 3% 7%
UK 4% 2% 1% 1% 11% 19% 33% 17% 3% 6%
Notes: E refers to total workforce, SE to self-employed. The categories of ‘armed forces occupations’ and ‘no response’ have been removed from the data.