Embed Size (px)
Citation preview

Self-Liquidating Sales Funnel for a
Cloud Manufacturer
Major Qualifying Project Submitted to the Faculty of
Worcester Polytechnic Institute
In Partial Fulfillment of the Requirement for the Degree of Bachelor of Science
Submitted by: Chase Flibbert
Project Advisors: Walter Towner PhD MBA
Shari Worthington PhD MBA
Date: April 24, 2019

2
Table of Contents
Contents Table of Contents .......................................................................................................................................... 2
Table of Figures ............................................................................................................................................. 3
Acknowledgements ....................................................................................................................................... 4
Abstract ......................................................................................................................................................... 5
Chapter 1: Introduction ................................................................................................................................ 6
1.1 Sponsor ............................................................................................................................................... 6
1.2 Problem Statement ............................................................................................................................. 7
1.3 Project Goals and Objectives .............................................................................................................. 7
Chapter 2- Background ................................................................................................................................. 9
2.1 Digital Marketing ................................................................................................................................. 9
2.1.1 Consumer Behavior .......................................................................................................................... 9
2.1.2 Rising Use of Digital Marketing ...................................................................................................... 10
2.1.3 Digital Marketing Channels ............................................................................................................ 11
2.1.4 Digital Inbound Marketing ............................................................................................................. 11
2.2 Cloud Manufacturing ........................................................................................................................ 12
2.3 Sales Funnels ..................................................................................................................................... 13
2.3.1 Digital Sales funnels ....................................................................................................................... 13
2.3.2 Russell Brunson and Click Funnels ................................................................................................. 14
Chapter 3- Methods .................................................................................................................................... 15
3.1 Market Research ............................................................................................................................... 15
3.2 Click Funnels ...................................................................................................................................... 16
3.3 Financial Analysis .............................................................................................................................. 20
Chapter 4- Results ....................................................................................................................................... 21
4.1 Marketing Persona ............................................................................................................................ 21
4.2 Self Liquidating Sales Funnel ............................................................................................................. 22
4.3 Financial Analysis .............................................................................................................................. 27
Chapter 5- Conclusion ................................................................................................................................. 30
Bibliography ................................................................................................................................................ 31
3
Table of Figures
Figure 1: One Funnel Away Challenge Outlook (www.onefunnelaway.com 2019) ................................... 18
Figure 2: Advance Marketing Institute Headline Analyzer ......................................................................... 19
Figure 3: Marketing Personas Pt. 1 (Lee 2015) ........................................................................................... 22
Figure 4: Marketing Personas Pt. 2 (Lee 2015) ........................................................................................... 22
Figure 5: Facebook Targeted Advertisement .............................................................................................. 23
Figure 6: Audience Interest Selection ......................................................................................................... 23
Figure 7: Squeeze Page ............................................................................................................................... 24
Figure 8: Sales Page..................................................................................................................................... 25
Figure 9: Order Bump Page ......................................................................................................................... 25
Figure 10: One Time Offer Page .................................................................................................................. 26
Figure 11: Outreach Potential for Facebook Ads Campaign ....................................................................... 27
Figure 12:Estimated ad clicks, leads, revenues, and costs ......................................................................... 28
Figure 13: Cash Flow NPV Calculations ....................................................................................................... 29
Figure 14: Chart of Estimate Cash Flows..................................................................................................... 29

4
Acknowledgements
I would like to acknowledge the following individuals for making their contributions to the
overall success of this project.
First, I want to thank the sponsor for providing me this project opportunity and invaluable
learning experience. I greatly appreciate the wealth of time they dedicated to work with me on
this dense and challenging project.
I also want to give thanks to one of my project advisors, Professor Shari Worthington. Her
expertise in marketing was extraordinarily helpful and provided the necessary guidance for
completing the project.
Finally, I owe a debt of gratitude to my other project advisor, Professor Walter Towner. Without
his support and encouragement, the completion of this project would not have been possible.

5
Abstract
The overall objective of this MQP was to develop a self-liquidating sales funnel for a
Worcester based cloud manufacturing (CMfg) company. The rationale for the project included
the potential cost effectiveness of self-liquidating sales funnels to generate leads, the growing
market pull for online manufacturing services, and the ability to inform and educate customers
through content marketing and information products. A review of the state of the art provided no
evidence that CMfg companies are currently using self-liquidating sales funnels, but the use of
content marketing has been observed. The team enabled the implementation of the self-
liquidating sales funnels by performing market research, participating in Click Funnels SLSF
building webinar, and running a financial analysis on Facebook advertisement spending. The
results of the methods provided us with marketing personas of our customer segments, a new
sales funnel design incorporating information products, high-value targeted-offers, and offer
sequencing, and a cost benefit analysis for Facebook ads spending. The implementation of the
self-liquidating sales funnel could prove beneficial for our sponsor as well as other ecommerce
companies, engaging in a new style of marketing strategy that trades information products to
customers for lead information while also providing the customer with several sales
opportunities could be an effective use of company resource.

6
Chapter 1: Introduction
1.1 Sponsor The sponsor is a cloud manufacturing service, the company offers waterjet cutting as well
as traditional milling, turning, grinding, 3D printing, and other custom operations, all through the
company’s website. While they are offer manufacturing services, they own no manufacturing
equipment, this is because the sponsor acts as a middleman between their customers and
partnered manufacturing job shops, facilitating the interaction between the two parties. The
sponsor is currently partnered with over 70 machine shops around the U.S., allowing them to
provide their services to customers around the nation quickly, and efficiently. The sponsor
interacts with customers, processing orders, providing engineering support and logistic
information, while the actual manufacturing operations are offloaded onto partnered machine
shops.
As a tech company in the ecommerce space, the sponsor has relied on “pay-per-click”
(PPC) targeted internet advertisements to draw in business. Using Facebook ads, they saw
moderate success in acquiring customers, placing ads on specific Facebook pages of customer
interest. However, most of their orders have been small in quantity and one-time orders from
customers seeking prototypes. They were also experiencing a large percentage of abandoned
carts, meaning customers either uploaded a part and failed to submit it for a quote or they
received a quote and did continue to place an order. In hopes of increasing the number of orders
received, quantity of parts per order, and decreasing the percentage of cart abandonment, the
sponsor desires to educate customers and make them better engineers.

7
1.2 Problem Statement With the growing popularity of ecommerce solutions, it is becoming more difficult and
expensive for small online companies to increase brand awareness, including those in CMfg. Pay
per click advertising, a staple marketing strategy for ecommerce stores, is continuing to grow in
popularity. As the demand for PPC services increases, so has the cost associated with using this
form of advertisement. From 2010 to 2016, the “cost per click” nearly doubled, increasing from
an average price of $1.24 to $2.14, and the “cost per conversion” almost tripled, going from
$13.14 in 2010, to an average price of $33.00 in 2016 (Hochman 2017). As the cost of online
advertisements continues to increase, small online business is forced to adapt in order to make
the most out of their advertising budget as they compete for market share with larger more
resourceful companies. In 2014, Russell Brunson introduced his start up Click Funnels™,
offering online businesses a strategy for generating customer leads, while also increasing
customer conversion rates. By utilizing social media presence, content marketing, offer building
and sequencing, small companies are given the chance to make revenue during the process of
lead generation. This project aims to implement Russell’s “self-liquidating sales funnel” into a
Cloud Manufacturing service’s website.
1.3 Project Goals and Objectives The overall goal of this project was to produce a new, lead generating sales funnel that
has the potential to offset advertising costs through sales opportunities. The MQP team
conducted market research in order to identify the demographics of our potential customer
segments, as well as their motivations and incentives. The team and sponsor were able to identify
plausible products and benefits to sell within the sales funnel. A financial analysis based on
advertising costs and plausible funnel sales was performed in order to determine a cost effective
PPC ad campaign. Three project deliverables were provided to the sponsor:

8
1. Identify our customer segments by developing marketing personas, capturing their
demographics, motivations and incentives.
2. Build and sequence the offers we want to make within the self-liquidating sales funnel by
analyzing current best practices as well as the wants and needs of our customer segments.
3. Produce a financial analysis on the profitability of the sales funnel

9
Chapter 2- Background
2.1 Digital Marketing
As the internet becomes more of an integral part of modern life and society, digital
marketing is becoming one of the most widely used tools by ecommerce, traditional, and hybrid
businesses alike to market their products and services to potential customers. Businesses are
spending less money on traditional forms of marketing in order to increase their investments in
digital marketing channels (The CMO Survey 2018). Digital marketing channels include email,
social media, affiliates, search engines, and display advertising. Emerging strategies are
increasing the effectiveness observed within these digital channels, as online shoppers are
looking for more engaging consumer experiences than that of what one-way communication
strategies provide (Truong, Simmons 2010).
2.1.1 Consumer Behavior Business to business customers are spending more time online now than ever, and the
trend is still increasing. In a report published by eMarketer, the average U.S. adult (age 18 and
over) was said to have spent approximately 343 minutes per day accessing digital media through
connected devices such as mobile phones, desktops, laptops, and other devices in 2016, and was
expected to increase by another 10 minutes in 2017(eMarketer 2017). In a report on the
frequency of internet usage by adults published in January 2018, 77% of Americans reported
daily internet use, 39% of 18-29-year old’s and 36% of 30-49-year old’s admit to being online
almost constantly (Perrin 2018). The widespread popularity of smartphones and other mobile
devices could offer some explanation. Out of all of those who use the internet, 80 percent of
them own smartphones (Chaffey 2017), and mobile usage per B2B worker is expected to
increase from two hours a day to three by 2020 (Google 2018). Out of all the time being spent
10
online, a large portion goes toward social medias. In 2017, the average amount of time spent by
users 18 and older on social media (Facebook, Snapchat, Instagram) was 91 minutes a day, and
is expected to continue increasing (eMarketer 2018).
More consumers are turning to the internet to make purchases as well. According to a
market forecast from Statista, the number of digital commerce customers in 2018 was almost 3.5
billion and is expected to grow to about 4.5 billion by 2023. With a consumer base of this size,
knowing how customers react to digital advertisements is critical when choosing a digital
marketing strategy. A 2010 study showed how its participants reacted poorly to intrusive digital
display advertisements, such as banner ads, pop-up ads, and video ads. In general, display
advertisements were seen as impersonal, one-way, and irrelevant (Truong, Simmons 2010).
However, companies still invest heavily in digital advertisements. In 2016 the U.S. total
advertising expenditure was $290.08 billion dollars (Hageman 2019), and approximately $57
billion of this was spent on digital advertising (Dentsu Aegis Network 2019).
2.1.2 Rising Use of Digital Marketing With the ease of access to digital marketing, and the wealth of information available on
the topic, it has never been easier for small businesses to implement cost effective digital
marketing strategies. In 2018, the leading marketing tactic for U.S. small businesses (of less than
500 employees) was the use of social media. 74.4 percent of small businesses surveyed reported
the use of social media in their marketing strategy (Bihnam 2019). In addition, companies like
Facebook and Google are offering pay-per-click advertising solutions, where advertisers only
pay when their advertisement is clicked on. This is an attractive service model, especially for
small companies that have never advertised before, now having the ability to invest as much as

11
they want at daily rates. From 2016 to 2018 the number of active Facebook advertisers doubled
from approximately 3 million to over 6 million (Facebook 2018).
2.1.3 Digital Marketing Channels Businesses have several choices when it comes to how they distribute their digital
marketing strategies. The various “channels”, or vehicles for distribution, each have their own
costs and benefits associated with them and can be used in conjunction with each other. Digital
marketing channels include one-way communication channels; company websites, email, and
display advertisements, and two-way communication channels; social media, affiliate marketers,
content publishing platforms, and company generated blogs & communities. Research has shown
more consumers respond better to two-way marketing channels, as it provides greater
opportunity for “one-to-one” engagement, the collaborative sharing of benefits between parties,
and mutual dialogues (Truong, Simmons 2010).
2.1.4 Digital Inbound Marketing Unlike the push-oriented nature of traditional marketing strategies, the digital inbound
marketing (DIM) concept focuses on an organic approach to attracting valuable prospects.
Interactivity and engagement drive DIM, this offers marketers the chance to build valuable
relationships and converse with customers interested in their products and services (Opreana,
Vinerean 2015). Digital content marketing (DCM) is a component of DIM, where marketers
create and distribute valuable, informative content focused on the nature of the product being
marketed. Search engines are a common starting point for the consumer’s online buying process,
companies can use search engine optimization (SEO) to improve their website’s visibility when
being searched by customers. Keywords, page optimization, content creation, and choosing
website links related to customer keywords all increase a website search relevancy. Social

12
networks provide companies with a platform for sharing content where customers can interact in
real time, increasing the perceived authenticity of the content (Opreana, Vinerean 2015).
2.2 Cloud Manufacturing As technology advances, so does the way we conduct business. Cloud manufacturing is
just one example of how advancements in web-based technology are allowing for more efficient
interactions between businesses and their customers. The National Institute for Standards and
Technology defines cloud manufacturing as ‘‘a model for enabling ubiquitous, convenient, on-
demand network access to a shared pool of configurable computing resources (e.g., networks,
servers, storage, applications, and services) that can be rapidly provisioned and released with
minimal management effort or service provider interaction.’’ Through the utilization of cloud
computing, the on-demand availability of computer resources (i.e. storage, computing power) via
internet connection, manufacturing services can now be completed entirely through web-based
interaction (Xu 2011).
Cloud manufacturing provides end-users with access to manufacturing resources and
capabilities through a web-based client, commonly known as a web browser (e.g. Google
Chrome, Microsoft Internet Explorer, Mozilla Firefox). Cloud manufacturing platforms are
typically owned and operated by third party agents who manage all customer interactions and
provide order details to partnered manufacturers (Balta, Lin, Barton, Tilbury, Mao 2018).
This framework provides an advantageous service model, allowing partnered
manufacturers to fill excess production capacity on otherwise unused equipment with orders
made directly from consumers. The customers receive several benefits including a high degree of
customization and the offloading of vendor qualification, inspection, and supply chain scaling

13
onto the manufacturers. Agents receive a small percentage of the total profit earned from order
partnered manufacturers complete (Ameri, Patil 2010).
2.3 Sales Funnels The sales funnel concept was initially described by E. St. Elmo Lewis in 1898 as a
process to improve performance in personal sales. His AIDA (Attention, Interest, Desire, Action)
model laid out the framework for building a customer’s motivation to purchase, and is composed
of the following four distinct stages (Rowley 1998);
1. Attention- customer becomes aware of the product
2. Interest- customer interest in product benefits develop
3. Desire- customer develops a wanting for product benefits
4. Action- customer takes the required action to purchase product
While Lewis’s model was focused on the improvement of personal selling, it was widely adopted
by marketing and advertising theorists throughout the 20th century and is still being used today.
Throughout the past century, the model has evolved, variations have been produced to examine
how new product introduction, product trials, repeat purchases and long term product satisfaction
can impact the Action stage, but these variations have not strayed away from the basic principles
of Lewis’s model (Stacks, Michaelson 2010).
2.3.1 Digital Sales funnels Online businesses, small and large, adopt sales funnel-based strategies for both product
and service-oriented selling. Even though variation exists in modern digital sales funnels, many
still display the basic concepts laid out by Lewis’s AIDA model (Hassan, Nadzim, Shiratuddin
2015).
Ecommerce businesses gain the attention of prospective customers using digital
marketing channels such as, but not excluded to, social media, advertisements, and affiliate

14
marketers. Prospects then display their interest by visiting a business’s website. Before a
customer leaves the website, it is imperative for a business to confirm a prospect’s interest by
extracting their contact information, most often an email address. Over 90% of people who leave
an ecommerce website without making a purchase will not visit the website for a second time
(Courday 2014). Because of the phenomenon, generating leads is one of the most important
aspects of the digital sales funnel. By directing prospects to a “landing page”, also known as a
“squeeze page”, ecommerce businesses provide a prospect with limited navigation options,
including the opportunity to receive something of value, typically an information product geared
toward educating the customer on the products and services the company provides in exchange
for their email address, and the chance to continue deeper into the website towards a sale
(Courday 2014). Desire is built through the educational product provided from the landing page,
additional email sequences, and the content of the company’s sales pages, social media, blogs
and other publishing platforms. Providing prospects free content that is “useful-but-incomplete-
information” with embedded links allowing them to be directed to a sales page, helps an
ecommerce company build toward a customer action, making an order (Courday 2014).
2.3.2 Russell Brunson and Click Funnels Russell Brunson is an American entrepreneur and founder of Click Funnels. He is
credited with the most recent popularization of digital sales funnels and sells training material
and software for creating self-liquidating sales funnels through his company. As of 2018,
Russell’s products have aided in creating over 206 millionaires who are in his exclusive 2
Comma Club, a group dedicated to ecommerce business owners who have built sales funnels
achieving over one million dollars in revenue (www.russellbrunson.com 2019).

15
Chapter 3- Methods
3.1 Market Research There were two objectives that needed to be accomplished through our market research.
1. Identify our competitors and common digital marketing tactics
2. Identify our customers and common motives and incentives
In order to complete the first objective, the team used the Google search engine to search
for businesses offering cloud manufacturing services. The terms used for our search include;
“CNC machining service”, “CNC on demand”, and “online CNC quote”. Using Google allowed
us to quickly identify possible competitors by noting which results were being promoted with
Google Ads. We followed the resulting links to each company’s home page, where we looked
for the cloud manufacturing services being provided.
With the competitor list we gathered, we searched their web addresses on the analytics
website Similarweb.com, this provided us with additional competitors through their
“Competitors & Similar Sites” function. Additionally, we collected information on competitor
web traffic including total website visits, bounce rate (percentage of visitors who navigate away
from the site after viewing only one page), traffic by country, and desktop traffic sources via
referrals, search engine results, social media, emails, and display advertising.
We visited competitor Facebook pages, specifically the “Info and Ads” section of their
pages, in order to identify current and prior advertisements and the content used to market cloud
manufacturing services. While examining these advertisements we identified the hooks, stories,
and offers used to attract potential customers.
The team continued to use competitor Facebook pages in order to gain perspective on
cloud manufacturing customers. By referring to the “Reviews” section of competitor pages, we

16
identified customers who have reviewed the service of competitor cloud manufacturers. We
collected information made publicly available by these customers from their personal Facebook
pages to use for marketing persona development. This information included gender,
employment, education, residing community, interests, and age. In addition to helping us identify
customers, analyzing customer reviews by finding common/recurring sources of complaints and
praise also provided us with insight on the wants and needs of CMfg customers.
The team collected information on customer interests and hobbies by visiting the
sponsor’s account on Instagram account where they post pictures of manufacturing processes and
parts they have made. The sponsor had over eight thousand Instagram followers during the time
of the project, the team went through their list of followers and identified personal accounts, as
opposed to business accounts which were easily identifiable due to the additional contact options
available on their account. When we visited customer profiles, if an account was set as a “private
account” we were only able to gather information from the account biography, which was often
very limited in information relative to interests and hobbies. When we examined public customer
profiles, we looked for similar subjects and topics of pictures being posted as well as public
figures and hashtags followed.
We used demographic segmentation in order to group our potential customers by
common demographic variables. The variables we relied on for segmentation included age,
gender, geographical location, income level, occupation and company size, education level, and
hobbies.
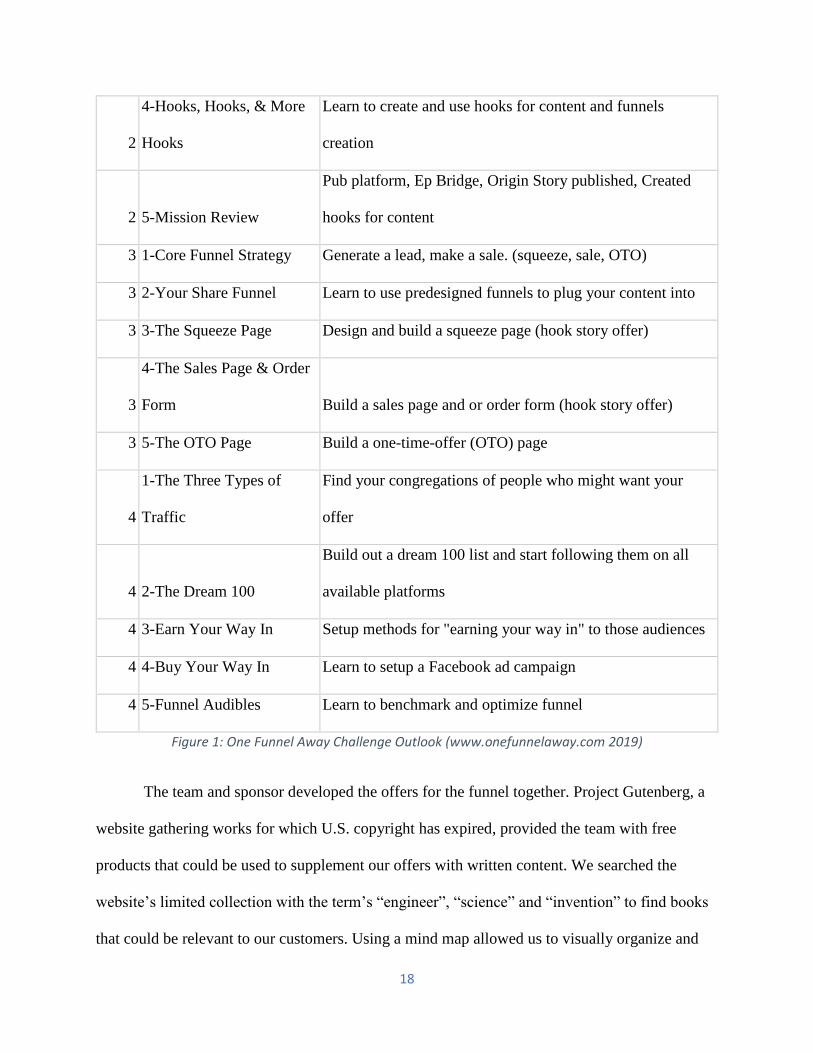
3.2 Click Funnels The team met with the sponsor Monday through Thursday in order to partake in a
training webinar by Click Funnels. Each installment of the series included a lesson on sales

17
funnel building as well as a “mission” to complete that tied in to the lesson. The webinar was
broken down into four weeks. Week one focused on creating the offers to be made in the funnel,
sequencing the offers in a logical order, and how to outsource the creation of information
products included in your offer. Week two focused on developing stories and hooks for content
marketing and sales funnel pages, we chose the publishing platforms to post content on, learned
a format for sales-centric stories, and created hooks based on these stories. Week three was on
building the design of each sales funnel webpage. Finally, week four focused on finding and
converting traffic to a funnel as well as benchmarking the success of a funnel, and how to
continue optimizing it. The following table lists the title and objective of each mission:
Week Mission Objective
1 1-Offer Hacking Identify Hook, Story and offer in competitor Facebook Ads
1 2-The Greatest Showman
Learn to Build practice offers by combining different
products
1 3-Offer Sequencing Create your own Offer & Offer Sequence in a Funnel Map
1
4-E Covers and Offer
Assets Find the Who to create the Offer Assets & eCovers
1 5-Create Find the Who to build the content in your offer pieces
2 1-Publishing
Learn how to utilize publishing platforms for content
creation
2 2-Epiphany Bridge Study the Epiphany Bridge Script
2 3-Your Origin Story Develop your own epiphany bridge script
18
2
4-Hooks, Hooks, & More
Hooks
Learn to create and use hooks for content and funnels
creation
2 5-Mission Review
Pub platform, Ep Bridge, Origin Story published, Created
hooks for content
3 1-Core Funnel Strategy Generate a lead, make a sale. (squeeze, sale, OTO)
3 2-Your Share Funnel Learn to use predesigned funnels to plug your content into
3 3-The Squeeze Page Design and build a squeeze page (hook story offer)
3
4-The Sales Page & Order
Form Build a sales page and or order form (hook story offer)
3 5-The OTO Page Build a one-time-offer (OTO) page
4
1-The Three Types of
Traffic
Find your congregations of people who might want your
offer
4 2-The Dream 100
Build out a dream 100 list and start following them on all
available platforms
4 3-Earn Your Way In Setup methods for "earning your way in" to those audiences
4 4-Buy Your Way In Learn to setup a Facebook ad campaign
4 5-Funnel Audibles Learn to benchmark and optimize funnel
Figure 1: One Funnel Away Challenge Outlook (www.onefunnelaway.com 2019)
The team and sponsor developed the offers for the funnel together. Project Gutenberg, a
website gathering works for which U.S. copyright has expired, provided the team with free
products that could be used to supplement our offers with written content. We searched the
website’s limited collection with the term’s “engineer”, “science” and “invention” to find books
that could be relevant to our customers. Using a mind map allowed us to visually organize and

19
rationalize our thought process. We brainstormed potential written, spoken, and physical
products, writing down every product we thought of and every relevant free press book we
found. Then, we made links between related products and the customer segments with a general
interest in them.
The sponsor took on the responsibility of creating the “story” aspects of the self-
liquidating sales funnel, this content would be posted on the social media websites; YouTube,
Facebook, and Instagram. The sponsor used the epiphany bridge script and origin story concept
as a basis for beginning content creation.
We utilized an Emotional Marketing Value Headline Analyzer from the Advanced
Marketing Institute to measure the emotional impact of our headlines. Sales are made by
Figure 2: Advance Marketing Institute Headline Analyzer

20
communicating with customers on a deep and emotional level. We wanted to ensure our
headlines would make emotional impacts on potential customers.
Facebook Ads were our primary method for driving traffic to our funnel, using its ability
to target customized audiences at a pay-per-click rate. We developed a “Dream 100” list, which
is a list of influencers, popular forums, social media accounts, and content publishing platforms
followed by our customer segments. This list helped us determine the types of interests we
targeted on Facebook, and who the sponsor could approach in the future as an attempt to drive
organic growth to their manufacturing services.
3.3 Financial Analysis The financial analysis interprets the implementation of the self-liquidating sales funnel
with estimated costs, net revenue, and net present value. Performing two different analyses
allowed the team to estimate the net present value of profitability for the funnel, as well as the
net present value of the leads generated.
In the profitability analysis, the estimated costs were made up of a onetime licensing fee
for Click Funnels web development software, the monthly Facebook pay-per-click advertising
campaign budget and the cost of goods sold. Net revenue is comprised of the sales made within
the funnel. Net present value was the difference between net revenue and the estimated expenses,
set to a discounted rate to account for the “time value of money”.

21
Chapter 4- Results
4.1 Marketing Persona
Using the information, we gathered from our market research on potential and existing
cloud manufacturing customer demographics, hobbies and interests, as well as the customer
segmentation we performed, the team developed several marketing personas. These personas
were meant to provide us with a semi-fictional representation of the ideal customer from each
segment based on their demographics, goals, challenges, values, and fears.
Figure 3: Marketing Personas Pt. 1 (Lee 2015)
22
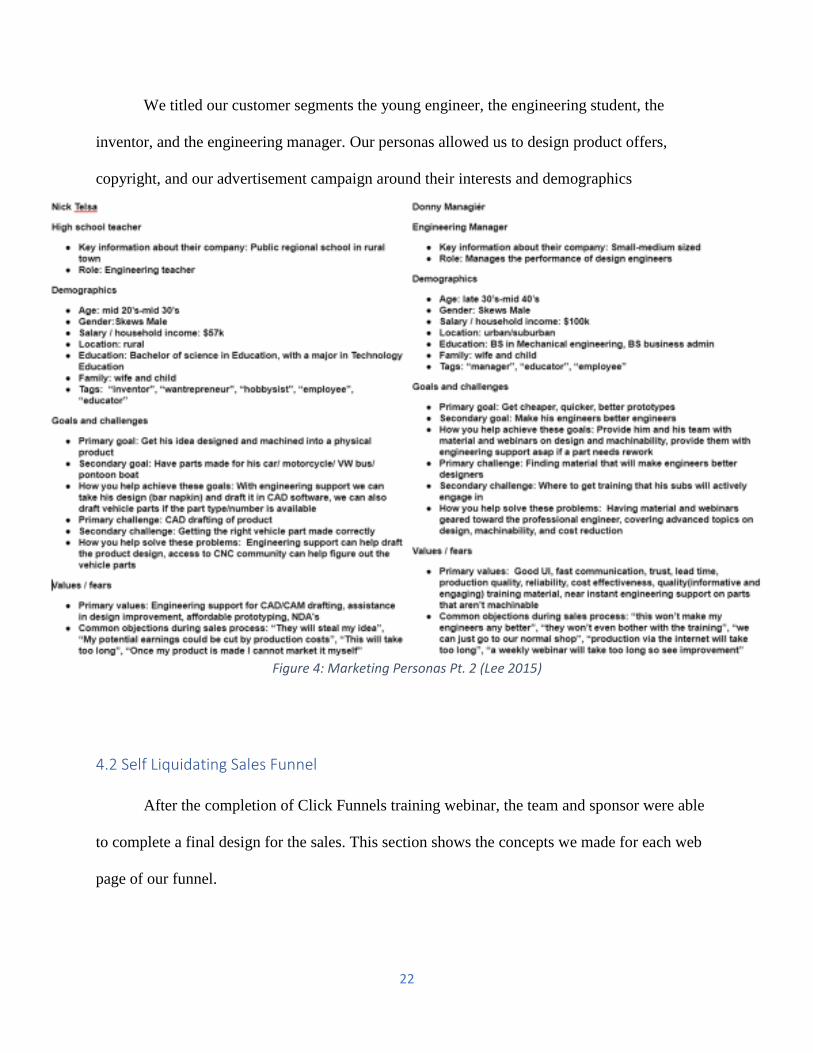
We titled our customer segments the young engineer, the engineering student, the
inventor, and the engineering manager. Our personas allowed us to design product offers,
copyright, and our advertisement campaign around their interests and demographics
Figure 4: Marketing Personas Pt. 2 (Lee 2015)
4.2 Self Liquidating Sales Funnel
After the completion of Click Funnels training webinar, the team and sponsor were able
to complete a final design for the sales. This section shows the concepts we made for each web
page of our funnel.

23
The advertisements will be targeting specific Facebook users who have shown interest in
CAM and CAD designing software. We chose to use a background picture clearly depicting
CNC manufactured pieces to signal prospects with interest in the subject.
Figure 6: Audience Interest Selection
Figure 5: Facebook Targeted Advertisement

24
The funnel was designed to provide educational information products on manufacturing
design to prospective customers for the sponsor’s CMfg service. The squeeze page offer was a
free video on the topic of reducing the cost to produce machined parts. This video would be sent
through email to customers, once they supplied us with their name, email address, and school or
work organization.
Figure 7: Squeeze Page
If they chose to fill out the prompts and click “CLAIM YOUR FREE VIDEO NOW!”
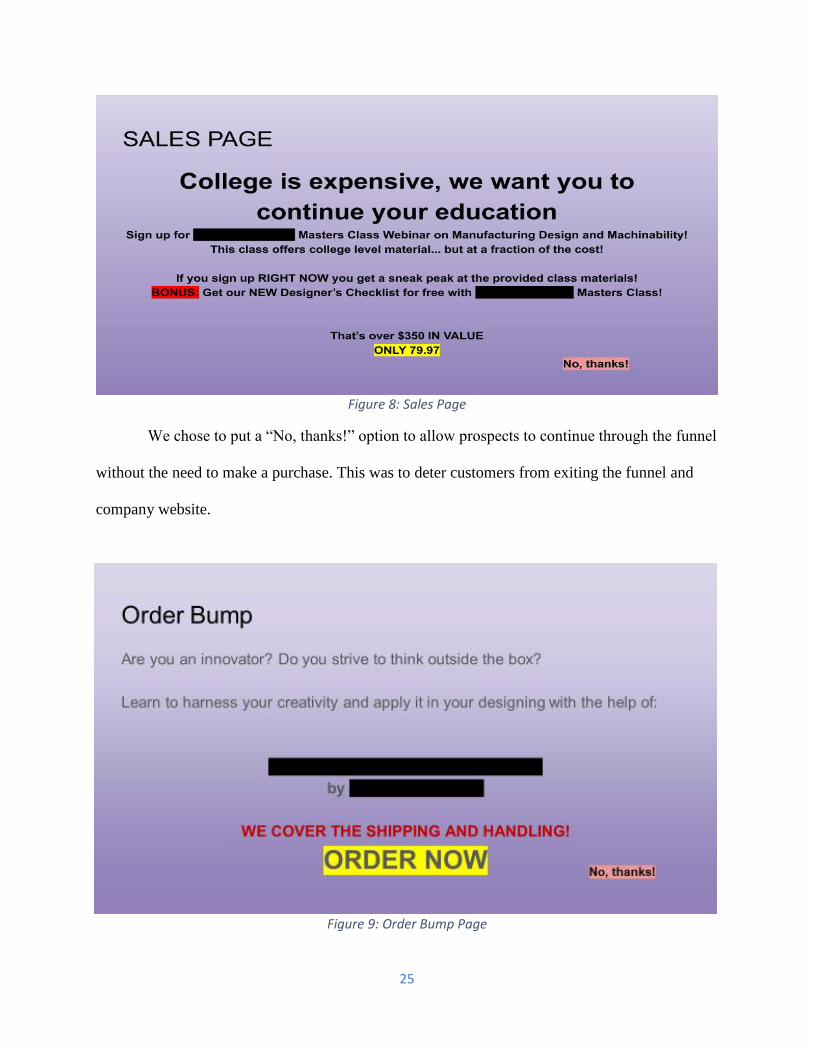
they would be sent to the sale page. The sales page offer was for a full-length webinar class on
“Manufacturing Machinability and Design” along with a designer’s guide checklist, both
provided by the sponsor. The value proposition this offer provided was a way for customers to
increase wealth by means of cutting costs to part production and providing a less costly college
education experience. The high prices associated with college education allowed us to price the
webinar at a sub premium rate without appearing as unreasonable.
25
Figure 8: Sales Page
We chose to put a “No, thanks!” option to allow prospects to continue through the funnel
without the need to make a purchase. This was to deter customers from exiting the funnel and
company website.
Figure 9: Order Bump Page

26
The order bump page was offering a book on design innovation. The sponsor was able to
contact and partner with the book’s publisher, who supplied the books at a discounted rate. The
book was aimed towards the entrepreneurially inclined customers, and meant to provide them
with inspiration to innovate using their mechanical design skills, in hopes that they would return
to the sponsor for future production needs. We offered the book along with “free shipping”,
however, the cost of shipping was included in the $30 price point. Again, we implemented the
same option to progress through the funnel in attempt to prevent customers from leaving the
website.
Figure 10: One Time Offer Page
Our One-Time-Offer page was the highest priced offer in the funnel we offered a 3D
printer, which would be sourced from a direct to consumer Chinese product manufacturing
company.
This offer was our method to provide customers with their own manufacturing
capabilities, allowing them to produce designs on their own. We also believe that customers

27
would inevitably outgrow or surpass the production capabilities provided by the 3D printer,
leading them to seek out the sponsor’s CMfg services with the intent to make an order.
4.3 Financial Analysis
In order to quantify the potential results of our sales funnel we utilized the following
NPV function:
NPV= (Today’s value of estimated revenue)- (Today’s Value of estimated costs)
Our financial analysis of the self-liquidating sales funnel was based on the use of a 6-month
Facebook Ads pay-per-click campaign. Time constraints placed on the project forced the team to
estimate results based on the minimum number of daily links clicks our campaign would
provide.
Figure 11: Outreach Potential for Facebook Ads Campaign
We made the following assumptions in order to estimate possible results for the self-
liquidating sales funnel.
• The cost of Click Funnels Licensing was a onetime $5,000 fee
• The campaign budget starts at $1,000 per month
• Targeted ad was clicked the minimum expected number of times
28
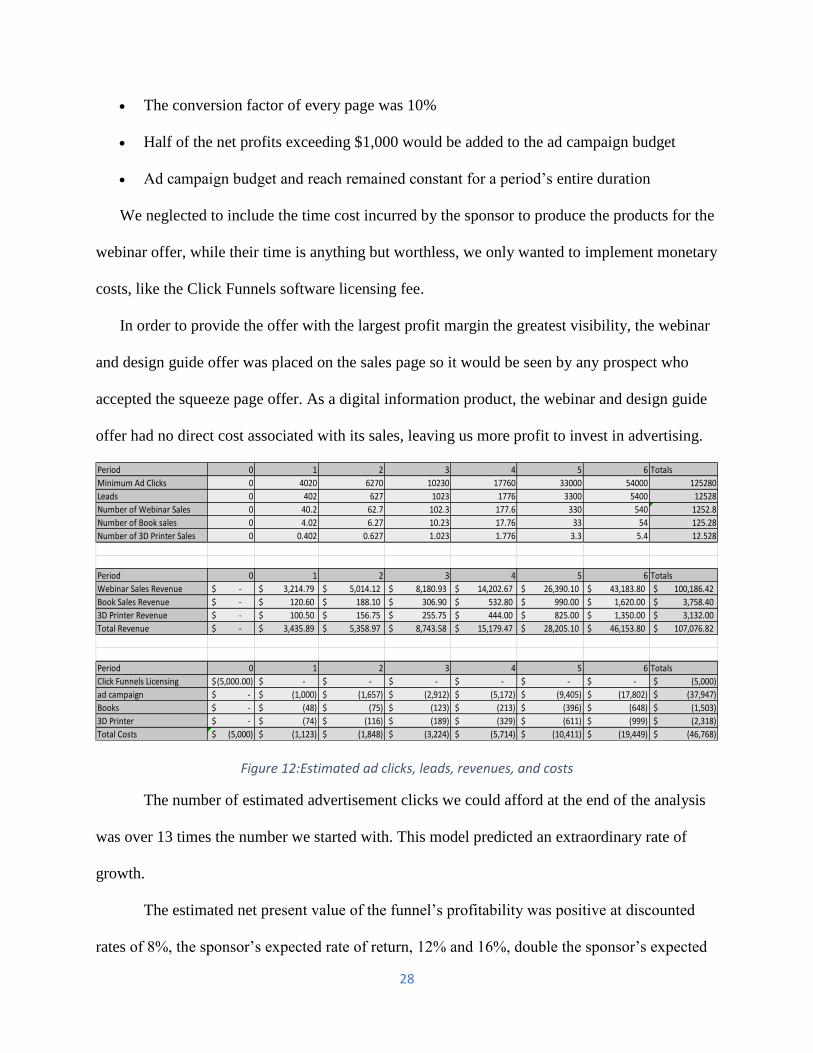
• The conversion factor of every page was 10%
• Half of the net profits exceeding $1,000 would be added to the ad campaign budget
• Ad campaign budget and reach remained constant for a period’s entire duration
We neglected to include the time cost incurred by the sponsor to produce the products for the
webinar offer, while their time is anything but worthless, we only wanted to implement monetary
costs, like the Click Funnels software licensing fee.
In order to provide the offer with the largest profit margin the greatest visibility, the webinar
and design guide offer was placed on the sales page so it would be seen by any prospect who
accepted the squeeze page offer. As a digital information product, the webinar and design guide
offer had no direct cost associated with its sales, leaving us more profit to invest in advertising.
Figure 12:Estimated ad clicks, leads, revenues, and costs
The number of estimated advertisement clicks we could afford at the end of the analysis
was over 13 times the number we started with. This model predicted an extraordinary rate of
growth.
The estimated net present value of the funnel’s profitability was positive at discounted
rates of 8%, the sponsor’s expected rate of return, 12% and 16%, double the sponsor’s expected
Period 0 1 2 3 4 5 6 Totals
Minimum Ad Clicks 0 4020 6270 10230 17760 33000 54000 125280
Leads 0 402 627 1023 1776 3300 5400 12528
Number of Webinar Sales 0 40.2 62.7 102.3 177.6 330 540 1252.8
Number of Book sales 0 4.02 6.27 10.23 17.76 33 54 125.28
Number of 3D Printer Sales 0 0.402 0.627 1.023 1.776 3.3 5.4 12.528
Period 0 1 2 3 4 5 6 Totals
Webinar Sales Revenue -$ 3,214.79$ 5,014.12$ 8,180.93$ 14,202.67$ 26,390.10$ 43,183.80$ 100,186.42$
Book Sales Revenue -$ 120.60$ 188.10$ 306.90$ 532.80$ 990.00$ 1,620.00$ 3,758.40$
3D Printer Revenue -$ 100.50$ 156.75$ 255.75$ 444.00$ 825.00$ 1,350.00$ 3,132.00$
Total Revenue -$ 3,435.89$ 5,358.97$ 8,743.58$ 15,179.47$ 28,205.10$ 46,153.80$ 107,076.82$
Period 0 1 2 3 4 5 6 Totals
Click Funnels Licensing (5,000.00)$ -$ -$ -$ -$ -$ -$ (5,000)$
ad campaign -$ (1,000)$ (1,657)$ (2,912)$ (5,172)$ (9,405)$ (17,802)$ (37,947)$
Books -$ (48)$ (75)$ (123)$ (213)$ (396)$ (648)$ (1,503)$
3D Printer -$ (74)$ (116)$ (189)$ (329)$ (611)$ (999)$ (2,318)$
Total Costs (5,000)$ (1,123)$ (1,848)$ (3,224)$ (5,714)$ (10,411)$ (19,449)$ (46,768)$

29
rate of return. These results indicate that the implementation of the sales funnel could be
profitable for the sponsor.
Figure 13: Cash Flow NPV Calculations
Figure 14 displays the estimated cash flows from the sales funnel over the 6 month
advertising campaign. The polynomial trend line curve helps us observe that as time moves on,
the cash flow grows at an increasing rate. This type of patterned change in cash flow is known as
a geometric gradient (Watts, Chapman 2015).
Figure 14: Chart of Estimate Cash Flows
$(15,000.00)
$(10,000.00)
$(5,000.00)
$-
$5,000.00
$10,000.00
$15,000.00
$20,000.00
$25,000.00
$30,000.00
$35,000.00
$40,000.00
0 1 2 3 4 5 6
cashflows
time periods(in months) 0 1 2 3 4 5 6
cashflows (5,000.00)$ 2,313.28$ 3,511.09$ 5,519.38$ 9,465.92$ 17,793.77$ 26,705.08$
NPV(6 months @ 8%) $37,435.36
NPV(6 months @ 12%) $29,852.75
NPV(6 months @ 16%) $23,965.72
30
Chapter 5- Conclusion
As internet usage becomes more integral for daily life and society, web-based
technologies advance, and cost of advertising online continues to rise it is important for
companies to continue adapting their business strategies in order to accommodate and utilize
these trends. Recognizing changes in the digital landscape is vital for a business’s marketing
strategy to effectively sell products and services.
The team concludes that implementing the self-liquidating sales funnel could be
beneficial for the CMfg sponsor, and other ecommerce markets could benefit from this strategy
as well. The financial flow we observed from our pay-per-click advertising campaign analysis
demonstrated the cost efficiency of selling information products. The low cost of development
and lack of direct sales costs associated with information products makes them ideal for
offsetting advertising expenditure during the lead generation process.
While self-liquidating sales funnels can cost effectively generate leads, they also have the
potential to be significant sources of revenue. The geometric gradient we observed from our
financial analysis portrayed revenue from the self-liquidating sales funnel was growing at an
increasing rate. As we invested profits into expanding advertising reach, the rate at which
revenue increased was greater than the rate at which costs increased.
The financial analysis of our self-liquidating sales funnel only provides an estimate of
potential success. However, the over 200 existing members of Russell Brunson’s 2 Comma Club,
as well as Russell’s own funnel driven $360 million software company, provide real life
examples of well-designed, profitable self-liquidating sales funnels exsist.
31
Bibliography
Ameri, F. & Patil, L., 2010. Digital manufacturing market: a semantic web-based framework for
agile supply chain deployment. Journal of Intelligent Manufacturing, 23(5), pp.1817
–1832.
Balta, E.C., Lin, Y., Barton, K., Tilbury, D.M. & Mao, Z.M. 2018, "Production as a Service: A
Digital Manufacturing Framework for Optimizing Utilization", IEEE Transactions on
Automation Science and Engineering, vol. 15, no. 4, pp. 1483-1493.
Bihnam, B., 2019 Small Business Marketing Trends Report. Keap.
https://keap.com/infusionsoft/resources/small-business-marketing-trends-report
Chaffey, D., 2017. What percentage of businesses have a digital marketing strategy? Smart
Insights. Available at: https://www.smartinsights.com/digital-marketing
-strategy/percentages-businesses-digital-marketing-plan/ [Accessed April 23, 2019].
The CMO Survey, 2018. Highlights and Insights Report. The CMO Survey.
https://cmosurvey.org/results/august-2018/
Coudray, M. 2014. "CREATING a SALES Funnel", Impressions, vol. 38, no. 1, pp. 34.
Dentsu Aegis Network. 2019. Digital advertising expenditure in the United States from 2016 to
2020 (in million U.S. dollars). Statista. https://www-statista
com.ezproxy.wpi.edu/statistics/386984/digital-advertising-expenditures-usa/.
eMarketer. 2017. Time spent per day with digital media in the United States from 2011 to 2017
(in minutes). Statista. https://www-statista-com.ezproxy.wpi.edu/statistics/262340/daily-
time-spent-with-digital-media-according-to- us-consumsers/.
eMarketer. 2018. Average daily time spent on selected social networks by adults in the United
States from 2014 to 2019 (in minutes). Statista. https://www-statista-
com.ezproxy.wpi.edu/statistics/324267/us-adults-daily-facebook-minutes/.
Facebook. 2018. Number of active advertisers on Facebook from 1st quarter 2016 to 1st quarter
2018 (in millions). Statista. https://www-statista-
com.ezproxy.wpi.edu/statistics/778191/active-facebook-advertisers/.
Hageman, M. 2019, Jan 22, Total Advertising Expenditure. IBISWorld. https://clients1-
ibisworld-com.ezproxy.wpi.edu/reports/us/bed/default.aspx?entid=4118.
Hassan, S., Nadzim, S.Z.A., Shiratuddin, N. 2015, "Strategic Use of Social Media for Small
Business Based on the AIDA Model", Procedia - Social and Behavioral Sciences, vol.
172, pp. 262-269

32
Hochman, J., 2017. The Cost of Pay-Per-Click (PPC) Advertising-Trends and
Analysis. Hochman Consultants. https://www.hochmanconsultants.com/cost-of-ppc-
advertising/
Lee, K., 2018. The Beginner's Guide to Creating Marketing Personas | Buffer. Buffer Marketing
Library. https://buffer.com/library/marketing-personas-beginners-guidelee
Opreana, A., Vinerean, S., 2017. A New Development in Online Marketing: Introducing Digital
Inbound Marketing. Expert Journal of Marketing.
http://marketing.expertjournals.com/23446773-305/
Perrin, A. et al., 2018. A quarter of Americans are online almost constantly. Pew Research
Center. https://www.pewresearch.org/fact-tank/2018/03/14/about-a-quarter
-of-americans-report-going-online-almost-constantly
Rowley, J. 1998, "Promotion and marketing communications in the information
marketplace", Library Review, vol. 47, no. 8, pp. 383-387.
Spero, J., 2017. How mobile is reshaping the B2B marketing landscape - Think with
Google. Google. https://www.thinkwithgoogle.com/marketing-resources/experience
-design/b2b-marketing-reshaping-growth/ [Accessed April 23, 2019].
Stacks, D. & Michaelson, D., 2010. A Practitioners Guide to Public Relations Research,
Evaluation and Measurement. Public Relations Journal, pp.11–21.
https://www.openaire.eu/search/publication?articleId=doajarticles::8d08a3df89ec7e4fa5b
9bccb1d49061
Truong, Y., Simmons, G. 2010, "Perceived intrusiveness in digital advertising: strategic
marketing implications", Journal of Strategic Marketing, vol. 18, no. 3, pp. 239-256.
Watts Jr., J.M. & Chapman, R.E. 2015, "Engineering Economics" in SFPE Handbook of Fire
Protection Engineering, Springer, New York, NY, pp. 3137-3157
We Are Social. 2018. Percentage of all global web pages served to mobile phones from 2009 to
2018. Statista. https://www-statista-com.ezproxy.wpi.edu/statistics/241462/global
mobile-phone-website-traffic-share/.
www.onefunnelaway.com. “One Funnel Away Challenge Debrief”. 2019.
https://onefunnelaway.com/members-area
www.russellbrunson.com. “Who is Russell Brunson” Russell Brunson. 2019. http://www.russellbrunson.com/hi
Xu, X. 2012, "From cloud computing to cloud manufacturing", Robotics and Computer
Integrated Manufacturing, vol. 28, no. 1, pp. 75-86.