Embed Size (px)
Citation preview
Harkins, G.W. et al. (2013). Self-maintaining or continuously refreshed? The genetic structure
of Euphasia lucens populations in the Benguela upwelling ecosystem. Journal of Plankton
Research, 35(5): 982 – 992
https://doi.org/10.1093/plankt/fbt046
University of the Western Cape Research Repository [email protected]
Self-maintaining or continuously refreshed? The genetic structure
of Euphausia lucens populations in the Benguela upwelling
ecosystem
Gordon W. Harkins Maria E. D'Amato Mark J. Gibbons
Abstract
Populations of Euphausia lucens over the shelf of the southern Benguela upwelling region
could be self-maintaining. Alternatively, they could be continually refreshed by expatriates
from the SW Atlantic that enter the system via South Atlantic Central Water in the south,
before developing and then being lost through advection off Namibia. These two hypotheses
are investigated here by examining geographic heterogeneity and molecular variation (cox1
and ND1) of the species across its distributional range in the Southern Hemisphere.
Comparisons are made with E. vallentini, which is assumed to show panmixia associated
with its circumglobal distribution between 50 and 60°S. Phylogenetic analysis with
mitochondrial 16S ribosomal RNA and cytochrome oxidase 1 (cox1) confirmed that E.
lucens and E. vallentinirepresent sister taxa. Strong geographic structuring of cox1 and ND1
mtDNA genetic variation by ocean basin was recorded in E. lucens, indicating
that neritic populations off South Africa are likely self-maintaining. This contrasts with the
results for E. vallentini, which appears to occur as a single panmictic population across its
distributional range. These differences are likely related to the habitats (neritic, E. lucens;
oceanic, E. vallentini) occupied by each species. The results of the neutrality tests are
consistent with demographic processes and suggest growth in E. lucens and equilibrium or
shrinkage in E. vallentini. Although purifying selection cannot be ruled out in the former, the
very few haplotypes recovered from E. vallentini could indicate that any population
expansion following a crash is not yet reflected in the relatively slowly evolving mtDNA
markers used here. Further work using other methods is recommended.
Euphausia lucens Hansen 1905 is the dominant species of krill in nearshore waters of the
southern Benguela upwelling region off the west coast of South Africa. Its regional
distribution extends eastwards to Port Elizabeth on the South coast, and northwards into
southern Namibia, where it is replaced by Nyctiphanes capensis Hansen 1911 inshore and
by E. hanseni Zimmer 1915 further offshore (see map in Pillar et al., 1992; Gibbons, 1995). It
is thought to be an upwelling specialist (Gibbons and Hutchings, 1996) that has a suite of
dietary and behavioural characteristics allowing it to persist in the Benguela upwelling region
throughout the year. E. lucens is an omnivore that can match its diet to the ambient food
environment (Pillar et al., 1992), being largely herbivorous when phytoplankton is abundant

2
(near the surface and during upwelling conditions) and switching to zooplankton if
phytoplankton is scarce (in deeper water and during quiescent/downwelling conditions).
Like other upwelling specialists in the area (Verheye et al., 1991), E. lucensdisplays
pronounced ontogentic diel vertical migration (DVM; Pillar et al., 1992). Adult populations
reach greatest numbers in the phytoplankton-rich waters close to shore off St Helena Bay,
and eggs are released that float into the near-surface waters. These are then moved offshore
in the Ekman layer, where they hatch into calyptopes. As these early life history stages are
transported further offshore and northwards along the west coast, so they and their
migratory abilities develop. This eventually enables individuals to take advantage of
onshoreward (upwelling) compensation currents, which return them to the more productive
nearshore environments and they can then move back southwards in the subsurface,
poleward flowing counter currents (Shannon, 1985). Ontogenetic DVM, therefore, would
allow populations of E. lucens to maintain themselves within the region, and prevent them
from being advected into the South Atlantic off Namibia.
However, E. lucens is not confined to the Benguela upwelling ecosystem, and is found over
continental shelves across the Southern Hemisphere between 40 and 50°S (see maps
in Mauchline and Fisher, 1969; Mauchline, 1980), being common off Australia and New
Zealand (Bartle, 1976) as well as South America (Tarling et al., 1995). Given that the source
water that is upwelled along the west coast of South Africa is of South Atlantic Central Water
(SACW) origin, a potential mechanism exists whereby South African populations of E.
lucens could be seeded by expatriates from the West Atlantic. If re-seeding of populations in
the East Atlantic occurs whenever upwelling-favourable winds blow along the South African
west coast, there is a constant supply of new individuals into local populations that then
“boom” in the productive waters of the southern Benguela, only to go “bust” when they get
entrained into offshore flows off southern Namibia. Although this latter scenario implies a
high level of gene flow between western and eastern populations, different subpopulations
of M. norvegica (M. Sars 1857) in the North Atlantic have been identified and matched to
basin scale circulation patterns there (Papetti et al., 2005). That said, no such clear current
closure systems are apparent in the South Atlantic, so it does not follow that significant
genetic structure would be apparent within populations of E. lucens in the region.
Here, we set out to test the genetic integrity of South African populations of E. lucens using a
variety of mitochondrial [16S rRNA, cytochrome oxidase 1 (cox1) and NADH dehydrogenase
1 (ND1)] and nuclear internal transcribed spacer 1 (ITS-1) molecular markers, with a view to
explicitly testing the extent of genetic mixing between populations across the Southern
Hemisphere. These DNA fragments have been successfully applied to the study of
phylogenetic relationships, geographical structure and demographic processes of krill species
(Patarnello et al., 1996; Papetti et al., 2005; Bucklin et al., 2007; Goodall-Copestake et al.,
2010; Bortolotto et al., 2011).
We additionally contrast the patterns observed for E. lucens with those for its putative sister
taxon (Zane and Patarnello, 2000), E. vallentini Stebbing 1900. Euphausia vallentini is
http://repository.uwc.ac.za
3
abundant between 50 and 60°S and because it is associated with the Antarctic Polar Frontal,
it is distributed more or less continuously across the Southern Hemisphere (see maps
in Mauchline and Fisher, 1969; Mauchline, 1980). Only in the SE Pacific and the SW Atlantic
do both species occur together over the shelf (Ramirez and Dato, 1983; Curtolo et
al., 1990; Tarling et al., 1995; Palma and Silva, 2004), otherwise E. vallentinifails to
penetrate the continental coastal waters in either the SE Atlantic or the SW Pacific. Given its
distribution, we predict that E. vallentini should show little evidence of separate breeding
pools across its distributional range, as has been observed for E. superba (e.g. Bortolotto et
al., 2011).
Finally, Jarman et al. (Jarman et al., 2000) hypothesize that E. lucens and E. vallentini have
been incorrectly classified as separate species. We investigate this hypothesis here and
predict that if E. vallentini and E. lucens indeed represent separate species, fixed differences
will be observed with both mitochondrial and nuclear genetic markers.
Method
The project was designed with the main objective of obtaining population genetics and
historical demographic information for E. lucens and E. vallentini, with a preliminary step of
validating their phylogenetic affinities. These objectives were achieved by utilizing a range of
DNA fragments with known different mutation rates. Both cox1 and 16S have been
extensively used in phylogenetic studies of plankton. For this purpose, a few individuals per
species are normally sufficient and frequently only one specimen per species is used
(e.g. Bucklin et al., 2007); cox1 has been recently adopted as the barcoding gene for species
identification (Hebert et al., 2003). The ND1 gene is thought to have a higher evolutionary
rate than 16S and cox1 (Saccone et al., 1999), which justifies a major effort on our part to
obtain population information for this fragment, especially as it has been successfully
applied to other krill micro-evolutionary studies (Zane et al., 1998; Papetti et al.,
2005; Bortolotto et al., 2011). ITS-1 is a nuclear marker and was incorporated as an
additional source of information here.
Sampling and DNA isolation
Five hundred and ninety-three specimens of E. lucens and two hundred and fifty-two E.
vallentini were collected from various global localities (Table I). Species were identified
following the identification key of Baker et al. (Baker et al., 1990). DNA extraction was
achieved using the CTAB method of Corach (Corach, 1991), modified using 5 μg/mL of
proteinase K (Harkins, 2007).
http://repository.uwc.ac.za

4
Polymerase chain reaction and sequencing conditions
Inter-species variation was studied using ITS-1, 16S rRNA and cox1, using a subset of
specimens from each species collected from a range of geographically distant sampling
locations. A region of ∼500 base pair (bp) spanning the nuclear ITS-1 region was amplified
with the primers SP-1-5′ and Sp-1-3′ (Chu et al., 2001). An ∼570 bp region of the 16S rRNA
mitochondrial gene was amplified using the primers 16Sa and 16Sb (Palumbi et al., 1991). A
region of subunit 1 of the cox1 gene 640 bp in length was amplified using the primers LCO
and HCO of Folmer et al. (Folmer et al., 1994).
Population structure and demographic history were investigated utilizing the polymorphisms
in cox1 and a 156 bp region coding for subunit 1 of the mitochondrial ND1 gene, using the
primers ND1f and ND1r (Zane et al., 1998). Failure of these primers to amplify was further
investigated by amplifying a 600 bp fragment with the primers ND1-F-lu (5′-
TCCTTATTATTTGTCTCCTG-3′) (Harkins, 2007) and CbMnl3 (Zane et al., 1998). DNA
sequencing confirmed substitutions in the priming sites for SWA E. lucens, thus the
primers GH1f (5′-TTTTTTCTATGTTGTACAAGATT-3′) and GH2r (5′-
ACAATCTCGCTGATATAATGA -3′) (Harkins, 2007) were designed for these samples using
the software program Oligo (Rychlick, 1992).
http://repository.uwc.ac.za

5
All PCRs were performed in a total volume of 15 μL containing 20–40 ng of purified DNA
from one individual krill as template, 0.1 U of Taq polymerase (Promega) and final
concentrations of 1× Mg2+- free buffer, 2.5 mM MgCl2, 0.24 mM deoxynucleotides (dNTPs)
and 0.3 μM of each primer. PCRs were run in a Perkin Elmer 9600 Gene Amp. Cycling
conditions were: 94°C (2 min): 94°C (30 s), annealing temperature (30 s): 72°C (1 min) for
37 cycles, final extension 5 min at 72°C. Annealing temperatures were 50°C for 16S rRNA,
cox1, and ND1 and 55°C for ITS-1.
Big Dye Terminator v. 3.1 (Applied Biosystems) was used to cycle sequence PCR products
under the conditions recommended by the manufacturer. All amplicons were sequenced in
both directions. Sequencing products were run in an ABI3100.
SSCP screening of mtDNA variation
ND1 haplotype variants were screened using SSCP (single strand conformational
polymorphism) analysis (Orita et al., 1989; Hayashi, 1991). For each individual, 2 μL of the
ND1f—ND1r PCR product, was added to an equal volume of formamide loading dye (98%
formamide, 2 mM EDTA, Bromphenol Blue), heat denatured and loaded on a 10%
acrylamide gel (37.5:1 acrylamide/bisacrylamide) with 5% glycerol. Runs were performed at
4°C at 135 V for 16 h in a 20-cm high vertical apparatus. Gels were silver stained
(Sambrook et al., 1989). Accuracy of scoring was confirmed by sequencing randomly chosen
individuals displaying each of the observed SSCP patterns. All distinct ND1 SSCP profiles
were sequenced in both directions more than once.
Phylogenetic analysis
For the euphausiid phylogeny reconstructions, we have augmented the information
generated in this study with that from a further 13 species (15 sequences) for 16S rRNA and
16 species (21 sequences) for cox1. GenBank accession numbers are provided
in Supplementary data, Table SI. The cox1 and 16S gene fragments were analysed separately.
Sequences for subsequent analysis with PAUP (see below) were aligned using Bioedit (Hall,
1999), while those for MrBayes were aligned using Sequencher 5.1 (GeneCodes). Nucleotide
substitution models for use in PAUP were assessed using MODELTEST v3.06 (Posada and
Crandall, 1998), while in the case of MrBayes, jModelTest 0.1.1 (Guindon and Gascuel,
2003; Darriba et al., 2012) was used. The numbers of variable and parsimony informative
sites were calculated with DnaSP v5 (Librado and Rozas, 2009). For the 16S and cox1 data,
the best fitting model was the general time reversible model with gamma distributed rate
variation and a proportion of invariable sites (GTR + G + I), and for the ND1 data this was
the Hasegawa, Kishino and Yano model with gamma distributed rate variation and a
proportion of invariable sites (HKY + G + I).
The evolutionary relationships among species (rooted on Meganyctiphanes norvegica) were
investigated using neighbour-joining (NJ), maximum likelihood and maximum parsimony,
as well as Bayesian phylogenetic methods with PAUP and MrBayes 3.2.1 (Huelsenbeck and
Ronquist, 2001; Ronquist and Huelsenbeck, 2003), respectively. In the case of PAUP,
statistical confidence in the stability of tree nodes was calculated by non-parametric
http://repository.uwc.ac.za
6
bootstrap (Felsenstein, 1985) with 1000 replications. In the case of MrBayes, the model was
run for 1 million generations, with three attempted swaps each iteration and with the
temperature set at 0.1: two independent runs were analysed, each with one hot and three
cold chains.
Genetic variation within species: geographical and temporal heterogeneity
The extent of the genetic diversity was evaluated using summary statistics estimates of
haplotype diversity (h), nucleotide diversity (π) of Nei (Nei, 1987), and the number of
segregating sites (S) calculated using DnaSP v5 (Librado and Rozas, 2009).
AMOVA (Excoffier et al., 1992) using Arlequin (Excoffier et al., 2005) was used to evaluate
spatial and temporal structure in ND1 haplotype heterogeneity of E. lucens samples (Table I),
as well as geographic structure of E. vallentinisamples. AMOVA computations for E.
vallentini haplotypes were performed using a p-distance matrix, but in the case of E.
lucens standard haplotype frequencies AMOVA were applied. Significance was tested with 10
000 permutations. The degree of population structure was further examined from a
parsimony network analysis of ND1 mtDNA haplotypes within species using the Median-
Joining algorithm, with parameter ε set to 0, using Network v.4.5 (Bandelt et al., 1999). To
account for multiple testing, P-values (0.05) were adjusted using the Bonferroni correction
(Quinn and Keough, 2002).
Gene flow among the four regions was further evaluated for E. vallentini using Migrate 3.4.2,
using a Bayesian coalescent framework (Beerli and Felsenstein, 2001; Beerli, 2006). Final
run conditions were determined after inspecting the effective sample size (all above 1000)
and the lowest Ln[Prob(D|G)] for all parameters M (M = 2Nef m), where 2Nef is the effective
population size of females and M is the number of migrant females per generation. Final run
conditions were summarized over five replicate runs of 1 short chain with 50 000 recorded
steps with 100 steps increments after 50 000 burn-in steps, and four chains with bounded
adaptive heating scheme of 1, 3, 10 and 100 000.
Historical demographic processes were investigated for both species using neutrality tests.
Departures from neutral expectations were investigated with two different tests implemented
in DnaSP v 5.0 (Librado and Rozas, 2009): Tajima's D (Tajima, 1989) and Fu's Fs (Fu, 1997).
The former uses information from the mutation (segregating site) frequency and is based on
the difference between two alternative estimates of θ, while the latter uses information from
the haplotype distribution and is based on Ewen's (Ewens, 1972) sampling distribution.
Fu's Fs test is more sensitive to demographic changes. An excess of rare alleles indicates
demographic expansion, whereas an excess of common alleles is indicative of population
shrinkage. The significance of Fswas evaluated using 1000 random permutations with DnaSP
(Librado and Rozas, 2009).
The relative magnitude of demographic changes through time was evaluated from different
estimates of the population-scaled mutation rate theta (θ = 2Neμ). These methods have
varying degrees of sophistication and utilize different properties of the data. We used the
http://repository.uwc.ac.za
7
non-genealogical summary statistic methods of Watterson (Watterson, 1975) and Tajima
(Tajima, 1983), and a genealogical estimator based on generalized linear models, UPBLUE
(Fu, 1994). A long-term history of effective population size was obtained using Watterson's
(Watterson, 1975) estimate θ1 (Fu and Li, 1993), which excludes the influence of singletons.
Genealogical and non-genealogical estimators of θ put different weights on mutations
occurring in different time periods (Crandall et al., 1999; Su et al., 2001).
Fu'sUPBLUE estimator (Fu, 1994) places heavy emphasis on young mutations revealing
relatively recent population processes, whereas Tajima's (Tajima, 1983) estimate places
heavy emphasis on older mutations reflecting ancient population events (Fu, 1997). The
comparison between these two estimators has been used to gain insights with respect to
population size changes over time.
Results
Genetic variation between species in 16SrDNA, cox1, ND1 and ITS-1
We generated 16S sequence information for two E. lucens and two E. vallentinispecimens.
The 446 bp 16S rRNA data set for these species had a total of eight variable sites seven of
which were fixed between species (Supplementary data, Table SIIa). We obtained DNA
sequence information for 640 bp of cox1 for eight E. lucens and 14 E. vallentini specimens,
with a total of 64 variable sites of which 55 were parsimony informative and 39 were fixed
between species (Supplementary data, Table SIIb).
The 16S rRNA MrBayes tree is shown in Supplementary data, Fig. S1a. Although its topology
in the context of E. lucens and E. vallentini is congruent with that of the NJ tree (data not
shown) and in general agreement with the maximum likelihood and maximum parsimony
trees, the latter were unable to resolve clearly the relationships between E. lucens, E.
vallentini and E. frigidaHansen 1911 (data not shown). Notably, the sequence previously
identified as E. lucens (AF177177.1) (Jarman et al., 2000) groups within a monophyletic
clade comprising all of the other E. vallentini samples with high bootstrap support indicating
that this specimen has been misidentified (Supplementary data, Fig. S1a). Congruent
topologies for E. lucens and E. vallentini were observed using cox1 in all four analyses, where
the sequence AF177185.1 that was previously identified as E. lucens by Jarman et al.
(Jarman et al., 2000) groups within the E. vallentini clade with high bootstrap support
(Supplementary data, Fig. S1b). The estimated mean pairwise distance for E. lucens and E.
vallentiniwas 7.6% using cox1 and 1.4% for 16S rRNA. For E. lucens a clear geographical
pattern can be superimposed onto the cox1 phylogenetic trees with two distinct reciprocally
monophyletic E. lucens clades corresponding to the separate SEA and SWA ocean basins
(Supplementary data, Fig. S1b).
The nuclear marker, ITS subunit 1, was sequenced in three individual E. lucens(GQ890562.1-
GQ890564.1), E. vallentini (GQ890567.1- GQ890569.1) and two E. recurva specimens
(GQ890565.1, GQ890566.1). These included specimens sampled from each of the regional
locations (SEA and SWA) that were previously identified as belonging to distinct clades in
the mtDNA phylogenetic analyses. No intra-species variation in ITS-1 was detected in either
http://repository.uwc.ac.za
8
species and two fixed substitutions and four indels separated the two species (Supplementary
data, Table SIII).
Thirty-eight distinct ND1 haplotypes were identified among the 593 individuals collected
from 19 E. lucens samples, with the highest number found in the SWA followed by SEA and
the SWP (Supplementary data, Table SIV). In E. vallentini in contrast, only four ND1
haplotypes were detected among the 252 individuals sampled in the SEA, SWA, SWP and
subAntarctic waters (Supplementary data, Table SIV).
Despite the initial expectation that the putative sister species would be very similar, they
differed substantially in their respective levels of intra-specific ND1 genetic diversity.
Nucleotide diversities (π) ranged between 2.6 × 10⁻⁴ and 7 × 10⁻³ substitutions/site among
sampling localities (Table I) and the average percentage ND1 bp difference between these
species was 19.27% with a net divergence of 17.79%. The highest haplotype diversity (h),
nucleotide diversity (π) and number of segregating sites (S) (Table I) was exhibited in the
SWA E. lucens population, where this pattern was consistently observed in all of the separate
samples from this area. The high and dominant frequency of haplotype A1 (Supplementary
data, Table SIV) in the SEA samples was responsible for the relatively low haplotype and
nucleotide diversities.
Geographic patterns of population genetic diversity
The patterns of population structure inferred from the analyses of cox1 differed substantially
between the sister species. Whereas E. lucens was characterized by strong genetic structure
at the ocean-basin scale with genetically differentiated populations in the SWA and SEA (Φst
= 0.71, P < 0.05), E. vallentini showed no evidence of geographical heterogeneity across its
global range (Supplementary data, Fig. S1b). The AMOVA analysis of E. vallentini ND1 data
showed that most variation is contained within samples (96.63%), indicating homogeneity
across samples (Φst = 0.033, P > 0.05).
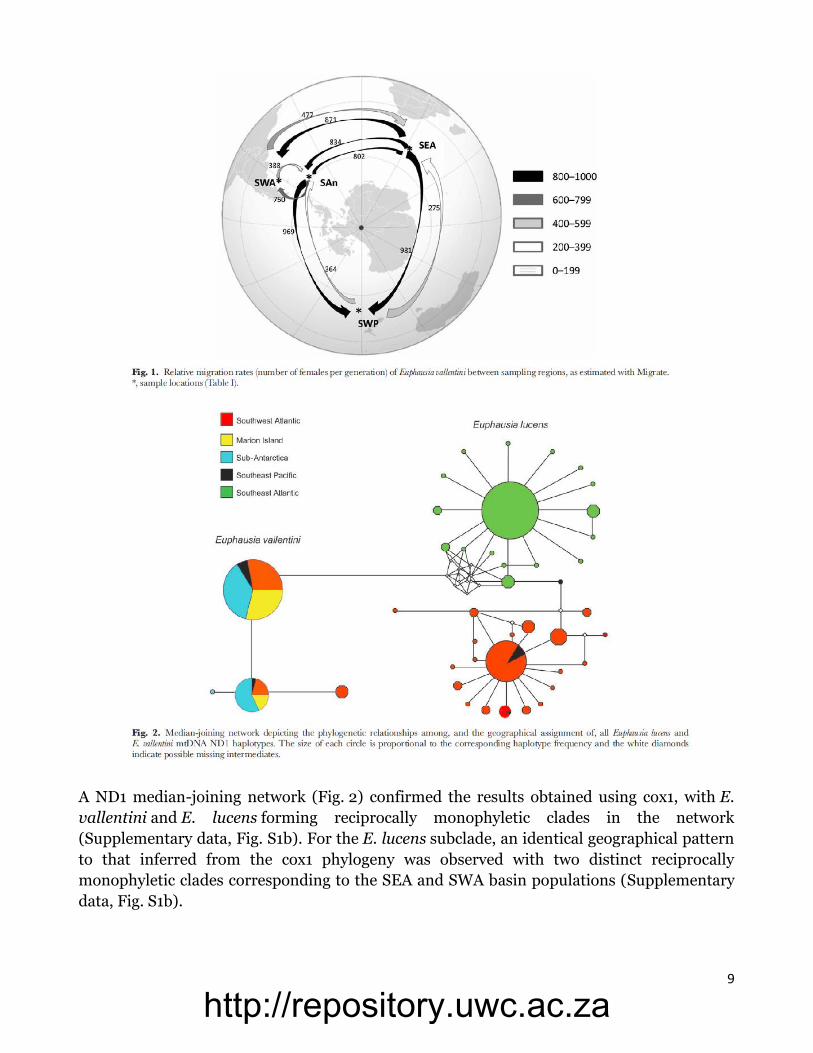
Modal values of the Migrate parameters (θ and M) and their 95% CI are shown for E.
vallentini in Supplementary data, Table SV and Figure 1. High levels of long-term gene flow
among regions and asymmetrical migration among most regions were detected.
Although M from SWP to SEA is apparently restricted (CI encompasses 0), this site
experiences high migration rates to and from all other regions. The SWP sample is the
smallest in size and these values should therefore be taken with caution.
http://repository.uwc.ac.za
9
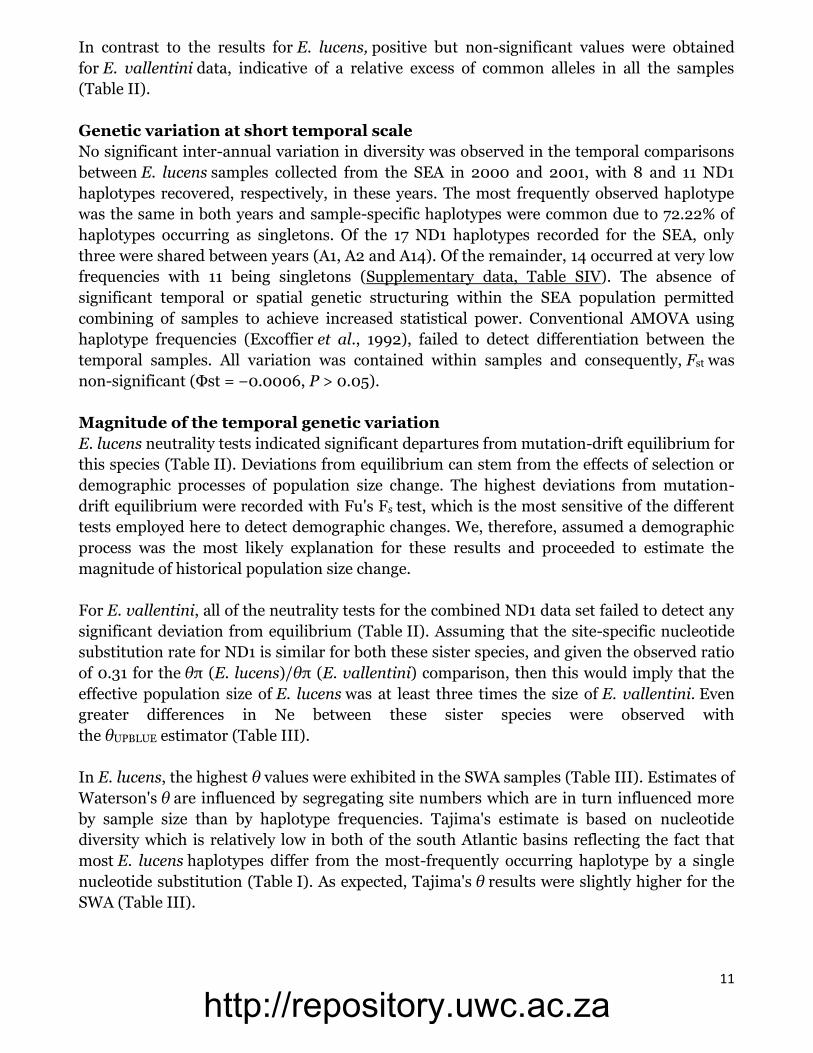
A ND1 median-joining network (Fig. 2) confirmed the results obtained using cox1, with E.
vallentini and E. lucens forming reciprocally monophyletic clades in the network
(Supplementary data, Fig. S1b). For the E. lucens subclade, an identical geographical pattern
to that inferred from the cox1 phylogeny was observed with two distinct reciprocally
monophyletic clades corresponding to the SEA and SWA basin populations (Supplementary
data, Fig. S1b).
http://repository.uwc.ac.za

10
The high-frequency ND1 haplotypes were internal to the network, with rare or singleton
haplotypes generally being derived from these. No evidence of any further geographic
subdivision was apparent among the three SWA E. lucenssamples, which also displayed a
high number of singleton haplotypes (Harkins, 2007). Two haplotypes (B1 and BC20) were
shared between the SWP and the SWA where, in the latter region, haplotype B1 occurred at
the highest frequency in all of the local samples (Fig. 2).
A strikingly different pattern was observed in E. vallentini with only four distinct ND1
haplotypes detected. Haplotype (III) was found only in the SWA Continental Shelf sample
while another haplotype (II) was recovered from a single subAntarctica sample
(Supplementary data, Table SIV). The remaining two haplotypes (I and IV) were found in all
the samples, whereas the latter was always the most frequent (Supplementary data, Table
SIV).
Temporal heterogeneity within species: long-term and short-term genetic
variation
For E. lucens, a significant departure from neutrality was detected for all samples (Table II).
This is due to the more elevated proportion of rare alleles present in the samples (see
also Supplementary data, Table SII and Fig. 2). The deviations from neutrality were more
pronounced for Fu's Fs test, arguing that demographic processes associated with expansion
are more plausible explanations for the patterns observed than those linked to selection.
http://repository.uwc.ac.za
11
In contrast to the results for E. lucens, positive but non-significant values were obtained
for E. vallentini data, indicative of a relative excess of common alleles in all the samples
(Table II).
Genetic variation at short temporal scale
No significant inter-annual variation in diversity was observed in the temporal comparisons
between E. lucens samples collected from the SEA in 2000 and 2001, with 8 and 11 ND1
haplotypes recovered, respectively, in these years. The most frequently observed haplotype
was the same in both years and sample-specific haplotypes were common due to 72.22% of
haplotypes occurring as singletons. Of the 17 ND1 haplotypes recorded for the SEA, only
three were shared between years (A1, A2 and A14). Of the remainder, 14 occurred at very low
frequencies with 11 being singletons (Supplementary data, Table SIV). The absence of
significant temporal or spatial genetic structuring within the SEA population permitted
combining of samples to achieve increased statistical power. Conventional AMOVA using
haplotype frequencies (Excoffier et al., 1992), failed to detect differentiation between the
temporal samples. All variation was contained within samples and consequently, Fst was
non-significant (Фst = −0.0006, P > 0.05).
Magnitude of the temporal genetic variation
E. lucens neutrality tests indicated significant departures from mutation-drift equilibrium for
this species (Table II). Deviations from equilibrium can stem from the effects of selection or
demographic processes of population size change. The highest deviations from mutation-
drift equilibrium were recorded with Fu's Fs test, which is the most sensitive of the different
tests employed here to detect demographic changes. We, therefore, assumed a demographic
process was the most likely explanation for these results and proceeded to estimate the
magnitude of historical population size change.
For E. vallentini, all of the neutrality tests for the combined ND1 data set failed to detect any
significant deviation from equilibrium (Table II). Assuming that the site-specific nucleotide
substitution rate for ND1 is similar for both these sister species, and given the observed ratio
of 0.31 for the θπ (E. lucens)/θπ (E. vallentini) comparison, then this would imply that the
effective population size of E. lucens was at least three times the size of E. vallentini. Even
greater differences in Ne between these sister species were observed with
the θUPBLUE estimator (Table III).
In E. lucens, the highest θ values were exhibited in the SWA samples (Table III). Estimates of
Waterson's θ are influenced by segregating site numbers which are in turn influenced more
by sample size than by haplotype frequencies. Tajima's estimate is based on nucleotide
diversity which is relatively low in both of the south Atlantic basins reflecting the fact that
most E. lucens haplotypes differ from the most-frequently occurring haplotype by a single
nucleotide substitution (Table I). As expected, Tajima's θ results were slightly higher for the
SWA (Table III).
http://repository.uwc.ac.za

12
The estimates of Watterson's θ* (Table III) for separate subsamples are lower for both of the
south Atlantic populations reflecting the relative contribution of singleton mutations to these
statistics. Note that all of θ estimators vary consistently for the two subsamples. For example,
the θUPBLUE estimate is four times as large as θπ, for the separate SWA (θUPBLUE = 12.113/θπ =
2.632), and SEA (θUPBLUE = 9.09/θπ = 2.081) Atlantic populations (Table III).
Discussion
Here, we have shown that fixed differences between E. lucens and E. vallentiniexist in both
the nuclear and mitochondrial genomes, demonstrating that they represent valid taxonomic
species. This settles some debate in the literature implied by the observations of Jarman et
al. (Jarman et al., 2000), and has implications for the systematics of Southern Hemisphere
euphausiids (Zane and Patarnello, 2000).
There is strong geographical structuring of genetic variation in E. lucenspopulations in the
South Atlantic. There is also a general absence of inter-annual differences in genetic
structure of SEA populations, indicating that the differences between east and west are real
and not the result of chance sampling. This suggests that the populations of E. lucens in the
SEA are not seeded by individuals transported from the SWA in upwelled SACW, as
provocatively proposed by Gibbons and Hutchings (Gibbons and Hutchings, 1996). Rather,
the diel and ontogenetic vertical migration behaviours shown by E. lucens in the SEA
(Pillar et al., 1992) are likely effective in maintaining populations over the shelf.
Although there are no other studies from the South Atlantic that can be used to compare our
results with (Patarnello et al., 2010) building largely on the work of Papetti et al. (Papetti et
al., 2005), noted that population structure of Meganyctiphanes norvegica in the North
Atlantic was closely tied to basin-wide circulation patterns. Thus, aside from the
Mediterranean population, three geographically distinct oceanic populations were identified
linked to the three regional gyres. Broadly, similar observations have also been noted for the
chaetognath Sagitta setosa (Peijnenburg et al., 2005). That distinct populations in the South
Atlantic are similarly observed then should come as no surprise, especially as E. lucens is
regarded as a shelf species and few specimens have been recorded from the open ocean
(Mauchline and Fisher, 1969; Mauchline, 1980), while M. norvegica is a shelf-slope species
occurring at depths >100 m. Interestingly, Papetti et al. (Papetti et al., 2005) also noted a
lack of a significant temporal signal within krill populations M. norvegica (Papetti et al.,
2005), implying high genetic stability over short periods of time.
This situation contrasts with that of E. vallentini, which, using the same markers employed
here for E. lucens, appears to be panmictic across the distribution range investigated. These
results are similar to those observed for another widely distributed austral species of oceanic
krill, E. superba,populations of which show no evidence of continental-level and regional
geographical structure (Goodall-Copestake et al., 2010; Bortolotto et al., 2011), although
subregional differences attributed to recruitment process have recently been observed
(Batta-Lona et al., 2011). Panmixia has also been observed for Clausocalanus
arcuicornis (Blanco-Bercial et al., 2011).
http://repository.uwc.ac.za
13
An excess of rare and common ND1 alleles was observed in E. lucens and E. vallentini,
respectively, and, consequently, all of the neutrality tests for ND1 returned significantly
negative results for the former species and positive (albeit not significantly so) results for the
latter. These results are consistent with population growth, sweepstake recruitment or
purifying selection in E. lucens and population decline or selective sweeps in E. vallentini.
In E. lucenswhich displays a shallow multifurcating genealogy, an excess of low frequency
alleles and large differences between estimates of effective and census population sizes
mirrors the expected patterns generated by sweepstakes recruitment (Árnason, 2004). These
organisms reproduce under spatially and temporally varying oceanographic conditions that
may affect their sexual maturation, choice of mate, fertilization success, survival of larvae
and recruitment (Hedgecock, 1994), all of which are processes about which we are almost
completely ignorant.
In the case of E. vallentini, the presence of the two high-frequency ND1 haplotypes could
have resulted from successive selective sweeps and incomplete fixation, perhaps linked to
historic changes in the oceanography of the Southern Hemisphere (e.g. Zane and Patarnello,
2000; Rabassa et al., 2005).
Alternatively, the observed patterns of variation could be driven by demographic processes.
The neutrality tests indicated substantial deviations from neutrality in almost all the
separate E. lucens samples consistent with a recent population size increase. Consistent with
this hypothesis the θestimators that incorporate genealogy information return larger values
than the summary statistic estimators (Crandall et al., 1999; Su et al., 2001). In contrast,
for E. vallentini similar θ values were obtained both among and between samples with both
types of estimators and, generally, deviation from a constant-population size model was in
the direction of population shrinkage (Tajima, 1989; Fu and Li, 1993; Fu, 1995). That said,
the very few haplotypes recovered from E. vallentini, which should have a large census
population size, may indicate that it has undergone a major population crash during its
evolutionary history, and the subsequent population expansion is not yet reflected in the
relatively slowly evolving mtDNA markers used here. It should be realized that the small size
of the fragments used and the low levels of variation observed are insufficient to make
unequivocal statements about the respective roles of demography and selection in shaping
the genetic variation in these species.
The differences observed in the patterns of population genetic structure of E. lucens and E.
vallentini most likely reflect differences in both their habitats, geographical ranges and the
hydrographic current regimes that characterize the areas they inhabit (Zane and Patarnello,
2000). By strongly influencing these regimes, historical climatic and concomitant
hydrological events must have played an important role in shaping the spatial distribution of
their genetic variation. We consider that the estimators that incorporate genealogical
information provide strong evidence for underlying demographic processes to explain the
patterns of variation in these two krill species, but full confirmation should be obtained from
the analysis of multiple loci.
http://repository.uwc.ac.za
14
Supplementary data
Supplementary data can be found online at http://plankt.oxfordjournals.org.
Acknowledgements
We would like to thank G. Alvarez-Colombo, J. Bradford- Grieve, E. Goetze, A. Rogers and W.
Froneman for kindly providing us with samples, and AE Channing for assisting us with some
of the phylogenetic analyses. We are grateful to the governments of South Africa and Norway
for ship’s time aboard their Research Vessels (Dr Fridtjof Nansen, Africana, Sardinops, SA
Agulhas) and to the various offi and crew for their assistance at sea. The manuscript was materi-
ally improved by the comments of the anonymous reviewers, whose inputs are gratefully
acknowledged.
Funding
This work was funded by the National Research Foundation (South Africa), the Royal
Society (London) and the University of the Western Cape.
http://repository.uwc.ac.za

15
References
Árnason, E. (2004) Mitochondrial cytochrome b DNA variation in the high fecundity
Atlantic cod: trans-Atlantic clines and shallow gene genealogy. Genetics, 166, 1871 –
1885.
Baker, A. de C., Boden, B. P. and Brinton, E. (1990) A Practical Guide to the Euphausiids of the
World. Natural History Museum Publications, London.
Bandelt, H. J., Forster, P. and Ro hl, A. (1999) Median-joining networks for inferring
intraspecific phylogenies. Mol. Biol. Evol., 16, 37 – 48.
Bartle, J. A. (1976) Euphausiids of Cook Strait: a transitional fauna? N. Zeal J. Mar. Fresh.
Res., 10, 559 – 576.
Batta-Lona, P. G., Bucklin, A., Wiebe, P. H. et al. (2011) Population genetic variation of the
Southern Ocean krill, Euphausia superba, in the Western Antarctic Peninsula region
based on mitochondrial single nucleotide polymorphisms (SNPs). Deep-Sea Res. II, 58,
1652 – 1661.
Beerli, P. (2006) Comparison of Bayesian and maximum likelihood inference of population
genetic parameters. Bioinformatics, 2, 341 – 345.
Beerli, P. and Felsenstein, J. (2001) Maximum likelihood estimation of a migration matrix
and effective population sizes in n subpopulations by using a coalescent approach.
Proc. Natl Acad. Sci. USA, 98, 4563 – 4568.
Blanco-Bercial, L., A lvarez-Marque s, F. and Bucklin, A. (2011) Comparative
phylogeography and connectivity of sibling species of the marine copepod
Clausocalanus (Calanoida). J. Exp. Mar. Biol. Ecol., 404, 108 – 115.
Bortolotto, E., Bucklin, A., Mezzavilla, M. et al. (2011) Gone with the currents: lack of
genetic differentiation at the circum-continental scale in the Antarctic krill Euphausia
superba. BMC Genetics, 12, 32.
Bucklin, A., Wiebe, P. H., Smolenack, S. B. et al. (2007) DNA barcodes for species
identification of euphausiids (Euphausiacea, Crustacea). J. Plankton Res., 29, 483 – 493.
Chu, K. H., Li, C. P. and Ho, H. Y. (2001) The first internal transcribed spacer (ITS-1) of
ribosomal DNA as a molecular marker for phylogenetic and population analyses in
Crustacea. Mar. Biotechnol., 3, 355 – 361.
Corach, D. (1991) A reliable, rapid and simple method for DNA extraction from frozen sperm
cells. Fingerprint News, 3, 13.
Crandall, K. A., Posada, D. and Vasco, D. (1999) Effective population sizes: missing
measures and missing concepts. Anim. Conserv., 2, 317 – 319.
Curtolo, L. M., Dadon, J. R. and Mazzoni, H. E. (1990) Distribution and abundance of
euphausiids off Argentina in spring 1978. Neritica, 5, 1 – 14.
Darriba, D., Taboada, G. L., Doallo, R. et al. (2012) jModelTest 2: more models, new
heuristics and parallel computing. Nat. Meth., 9, 772.
Ewens, W. J. (1972) The sampling theory of selectively neutral alleles. Theor. Popul. Biol., 3, 87
– 112.
Excoffier, L. G., Laval, G. and Schneider, S. (2005) Arlequin ver.3.0: An integrated software
package for population genetics data analysis. Evol. Bioinform., 1, 47 – 50.
http://repository.uwc.ac.za

16
Excoffier, L. G., Smouse, P. and Quattro, J. (1992) Analysis of molecular variance inferred
from metric distances among DNA haplotypes: Application to human
mitochondrial DNA restriction data. Genetics, 131, 479 – 491.
Felsenstein, J. (1985) Confidence limits on phylogenies: an approach using the bootstrap.
Evolution, 39, 783 – 791.
Folmer, O., Black, M. and Hoeh, W. et al. (1994) DNA primers for amplification of
mitochondrial cytochrome c oxidase subunit I from diverse metazoan invertebrates.
Mol. Mar. Biol. Biotechnol., 3, 294 – 297.
Fu, Y-X. (1994) A phylogenetic estimator of effective population size or mutation rate.
Genetics, 136, 685 – 692.
Fu, Y-X. (1995) Statistical properties of segregating sites. Theor. Popul. Biol., 48, 172 – 197.
Fu, Y-X. (1997) Statistical tests of neutrality of mutations against population growth,
hitchhiking and background selection. Genetics, 147, 915 – 925.
Fu, Y-X. and Li, W-H. (1993) Statistical tests of neutrality of mutations. Genetics, 133, 693 –
709.
Gibbons, M. J. (1995) Observations on euphausiid communities of the south coast of South
Africa. S. Afr. J. Mar. Sci., 16, 141 – 148.
Gibbons, M. J. and Hutchings, L. (1996) Zooplankton diversity and community
structure around southern Africa, with special attention to the Benguela upwelling
system. S. Afr. J. Sci., 92, 63 – 76.
Goodall-Copestake, W. P., Perez-Espona, S., Clark, M. S. et al. (2010) Swarms of diversity at
the gene cox1 in Antarctic krill. Heredity, 104, 3 – 518.
Guindon, S. and Gascuel, O. (2003) A simple, fast and accurate method to estimate large
phylogenies by maximum-likelihood. Syst. Biol., 52, 696 – 704.
Hall, T. (1999) BioEdit: a user-friendly biological sequence editor and analyses program
for Windows 95/98/NT. Nucl. Acid Symp., 41, 95 – 98.
Harkins, G. W. (2007) Studies on the population genetics of euphausiids: a comparison of
patterns in pelagic taxa displaying different distributions and life histories.
Unpublished PhD Thesis. University of the Western Cape, Bellville.
Hayashi, K. (1991) PCR-SSCP: A simple and sensitive method for detection of mutations in
the genomic DNA. PCR Meth. Appl., 1, 34 – 38.
Hebert, P. D. N., Cywinska, A., Ball, S. L. et al. (2003) Biological identifications through DNA
barcodes. Proc. R. Soc. Lond. B, 270, 313 – 322.
Hedgecock, D. (1994) Does variance in reproductive success limit effective population sizes
of marine organisms?. In Beaumont, A. R. (ed.), Genetics and Evolution of Aquatic
Organisms. Chapman & Hall, London, pp. 122 – 134.
Huelsenbeck, J. P. and Ronquist, F. (2001) MRBAYES: Bayesian inference of phylogeny.
Bioinformatics, 17, 754 – 755.
Jarman, S. N., Elliott, N. G., Nicol, S. et al. (2000) Molecular phylogenetics of circumglobal
Euphausia species (Euphausiacea: Crustacea). Can. J. Fish. Aquat. Sci., 57(Suppl. 3), 51 –
58.
Librado, P. and Rozas, J. (2009) DnaSP v5: a software for comprehensive analysis of DNA
polymorphism data. Bioinformatics, 25, 1451 – 1452.
Mauchline, J. (1980) The biology of mysids and euphausiids. Adv. Mar. Biol., 18, 1 – 623.
http://repository.uwc.ac.za

17
Mauchline, J. and Fisher, L. R. (1969) The biology of euphausiids. Adv. Mar. Biol., 7, 1 – 454.
Nei, M. (1987) Molecular Evolutionary Genetics. Columbia University Press, New York.
Orita, M., Iwahana, H., Kanazawa, H. et al. (1989) Detection of polymorphisms of human
DNA by gel electrophoresis as single strand conformation polymorphisms. Proc.
Natl Acad. Sci. USA, 86, 2766 – 2770.
Palma, S. and Silva, N. (2004) Distribution of siphonophores, chaetognaths, euphausiids
and oceanographic conditions in the fjords and channels of southern Chile. Deep-Sea
Res. II, 51, 513 – 535.
Palumbi, S. R., Martin, A., Romano, S. et al. (1991) A Simple Fools Guide to PCR, v 2.0.
University of Hawaii, Honolulu.
Papetti, C., Zane, L., Bortolotto, E. et al. (2005) Genetic differentiation and local temporal
stability of population structure in the euphausiid Meganyctiphanes norvegica. Mar. Ecol.
Prog. Ser., 289, 225 – 235.
Patarnello, T., Bargelloni, L., Varotto, V. et al. (1996) Krill evolution and the Antarctic Ocean
currents: evidence of vicariant speciation as inferred by molecular data. Mar. Biol.,
126, 603 – 608.
Patarnello, T., Papetti, C. and Zane, L. (2010) Genetics of northern krill (Meganyctiphanes
norvegica Sars). Adv. Mar. Biol., 57, 41 – 57.
Peijnenburg, K. T. C. A., van Haastrecht, E. K. V. and Fauvelot, C. (2005) Present day
genetic composition suggests contrasting demographic histories of two
dominant chaetognaths of the North East Atlantic Sagitta elegans and S. setosa. Mar. Biol.,
147, 1279 – 1289.
Pillar, S. C., Stuart, V., Barange, M. et al. (1992) Community structure and trophic ecology
of euphausiids in the Benguela ecosystem. S. Afr. J. Mar. Sci., 12, 393 – 409.
Posada, D. and Crandall, K. A. (1998) Modeltest: testing the model of DNA substitution.
Bioinformatics, 14, 817 – 818.
Quinn, G. and Keough, M. (2002) Experimental Design and Data Analysis for Biologists. Cambridge
University Press, Cambridge.
Rabassa, J., Coronato, A. M. and Salemme, M. (2005) Chronology of the Late Cenozoic
Patagonian glaciations and their correlation with biostratigraphic units of the
Pampean region (Argentina). J. S. Am. Earth Sci., 20, 81 – 103.
Ramirez, F. C. and Dato, C. (1983) Seasonal changes in population structure and gonadal
development of three euphausiid species. Oceanol. Acta, 6, 427 – 433.
Ronquist, F. and Huelsenbeck, J. P. (2003) MRBAYES 3: Bayesian phylogenetic
inference under mixed models. Bioinformatics, 19, 572 – 1574.
Rychlick, W. (1989 – 1992) Oligo version 4: Primer Analysis Software. National Biosciences, Inc.,
Plymouth.
Saccone, C., De Giorgi, C., Gissi, C. et al. (1999) Evolutionary genomics in Metazoa: the
mitochondrial DNA as a model system. Gene, 238, 195 – 209.
Sambrook, J., Fritsch, E. F. and Maniatis, T. (1989) Molecular Cloning: A Laboratory
Manual, 2nd edn. Cold Spring Harbour Laboratory Press, New York.
Shannon, L. V. (1985) The Benguela ecosystem. I. Evolution of the Benguela, physical
features and processes. Oceanogr. Mar. Biol., 23, 105 – 182.
http://repository.uwc.ac.za

18
Su, B., Fu, Y., Wang, Y. et al. (2001) Genetic diversity and population history of the red
panda (Ailurus fulgens) as inferred from mitochondrial DNA sequence variations. Mol.
Biol. Evol., 18, 1070 – 1076.
Tajima, F. (1983) Evolutionary relationships of DNA sequences in finite populations.
Genetics, 105, 437 – 460.
Tajima, F. (1989) Statistical method for testing the neutral mutation hypothesis by DNA
polymorphism. Genetics, 123, 585 – 595.
Tarling, G. A., Ward, P., Sheader, M. et al. (1995) Distribution patterns of macrozooplankton
assemblages in the southwest Atlantic. Mar. Ecol. Prog. Ser., 120, 29 – 40.
Verheye, H. M., Hutchings, L. and Peterson, W. T. (1991) Life history and population
maintenance strategies of Calanoides carinatus (Copepoda: Calanoida) in the
southern Benguela ecosystem. S. Afr. J. mar. Sci., 11, 179 – 191.
Watterson, G. A. (1975) On the number of segregating sites in genetic models without
recombination. Theor. Popul. Biol., 7, 256 – 276.
Zane, L. and Patarnello, T. (2000) Krill: a possible model for investigating the effects of
ocean currents on the genetic structure of a pelagic invertebrate. Can. J. Fish. Aquat. Sci.,
57, 16 – 23.
Zane, L., Ostellari, L., Maccatrozzo, L. et al. (1998) Molecular evidence for genetic subdiv\on
of Antarctic krill (Euphausia superba Dana) populations. Proc. R. Soc. Lond. B, 265, 2387 –
2391.
http://repository.uwc.ac.za


![Lucen's reactor en.wikipedia.org/wiki/Lucens reactor ]...Mar 21, 2021 · Lucen's reactor The Lucens experimental nuclear power plant ( VAKL for shor t ), also known as the Lucens](https://img.pdfslide.net/doc/110x75/612122dd5dca7b6a936da80e/lucens-reactor-en-reactor-mar-21-2021-lucens-reactor-the-lucens-experimental.jpg)