Embed Size (px)
Citation preview
SELF STORAGE VALUATION
April 7, 2011 Downey, CA
Special Purpose Property Valuation – Appraisal Institute
2
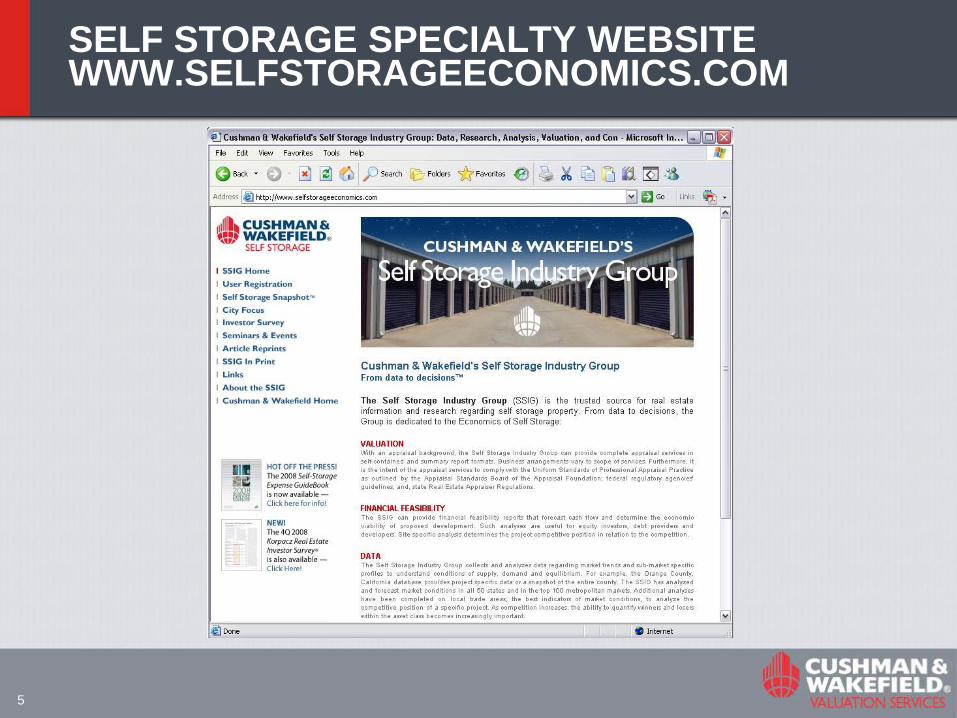
ABOUT CUSHMAN & WAKEFIELD‟S SELF STORAGE INDUSTRY GROUP
R. Christian Sonne, MAI, MRICS
Senior Managing Director
Self Storage Industry Group
Cushman & Wakefield of California, Inc.
2020 Main Street, Suite 1000
Irvine, CA 92614
Direct line: (949) 930-9241
E-mail: chris.sonne @ cushwake.com
3
“The Presenter” - Chris‟ Friend
Greer Advisors, LLC
Los Angeles
213.985.3800
New York
646.867.1600
San Francisco
415.233.6300
Dallas
214.347.7500
Miami
786.629.9600
San Diego
619.618.2500
Everett Allen Greer, MAI Managing Member
655 So. Flower St, Suite 355
Los Angeles, CA 90017
www.GreerAdvisors.com

4
ABOUT CUSHMAN & WAKEFIELD‟S SELF STORAGE INDUSTRY GROUP
The Self Storage Industry Group is a nationwide
team of professionals specializing in:
Valuation
Financial Feasibility
Data
Research
Analysis
Market Reports
Brokerage
Consultation
5
SELF STORAGE SPECIALTY WEBSITE WWW.SELFSTORAGEECONOMICS.COM
6
THE ECONOMIST
―Over the centuries inflation has moved up and
down, but rising inflation has always been
caused by excessive monetary expansion, often
associated with wars or other strains on
government finances. It is alarming, therefore,
that monetary and fiscal policies are currently so
lax. In the G7 economies the average budget
deficit as a share of GDP is almost as big as at
any time in the past 50 years, while global
monetary policy is, by some measures, at its
loosest since the 1970s — when inflation last
took off.‖
The Economist
17 June 2004
7
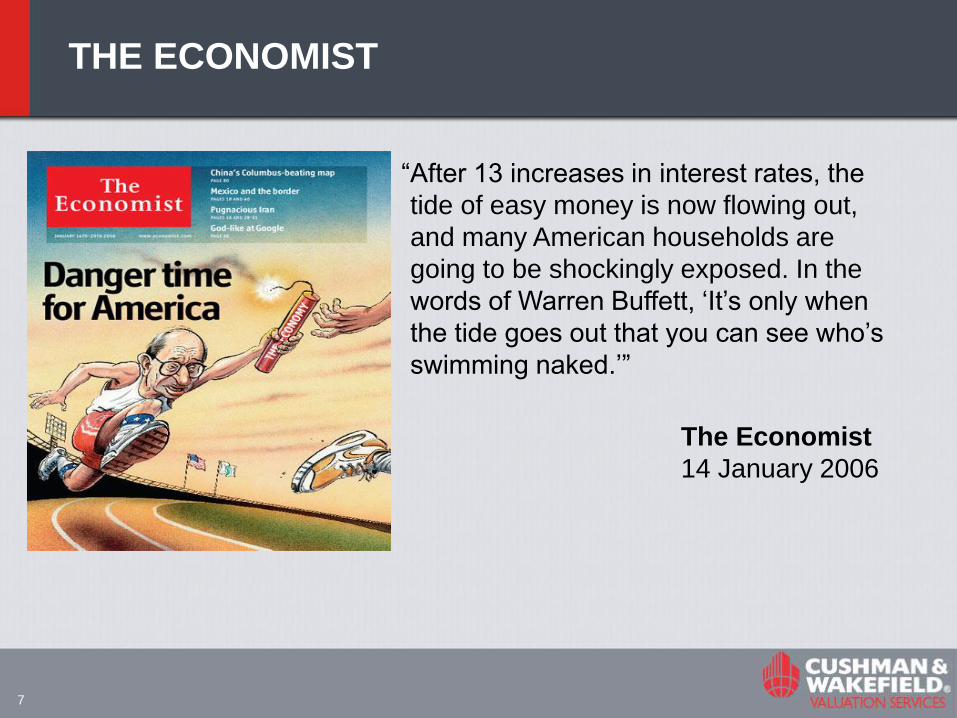
THE ECONOMIST
―After 13 increases in interest rates, the
tide of easy money is now flowing out,
and many American households are
going to be shockingly exposed. In the
words of Warren Buffett, ‗It‘s only when
the tide goes out that you can see who‘s
swimming naked.‘‖
The Economist
14 January 2006
8
MOODY‟S INVESTORS SERVICE
―The negative credit implications of the ongoing
erosion of conduit loan underwriting, particularly the
increase in leverage, now exceed the benefits of
generally positive property market fundamentals.‖
Moody‟s Investors Service
New York, NY
10 April 2007
9
NATIONAL TRENDS
HOW BAD
WAS IT ?

10
NATIONAL TRENDS – HOW BAD WAS IT?
11
NATIONAL TRENDS – HOW BAD WAS IT?
12
NATIONAL TRENDS – HOW BAD WAS IT?
13
NATIONAL TRENDS
WAS SELF STORAGE
RECESSION-PROOF ?
14
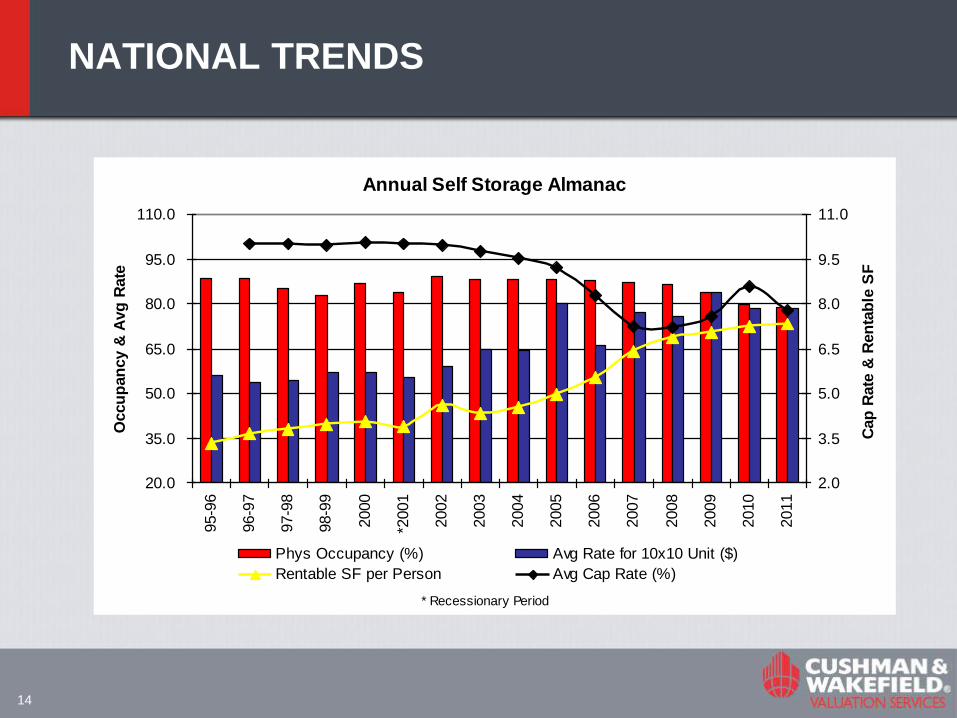
NATIONAL TRENDS
Annual Self Storage Almanac
20.0
35.0
50.0
65.0
80.0
95.0
110.095-9
6
96-9
7
97-9
8
98-9
9
2000
*2001
2002
2003
2004
2005
2006
2007
2008
2009
2010
2011
* Recessionary Period
Occu
pan
cy &
Avg
Rate
2.0
3.5
5.0
6.5
8.0
9.5
11.0
Cap
Rate
& R
en
tab
le S
F
Phys Occupancy (%) Avg Rate for 10x10 Unit ($)
Rentable SF per Person Avg Cap Rate (%)
15
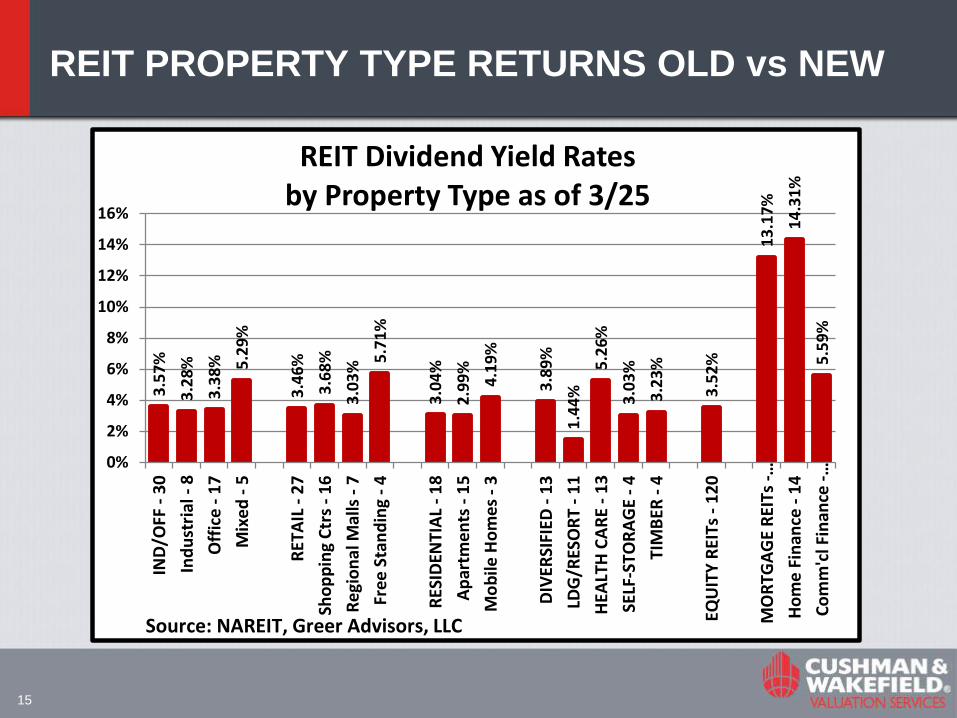
REIT PROPERTY TYPE RETURNS OLD vs NEW
Source: NAREIT
3.5
7%
3.2
8%
3.3
8% 5.2
9%
3.4
6%
3.6
8%
3.0
3%
5.7
1%
3.0
4%
2.9
9%
4.1
9%
3.8
9%
1.4
4%
5.2
6%
3.0
3%
3.2
3%
3.5
2%
13
.17
%
14
.31
%
5.5
9%
0%
2%
4%
6%
8%
10%
12%
14%
16%
IND
/OFF
- 3
0
Ind
ust
rial
- 8
Off
ice
- 1
7
Mix
ed -
5
RET
AIL
- 2
7
Sho
pp
ing
Ctr
s -
16
Reg
ion
al M
alls
- 7
Free
Sta
nd
ing
- 4
RES
IDEN
TIA
L -
18
Ap
artm
ents
- 1
5
Mo
bile
Ho
mes
- 3
DIV
ERSI
FIED
- 1
3
LDG
/RES
OR
T -
11
HEA
LTH
CA
RE
- 1
3
SELF
-STO
RA
GE
- 4
TIM
BER
- 4
EQU
ITY
REI
Ts -
120
MO
RTG
AG
E R
EITs
-…
Ho
me
Fin
ance
- 1
4
Co
mm
'cl F
inan
ce -
…
REIT Dividend Yield Rates by Property Type as of 3/25
Source: NAREIT, Greer Advisors, LLC
16
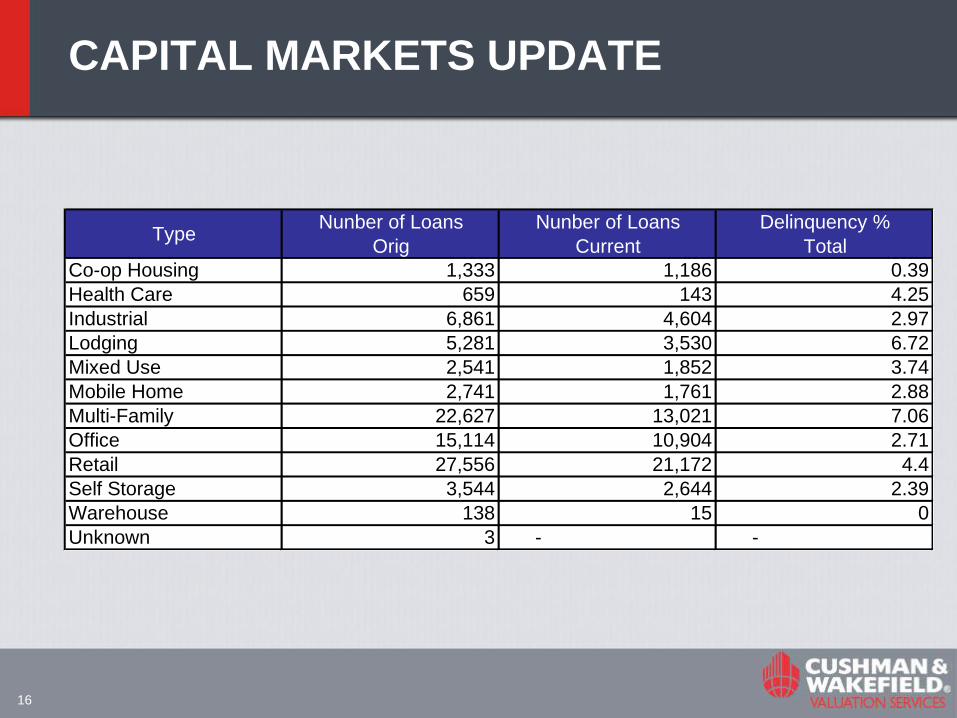
CAPITAL MARKETS UPDATE
TypeNunber of Loans
Orig
Nunber of Loans
Current
Delinquency %
Total
Co-op Housing 1,333 1,186 0.39
Health Care 659 143 4.25
Industrial 6,861 4,604 2.97
Lodging 5,281 3,530 6.72
Mixed Use 2,541 1,852 3.74
Mobile Home 2,741 1,761 2.88
Multi-Family 22,627 13,021 7.06
Office 15,114 10,904 2.71
Retail 27,556 21,172 4.4
Self Storage 3,544 2,644 2.39
Warehouse 138 15 0
Unknown 3 - -

17
CMBS WATCHLIST AND SPECIAL SERVICERS
Self Storage Properties
Watch List California: 100
Special Servicers California: 5
Watch List Nationally: 505
Special Servicers Nationally: 52

18
THE LEAF-CHRONICLE
―Rental storage units, once the provenance
of furniture packed up between moves, are
increasingly used as remote additions to a
house. Instead of the home away from
home, rental storage units are the garage
away from the garage.‖
The Leaf-Chronicle
Clarksville, TN
30 March 2006
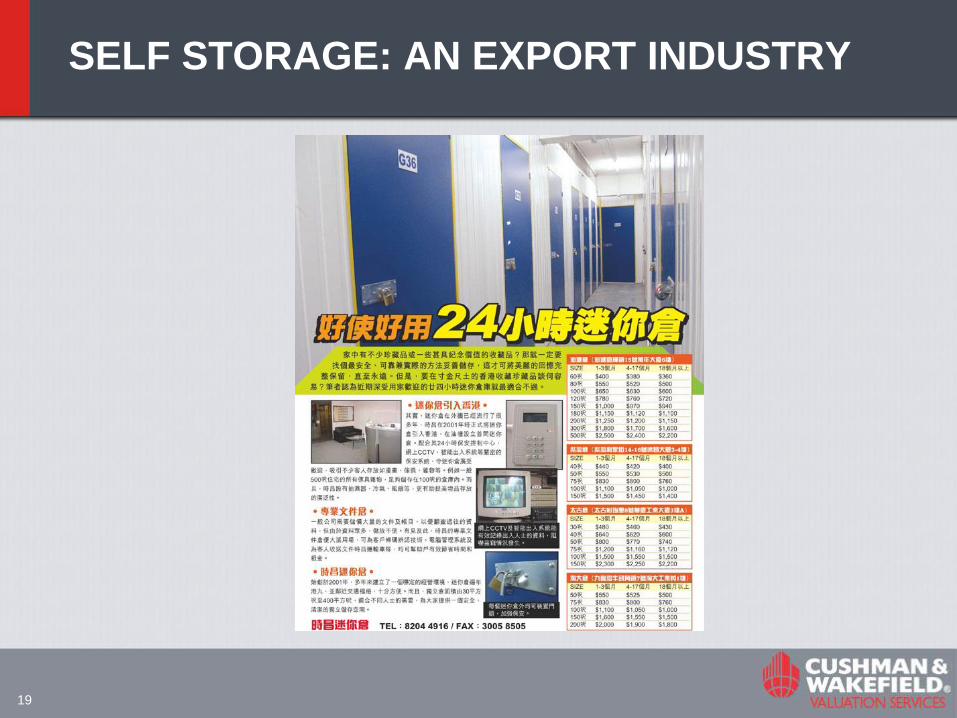
19
SELF STORAGE: AN EXPORT INDUSTRY
20
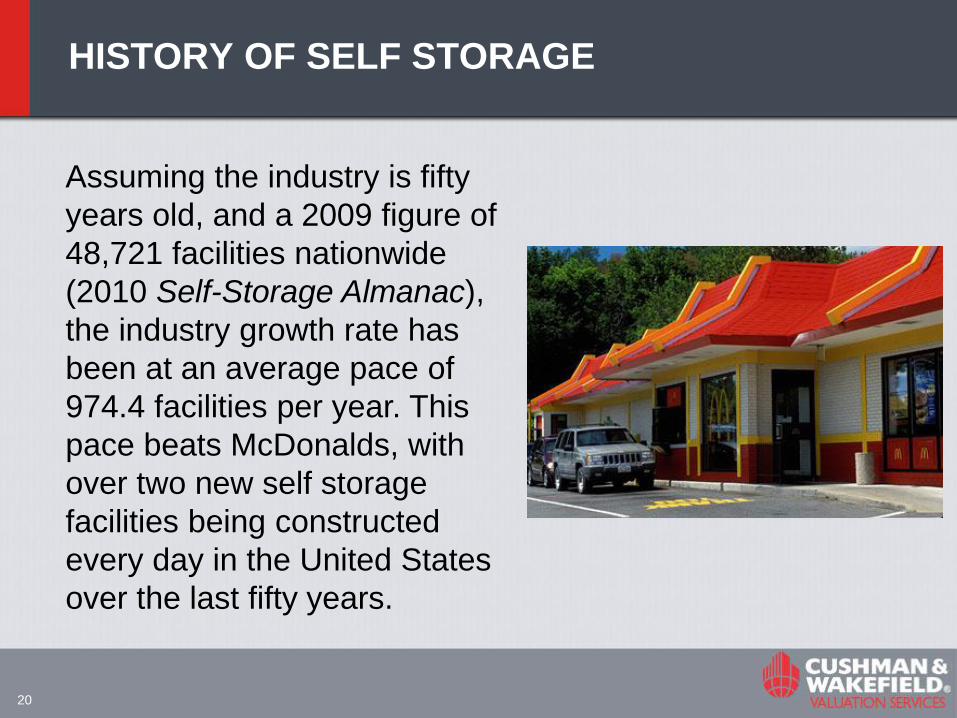
HISTORY OF SELF STORAGE
Assuming the industry is fifty
years old, and a 2009 figure of
48,721 facilities nationwide
(2010 Self-Storage Almanac),
the industry growth rate has
been at an average pace of
974.4 facilities per year. This
pace beats McDonalds, with
over two new self storage
facilities being constructed
every day in the United States
over the last fifty years.
21
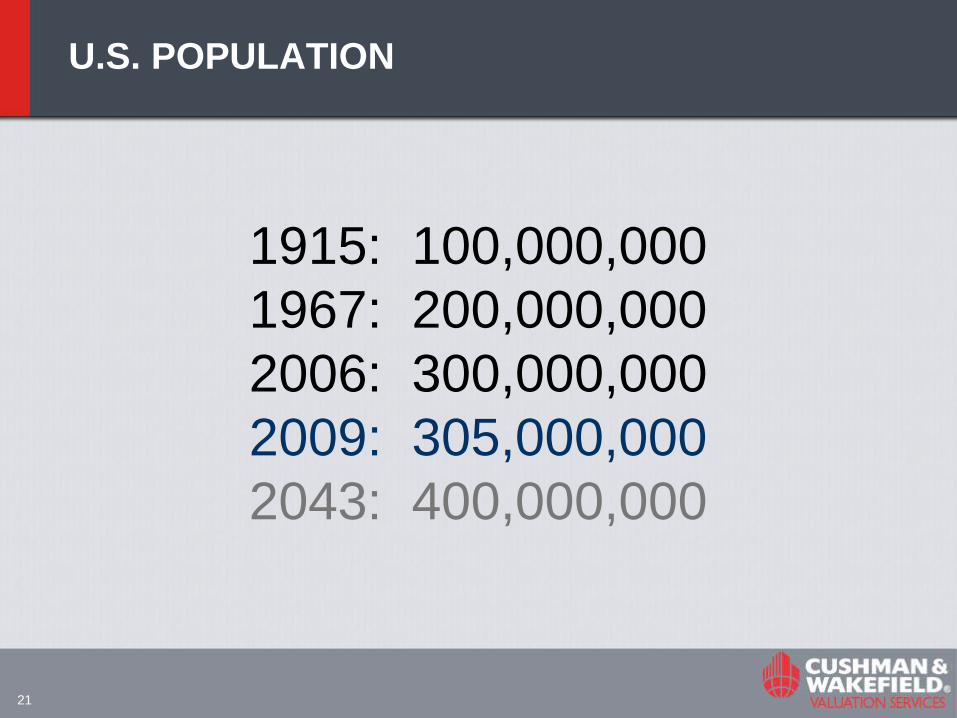
U.S. POPULATION
1915: 100,000,000
1967: 200,000,000
2006: 300,000,000
2009: 305,000,000
2043: 400,000,000
22
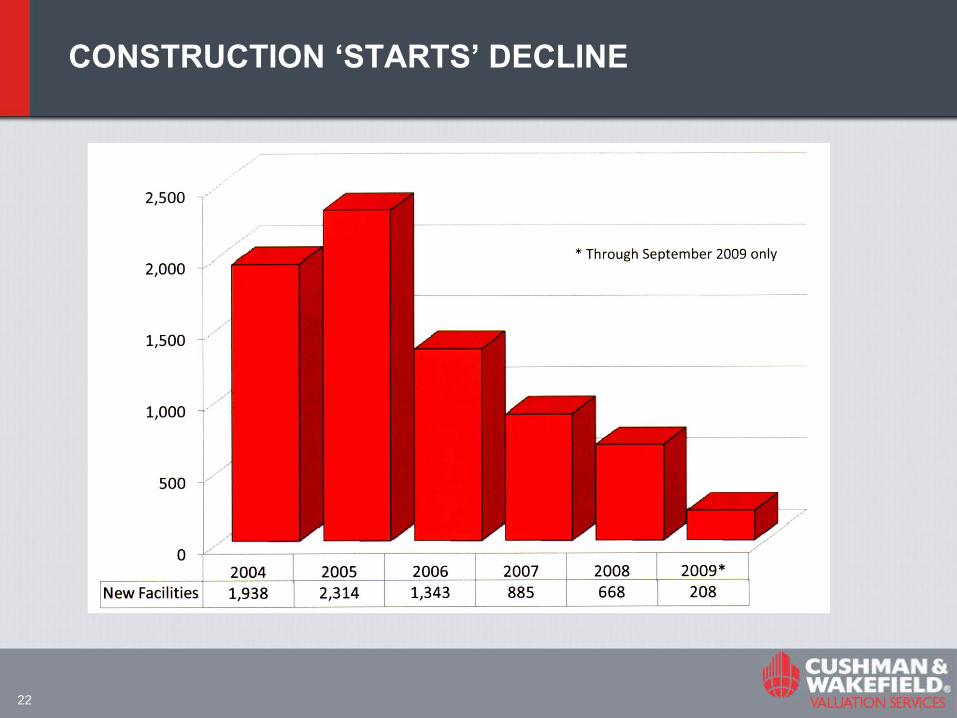
CONSTRUCTION „STARTS‟ DECLINE

23
INVESTING IN NEW REALITY
24
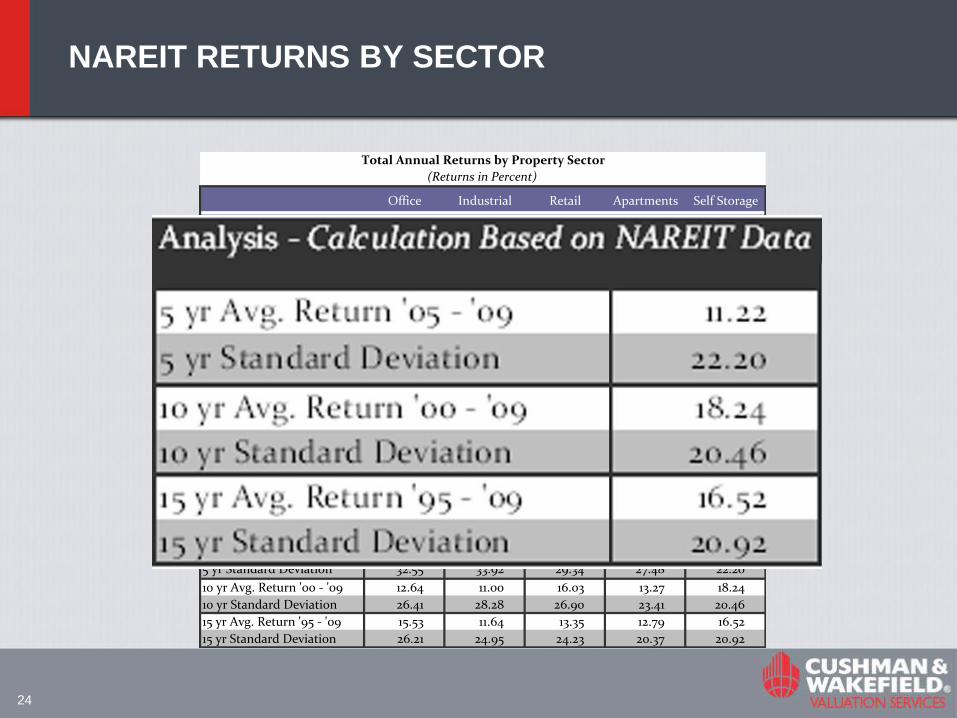
NAREIT RETURNS BY SECTOR
Office Industrial Retail Apartments Self Storage
1994 2.86 18.67 2.98 2.19 8.90
1995 38.80 16.21 5.10 12.26 34.40
1996 51.80 37.22 34.60 28.93 42.84
1997 29.01 19.02 16.95 16.04 3.41
1998 -17.35 -11.74 -4.94 -8.77 -7.20
1999 4.25 3.90 -11.77 10.73 -8.04
2000 35.46 28.62 17.97 35.53 14.69
2001 6.65 7.42 30.42 8.66 43.24
2002 -6.82 17.32 21.07 -6.15 0.56
2003 34.01 33.14 46.77 25.49 38.14
2004 23.28 34.09 40.23 34.71 29.70
2005 13.11 15.42 11.80 14.65 26.55
2006 45.22 28.92 29.01 39.95 40.95
2007 -18.96 0.38 -15.77 -25.43 -24.82
2008 -41.07 -67.47 -48.36 -25.13 5.05
2009 35.55 12.17 27.17 30.40 8.37
Source Data: NAREIT
Analysis - Calculation Based on NAREIT Data
5 yr Avg. Return '05 - '09 6.77 -2.12 0.77 6.89 11.22
5 yr Standard Deviation 32.55 33.92 29.34 27.48 22.20
10 yr Avg. Return '00 - '09 12.64 11.00 16.03 13.27 18.24
10 yr Standard Deviation 26.41 28.28 26.90 23.41 20.46
15 yr Avg. Return '95 - '09 15.53 11.64 13.35 12.79 16.52
15 yr Standard Deviation 26.21 24.95 24.23 20.37 20.92
Total Annual Returns by Property Sector
(Returns in Percent)
25
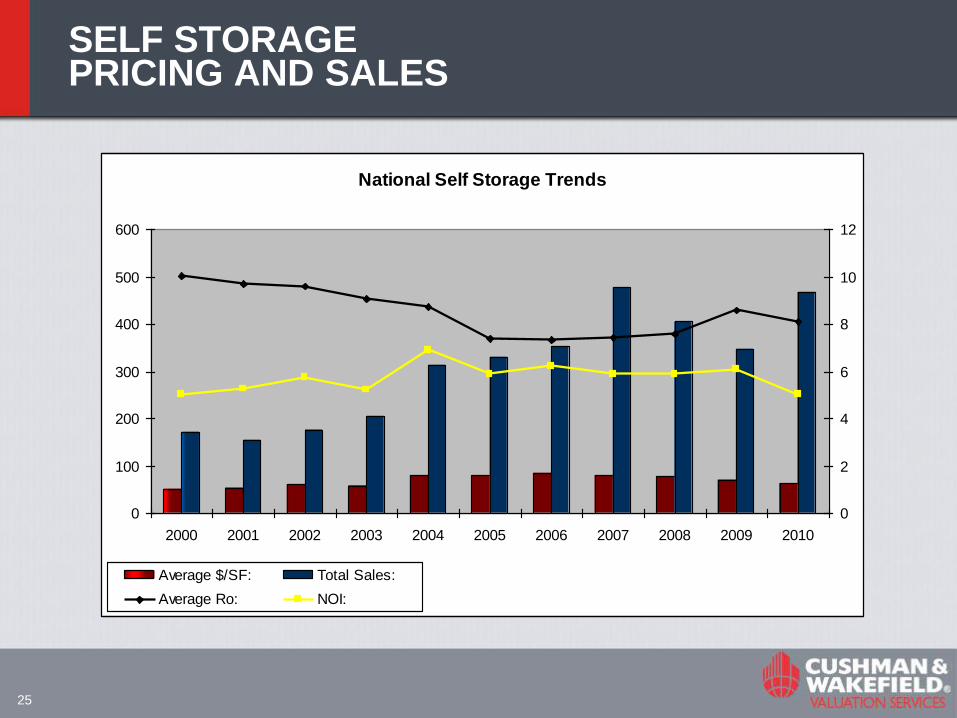
SELF STORAGE PRICING AND SALES
National Self Storage Trends
0
100
200
300
400
500
600
2000 2001 2002 2003 2004 2005 2006 2007 2008 2009 2010
0
2
4
6
8
10
12
Average $/SF: Total Sales:
Average Ro: NOI:
26
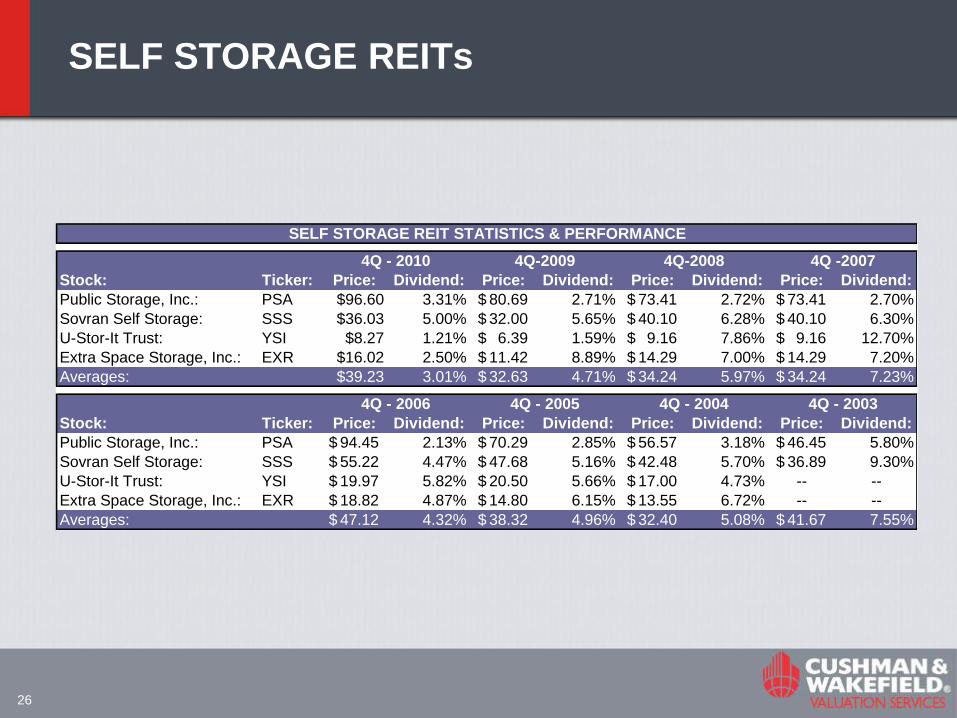
SELF STORAGE REITs
Stock: Ticker: Price: Dividend: Price: Dividend: Price: Dividend: Price: Dividend:
Public Storage, Inc.: PSA $96.60 3.31% 80.69$ 2.71% 73.41$ 2.72% 73.41$ 2.70%
Sovran Self Storage: SSS $36.03 5.00% 32.00$ 5.65% 40.10$ 6.28% 40.10$ 6.30%
U-Stor-It Trust: YSI $8.27 1.21% 6.39$ 1.59% 9.16$ 7.86% 9.16$ 12.70%
Extra Space Storage, Inc.: EXR $16.02 2.50% 11.42$ 8.89% 14.29$ 7.00% 14.29$ 7.20%
Averages: $39.23 3.01% 32.63$ 4.71% 34.24$ 5.97% 34.24$ 7.23%
Stock: Ticker: Price: Dividend: Price: Dividend: Price: Dividend: Price: Dividend:
Public Storage, Inc.: PSA 94.45$ 2.13% 70.29$ 2.85% 56.57$ 3.18% 46.45$ 5.80%
Sovran Self Storage: SSS 55.22$ 4.47% 47.68$ 5.16% 42.48$ 5.70% 36.89$ 9.30%
U-Stor-It Trust: YSI 19.97$ 5.82% 20.50$ 5.66% 17.00$ 4.73% -- --
Extra Space Storage, Inc.: EXR 18.82$ 4.87% 14.80$ 6.15% 13.55$ 6.72% -- --
Averages: 47.12$ 4.32% 38.32$ 4.96% 32.40$ 5.08% 41.67$ 7.55%
4Q - 2006 4Q - 2005 4Q - 2004 4Q - 2003
SELF STORAGE REIT STATISTICS & PERFORMANCE
4Q-2009 4Q-2008 4Q -20074Q - 2010
27
PUBLIC STORAGE
January 31, 2011 - PSA Reached a New 52 Week High at $108.88
February 1, 2011 - PSA Reached a New 52 Week High at $109.89
February 7, 2011 - PSA Reached a New 52 Week High at $110.06
February 8, 2011 - PSA Reached a New 52 Week High at $110.94
Additionally, over the last 12 months, PSA has increased 45.90%
while its peers in the Specialized REITs industry increased 36.88%.
As provided by Charles Schwab
28
EXTRA SPACE
February 1, 2011 - EXR Reached a New 52 Week High at $19.55
February 2, 2011 - EXR Reached a New 52 Week High at $19.59
February 3, 2011 - EXR Reached a New 52 Week High at $19.65
February 7, 2011 - EXR Reached a New 52 Week High at $19.69
February 7, 2011 - Additionally, over the last 12 months, EXR has
increased 73.48% while its peers in the Specialized REITs
industry increased 37.72%.
As provided by Charles Schwab
29
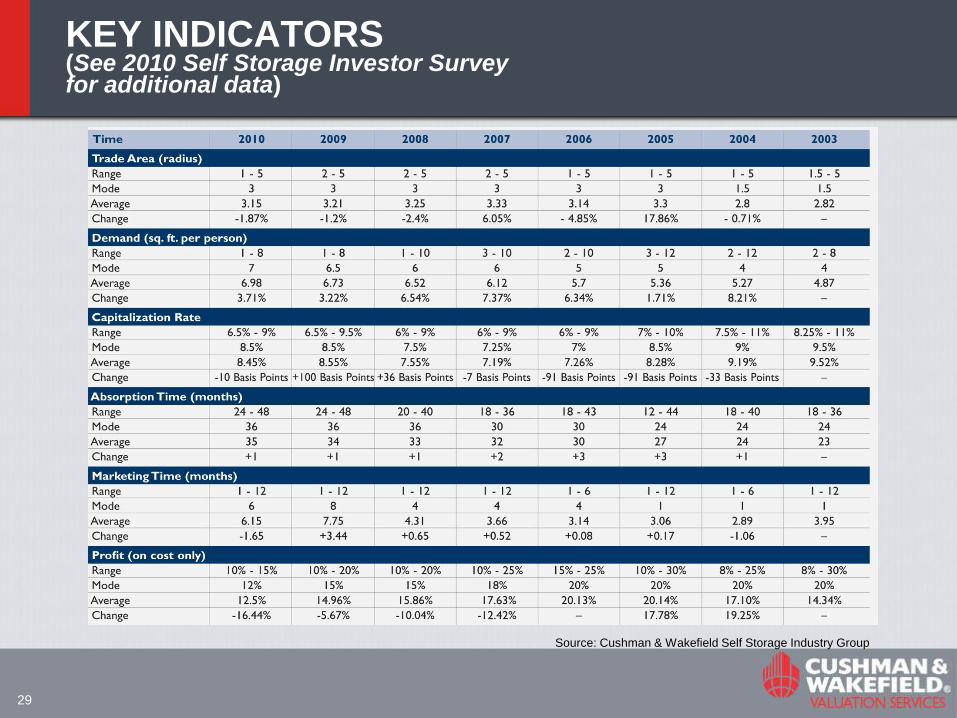
KEY INDICATORS (See 2010 Self Storage Investor Survey for additional data)
Source: Cushman & Wakefield Self Storage Industry Group
30
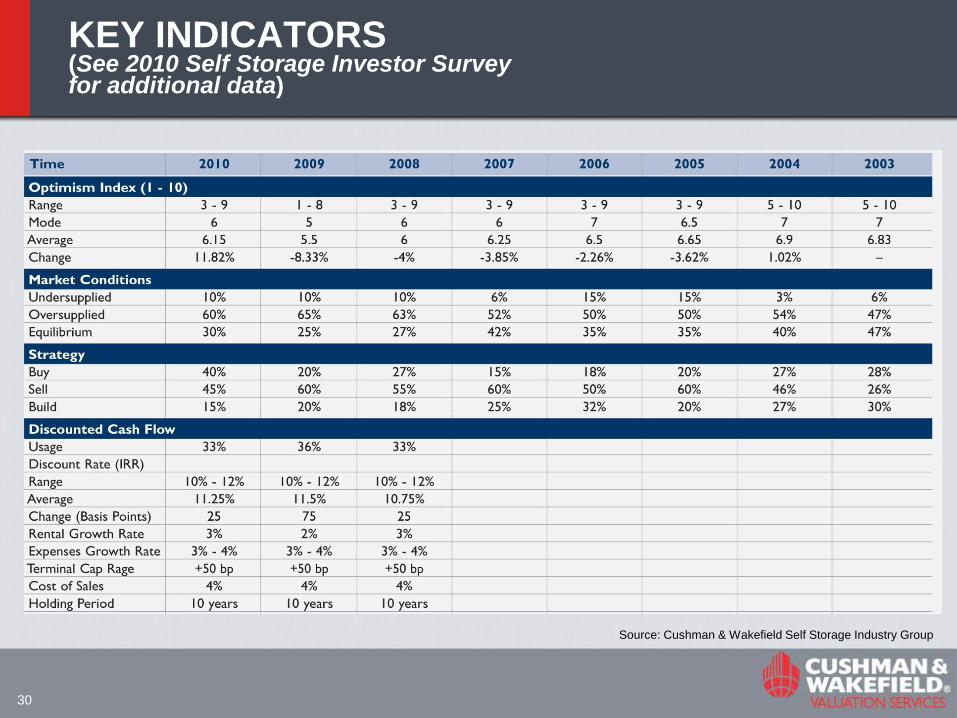
KEY INDICATORS (See 2010 Self Storage Investor Survey for additional data)
Source: Cushman & Wakefield Self Storage Industry Group
31
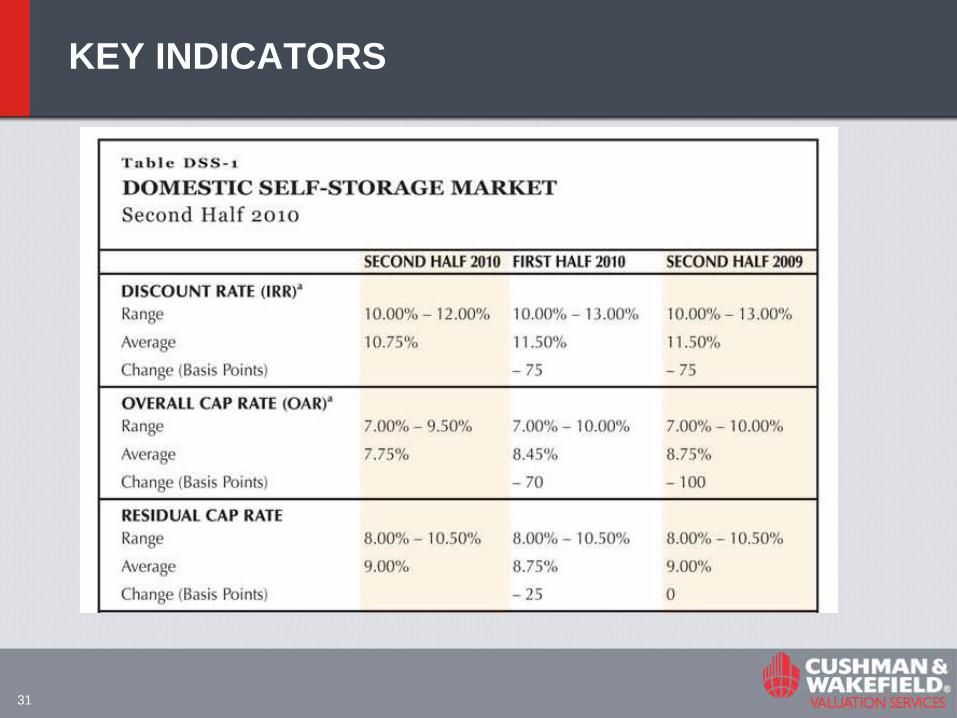
KEY INDICATORS
32
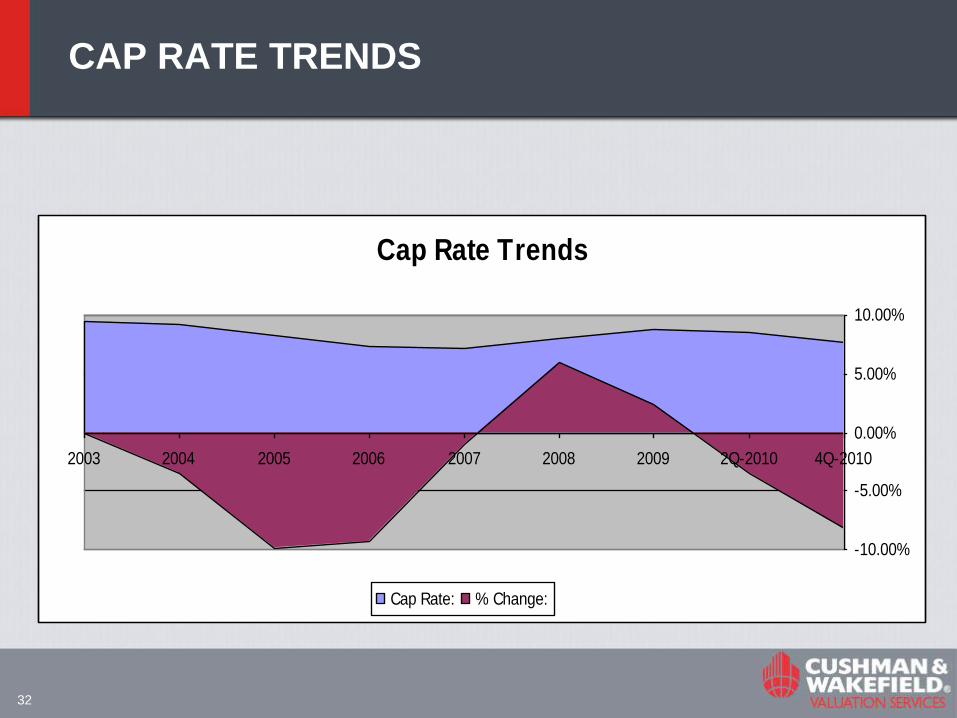
CAP RATE TRENDS
Cap Rate Trends
-10.00%
-5.00%
0.00%
5.00%
10.00%
2003 2004 2005 2006 2007 2008 2009 2Q-2010 4Q-2010
Cap Rate: % Change:

33
VACANCY TRENDS
0%
5%
10%
15%
20%
25%
19
90
19
91
19
92
19
93
19
94
19
95
19
96
19
97
19
98
19
99
20
00
20
01
20
02
20
03
20
04
20
05
20
06
20
07
20
08
20
09
20
10
National
North Central
Northeast
South Central
Southeast
West
Self Storage Vacancy Trends
34
DATA IS BETTER THAN GUESSING

35
DATA IS NOT ROCKET SCIENCE
36
MARKET ANALYSIS
37
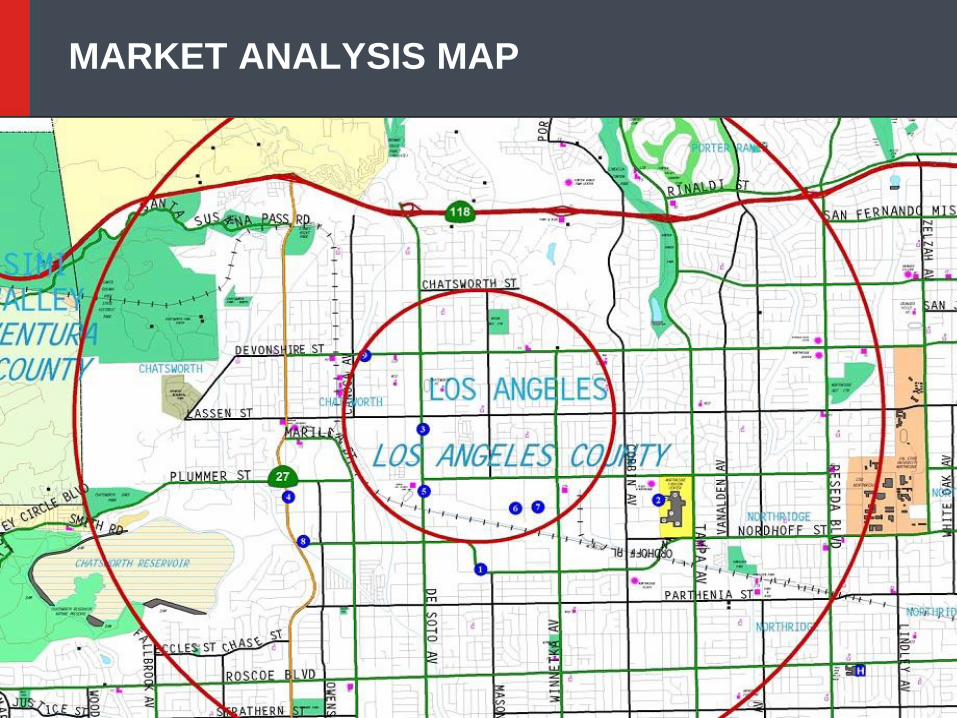
MARKET ANALYSIS MAP
38
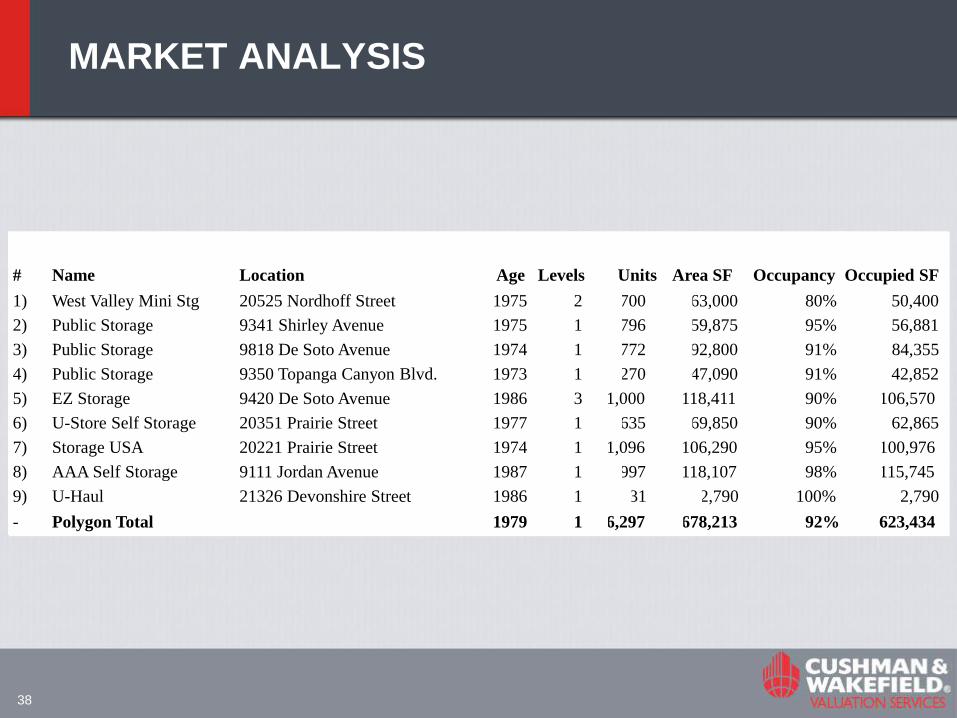
MARKET ANALYSIS
# Name Location Age Levels Units Area SF Occupancy Occupied SF
1) West Valley Mini Stg 20525 Nordhoff Street 1975 2 700 63,000 80% 50,400
2) Public Storage 9341 Shirley Avenue 1975 1 796 59,875 95% 56,881
3) Public Storage 9818 De Soto Avenue 1974 1 772 92,800 91% 84,355
4) Public Storage 9350 Topanga Canyon Blvd. 1973 1 270 47,090 91% 42,852
5) EZ Storage 9420 De Soto Avenue 1986 3 1,000 118,411 90% 106,570
6) U-Store Self Storage 20351 Prairie Street 1977 1 635 69,850 90% 62,865
7) Storage USA 20221 Prairie Street 1974 1 1,096 106,290 95% 100,976
8) AAA Self Storage 9111 Jordan Avenue 1987 1 997 118,107 98% 115,745
9) U-Haul 21326 Devonshire Street 1986 1 31 2,790 100% 2,790
- Polygon Total 1979 1 6,297 678,213 92% 623,434

39
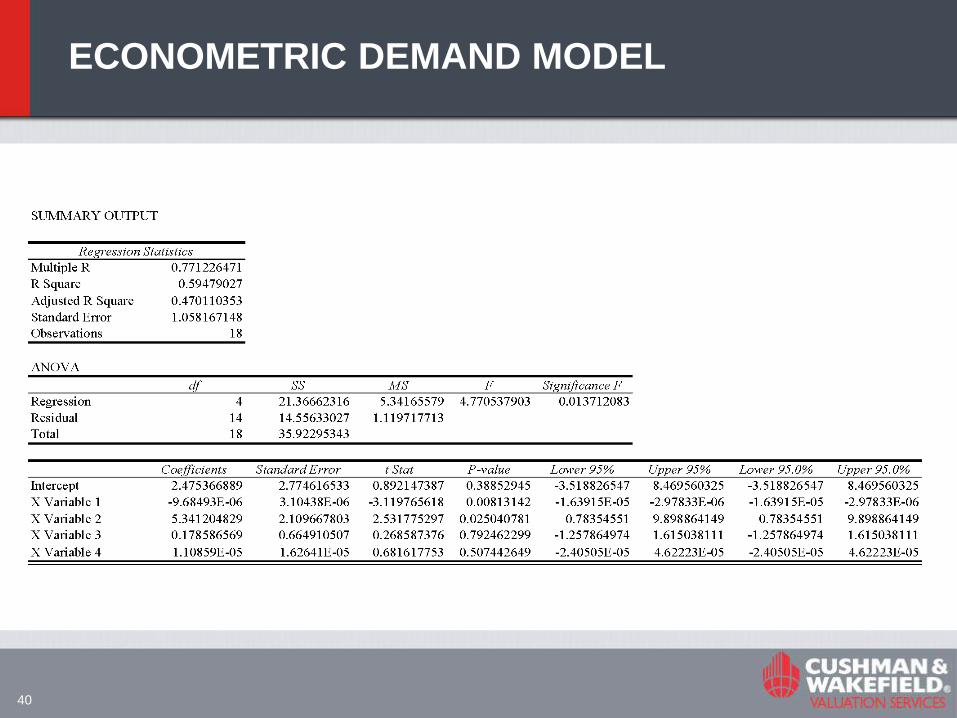
ECONOMETRIC DEMAND MODEL
40
ECONOMETRIC DEMAND MODEL

41
ECONOMETRIC DEMAND MODEL
42
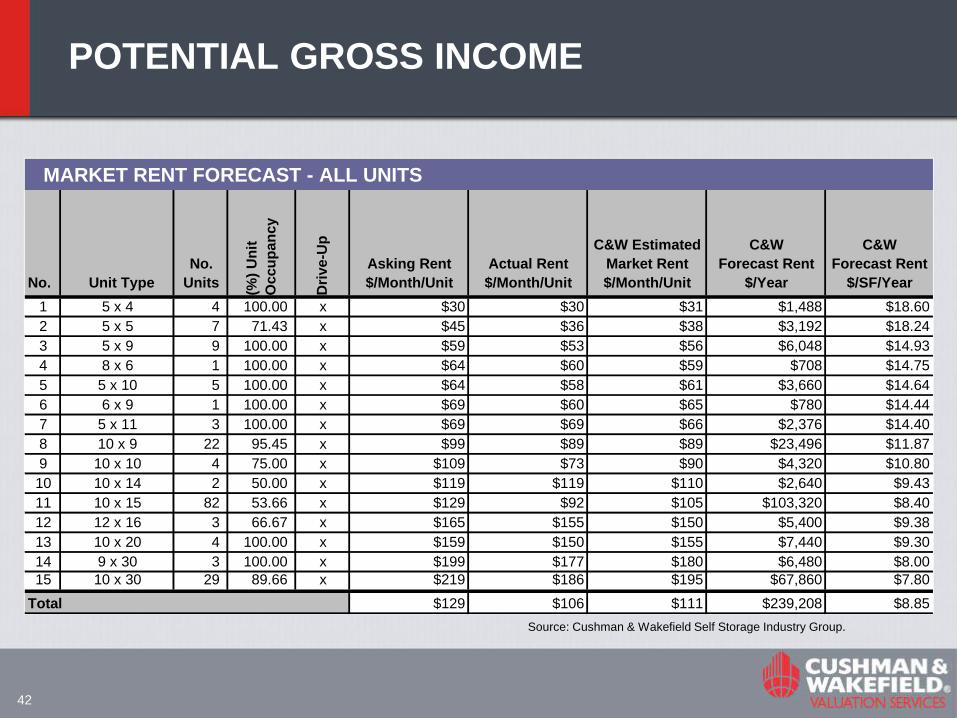
POTENTIAL GROSS INCOME
MARKET RENT FORECAST - ALL UNITS
No. Unit Type
No.
Units
(%)
Un
it
Occu
pa
ncy
Dri
ve-U
p
Asking Rent
$/Month/Unit
Actual Rent
$/Month/Unit
C&W Estimated
Market Rent
$/Month/Unit
C&W
Forecast Rent
$/Year
C&W
Forecast Rent
$/SF/Year
1 5 x 4 4 100.00 x $30 $30 $31 $1,488 $18.60
2 5 x 5 7 71.43 x $45 $36 $38 $3,192 $18.24
3 5 x 9 9 100.00 x $59 $53 $56 $6,048 $14.93
4 8 x 6 1 100.00 x $64 $60 $59 $708 $14.75
5 5 x 10 5 100.00 x $64 $58 $61 $3,660 $14.64
6 6 x 9 1 100.00 x $69 $60 $65 $780 $14.44
7 5 x 11 3 100.00 x $69 $69 $66 $2,376 $14.40
8 10 x 9 22 95.45 x $99 $89 $89 $23,496 $11.87
9 10 x 10 4 75.00 x $109 $73 $90 $4,320 $10.80
10 10 x 14 2 50.00 x $119 $119 $110 $2,640 $9.43
11 10 x 15 82 53.66 x $129 $92 $105 $103,320 $8.40
12 12 x 16 3 66.67 x $165 $155 $150 $5,400 $9.38
13 10 x 20 4 100.00 x $159 $150 $155 $7,440 $9.30
14 9 x 30 3 100.00 x $199 $177 $180 $6,480 $8.00
15 10 x 30 29 89.66 x $219 $186 $195 $67,860 $7.80
Total $129 $106 $111 $239,208 $8.85
Source: Cushman & Wakefield Self Storage Industry Group.
43
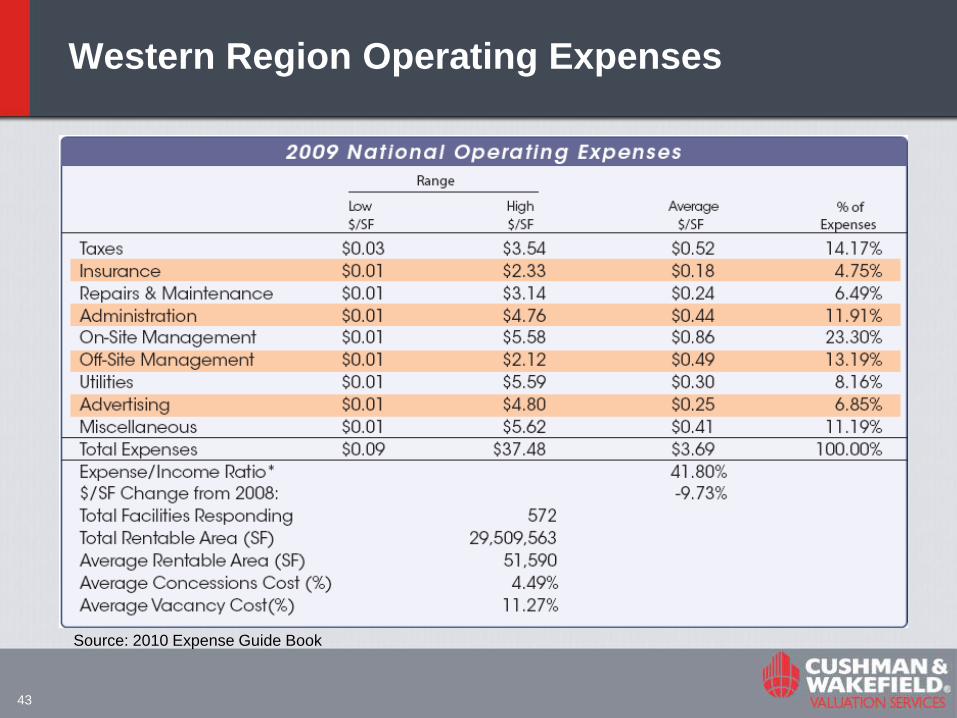
Western Region Operating Expenses
Source: 2010 Expense Guide Book
44
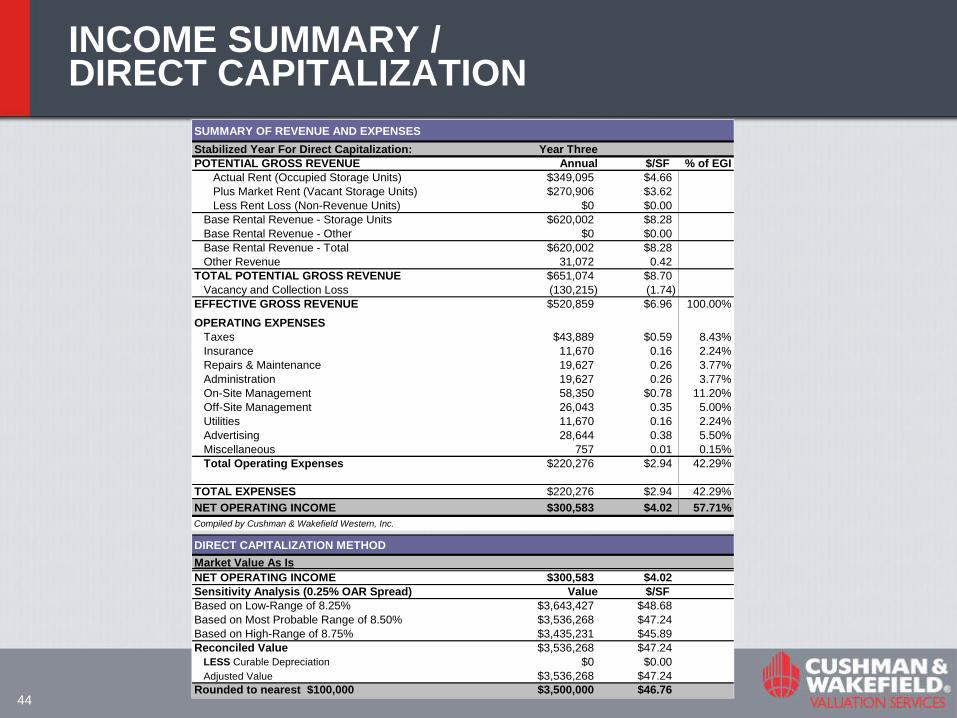
INCOME SUMMARY / DIRECT CAPITALIZATION
SUMMARY OF REVENUE AND EXPENSES
Stabilized Year For Direct Capitalization: Year Three
POTENTIAL GROSS REVENUE Annual $/SF % of EGI
Actual Rent (Occupied Storage Units) $349,095 $4.66
Plus Market Rent (Vacant Storage Units) $270,906 $3.62
Less Rent Loss (Non-Revenue Units) $0 $0.00
Base Rental Revenue - Storage Units $620,002 $8.28
Base Rental Revenue - Other $0 $0.00
Base Rental Revenue - Total $620,002 $8.28
Other Revenue 31,072 0.42
TOTAL POTENTIAL GROSS REVENUE $651,074 $8.70
Vacancy and Collection Loss (130,215) (1.74)
EFFECTIVE GROSS REVENUE $520,859 $6.96 100.00%
OPERATING EXPENSES
Taxes $43,889 $0.59 8.43%
Insurance 11,670 0.16 2.24%
Repairs & Maintenance 19,627 0.26 3.77%
Administration 19,627 0.26 3.77%
On-Site Management 58,350 $0.78 11.20%
Off-Site Management 26,043 0.35 5.00%
Utilities 11,670 0.16 2.24%
Advertising 28,644 0.38 5.50%
Miscellaneous 757 0.01 0.15%
Total Operating Expenses $220,276 $2.94 42.29%
TOTAL EXPENSES $220,276 $2.94 42.29%
NET OPERATING INCOME $300,583 $4.02 57.71%
Compiled by Cushman & Wakefield Western, Inc.
DIRECT CAPITALIZATION METHOD
Market Value As Is
NET OPERATING INCOME $300,583 $4.02
Sensitivity Analysis (0.25% OAR Spread) Value $/SF
Based on Low-Range of 8.25% $3,643,427 $48.68
Based on Most Probable Range of 8.50% $3,536,268 $47.24
Based on High-Range of 8.75% $3,435,231 $45.89
Reconciled Value $3,536,268 $47.24
LESS Curable Depreciation $0 $0.00
Adjusted Value $3,536,268 $47.24
Rounded to nearest $100,000 $3,500,000 $46.76
45
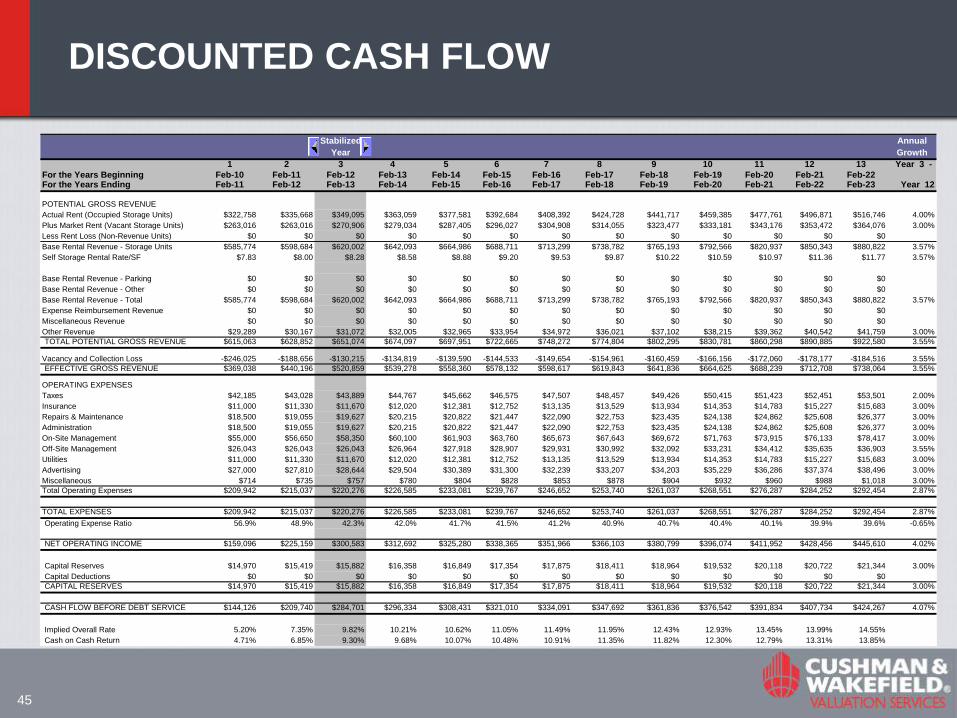
DISCOUNTED CASH FLOW
Stabilized Annual
Year Growth
1 2 3 4 5 6 7 8 9 10 11 12 13 Year 3 -
For the Years Beginning Feb-10 Feb-11 Feb-12 Feb-13 Feb-14 Feb-15 Feb-16 Feb-17 Feb-18 Feb-19 Feb-20 Feb-21 Feb-22For the Years Ending Feb-11 Feb-12 Feb-13 Feb-14 Feb-15 Feb-16 Feb-17 Feb-18 Feb-19 Feb-20 Feb-21 Feb-22 Feb-23 Year 12
POTENTIAL GROSS REVENUE
Actual Rent (Occupied Storage Units) $322,758 $335,668 $349,095 $363,059 $377,581 $392,684 $408,392 $424,728 $441,717 $459,385 $477,761 $496,871 $516,746 4.00%
Plus Market Rent (Vacant Storage Units) $263,016 $263,016 $270,906 $279,034 $287,405 $296,027 $304,908 $314,055 $323,477 $333,181 $343,176 $353,472 $364,076 3.00%
Less Rent Loss (Non-Revenue Units) $0 $0 $0 $0 $0 $0 $0 $0 $0 $0 $0 $0 $0
Base Rental Revenue - Storage Units $585,774 $598,684 $620,002 $642,093 $664,986 $688,711 $713,299 $738,782 $765,193 $792,566 $820,937 $850,343 $880,822 3.57%
Self Storage Rental Rate/SF $7.83 $8.00 $8.28 $8.58 $8.88 $9.20 $9.53 $9.87 $10.22 $10.59 $10.97 $11.36 $11.77 3.57%
Base Rental Revenue - Parking $0 $0 $0 $0 $0 $0 $0 $0 $0 $0 $0 $0 $0
Base Rental Revenue - Other $0 $0 $0 $0 $0 $0 $0 $0 $0 $0 $0 $0 $0
Base Rental Revenue - Total $585,774 $598,684 $620,002 $642,093 $664,986 $688,711 $713,299 $738,782 $765,193 $792,566 $820,937 $850,343 $880,822 3.57%
Expense Reimbursement Revenue $0 $0 $0 $0 $0 $0 $0 $0 $0 $0 $0 $0 $0
Miscellaneous Revenue $0 $0 $0 $0 $0 $0 $0 $0 $0 $0 $0 $0 $0
Other Revenue $29,289 $30,167 $31,072 $32,005 $32,965 $33,954 $34,972 $36,021 $37,102 $38,215 $39,362 $40,542 $41,759 3.00%
TOTAL POTENTIAL GROSS REVENUE $615,063 $628,852 $651,074 $674,097 $697,951 $722,665 $748,272 $774,804 $802,295 $830,781 $860,298 $890,885 $922,580 3.55%
Vacancy and Collection Loss -$246,025 -$188,656 -$130,215 -$134,819 -$139,590 -$144,533 -$149,654 -$154,961 -$160,459 -$166,156 -$172,060 -$178,177 -$184,516 3.55%
EFFECTIVE GROSS REVENUE $369,038 $440,196 $520,859 $539,278 $558,360 $578,132 $598,617 $619,843 $641,836 $664,625 $688,239 $712,708 $738,064 3.55%
OPERATING EXPENSES
Taxes $42,185 $43,028 $43,889 $44,767 $45,662 $46,575 $47,507 $48,457 $49,426 $50,415 $51,423 $52,451 $53,501 2.00%
Insurance $11,000 $11,330 $11,670 $12,020 $12,381 $12,752 $13,135 $13,529 $13,934 $14,353 $14,783 $15,227 $15,683 3.00%
Repairs & Maintenance $18,500 $19,055 $19,627 $20,215 $20,822 $21,447 $22,090 $22,753 $23,435 $24,138 $24,862 $25,608 $26,377 3.00%
Administration $18,500 $19,055 $19,627 $20,215 $20,822 $21,447 $22,090 $22,753 $23,435 $24,138 $24,862 $25,608 $26,377 3.00%
On-Site Management $55,000 $56,650 $58,350 $60,100 $61,903 $63,760 $65,673 $67,643 $69,672 $71,763 $73,915 $76,133 $78,417 3.00%
Off-Site Management $26,043 $26,043 $26,043 $26,964 $27,918 $28,907 $29,931 $30,992 $32,092 $33,231 $34,412 $35,635 $36,903 3.55%
Utilities $11,000 $11,330 $11,670 $12,020 $12,381 $12,752 $13,135 $13,529 $13,934 $14,353 $14,783 $15,227 $15,683 3.00%
Advertising $27,000 $27,810 $28,644 $29,504 $30,389 $31,300 $32,239 $33,207 $34,203 $35,229 $36,286 $37,374 $38,496 3.00%
Miscellaneous $714 $735 $757 $780 $804 $828 $853 $878 $904 $932 $960 $988 $1,018 3.00%
Total Operating Expenses $209,942 $215,037 $220,276 $226,585 $233,081 $239,767 $246,652 $253,740 $261,037 $268,551 $276,287 $284,252 $292,454 2.87%
TOTAL EXPENSES $209,942 $215,037 $220,276 $226,585 $233,081 $239,767 $246,652 $253,740 $261,037 $268,551 $276,287 $284,252 $292,454 2.87%
Operating Expense Ratio 56.9% 48.9% 42.3% 42.0% 41.7% 41.5% 41.2% 40.9% 40.7% 40.4% 40.1% 39.9% 39.6% -0.65%
NET OPERATING INCOME $159,096 $225,159 $300,583 $312,692 $325,280 $338,365 $351,966 $366,103 $380,799 $396,074 $411,952 $428,456 $445,610 4.02%
Capital Reserves $14,970 $15,419 $15,882 $16,358 $16,849 $17,354 $17,875 $18,411 $18,964 $19,532 $20,118 $20,722 $21,344 3.00%
Capital Deductions $0 $0 $0 $0 $0 $0 $0 $0 $0 $0 $0 $0 $0
CAPITAL RESERVES $14,970 $15,419 $15,882 $16,358 $16,849 $17,354 $17,875 $18,411 $18,964 $19,532 $20,118 $20,722 $21,344 3.00%
CASH FLOW BEFORE DEBT SERVICE $144,126 $209,740 $284,701 $296,334 $308,431 $321,010 $334,091 $347,692 $361,836 $376,542 $391,834 $407,734 $424,267 4.07%
Implied Overall Rate 5.20% 7.35% 9.82% 10.21% 10.62% 11.05% 11.49% 11.95% 12.43% 12.93% 13.45% 13.99% 14.55%
Cash on Cash Return 4.71% 6.85% 9.30% 9.68% 10.07% 10.48% 10.91% 11.35% 11.82% 12.30% 12.79% 13.31% 13.85%
46
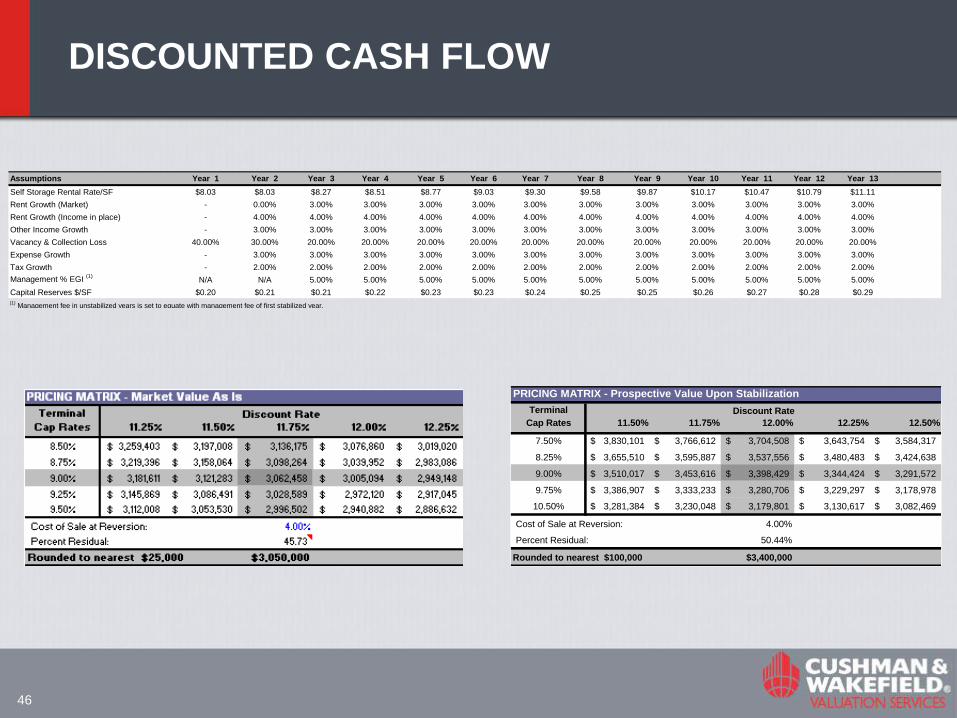
DISCOUNTED CASH FLOW
Assumptions Year 1 Year 2 Year 3 Year 4 Year 5 Year 6 Year 7 Year 8 Year 9 Year 10 Year 11 Year 12 Year 13
Self Storage Rental Rate/SF $8.03 $8.03 $8.27 $8.51 $8.77 $9.03 $9.30 $9.58 $9.87 $10.17 $10.47 $10.79 $11.11
Rent Growth (Market) - 0.00% 3.00% 3.00% 3.00% 3.00% 3.00% 3.00% 3.00% 3.00% 3.00% 3.00% 3.00%
Rent Growth (Income in place) - 4.00% 4.00% 4.00% 4.00% 4.00% 4.00% 4.00% 4.00% 4.00% 4.00% 4.00% 4.00%
Other Income Growth - 3.00% 3.00% 3.00% 3.00% 3.00% 3.00% 3.00% 3.00% 3.00% 3.00% 3.00% 3.00%
Vacancy & Collection Loss 40.00% 30.00% 20.00% 20.00% 20.00% 20.00% 20.00% 20.00% 20.00% 20.00% 20.00% 20.00% 20.00%
Expense Growth - 3.00% 3.00% 3.00% 3.00% 3.00% 3.00% 3.00% 3.00% 3.00% 3.00% 3.00% 3.00%
Tax Growth - 2.00% 2.00% 2.00% 2.00% 2.00% 2.00% 2.00% 2.00% 2.00% 2.00% 2.00% 2.00%
Management % EGI (1)
N/A N/A 5.00% 5.00% 5.00% 5.00% 5.00% 5.00% 5.00% 5.00% 5.00% 5.00% 5.00%
Capital Reserves $/SF $0.20 $0.21 $0.21 $0.22 $0.23 $0.23 $0.24 $0.25 $0.25 $0.26 $0.27 $0.28 $0.29(1)
Management fee in unstabilized years is set to equate with management fee of first stabilized year.
Terminal
Cap Rates 11.50% 11.75% 12.00% 12.25% 12.50%
7.50% 3,830,101$ 3,766,612$ 3,704,508$ 3,643,754$ 3,584,317$
8.25% 3,655,510$ 3,595,887$ 3,537,556$ 3,480,483$ 3,424,638$
9.00% 3,510,017$ 3,453,616$ 3,398,429$ 3,344,424$ 3,291,572$
9.75% 3,386,907$ 3,333,233$ 3,280,706$ 3,229,297$ 3,178,978$
10.50% 3,281,384$ 3,230,048$ 3,179,801$ 3,130,617$ 3,082,469$
Cost of Sale at Reversion: 4.00%
Percent Residual: 50.44%
$3,400,000Rounded to nearest $100,000
Discount Rate
PRICING MATRIX - Prospective Value Upon Stabilization
47
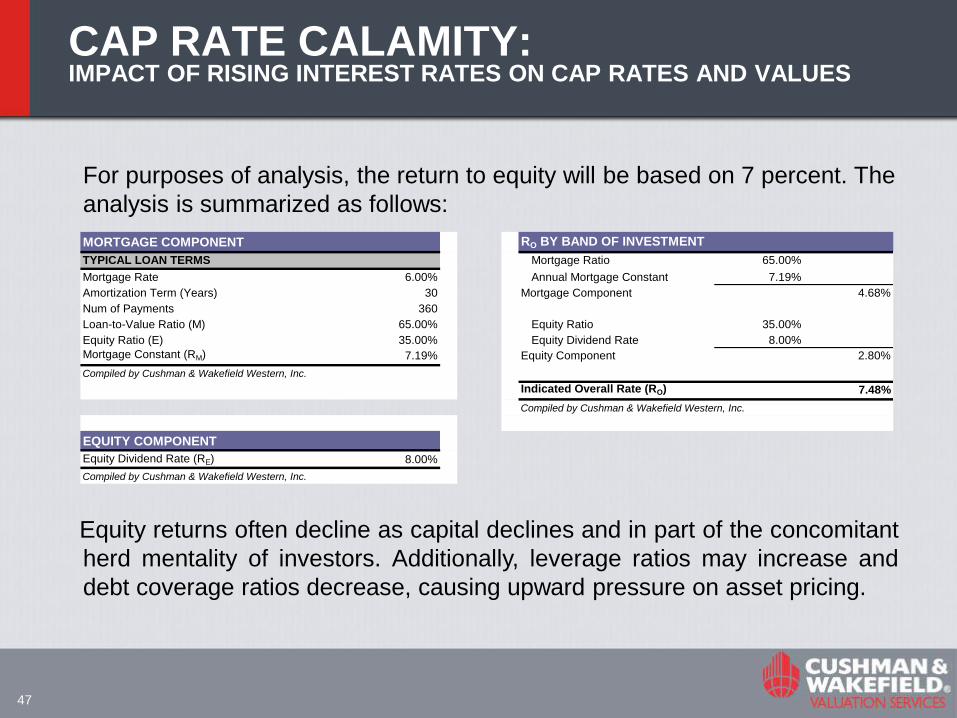
CAP RATE CALAMITY: IMPACT OF RISING INTEREST RATES ON CAP RATES AND VALUES
For purposes of analysis, the return to equity will be based on 7 percent. The
analysis is summarized as follows:
Equity returns often decline as capital declines and in part of the concomitant
herd mentality of investors. Additionally, leverage ratios may increase and
debt coverage ratios decrease, causing upward pressure on asset pricing.
MORTGAGE COMPONENT RO BY BAND OF INVESTMENT
TYPICAL LOAN TERMS Mortgage Ratio 65.00%
Mortgage Rate 6.00% Annual Mortgage Constant 7.19%
Amortization Term (Years) 30 Mortgage Component 4.68%
Num of Payments 360
Loan-to-Value Ratio (M) 65.00% Equity Ratio 35.00%
Equity Ratio (E) 35.00% Equity Dividend Rate 8.00%
Mortgage Constant (RM) 7.19% Equity Component 2.80%
Compiled by Cushman & Wakefield Western, Inc.
Indicated Overall Rate (RO) 7.48%
Compiled by Cushman & Wakefield Western, Inc.
EQUITY COMPONENT
Equity Dividend Rate (RE) 8.00%
Compiled by Cushman & Wakefield Western, Inc.
48
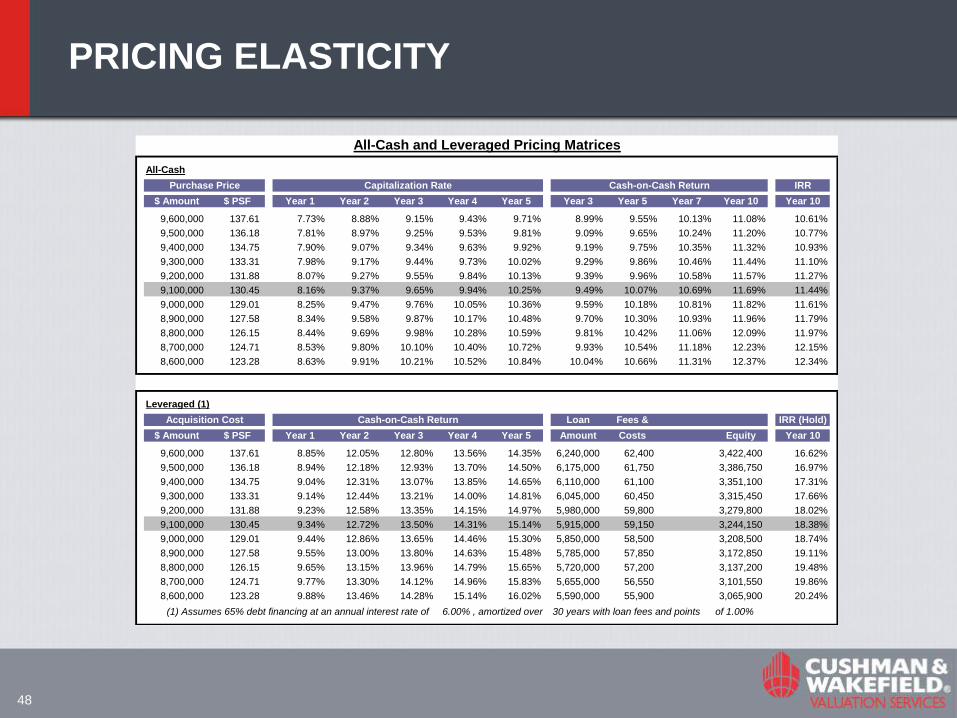
PRICING ELASTICITY
All-Cash
IRR
$ Amount $ PSF Year 1 Year 2 Year 3 Year 4 Year 5 Year 3 Year 5 Year 7 Year 10 Year 10
9,600,000 137.61 7.73% 8.88% 9.15% 9.43% 9.71% 8.99% 9.55% 10.13% 11.08% 10.61%
9,500,000 136.18 7.81% 8.97% 9.25% 9.53% 9.81% 9.09% 9.65% 10.24% 11.20% 10.77%
9,400,000 134.75 7.90% 9.07% 9.34% 9.63% 9.92% 9.19% 9.75% 10.35% 11.32% 10.93%
9,300,000 133.31 7.98% 9.17% 9.44% 9.73% 10.02% 9.29% 9.86% 10.46% 11.44% 11.10%
9,200,000 131.88 8.07% 9.27% 9.55% 9.84% 10.13% 9.39% 9.96% 10.58% 11.57% 11.27%
9,100,000 130.45 8.16% 9.37% 9.65% 9.94% 10.25% 9.49% 10.07% 10.69% 11.69% 11.44%
9,000,000 129.01 8.25% 9.47% 9.76% 10.05% 10.36% 9.59% 10.18% 10.81% 11.82% 11.61%
8,900,000 127.58 8.34% 9.58% 9.87% 10.17% 10.48% 9.70% 10.30% 10.93% 11.96% 11.79%
8,800,000 126.15 8.44% 9.69% 9.98% 10.28% 10.59% 9.81% 10.42% 11.06% 12.09% 11.97%
8,700,000 124.71 8.53% 9.80% 10.10% 10.40% 10.72% 9.93% 10.54% 11.18% 12.23% 12.15%
8,600,000 123.28 8.63% 9.91% 10.21% 10.52% 10.84% 10.04% 10.66% 11.31% 12.37% 12.34%
Leveraged (1)
Loan Fees & IRR (Hold)
$ Amount $ PSF Year 1 Year 2 Year 3 Year 4 Year 5 Amount Costs Equity Year 10
9,600,000 137.61 8.85% 12.05% 12.80% 13.56% 14.35% 6,240,000 62,400 3,422,400 16.62%
9,500,000 136.18 8.94% 12.18% 12.93% 13.70% 14.50% 6,175,000 61,750 3,386,750 16.97%
9,400,000 134.75 9.04% 12.31% 13.07% 13.85% 14.65% 6,110,000 61,100 3,351,100 17.31%
9,300,000 133.31 9.14% 12.44% 13.21% 14.00% 14.81% 6,045,000 60,450 3,315,450 17.66%
9,200,000 131.88 9.23% 12.58% 13.35% 14.15% 14.97% 5,980,000 59,800 3,279,800 18.02%
9,100,000 130.45 9.34% 12.72% 13.50% 14.31% 15.14% 5,915,000 59,150 3,244,150 18.38%
9,000,000 129.01 9.44% 12.86% 13.65% 14.46% 15.30% 5,850,000 58,500 3,208,500 18.74%
8,900,000 127.58 9.55% 13.00% 13.80% 14.63% 15.48% 5,785,000 57,850 3,172,850 19.11%
8,800,000 126.15 9.65% 13.15% 13.96% 14.79% 15.65% 5,720,000 57,200 3,137,200 19.48%
8,700,000 124.71 9.77% 13.30% 14.12% 14.96% 15.83% 5,655,000 56,550 3,101,550 19.86%
8,600,000 123.28 9.88% 13.46% 14.28% 15.14% 16.02% 5,590,000 55,900 3,065,900 20.24%
of 1.00%(1) Assumes 65% debt financing at an annual interest rate of 6.00% , amortized over 30 years with loan fees and points
Acquisition Cost Cash-on-Cash Return
All-Cash and Leveraged Pricing Matrices
Purchase Price Capitalization Rate Cash-on-Cash Return

49
SPECIAL TOPICS IN CALAMITY PHYSICS & SELF STORAGE
USAGE ISSUES?
50
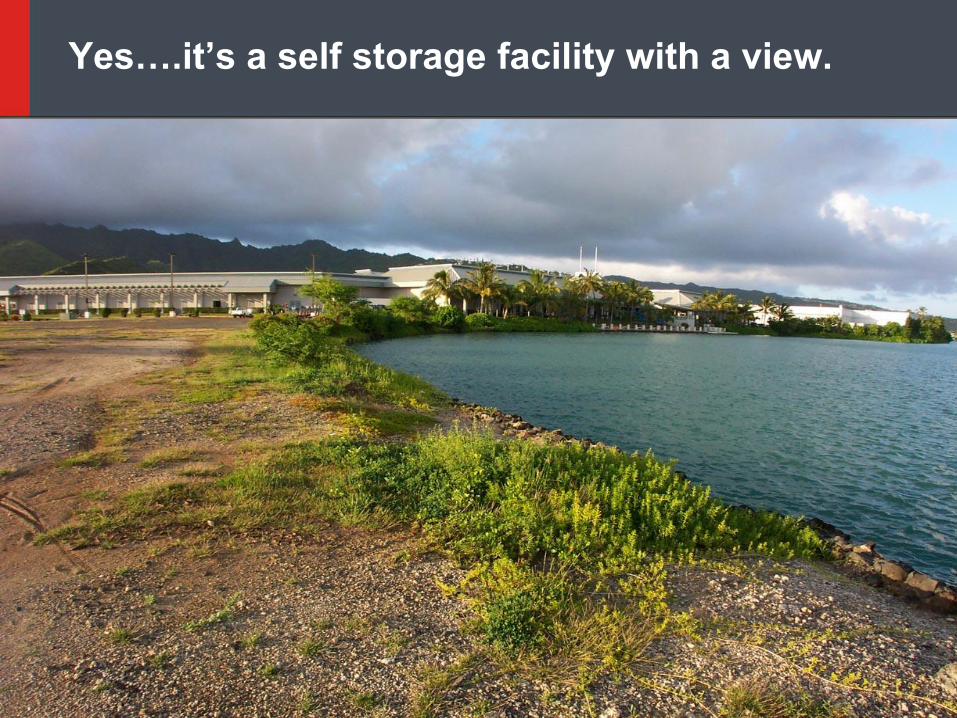
Yes….it‟s a self storage facility with a view.

51
Yes…another self storage facility…
QUESTIONS
April 7, 2011
Self Storage Industry…presented by Everett Allen Greer
53
Questions / Answers
Greer Advisors, LLC
www.GreerAdvisors.com
Los Angeles
213.985.3800
New York
646.867.1600
San Francisco
415.233.6300
Dallas
214.347.7500
Miami
786.629.9600
San Diego
619.618.2500