Embed Size (px)
Citation preview

WREN.EIC 8/4/2010 9:46 AM
SELLING BLUE ELEPHANTS TO THE JURY: POTENTIAL APPLICATION OF
RULE DEVELOPING EXPERIMENTATION IN LITIGATION
James E. Wren* and Timothy C. Williams
**
I. INTRODUCTION .................................................................................1
II. PROBLEMS ASSOCIATED WITH FOCUS GROUPS ...............................2
A. Statistical Invalidity .............................................................4
B. Social Demands of the Group ..............................................4
C. Subjective Analysis ...............................................................5
D. Determining “Why” .............................................................6
E. Conclusion of Focus Group Problems .................................6
III. RDE APPLIED IN BUSINESS ............................................................6
A. The Purpose of RDE ............................................................6
B. Maxwell House‟s Application of RDE .................................8
IV. RDE APPLIED TO THE LEGAL PROFESSION ....................................9
A. Potential Benefits of Using RDE in the Legal
Profession ..........................................................................10
1. Resolving the Problems Plaguing Focus Groups .........10
2. Other Benefits of RDE .................................................11
B. RDE Experiment on Victim Impact Statements ..................13
1. Overview of Study .......................................................13
2. The Results ...................................................................15
V. CONCLUSION .................................................................................16
I. Introduction
Rule Developing Experimentation (RDE) is an experimentation research
method utilized to discover what appeals to customers without regard to
whether the customers are themselves able to articulate what appeals to
them.1 This methodology has been successfully used in the creation of
* James E. Wren is an Assistant Professor at Baylor Law School teaching Practice Court and
Advanced Trial Preparation. He wishes to thank Dr. Howard Moskowitz, Dr. Alan Perry, Rex
Parris, David Moskowitz, and the other authors of ―Experimental Design Applied to Jury
Communication‖ (Appendix 1) for their potentially groundbreaking insights.

WREN.EIC 8/4/2010 9:46 AM
2 BAYLOR LAW REVIEW [Vol. 61:1
products and messages ranging from the food and beverage industry to
public policy.2 Does RDE have the potential to help design the message for
a jury?
Although the use of RDE in the legal profession is a new concept, its
prospects are intriguing. It provides a supplemental alternative to the use of
focus groups, which have long been a staple of jury research. In addition to
overcoming some of the problems associated with the use of focus groups,
RDE offers the potential to help the legal practitioner evaluate case themes
and theories, identify particular elements of a theme that are effective or
ineffective, determine what aspects of the case to emphasize or
deemphasize, determine in which order or sequence to present anything
from witnesses to exhibits, determine what messages are particularly
persuasive to segments of the jury, and enable the practitioner to effectively
select a jury based upon segmentation.
This Article considers the possible application and benefits of RDE to
the legal profession. Part II provides a brief background of focus groups
and examines the current problems faced by practitioners when using focus
groups, including statistical invalidity and the inability of the practitioner to
determine why the focus group members take certain positions. Part III
discusses the purpose of RDE and its application outside the legal
profession. Part IV provides an analysis of the potential uses of RDE in the
legal profession and includes results from a study of victim impact
statements.
II. PROBLEMS ASSOCIATED WITH FOCUS GROUPS
To understand the potential usefulness of RDE, it is first helpful to
understand some of the problems that plague focus groups. Although focus
groups are valuable research tools, they have limitations.
** Timothy C. Williams received his JD from Baylor University in 2008. He has a political
science degree from McMurry University. He also wishes to thank the authors of ―Experimental
Design Applied to Jury Communication.‖ 1For a definition of RDE, see HOWARD R. MOSKOWITZ & ALEX GOFMAN, SELLING BLUE
ELEPHANTS: HOW TO MAKE GREAT PRODUCTS THAT PEOPLE WANT BEFORE THEY EVEN KNOW
THEY WANT THEM 3 (Tim Moore ed., Wharton School Publishing 2007) (defining RDE as ―a
systematized solution-oriented business process of experimentation that designs, tests, and
modifies alternative ideas, packages, products, or services in a disciplined way so that the
developer and marketer discover what appeals to the customer, even if the customer can‟t
articulate the need, much less the solution‖). 2See generally id. (discussing RDE and its various applications).
WREN.EIC 8/4/2010 9:46 AM
2009] RULE DEVELOPING EXPERIMENTATION 3
Focus groups are research tools that explore a variety of topics and
issues.3 The use of focus groups as a research tool dates back to World War
II, when sociologists used these groups to test the effectiveness of wartime
propaganda and the social effects of mass communication.4 Following the
war, the use of focus groups expanded to encompass research of everything
from products to movie endings.5 Eventually, the use of focus groups found
its way into the legal profession as a tool to help test themes, biases, and
issues in a case.
Although there are numerous variations in the specifics, focus groups
are most often controlled by a moderator who introduces small amounts of
information to the group, facilitates discussion among the group, and
obtains the group‘s reaction to the information provided.6 This structure
enables the free flow of ideas by allowing the moderator to lead a
discussion and focus on important case issues, case themes, viability of
claims, and potential strengths and weaknesses of a case.7 Among other
benefits of focus groups, the moderator is able to discover the focus group‘s
perceptions of the case, which enables the legal practitioner to better
understand how the case or issues are perceived.8 However, despite these
benefits, focus groups often leave an attorney with as many questions left
unanswered as answered.
3RICHARD C. WAITES, COURTROOM PSYCHOLOGY AND TRIAL ADVOCACY 175 (ALM
Publishing 2003); see also Alltel Corp. v. Actel Integrated Commc‘ns, Inc., 42 F. Supp. 2d 1265,
1269 (S.D. Ala. 1999) (stating that the ―purpose of focus group research is to gain more in-depth
understanding of the reasons behind consumer‘s opinions‖); Joni E. Johnston, Avoiding the
Pitfalls of Sloppy Focus Groups, 47 ORANGE COUNTY LAW 40, 40 (2005) (stating that focus
groups allow attorneys to test their theories, themes and arguments with a group similar to the
potential jury). 4AMY J. POSEY & LAWRENCE S. WRIGHTSMAN, TRIAL CONSULTING 84 (Ronald Roesch ed.,
Oxford University Press 2005). 5Id.
6Id. at 80.
7See WAITES, supra note 3, at 176; see also POSEY & WRIGHTSMAN, supra note 4, at 80
(noting that the discussion is determined or focused by the moderator in order to obtain a variety
of information). 8See WAITES, supra note 3, at 176 (listing potential benefits of focus groups as discovering
the fact finder‘s perceptions of the case of issues, discovering the issues most important to the
jury, determining how to handle weaknesses, determining how to present strong points,
uncovering the most powerful story, discovering how jurors will react to key facts and witnesses,
discovering any overlooked issues, receiving feedback on demonstrative exhibits, and determining
the likely range of damages a jury would award).

WREN.EIC 8/4/2010 9:46 AM
4 BAYLOR LAW REVIEW [Vol. 61:1
A. Statistical Invalidity
Focus groups are routinely composed of six to twelve people.9
Although this size approximates the numbers that an attorney will see on a
jury, this small sample size is troublesome. Because focus groups are
composed of such small numbers, they can never reliably represent a large
diverse population.10
Thus, the results reached by a focus group cannot be
generalized and applied to a potential jury pool because those results do not
necessarily represent the same results that would be reached if the sample
size were larger.11
Compounding this problem is the fact that the members of a focus group
are often not randomly selected.12
For example, focus groups are
sometimes assembled through newspaper advertisements.13
As a result,
these groups may not be adequately screened for any potential bias or
connection to the case for which they would likely be dismissed for cause at
the actual trial.14
Further, those few who respond to the advertisement in
the newspaper are not necessarily representative of the larger potential jury
pool.15
Consequently, any results or conclusions gathered from these focus
groups are further removed from the actual results likely to be attained from
the pool of jurors selected for trial. As such, the information gathered from
a focus group is not statistically reliable and therefore must be viewed with
a certain level of skepticism.16
B. Social Demands of the Group
Another pitfall of focus groups is the potential for skewed results from
group think. Basically, the focus group will not yield genuine results
because the group members deliver their opinions in the presence of the
9POSEY & WRIGHTSMAN, supra note 4, at 176; Jack H. Nagel, Combining Deliberation and
Fair Representation in Community Health Decisions, 140 U. PA. L. REV. 1965, 1981 (1965)
(stating that focus groups are typically groups of between eight and twelve people). 10
Nagel, supra note 9, at 1982. 11
See id. at 1982–83. 12
POSEY & WRIGHTSMAN, supra note 4, at 85. 13
Id. 14
Id. 15
Id. 16
Alltel Corp. v. Actel Integrated Commc‘ns, Inc., 42 F. Supp. 2d 1265, 1269 (S.D. Ala.
1999).
WREN.EIC 8/4/2010 9:46 AM
2009] RULE DEVELOPING EXPERIMENTATION 5
group.17
As such, input is not anonymous. The lack of anonymity in focus
groups may lead members of the group to respond in a certain way. These
responses may be crafted to appease the questioner, to end the session
sooner, to agree with other members, to gain admiration or to achieve group
cohesion.18
Further, group members who are asked their opinion last will
often mirror the views of those who expressed their opinions first.19
Thus,
members of the group may not express their true opinions but rather
conform their answers to appease other members or the moderator.20
Although this process also occurs in jury deliberations, the personalities that
drive a focus group in one direction are not necessarily reflective of the
personalities that will drive the ultimate jury in a different direction. This
further exacerbates the statistical invalidity of the group‘s results, while
simultaneously leaving the attorney unable to assess whether the responses
of individual group members are genuine or the result of the social
influences mentioned above.
C. Subjective Analysis
Another problem with focus groups is that the results reached cannot be
calculated using a quantitative method.21
Instead of using numerical data
that is statistically analyzed, focus groups require the researcher to ―extract
themes and draw conclusions from the group dialogue, a process that can
easily be influenced by researcher bias.‖22
In other words, there is no hard
numerical data to objectively verify. The researcher is left to formulate the
results of the focus group based on the researcher‘s own perceptions of the
focus group‘s input. As such, despite the best efforts of the researcher,
personal bias or desire to reach a particular result may influence the
subjective analysis. Thus, the results reached in the focus groups could be
inaccurate if the researcher misconstrues the opinions and views of the
group members.23
17POSEY & WRIGHTSMAN, supra note 4, at 84.
18Id.
19Id.; see also SUNWOLF, PRACTICAL JURY DYNAMICS 2, 21 (Matthew Bender & Company,
Inc. 2007) (recognizing the ―strong relationship between first ballots and final verdicts‖ because
deliberations may influence the outcome). 20
POSEY & WRIGHTSMAN, supra note 4, at 84. 21
Id. at 86. 22
Id. 23
Id.

WREN.EIC 8/4/2010 9:46 AM
6 BAYLOR LAW REVIEW [Vol. 61:1
D. Determining “Why”
Perhaps one of the largest problems with the use of focus groups in the
legal profession is the inability to accurately determine why the group
members reached a certain result or expressed a particular view. As
mentioned earlier, focus groups are given small pieces of information and
asked for a result.24
This is beneficial as it allows the researcher to gather
the results given by the members. However, when the focus group is asked
why, the members may not have a reason why they reached the answer, or,
if there is a reason, they may not be able to precisely articulate it. Further,
even if the members give a reason, the member may have developed a
rationale after the fact to fit the answer given. That after-the-fact rationale,
although probably genuine (in the sense that the individual honestly
believes the rationale to be true), may only encompass a small portion of
the actual reasons and subconscious triggers underlying the decision.
Although a focus group can potentially supply a response to a specific
question based on the information provided, it cannot provide the attorney
with the rationale behind the result that would allow for prediction of
results with a change of information.
E. Conclusion of Focus Group Problems
Although focus groups can, among other things, provide attorneys with
insight into ideas that were previously overlooked and allow for feedback
on themes and ideas,25
the results reached can often inaccurately depict the
results later reached by a jury. The inability to get a statistically reliable
number, the subjective analysis of the results, and reliance on the members‘
articulation of the underlying reasons are recognized limitations.
III. RDE APPLIED IN BUSINESS
A. The Purpose of RDE
RDE, as applied in a business context, is a systematic testing process that allows messages, products, and services to be designed in a way that
appeals to customers, even if customers are unable to articulate what
appeals to them.26
Often consumers can tell a researcher what they want the
24Id. at 80.
25WAITES, supra note 3, at 176.
26MOSKOWITZ & GOFMAN, supra note 1, at 3.
WREN.EIC 8/4/2010 9:46 AM
2009] RULE DEVELOPING EXPERIMENTATION 7
end result to be, whether it be a ―strong‖ coffee flavor or a certain feature
on a credit card.27
However, the consumer may be unable to articulate what
a ―strong‖ coffee flavor is or what particular features, in combination with
one another, will create the most appealing credit card offer.28
Essentially,
even after conducting focus group research, the researcher is left with the
need for ―strong‖ coffee flavor—which remains undefined—or a consumer
that wants a lower interest rate on a credit card.29
Although these methods
may have identified the problem faced, the researcher is a long way from its
resolution. At this point, RDE can help solve the problem.30
RDE
accomplishes this by allowing the business owner to identify what
particular features have the greatest appeal to a customer through systematic
testing of a consumer group. This systematic approach allows the marketer
or developer to determine what draws a positive consumer response,
whether it is a soft drink flavor, a credit card feature, or a color theme in an
advertisement, regardless of whether the consumer can actually articulate
what is appealing about the feature.31
RDE has seven basic steps, which can be summarized as follows.32
The
first step is to identify the problem and potential features of the target
product.33
Step two is to ―[m]ix and match the elements according to [an]
experimental design . . . to create a set of prototypes.‖34
Step three is to
show the prototypes to the consumers and obtain the results.35
The next
three steps involve analyzing the results through an automated identification
of any naturally occurring patterns using the quantitative data.36
Finally, the
resulting predictive rules that come from the analysis are applied to create
new products, offerings, or messages.37
27Id.
28Id.
29Id.
30See id.
31See id.
32Id. at 4.
33Id.
34Id. (noting that this step is done automatically by a tool that creates a unique design plan).
35Id.
36Id. at 4–5.
37Id. at 5.

WREN.EIC 8/4/2010 9:46 AM
8 BAYLOR LAW REVIEW [Vol. 61:1
B. Maxwell House‟s Application of RDE
In order to understand its potential application in the legal profession, it
is beneficial to first understand the successful uses of RDE in the business
world. One of the oldest and best known examples of RDE in the business
world comes from the food and beverage industry.38
Historically, food and
beverage industry products evolved slowly from the trial and error efforts of
experimentation.39
Most of these experiments were small random tests,
mixing ingredients, cooking over fire, and tasting.40
Eventually, the trial-
and-error experimentation gave way to a more active, structured and
thoughtful nature of experimentation.41
A success story of this shift from
traditional experimentation to RDE comes from General Food Incorporated,
which developed a more profitable blend of coffee for its brand, Maxwell
House.42
First, Maxwell House discovered its products needed remedial action
when head-to-head tests against other competitors revealed its products
were not performing as well as they should have.43
Although Maxwell
House discovered the decline in performance of its products, head-to-head
tests and audits did not provide a solution.44
As a result, Maxwell House
needed to develop a solution before its products began to lose market share.
Maxwell House created a large experimental base of prototypes to test
systematically.45
It did this by testing a variety of beans in different
combinations to determine which combination best pleased consumers.46
At this point, consumers tested a different randomized set of eight coffee
samples from the full set of seventeen test products and ranked which
product they liked and disliked.47
As the RDE process continued, the
combinations that appealed to the consumer were eventually revealed to the
38Id. at 27.
39Id.
40Id.
41Id. at 28.
42Id. Although this Article does not provide the same in-depth analysis as the book Selling
Blue Elephants, it does provide an overview of the problems faced by Maxwell House and how
RDE helped resolve them. 43
Id. 44
Id. at 36. 45
Id. at 37. 46
Id. 47
Id. at 38–39.

WREN.EIC 8/4/2010 9:46 AM
2009] RULE DEVELOPING EXPERIMENTATION 9
researcher through an automated process.48
The results indicated that
consumers liked some of the test combinations better than the blend
Maxwell House had on the market.49
When analyzing the data, the researchers discovered through RDE that
there were clearly three different segments of consumers with different,
distinct palates.50
Although each segment of consumers stated they wanted
―strong‖ flavored coffee, RDE revealed that each segment had a different
definition of what ―strong‖ meant.51
Based on the results, Maxwell House
was able to examine the different flavor profiles contained in the test
combinations for each segment and determine what appealed to that
particular consumer segment.52
These results allowed the company to take
the general description of ―strong‖ and actually predict and provide a
specific flavor profile for each consumer group.53
Thus, Maxwell House
was able to discover what combinations were most appealing to the distinct
consumer groups despite the consumers‘ inability to articulate the precise
flavors that appealed to them. The end result was that Maxwell House—
rather than losing market share—instead increased coffee sales by more
than fifteen percent.54
IV. RDE APPLIED TO THE LEGAL PROFESSION
Although the idea of using RDE in the legal profession to shape a jury
message is new, research and experience suggest that it may have the
potential to be an effective tool. As applied in the legal profession, RDE is a
systematic process of experimentation to design, test, and modify
alternative ideas, themes, theories, and legal arguments in a disciplined
way, so that the attorney can discover an effective strategy even if mock
jury members are unable to articulate why they reached certain results. The
use of RDE in the legal profession can aid a practitioner in several aspects
where focus groups fall short.55
Although focus groups may allow an
48Id. at 38.
49Id. at 39.
50Id. at 40.
51Id.
52Id. at 40–44.
53See id. at 40–46 (describing the results reached by Maxwell House).
54Id. at 45.
55See supra Part II for a discussion of focus groups and the potential problems which they
create, including statistical unreliability, social concerns, and subjective analysis.
WREN.EIC 8/4/2010 9:46 AM
10 BAYLOR LAW REVIEW [Vol. 61:1
attorney to develop new ideas or to discover an important point, RDE can
supplement the traditional focus group process, by systematically analyzing
what information to present and how to present it to the jury.
A. Potential Benefits of Using RDE in the Legal Profession
1. Resolving the Problems Plaguing Focus Groups
RDE addresses some of the limitations associated with focus groups
because the research pool is much larger and the results can be
quantitatively analyzed.56
First, as discussed, one of the main problems with the use of focus
groups is their statistical unreliability because their sample size is too small
to represent the larger general population.57
RDE, in contrast, draws from a
much larger pool. A typical test may involve hundreds of participants. As
discussed below in Part IV B, 288 mock jurors participated in a recent
application of RDE examining victim impact statements.58
The larger the
number of participants, the more likely the results are to reflect the attitudes
of a larger diverse population. As such, RDE provides a level of statistical
reliability that cannot be achieved through the use of focus groups.
Next, the social demands that are associated with focus groups are not
present when using RDE.59
Since the survey is usually administered by
means of an automated web survey, concerns that members of the group
will respond in a certain way—idiosyncratic to this particular group—to
appease other group members or the examiner are eliminated.60
Instead, the
participant is free to give a candid response without worrying about its
effect on others. In essence, it allows the researcher to gather more accurate
information and assessments from all members of the group.
In addition, the subjective analysis required in focus groups is absent in
RDE.61
Since focus group results cannot be calculated quantitatively,62
the
56See supra Part I.
57Nagel, supra note 9, at 1983–84 (1992); see supra Part II.A.
58See infra Appendix 1. The number of participants in the victim impact statement study is a
good representation of the increased amount of participants creating statistical validity when using
RDE. 59
For a discussion on social demands on a focus group, see POSEY & WRIGHTSMAN, supra
note 4; see supra Part II.B. 60
MOSKOWITZ & GOFMAN, supra note 1, at 4. 61
See id. at 5; see also POSEY & WRIGHTSMAN, supra note 4, at 86; supra Part II.C.

WREN.EIC 8/4/2010 9:46 AM
2009] RULE DEVELOPING EXPERIMENTATION 11
researcher is forced to subjectively draw conclusions which may or may not
accurately reflect the sentiments of the group.63
RDE, on the other hand,
quantitatively examines the results using an automated regression
analysis.64
Results of the numerical data are unaffected by any bias of the
researcher.65
Finally, RDE helps to determine why. With RDE (as opposed to focus
groups), why the participants answered in a certain way is determined
through an objective analysis of patterns which appear in their answers.
Thus, the fact that the participant is unable to articulate the reason for the
decision—or developed a reason after the fact—is immaterial. The results
will still accurately reveal what elements influenced their decisions. So,
instead of merely identifying a problem, RDE goes further and allows the
researcher to determine which elements, presented in which order, triggered
which responses, and thereby help demonstrate why the participants
reached their decision (and thus predict what changes are most likely to
reinforce or change the decision).
2. Other Benefits of RDE
RDE offers other possibilities. These potentialities focus on the use of
segmentation, selected repetition and emphasis, and sequencing.
First, RDE allows for segmentation.66
The process will identify
naturally occurring segments of the population that show similar patterns.67
For example, in the coffee example above, there were three distinct
segments or palates of coffee drinkers.68
Some liked their coffee bitter,
other liked it less bitter, and still some liked it with moderate bitterness.69
These segments were revealed automatically by dividing the panel into
groups based on their preferences.70
Rather than seeking to design one
coffee flavor with modest appeal across all segments, RDE allowed
62POSEY & WRIGHTSMAN, supra note 4, at 86.
63Id.
64MOSKOWITZ & GOFMAN, supra note 1, at 4–5.
65Id. at 5.
66Id.
67Id.
68Id. at 40.
69Id.
70Id.

WREN.EIC 8/4/2010 9:46 AM
12 BAYLOR LAW REVIEW [Vol. 61:1
Maxwell House to optimize coffees directed to each of the three identified
segments of coffee drinkers.
This same concept may have application in the legal profession by
allowing the practitioner to divide the potential jury or jury pool into
segments. For example, pretrial RDE may reveal that jurors generally can
be segmented into a group that is more receptive and a group that is more
antagonistic to a particular set of facts, and that this segmentation can be
revealed by particular answers to voir dire questions. Attorneys sometimes
attempt to do this at present by ascribing positive or negative
generalizations to a particular demographic group, and yet, demographics
alone are routinely acknowledged as a poor way to predict behavior.71
Uncovering jury segmentation by using RDE may allow more accurate
identification, and, as mentioned above, the process is automated so that a
particular segment of the population and their inclination to particular
elements of a case will automatically be revealed when processing the
information.72
This use of RDE may allow the attorney to shape the jury
panel with a favorable segment of the population that has shown positive
responses to the message the attorney is going to deliver. Additionally, this
information would give the attorney insight for shaping delivery of the
message at trial in a way likely to appeal to the dominant segment of the
actual seated jury. The attorney could essentially customize his message in
order to maximize the jury‘s receptivity.
Next, RDE may help the legal practitioner determine whether repetition
would be successful. For example, in a wrongful death case, the jury may
be exposed to numerous statements about how much the widow misses her
spouse. Although this may be effective, overuse of this may cause the jury
to become numb to those facts. RDE can reveal this tendency through
repeated exposure of particular elements to the mock jury participants. As
the survey progresses, the mock jurors may be more or less inclined to vote
in favor of the widow when the element is present. Thus, RDE allows the
practitioner to determine whether and at what point a particular element
becomes more or less effective with repetition. Similarly, RDE allows the
71See generally Richard L. Wiener & Dennis P. Stolle, Trial Consulting: Jurors‟ and
Attorneys‟ Perceptions of Murder, 34 CAL. W.L. REV. 225 (1997) (noting that demographic
characteristics are often qualified because attitudes that predict juror behavior vary extensively
across cases). 72
MOSKOWITZ & GOFMAN, supra note 1, at 5.
WREN.EIC 8/4/2010 9:46 AM
2009] RULE DEVELOPING EXPERIMENTATION 13
practitioner to decide whether to emphasize or deemphasize certain aspects
of the case based on the segments of the population present in the jury box.
Finally, RDE may also allow the attorney insight into the optimal
sequencing of information presented to the jury. The regression analysis
determines different combinations or orders of elements that appeal to the
jury. For example, the jury may be more inclined to award large amounts
of damages when first exposed to the injury sustained by the plaintiff and
then to the debt incurred as a result. Or, although particular elements may
make the jury inclined to vote one way or the other when presented alone,
those elements may lose their effectiveness when presented together. These
natural patterns, which are revealed during RDE, will enable an attorney to
decide what order to present the fact elements contained in the RDE survey.
B. RDE Experiment on Victim Impact Statements
1. Overview of Study
A victim impact statement during the sentencing portion of a criminal
trial typically informs the judge or jury of the financial, physical and
psychological impact the crime had on the victim or the victim‘s family
members.73
The jury considers the testimony contained in the victim
impact statement in determining whether to sentence the defendant to life in
prison or to death.74
In studies, significantly more people were willing to
vote for the death penalty when victim impact statements were given versus
when they were absent.75
Thus, the victim impact statement may play an
enormous role in determining what sentence the defendant will receive.76
73BLACK‘S LAW DICTIONARY 1598 (8th ed. 2004) (defining victim impact statements as ―a
statement read into the record during sentencing to inform the judge or jury of the financial,
physical, and psychological impact of the crime on the victim and the victim‘s family‖); see also
Payne v. Tennessee, 501 U.S. 808, 825 (1991) (stating that a victim impact statement is a ―form or
method of informing the sentencing authority about the specific harm caused by the crime in
question‖). 74
Niru Shanker, Getting a Grip on Payne and Restricting the Influence of Victim Impact
Statements in Capital Sentencing: The Timothy McVeigh Case and Various State Approaches
Compared, 26 HASTINGS CONST. L.Q. 711, 711 (1999). 75
James Luginbuhl & Michael Burkhead, Victim Impact Evidence in a Capital Trial:
Encouraging Votes for Death, 20 AM. J. CRIM. JUST. 1, 1 (1995); see also Bryan Myers & Jack
Arbuthnot, The Effects of Victim Impact Evidence on the Verdicts and Sentencing Judgments of
Mock Jurors, 29 J. OFFENDER REHAB. 95, 108 (1999) (stating that mock jurors are significantly
more likely to vote for the death penalty when exposed to the mother‘s victim impact statements

WREN.EIC 8/4/2010 9:46 AM
14 BAYLOR LAW REVIEW [Vol. 61:1
In a recent study, RDE was used to systematically determine how
different items of information in combination with each other would have
the greatest relevance in the mock jurors‘ sentencing decisions.77
Although
practitioners generally knew what information to present in a victim impact
statement, this study enabled them to determine how to present that
information. The information was grouped into five large categories
comprised of the sex and race of the person making the victim impact
statement, what the person said about the emotional, financial, or social
impact of the crime, and the viciousness of the crime.78
Each of these
categories was then broken down into four smaller elements.79
For
example, the first category was broken down into four possible pictures to
display to the mock jury—black female, black male, white female, and
white male—and the second category contained four different statements
describing the financial difficulty the victim has experienced.80
Although
all the phrases talk about the same facts, certain phrases—especially in
combination with other phrases—may be more or less impactful than other
statements in different combinations. Thus, RDE more naturally simulates
the complexity of the victim‘s testimony, which consists of several parts.
Through experimentation, RDE shows what specific facts, in combination
with each other, have the most relevance to the jury.
The mock jury was selected using a panel who agreed to participate in
internet-based studies. The study was comprised of 288 mock jurors.81
Before being asked any questions regarding the victim impact statement,
in contrast to other victim impact statements); Bryan Myers et al., Psychology Weighs in on the
Debate Surrounding Victim Impact Statements and Capital Sentencing: Are Emotional Jurors
Really Irrational?, 19 FED. SENT‘G REP. 13, 15 (2006) (stating that when victim impact
statements are present, mock jurors demonstrate greater anger by voting for harsher sentences for
female versus male defendants). 76
Jacqueline E. Ross, The Entrenched Position of Plea Bargaining in United States Legal
Practice, 54 AM. J. COMP. L. 717, 717–18 n.2 (2006). 77
See Howard Moskowitz et al., Experimental Design Applied to Jury Communication (on
file with author). 78
See id. The five categories were (1) picture of the surviving spouse, (2) financial impact,
(3) emotional impact, (4) viciousness of the crime, and (5) social impact. Id. 79
See id. 80
See id. The four elements in the financial category were (1) I am having trouble paying the
mortgage since the murder; (2) since the murder I have had to go on public assistance; (3) I am
unable to keep up with the children‘s tuition payments since the murder; and (4) I am having
difficulty paying for the family‘s health insurance premiums since the murder. Id. 81
See id.

WREN.EIC 8/4/2010 9:46 AM
2009] RULE DEVELOPING EXPERIMENTATION 15
each mock juror was asked self-profiling questions ranging from belief in
the death penalty to gender.82
After completing the self-assessment, each
mock juror was then asked to evaluate a unique set of combinations
containing elements from the five various categories.83
The mock jurors
were each asked twenty-five questions where they would read a
combination of elements and rank on a scale of one to nine whether they
were more likely to vote for life without parole or death.84
Some of the
questions contained an element from each of the categories while others
questions left categories out altogether. For example, question one may
have contained information regarding the viciousness of the crime, the
financial impact, and a picture of the victim, whereas question two may
have contained information regarding the viciousness of the crime, the
social impact, the financial impact, and a picture of the victim.
2. The Results
The data gathered was calculated through regression analysis in order to
determine the consistency of an individual‘s response and to segment mock
jurors into groups.85
The results indicate that the viciousness or heinousness of a crime,
combined with the emotional burden the surviving spouse faces in the wake
of a murder, inclined potential jurors to move toward voting for the death
penalty. The other categories, such as a picture of the surviving spouse and
social and financial impact, had little initial effect on the mock jury. The
brutality of the murder inclined jurors to vote for the death penalty
independent of their belief in the death penalty. In other words, mock
jurors were more inclined to vote for the death penalty when exposed to the
brutality of the crime regardless of whether they personally believed in the
death penalty.86
82See id.
83For an example of a set of combinations, see id.
84See id.
85Regression analysis is a technique for the analysis of numerical data consisting of values of
a dependent variable and one or more independent variables in order to isolate the effect of the
independent variables. See generally Lorraine Lewandrowski, Toxic Blackacre: Appraisal
Techniques & Current Trends in Valuation, 5 ALB. L.J. SCI. & TECH. 55 (1994). For an
introduction into regression analysis, see Alan O. Sykes, An Introduction to Regression Analysis
(Univ. of Chicago Law Sch., Law & Econ. Working Paper No. 20, 1993). 86
Moskowitz et al., supra note 77.
WREN.EIC 8/4/2010 9:46 AM
16 BAYLOR LAW REVIEW [Vol. 61:1
In addition, RDE allowed the researchers to determine the effect of
repetitiveness of certain elements to the mock jury. Although exposure to
the viciousness of the crime caused the mock jury to be more likely to vote
for the death penalty, repeated exposure to the viciousness of the crime
caused the mock jury to become more lenient. By contrast, repeated
exposure to the financial hardships resulting from the crime caused the
mock jury to lean toward the death penalty.
RDE also revealed inclinations among specific groups. The results
show that certain groups were more responsive to particular categories of
information than others. For example, females were more inclined to vote
for the death penalty than males after exposure to statements of brutality.
To the contrary, males were more inclined to vote for the death penalty than
females after statements regarding the financial impact of the crime.
Surprisingly, those who had previously been a victim of a crime were not as
persuaded by the viciousness of the crime as those who had not been
previous victims of a crime.87
This research may help the practitioner to
segment the jury for purposes of selection, and to determine the most
effective message for the jury actually selected.
Another advantage of RDE is that, unlike the typical focus group, the
mock jury in the study consisted of 288 jurors as opposed to six or twelve.
As a result, the sample size is much larger and can therefore more
accurately represent a larger diverse population. Furthermore, the results
reached during the experiment were statistically reliable. In addition to
having the larger jury pool, results were verified by conducting the same
study again with a different mock jury pool. This study, run two months
later, was comprised of 194 mock jurors. The results reached indicated
reliability of ninety-eight percent for females and ninety-six percent for
males.88
V. CONCLUSION
RDE offers intriguing potential in litigation. Although its application to
litigation is a new concept, it could provide valuable assistance to the legal
practitioner in selecting the most advantageous jury and customizing the
message to that selection. Its statistical reliability results from the
involvement of a significant sample size of participants—much larger than
87Id.
88Id.

WREN.EIC 8/4/2010 9:46 AM
2009] RULE DEVELOPING EXPERIMENTATION 17
can be involved with focus groups—whose responses are analyzed via
automated regression analysis, rather than being unconsciously skewed by
the subjective views of the focus group researcher. More research is needed
to explore the potential impact of RDE in this arena.

WREN.EIC 8/4/2010 9:46 AM
18 BAYLOR LAW REVIEW [Vol. 61:1
APPENDIX 1
Editor‟s Note: Below is a reproduction of Experimental Design Applied
to Jury Communication, in its original form, for the reader‟s reference.
This analysis was conducted by David Moskowitz, B.A., Howard R.
Moskowitz, Ph.D., Thomas O‟Rourke, Ph.D., Rex Parris, J.D., Alan M.
Perry, Ph.D., and Richard Waxman, Ph.D.
Abstract
Internet survey respondents (N=288) served as surrogate jurors in a
murder case. They were exposed to victim impact statements (VIS) from
the surviving spouse. The impact statements were systematically varied
according to a fractional factorial design. The respondent‘s individual
inclinations, to vote for the death penalty or for life without parole, were
measured by rating scales related to the statements by subsequent modeling
using ordinary least squares regression. All four VIS, describing the
viciousness of a crime, and two statements about the emotional burden on a
surviving spouse in wake of the crime, inclined these potential jurors to
move toward voting for the death penalty. Four VIS statements, each about
the financial or social impact on the spouse‘s life, had little effect on
moving a potential juror‘s vote either towards or away from the death
penalty.
Interactions between the nature of the potential juror and the type of
messages emerged for different groups of individuals, who were classified
by gender and race. Statements geared toward the viciousness of the crime
inclined jurors to vote for the death penalty independent of their separately
self-stated bias to vote for death or the alternative option, life without
parole. Based upon their patterns of responding, subjects were grouped and
classified as swayable and less swayable. The effect of statements about the
brutality of the crime resulted in a three fold increase for the swayable
group to vote for death. As respondents were exposed to more stimuli over
the course of the experimental trials, the potency of the individual elements
to drive to the death penalty was assessed. Repeated exposure to impact
stimuli moved to leniency, especially among male respondents who became
less affected by statements related to brutality. Repeated exposure to
statements about hardship moved respondents towards voting death.
Practical implications for juror categorization are discussed.
WREN.EIC 8/4/2010 9:46 AM
2009] RULE DEVELOPING EXPERIMENTATION 19
Introduction
In most capital cases, victim impact statements (VIS) are presented to
jurors who will be called upon to make decisions regarding guilt or
innocence and sentencing recommendations, e.g. death vs. life
imprisonment without the possibility of parole. In a study that varied
severity of the crime and the presence of VIS, Luginbuhl and Burkhead
(1995) reported that significantly more subjects (undergraduate students)
were willing to vote for the death penalty when VIS were given versus
when they were absent. Myers and Arbuthnot (1999) used a paradigm in
which two statements were conjoined. A murder victim‘s mother stated that
her daughter‘s death caused her emotional, physical, and financial
problems, but also caused the crime victim‘s son severe emotional
problems. Mock jurors (undergraduates) were significantly more likely to
vote for the death penalty when exposed to the mother‘s VIS in contrast to
those who were not. In another study, Myers, Lynn, and Arbuthnot (2002)
pointed out that when mock jurors (undergraduates) are exposed to VIS that
varied the severity of the harm experienced by the victim‘s family and the
affectivity of the witness, the harm experienced by the victim‘s family, not
the emotional display of the witness, made a significant difference in
respondents‘ decisions to vote for the death penalty. In 1999, Greene
conducted a study in an effort to evaluate the impact of different kinds of
VIS on jury eligible adults in a capital case. Groups of subjects heard a VIS
about the character of the crime victim (victim qualities); the physical,
psychological, and financial impact of the murder on the survivors (impact);
and survivor‘s opinion about sentencing (opinion). VIS focusing on the
qualities of the crime victim elicited a more positive juror response toward
the crime victim than did VIS focusing on survivor impact and/or survivor
opinion about punishment. In a related theme, Granados (2003)
demonstrated that mock jurors who heard inflammatory VIS were
significantly more likely to vote for death than did mock jurors who did not.
As noted in a review article by Myers, Weidermann, and Pearce (2006)
the authors made note of a study (ForsterLee, Fox, ForsterLee, Ho, 2004)
that examined VIS and the gender of the victim and the defendant. It was
found that mock jurors (jury eligible community members) tended generally
to endorse more lenient sentences for female defendants, but this difference
was reduced by the presence of VIS. Specifically, it was noted that when no
VIS were present, subjects showed less anger toward female defendants.
When VIS were present, however, they demonstrated greater anger by
voting for harsher sentences for female versus male defendants.

WREN.EIC 8/4/2010 9:46 AM
20 BAYLOR LAW REVIEW [Vol. 61:1
Myers and Greene (2004), in another review article, note that research
points to the idea that when VIS are presented, jurors may empathize with
the emotional pain felt by the witness and this empathy may result in
harsher sentences.
Thus VIS may play a powerful role in affecting jurors‘ decisions in the
punishment phase of a capital murder case (Arrigo & Williams, 2003). The
present study is unique in that an attempt was made to determine how
various stimuli in combination with each other affected the degree to which
mock jurors decide death vs. life imprisonment without the possibility of
parole. The stimuli included: the qualities of the person making VIS (sex
and race) and what is said about the emotional, financial, or social impact of
the crime and/or the viciousness of the crime.
Applying the Conjoint Analysis Approach to Trial Language
An experimental design was employed to investigate how various
stimuli affected individuals who are surrogates of jurors. Each respondent
evaluated a specific set of combinations, unique for that respondent, with
the combinations comprising various stimuli-short, easy to understand
vignettes. Each respondent did not need to evaluate complete concepts,
comprising one element from each of the ‗categories‘ or ‗silos‘, but rather
needed to evaluate these smaller combinations, i.e., incomplete
combinations with some silos absent. That strategy of incomplete
combinations allowed for subsequent regression analysis that generated
estimates of the absolute magnitude of contributions of the different stimuli.
For this particular murder case study, five categories were selected, each
comprising four elements, as Table 1 shows The first category was a picture
of the surviving spouse. The remaining categories were about the surviving
spouse‘s testimony. These included three consequences – financial,
emotional, social, and one description of the crime (viciousness).

WREN.EIC 8/4/2010 9:46 AM
2009] RULE DEVELOPING EXPERIMENTATION 21
Table 1—The Five Categories and Four Elements in Each
Category1: Visuals of surviving spouse who is giving the
testimony
A1 Black female
A2 Black male
A3 White female
A4 White male
Category2: Financial
B1 I am having trouble paying the mortgage since the murder
B2 Since the murder I have had to go on public assistance
B3 I am unable to keep up with the childrens‘ tuition payments since the murder
B4
I am having difficulty paying the family‘s health insurance premiums since the
murder
Category3: Emotional
C1 Since my loved one was killed, I find myself crying most of the time
C2
Since the murder, I find myself overwhelmed by even the thought of leaving the
house
C3 Although I used to enjoy food, since the murder I no longer have an appetite
C4 I am always tired and can never get a good night‘s sleep since the murder
Category4: Viciousness of the Crime
D1
I still remember how shocked I was when the detectives told me the body had been
mutilated
D2 I couldn‘t believe that my spouse‘s throat was slashed
D3
The detectives found it hard to tell me that the body showed signs of sexual
molestation
D4 The body was bludgeoned beyond recognition
Category5: Social
E1 My friends treat me differently since the murder
E2 Since the murder, I no longer know who my true friends are
E3 Since the murder, I can‘t remember the last time my friends invited me out
E4 Since the murder, it seems that my friends are uncomfortable around me

WREN.EIC 8/4/2010 9:46 AM
22 BAYLOR LAW REVIEW [Vol. 61:1
The 20 elements in Table 1 were combined into 25 small, easy-to-read
vignettes, comprising a minimum of two and a maximum of five elements,
as well as one or no element from each of the five categories. Each element
appeared exactly three times, in different combinations so that each
respondent evaluated a unique set of combinations.. This ‗fractional
factorial‘ design insured that the 20 elements appear in a statistically
independent fashion for each respondent. Such an approach of permuting
25 different combinations for each respondent insured that there was no
possibility of any specific combination unduly influencing the results, while
at the same time allowing an individual-level model to be run for each
respondent to show how the different elements ‗drive‘ responses.
Field Execution
The respondents were selected at random from the i-Novation panel of
individuals who have agreed to participate in Internet-based studies. A total
of 5,000 respondents were invited to participate by means of an e-mail
invitation. (Figure 1). The invitation was designed to be fairly neutral. A
total of 288 respondents participated, for a response rate of 5.7%. This is a
typical research response rate for mid 2007. (Note: response rates have been
declining steadily from 2001. There is no reason to believe that the response
rate observed was unusually low or high). Although this study used a
random sample from a panel, other studies of a similar nature can customize
the composition of the panel, in terms of age, gender, race, income, etc.

WREN.EIC 8/4/2010 9:46 AM
2009] RULE DEVELOPING EXPERIMENTATION 23
Figure 1—Email Invitation
When the respondent clicked on the invitation e-mail, he or she was led
to the actual study, which began with an orientation page, shown in Figure
2. The orientation page is relatively neutral, not providing much
information about what is expected, other than a general outline of what the
respondent will read and instructions about what the scale means.
Figure 2—Orientation Page

WREN.EIC 8/4/2010 9:46 AM
24 BAYLOR LAW REVIEW [Vol. 61:1
After the orientation page, the respondent read 25 different vignettes,
rating each vignette on the scale. They were not instructed how to read the
vignette or what to look for in the vignette. Rather, the vignette was simply
presented and the respondent was instructed to assign a rating
Each respondent read a unique combination of 25 vignettes, each
comprised of short phrases (2-5 elements). A vignette had either one or no
elements from each of the five categories. The combinations were created
so that the elements appeared in a statistically independent manner, so that
each respondent evaluated every element three times across the 25
concepts. The combinations for each respondent allowed the creation of an
individual-level model for the respondent. This strategy insured a
statistically robust experimental design in which no combination appeared
unduly often. Figure 3 shows an example of the test concept or vignette.
Figure 3—Test Concept
After the respondent completed the test concepts evaluation, s/he
finished a self-profiling classification questionnaire. The questionnaire
asked both conventional demographic questions (e.g., gender, age, income),
as well as more topic-related questions (e.g., whether or not the respondent
had been the victim of a crime; whether or not the respondent believed in
the death penalty).
WREN.EIC 8/4/2010 9:46 AM
2009] RULE DEVELOPING EXPERIMENTATION 25
Out of the 5000 invitations, 288 individuals responded and completed
the interview. This was a response rate of 5.5%, about the same response
rate that the authors have found in similar studies dealing with products
rather than with the seriousness of crimes. Table 2 shows the distribution
of respondents for total panel, and for the two concept-respondent segments
that will be discussed later.
ANALYSIS OF THE RATING BY REGRESSION MODELING
The respondents rated each of the 25 vignettes on an anchored 1-9 point
scale, where 9 = death penalty for the crime, and 1 = life imprisonment
without the possibility of parole. The 9-point scale, anchored at both ends,
was used twice, first to create a model for ‗persuasion‘ and a second to
create a model for ‗interest‘.
Persuasion Model
The ratings for each respondent enabled the use of an ordinary least
squares method to relate the presence/absence of the 20 elements to the 9-
point rating, assigned by a respondent. The persuasion model can be
expressed by the simple equation:
Rating = k0 + k1(Element A1) . . . k20(Element E4)
The rating is the 9-point scale that respondents used. The elements take
on the value 0 if the elements were absent in the concept and 1 if the
elements were present in the concept. Regression analysis generates
coefficients, which in the persuasion model show the part-worth
contributions of each of the 20 elements to the 9-point rating scale. Each
element generates a coefficient for each respondent.
The persuasion model is used for two analyses:
1. Calculate the Consistency of an Individual‘s Response.
To the degree that the respondent attends to the task, the goodness-of-fit
of the individual model to the actual rating will be higher. That is, the
model will conform to the data and the variability in the ratings will be
traceable to the variability of the elements. The statistical measure is the
multiple R2 of the model, which ranges from a low of 0.0 (ratings are
random) to a high of 1.0 (ratings are perfectly consistent).

WREN.EIC 8/4/2010 9:46 AM
26 BAYLOR LAW REVIEW [Vol. 61:1
2. Segment Respondents into Clusters or Mind-Set Segments.
Cluster analysis allows for the placement of the 288 respondents into 2,
3, 4 or more groups such that the patterns of the 20 utilities for respondents
placed into a group (i.e., segment) are similar. The patterns of utilities
across the groups (i.e., segments) are different. Prior to clustering, the set of
20 persuasion coefficients, one per element, was processed to reduce the
redundancy. The clustering would be done on a set of utilities that was
parsimonious. Redundancy across the 20 elements was reduced by a
principal components factor analysis, followed by a quartimax rotation,
which reduced the 20 elements to six orthogonal factors, on which the
clustering was performed. What is critical here is that the analysis was done
strictly statistically. Only after the data was clustered into segments was an
attempt made to name the segments.
Interest Model
Consumer researchers usually focus on the number or proportion of
respondents exhibiting a certain type of behavior or belonging to a certain
group. Their focus is on incidence measures, not on intensity measures.
That is, the researcher is not interested in the strength of feeling, but rather
what the person will do. A 9-point scale is used as a means by which to
measure membership in one of two classes, vote for death penalty (rating of
7-9) versus do not vote for the death penalty (rating of 1-6). Each individual
rating each concept could either fall into the group of ‗pro-death penalty‘
for that concept or against death-penalty for that concept.
In the 9-point rating scale, 1 represented ‗life sentence without parole‘,
whereas 9 represented the ‗death penalty‘. Each respondent‘s data was
recoded, so that a rating of 1-6 was replaced by the value 0 to denote life
without parole and a rating of 7-9 was replaced by the value 100 to denote
the death penalty. This recoding means that minus numbers in the model
suggest leaning towards life imprisonment, whereas positive numbers in the
model suggest leaning towards the death penalty.
RESULTS
Who Participated
Table 2 presents the distribution of the respondents, based upon their
self-profiling classification questionnaires, as well the relative proportion of
WREN.EIC 8/4/2010 9:46 AM
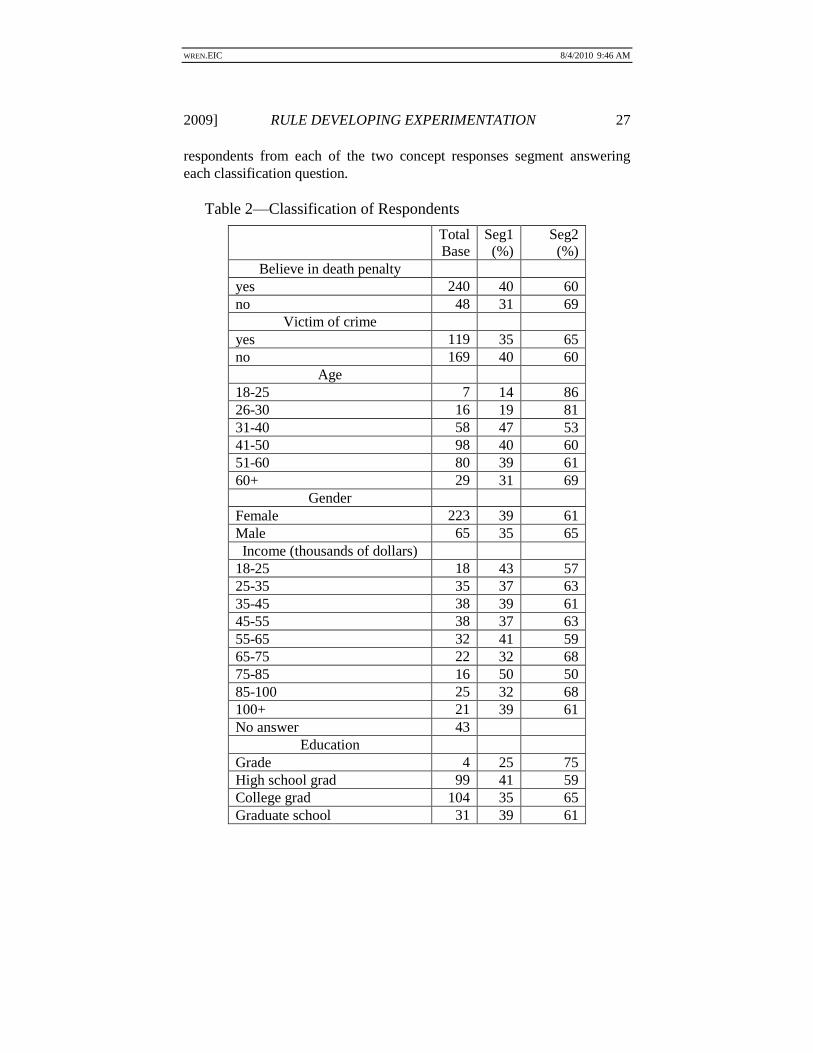
2009] RULE DEVELOPING EXPERIMENTATION 27
respondents from each of the two concept responses segment answering
each classification question.
Table 2—Classification of Respondents
Total
Base
Seg1
(%)
Seg2
(%)
Believe in death penalty
yes 240 40 60
no 48 31 69
Victim of crime
yes 119 35 65
no 169 40 60
Age
18-25 7 14 86
26-30 16 19 81
31-40 58 47 53
41-50 98 40 60
51-60 80 39 61
60+ 29 31 69
Gender
Female 223 39 61
Male 65 35 65
Income (thousands of dollars)
18-25 18 43 57
25-35 35 37 63
35-45 38 39 61
45-55 38 37 63
55-65 32 41 59
65-75 22 32 68
75-85 16 50 50
85-100 25 32 68
100+ 21 39 61
No answer 43
Education
Grade 4 25 75
High school grad 99 41 59
College grad 104 35 65
Graduate school 31 39 61

WREN.EIC 8/4/2010 9:46 AM
28 BAYLOR LAW REVIEW [Vol. 61:1
Other education 50 40 60
Marital status
Single 30 70
Separated 33 67
Divorced 37 63
Married 42 58
Widowed 17 83
Consistency of Respondent Results
Figure 4 shows that the majority of the persuasion models from the
individual respondents show multiple R2 values exceeding 0.80. For each
of these consistent respondents, more than 80% of the variability in the
respondent‘s ratings is accounted for by knowing the presence/absence of
the elements. The ratings of the individual respondent are not random, but
rather follow a discernable pattern. It is important to bear in mind that
consistency is not validity, but simply a measure of whether, for a single
element, the respondent evaluates the element in a consistent fashion when
the element is present in different concepts. If the responses were random,
then there would be a weak correlation between the presence/absence of the
20 elements and the ratings, manifesting itself as a low R2.
Figure 4
0.0 0.2 0.4 0.6 0.8 1.0R-Square (Consistency) Measure
Figure 4—Consistency of the response patterns for each of the 288 respondents, measured
by the goodness of fit of the individual‘s persuasion model. Each respondent is shown as a

WREN.EIC 8/4/2010 9:46 AM
2009] RULE DEVELOPING EXPERIMENTATION 29
filled circle. R2 values above 0.8 indicate very consistent data. A majority of respondents
showed this high R2 statistic for their models.
Creating the „Interest Model‟ for the Total Panel
The interest model was created by ordinary least squares regression.
Although one might use logistic regression in place of ordinary least-
squares (OLS), OLS is easier for managers, and decision makers to
understand. Furthermore, it is easy to construct better arguments because
one can simply add up the element utilities to get an intuitive idea of how
strong the argument will be.
On a substantive basis, the parameters of the interest model show the
relative number of respondents pushing towards either life without parole or
for the death sentence. Table 3 shows the parameters for all of the data
combined, in one large model, independent of individual respondent.
1. The additive constant in the interest model is the conditional probability
of a juror voting for the death penalty in the absence of any elements.
The additive constant, or intercept in the regression model, is a purely
estimated parameter, but can be used as a benchmark to show basic
propensity to vote for the death penalty. Here, we have 23; without
elements, about 23% of the respondents are pushing for the death
penalty.
2. The utilities, or coefficients from the interest model for the different
elements, show the driving power for the death penalty, when the
particular element is present in the test concept. The coefficient gives
the additive (or subtractive) conditional probability of voting for the
death penalty. The elements add or subtract to that baseline. Thus,
element D4 (The body was bludgeoned beyond recognition) increases
the probability of a vote for the death penalty from a baseline of
23.47% to a sum of 23.47% and 25.54% or from about 23% to 49%.
3. The T value shows the test for ‗difference from 0‘ (i.e., the test to show
whether the coefficient is a real effect, not just a random effect)
4. The P value shows the probability that the coefficient‘s value (i.e.,
utility of the element) occurs by chance, when it is really 0.
Table 3
Utility T value P Value
Additive constant 23.47 8.93 0.00
A1 Black Female -2.28 -1.26 0.21
A2 Black Male -1.11 -0.61 0.54

WREN.EIC 8/4/2010 9:46 AM
30 BAYLOR LAW REVIEW [Vol. 61:1
A3 White Female -3.18 -1.75 0.08
A4 White Male -2.01 -1.11 0.27
B1
I am having trouble paying the
mortgage since the murder 1.87 1.03 0.30
B2
Since the murder I have had to
go on public assistance 0.42 0.23 0.82
B3
I am unable to keep up with the
children‘s tuition payments
since the murder 0.21 0.11 0.91
B4
I am having difficulty paying
the family‘s health insurance
premiums since the murder 1.38 0.76 0.45
C1
Since my loved one was killed,
I find myself crying most of the
time 4.71 2.59 0.01
C2
Since the murder, I find myself
overwhelmed by even the
thought of leaving the house 4.36 2.40 0.02
C3
Although I used to enjoy food,
since the murder I no longer
have an appetite 1.87 1.03 0.30
C4
I am always tired and can never
get a good night‘s sleep since
the murder 2.98 1.64 0.10
D1
I still remember how shocked I
was when the detectives told
me the body had been mutilated 23.11 12.74 0.00
D2
I couldn‘t believe that my
spouse‘s throat was slashed 18.34 10.11 0.00
D3
The detectives found it hard to
tell me that the body showed
signs of sexual molestation 22.70 12.51 0.00
D4
The body was bludgeoned
beyond recognition 25.54 14.07 0.00
E1
My friends treat me differently
since the murder 0.28 0.15 0.88
E2
Since the murder, I no longer
know who my true friends are 0.62 0.34 0.73
E3
Since the murder, I can‘t
remember the last time my
friends invited me out 1.94 1.07 0.29
WREN.EIC 8/4/2010 9:46 AM
2009] RULE DEVELOPING EXPERIMENTATION 31
E4
Since the murder, it seems that
my friends are uncomfortable
around me 0.69 0.38 0.70
Analysis of variance for the
model
Source Sum-of-Squares df
Mean-
Square F-ratio
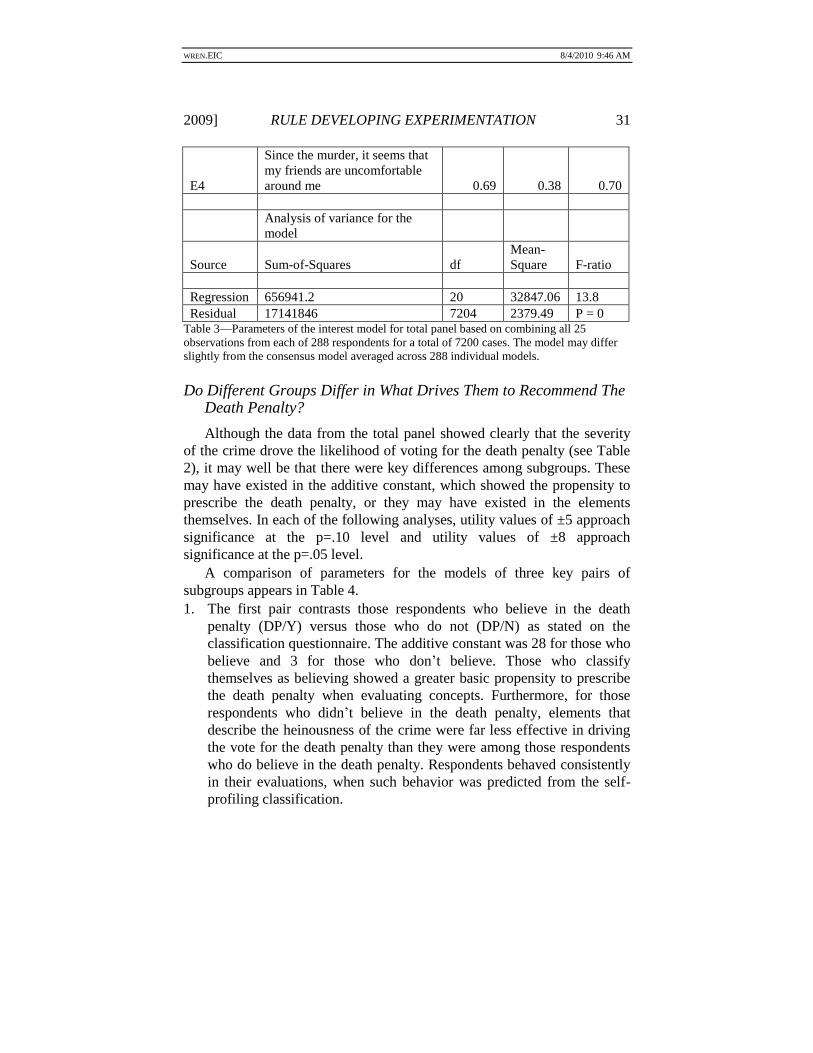
Regression 656941.2 20 32847.06 13.8
Residual 17141846 7204 2379.49 P = 0 Table 3—Parameters of the interest model for total panel based on combining all 25
observations from each of 288 respondents for a total of 7200 cases. The model may differ
slightly from the consensus model averaged across 288 individual models.
Do Different Groups Differ in What Drives Them to Recommend The Death Penalty?
Although the data from the total panel showed clearly that the severity
of the crime drove the likelihood of voting for the death penalty (see Table
2), it may well be that there were key differences among subgroups. These
may have existed in the additive constant, which showed the propensity to
prescribe the death penalty, or they may have existed in the elements
themselves. In each of the following analyses, utility values of ±5 approach
significance at the p=.10 level and utility values of ±8 approach
significance at the p=.05 level.
A comparison of parameters for the models of three key pairs of
subgroups appears in Table 4.
1. The first pair contrasts those respondents who believe in the death
penalty (DP/Y) versus those who do not (DP/N) as stated on the
classification questionnaire. The additive constant was 28 for those who
believe and 3 for those who don‘t believe. Those who classify
themselves as believing showed a greater basic propensity to prescribe
the death penalty when evaluating concepts. Furthermore, for those
respondents who didn‘t believe in the death penalty, elements that
describe the heinousness of the crime were far less effective in driving
the vote for the death penalty than they were among those respondents
who do believe in the death penalty. Respondents behaved consistently
in their evaluations, when such behavior was predicted from the self-
profiling classification.

WREN.EIC 8/4/2010 9:46 AM
32 BAYLOR LAW REVIEW [Vol. 61:1
2. For respondents who said that they have been victims of a crime, there
was no clear pattern either in the additive constant or in the utility
values. The additive constant or predisposition to recommend the death
penalty was only slightly higher for those who have been victims of a
crime versus non victims (25 vs. 22). The elements describing the
heinousness of the crime were, surprisingly, slightly more effective in
driving towards the death penalty among the non victims. In all, the
additive constant and the element utilities cancelled each other, so being
a victim of a crime had no apparent major effect on likelihood of voting
for the death penalty among these mock jurors.
3. For gender there again was no clear pattern either across all the
elements. Both females and males were equally likely to recommend
the death penalty. Their additive constants were similar (23 versus 24,
respectively). Females were somewhat more moved by the statements
about brutality, so that for the same statement about 3%- 5% more of
females than males were likely to recommend the death penalty. Men
were more swayed by crying than were females, leading them to
recommend the death penalty (Element C1 Since my loved one was
killed, I find myself crying most of the time has a utility for the death
sentence of 4 for women and 9 for men)
Table 4
To
tal
DP
/Y
DP
/N
Vic/Y
Vic/N
Gen
/F
Gen
/M
Additive constant 23 28 3 25 22 23 24
D4
The body was
bludgeoned beyond
recognition 26 29 10 23 29 27 22
D1
I still remember how
shocked I was when the
detectives told me the
body had been mutilated 23 26 8 22 24 24 19
D3
The detectives found it
hard to tell me that the
body showed signs of
sexual molestation 23 26 9 22 25 23 21
D2
I couldn‘t believe that
my spouse‘s throat was
slashed 18 21 8 17 20 19 17

WREN.EIC 8/4/2010 9:46 AM
2009] RULE DEVELOPING EXPERIMENTATION 33
C1
Since my loved one was
killed, I find myself
crying most of the time 5 5 5 6 3 4 9
C2
Since the murder, I find
myself overwhelmed by
even the thought of
leaving the house 4 5 -1 5 3 5 4
C4
I am always tired and
can never get a good
night‘s sleep since the
murder 3 4 0 3 3 3 4
E3
Since the murder, I can‘t
remember the last time
my friends invited me
out 2 3 -3 2 2 2 1
B1
I am having trouble
paying the mortgage
since the murder 2 2 2 1 3 2 2
C3
Although I used to enjoy
food, since the murder I
no longer have an
appetite 2 2 0 3 1 1 4
B4
I am having difficulty
paying the family‘s
health insurance
premiums since the
murder 1 1 2 2 1 2 0
E4
Since the murder, it
seems that my friends
are uncomfortable
around me 1 2 -3 0 1 1 0
E2
Since the murder, I no
longer know who my
true friends are 1 1 -1 1 0 1 0
B2
Since the murder I have
had to go on public
assistance 0 1 0 -1 2 1 0
E1
My friends treat me
differently since the
murder 0 1 -3 0 0 1 -2
B3
I am unable to keep up
with the children‘s
tuition payments since
the murder 0 0 0 0 0 0 2

WREN.EIC 8/4/2010 9:46 AM
34 BAYLOR LAW REVIEW [Vol. 61:1
A2 Black Male -1 -1 0 -1 -2 -2 3
A4 White Male -2 -2 -3 -2 -2 -2 -2
A1 Black Female -2 -2 -3 -3 -1 -3 -1
A3 White Female -3 -4 -2 -4 -2 -4 0 Table 4—The interest model for total panel and for three matched pairs of subgroups as well
as the range of utility values across these three matched pairs.
How „Who Does the Judging‟ (Males, Females) and „Who Does the Testifying‟ (Surviving Spouse) Jointly Determine What Elements Work Most Strongly to Drive a Vote for the Death Penalty
How can systematic experimentation that shows what elements ‗work‘
to drive towards the death penalty be further mined to identify what
elements work, if it is known who is doing the evaluating and who is doing
the testifying? The analysis of interactions between the respondent (mock
juror) and the witness (part of the test concept) works because researchers
can stratify the test concepts according to the different witnesses who are
part of the concept. Then, they can run the interest model for those concepts
only. The interest model is run separately on all of the concepts containing
each of the four testifying witnesses (white versus black males, white
versus black females).
Representation of the different test concepts is done in a matrix format.
Each row of the matrix is a concept. With 288 respondents and with each
respondent evaluating a unique set of 25 concepts, there are (25 x 288) or
7200 rows of data.
Finally, by summary, the model is run for the remaining 16 elements
(four elements each from financial, social, viciousness of the crime,
emotional, respectively) and leaving out the category of surviving spouse
who does the testifying. The regression analysis is run five times, once each
for the stratum comprising concepts with no surviving spouse and once
each for the four different strata comprising concepts with each of the four
different surviving spouses. The regression model shows the utility value
for the 16 elements (testimony) in the presence of each surviving spouse
who is giving that testimony. The data show how these remaining 16
elements drives the death penalty decision when statements are given by the
four types of spouses (black and white males, black and white females).
This analysis can be done with an even more fine-grained focus. One
can examine how male respondents versus female respondents respond to
the elements as driving to the death penalty or when the surviving spouse is

WREN.EIC 8/4/2010 9:46 AM
2009] RULE DEVELOPING EXPERIMENTATION 35
male or female, black or white (i.e., how the gender of the juror interacts
with the gender and color of the surviving spouse to drive the impact of the
messages).
This analysis generated the data shown in Table 5. Note that it is not
important to see a pattern immediately. Confirming or denying a specific
hypothesis, or looking for a simple rule based upon one or two
observations, is not the objective. Rather, the utility values in Table 5 stand
for ‗what works‘, when it is known who the juror is, who the testifying
witness is, and what is being said. Which one of those statements drives
towards the death penalty? Moving forward, an attempt can be made to
abstract a pattern. Most important, however, is to be able to create this
table.
A few interesting patterns were noted, although they are not yet worthy
to be called findings, because there are not enough respondents behind
each of the data points. For example, the additive constant or propensity to
vote for the death penalty, varies by the gender of the juror and the gender
and color of the surviving spouse giving the testimony.
Looking at the additive constant, the predisposition to vote for the death
penalty in the absence of any element, it can be seen that females judging
males were quite different from males judging males. This can be discerned
from looking at the additive constant for four columns, corresponding to the
gender of the juror, and the race/gender of the surviving spouse who
testified. Males were more consistent. Males listening to the testimony of
black male spouses showed an additive constant of 19. Males who listen to
the testimony of white male spouses showed an additive constant of 21.
Females were less consistent. Females listening to the testimony of black
male spouses showed an additive constant of 10, whereas when they
listened to the testimony of white males they showed an additive constant
of 27.
The database shown in Table 5 can be ‗mined‘ in order to extract
various findings and, in turn, create a wealth of hypotheses. That is not as
important as recognizing one of the major contributions of systematic
exploration, as shown here. The analysis can focus at many levels, from
simply ‗what works‘ to ‗what works among which respondents‘, to ‗what
works among which respondents based on who is giving the testimony‘.
The results come back in the form of ‗basic propensity to vote for the death
penalty‘ (additive constant) or part-wise impact or utility value for each
element as a driver towards the death penalty.

WREN.EIC 8/4/2010 9:46 AM
36 BAYLOR LAW REVIEW [Vol. 61:1
Table 5
A X B C D E F X G H I J K
Gender of the
juror
Av
era
ge
Ma
le
Ma
le
Ma
le
Ma
le
Ma
le
Fem
Fem
Fem
Fem
Fem
Gender and race
of the surviving
spouse who
testifies
No
ne
No
ne
Bla
ck
F
Bla
ck
M
Wh
ite F
Wh
ite M
No
ne
Bla
ck
F
Bla
ck
M
Wh
ite F
Wh
ite M
Additive constant 24 22 29 19 18 21 22 33 10 32 27
The body was bludgeoned
beyond
recognition
25 28 21 29 27 26 21 22 28 18 13
The detectives found it hard to
tell me that the
body showed
signs of sexual
molestation
24 24 22 22 25 22 24 13 27 16 17
I still remember
how shocked I was when the
detectives told
me the body had been mutilated
23 26 24 24 23 25 20 18 24 18 19
I couldn‘t believe
that my spouse‘s
throat was slashed
20 21 18 19 19 18 18 12 23 14 11
Since my loved
one was killed, I
find myself
crying most of
the time
9 3 3 3 2 7 15 7 8 5 10
Although I used
to enjoy food, since the murder
I no longer have
an appetite
9 3 -3 3 -4 4 14 4 5 -4 7
I am always tired and can never get
a good night‘s
sleep since the murder
6 4 -2 6 -2 4 8 3 3 0 10
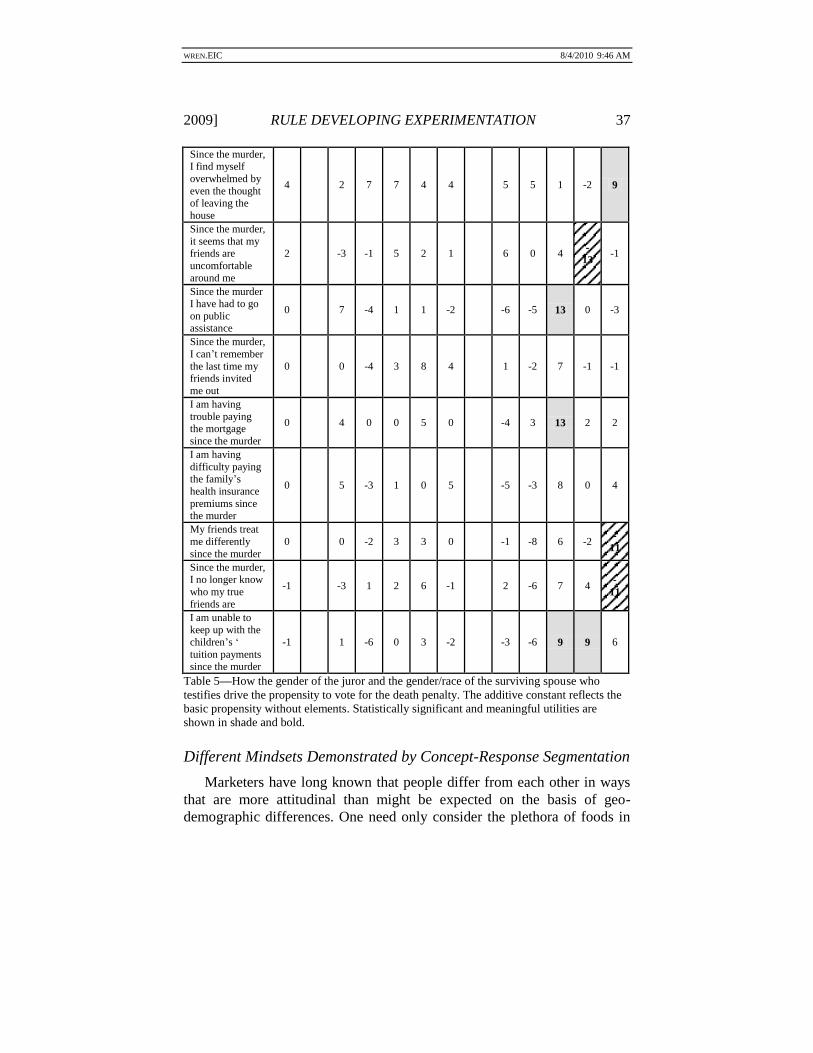
WREN.EIC 8/4/2010 9:46 AM
2009] RULE DEVELOPING EXPERIMENTATION 37
Since the murder, I find myself
overwhelmed by
even the thought of leaving the
house
4 2 7 7 4 4 5 5 1 -2 9
Since the murder,
it seems that my friends are
uncomfortable
around me
2 -3 -1 5 2 1 6 0 4 -
13 -1
Since the murder I have had to go
on public assistance
0 7 -4 1 1 -2 -6 -5 13 0 -3
Since the murder,
I can‘t remember
the last time my friends invited
me out
0 0 -4 3 8 4 1 -2 7 -1 -1
I am having
trouble paying the mortgage
since the murder
0 4 0 0 5 0 -4 3 13 2 2
I am having
difficulty paying
the family‘s
health insurance
premiums since the murder
0 5 -3 1 0 5 -5 -3 8 0 4
My friends treat
me differently
since the murder
0 0 -2 3 3 0 -1 -8 6 -2 -
11
Since the murder, I no longer know
who my true
friends are
-1 -3 1 2 6 -1 2 -6 7 4 -
11
I am unable to keep up with the
children‘s ‗
tuition payments
since the murder
-1 1 -6 0 3 -2 -3 -6 9 9 6
Table 5—How the gender of the juror and the gender/race of the surviving spouse who
testifies drive the propensity to vote for the death penalty. The additive constant reflects the
basic propensity without elements. Statistically significant and meaningful utilities are
shown in shade and bold.
Different Mindsets Demonstrated by Concept-Response Segmentation
Marketers have long known that people differ from each other in ways
that are more attitudinal than might be expected on the basis of geo-
demographic differences. One need only consider the plethora of foods in

WREN.EIC 8/4/2010 9:46 AM
38 BAYLOR LAW REVIEW [Vol. 61:1
any store to realize that there are many different ‗tastes‘ in the population,
and that a single product cannot satisfy all of these preference groups. The
same reasoning can be applied to people‘s responsiveness to messaging,
such as we have here with the juror votes for the death penalty. There are
differences among key subgroups, but these differences are not systematic.
To determine whether more fundamentally different, more ‗basic‘
groups of mind-sets in the population exist with respect to the messaging, a
clustering analysis was performed to uncover latent ‗segments‘ or groups of
individuals with different mind-sets. The term ‗latent‘ means that these
segments exist but are not necessarily co-terminus with conventional ways
of dividing people.
The method section of this paper provided the approach. Table 2
showed the distribution of respondents for the two segments that emerged
from this analysis. Three, four and five segment solutions were tried. In the
interests of parsimony and interpretability, we selected two segments as
being the simplest solution. Table 6 shows how the elements perform for
the two segments which can be called ‗more swayable‘ and ‗less swayable‘,
respectively.
1. The additive constant for the More Swayable segment was 20,
and for the Less Swayable segment was 26. The Less Swayable
started off slightly more predisposed to assign the death penalty.
2. The real difference came in the utility values from the
testimony. The messaging was far more powerful (3x more)
from some of the strongest scoring elements dealing with the
heinousness of the crime. Element D4, for example, ‗The body
was bludgeoned beyond recognition‘ had a utility of 45 for the
More Swayable segment and only a utility of 14 for the Less
Swayable.
3. Using the foregoing testimony (D4) created a 65% conditional
probability of the death penalty voted for by the More Swayable
Segment (Constant + Element Utility = 20 + 45 = 65), and a far
lower 40% conditional probability for the Less Swayable
Segment (Constant + Element Utility = 26 + 14 = 40).
4. The degree to which the More Swayable segment can be moved
always may work to the defendant‘s advantage. The More
Swayable segment responded to pictures of the surviving spouse
by moving towards life without parole. A white female as the
surviving spouse, for example, generated a utility value of -7,
which is just as impactful (but in a different direction) as

WREN.EIC 8/4/2010 9:46 AM
2009] RULE DEVELOPING EXPERIMENTATION 39
testimony that Since my loved one was killed, I find myself
crying most of the time!
Table 6
To
tal P
an
el
Segm
en
t 1
Mo
re S
waya
ble
Seg
men
t 2
Less S
wa
ya
ble
Additive constant 23 20 26
D4 The body was bludgeoned beyond recognition 26 45 14
D1 I still remember how shocked I was when the detectives told me the body had been mutilated 23 40 13
D3
The detectives found it hard to tell me that the body showed
signs of sexual molestation 23 37 14
D2 I couldn‘t believe that my spouse‘s throat was slashed 18 32 10
C1
Since my loved one was killed, I find myself crying most of
the time 5 6 4
C2
Since the murder, I find myself overwhelmed by even the
thought of leaving the house 4 5 4
C4
I am always tired and can never get a good night‘s sleep since
the murder 3 5 2
E3
Since the murder, I can‘t remember the last time my friends
invited me out 2 -3 5
B1 I am having trouble paying the mortgage since the murder 2 5 0
C3
Although I used to enjoy food, since the murder I no longer
have an appetite 2 2 2
B4 I am having difficulty paying the family‘s health insurance premiums since the murder 1 4 0
E4
Since the murder, it seems that my friends are uncomfortable
around me 1 -3 3
E2 Since the murder, I no longer know who my true friends are 1 -4 3
B2 Since the murder I have had to go on public assistance 0 2 -1
E1 My friends treat me differently since the murder 0 -5 3
B3
I am unable to keep up with the children‘s tuition payments
since the murder 0 4 -2
A2 Black Male -1 -4 1
A4 White Male -2 -4 -1
A1 Black Female -2 -5 -1
A3 White Female -3 -7 -1
Table 6—Segmenting the respondents by the pattern of their persuasion utilities generates
two mind-set segments with substantially different response patterns to the same testimony.

WREN.EIC 8/4/2010 9:46 AM
40 BAYLOR LAW REVIEW [Vol. 61:1
Creating the typing tool was straightforward, combining elements that
differentiate the segments were examined. Respondents in one segment
were far more drawn to one of the concepts than to the other. None of the
concepts were perfect; they were only devices by which to sort an
individual. There may, in fact, be two sets of such concepts rather than one
set.
For these data the statements about the heinousness of the crimes were
not used, because both segments responded strongly to those statements.
The statements about the heinousness simply did not sufficiently
differentiate to be useful, even though Segment 1 was more responsive to
them than was Segment 2.
Of practical import is the ability of the lawyer to ‗type‘ the jurors in
terms of their membership in a segment. Since the segments show different
patterns of what drives jurors to recommend the death penalty versus life,
when framing arguments it became important to fine-tune the statements to
the jurors. In the voir-dire, and with allowable juror questionnaires, one can
use the data from segmentation to frame two paragraphs, the choice of
which places a potential juror into the more swayable versus less swayable
segment, respectively. Examples of two paragraphs (i.e., test concepts)
appear in Table 7. Other combinations of elements from the study may be
used to type prospective jurors. The approach presented in Table 7 is
simply one alternative typing tool.
Table 7
To
tal
Mo
re
Sw
ay
ab
le
Less
Sw
ay
ab
le
Additive constant 23 20 26
Choose this concept - prospective juror is
probably in Segment 1
B1
I am having trouble paying the mortgage since
the murder 2 5 0
B3
I am unable to keep up with the children‘s tuition
payments since the murder 0 4 -2
B4
I am having difficulty paying the family‘s health
insurance premiums since the murder 1 4 0
Total (Constant + Element utilities) 27 33 23

WREN.EIC 8/4/2010 9:46 AM
2009] RULE DEVELOPING EXPERIMENTATION 41
To
tal
Mo
re
Sw
ay
ab
le
Less
Sw
ay
ab
le
Choose this concept – prospective juror is
quite likely in Segment 2
E3
Since the murder, I can‘t remember the last time
my friends invited me out 2 -3 5
E2
Since the murder, I no longer know who my true
friends are 1 -4 3
E1 My friends treat me differently since the murder 0 -5 3
Total (Constant + Element utilities) 26 9 37 Table 7—Suggested pair of paragraphs by which to ‗type‘ a prospective juror as belonging
to Segment 1 (More Swayable) or Segment 2 (Less Swayable).
„1+1 Occasionally Make 3 and Occasionally Make 0‟—Synergisms and Suppressions Are Absent Between Pairs of Elements
Synergism means that two elements generate a combination, the
response to which is far higher than what might be expected from the
response to the two elements considered separately. Suppression is the
same, unexpected effect of the combination, but with the combination
generating a response that is far lower.
In messaging research, synergisms and suppressions are often talked
about but rarely demonstrated. Recent concept research by Gofman (2006)
provides a method by which to uncover these synergisms. When applied to
these data and this specific experimental design (5 categories, 4 elements
per category, 20 elements altogether), the method first forces the 20
elements into the equation. Then the method attempts to find additional
pairs of elements that add significant increased predictability to the model.
The equation already has 20 terms. There are an additional 10 pairs of
categories (AB, AC, AD, AE, BC, BD, BE, CD, CE, DE), and 16 pairs of
elements for each pair of categories (e.g., A1B1 . . . A4B4 = 16 unique
combinations). Therefore, there are a possible 160 pair-wise interactions.
The analysis looks for any pair of elements that adds significant
predictability to the model that already comprises 20 elements. In previous
studies of this type, about 3% to 5% of the pairs qualified as synergistic or
suppressive.
The analysis of these results suggest that 4 of the 160, or 1/40 = 2.5% of
the pairs, generate a synergism or suppression, about what is found in other
studies. It is important thing to identify which specific combination
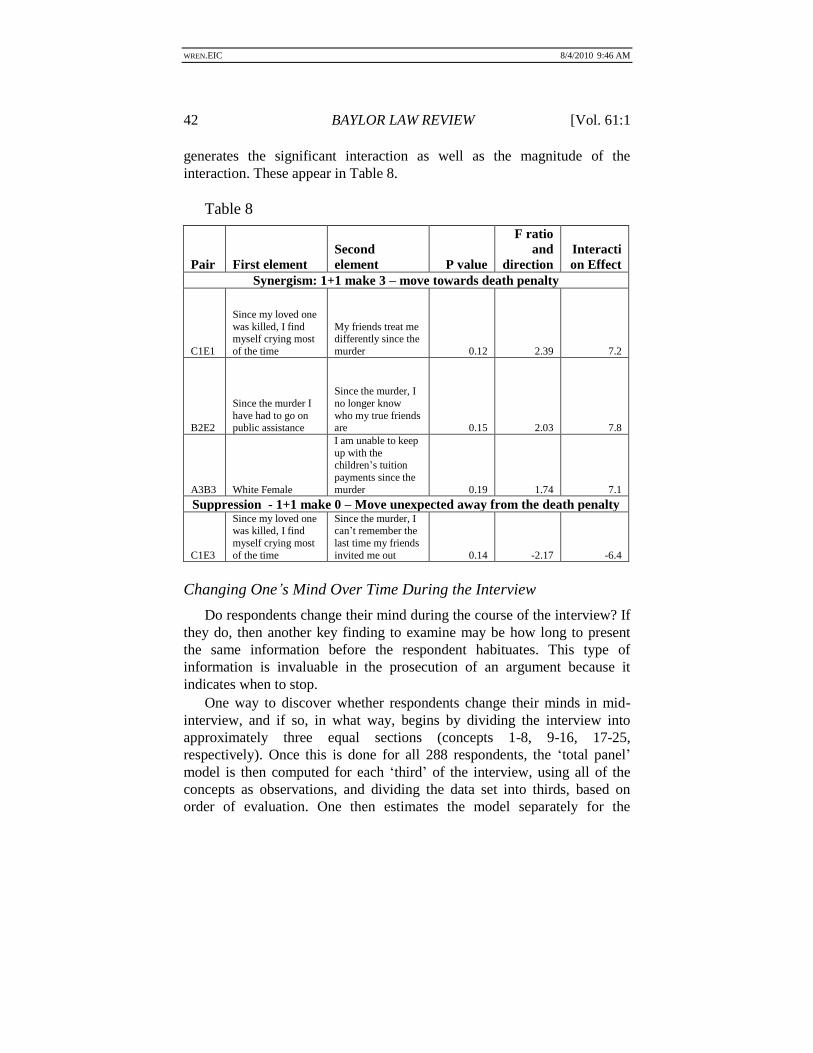
WREN.EIC 8/4/2010 9:46 AM
42 BAYLOR LAW REVIEW [Vol. 61:1
generates the significant interaction as well as the magnitude of the
interaction. These appear in Table 8.
Table 8
Pair First element
Second
element P value
F ratio
and
direction
Interacti
on Effect
Synergism: 1+1 make 3 – move towards death penalty
C1E1
Since my loved one
was killed, I find myself crying most
of the time
My friends treat me differently since the
murder
0.12 2.39 7.2
B2E2
Since the murder I
have had to go on public assistance
Since the murder, I
no longer know
who my true friends are 0.15 2.03 7.8
A3B3 White Female
I am unable to keep
up with the children‘s tuition
payments since the
murder 0.19 1.74 7.1
Suppression - 1+1 make 0 – Move unexpected away from the death penalty
C1E3
Since my loved one was killed, I find
myself crying most
of the time
Since the murder, I can‘t remember the
last time my friends
invited me out 0.14 -2.17 -6.4
Changing One‟s Mind Over Time During the Interview
Do respondents change their mind during the course of the interview? If
they do, then another key finding to examine may be how long to present
the same information before the respondent habituates. This type of
information is invaluable in the prosecution of an argument because it
indicates when to stop.
One way to discover whether respondents change their minds in mid-
interview, and if so, in what way, begins by dividing the interview into
approximately three equal sections (concepts 1-8, 9-16, 17-25,
respectively). Once this is done for all 288 respondents, the ‗total panel‘
model is then computed for each ‗third‘ of the interview, using all of the
concepts as observations, and dividing the data set into thirds, based on
order of evaluation. One then estimates the model separately for the

WREN.EIC 8/4/2010 9:46 AM
2009] RULE DEVELOPING EXPERIMENTATION 43
concepts in each third. This analysis of terciles is valid because each
respondent evaluated a different set of combinations, totally randomized.
The results of this order analysis appear in Table 9. The concepts were
divided into the three thirds and the model run for the panel, for males, and
for females, respectively. The difference in utility values between the first
third of the concepts and the final third of the concepts was then computed,
keeping only those elements where the absolute value of the difference was
5 or more. When the first third of the concepts generate higher utilities than
do the final third (i.e., utilities decrease) it was concluded that repeated
exposure decreases the propensity to vote for the death penalty, i.e., the
respondent becomes more lenient. When the first third generated lower
utilities than did the final third (i.e., utilities increase) it was concluded that
repeated exposure increases the propensity to vote for the death penalty,
i.e., the respondent becomes more strict.
The most striking thing about these results was the strong drop in the
additive constant, namely the conditional probability or percent of
respondents (i.e., jurors) voting for the death penalty without the presence
of elements. As the survey progressed there was a strong drop, i.e.,
increasing leniency, most noticeable for men, but also present for women.
The same pattern held for the strong performing individual elements. It was
men more than women who changed their mind during the course of the
interview, and not always for leniency. As the survey went on, men became
more lenient (voted for life without parole) with respect to the description
of the heinousness of the crime. However, when the surviving spouse talked
about hardships, the men became far less lenient, voting more for the death
penalty. This change, during the course of the survey, and thus, by
implication of the course of the trial, deserves far more investigation,
because it suggested that different arguments may have to be adduced,
depending upon where in the trial the parties find themselves.

WREN.EIC 8/4/2010 9:46 AM
44 BAYLOR LAW REVIEW [Vol. 61:1
[pages 44 & 45 are intentionally left blank to insert Table 9]

WREN.EIC 8/4/2010 9:46 AM
2009] RULE DEVELOPING EXPERIMENTATION 45
[pages 44 & 45 are intentionally left blank to insert Table 9]

WREN.EIC 8/4/2010 9:46 AM
46 BAYLOR LAW REVIEW [Vol. 61:1
RELIABILITY—DO THE RESULTS HOLD UP WHEN THE TEST IS RUN
TWO MONTHS LATER WITH DIFFERENT PEOPLE?
One of the key aspects of a good research procedure is that the
procedure produces the same results when it is repeated. This is called
reliability. In order to establish reliability it is necessary to run the same
study twice, at different times, with different people. To the degree that the
results are identical from one study to another, the procedure is reliable.
The same study was run two months apart. This paper presented the
results of the first study, comprising 288 respondents (223 females, 65
males). The second study, run to replicate the first, comprised 194
respondents (154 females, 40 males). There was almost the same percent of
males and females in the two studies. Figure 5 shows the closeness of the
two sets of utilities. Each circle corresponds to one of the 20 elements in the
study. The line shows the pattern to be expected if there were perfect
agreement between the two studies, run at different times, with different
respondents. It is very clear that except for a few elements, the data are
highly reliable.
Figure 5
-10 0 10 20 30
Study 1 - Females
-10
0
10
20
30
Stu
dy 2
- F
em
ale
-10 0 10 20 30
Study 1 - Males
-10
0
10
20
30
Stu
dy 2
- M
ale
s
Figure 5—Scatter plot of the 20 utilities estimated for study 1 (reported here) and study 2
(run two months later). The line corresponds to perfect reliability. The correlations are 0.98
for females and 0.96 for males.

WREN.EIC 8/4/2010 9:46 AM
2009] RULE DEVELOPING EXPERIMENTATION 47
DISCUSSION
The first issue here is the representation of the respondents as surrogates
for the jury. Requirements for participation in this study included access to
a personal computer, online interconnectivity, and entrée to internet
surveys. In real life, jurors come from a wider pool and may differ
demographically from respondents used as surrogate jurors. Besides being
computer literate, respondents here were predominantly white (88%),
(African American 5%, Hispanic 2%, Asian 1%, other 4%), female (77%),
overage 41 (72%), earned over $55,000 per year (47%), and had a college
or graduate degree (47%). Real jurors are known to vary widely on these
demographics depending on geographic locale. Jurors vary widely in the
degree in which they volunteer for or attempt to elude jury duty.
The second issue here is the nature of the interview. This study was run
as a self-administered, Internet-based interview. Real jurors do not vote in
isolation as did study respondents, but are by most accounts, highly
interactive in congregate deliberations leading to votes which may be
multiple as all jurisdictions require unanimity or a lesser majority for a
verdict. Depending on the situation, real jurors may see multiple family
members impacted by a murder and the ways each can be impacted are
more numerous than the four items listed in the other categories of this
research study (financial, emotional, viciousness of crime, social). This
research looked only at whether specific items of one of five categories
combined to synergize or suppress across categories, but did not look at
cumulative interactions within categories. Nonetheless, these are the types
of concerns that beset most research incorporating mock jurors. Although
such concerns limit generalizations that can be made about results, the
heuristic value of such research remains recognized.
From the analyses of the segments identified in this study a ‗tool‘ for
typing or sorting jurors was created by empirical findings. ‗Typing‘ allows
the lawyer to identify jurors whose basic stance may be favorable or
unfavorable to the case. One way to type a juror is to present two or more
concepts constructed from the data set. Depending upon how the
prospective juror rates, ranks, or chooses between the concepts, its possible
to identify the respondent as belonging to one segment or to the other. An
example of such typing was seen in Table 7.
For cases where there is more segmentation, the same approach can be
used, except that the prospective juror has to select, rate, or rank from a set
of three or more concepts, constructed to differentiate among the segments.
It may not be necessary to infer a link between exogenous variables about a

WREN.EIC 8/4/2010 9:46 AM
48 BAYLOR LAW REVIEW [Vol. 61:1
prospective juror (e.g., age, income, gender, occupation, etc.) and
membership in a ‗mind-set‘ segment. Such links are, at best, tenuous. We
avoid this effort and a possible weak bridge to segmentation by a method
that is ‗self-validating‘. The respondents are exposed to precisely the same
elements to which a segment strongly responds, as established empirically.
That is, to include new individuals in that segment, we simply use the
response behavior defining a segment. To the degree that the „test‟ is
reliable, we can feel comfortable with the typing of new respondents, and
can consider this typing to fall into the category or measurement reliability,
rather than measurement validity.
ACKNOWLEDGMENTS
The authors would like to thank Jim Wren of Baylor Law School for
insight into potential application of ‗typing‘ prospective jurors. Dr. Howard
R. Moskowitz would like to thank his editorial assistant, Linda Lieberman,
for keeping him on publication schedule.
REFERENCES
Arrigo, B.A. & Williams, C.R. (2003). ‗Victim vices, victim voices, and
impact statements: On the place of emotion and the role of restorative
justice in capital sentencing,‘ Crime & Delinquency, 49(4), 603-626.
Forster Lee, L., Fox, G.B., Forster Lee, R., & Ho, R. (2004). ‗The
effects of a victim impact statements and gender on juror information
processing in a criminal trial: Does the punishment fit the crime?,‘
Australian Psychologist, 57.
Granados, A.E. ‗The (un)constitutionality of victim impact statements:
Assessing the effect of victim impact statements during the sentencing
phase of a capital trial.‘ Unpublished doctoral dissertation. Alliant
University, 132 pages. AAT3092422. Fresno, CA(2003).
Gofman, A. (2006). ‗Emergent scenarios, synergies and suppressions
uncovered within conjoint analysis,‘ Journal of Sensory Studies, 32, 373-
414.
Greene, E. (1999). ‗The many guises of victim impact evidence and
effects on jurors‘ judgments,‘ Psychology, Crime and Law, Vol. 5, 331-
348.
Luginbuhl, J. and Burkhead, M. (1995). ‗Victim impact evidence in a
capital trial: Encouraging votes for death,‘ American Journal of Criminal
Justice, 20(1), 1-16.

WREN.EIC 8/4/2010 9:46 AM
2009] RULE DEVELOPING EXPERIMENTATION 49
Myers, B. and Arbuthnot, J. (1999). ―The effects of victim impact
evidence on the verdicts and sentencing judgments of mock jurors,‖ Journal
of Offender Rehabilitation, 29(3-4), 95-112.
Myers, B. and Greene, E. (2004). ―The prejudicial nature of victim
impact statements: Implications for capital sentencing policy,‖ Psychology,
Public Policy, and Law, 10(4), 492-515.
Myers, B., Lynn, S.J. & Arbuthnot, J. (2002). ―Victim impact testimony
and juror judgments: The effects of harm information and witness
demeanor,‖ Journal of Applied Social Psychology, 32, 2393-2412.
Myers, B., Weidemann, E. & Pearce, G. (2006). ―Psychology weighs in
on the debate surrounding victim impact statements and capital sentencing:
Are emotional jurors really irrational?,‖ Federal Sentencing Reporter, Vol.
19, No. 1, 13-20.