Embed Size (px)
Citation preview
Selling the family silver to pay the grocer�s bill?
The case of privatization in India
Nandini Gupta�
March 18, 2011
Abstract
Using data on Indian government-owned �rms, we investigate the
e¤ect of privatization on the performance of these �rms. Our results
suggest that privatization is positively associated with the pro�tability
and e¢ ciency of of government-owned �rms. Despite the small number
of transactions, selling majority equity stakes to private owners has an
economically signi�cant impact on �rm performance. Moreover, pri-
vatization is not associated with layo¤s or a decline in employee com-
pensation. These results are robust to controlling for the observable
and unobservable characteristics of �rms selected for privatization, and
industry and country level reforms.
�Kelley School of Business, Indiana University, [email protected]. This paper hasbene�ted from the comments of Jagdish Bhagwati, Arvind Panagariya, T.N. Srinivasan,Jan Svejnar, Ashutosh Varshney, and the participants at the Workshop on the IndianEconomy, August 2010 and the Conference on Indian Economic Reforms, November 2010,Columbia University. All remaining errors are my own. Work on this paper has beensupported by Columbia University�s Program on Indian Economic Policies, funded by agenerous grant from the John Templeton Foundation. The opinions expressed in the paperare those of the author and do not necessarily re�ect the views of the John TempletonFoundation.
1
1 Introduction
Government-owned �rms occupy an important position in the Indian econ-
omy. Federal government-owned �rms contributed more than 11 percent of
GDP in 2005 (Economic Survey, 2006-07), and just 47 listed government-
owned �rms constituted 22% of the total market capitalization of the Bom-
bay Stock Exchange as of February 28, 2011 (Bombay Stock Exchange
Disinvestments Database, March 2011). However, government-owned �rms
are highly ine¢ cient due to surplus employment, rent-seeking activities by
politicians, protection from competitive forces, and the absence of market-
based incentives for workers. For example, while158 federal government-
owned �rms reported positive pro�ts, another 59 �rms reported cumulative
losses of approximately Rs. 158 billion in 2009 (Public Enterprise Survey,
2009-10).
Following a balance of payments crisis in 1991, the Indian government
undertook wide-ranging economic reforms to reduce the role of the govern-
ment in the economy, including delicensing, foreign investment and trade
liberalization, �nancial sector reforms, and privatization. Since 1991, the
government has raised approximately Rs. 960 billion from privatization
sales (Bombay Stock Exchange Disinvestments Database, March 2011). Of
the 249 non-�nancial �rms owned by the federal government, successive
governments have sold partial equity stakes on the stock market without
transferring management control in 47 �rms, and have sold majority stakes
and transferred management control in 14 �rms.
The two privatization methods, partial and majority sales, adopted by
2
the Indian government o¤er us insight into the long-standing debate over
why government-owned �rms perform poorly. First, the managerial view,
based on agency theory, is that government-owned �rms have di¢ culty mon-
itoring managers because there is neither an individual owner with strong
incentives to monitor managers nor a public share price to provide informa-
tion about manager actions as judged by stock market participants (La¤ont
and Tirole (1993)). Partial privatization, where the shares of the �rm are
traded on the stock market while the �rm remains under government con-
trol and subject to political interference, o¤ers a test of this theory. Using
data on all partial privatizations undertaken between 1991 and 1999 in In-
dia, Gupta (2005) �nds that, consistent with the managerial view, the sale
of partial equity stakes increases the sale revenues, pro�tability, and labor
productivity of government-owned �rms.1
According to the political view of government ownership, governments
pursue objectives in addition to and in con�ict with pro�t maximization and
the resulting political interference may distort the objectives and constraints
faced by managers (Shleifer and Vishny (1994)). For example, Fan, Wong,
and Zhang (2007) �nd that Chinese partially privatized �rms with politically
connected CEOs are more likely to underperform, and appoint less profes-
sionally quali�ed but politically connected board members. Therefore, only
the outright transfer of �rms to private owners will lead to performance im-
provements. India�s privatization experience is useful in this regard because
the Indian government undertook both partial privatizations as well as the
1The majority of privatization studies show that privatization has a positive e¤ect on�rm performance. For a recent survey see Megginson and Netter (2001).
3

sale of majority stakes with the transfer of management control, which al-
lows us to investigate the political view. In particular, we examine the e¤ect
of privatizing majority stakes and transferring management control on the
performance of government-owned �rms that have been partially privatized
and are trading on the stock market.
The literature has shown that governments are likely to selectively choose
�rms for privatization based on observable and unobservable characteristics.
For example, Gupta, Ham and Svejnar (2008) show that pro�table �rms are
more likely to be privatized, while Dinc and Gupta (2010) �nd that �rm-level
characteristics are likely to a¤ect the selection of �rms for privatization. To
address the potential endogeneity of privatization to �rm performance we
estimate a �rm �xed e¤ects speci�cation that addresses selection bias that
may arise if more pro�table or larger �rms are selected for privatization. To
address dynamic selection bias, which may arise if the government selects
�rms for privatization based on unobservable time-varying characteristics,
we use the approach suggested by Frydman et al. (1999). In particular,
they argue that �rms that are selected for privatization are likely to share
similar characteristics, so comparing privatized �rms to a control group of
�rms that have also been selected for privatization but have not yet been
sold should address this selection bias. Since privatization is distributed over
several years in our data, in any given year we also observe �rms privatized
in later years that form the control group. To minimize the possibility of
simultaneity between privatization and performance, we use the lagged share
of private ownership. The speci�cations also include �rm-speci�c controls
such as �rm size and the industry Her�ndahl index to control for the e¤ect
4

of industry level reforms that may a¤ect the performance of �rms. Lastly,
we include year dummies to control for contemporaneous macroeconomic
shocks.
Using data on all privatizations undertaken since the start of the process
in 1991 until 2009, we �nd that performance improvements are signi�cantly
and positively related to the fraction of equity sold. For example, comparing
privatized �rms to �rms that have been selected for privatization but have
not yet sold any equity, we �nd that a 10 percentage point increase in the
level of private equity would increase annual sales by 3:3%, returns to sales
by 3:8%, and net worth to sales by 17% on average. Our results also suggest
that privatization is not associated with a decline in employment. These
results are robust to controlling for �rm �xed e¤ects, average �rm size,
industry characteristics, and contemporaneous reforms at the country level.
Our results also suggest that the sale of majority equity stakes has an
economically signi�cant impact on �rm performance. Compared to par-
tially privatized �rms, sales and returns to sales increase by 23% and 21%
respectively on average when �rms sell majority equity stakes and transfer
management control to private owners. Moreoever, the sale of majority eq-
uity stakes are not accompanied by layo¤s. In fact, employment appears to
increase signi�cantly following privatization.
Despite the ine¢ ciency of government-owned �rms, public support for
privatization in India remains low, as suggested by the fact that it is of-
�cially referred to as �disinvestment�.2 The prevailing argument against
2Ahmed and Varshney (2008) note that privatization has been more di¢ cult to imple-ment than other policies such as stock market liberalization: �Within economic policy. . .some issues are more likely to arouse mass contestation than others. Privatization, a
5

privatization is best captured by a recent quote from a Member of Parlia-
ment: �Disinvestment of the public sector is nothing but selling the family
silver to meet the grocer�s bill,�(Times of India, June 9, 2009, �DMK puts
spoke in disinvestment plans�). However, our results suggest that priva-
tization is associated with signi�cant improvements in the performance of
government-owned �rms, and these e¤ects are robust to the pre-privatization
characteristics of �rms, indicating that pro�table �rms also bene�t from pri-
vatization.
Examining the role of politics in India�s privatization program, Dinc and
Gupta (2010) show that �rms located in electoral districts where the gov-
erning party is in a close race with opposition parties, and �rms located
in the home state of cabinet ministers, are much less likely to be priva-
tized.3 Acknowledging the political cost of privatization one Prime Minister
noted, �If you face immediate political problems - elections in four states -
it is hard to push ahead. . .We had to worry about the prospects of unem-
ployment if public sector units faced closure,� (Asia Times, April 8, 1997,
�India�s Reform Architect Looks On From The Sidelines�). However, fears
of layo¤s following privatization may be exaggerated since our results sug-
change in labor laws, withdrawal of agricultural subsidies... Either a large number ofpeople are negatively a¤ected in the short run (agriculture), or those so a¤ected, evenwhen not in large numbers, are well organized in unions (privatization and labor laws). Itshould now be clear why India�s decision makers have. . . achieved limited privatization�(page 22).
3There is a growing literature on the political economy of privatization. For example,Jones et al. (1999) show that governments adopt terms of sale that are consistent withpolitical objectives; Clarke and Cull (2002) �nd that the political a¢ liation of the govern-ment does not have a robust impact on the probability of bank privatization in Argentina;Bortolotti and Pinotti (2008) show that privatization is delayed in democracies with pro-portional electoral systems; and, Dastidar, Fisman, and Khanna (2009) show that thereis policy irreversibility in the privatization process in India
6

gest that government-owned �rms that do not privatize reduce workforce
size on average compared to privatized �rms.
In Section 2 below we describe the background to government ownership
and privatization in India, Section 3 describes the data, Section 4 describes
the regression results, and Section 5 concludes.
2 Government-ownership and privatization
2.1 Government-owned �rms
The �rst prime minister of post-independence India, Pandit Jawaharlal
Nehru envisaged the role of government-owned �rms as the �commanding
heights� of the economy, on the grounds that the nascent private sector
would not undertake projects requiring large investments with long gesta-
tion periods. The Industrial Policy Resolution of 1956, stated, �The State
will progressively assume predominance and direct responsibility for set-
ting up new industrial undertakings and for developing transport facilities.�
While on the eve of the First Five Year Plan in 1951 there were 5 fed-
eral government-owned �rms with a total investment of Rs. 290 million,
in 2010, there were 249 �rms with a total investment of Rs.5,799.2 billion
and employing 1.5 million non-casual workers (Public Enterprise Survey,
2009-10). We focus on �rms owned by the federal government, which ac-
count for about 85% of the total assets of all government-owned companies
(Gupta (2005)), and operate in a large number of manufacturing, service,
and infrastructure industries, including steel, cement and chemicals; capital
goods; electricity and gas; as well as services such as technology, telecom-
7
munications, trade, tourism, and warehousing, among others. The banking,
insurance, and �nancial services sectors are also heavily dominated by fed-
eral and state-government owned �rms.
The in�uence of the government on India�s economy was described by
Prime Minister Manmohan Singh as follows: �In the initial stages of In-
dia�s development central planning was a positive factor for development of
promoting industrialization, of building industries which would never have
[been] built...But the real problem starts after 15 or 20 years, because the
central-planning system that we have evolved and [that] other countries have
evolved lack an e¤ective incentive system to modernize on a progressive ba-
sis, to improve productivity, to bring new technology,� (PBS Interview for
Commanding Heights, February 6, 2001).
Federal government-owned �rms typically underperform in comparison
to private �rms in the same industry (Department of Disinvestment (2001)).
For example, between 1990 and 1998 the ratio of pro�ts after tax to sales av-
eraged -4.4% for government-owned manufacturing �rms, and 6.7% among
private �rms (Department of Disinvestment (2001)). In 2009, 158 �rms
reported cumulative pro�ts of about Rs. 1, 084.4 billion, while 59 �rms
reported accumulated losses of Rs. 158 billion (Public Enterprise Survey,
2009-10). These �rms are typically oversta¤ed, and the average wages of
government-�rm workers are twice as high as in the private sector (Pana-
gariya (2008)), which may explain why government �rm workers typically
oppose privatization. Describing this opposition a news article reported:
�Over 25,000 ONGC [Oil and Natural Gas Commission] sta¤observed �black
day�and their union leaders went on hunger strike to mark their protest over
8

the privatisation move,�(The Financial Times, 1993).
Central government-owned �rms are also large. As of February 2011,
the total market capitalization of the 47 �rms listed on the country�s largest
stock exchange, the Bombay Stock Exchange (BSE) was about Rs. 14 tril-
lion, accounting for 22% of the total market capitalization of the 4942 listed
companies on the BSE. Taking into account government-owned banks and
regional government owned �rms increases the share of market capitaliza-
tion of all government-owned �rms to 28.8% of total market capitalization
(Bombay Stock Exchange Disinvestments Database, March 2011).
2.2 Evolving privatization policy
In response to a balance of payments crisis in 1991, India undertook sweeping
economic reforms that included deregulation and privatization. Outlining
the economic reforms, the Industrial Policy Resolution of 1991 argued for
partial divestiture in government-owned �rms �in order to provide further
market discipline to the performance of public enterprises�(paragraph 34).
Between 1991 and 2004, nearly every government�s annual budget declared
that the privatization goal is to reduce government ownership to 26% of eq-
uity, the minimum equity holding necessary for certain voting powers, in all
government-owned �rms not in the defense, atomic energy, and railway sec-
tors. However, until 1999, successive governments sold only minority stakes,
sometimes as little as 0.1%, without transferring management control. Par-
tial privatization proved to be a lucrative source of revenues without the
accompanying political controversy of transferring control of government-
owned assets to private owners.
9
In Table 1 we list the number of privatization transactions and the
amounts received from privatization sales for each year since the start of
the program and until 2009. Out of about 250 non-�nancial �rms owned by
the federal government, 55 �rms have sold partial and majority equity stakes
between the �scal years 1991 and 2009, some in multiple tranches. Since
2010, the Indian government has sold minority equity stakes in another six
�rms, three of which were initial public o¤erings (Coal India, Manganese
Ore India Limited, and Satluj Jal Vidyut Nigam).4 The privatization pro-
gram was initiated by the Congress government in 1991, and after a brief
hiatus was continued by the BJP government elected in 1999. However, the
program stalled when the BJP-led government was defeated in 2004, until it
was resurrected by the reelected Congress government in 2009 with the sale
of minority equity stakes in 5 �rms. Between 1991 and 2010, total revenues
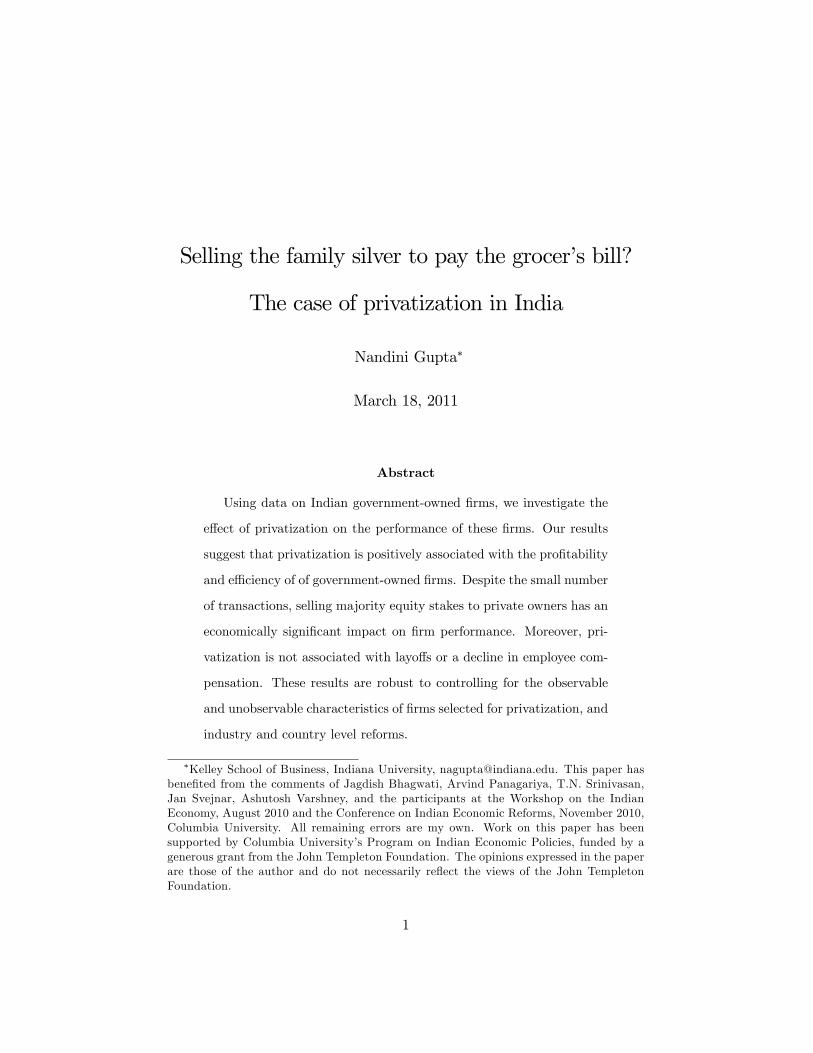
raised from privatization sales was about Rs. 960 billion. In Figure 1, we
describe the annual breakdown of revenues raised from privatization sales in
India between 1991 and 2010.
Starting in 1991, the ideologically center-left Congress government par-
tially privatized 39 �rms, some of which sold equity multiple times. Fol-
lowing the defeat of this government in 1996, the privatization program
remained in hiatus until 1999. The incoming government led by the con-
servative Bharatiya Janata Party (BJP) continued the practice of minority
equity sales on �nancial markets, but also sold majority stakes and trans-
ferred management control in 14 �rms. Although privatization revenues
4The maximum amount raised in any year from privatization through public o¤eringsis Rs. 228 billion in 2010 (Bombay Stock Exchange, Disinvestments Database).
10
from strategic sales were only a small fraction of the amounts raised through
partial privatizations (Department of Disinvestment, 2010), this represented
a major shift in policy from previous governments. The companies priva-
tized through majority sales are listed in Table 2 along with the names of
the acquiring �rms.
Political considerations may explain why so few privatizations were un-
dertaken by the BJP. In fact, attributing the defeat of the BJP-led National
Democratic Alliance government in the 2004 elections to its disinvestment
[privatization] program, a major newspaper�s editorial opined, �The Indian
voters. . . were rejecting the National Democratic Alliance [NDA] govern-
ment, which, as one poll slogan had it, stood for the �National Disinvestment
Agency�(The Hindu, 2004).
The privatization program came to a halt after the defeat of the BJP gov-
ernment in 2004, which saw the election of the Congress party and its coali-
tion partners (UPA). Since 2004, the UPA government, which was reelected
in 2009, has sold only minority equity stakes in 11 �rms. The Economic
Survey (Ministry of Finance, 2008-09) describes the current government�s
policy as follows: (1) Generate at least Rs. 250 billion per year from priva-
tization sales. (2) Sell 5-10% equity in previously identi�ed pro�t making
�rms that are not one of the �navratnas�, or nine most prestigious �rms.
(3) List all unlisted �rms and sell a minimum of 10% of equity to the public,
and (4) Auction all loss making �rms that cannot be revived.
In February 2010, the government resurrected its stalled privatization
program with a secondary o¤ering of shares in National Thermal Power
Corporation Ltd (NTPC), which owns 20% of India�s power generation ca-
11

pacity. However, the Wall Street Journal noted that the sale of minority
equity stakes �makes this a fund-raising exercise rather than a meaningful
shift toward less state control,�(�In India, o¤ers fall well short of P-word,�
February 4, 2010, The Wall Street Journal). Since then the government
has continued the practice of selling minority equity stakes, while retaining
majority government ownership and management control of �rms.
The lack of meaningful progress in privatization is mainly due to the
fact that successive coalition governments have required the support of mul-
tiple coalition partners to maintain a parliamentary majority. For example,
during the current government�s regime, the privatization of Neyveli Lignite
located in Tamil Nadu was delayed because of opposition from a coalition
member, the DMK party, which is based in Tamil Nadu. And the privati-
zation of �rms located in West Bengal has been delayed due to opposition
from the West Bengal based Trinamool Congress party. As noted in a news-
paper editorial, �It is not that the DMK and the Trinamool Congress have
any deep ideological opposition to disinvestment. . . these parties�concern
over disinvestment will stem from its likely impact on the mood of voters
in the next Assembly elections...No political party will like to be associated
with any proposal that results in obvious job losses or relocation of employ-
ees and then lose votes in the elections.�(Business Standard, June 3, 2009,
�Disinvestment, There is many a slip�).
The literature supports the anecdotal evidence. Examining the role of
politics in India�s privatization program, Dinc and Gupta (2010) �nd that
successive Indian governments have been reluctant to privatize because of a
potential electoral backlash. For example, �rms located in electoral districts
12

where the governing party is in a close race with opposition parties, and
�rms located in the home state of the Cabinet Minister, are much less likely
to be privatized.
3 Data
We observe �nancial data annually for 213 manufacturing and non-�nancial
service sector companies owned by the federal government of India. To avoid
attrition bias we do not require the panel to be balanced. The data are
collected by the Centre for Monitoring the Indian Economy (CMIE) from
company annual reports. The data start in �scal year 1988, prior to the
launch of the economic reforms of 1991, and end in �scal year 2008, hence
we include all privatization transactions conducted until the end of 2008-09.
Data on privatization transactions were obtained from the Disinvestment
Commission of the Government of India and the Disinvestments Database
of the Bombay Stock Exchange.
Comparing the pre-privatization characteristics of privatized �rms to
�rms that remain fully government-owned, we note several di¤erences. In
Table 3 we report that compared to fully government-owned �rms, �rms
selected for partial privatization are nearly four times as large in terms of
sales and gross �xed assets, and employ twice as many workers. Firms
that are partially privatized are also more pro�table and e¢ cient (higher
pro�ts, return on sales, and networth), borrow more, and have lower com-
pensation relative to size. Firms that eventually sell majority equity stakes
have higher sales, lower assets, higher return on sales, fewer employees, and
13

lower levels of employee compensation compared to �rms that remain fully
government-owned. Partially privatized �rms are also signi�cantly larger
compared to majority sale �rms. In the regression analysis we control for
the pre-privatization characteristics of �rms.
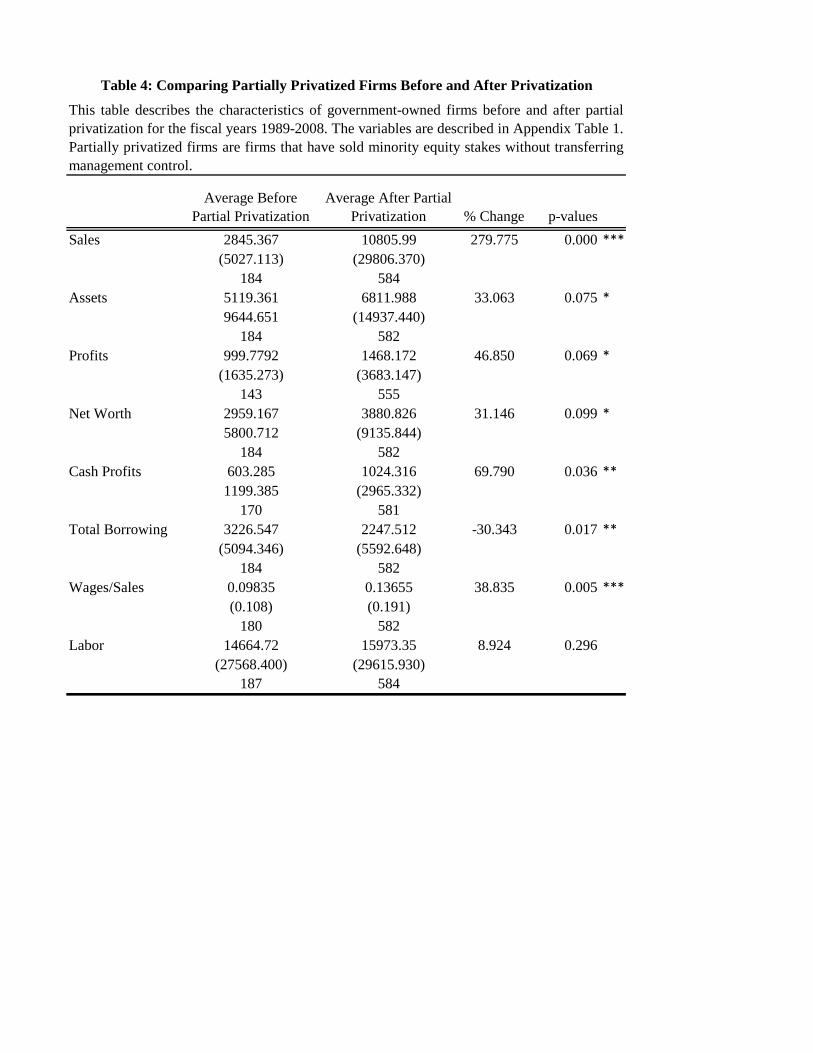
Table 4 presents before-after statistics for selected performance measures
for partially privatized �rms. Speci�cally, using the sample of partially
privatized �rms, we compare average performance in the years following the
�rst public o¤ering to the average performance of �rms in the years before
they sell any equity. We �nd that �rms experience a signi�cant increase in
average sales, gross �xed assets, pro�ts, net worth, and cash pro�ts after
partial privatization.
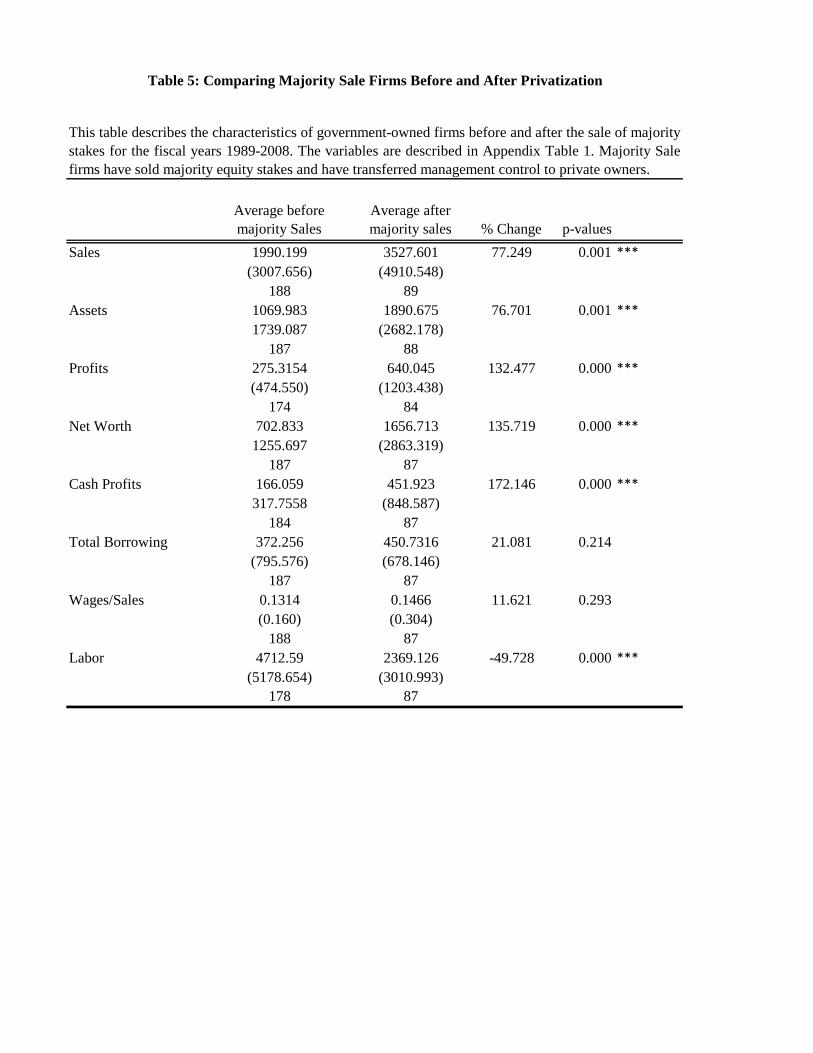
In Table 5 we describe before-after statistics for selected performance
measures for �rms that have sold majority equity stakes and transferred
control to private owners. The average e¤ects suggest that these �rms ex-
perience a signi�cant increase in sales, asset size, pro�ts, net worth, and
cash pro�ts following the sale of majority equity stakes and the transfer of
management control to private owners. Unlike partially privatized �rms,
�rms that have transferred control to private owners appear to experience
a signi�cant decrease in employment following ownership change. Below we
describe the results from the regression analysis.
4 Regression results
A. E¤ect of Private Ownership
We start out by investigating the average e¤ect of selling partial and
14
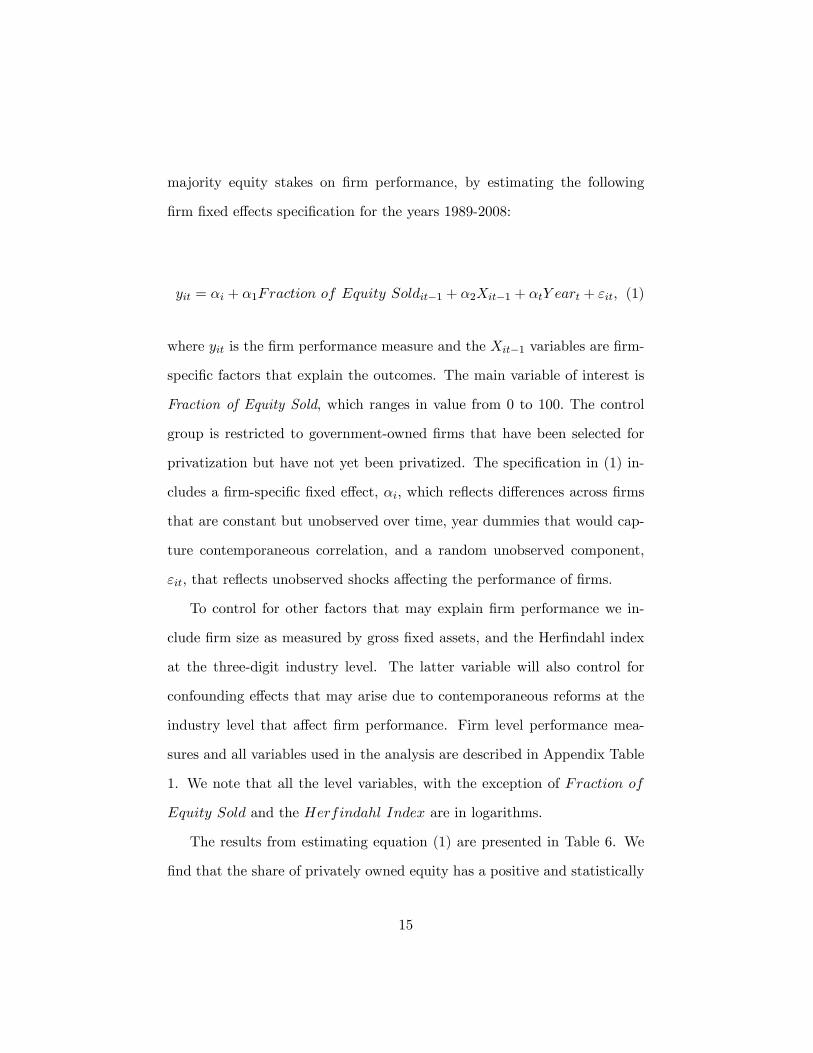
majority equity stakes on �rm performance, by estimating the following
�rm �xed e¤ects speci�cation for the years 1989-2008:
yit = �i + �1Fraction of Equity Soldit�1 + �2Xit�1 + �tY eart + "it; (1)
where yit is the �rm performance measure and the Xit�1 variables are �rm-
speci�c factors that explain the outcomes. The main variable of interest is
Fraction of Equity Sold, which ranges in value from 0 to 100: The control
group is restricted to government-owned �rms that have been selected for
privatization but have not yet been privatized. The speci�cation in (1) in-
cludes a �rm-speci�c �xed e¤ect, �i; which re�ects di¤erences across �rms
that are constant but unobserved over time, year dummies that would cap-
ture contemporaneous correlation, and a random unobserved component,
"it; that re�ects unobserved shocks a¤ecting the performance of �rms.
To control for other factors that may explain �rm performance we in-
clude �rm size as measured by gross �xed assets, and the Her�ndahl index
at the three-digit industry level. The latter variable will also control for
confounding e¤ects that may arise due to contemporaneous reforms at the
industry level that a¤ect �rm performance. Firm level performance mea-
sures and all variables used in the analysis are described in Appendix Table
1. We note that all the level variables, with the exception of Fraction of
Equity Sold and the Herfindahl Index are in logarithms.
The results from estimating equation (1) are presented in Table 6. We
�nd that the share of privately owned equity has a positive and statistically
15
signi�cant impact on next period sales, return on sales (ratio of pro�t before
taxes and depreciation to sales), net worth to sales, cash pro�ts to sales,
total borrowing, and employment. From the �rst two columns of Table 6
we observe that a 10 percentage point increase in the level of private equity
would increase annual sales by about 3:3%, returns to sales by 3.8%, and
net worth to sales by 17% on average. Firms also experience a signi�cant
increase in access to loans, which suggests that privatized �rms may be
better able to �nance growth opportunities compared to �rms that remain
fully government-owned. Further, these results suggest that selling equity
to private owners does not cause the government to abandon the political
objective of maintaining surplus employment, and average compensation
also does not appear to be a¤ected by privatization. These results are robust
to controlling for average �rm size and industry competitiveness.
Prior research suggests that governments are likely to selectively choose
�rms for privatization based on observable and unobservable characteristics.
For example, Gupta, Ham and Svejnar (2008) show that pro�table �rms are
more likely to be privatized. We take a number of steps to address the poten-
tial endogeneity of privatization to �rm performance. First, we estimate a
�rm �xed e¤ects speci�cation that addresses selection bias that may arise if
more pro�table or larger �rms are selected for privatization. However, �xed
e¤ects will not address dynamic selection bias, which may arise if the gov-
ernment selects �rms for privatization based on unobservable time-varying
characteristics. To address this, we use the approach suggested by Fryd-
man et al. (1999), who argue that �rms that are selected for privatization
are likely to share similar characteristics, so comparing privatized �rms to
16

a control group of �rms that have also been selected for privatization but
have not yet been sold should address this potential selection bias. Since
privatization is distributed over several years in our data, in any given year
we also observe �rms privatized in later years that form the control group.
To minimize the possibility of simultaneity between privatization and
performance, we use the lagged share of private ownership. The speci�ca-
tions also include �rm-speci�c controls such as �rm size and the industry
Her�ndahl index to control for the e¤ect of industry level reforms that may
a¤ect the performance of �rms. Lastly, we include year dummies to control
for contemporaneous macroeconomic shocks.
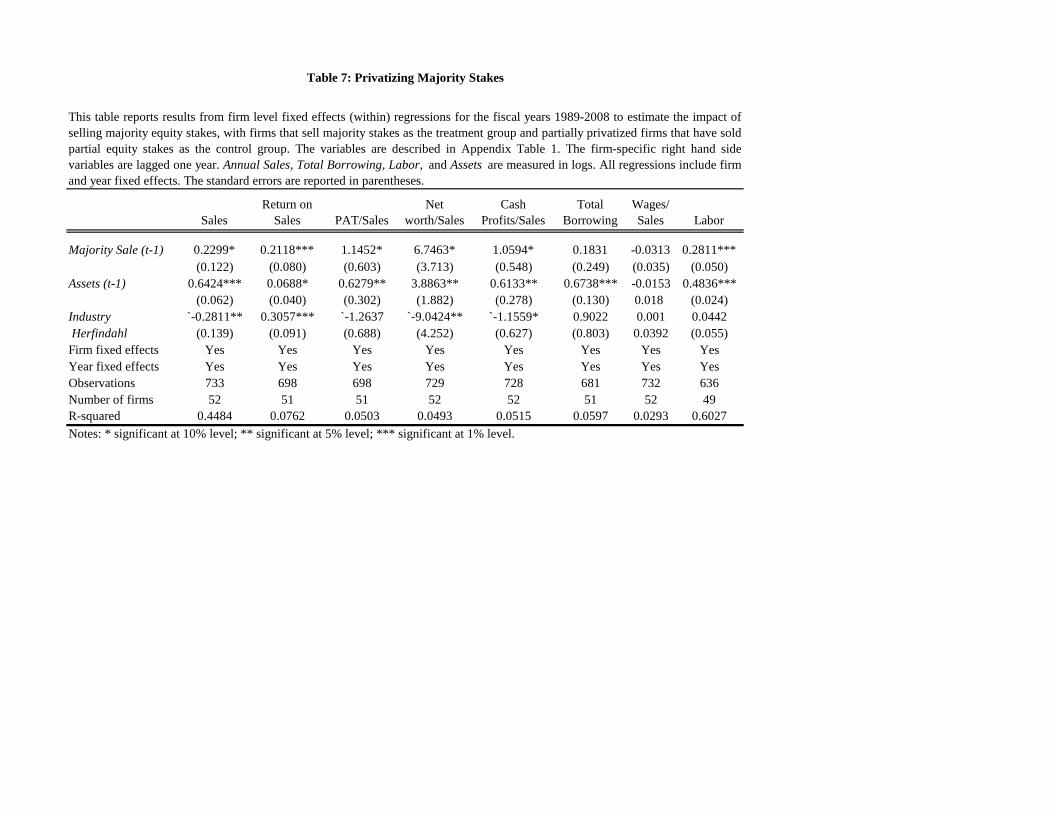
B. E¤ect of Majority Sales
We investigate the marginal e¤ect of selling majority equity stakes with
the transfer of management control to private owners by comparing majority
sale �rms to partially privatized �rms. We estimate the following �rm �xed
e¤ects speci�cation for the years 1989-2008,
yit = �i + �1Majority Saleit�1 + �2Xit�1 + �tY eart + "it; (2)
where Majority Sale is a dummy variable that is equal to one when
a �rm has sold majority equity stakes and transferred management control
to a private owner. The control group is partially privatized �rms that
have sold minority equity stakes and are listed on the stock market. The
remaining variables are as described in equation (1). From the �rst two
columns of Table 7 we note that sales and returns to sales increase by 23%
17

and 21% respectively on average when �rms transfer management control to
private owners. Hence, compared to partially privatized �rms that are pub-
licly traded on the stock market but are still controlled by the government,
the sale of majority equity stakes with the transfer of management con-
trol has an economically signi�cant impact on the sales and pro�tability of
government-owned �rms. Moreoever, this increase in revenues and pro�ts is
not accompanied by a decline in employment or wages. While wages are not
signi�cantly a¤ected by ownership change, employment appears to increase
signi�cantly, perhaps in response to the increase in pro�tability following
privatization.
Despite the small number of majority sales, our results suggest that
transferring control to private owners may result in signi�cant performance
improvements compared to publicly listed �rms that remain under govern-
ment control. A potential explanation is that �rms that have been sold
to private owners are no longer subject to political interference, and man-
agers of these �rms are provided incentives to align their objectives with
that of shareholders. For example, Fan, Wong, and Zhang (2007) show that
partially privatized �rms in China with politically connected CEOs under-
perform those without politically connected CEOs, and are more likely to
appoint bureaucrats rather than quali�ed board members.
C. Evaluating the Long-run Impact of Privatization
So far, we have considered the e¤ect of privatization on �rm performance
in the following year. However, the e¤ects of privatization, due to decisions
made by new owners in the case of majority sales, or due to improved cor-
porate governance and increased investor scrutiny in the case of public o¤er-
18
ings, may not be immediate. Or, it may be the case that some performance
e¤ects are not persistent, such as the observed increase in employment fol-
lowing privatization. To capture the long-run e¤ects of privatization, we
consider three-year averages of �rm performance including the three years
following the year in which the �rm privatizes partial and majority equity
stakes. The results are reported in Table 8. In Panel A of Table 8, we con-
sider the e¤ect of selling partial and majority equity stakes. The results are
similar to those reported in Table 6. We �nd that in the three years following
privatization, �rms that have sold partial and majority equity stakes experi-
ence signi�cant improvements in average sales, pro�tability, net worth, and
total borrowing, relative to �rms that have not yet privatized. The main
di¤erence from the previously reported results is that wages as a fraction of
sales appears to decrease in privatized �rms, suggesting that average wages
do not increase at the same rate as average sales following privatization. We
also �nd that average employment increases signi�cantly in the three years
following privatization.
In Panel B, we examine the impact of majority equity sales, where major-
ity ownership and management control is transferred from the government
to private owners. We note that the results are substantively similar to Ta-
ble 7. Firms that sell majority stakes experience a signi�cant increase in
sales and pro�tability, a decline in averages wages as a share of sales, and an
increase in employment. The statistical signi�cance of the other dependent
variables is slightly lower because of the smaller sample size since we restrict
the sample to �rms with at least three years of performance data following
privatization. Overall, our results suggest that the e¤ects of privatization
19

are persistent rather than short-run.
D. Evaluating the Impact of Varying Ownership Stakes
Our results suggest that �rm performance is positively related to the
fraction of equity sold by government-owned �rms. We also �nd that trans-
ferring management control to private owners has an economically signi�cant
impact on �rm performance. It may however be the case that ownership
has a non-linear impact on �rm performance. For example, performance
improvements may occur only when a su¢ ciently large share of the �rm
is privately-owned. In Table 9 we report the results from estimating �rm
�xed-e¤ects speci�cations that describe the relationship between �rm per-
formance and the privatization of 10%, 25% and 50% or more equity stakes.
The results suggest that compared to �rms that have not yet been privatized,
selling 10% or more equity in a �rm is associated with a signi�cant increase
in sales, net worth, and employment. In comparison, selling majority stakes
or 50% or more equity is associated with both an increase in sales and net
worth, as well as an increase in external borrowings and employment. The
e¤ects also appear to be signi�cant for �rms that have sold 25% or more
equity. In sum, these e¤ects are consistent with our results so far suggesting
that both partial privatization, as well as the sale of majority equity stakes
have a signi�cant impact on the performance of government-owned �rms.
We also estimate but do not report results using a dummy variable for
�rms that have sold 5% or more equity. The results are less statistically
signi�cant. In particular, �rms that have sold 5% or more equity experience
a signi�cant increase in employment relative to �rms that are not yet priva-
tized, but there is no signi�cant association with the pro�tability and other
20

performance measures.
E. Comparing privatized �rms to fully government-owned �rms
As a robustness check we also investigate the impact of privatization on
�rm performance where the control group includes �rms that have never
been privatized and are fully government-owned. The results reported in
Table 10 are similar to what we observe when the control group is restricted
to �rms that are selected for privatization, but less statistically signi�cant.
In particular, compared to �rms that remain 100% government-owned, a
10 percentage point decrease in government-ownership is associated with an
8% increase in sales, 4% increase in total borrowing, and 6% increase in
employment, on average.
5 Conclusion
Privatization in India has encountered numerous roadblocks over the last
two decades. Opponents argue that it will lead to widespread layo¤s and a
redistribution of wealth in favor of the politically connected. It has also been
argued that selling pro�table �rms to raise revenues for general government
expenditures does not make economic sense. However, our results suggest
that selling both partial and majority equity stakes is associated with signif-
icant improvements in the pro�tability and e¢ ciency of government-owned
�rms. These e¤ects are robust to the pre-privatization characteristics of
�rms, suggesting that pro�table �rms also bene�t from privatization. Inter-
estingly, privatized �rms appear to increase employment compared to �rms
that have not yet been privatized, while average compensation is not a¤ected
21
by privatization. Hence, the improvement in pro�tability following privati-
zation is not accompanied by layo¤s or a decline in worker compensation.
We �nd that the sale of majority equity stakes accompanied by the trans-
fer of management control from the government to private owners has an
economically signi�cant impact on performance. This result suggests that
full privatization may have a greater impact on the pro�tability of �rms,
without requiring layo¤s or a decline in worker compensation.
Despite these observed bene�ts, privatization remains a politically con-
tentious issue in India. Our results suggest that fears regarding employ-
ment loss may be exaggerated. Indeed, government-owned �rms that do
not privatize appear to be reducing workforce size on average compared to
privatized �rms. While there is a potential redistribution of wealth from the
government to private investors, this argument ignores the cost of subsidies
to government-owned �rms. However, since the costs of giving up control
will be borne by organized labor and politicians, while the bene�ts, such as
more e¢ cient �rms and lower subsidies, are distributed across the popula-
tion, political economy theory suggests that privatization will continue to
generate opposition from organized interests who bene�t from maintaining
government ownership.
22

References
[1] Ahmed, Sadiq and Ashutosh Varshney, 2008, Battles Half Won: The
Political Economy of India�s Growth and Economic Policy since Inde-
pendence, World Bank Working Paper No. 15.
[2] Bombay Stock Exchange Disinvestments Database,
http://www.bsepsu.com.
[3] Bortolotti, Bernardo and Paolo Pinotti, 2008, Delayed Privatization,
Bank of Italy Working Paper No. 663.
[4] Clarke, George and Robert Cull, 2002, Political and Economic Determi-
nants of the Likelihood of Privatizing Argentine Public Banks, Journal
of Law and Economics 45, 165-197.
[5] Dastidar, Sidhartha, Raymond Fisman, and Tarun Khanna, 2009, Lim-
its to Policy Reversal: Evidence from Indian Privatizations, forthcom-
ing, Journal of Financial Economics.
[6] Department of Disinvestment, 2001, Presentation on Disinvestment.
[7] Department of Disinvestment, 2010, Disinvestment until Now,
http://www.divest.nic.in.
[8] Department of Public Enterprises, 2009-10, Public Enterprise Survey,
Government of India, New Delhi, India.
[9] Dinc, Serdar and Nandini Gupta, 2010, The Decision to Privatize: Fi-
nance and Politics, forthcoming, Journal of Finance.
23

[10] Fan, Joseph P.H., T.J. Wong, and Tianyu Zhang, 2007, Politically
connected CEOs, corporate governance, and Post-IPO performance
of China�s newly partially privatized �rms, Journal of Financial Eco-
nomics, 84, 330-57.
[11] Frydman, Roman, Cheryl Gray, Marek Hessel, and Andrzej Rapaczyn-
ski, 1999, When Does Privatization Work? The Impact of Private Own-
ership on Corporate Performance in Transition Economies, Quarterly
Journal of Economics 114, 1153-91.
[12] Gupta, Nandini, 2005, Partial Privatization and Firm Performance,
Journal of Finance 60, 987-1015.
[13] Gupta, Nandini, John Ham, and Jan Svejnar, 2008, Priorities and Se-
quencing in Privatization: Evidence from Czech Firm Panel Data, The
European Economic Review, 52, 183-208.
[14] Gupta, Nandini, 2008, Privatization in South Asia, in Gerard Roland
(ed.) Privatization:Successes and Failures, Columbia University Press:
New York, NY, pages 170-198.
[15] Jones, Steven, William Megginson, Robert Nash, and Je¤ry Netter,
1999, Share Issue Privatizations as Financial Means to Political and
Economic Ends, Journal of Financial Economics 53, 217-253
[16] La¤ont, Jean-Jacques, and Jean Tirole, 1993, A theory of incentives in
procurement and regulation (MIT Press, Cambridge, MA).
24

[17] Ministry of Finance, 1996, 2008, Economic Survey of India, Govern-
ment of India, New Delhi, India.
[18] Megginson, William and Je¤ry Netter, 2001, From State to Market:
A Survey of Empirical Studies on Privatization, Journal of Economic
Literature 39, 321-389.
[19] Megginson, William, 2005, The Financial Economics of Privatization
(Oxford University Press, New York).
[20] Panagariya, Arvind, 2007, India: An Emerging Giant (Oxford Univer-
sity Press, New York).
[21] Shleifer, Andrei and Robert Vishny, 1994, Politicians and Firms, Quar-
terly Journal of Economics 109, 995-1025.
25

30377.4
19125.1
48431
1684.83796.7 9100
53711.4
15847.218712.6
32682.823479.8
155474.2
27648.7
15696.8
41813.8
233529.6227627.3
0
50000
100000
150000
200000
250000
1991 1992 1993 1994 1995 1996 1997 1998 1999 2000 2001 2002 2003 2004 2005 2006 2007 2008 2009 2010
Privatization Revenues, 1991-2010 (Millions of Rupees)
Source: Department of Disinvestment, Government of India, and Bombay Stock Exchange Disinvestments Database
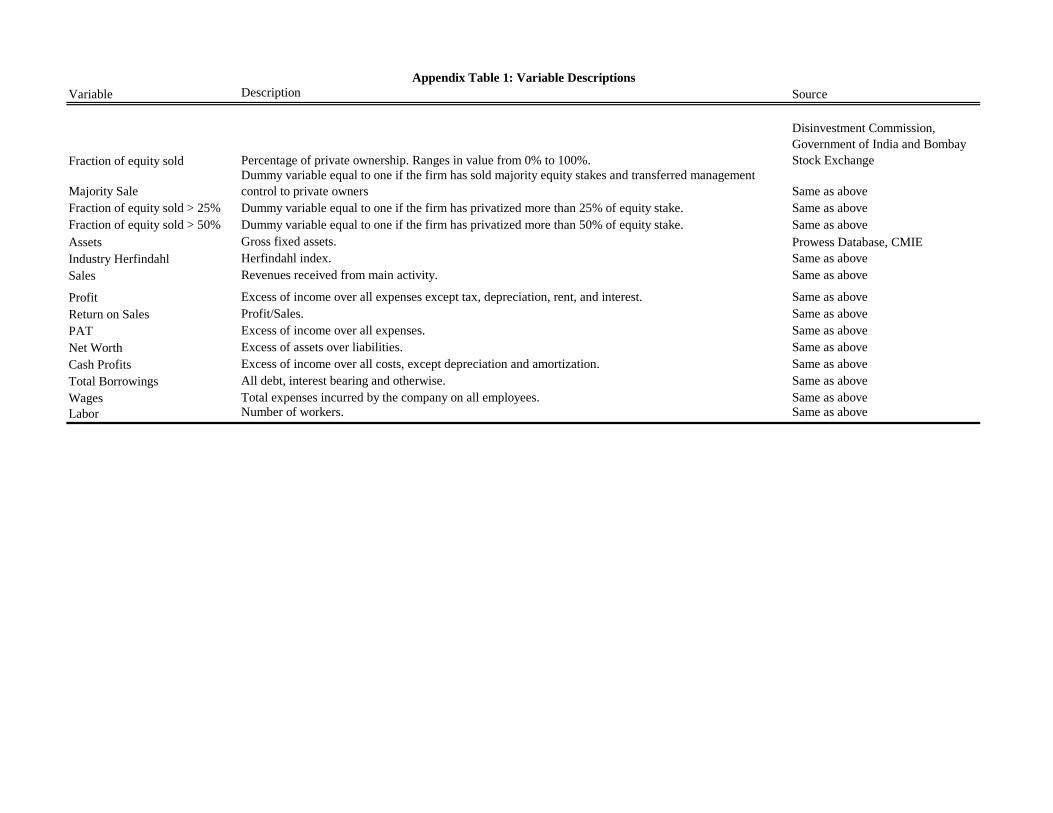
Variable Description Source
Fraction of equity sold Percentage of private ownership. Ranges in value from 0% to 100%.
Disinvestment Commission, Government of India and Bombay Stock Exchange
Majority Sale Dummy variable equal to one if the firm has sold majority equity stakes and transferred management control to private owners Same as above
Fraction of equity sold > 25% Dummy variable equal to one if the firm has privatized more than 25% of equity stake. Same as aboveFraction of equity sold > 50% Dummy variable equal to one if the firm has privatized more than 50% of equity stake. Same as aboveAssets Gross fixed assets. Prowess Database, CMIEIndustry Herfindahl Herfindahl index. Same as aboveSales Revenues received from main activity. Same as above
Profit Excess of income over all expenses except tax, depreciation, rent, and interest. Same as aboveReturn on Sales Profit/Sales. Same as abovePAT Excess of income over all expenses. Same as aboveNet Worth Excess of assets over liabilities. Same as aboveCash Profits Excess of income over all costs, except depreciation and amortization. Same as aboveTotal Borrowings All debt, interest bearing and otherwise. Same as aboveWages Total expenses incurred by the company on all employees. Same as aboveLabor Number of workers. Same as above
Appendix Table 1: Variable Descriptions

YearNumber of Privatization
TransactionsPrivatization Revenues (Millions of
Indian Rupees)*1991 47 30377.41992 35 19125.119931994 13 484311995 5 1684.81996 1 3796.71997 1 91001998 5 53711.41999 4 15847.22000 4 18712.62001 9 32682.82002 6 23479.82003 10 155474.22004 3 27648.72005 1 15696.82006 02007 3 41813.82008 02009 5 233529.62010 6 227627.3
Table 1: Privatization by year
Source: Disinvestment Commission of India, Government of India, Disinvestment until Now

Company Name Year of Sale Name of Buyer % Stake Sold% Government
Equity
BHARAT ALUMINIUM CO.LTD. 2000-01 STERLITE INDUSTRIES (INDIA) LTD. 51 49
CMC LTD. 2001-02 TATA CONSULTANCY SERVICES LTD. 51 32.31
HINDUSTAN TELEPRINTERS LTD. 2001-02 HIMACHAL FUTURISTIC COMMUNICATION LTD. 74 26
HINDUSTAN ZINC LTD. 2002-03 STERLITE OPPORTUNITIES & VENTURES LTD. 22.07 49.93
HOTEL CORP.OF INDIA LTD.* 2002-03 BATRA HOSPITALITY PVT.LTD. 100 0,, 2001-02 INPAC TRAVELS (INDIA) PVT.LTD. 100 0,, 2001-02 TULIP HOSPITALITY PVT.LTD. 100 0
ICI INDIA LTD. 2003-04 ASIAN PAINTS (INDIA) LTD. 9.2 0
INDIA TOURISM DEVELOPMENT CORP.LTD.* 2002-03 BRIGHT ENTERPRISES PVT.LTD.& CONSORTIUM 89.97 0,, 2002-03 M FAR HOTELS LTD. 89.97 0,, 2002-03 LOKSANGAM HOTELS & RESORTS PVT.LTD.& CONSORTIUM 89.97 0,, 2002-03 AUTO IMPEX LTD. 89.97 0,, 2002-03 BHARAT HOTELS LTD. 89.97 0,, 2002-03 CONSORTIUM OF RAMNATH HOTELS PVT.LTD. 89.97 0,, 2002-03
COMMERCIAL PVT.LTD. 89.97 0
,, 2002-03 NEHRU PLACE HOTELS LTD. 89.97 0,, 2002-03 MORAL TRADING & INVESTMENT LTD. 89.97 0,, 2002-03 TAJGVK HOTELS & RESORTS LTD. 100 0,, 2001-02 MALNAD HOTELS& RESORTS PVT.LTD. 89.97 0,, 2001-02 LOTUS NIKKO HOTELS 89.97 0,, 2001-02 SANGU CHAKRA HOTELS PVT.LTD. 89.97 0,, 2001-02 G.R.THANGA MALIGAI PVT.LTD. 89.97 0,, 2001-02 MOHAN SINGH 89.97 0,, 2001-02 BHARAT HOTELS LTD. 89.97 0,, 2001-02 CONSORTIUM OF SUSHIL GUPTA & OTHERS 89.97 0,, 2001-02 SILVERLINK HOLDINGS LTD.& CONSORTIUM 89.97 0
INDIAN PETROCHEMICALS CORP.LTD. 2002-03 RELIANCE PETRO INVESTMENTS LTD. 26 33.95
JESSOP & CO.LTD. 2003-04 INDO WAGON ENGINEERING LTD. 72 27
KOCHI REFINERIES LTD. 2000-01 BHARAT PETROLEUM CORP.LTD. 55.04 0
LAGAN JUTE MACHINERY CO.LTD.,THE 2000-01 MURALIDHAR RATANLAL EXPORTS LTD. 74 26
MADRAS REFINERIES LTD. 2000-01 INDIAN OIL CORP.LTD. 51.81 0
MARUTI UDYOG LTD. 2003-04 27.51 18.28
MODERN FOOD INDUSTRIES (INDIA) LTD. 1999-00 HINDUSTAN LEVER LTD. 74 26
PARADEEP PHOSPHATES LTD. 2001-02 ZUARI MAROC PHOSPHATES PVT.LTD. 74 26VIDESH SANCHAR NIGAM LTD. 2001-02 PANATONE FINVEST LTD.(A TATA GROUP CO.) 25 26.12
Source: Bombay Stock Exchange Disinvestments Database
Table 2: Majority Sales to Private Owners
Notes: * Sale of hotels owned by these companies

Fully Government-Owned Partially Privatized Majority Sale Sales 708.678 2845.367 960.530
(2964.530) (5027.113) (1534.319)Observations 3434 184 120Assets 967.9225 5119.361 388.5783
5922.774 9644.651 475.17713463 184 119
Profits 188.423 999.779 77.822(1018.703) (1635.273) (107.370)
Observations 2447 143 107Return on Sales -0.106 3.629 0.092
(36.698) (23.446) (0.301)Observations 2303 139 107Net worth/Sales -98.823 6.200 -0.009
(2240.821) (43.549) (1.734)Observations 3050 179 119Total Borrowings 552.453 3226.547 191.838
(2022.717) (5094.346) (229.280)Observations 3463 184 119Wages/Sales 1.549 0.098 0.158
(16.561) (0.108) (0.184)Observations 3296 180 120Labor 6933.244 14664.720 4348.369
(20951.080) (27568.400) (5476.173)Observations 3325 187 111
Table 3: Describing Government-Owned Firms
This table reports the mean and standard deviation for the variables defined in Appendix Table 1 forthe fiscal years 1989-2008. Fully Government-Owned are firms that have not privatized any equity;Partially Privatized are firms that have sold partial equity stakes without transferring managementcontrol; Majority Sale are firms that have sold majority equity stakes and transferred managementcontrol. The average values of the variables for the partially and majority privatized firms arecalculated for the years prior to privatization.
Average Before Partial Privatization
Average After Partial Privatization % Change p-values
Sales 2845.367 10805.99 279.775 0.000 ***(5027.113) (29806.370)
184 584Assets 5119.361 6811.988 33.063 0.075 *
9644.651 (14937.440)184 582
Profits 999.7792 1468.172 46.850 0.069 *(1635.273) (3683.147)
143 555Net Worth 2959.167 3880.826 31.146 0.099 *
5800.712 (9135.844)184 582
Cash Profits 603.285 1024.316 69.790 0.036 **1199.385 (2965.332)
170 581Total Borrowing 3226.547 2247.512 -30.343 0.017 **
(5094.346) (5592.648)184 582
Wages/Sales 0.09835 0.13655 38.835 0.005 ***(0.108) (0.191)
180 582Labor 14664.72 15973.35 8.924 0.296
(27568.400) (29615.930)187 584
Table 4: Comparing Partially Privatized Firms Before and After Privatization
This table describes the characteristics of government-owned firms before and after partialprivatization for the fiscal years 1989-2008. The variables are described in Appendix Table 1.Partially privatized firms are firms that have sold minority equity stakes without transferringmanagement control.
Average before majority Sales
Average after majority sales % Change p-values
Sales 1990.199 3527.601 77.249 0.001 ***(3007.656) (4910.548)
188 89Assets 1069.983 1890.675 76.701 0.001 ***
1739.087 (2682.178)187 88
Profits 275.3154 640.045 132.477 0.000 ***(474.550) (1203.438)
174 84Net Worth 702.833 1656.713 135.719 0.000 ***
1255.697 (2863.319)187 87
Cash Profits 166.059 451.923 172.146 0.000 ***317.7558 (848.587)
184 87Total Borrowing 372.256 450.7316 21.081 0.214
(795.576) (678.146)187 87
Wages/Sales 0.1314 0.1466 11.621 0.293(0.160) (0.304)
188 87Labor 4712.59 2369.126 -49.728 0.000 ***
(5178.654) (3010.993)178 87
Table 5: Comparing Majority Sale Firms Before and After Privatization
This table describes the characteristics of government-owned firms before and after the sale of majoritystakes for the fiscal years 1989-2008. The variables are described in Appendix Table 1. Majority Salefirms have sold majority equity stakes and have transferred management control to private owners.

Sales
rReturn on
Sales PAT/SalesNet
worth/SalesCash
Profits/SalesTotal
BorrowingWages/Sales Labor
Fraction of equity .0033*** .0387* 0.0144* 0.1775*** 0.0126* 0.009*** -0.0003 0.0058*** sold (t-1) (0.001) (0.021) (0.008) (0.055) (0.007) (0.003) (0.000) (0.001)Assets (t-1) .4845*** 7 `-1.6549*** 0.2906 -2.1831 0.2965 0.5439*** -0.0202** .2831***
(0.037) (0.549) (0.211) (1.395) (0.194) (0.070) 0.009 (0.018)Industry -0.0897 ̀ -5.0757*** -0.2852 -16.2715 -0.16944 0.9391 -0.0046 `-0.2842*** Herfindahl (t-1) (0.119) (1.739) (0.666) (4.483) (0.601) (0.674) 0.0283 (0.059)Firm fixed effects Yes Yes Yes Yes Yes Yes Yes YesYear fixed effects Yes Yes Yes Yes Yes Yes Yes YesObservations 982 907 907 976 958 919 981 857Number of firms 52 51 51 52 52 51 52 52R-squared 0.5367 0.0394 0.0289 0.0472 0.0283 0.1026 0.0313 0.4384Notes: * significant at 10% level; ** significant at 5% level; *** significant at 1% level.
This table reports results from firm level fixed effects (within) regressions for the fiscal years 1989-2008 to estimate the impact ofprivate ownership with privatized firms as the treatment group and firms that are selected for privatization and sell equity in lateryears as the control group. The variables are described in Appendix Table 1. The firm-specific right hand side variables are laggedone year. Annual Sales, Total Borrowing, Labor, and Assets are measured in logs. All regressions include firm and year fixedeffects. The standard errors are reported in parentheses.
Table 6: Privatization and Firm Performance
SalesReturn on
Sales PAT/SalesNet
worth/SalesCash
Profits/SalesTotal
BorrowingWages/Sales Labor
Majority Sale (t-1) 0.2299* 0.2118*** 1.1452* 6.7463* 1.0594* 0.1831 -0.0313 0.2811***(0.122) (0.080) (0.603) (3.713) (0.548) (0.249) (0.035) (0.050)
Assets (t-1) 0.6424*** 0.0688* 0.6279** 3.8863** 0.6133** 0.6738*** -0.0153 0.4836***(0.062) (0.040) (0.302) (1.882) (0.278) (0.130) 0.018 (0.024)
Industry `-0.2811** 0.3057*** `-1.2637 `-9.0424** `-1.1559* 0.9022 0.001 0.0442 Herfindahl (0.139) (0.091) (0.688) (4.252) (0.627) (0.803) 0.0392 (0.055)Firm fixed effects Yes Yes Yes Yes Yes Yes Yes YesYear fixed effects Yes Yes Yes Yes Yes Yes Yes YesObservations 733 698 698 729 728 681 732 636Number of firms 52 51 51 52 52 51 52 49R-squared 0.4484 0.0762 0.0503 0.0493 0.0515 0.0597 0.0293 0.6027Notes: * significant at 10% level; ** significant at 5% level; *** significant at 1% level.
Table 7: Privatizing Majority Stakes
This table reports results from firm level fixed effects (within) regressions for the fiscal years 1989-2008 to estimate the impact ofselling majority equity stakes, with firms that sell majority stakes as the treatment group and partially privatized firms that have soldpartial equity stakes as the control group. The variables are described in Appendix Table 1. The firm-specific right hand sidevariables are lagged one year. Annual Sales, Total Borrowing, Labor, and Assets are measured in logs. All regressions include firmand year fixed effects. The standard errors are reported in parentheses.

SalesReturn on
Sales PAT/SalesNet
worth/SalesCash
Profits/SalesTotal
Borrowing Wages/Sales LaborFraction of equity 0.005** 0.002* 0.018*** 0.115*** 0.015*** 0.006*** `-0.001*** 0.005*** sold (t-1) (0.001) (0.001) (0.007) (0.046) (0.006) (0.003) (0.000) (0.001)Assets (t-1) 0.321*** 0.005 0.099 -1.036 0.099 0.281*** -0.002 0.334***
(0.029) (0.021) (0.163) (1.102) (0.145) (0.062) 0.005 (0.020)Industry `-0.555** 0.603*** -0.408 -14.557 -0.617 `-1.143* `-0.151*** `-0.673*** Herfindahl (t-1) (0.282) (0.208) (1.632) (10.760) (1.432) (0.664) (0.046) (0.161)Firm fixed effects Yes Yes Yes Yes Yes Yes Yes YesYear fixed effects Yes Yes Yes Yes Yes Yes Yes YesObservations 875 753 753 863 830 796 872 674Number of firms 52 51 51 52 52 52 52 52R-squared 0.6108 0.0424 0.0342 0.0353 0.0353 0.0666 0.1005 0.5302
SalesReturn on
Sales PAT/SalesNet
worth/SalesCash
Profits/SalesTotal
Borrowing Wages/Sales LaborFraction of equity 0.241*** 0.199*** 0.923 5.201 0.831 0.132 `-0.033* 0.346*** sold (t-1) (0.095) (0.050) (0.685) (3.966) (0.577) (0.219) (0.018) (0.058)Assets (t-1) 0.499*** 0.007 0.434 2.624 0.407 0.347*** 0.013 0.429***
(0.049) (0.024) (0.333) (2.034) (0.296) (0.115) (0.009) (0.027)Industry -0.402 0.620*** -0.539 -8.5731 -0.73 -1.063 `-0.176*** -0.195 Herfindahl (t-1) (0.299) (0.150) (2.073) (12.442) (1.811) (0.795) (0.056) (0.160)Firm fixed effects Yes Yes Yes Yes Yes Yes Yes YesYear fixed effects Yes Yes Yes Yes Yes Yes Yes YesObservations 679 603 603 674 666 619 678 522Number of firms 50 49 49 50 50 49 50 47R-squared 0.5601 0.1169 0.0362 0.036 0.0377 0.0368 0.1111 0.6137Notes: * significant at 10% level; ** significant at 5% level; *** significant at 1% level.
Table 8: Long-run impact of privatization
This table reports results from firm level fixed effects (within) regressions for the fiscal years 1989-2008 to estimate the impact of privateownership with privatized firms as the treatment group and firms that are selected for privatization and sell equity in later years as thecontrol group. The dependent variables are measured as 3-year moving averages over the three years following the year of privatization, ort, t+1, and t+2, where t is the year in which the firm privatizes. The variables are described in Appendix Table 1. The firm-specific righthand side variables are lagged one year. Annual Sales, Total Borrowing, Labor, and Assets are measured in logs. All regressions includefirm and year fixed effects. The standard errors are reported in parentheses.
Panel A: Partial and majority privatization
Panel B: Majority privatization

Fraction of equity sold 0.1897** 0.9563 5.9761** >= 10% (t-1) (0.079) (1.155) (2.959)Fraction of equity sold 0.1461* 1.9633* 8.2309*** > 25% (t-1) (0.076) (1.083) (2.854)Fraction of equity sold .1690* 1.4427 7.5920** > 50% (t-1) (0.095) (1.356) (3.578)
Assets (t-1) 0.4759*** 0.4728*** 0.4780*** `-1.4666*** `-1.5662*** `-1.4933*** -1.6781 -2.0675 -1.6935(0.037) (0.038) (0.037) (0.553) (0.556) (0.554) (1.418) (1.426) (1.417)
Industry -0.3912 -0.4673 `-0.5269 -6.1603 `-6.9287 -7.3177 `-22.6779* `-26.415** `-28.4471** Herfindahl (0.329) (0.331) (0.336) (4.908) (4.899) (4.970) (12.470) (12.463) (12.649)Firm fixed effects Yes Yes Yes Yes Yes Yes Yes Yes YesYear fixed effects Yes Yes Yes Yes Yes Yes Yes Yes YesObservations 982 982 982 907 907 907 976 976 976Number of firms 52 52 52 51 51 51 52 52 52R-squared 0.5379 0.5368 0.5366 0.0308 0.0339 0.0314 0.0355 0.04 0.0359
Fraction of equity sold 0.0435 0.1658*** >= 10% (t-1) (0.147) (0.041)Fraction of equity sold 0.0441 0.2503*** > 25% (t-1) (0.143) (0.039)
Fraction of equity sold 0.7729*** 0.2031*** > 50% (t-1) (0.175) (0.526)Assets (t-1) 0.5460*** 0.5441*** 0.5225*** 0.2857*** 0.2719*** 0.2835***
(0.071) (0.072) (0.071) (0.018) (0.018) (0.018)
Industry 1.2857** 1.2534* 0.6946 `0.7335*** `-0.8557*** `-0.8995*** Herfindahl (0.658) (0.661) (0.663) (0.162) (0.160) (0.165)Firm fixed effects Yes Yes Yes Yes Yes YesYear fixed effects Yes Yes Yes Yes Yes YesObservations 920 920 920 857 857 857Number of firms 52 52 52 52 52 52R-squared 0.0869 0.0869 0.1075 0.4215 0.4394 0.4204Notes: * significant at 10% level; ** significant at 5% level; *** significant at 1% level.
Total Borrowing Labor
Table 9: Evaluating the Impact of Varying Ownership Stakes
Table 9 continued
This table reports results from firm level fixed effects (within) regressions for the fiscal years 1989-2008 to estimate the impact of private ownershipwith privatized firms as the treatment group and firms that are selected for privatization and sell equity in later years as the control group. Thevariables are described in Appendix Table 1. The firm-specific right hand side variables are lagged one year. Annual Sales, Total Borrowing,Labor , and Assets are measured in logs. All regressions include firm and year fixed effects. The standard errors are reported in parentheses.
Net worth/SalesReturn on SalesSales

SalesReturn on
SalesNet
worth/SalesTotal
Borrowing Wages/Sales Labor
Fraction of equity 0.0075*** 0.0386 2.5175 0.0044** -0.0109 0.0055*** sold (t-1) (0.002) (0.062) (3.742) (0.002) (0.026) (0.001)Assets (t-1) 0.4811*** `-2.2011*** 125.9256*** 0.2972*** -0.2328 0.2638***
(0.019) (0.820) (46.561) (0.023) (0.320) (0.013)Industry `-0.6499*** `-9.8313*** 17.8529* 0.4240* 1.3355 `-0.1953*** Herfindahl (0.072) (3.235) (182.438) (0.235) (1.199) (0.050)Firm fixed effects Yes Yes Yes Yes Yes YesYear fixed effects Yes Yes Yes Yes Yes YesObservations 3937 3039 3706 3688 3935 3180Number of firms 276 247 275 270 276 253R-squared 0.3304 0.018 0.009 0.0744 0.007 0.2312Notes: * significant at 10% level; ** significant at 5% level; *** significant at 1% level.
Table 10: Comparing Privatized Firms to Fully Government-Owned Firms
This table reports results from firm level fixed effects (within) regressions for the fiscal years 1989-2008 toestimate the impact of private ownership with privatized firms as the treatment group and firms that remain fullygovernment-owned as well as firms that sell equity in later years as the control group. The variables are describedin Appendix Table 1. The firm-specific right hand side variables are lagged one year. Annual Sales, TotalBorrowings, Labor, and Assets are measured in logs. All regressions include firm and year fixed effects. Thestandard errors are reported in parentheses.