Embed Size (px)
Citation preview
Semantic Interoperability for Operational Planning for the Electric
Power Distribution System
A. ESPINOSA-REZA1, H.R. AGUILAR-VALENZUELA
2, M. MOLINA-MARIN
1, M.L.
TORRES-ESPINDOLA1, T.M. CALLEROS-TORRES
1, E. GRANADOS-GOMEZ
1, R.
GARCIA-MENDOZA1, C.F. VILLATORO-HERNANDEZ
1
1 Instituto de Investigaciones Electricas, Reforma 113, Col. Palmira, Cuernavaca, Morelos
2 Comision Federal de Electricidad, Lago Iseo 236, Col. Anahuac, Mexico, D.F.
MEXICO
[email protected] and [email protected]
Abstract: - This paper shows the Semantic Interoperability architecture based on the Common Information
Model (CIM), IEC 61968, IEC 61970 and related standards for integrate a series of software tools focused on
decision support for the operational planning for the Electric Power Distribution System, adopted standards and
implemented software tools are discussed. The document shows some results and benefits towards implement
enterprise architecture for Smart Grid in Mexico.
Key-Words: - Semantic Interoperability, Common Information Model (CIM), Smart Grid, Electric Power
Distribution System (EPDS).
1 Introduction Many references describe the Common Information
Model (CIM), for example, “The Common
Information Model (CIM) is an open standard for
representing power system components.” [3], as
well as “CIM is an Information Model that applies
the Object-Oriented paradigm of Software
Engineering in order to represent the elements of the
real world that are used for the infrastructure,
management and operation of the electric systems of
Transmission and Distribution, such as cables, lines,
transformers, switches, protections, structures,
poles, measurements, among others.” [1].
The CIM is a generic, open and standard Model
defined in a group of standards of the IEC, being the
most important: IEC 61970-301, IEC 61968-11 and
IEC 62325-301 [3], [1].
Many works related to CIM have been
performed for many years, proof of concepts,
prototypes, demonstrations, interoperability tests,
systems integrations, standardization, extensions to
integrate new utility fields, software tools for
supporting the adoption process, and successful
deployments. Currently, there are some documented
case studies related to the present CIM
implementation in utilities. The DTE Case Study
report [2] introduce that in DTE Energy “Any single
integration that used to take 3-4 weeks now can
often be done in 3-4 days”, also adds that “There is
an upfront cost to implementing the CIM message
for the first time and determining what part fits for
that use case but the total cost of ownership is less
because that initial effort is not repeated for every
new interface or change”.
Many documents show, in different levels, the
CIM philosophy, and its adoption process [1], [3],
[6], and the direct relation to the Enterprise
Architecture is evident [5], [8], and its impact to
Smart Grid strategies [4], [12].
In this sense, an implementation of a CIM-Based
Semantic Interoperability Strategy in a utility must
fulfill many requirements, including: international
standardization for information modeling; efficient,
secure and standard data interfaces for information
exchange; a long term plan to integrate an
Enterprise Architecture in order to align systems,
business process and strategy objectives, among
others.
2 Problem Formulation The Valley of Mexico – Centre (DVMC by its
Spanish acronym) at Comision Federal de
Electricidad (CFE) is in charge of electric power
supply to at least 2 millions of customers in Mexico
City and metropolitan area of The State of Mexico,
the most important and populated city in Mexico.
2.1 Operational Planning The Electric Power Distribution System (EPDS) is
dynamic, is changing continuously; the technical
WSEAS TRANSACTIONS on POWER SYSTEMS
A. Espinosa-Reza, H. R. Aguilar-Valenzuela, M. Molina-Marin, M. L. Torres-Espindola, T. M. Calleros-Torres, E. Granados-Gomez,
R. Garcia-Mendoza, C. F. Villatoro-Hernandez
E-ISSN: 2224-350X 289 Volume 11, 2016
and business process for operational planning for
the EPDS is very complex and commonly includes:
Distribution Control Centers (with Human
Operators 24x7).
Measurement and communications systems.
Devices for control, protection and automation.
Software tools running almost 24x7:
o SCADA: Supervisory Control and Data
Acquisition.
o ADA: Advanced Distribution Automation.
o FDIR: Failure Detection, Isolation and
Reestablishment.
o VVC: Volt and VAR Control.
o IAP: Intelligent Alarm Processing.
o DMS: Distribution Management System.
o DOMA: Distribution Operation Modeling and
Analysis.
o CA: Contingency Analysis.
o OMS: Outage Management System.
o TCS: Trouble Call System.
o CIS: Customer Relationship System.
o WFMS: Work Force Management System.
o GIS: Geographical Information System
(including electrical information).
o DSM: Demand Side Management.
o AMI: Advanced Metering Infrastructure.
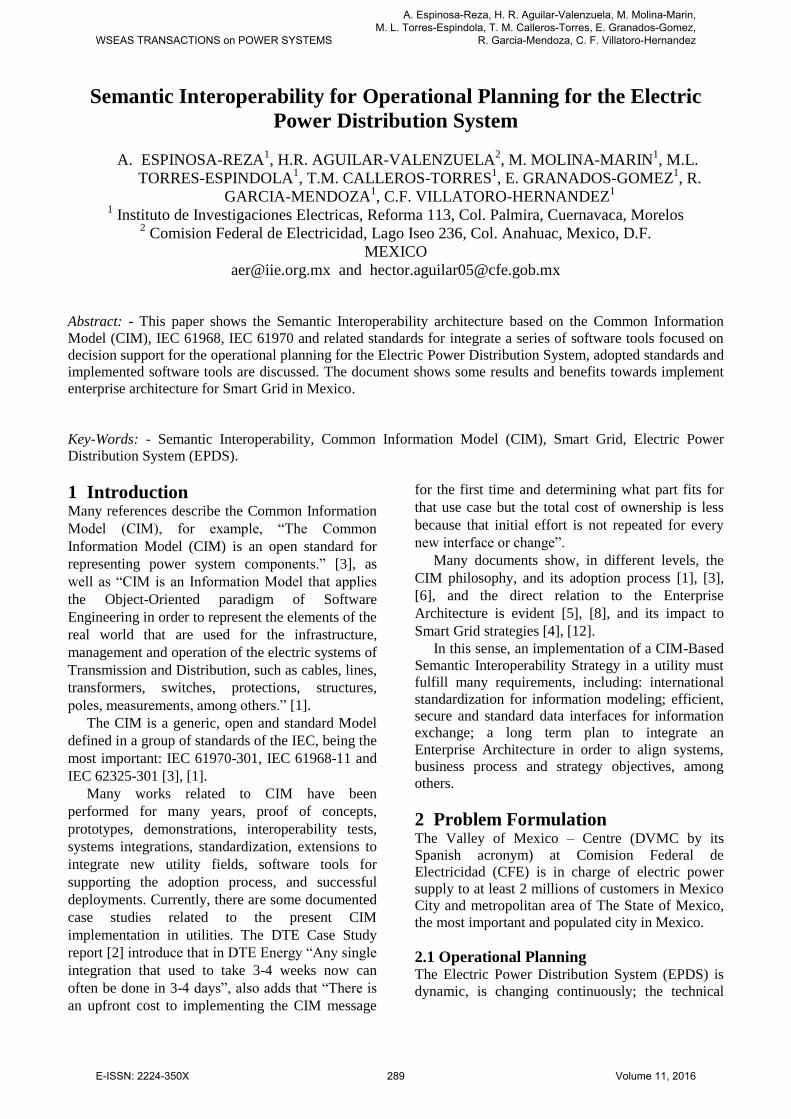
Fig. 1. Typical view of a Distribution Control
Center.
Fig. 2. Software tools for 24x7 monitoring the
EPDS.
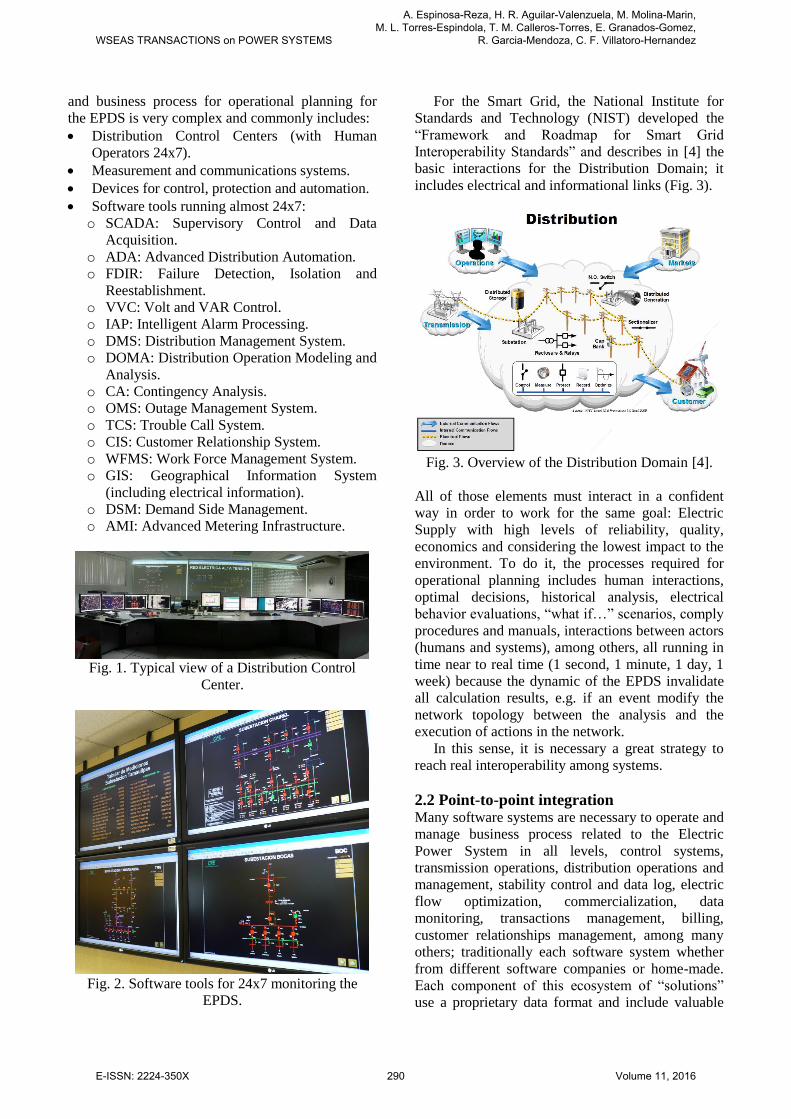
For the Smart Grid, the National Institute for
Standards and Technology (NIST) developed the
“Framework and Roadmap for Smart Grid
Interoperability Standards” and describes in [4] the
basic interactions for the Distribution Domain; it
includes electrical and informational links (Fig. 3).
Fig. 3. Overview of the Distribution Domain [4].
All of those elements must interact in a confident
way in order to work for the same goal: Electric
Supply with high levels of reliability, quality,
economics and considering the lowest impact to the
environment. To do it, the processes required for
operational planning includes human interactions,
optimal decisions, historical analysis, electrical
behavior evaluations, “what if…” scenarios, comply
procedures and manuals, interactions between actors
(humans and systems), among others, all running in
time near to real time (1 second, 1 minute, 1 day, 1
week) because the dynamic of the EPDS invalidate
all calculation results, e.g. if an event modify the
network topology between the analysis and the
execution of actions in the network.
In this sense, it is necessary a great strategy to
reach real interoperability among systems.
2.2 Point-to-point integration Many software systems are necessary to operate and
manage business process related to the Electric
Power System in all levels, control systems,
transmission operations, distribution operations and
management, stability control and data log, electric
flow optimization, commercialization, data
monitoring, transactions management, billing,
customer relationships management, among many
others; traditionally each software system whether
from different software companies or home-made.
Each component of this ecosystem of “solutions”
use a proprietary data format and include valuable
WSEAS TRANSACTIONS on POWER SYSTEMS
A. Espinosa-Reza, H. R. Aguilar-Valenzuela, M. Molina-Marin, M. L. Torres-Espindola, T. M. Calleros-Torres, E. Granados-Gomez,
R. Garcia-Mendoza, C. F. Villatoro-Hernandez
E-ISSN: 2224-350X 290 Volume 11, 2016
information for other system or business process in
the value-chain of energy supply, for example, daily
demand profile is necessary to dispatch the energy
market in a deregulated power industry.
Exchanging data between legacy software
systems is always problematic and traditionally a
point-to-point strategy is applied.
Fig. 4. Traditional point-to-point integration
strategy.
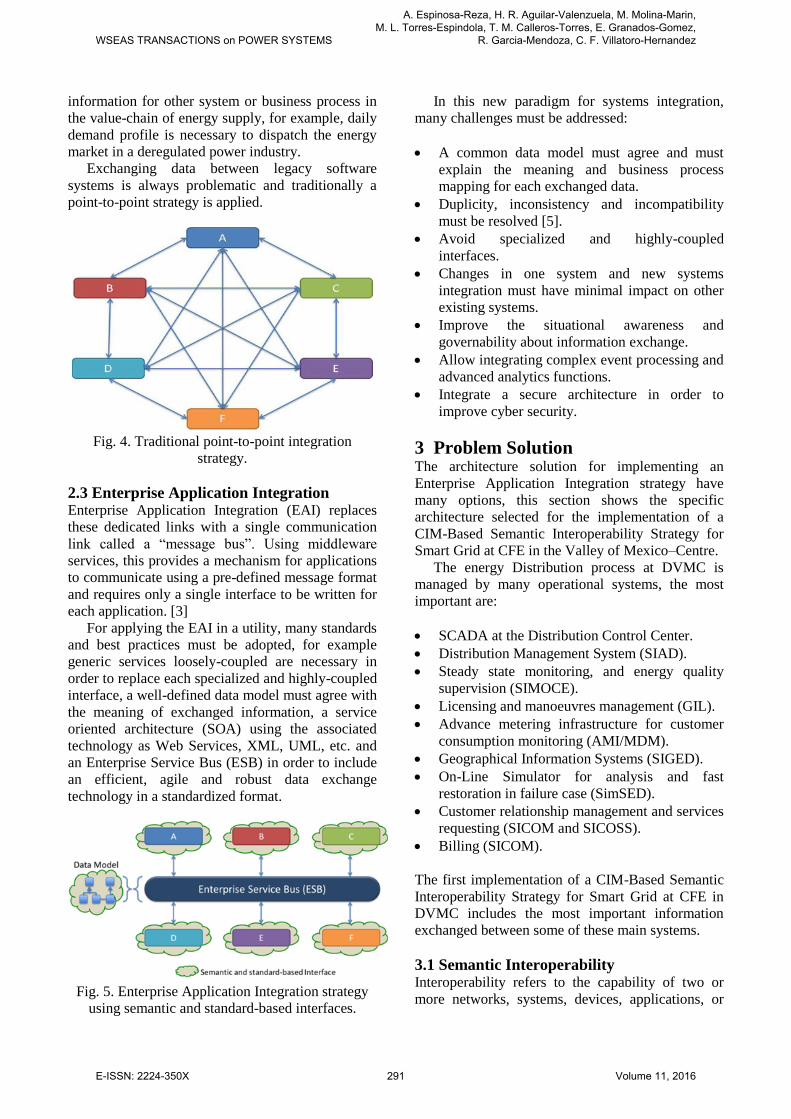
2.3 Enterprise Application Integration Enterprise Application Integration (EAI) replaces
these dedicated links with a single communication
link called a “message bus”. Using middleware
services, this provides a mechanism for applications
to communicate using a pre-defined message format
and requires only a single interface to be written for
each application. [3]
For applying the EAI in a utility, many standards
and best practices must be adopted, for example
generic services loosely-coupled are necessary in
order to replace each specialized and highly-coupled
interface, a well-defined data model must agree with
the meaning of exchanged information, a service
oriented architecture (SOA) using the associated
technology as Web Services, XML, UML, etc. and
an Enterprise Service Bus (ESB) in order to include
an efficient, agile and robust data exchange
technology in a standardized format.
Fig. 5. Enterprise Application Integration strategy
using semantic and standard-based interfaces.
In this new paradigm for systems integration,
many challenges must be addressed:
A common data model must agree and must
explain the meaning and business process
mapping for each exchanged data.
Duplicity, inconsistency and incompatibility
must be resolved [5].
Avoid specialized and highly-coupled
interfaces.
Changes in one system and new systems
integration must have minimal impact on other
existing systems.
Improve the situational awareness and
governability about information exchange.
Allow integrating complex event processing and
advanced analytics functions.
Integrate a secure architecture in order to
improve cyber security.
3 Problem Solution The architecture solution for implementing an
Enterprise Application Integration strategy have
many options, this section shows the specific
architecture selected for the implementation of a
CIM-Based Semantic Interoperability Strategy for
Smart Grid at CFE in the Valley of Mexico–Centre.
The energy Distribution process at DVMC is
managed by many operational systems, the most
important are:
SCADA at the Distribution Control Center.
Distribution Management System (SIAD).
Steady state monitoring, and energy quality
supervision (SIMOCE).
Licensing and manoeuvres management (GIL).
Advance metering infrastructure for customer
consumption monitoring (AMI/MDM).
Geographical Information Systems (SIGED).
On-Line Simulator for analysis and fast
restoration in failure case (SimSED).
Customer relationship management and services
requesting (SICOM and SICOSS).
Billing (SICOM).
The first implementation of a CIM-Based Semantic
Interoperability Strategy for Smart Grid at CFE in
DVMC includes the most important information
exchanged between some of these main systems.
3.1 Semantic Interoperability Interoperability refers to the capability of two or
more networks, systems, devices, applications, or
WSEAS TRANSACTIONS on POWER SYSTEMS
A. Espinosa-Reza, H. R. Aguilar-Valenzuela, M. Molina-Marin, M. L. Torres-Espindola, T. M. Calleros-Torres, E. Granados-Gomez,
R. Garcia-Mendoza, C. F. Villatoro-Hernandez
E-ISSN: 2224-350X 291 Volume 11, 2016
components to exchange and readily use
information securely, effectively, and with little or
no inconvenience to the user. [4].
For this paper, Semantic Interoperability refers to
second category in the framework defined by the
GridWise [8]. The semantic category focuses into
what information is exchanged and its meaning. It
establishes the understanding of the contained
concepts in the data structures of exchanged
messages, and integrates knowledge of the business
related to the semantics or meaning in the work flow
of a process. [1].
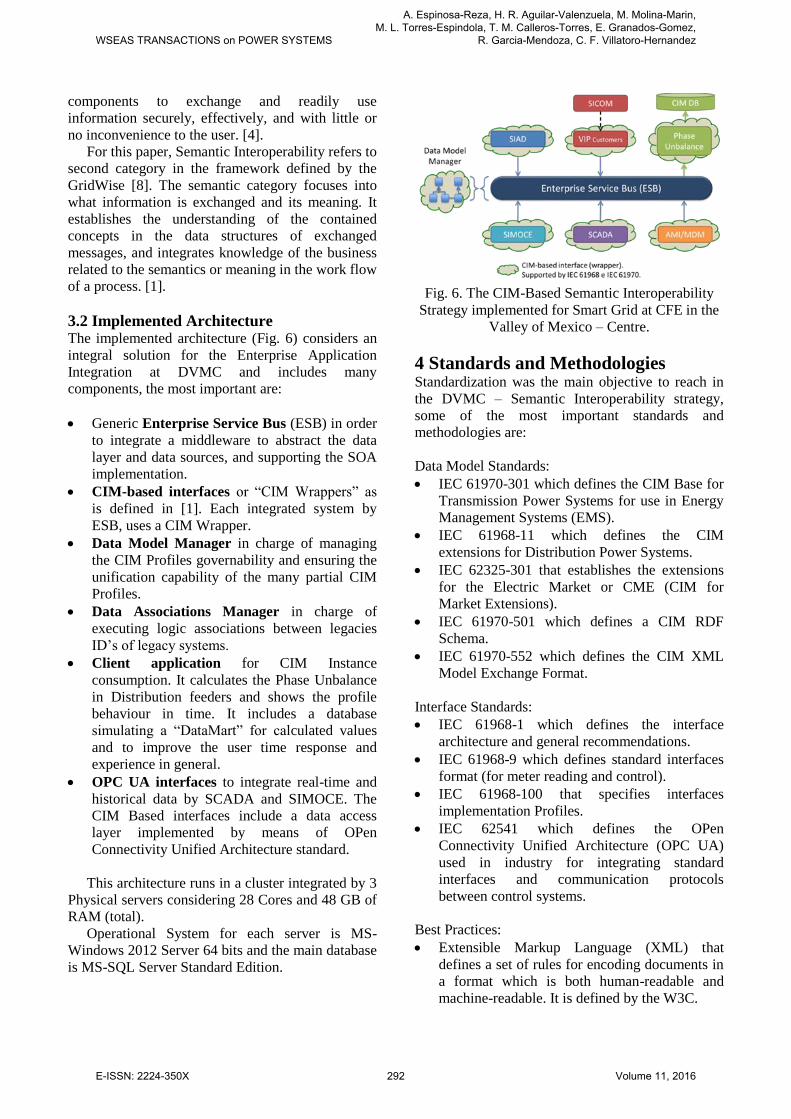
3.2 Implemented Architecture The implemented architecture (Fig. 6) considers an
integral solution for the Enterprise Application
Integration at DVMC and includes many
components, the most important are:
Generic Enterprise Service Bus (ESB) in order
to integrate a middleware to abstract the data
layer and data sources, and supporting the SOA
implementation.
CIM-based interfaces or “CIM Wrappers” as
is defined in [1]. Each integrated system by
ESB, uses a CIM Wrapper.
Data Model Manager in charge of managing
the CIM Profiles governability and ensuring the
unification capability of the many partial CIM
Profiles.
Data Associations Manager in charge of
executing logic associations between legacies
ID’s of legacy systems.
Client application for CIM Instance
consumption. It calculates the Phase Unbalance
in Distribution feeders and shows the profile
behaviour in time. It includes a database
simulating a “DataMart” for calculated values
and to improve the user time response and
experience in general.
OPC UA interfaces to integrate real-time and
historical data by SCADA and SIMOCE. The
CIM Based interfaces include a data access
layer implemented by means of OPen
Connectivity Unified Architecture standard.
This architecture runs in a cluster integrated by 3
Physical servers considering 28 Cores and 48 GB of
RAM (total).
Operational System for each server is MS-
Windows 2012 Server 64 bits and the main database
is MS-SQL Server Standard Edition.
Fig. 6. The CIM-Based Semantic Interoperability
Strategy implemented for Smart Grid at CFE in the
Valley of Mexico – Centre.
4 Standards and Methodologies Standardization was the main objective to reach in
the DVMC – Semantic Interoperability strategy,
some of the most important standards and
methodologies are:
Data Model Standards:
IEC 61970-301 which defines the CIM Base for
Transmission Power Systems for use in Energy
Management Systems (EMS).
IEC 61968-11 which defines the CIM
extensions for Distribution Power Systems.
IEC 62325-301 that establishes the extensions
for the Electric Market or CME (CIM for
Market Extensions).
IEC 61970-501 which defines a CIM RDF
Schema.
IEC 61970-552 which defines the CIM XML
Model Exchange Format.
Interface Standards:
IEC 61968-1 which defines the interface
architecture and general recommendations.
IEC 61968-9 which defines standard interfaces
format (for meter reading and control).
IEC 61968-100 that specifies interfaces
implementation Profiles.
IEC 62541 which defines the OPen
Connectivity Unified Architecture (OPC UA)
used in industry for integrating standard
interfaces and communication protocols
between control systems.
Best Practices:
Extensible Markup Language (XML) that
defines a set of rules for encoding documents in
a format which is both human-readable and
machine-readable. It is defined by the W3C.
WSEAS TRANSACTIONS on POWER SYSTEMS
A. Espinosa-Reza, H. R. Aguilar-Valenzuela, M. Molina-Marin, M. L. Torres-Espindola, T. M. Calleros-Torres, E. Granados-Gomez,
R. Garcia-Mendoza, C. F. Villatoro-Hernandez
E-ISSN: 2224-350X 292 Volume 11, 2016
Resource Description Framework Schema
(RDFS Schema) provides basic elements for
ontologies description (knowledge
representation). It specifies how to formally
describe the elements in an XML document.
XML Schema Definition (XSD) allows to
formally describe the elements in an XML
document. It is defined by the W3C.
Web Services is a method of communication
between two electronic devices over a network.
It is defined by the W3C.
Windows Communication Foundation (WCF) is
a runtime and a set of APIs in the Microsoft
.NET Framework for building connected,
service-oriented applications.
Java Message Service (JMS) is a messaging
standard that allows application components
based on the Java Enterprise Edition to create,
send, receive, and read messages. It allows the
communication between different components
of a distributed application to be loosely
coupled, reliable, and asynchronous.
Service Oriented Architecture (SOA) is a design
pattern providing application functionality as
services to other applications. It is independent
of any vendor, product or technology.
Business Process Model Notation (BPMN) is a
graphical representation for specifying business
processes, which is developed by the Object
Management Group (OMG).
Methodologies:
IntelliGrid Methodology for Developing
Requirements for Energy Systems [12].
CIM Extensions method as in [3].
Unified Modelling Language (UML) to describe
CIM components about the electric power
system.
Open Unified Process for incremental
development process.
Business process management (BPM) for
implementing a process optimization process.
5 Software Tools Software tools were used in order to integrate all
components, from modelling to automatic code
generation.
Enterprise Architect: CIM modelling,
extensions and formal description of
information components.
CIMtool: used by CIM Profile generation and
validation. The output could be a RDFS
Schema, an OWL or an XSD file that includes
the knowledge representation of the information
to exchange.
CIMer: a home-made software tool to create
automatically source code from a CIM Profile.
CIMit: a home-made software tool to create
CIM Instances files from a specific data source
using a CIM Profile.
Data Model Manager: a home-made software
tool including many basic functions to manage
many partial CIM Profiles, for each integrated
legacy system
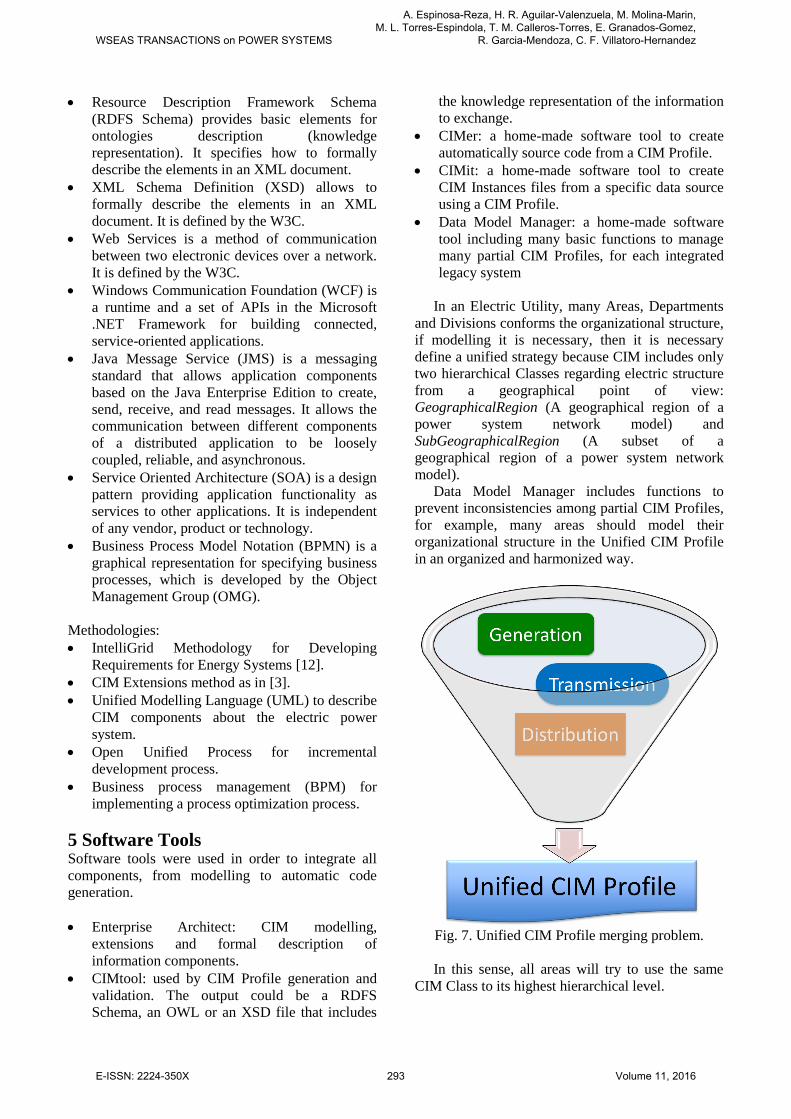
In an Electric Utility, many Areas, Departments
and Divisions conforms the organizational structure,
if modelling it is necessary, then it is necessary
define a unified strategy because CIM includes only
two hierarchical Classes regarding electric structure
from a geographical point of view:
GeographicalRegion (A geographical region of a
power system network model) and
SubGeographicalRegion (A subset of a
geographical region of a power system network
model).
Data Model Manager includes functions to
prevent inconsistencies among partial CIM Profiles,
for example, many areas should model their
organizational structure in the Unified CIM Profile
in an organized and harmonized way.
Fig. 7. Unified CIM Profile merging problem.
In this sense, all areas will try to use the same
CIM Class to its highest hierarchical level.
WSEAS TRANSACTIONS on POWER SYSTEMS
A. Espinosa-Reza, H. R. Aguilar-Valenzuela, M. Molina-Marin, M. L. Torres-Espindola, T. M. Calleros-Torres, E. Granados-Gomez,
R. Garcia-Mendoza, C. F. Villatoro-Hernandez
E-ISSN: 2224-350X 293 Volume 11, 2016
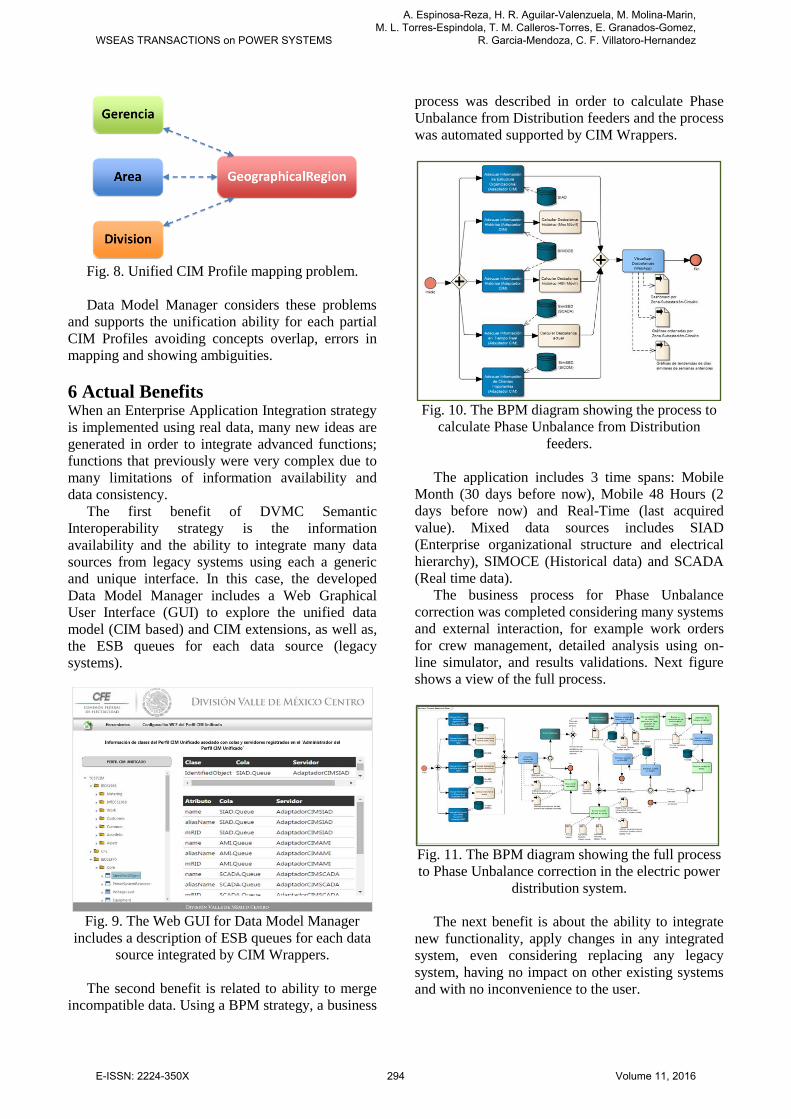
Fig. 8. Unified CIM Profile mapping problem.
Data Model Manager considers these problems
and supports the unification ability for each partial
CIM Profiles avoiding concepts overlap, errors in
mapping and showing ambiguities.
6 Actual Benefits When an Enterprise Application Integration strategy
is implemented using real data, many new ideas are
generated in order to integrate advanced functions;
functions that previously were very complex due to
many limitations of information availability and
data consistency.
The first benefit of DVMC Semantic
Interoperability strategy is the information
availability and the ability to integrate many data
sources from legacy systems using each a generic
and unique interface. In this case, the developed
Data Model Manager includes a Web Graphical
User Interface (GUI) to explore the unified data
model (CIM based) and CIM extensions, as well as,
the ESB queues for each data source (legacy
systems).
Fig. 9. The Web GUI for Data Model Manager
includes a description of ESB queues for each data
source integrated by CIM Wrappers.
The second benefit is related to ability to merge
incompatible data. Using a BPM strategy, a business
process was described in order to calculate Phase
Unbalance from Distribution feeders and the process
was automated supported by CIM Wrappers.
Fig. 10. The BPM diagram showing the process to
calculate Phase Unbalance from Distribution
feeders.
The application includes 3 time spans: Mobile
Month (30 days before now), Mobile 48 Hours (2
days before now) and Real-Time (last acquired
value). Mixed data sources includes SIAD
(Enterprise organizational structure and electrical
hierarchy), SIMOCE (Historical data) and SCADA
(Real time data).
The business process for Phase Unbalance
correction was completed considering many systems
and external interaction, for example work orders
for crew management, detailed analysis using on-
line simulator, and results validations. Next figure
shows a view of the full process.
Fig. 11. The BPM diagram showing the full process
to Phase Unbalance correction in the electric power
distribution system.
The next benefit is about the ability to integrate
new functionality, apply changes in any integrated
system, even considering replacing any legacy
system, having no impact on other existing systems
and with no inconvenience to the user.
WSEAS TRANSACTIONS on POWER SYSTEMS
A. Espinosa-Reza, H. R. Aguilar-Valenzuela, M. Molina-Marin, M. L. Torres-Espindola, T. M. Calleros-Torres, E. Granados-Gomez,
R. Garcia-Mendoza, C. F. Villatoro-Hernandez
E-ISSN: 2224-350X 294 Volume 11, 2016
Finally, total time for systems integration was
reduced, from many weeks to only some days and
the total time for maintaining point-to-point
interfaces was almost eliminated, because now CFE
has the know-how about CIM philosophy,
Enterprise Application Integration, SOA and
standard services, as well as a robust infrastructure
to support a CIM-Based Semantic Interoperability
Strategy.
7 CIM-Based Solutions Considering new capabilities, a new application was
completely developed, CIM-Based using the current
semantic interoperability strategy implemented at
DVMC.
The main objective of the new solution is to
integrate functions oriented to decision support at
Distribution Control Centers for losses reduction by
means of Phase Unbalance correction.
First question resolved is: Related to Phase
Unbalance in Distribution feeders (Current, Real
Power, Reactive Power and Voltage); which areas
and feeders show the worst behaviour today?
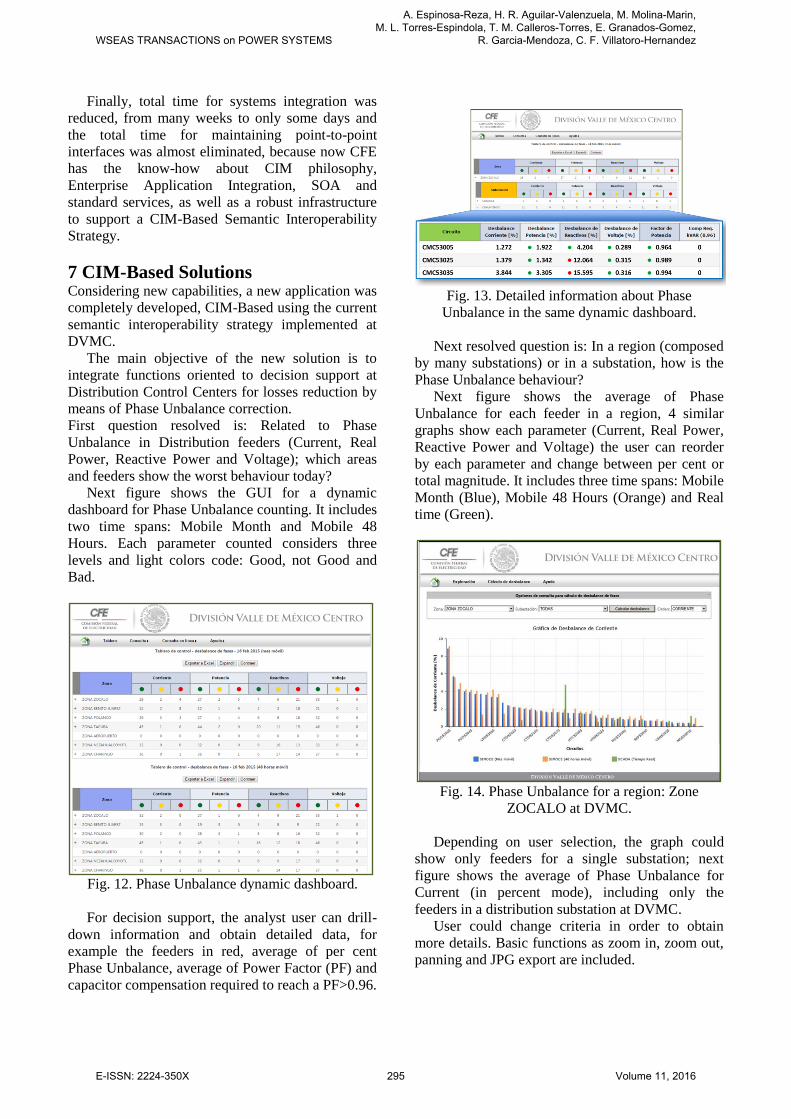
Next figure shows the GUI for a dynamic
dashboard for Phase Unbalance counting. It includes
two time spans: Mobile Month and Mobile 48
Hours. Each parameter counted considers three
levels and light colors code: Good, not Good and
Bad.
Fig. 12. Phase Unbalance dynamic dashboard.
For decision support, the analyst user can drill-
down information and obtain detailed data, for
example the feeders in red, average of per cent
Phase Unbalance, average of Power Factor (PF) and
capacitor compensation required to reach a PF>0.96.
Fig. 13. Detailed information about Phase
Unbalance in the same dynamic dashboard.
Next resolved question is: In a region (composed
by many substations) or in a substation, how is the
Phase Unbalance behaviour?
Next figure shows the average of Phase
Unbalance for each feeder in a region, 4 similar
graphs show each parameter (Current, Real Power,
Reactive Power and Voltage) the user can reorder
by each parameter and change between per cent or
total magnitude. It includes three time spans: Mobile
Month (Blue), Mobile 48 Hours (Orange) and Real
time (Green).
Fig. 14. Phase Unbalance for a region: Zone
ZOCALO at DVMC.
Depending on user selection, the graph could
show only feeders for a single substation; next
figure shows the average of Phase Unbalance for
Current (in percent mode), including only the
feeders in a distribution substation at DVMC.
User could change criteria in order to obtain
more details. Basic functions as zoom in, zoom out,
panning and JPG export are included.
WSEAS TRANSACTIONS on POWER SYSTEMS
A. Espinosa-Reza, H. R. Aguilar-Valenzuela, M. Molina-Marin, M. L. Torres-Espindola, T. M. Calleros-Torres, E. Granados-Gomez,
R. Garcia-Mendoza, C. F. Villatoro-Hernandez
E-ISSN: 2224-350X 295 Volume 11, 2016
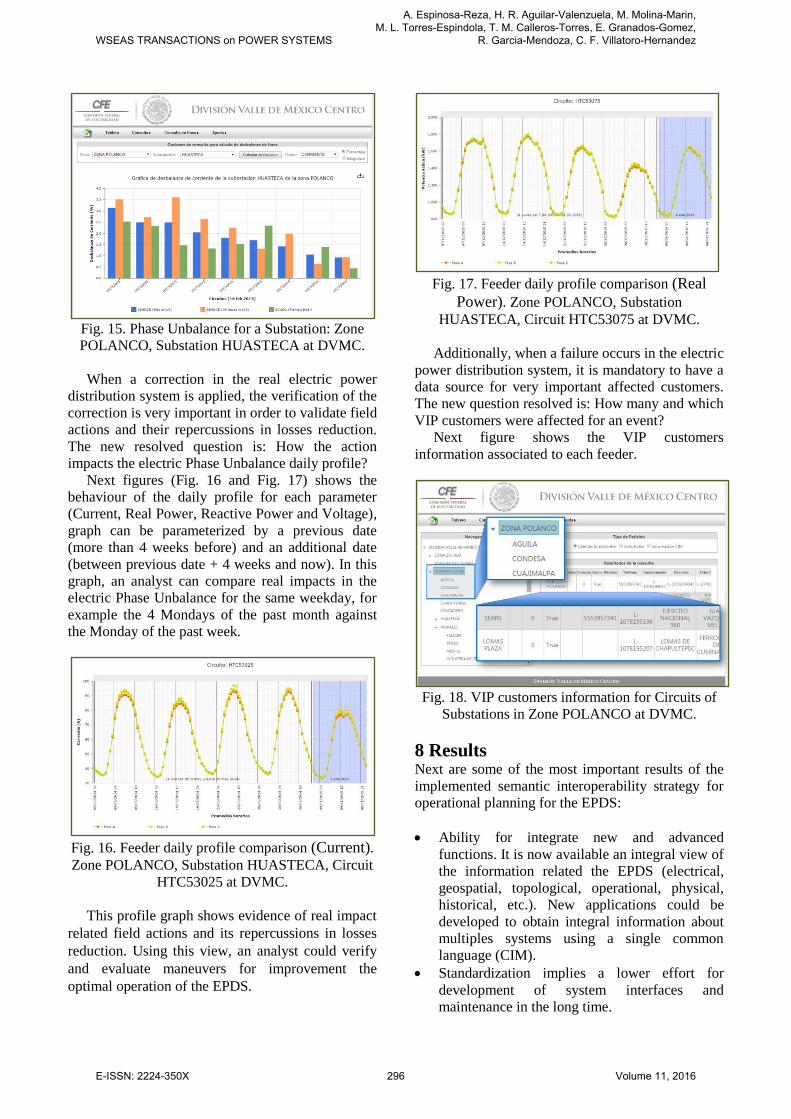
Fig. 15. Phase Unbalance for a Substation: Zone
POLANCO, Substation HUASTECA at DVMC.
When a correction in the real electric power
distribution system is applied, the verification of the
correction is very important in order to validate field
actions and their repercussions in losses reduction.
The new resolved question is: How the action
impacts the electric Phase Unbalance daily profile?
Next figures (Fig. 16 and Fig. 17) shows the
behaviour of the daily profile for each parameter
(Current, Real Power, Reactive Power and Voltage),
graph can be parameterized by a previous date
(more than 4 weeks before) and an additional date
(between previous date + 4 weeks and now). In this
graph, an analyst can compare real impacts in the
electric Phase Unbalance for the same weekday, for
example the 4 Mondays of the past month against
the Monday of the past week.
Fig. 16. Feeder daily profile comparison (Current). Zone POLANCO, Substation HUASTECA, Circuit
HTC53025 at DVMC.
This profile graph shows evidence of real impact
related field actions and its repercussions in losses
reduction. Using this view, an analyst could verify
and evaluate maneuvers for improvement the
optimal operation of the EPDS.
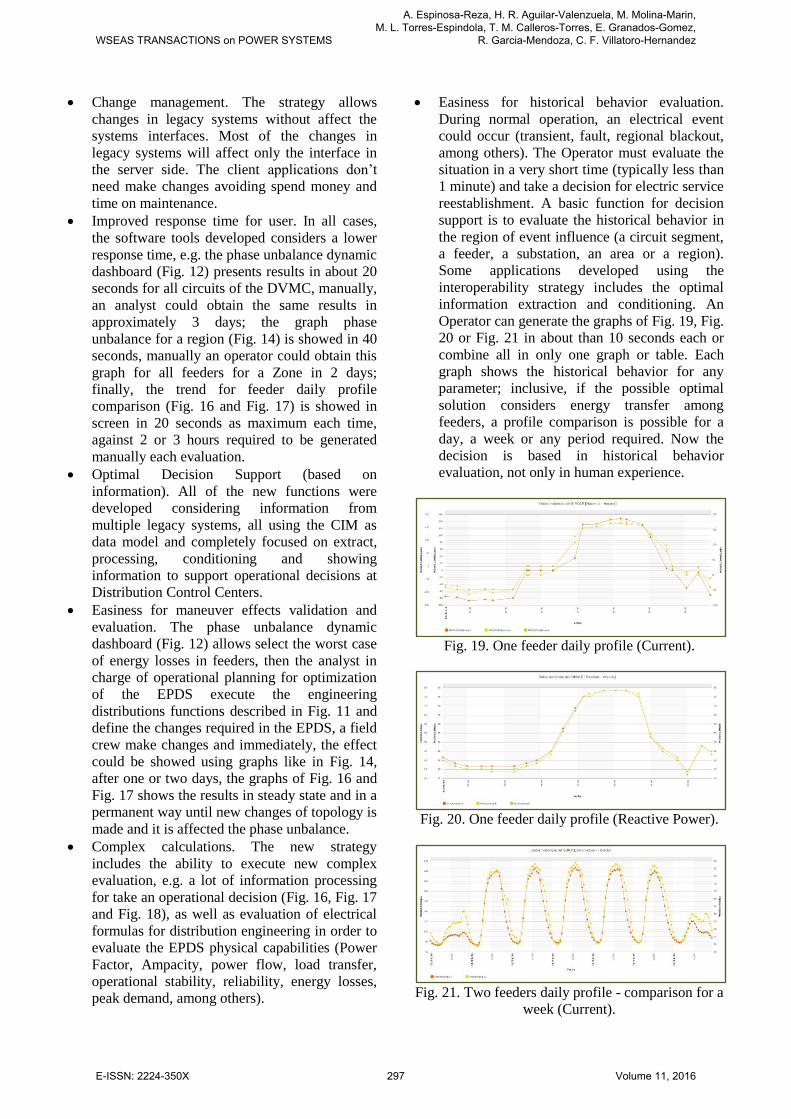
Fig. 17. Feeder daily profile comparison (Real
Power). Zone POLANCO, Substation
HUASTECA, Circuit HTC53075 at DVMC.
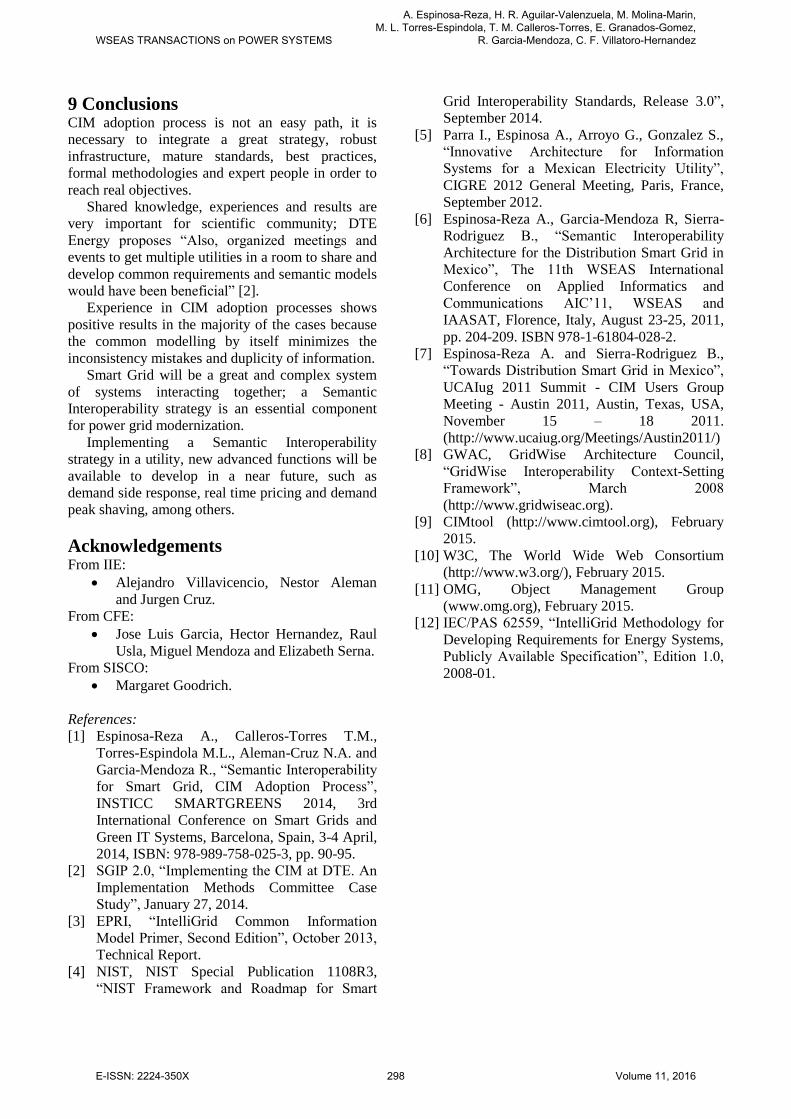
Additionally, when a failure occurs in the electric
power distribution system, it is mandatory to have a
data source for very important affected customers.
The new question resolved is: How many and which
VIP customers were affected for an event?
Next figure shows the VIP customers
information associated to each feeder.
Fig. 18. VIP customers information for Circuits of
Substations in Zone POLANCO at DVMC.
8 Results Next are some of the most important results of the
implemented semantic interoperability strategy for
operational planning for the EPDS:
Ability for integrate new and advanced
functions. It is now available an integral view of
the information related the EPDS (electrical,
geospatial, topological, operational, physical,
historical, etc.). New applications could be
developed to obtain integral information about
multiples systems using a single common
language (CIM).
Standardization implies a lower effort for
development of system interfaces and
maintenance in the long time.
WSEAS TRANSACTIONS on POWER SYSTEMS
A. Espinosa-Reza, H. R. Aguilar-Valenzuela, M. Molina-Marin, M. L. Torres-Espindola, T. M. Calleros-Torres, E. Granados-Gomez,
R. Garcia-Mendoza, C. F. Villatoro-Hernandez
E-ISSN: 2224-350X 296 Volume 11, 2016
Change management. The strategy allows
changes in legacy systems without affect the
systems interfaces. Most of the changes in
legacy systems will affect only the interface in
the server side. The client applications don’t
need make changes avoiding spend money and
time on maintenance.
Improved response time for user. In all cases,
the software tools developed considers a lower
response time, e.g. the phase unbalance dynamic
dashboard (Fig. 12) presents results in about 20
seconds for all circuits of the DVMC, manually,
an analyst could obtain the same results in
approximately 3 days; the graph phase
unbalance for a region (Fig. 14) is showed in 40
seconds, manually an operator could obtain this
graph for all feeders for a Zone in 2 days;
finally, the trend for feeder daily profile
comparison (Fig. 16 and Fig. 17) is showed in
screen in 20 seconds as maximum each time,
against 2 or 3 hours required to be generated
manually each evaluation.
Optimal Decision Support (based on
information). All of the new functions were
developed considering information from
multiple legacy systems, all using the CIM as
data model and completely focused on extract,
processing, conditioning and showing
information to support operational decisions at
Distribution Control Centers.
Easiness for maneuver effects validation and
evaluation. The phase unbalance dynamic
dashboard (Fig. 12) allows select the worst case
of energy losses in feeders, then the analyst in
charge of operational planning for optimization
of the EPDS execute the engineering
distributions functions described in Fig. 11 and
define the changes required in the EPDS, a field
crew make changes and immediately, the effect
could be showed using graphs like in Fig. 14,
after one or two days, the graphs of Fig. 16 and
Fig. 17 shows the results in steady state and in a
permanent way until new changes of topology is
made and it is affected the phase unbalance.
Complex calculations. The new strategy
includes the ability to execute new complex
evaluation, e.g. a lot of information processing
for take an operational decision (Fig. 16, Fig. 17
and Fig. 18), as well as evaluation of electrical
formulas for distribution engineering in order to
evaluate the EPDS physical capabilities (Power
Factor, Ampacity, power flow, load transfer,
operational stability, reliability, energy losses,
peak demand, among others).
Easiness for historical behavior evaluation.
During normal operation, an electrical event
could occur (transient, fault, regional blackout,
among others). The Operator must evaluate the
situation in a very short time (typically less than
1 minute) and take a decision for electric service
reestablishment. A basic function for decision
support is to evaluate the historical behavior in
the region of event influence (a circuit segment,
a feeder, a substation, an area or a region).
Some applications developed using the
interoperability strategy includes the optimal
information extraction and conditioning. An
Operator can generate the graphs of Fig. 19, Fig.
20 or Fig. 21 in about than 10 seconds each or
combine all in only one graph or table. Each
graph shows the historical behavior for any
parameter; inclusive, if the possible optimal
solution considers energy transfer among
feeders, a profile comparison is possible for a
day, a week or any period required. Now the
decision is based in historical behavior
evaluation, not only in human experience.
Fig. 19. One feeder daily profile (Current).
Fig. 20. One feeder daily profile (Reactive Power).
Fig. 21. Two feeders daily profile - comparison for a
week (Current).
WSEAS TRANSACTIONS on POWER SYSTEMS
A. Espinosa-Reza, H. R. Aguilar-Valenzuela, M. Molina-Marin, M. L. Torres-Espindola, T. M. Calleros-Torres, E. Granados-Gomez,
R. Garcia-Mendoza, C. F. Villatoro-Hernandez
E-ISSN: 2224-350X 297 Volume 11, 2016
9 Conclusions CIM adoption process is not an easy path, it is
necessary to integrate a great strategy, robust
infrastructure, mature standards, best practices,
formal methodologies and expert people in order to
reach real objectives.
Shared knowledge, experiences and results are
very important for scientific community; DTE
Energy proposes “Also, organized meetings and
events to get multiple utilities in a room to share and
develop common requirements and semantic models
would have been beneficial” [2].
Experience in CIM adoption processes shows
positive results in the majority of the cases because
the common modelling by itself minimizes the
inconsistency mistakes and duplicity of information.
Smart Grid will be a great and complex system
of systems interacting together; a Semantic
Interoperability strategy is an essential component
for power grid modernization.
Implementing a Semantic Interoperability
strategy in a utility, new advanced functions will be
available to develop in a near future, such as
demand side response, real time pricing and demand
peak shaving, among others.
Acknowledgements From IIE:
Alejandro Villavicencio, Nestor Aleman
and Jurgen Cruz.
From CFE:
Jose Luis Garcia, Hector Hernandez, Raul
Usla, Miguel Mendoza and Elizabeth Serna.
From SISCO:
Margaret Goodrich.
References:
[1] Espinosa-Reza A., Calleros-Torres T.M.,
Torres-Espindola M.L., Aleman-Cruz N.A. and
Garcia-Mendoza R., “Semantic Interoperability
for Smart Grid, CIM Adoption Process”,
INSTICC SMARTGREENS 2014, 3rd
International Conference on Smart Grids and
Green IT Systems, Barcelona, Spain, 3-4 April,
2014, ISBN: 978-989-758-025-3, pp. 90-95.
[2] SGIP 2.0, “Implementing the CIM at DTE. An
Implementation Methods Committee Case
Study”, January 27, 2014.
[3] EPRI, “IntelliGrid Common Information
Model Primer, Second Edition”, October 2013,
Technical Report.
[4] NIST, NIST Special Publication 1108R3,
“NIST Framework and Roadmap for Smart
Grid Interoperability Standards, Release 3.0”,
September 2014.
[5] Parra I., Espinosa A., Arroyo G., Gonzalez S.,
“Innovative Architecture for Information
Systems for a Mexican Electricity Utility”,
CIGRE 2012 General Meeting, Paris, France,
September 2012.
[6] Espinosa-Reza A., Garcia-Mendoza R, Sierra-
Rodriguez B., “Semantic Interoperability
Architecture for the Distribution Smart Grid in
Mexico”, The 11th WSEAS International
Conference on Applied Informatics and
Communications AIC’11, WSEAS and
IAASAT, Florence, Italy, August 23-25, 2011,
pp. 204-209. ISBN 978-1-61804-028-2.
[7] Espinosa-Reza A. and Sierra-Rodriguez B.,
“Towards Distribution Smart Grid in Mexico”,
UCAIug 2011 Summit - CIM Users Group
Meeting - Austin 2011, Austin, Texas, USA,
November 15 – 18 2011.
(http://www.ucaiug.org/Meetings/Austin2011/)
[8] GWAC, GridWise Architecture Council,
“GridWise Interoperability Context-Setting
Framework”, March 2008
(http://www.gridwiseac.org).
[9] CIMtool (http://www.cimtool.org), February
2015.
[10] W3C, The World Wide Web Consortium
(http://www.w3.org/), February 2015.
[11] OMG, Object Management Group
(www.omg.org), February 2015.
[12] IEC/PAS 62559, “IntelliGrid Methodology for
Developing Requirements for Energy Systems,
Publicly Available Specification”, Edition 1.0,
2008-01.
WSEAS TRANSACTIONS on POWER SYSTEMS
A. Espinosa-Reza, H. R. Aguilar-Valenzuela, M. Molina-Marin, M. L. Torres-Espindola, T. M. Calleros-Torres, E. Granados-Gomez,
R. Garcia-Mendoza, C. F. Villatoro-Hernandez
E-ISSN: 2224-350X 298 Volume 11, 2016